protein(validaon( (stas-cal(inference)(and(protein( quan ... · pdf...
TRANSCRIPT

Center for Mass Spectrometry and Proteomics | Phone | (612)625-2280 | (612)625-2279
Protein Valida-on (Sta-s-cal Inference) and Protein
Quan-fica-on

Center for Mass Spectrometry and Proteomics | Phone | (612)625-2280 | (612)625-2279
Terminology
• Pep-de Spectrum Match • Target / Decoy • False discovery rate • Shared pep-de • Parsimony • One hit wonders

200 400 600 800 1000 1200 m/z
Rela-ve Ab
undance
3
SPECTRUM

200 400 600 800 1000 1200 m/z
Rel
ativ
e A
bund
ance
H2N-N--S--G--D--I--V--N--L--G--S--I--A--G--R-COOH b2 b3 b4 b5 b6 b7 b8 b9 b10 b11 b12 b13 b14 b1
y13 y12 y11 y10 y9 y8 y7 y6 y5 y4 y3 y2 y1 y14 y-series:
b-series:
Tandem mass spectrometry and pep/de sequence
• An MS/MS spectrum contains a mixture of b and y ions
4

PEPTIDE SPECTRUM MATCH
Mass spectrum Reference Protein Database
from genomic annotation Pep/de Spectral Match

Nesvizhskii et al Nature Methods -‐ 4, 787 -‐ 797 (2007)
6
• Visual inspection • Scoring function f(S,P) measures the quality of the match between spectrum S and peptide sequence P • Look at fragment ions
– predicted mass – expected intensity – compare to next best – presence of immonium
ions – etc.
PEPTIDE SPECTRUM MATCH

Nesvizhskii et al Nature Methods -‐ 4, 787 -‐ 797 (2007)
7
PEPTIDE SPECTRAL MATCH

TARGET-DECOY SEARCH

TARGET-DECOY SEARCH
INPUTS : PEAKLISTS and SEARCH db SEARCHGUI PEPTIDESHAKER 9
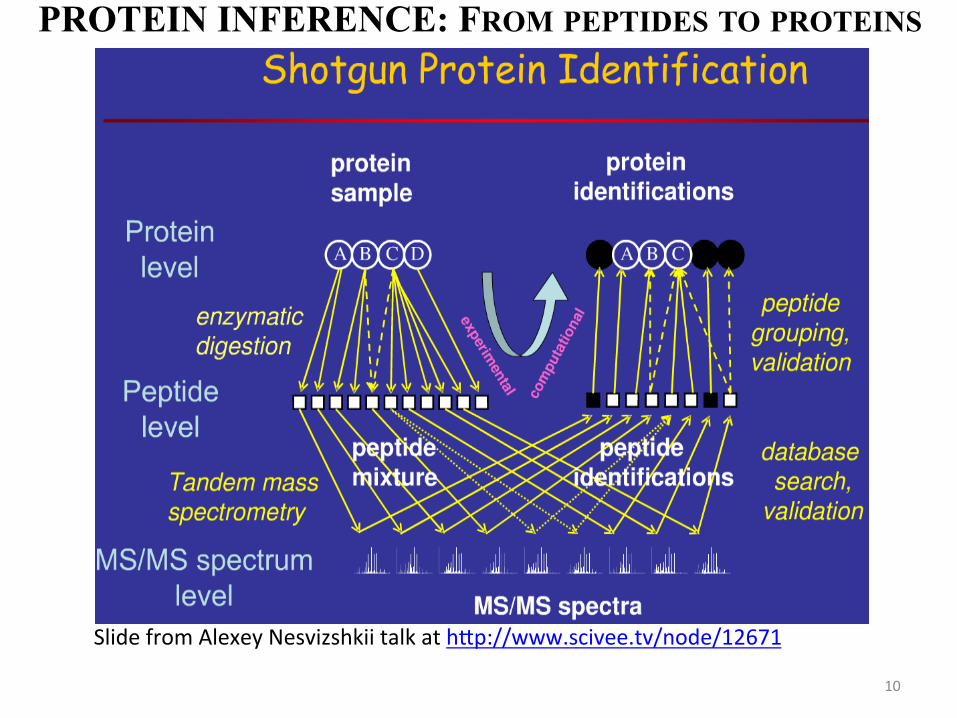
Slide from Alexey Nesvizshkii talk at hWp://www.scivee.tv/node/12671
PROTEIN INFERENCE: FROM PEPTIDES TO PROTEINS
10

Nesvizhskii, A. I.; Aebersold, R. Mol. Cell. Proteom. 4.10, 1419-‐1440, 2005
Shared Pep-des

SIQFVDWCPTGFK
Tubulin alpha 6
Tubulin alpha 3
YMACCLLYR
Tubulin alpha 4
Center for Mass Spectrometry and Proteomics | Phone | (612)625-2280 | (612)625-2279
85%
85%
85%
Shared
Pep
-des

AEPTIR
IDVCIVLLQHK
NTGDR
Protein
85%
65%
25%
Center for Mass Spectrometry and Proteomics | Phone | (612)625-2280 | (612)625-2279
(4%)
0.15 * 0.35 * 0.75 = 0.04 Feng J, Naiman DQ, Cooper B. Anal Chem. 2007 May 15;79(10):3901-‐11.
From Pep-des to Proteins

IDVCIVLLQHK Protein 95%
Center for Mass Spectrometry and Proteomics | Phone | (612)625-2280 | (612)625-2279
(5%)
One Hit Wonders

One Hit Wonders
• Quan-fy as a score: If different pep-des agree: Good! If pep-des are one-‐hit-‐wonders: Bad!
• Protein Prophet, etc. • Then can use FDR at protein level
Center for Mass Spectrometry and Proteomics | Phone | (612)625-2280 | (612)625-2279

Center for Mass Spectrometry and Proteomics | Phone | (612)625-2280 | (612)625-2279
Pep-de / Protein Quan-fica-on

Center for Mass Spectrometry and Proteomics | Phone | (612)625-2280 | (612)625-2279
Terminology
• Absolute Quan-fica-on • Rela-ve Quan-fica-on • Label-‐free • Normaliza-on • Labelled • iTRAQ • Reporter ions

Center for Mass Spectrometry and Proteomics | Phone | (612)625-2280 | (612)625-2279
Pep-de / Protein Quan-fica-on • Absolute – Es-mate the molar amount of protein / pep-de in the biological sample – PTMs – Valida-on
• Rela-ve –Fold change / sta-s-cally significant difference between 2 biological states – Biological varia-on – Biomarker studies
Center for Mass Spectrometry and Proteomics | Phone | (612)625-2280 | (612)625-2279
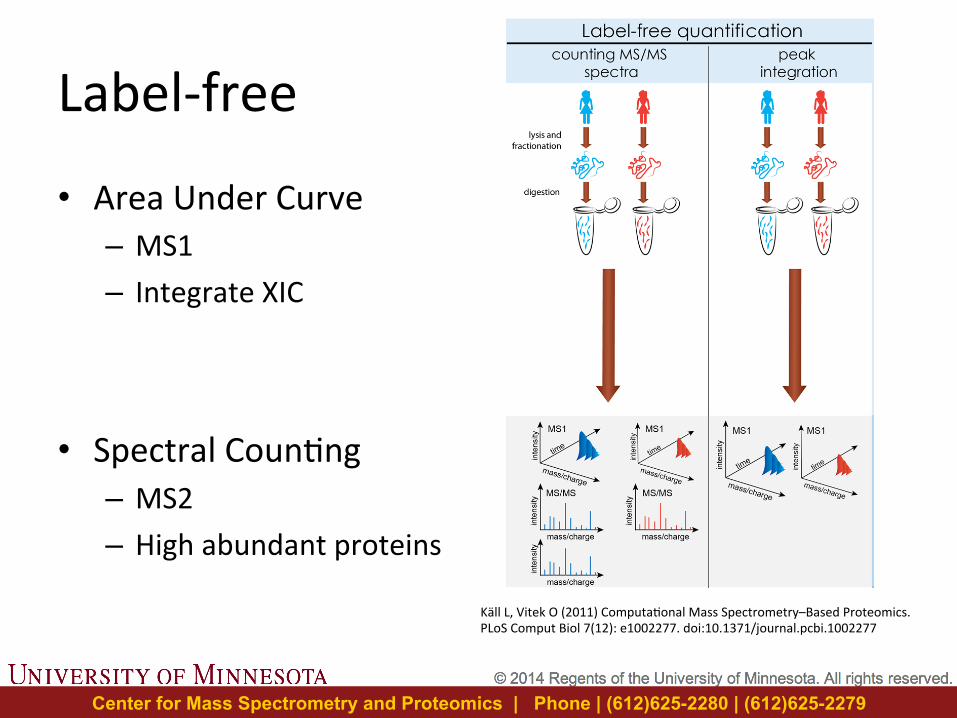
Label-‐free
• Area Under Curve – MS1 – Integrate XIC
• Spectral Coun-ng – MS2 – High abundant proteins
Käll L, Vitek O (2011) Computa-onal Mass Spectrometry–Based Proteomics. PLoS Comput Biol 7(12): e1002277. doi:10.1371/journal.pcbi.1002277

Center for Mass Spectrometry and Proteomics | Phone | (612)625-2280 | (612)625-2279
MS Quan-fica-on
• MS not inherently quan-ta-ve • Physiochemical proper-es invoke different MS responses
• MS only samples a small percentage of total pep-des • Bias and variability
Population Biological
Sample Handling
Instrument

Center for Mass Spectrometry and Proteomics | Phone | (612)625-2280 | (612)625-2279
Normaliza-on
• Remove bias and variability between runs • Global – commonly used
– Median scale – Total ion current (TIC)
• Local – very recent development – Proximity-‐based intensity normaliza-on (PIN)

Center for Mass Spectrometry and Proteomics | Phone | (612)625-2280 | (612)625-2279
Labeled Quan-fica-on
• Run samples simultaneously on in a single run • Add label to samples • Mix samples together • Compute ra-os / sta-s-cally significant diffs.

Center for Mass Spectrometry and Proteomics | Phone | (612)625-2280 | (612)625-2279
Labeled
• Isobaric – MS2, iTRAQ – Number of samples
• Synthe-c Pep-des – MS1 – Absolute (AQUA)
• Metabolic – MS1, SILAC – Not higher life forms
Käll L, Vitek O (2011) Computa-onal Mass Spectrometry–Based Proteomics. PLoS Comput Biol 7(12): e1002277. doi:10.1371/journal.pcbi.1002277
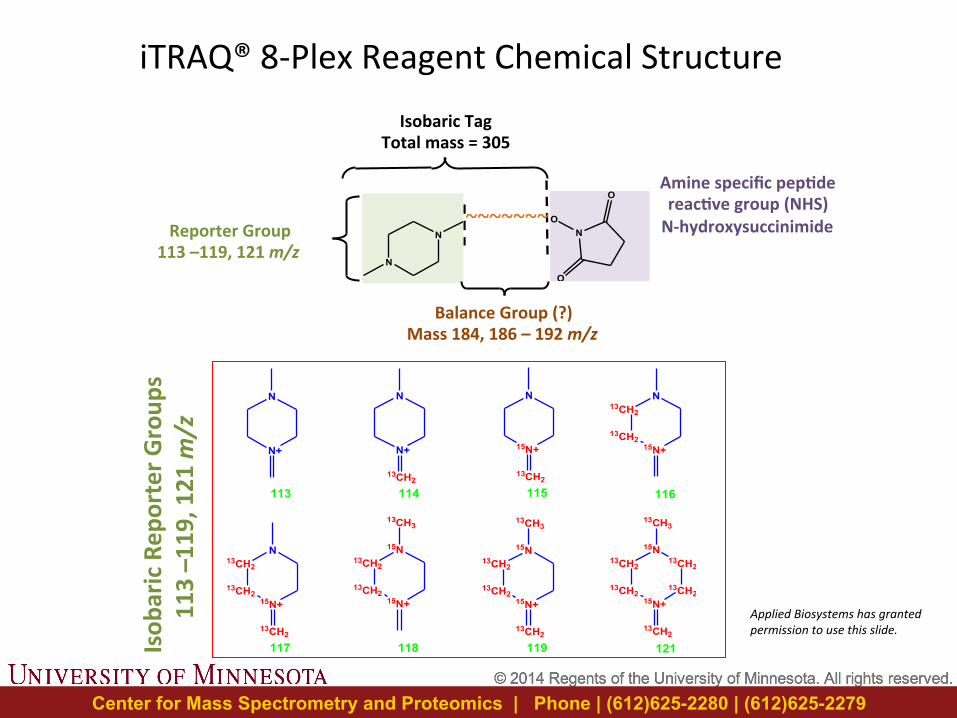
Isobaric Tag Total mass = 305
Reporter Group 113 –119, 121 m/z
Balance Group (?) Mass 184, 186 – 192 m/z
Amine specific pep/de reac/ve group (NHS) N-‐hydroxysuccinimide
N
N
O
ON
O
O
N
N
O
ON
O
O
~~~~~~~
N+
N
N+
N
13CH2
15N+
N
13CH2
13CH2
13CH215N+
N
13CH2
13CH2
13CH215N+
15N
13CH3
13CH2
13CH215N+
15N
13CH2
13CH3
13CH2
13CH215N+
N
13CH2
13CH215N+
13CH2
13CH2
15N
13CH2
13CH3
113 114 115 116
117 118 119 121
Applied Biosystems has granted permission to use this slide.
Isob
aric Rep
orter G
roup
s 113 –119, 121 m
/z
iTRAQ® 8-‐Plex Reagent Chemical Structure
Center for Mass Spectrometry and Proteomics | Phone | (612)625-2280 | (612)625-2279

Reduce, alkylate Cysteines
Trypsin Digest
Reduce, alkylate Cysteines
Trypsin Digest
Reduce, alkylate Cysteines
Trypsin Digest
Reduce, alkylate Cysteines
Trypsin Digest
Proteoly-c Diges-on
iTRAQ TAG 114
iTRAQ TAG 115
iTRAQ TAG 116
iTRAQ TAG 117
Label pep-des with iTRAQ® Reagents
Tissue Images: Rosas HD et al, (2002) Neurology, 58, 695
MIX
2D LC-‐MS/MS
Normal Brain Tissue-‐1
Normal Brain Tissue-‐2
Obtain protein-‐containing sample, extract protein
Huntington’s Disease-1
Huntington’s Disease-2
iTRAQ Experiment
Center for Mass Spectrometry and Proteomics | Phone | (612)625-2280 | (612)625-2279

+TOF Product (513.3): Experiment 2, 33.388 min from keyxx001_perez061_fxn13_queb2_1004.wiffa=3.56649482550429800e-004, t0=4.09124284567078580e+001
Max. 1224.0 counts.
50 100 150 200 250 300 350 400 450 500 550 600 650 700 750 800 850 900m/z, amu
0
100
200
300
400
500
600
700
800
900
1000
1100
1200In
ten
sity
, co
un
ts216.2
255.1
145.1
428.3
114.1
244.2 782.5513.3
400.2117.1
175.1315.2
598.4499.3185.1212.1
881.6711.4272.2
70.1383.386.1 527.4
199.1 343.2 412.3230.2 326.2440.3
a1
b1
y9
I
b2
y8
a3
b3
y7
I
a4
b4
y6
I
a5y5
I
y4
y3
y2I
y1
y9(+2)
y9
Inte
nsity
, cou
nts
Peptide = VAIVVGAPRMW = 1024.6249Protein ID = platelet membrane
glycoprotein 11b
“Reporter Ion Mass Tags” from which quantitation is calculated
Pep-de iTQVAIVVGAPR MWmono 1024.62 Protein Match Platelet
membrane glycoprotein 11b
Pep-de match is made from product ions, e.g., b-‐ and y-‐ion series
iTRAQ Experiment MS2 Spectrum
Center for Mass Spectrometry and Proteomics | Phone | (612)625-2280 | (612)625-2279

112.72493 113.91559 115.10626 116.29692 117.48759 118.67826
Mass (m/z)
976.9
0
10
20
30
40
50
60
70
80
90
100
% In
tens
ity
4700 MS/MS Precursor 1289.72 Spec #1 MC[BP = 1127.5, 1180]
115.13
114.13 116.13 117.13
113.11No change disease:control
control disease
iTRAQ Results
• Reporter ion intensi-es reflect rela-ve pep-de amounts
Center for Mass Spectrometry and Proteomics | Phone | (612)625-2280 | (612)625-2279

112.74415 113.88269 115.02123 116.15977 117.29831 118.43685
Mass (m/z)
1.1E +4
0
10
20
30
40
50
60
70
80
90
100
% Int
ensit
y
4700 MS/MS Precursor 1563.04 Spec #1 MC[BP = 116.1, 11442]
116.14117.14
115.14
114.14
113.12
112.52129 113.84865 115.17602 116.50338 117.83075 119.15811
Mass (m/z)
3070.1
0
10
20
30
40
50
60
70
80
90
100
% Int
ensit
y
4700 MS/MS Precursor 2120.14 Spec #1 MC[BP = 115.1, 3070]
115.12
114.12
116.12117.12
113.11
control
control disease
disease
Increase disease:control
Decrease disease:control
iTRAQ Results • What fold changes are significant?
• Do they represent biological relevance as opposed to experimental variability?
Center for Mass Spectrometry and Proteomics | Phone | (612)625-2280 | (612)625-2279

Center for Mass Spectrometry and Proteomics | Phone | (612)625-2280 | (612)625-2279
From Käll L, Vitek O (2011) Computa-onal Mass Spectrometry–Based Proteomics. PLoS Comput Biol 7(12): e1002277. doi:10.1371/journal.pcbi.1002277
Labe
led & Label-‐free