proteomics–basics, methods, applications
TRANSCRIPT
Proteomics – basics, methods, applications
Basics and „omics”: Genomics
– Determination of human genome: 2001 February
– Genome: Winkler, 1920; „GENes and chromosOMEs”
The complete set of chromosomal and extrachromosomal genes ofan organism, a cell, an organelle or a virus; the complete DNAcomponent of an organism. [IUPAC Biotech]
→ Genomics: Roderick, 1986 (Genomics, journal)
– Science of using DNA- and RNA-based technologies to demonstrate alterations in gene expression.
– Sequencing data– Discovery of new genes– Gene mapping– Comparison of different genomes (species, evolution) – New genetic technologies
Proteome: M. Wilkins (1994)Conference on Genome and Protein Maps, Siena, ItalyProtein complement expressed by a genome.
Proteomics:1. Qualitative or quantitative analysis and comparison of the proteomes under different conditions for better understanding of biological processes (e.g. disease vs healthy sample)2. Identification (sequence, 3D structure) and protein modifications3. Collection of experimental data in databases4. Determination of the following protein properties:
- localization- post-translational modifications- interactions (e.g. metabolics and signalization)- activity- function (based on predicitions and experimental data)
5. Better understanding of diseases, diagnostics, drug development
If the genome is a list of the instruments in an orchestra, the proteome is the orchestra playing a symphony. (R. Simpson)
All of the proteins in an organism, organelle or virus. The set of expressed proteins in a given type of cell or organism, at a given time, under defined conditions.
Basics and „omics”: Proteomics

Genomics Transcriptomics Proteomics Metabolomics
Genes mRNA Proteins Metabolites
BioinformaticsData Data Data Data
Further „omics”
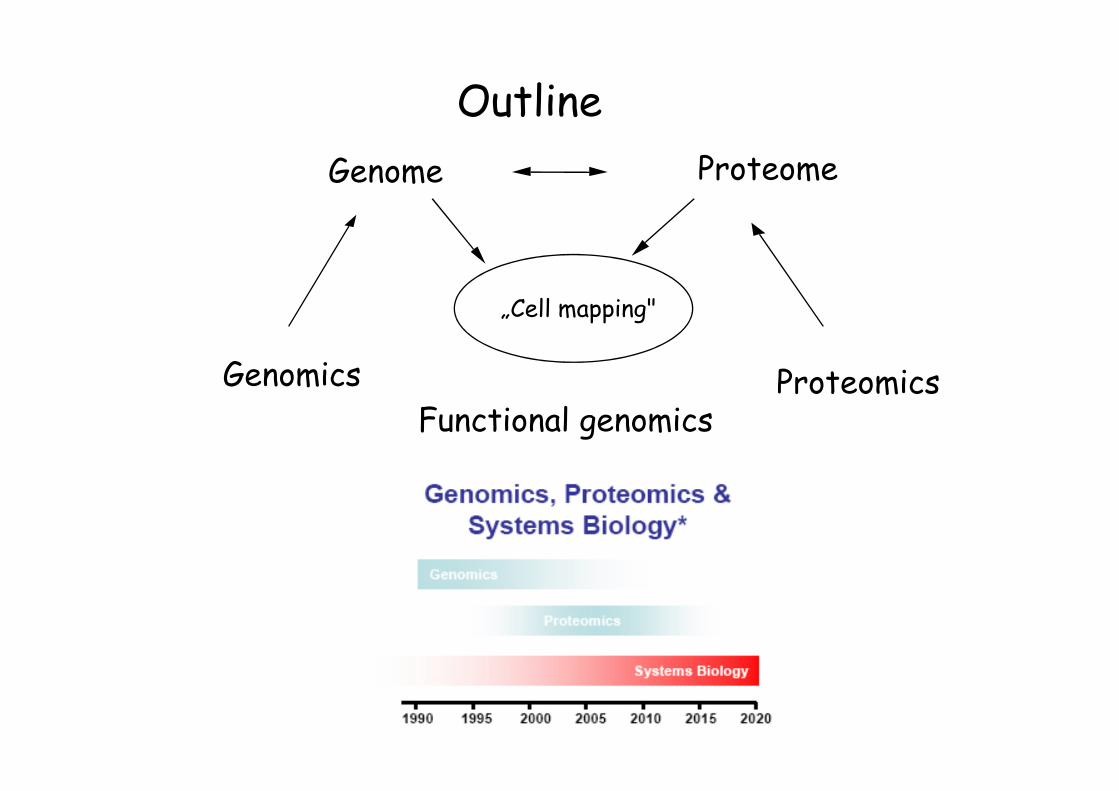
„Cell mapping"
Outline
ProteomicsGenomics
ProteomeGenome
Functional genomics

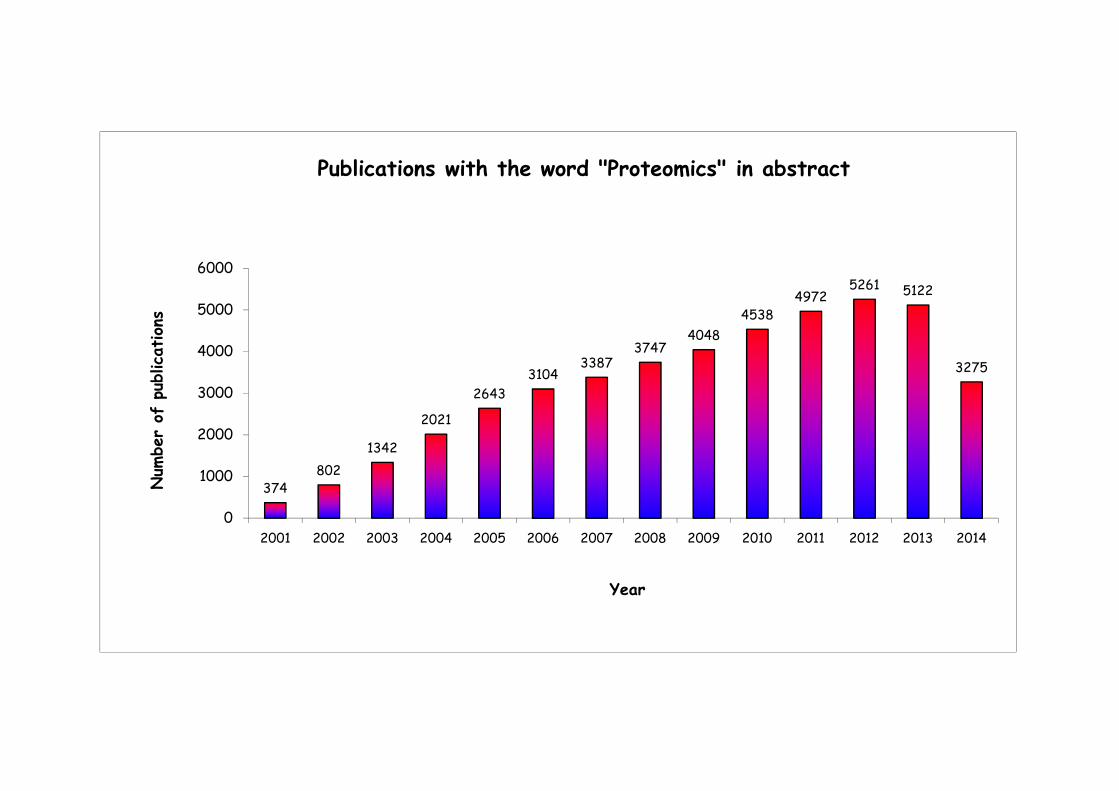
374802
1342
2021
2643
31043387
37474048
45384972
5261 5122
3275
0
1000
2000
3000
4000
5000
6000
2001 2002 2003 2004 2005 2006 2007 2008 2009 2010 2011 2012 2013 2014
Num
ber of publications
Year
Publications with the word "Proteomics" in abstract
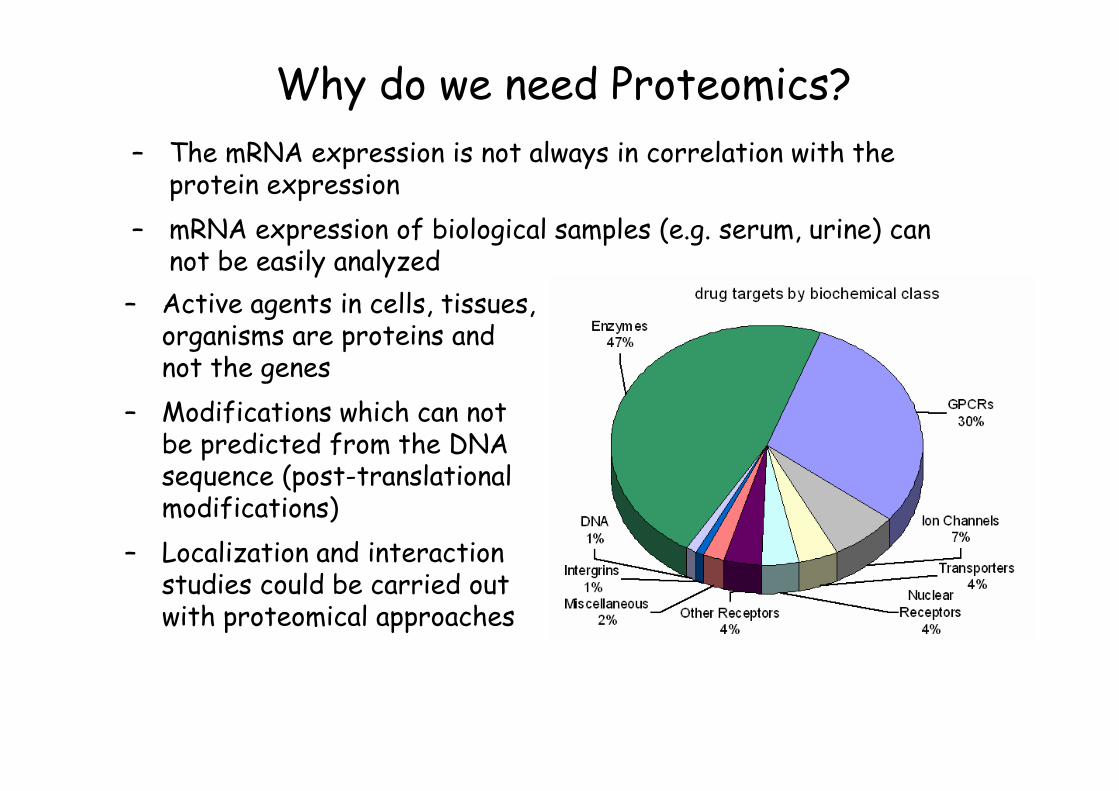
Why do we need Proteomics?
– Active agents in cells, tissues, organisms are proteins and not the genes
– Modifications which can not be predicted from the DNA sequence (post-translational modifications)
– Localization and interaction studies could be carried out with proteomical approaches
– The mRNA expression is not always in correlation with the protein expression
– mRNA expression of biological samples (e.g. serum, urine) can not be easily analyzed

Proteomics
FunctionalStructural
Integrated
Activity-based proteomics:Find connections between functional and gene-expression data and/or
protein-protein interaction
Toxicoproteomics: Determination of specific proteins and study of their concentration
alteration
Chemical proteomics: Proteom-based examinations
Determination of enzyme activity, Chemical libraries
Filoproteomics:Identification of unknown bacterial isolates based on
biomarker similarities in databases
Microbialproteomics Computational proteomics:
High throughput 3D/4D structural analysis and application in every life
sciencesTargeted proteomics:Tissue proteomics initiative (National Cancer Institute)
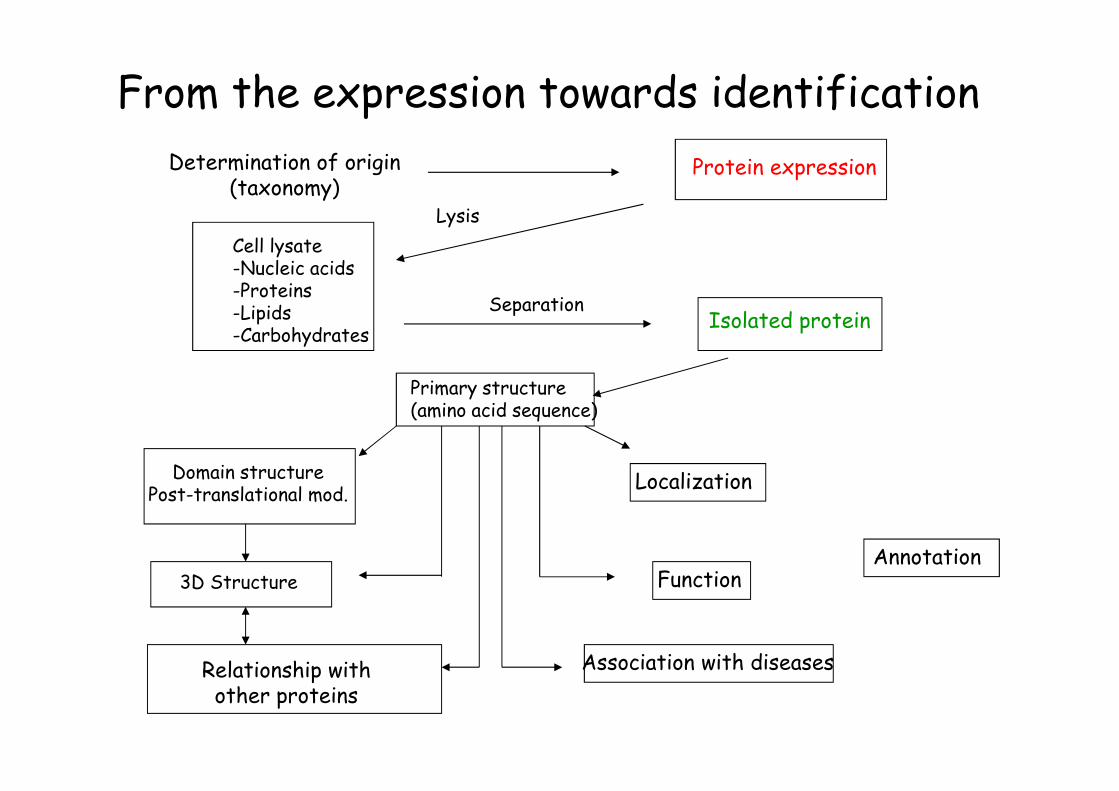
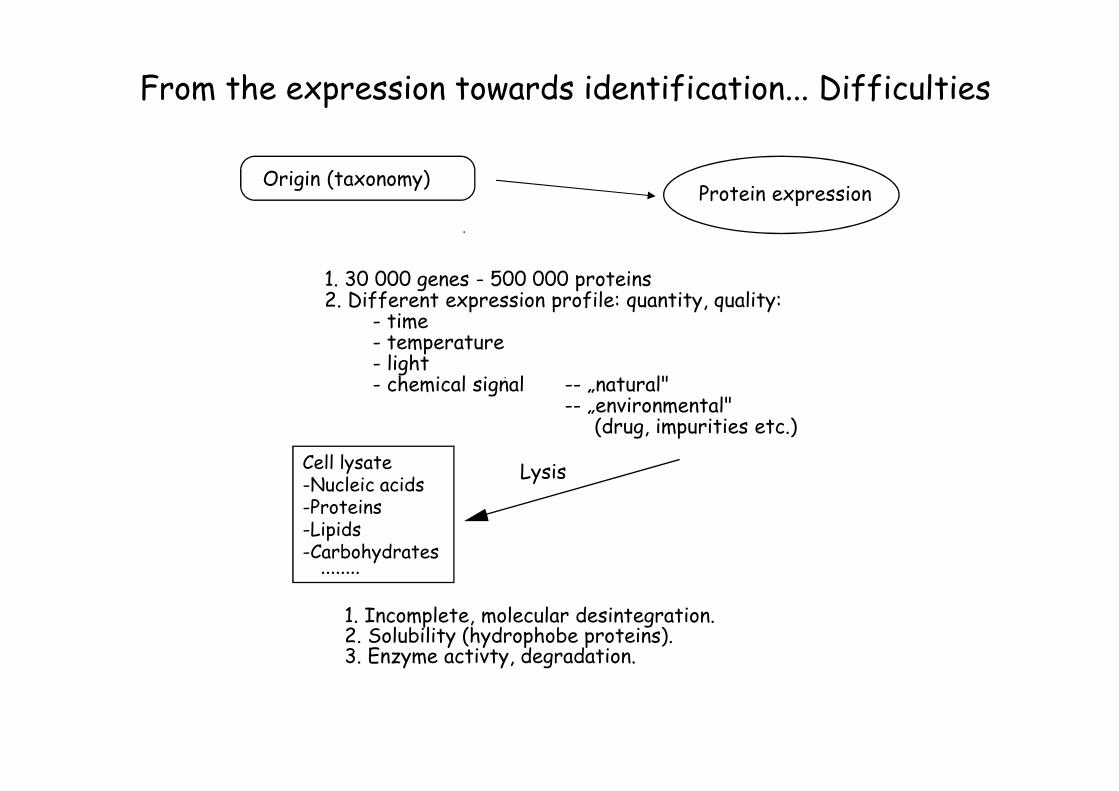
From the expression towards identification
Determination of origin(taxonomy)
Protein expression
Lysis
SeparationIsolated protein
Primary structure(amino acid sequence)
Cell lysate-Nucleic acids-Proteins-Lipids-Carbohydrates
Domain structurePost-translational mod.
3D Structure
Localization
Function
Relationship withother proteins
Association with diseases
Annotation
1. Fehérje-expresszióProtein expressionOrigin (taxonomy)
1. 30 000 genes - 500 000 proteins2. Different expression profile: quantity, quality:
- time- temperature- light- chemical signal -- „natural"
-- „environmental" (drug, impurities etc.)
Lysis
........
1. Incomplete, molecular desintegration. 2. Solubility (hydrophobe proteins). 3. Enzyme activty, degradation.
From the expression towards identification... Difficulties
Cell lysate-Nucleic acids-Proteins-Lipids-Carbohydrates
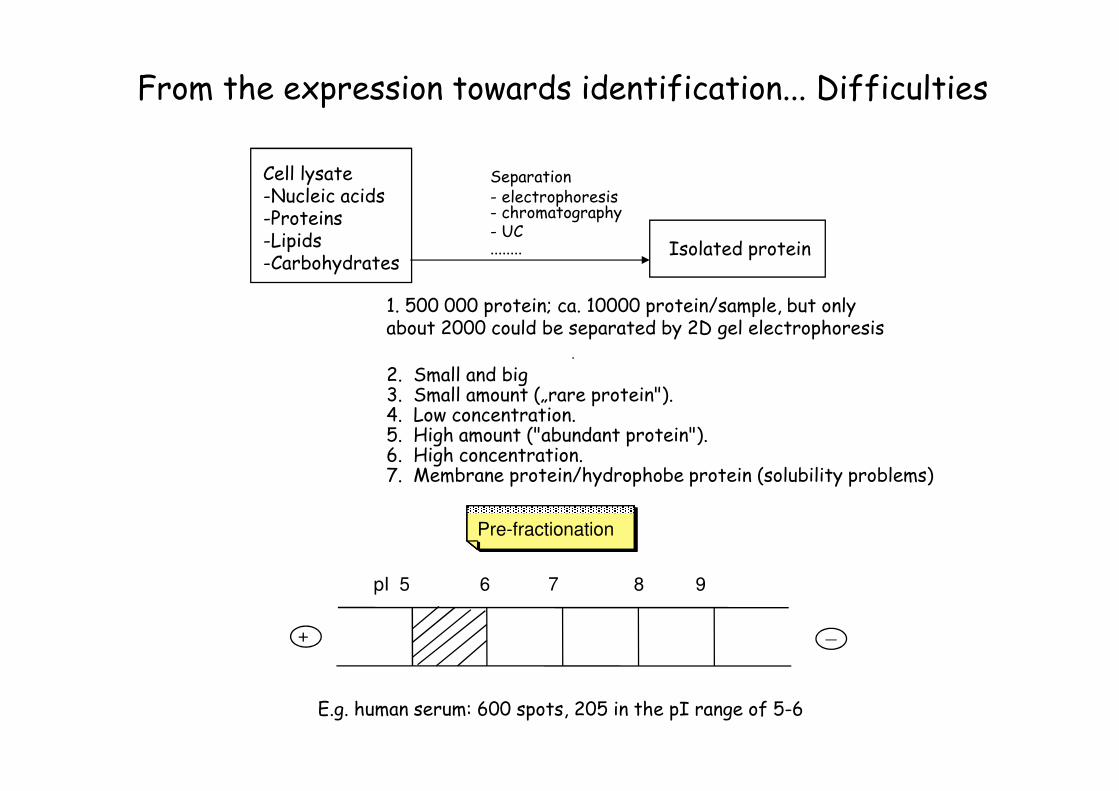
1. 500 000 protein; ca. 10000 protein/sample, but only about 2000 could be separated by 2D gel electrophoresis
2. Small and big3. Small amount („rare protein"). 4. Low concentration. 5. High amount ("abundant protein"). 6. High concentration. 7. Membrane protein/hydrophobe protein (solubility problems)
Separation- electrophoresis- chromatography- UC........ Isolated protein
+ _
pI 5 6 7 8 9
E.g. human serum: 600 spots, 205 in the pI range of 5-6
Pre-fractionation
From the expression towards identification... Difficulties
Cell lysate-Nucleic acids-Proteins-Lipids-Carbohydrates
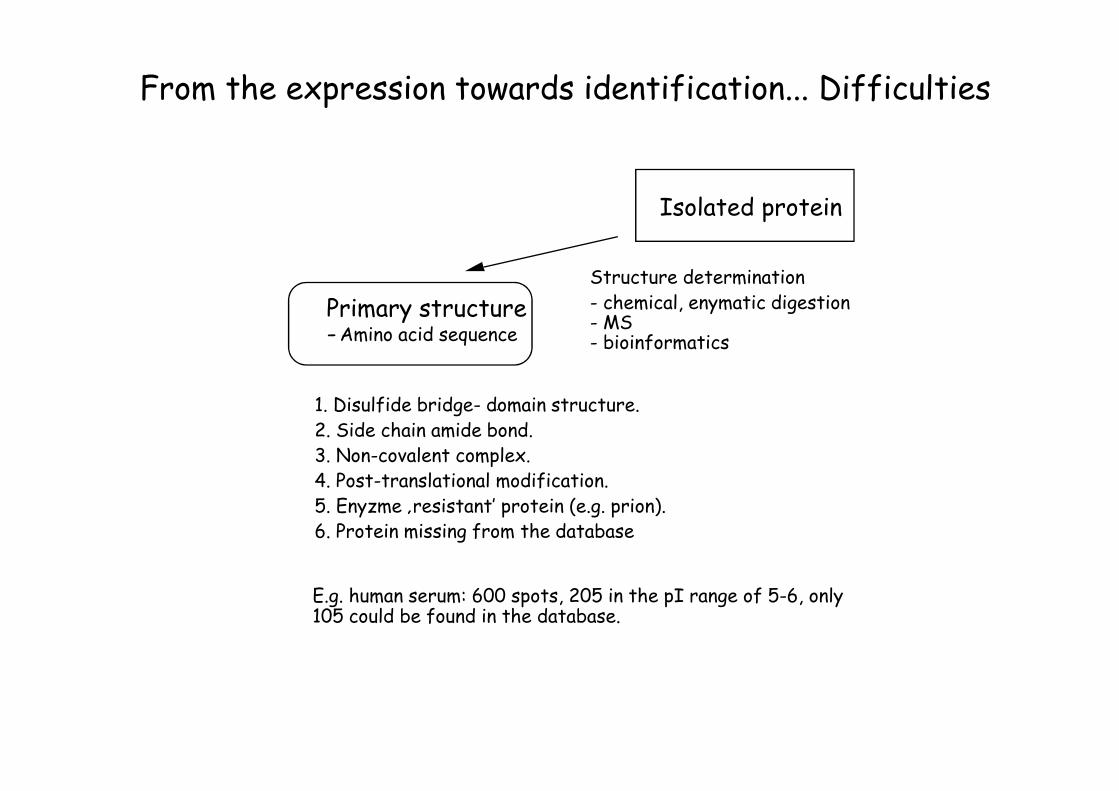
1. Disulfide bridge- domain structure. 2. Side chain amide bond. 3. Non-covalent complex.4. Post-translational modification. 5. Enyzme ‚resistant’ protein (e.g. prion). 6. Protein missing from the database
E.g. human serum: 600 spots, 205 in the pI range of 5-6, only 105 could be found in the database.
Primary structure-Amino acid sequence
Structure determination- chemical, enymatic digestion- MS - bioinformatics
Isolated protein
From the expression towards identification... Difficulties

1. Unknown 3D structure - isolation, synthesis, X-ray/NMR - prediction
2. Unknown localization - cell fractionation- radiolabeled biosynthesis
3. Unknown function - binding- measurement of biological function
4. Comparative studies - species- "normal" vs „treated"
Primary structure- Aminoacid sequence
Localization
Functions- Ca 2+ binding- Zn finger - ATP binding
Association with diseases
Annotation
3D StructurePrimary structure- domains- post-translational modifications
Relationship withother proteins
From the expression towards identification... Difficulties
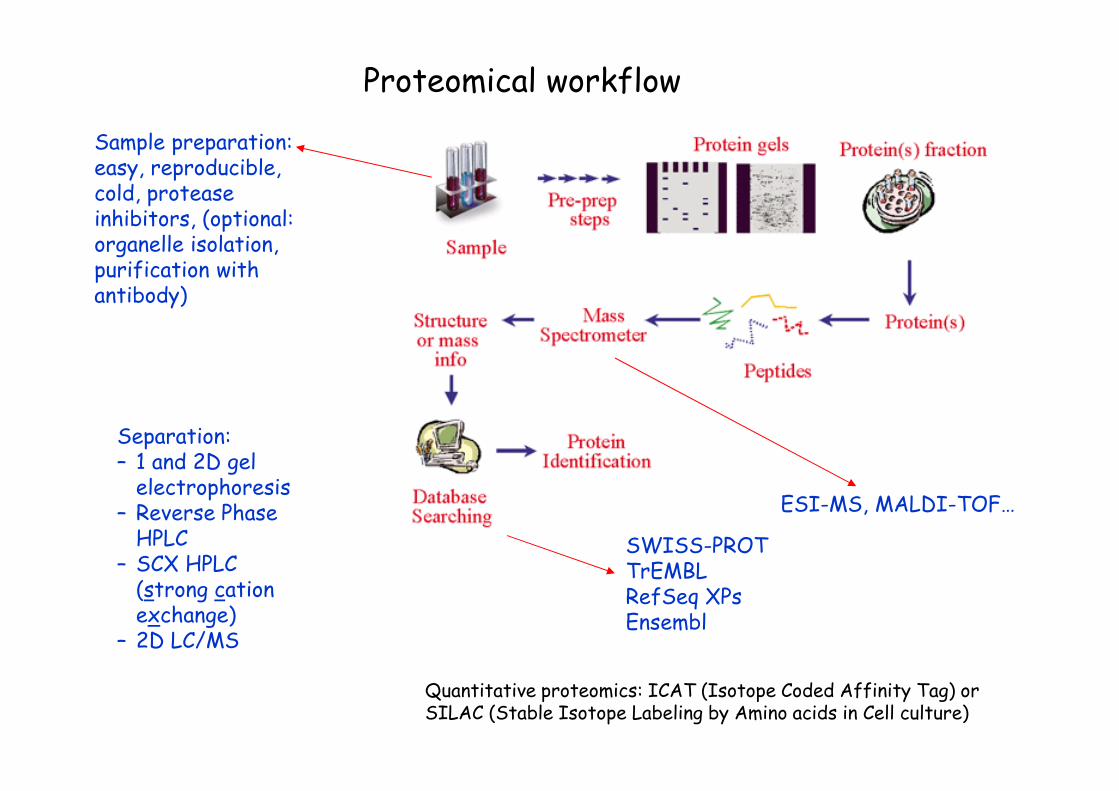
Proteomical workflow
Sample preparation: easy, reproducible, cold, protease inhibitors, (optional: organelle isolation, purification with antibody)
Separation:– 1 and 2D gel electrophoresis
– Reverse Phase HPLC
– SCX HPLC (strong cation exchange)
– 2D LC/MS
ESI-MS, MALDI-TOF…
SWISS-PROTTrEMBLRefSeq XPsEnsembl
Quantitative proteomics: ICAT (Isotope Coded Affinity Tag) or SILAC (Stable Isotope Labeling by Amino acids in Cell culture)

Sample preparation(Mainly for 2D-gels)
– Any type of cell could be analyzed (plant-, microorganism-, animal cells, cell culture, organs etc.)
– Proteins with isolelectric point between 2 and 11
– Proteins between 8 and 200 kDa
– Post-translational modifications
– Cells: 6 x 10⁶ cell/gel
– Tissues: 2,5-50 mg blood-free tissues
– Body fluids: 1010 cells
– Liophylized protein sample: 100-500 µg/gel (protein concentration: 5-30 mg/ml, buffer <50 mM salt, detergents: only non-ionic detergents)
– Sample buffer (7M Urea, 4% CHAPS, 50mM DTT, 2M thiourea)

Difficulties in sample preparation
– Expression could be organ-, tissue- or time-specific
– Proteins in small amount
– Abundant proteins
– Conditions are very important (composition of the cell culture media)
– Membrane proteins
Arg
- Arg
The effect of medium composition on E-coli protein expressionFarrell PHO (1978)
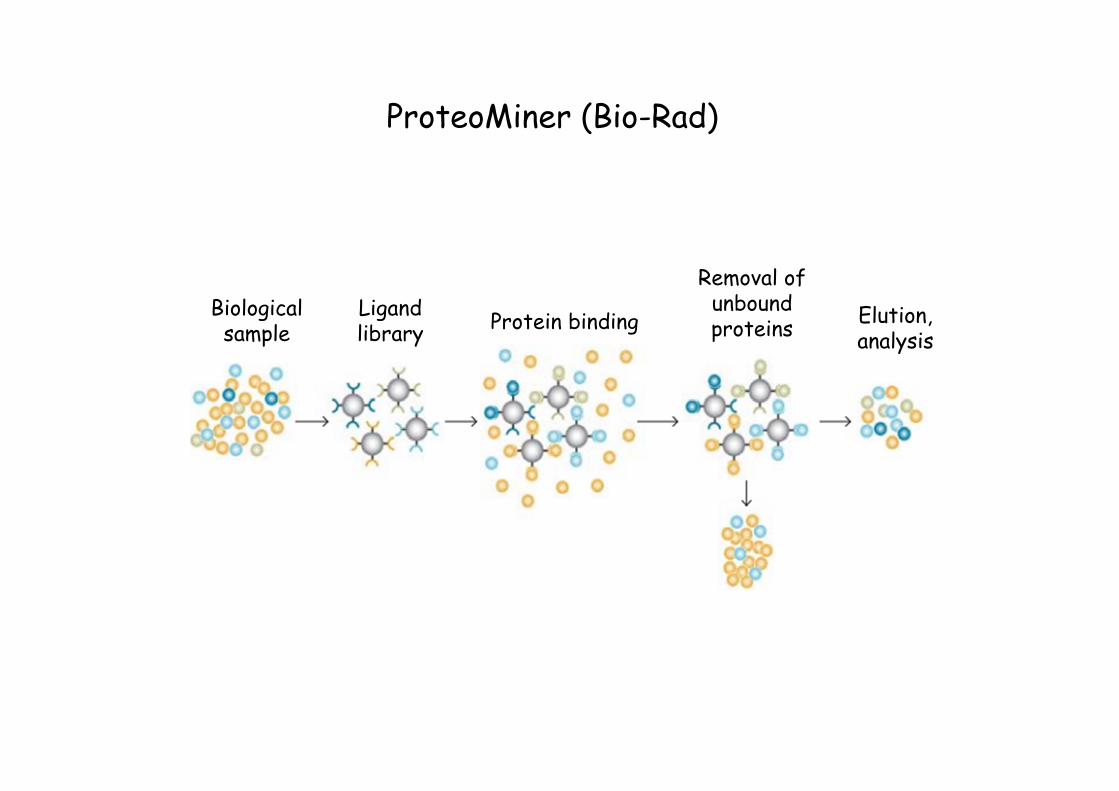
ProteoMiner (Bio-Rad)
Protein binding
Removal of unbound proteins
Elution, analysis
Biological sample
Ligand library

Solubilization of membrane proteins for 2D gel electrophoresis
Why membrane proteins represent only 1% of the identified proteins?
1. Small amount
2. High pI
3. Poor solubility in aqueous solutions
Solution
1. Isolation from the lipid environment
2. They should be solubilized and
3. Remain in solution during IEF
MS MS
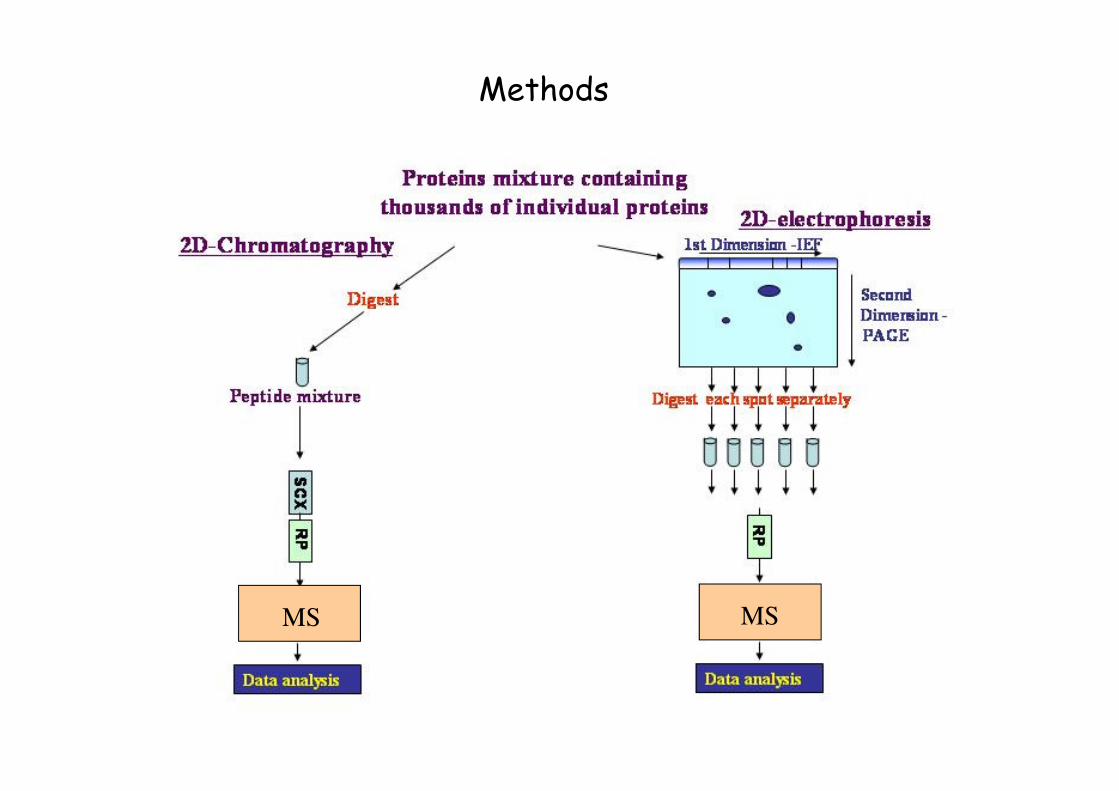
Methods

Separation: 2D gel electrophoresis
Sample solutionDried gel strip
- Passive rehydration (20°C, overnight) / active- Isoelectric focusing (50-250 V, 20’; 250-10000 V, 150’; 8 h)
Gel strip
Acrylamide gel
Running (16 mA/gel, 30 min, then 24 mA/gel)
Equilibration (DTT, SDS, iodoacetamide)
Fixation, staining, washing
wells
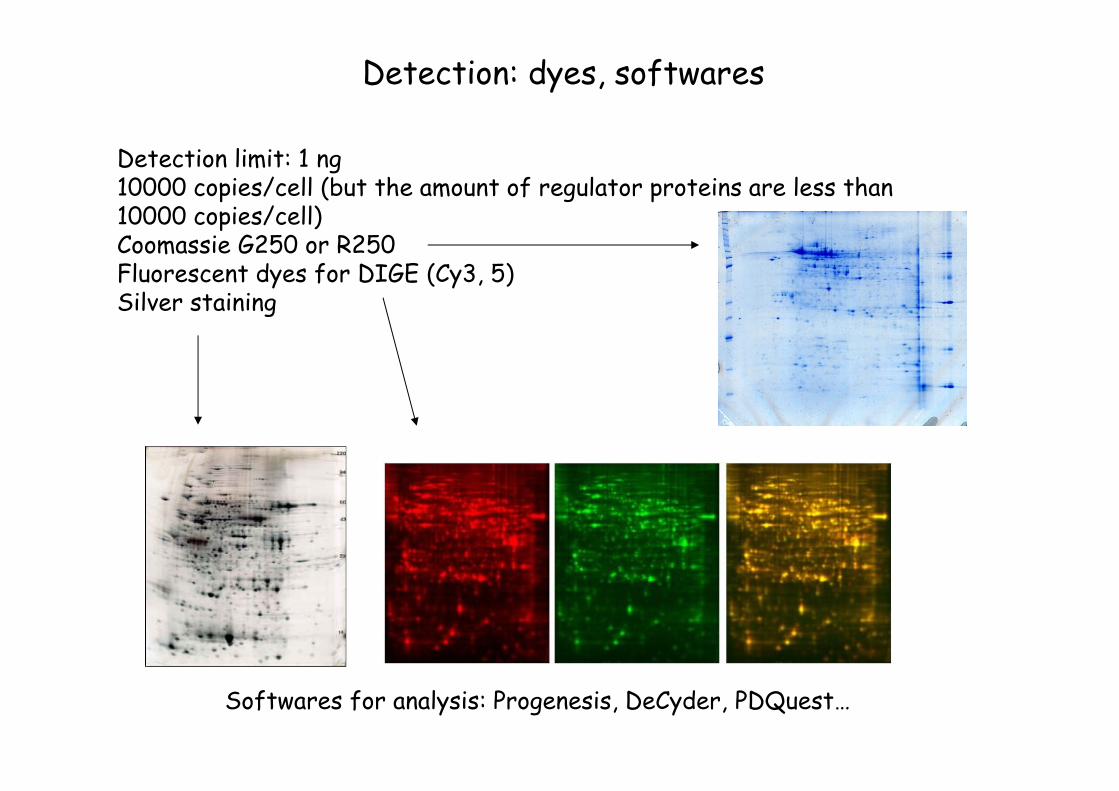
Detection: dyes, softwares
Detection limit: 1 ng10000 copies/cell (but the amount of regulator proteins are less than 10000 copies/cell)Coomassie G250 or R250Fluorescent dyes for DIGE (Cy3, 5)Silver staining
Softwares for analysis: Progenesis, DeCyder, PDQuest…

Differential gel electrophoresis (DIGE)
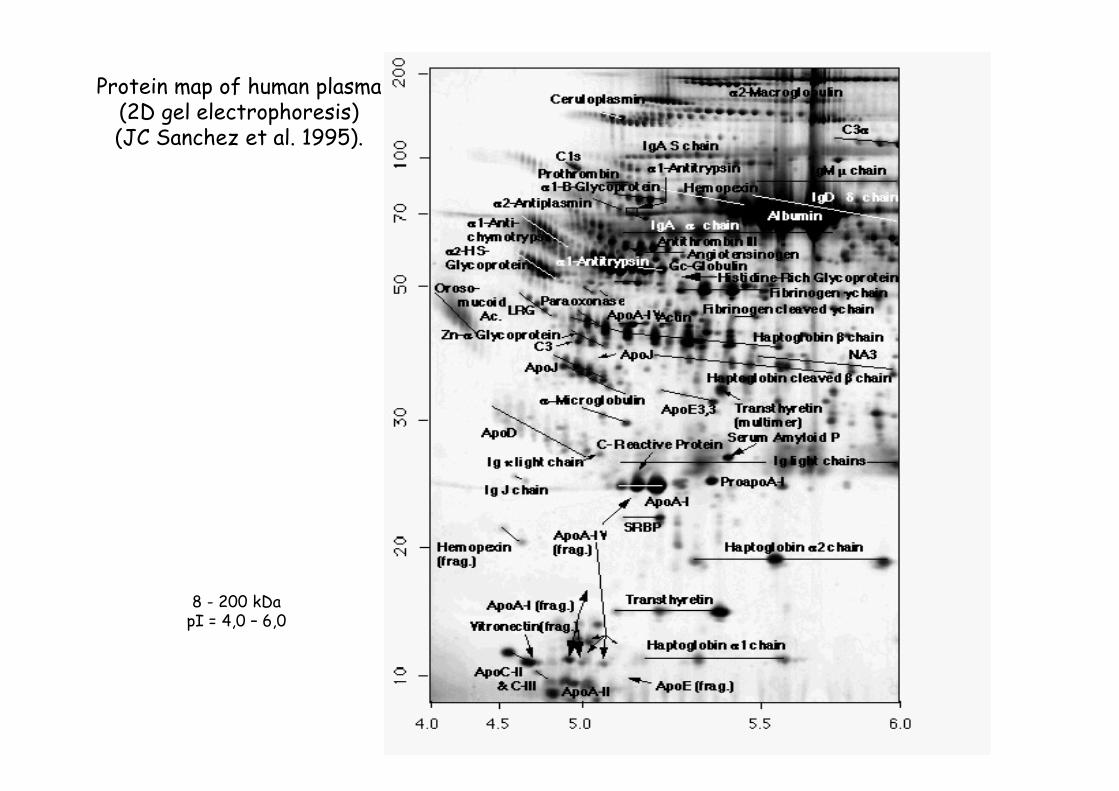
Protein map of human plasma(2D gel electrophoresis)(JC Sanchez et al. 1995).
8 - 200 kDa pI = 4,0 – 6,0

Human colon epithel protein map (2D gel electrophoresis of the cell lysate)(MA Raymond et al. 1997).
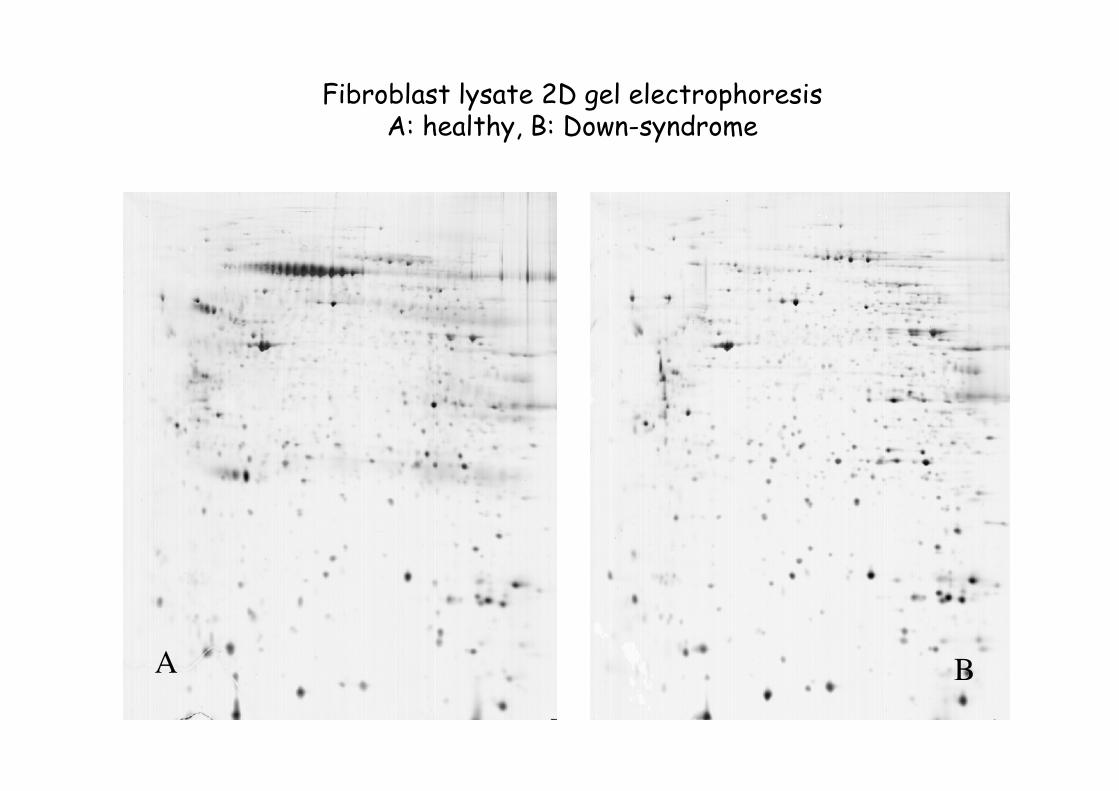
A B
Fibroblast lysate 2D gel electrophoresisA: healthy, B: Down-syndrome
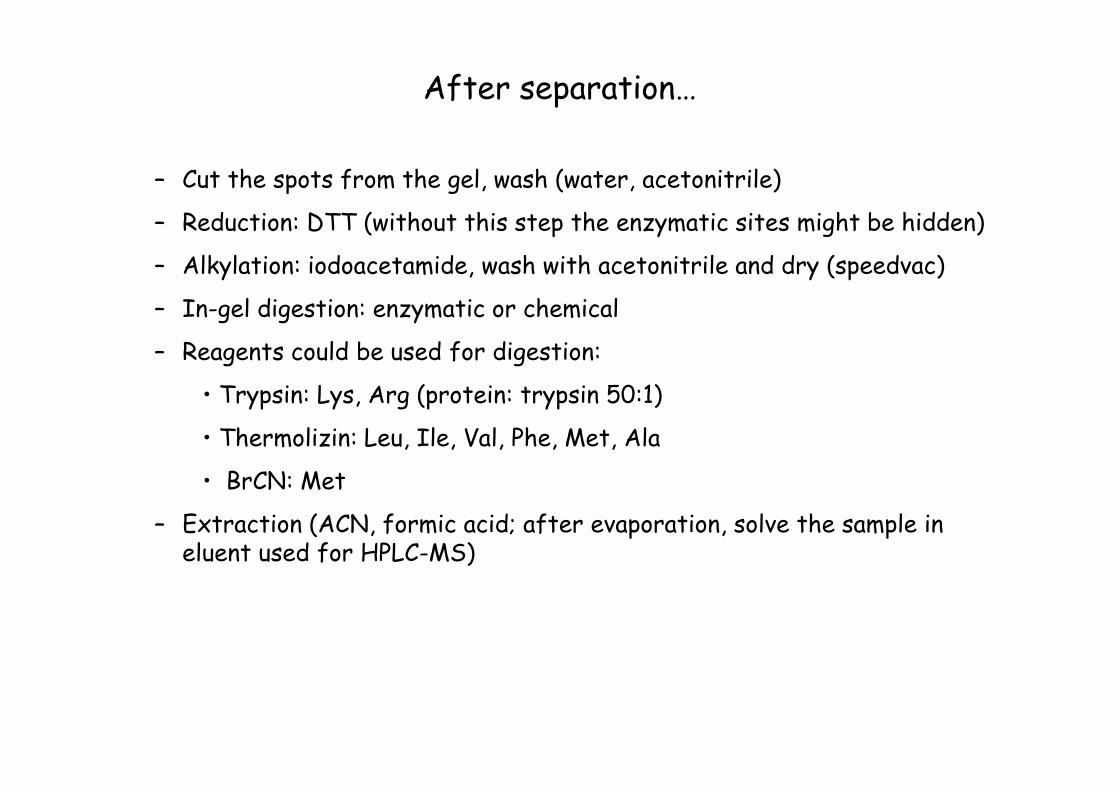
After separation…
– Cut the spots from the gel, wash (water, acetonitrile)
– Reduction: DTT (without this step the enzymatic sites might be hidden)
– Alkylation: iodoacetamide, wash with acetonitrile and dry (speedvac)
– In-gel digestion: enzymatic or chemical
– Reagents could be used for digestion:
• Trypsin: Lys, Arg (protein: trypsin 50:1)
• Thermolizin: Leu, Ile, Val, Phe, Met, Ala
• BrCN: Met
– Extraction (ACN, formic acid; after evaporation, solve the sample in eluent used for HPLC-MS)

Non-gel based separation methods: chromatography for the analysis of peptides and proteins
Gelfiltration Hydrophobicinteraction
Ion-exchange Reverse phase Affinity
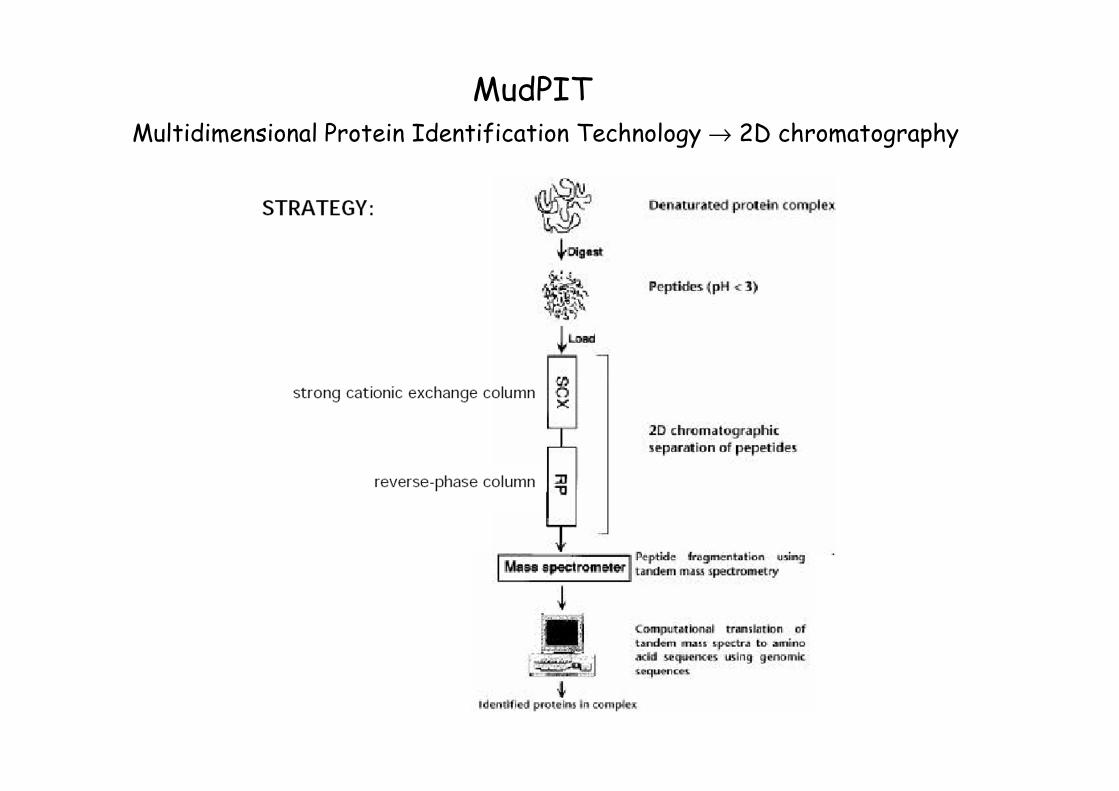
MudPITMultidimensional Protein Identification Technology → 2D chromatography

ICAT: Isotope Coded Affinity Tag
Labeling with two different stable isotope (biotin is required for the isolation of the peptides)
1. Protein isolation, isotope labeling
2. Mix the two samples labeled with different isotopes
3. Digestion
4. Separation
5. Mass spectrometry
6. Identification from database

SILAC: Stable Isotope Labeling by Amino acids in
Cell culture
Principle: incorporation of amino acids into the proteins of the cell.
Before treatment and analysis some cell division cycle are needed for the incorporation.
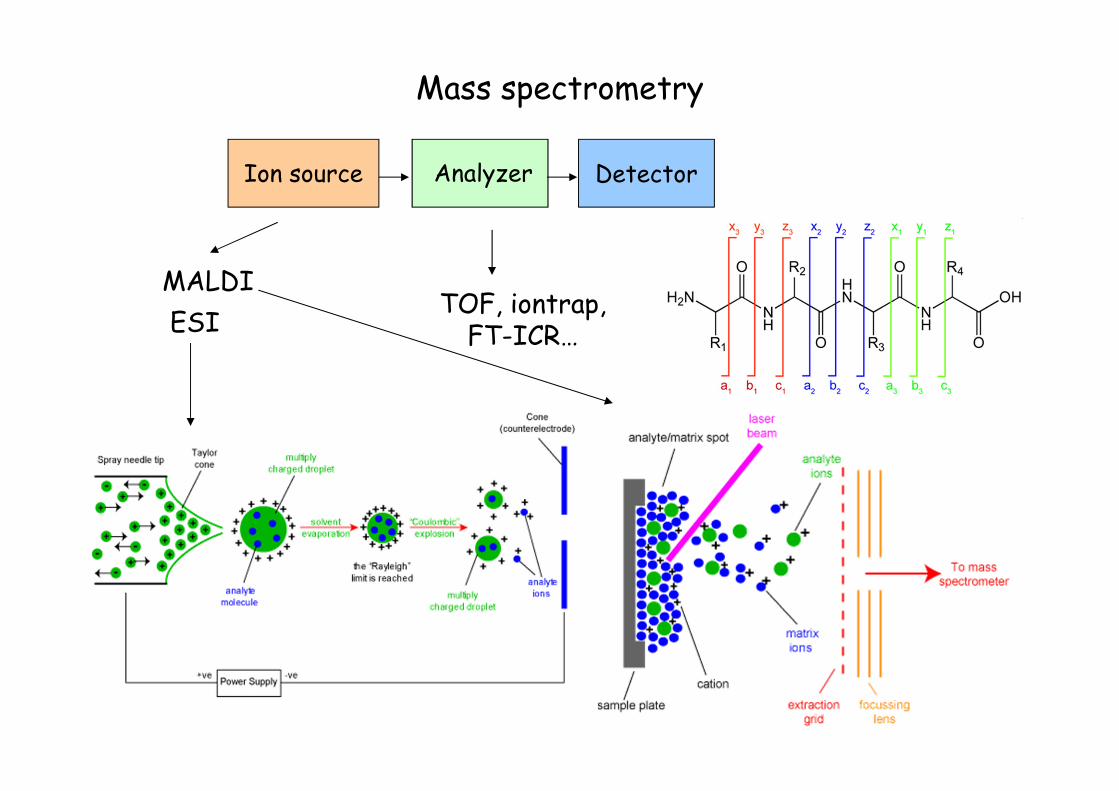
Mass spectrometry
Ion source Analyzer Detector
ESI
MALDITOF, iontrap, FT-ICR…
EDA N
KQ ,V
TP
510 610590530 570550 630
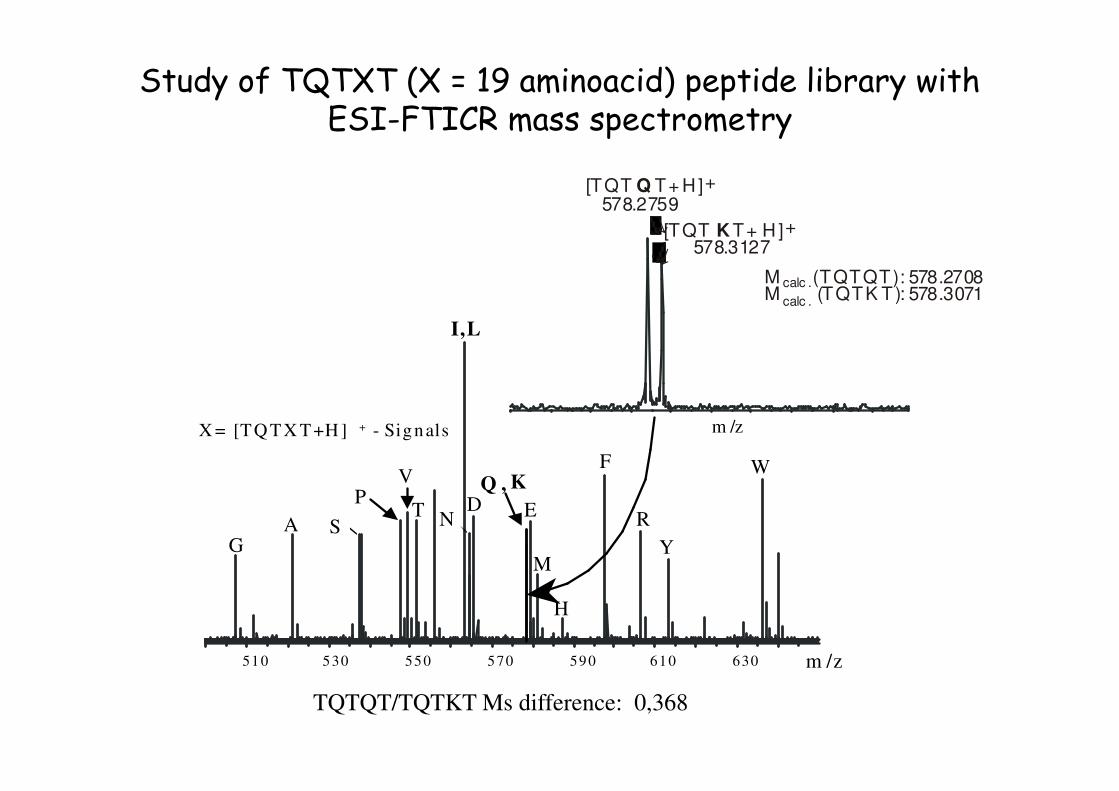
X = [TQ TX T+H ] + - Signals
M
H
F
R
Y
W
m /z
GS
I,L
M calc .(TQTQT): 578.2708M calc .
(TQTK T): 578.3071
[TQT K T+ H ]578.3127
+
[TQT Q T+ H]578.2759
+
↓
↓
m /z
Study of TQTXT (X = 19 aminoacid) peptide library with ESI-FTICR mass spectrometry
TQTQT/TQTKT Ms difference: 0,368

Search in database
Mass spectrum
Peptide Mass Fingerprint (PMF)
Protein identification based on molecular mass
MS/MS spectrum
Sequence-specific information for every peptides
Protein identification based on the sequence information of the peptides
MS based search MS-MS based search
At least 5 peptide mass should be identical
At least 2 fragmentation patterns should be identical
For identification
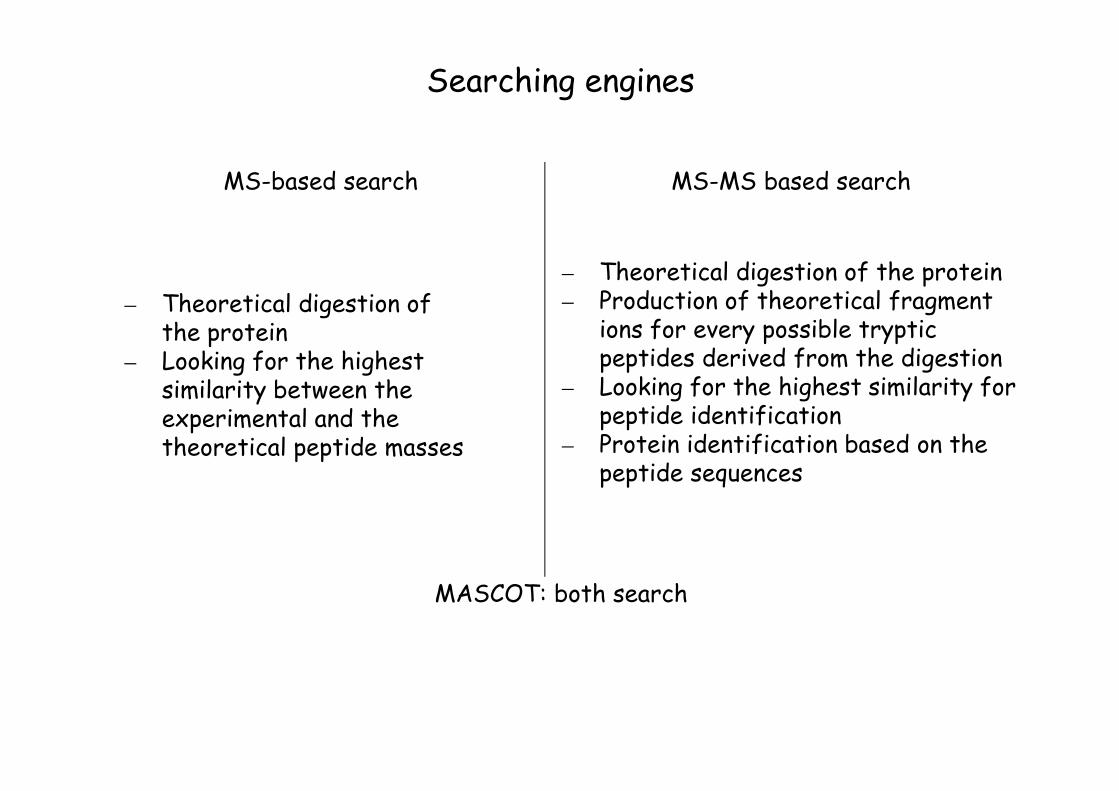
Searching engines
MS-based search
– Theoretical digestion of the protein
– Looking for the highest similarity between the experimental and the theoretical peptide masses
MS-MS based search
– Theoretical digestion of the protein– Production of theoretical fragment
ions for every possible tryptic peptides derived from the digestion
– Looking for the highest similarity for peptide identification
– Protein identification based on the peptide sequences
MASCOT: both search

Mascot
- Combined search of MS/MS, sequence and mass spectrometricaldata
- Searching in MSDB, SwissProt and NCBI database
ExPASy (Expert Protein Analysis System)
www.expasy.org
-2D gel electrophoresis database
-Technical information
-Searching based on protein name and identification number

International Protein Index (IPI)
http://www.ebi.ac.uk/IPI/IPIhelp.html
(October 2001)
Human Proteom, Collection of human protein sequence information from 5 databases
SWISS-PROT Swiss-Prot is a manually curated biological database of protein sequences started by Amos Bairoch and developed by the Swiss Institute of Bioinformatics and the European Bioinformatics Institute
TrEMBL TrEMBL, (Translated EMBL) is a very large protein database in SwissProt format generated by computer translation of the genetic information from the EMBL Nucleotide Sequence Database.
RefSeq The Reference Sequence (RefSeq) database is an open access, annotated and curated collection of publicly available nucleotide sequences (DNA, RNA) and their protein products. This database is built by National Center for Biotechnology Information (NCBI), and, unlike GenBank, provides only a single record for each natural biological molecule (i.e. DNA, RNA or protein) for major organisms ranging from viruses to bacteria to eukaryotes.
Ensembl Ensembl is a joint scientific project between the European Bioinformatics Institute and the Wellcome Trust Sanger Institute, which was launched in 1999 in response to the imminent completion of the Human Genome Project.
Databases
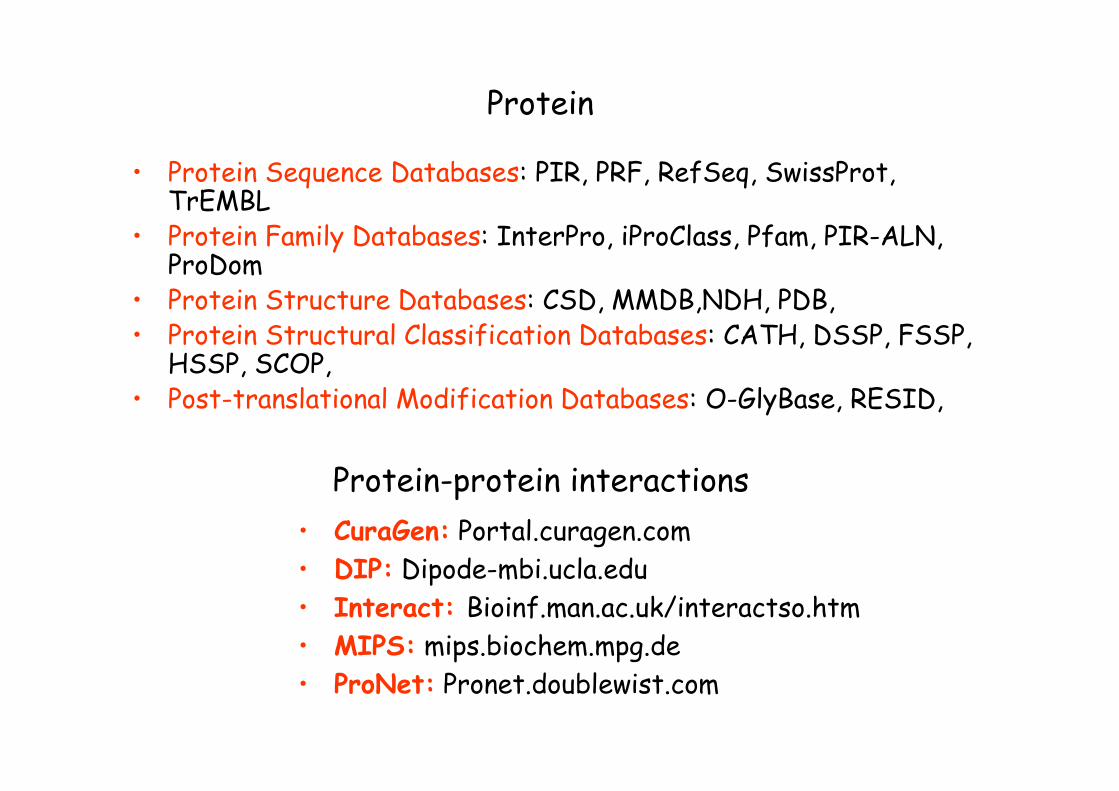
• Protein Sequence Databases: PIR, PRF, RefSeq, SwissProt, TrEMBL
• Protein Family Databases: InterPro, iProClass, Pfam, PIR-ALN, ProDom
• Protein Structure Databases: CSD, MMDB,NDH, PDB, • Protein Structural Classification Databases: CATH, DSSP, FSSP,
HSSP, SCOP, • Post-translational Modification Databases: O-GlyBase, RESID,
• CuraGen: Portal.curagen.com
• DIP: Dipode-mbi.ucla.edu
• Interact: Bioinf.man.ac.uk/interactso.htm
• MIPS: mips.biochem.mpg.de
• ProNet: Pronet.doublewist.com
Protein-protein interactions
Protein
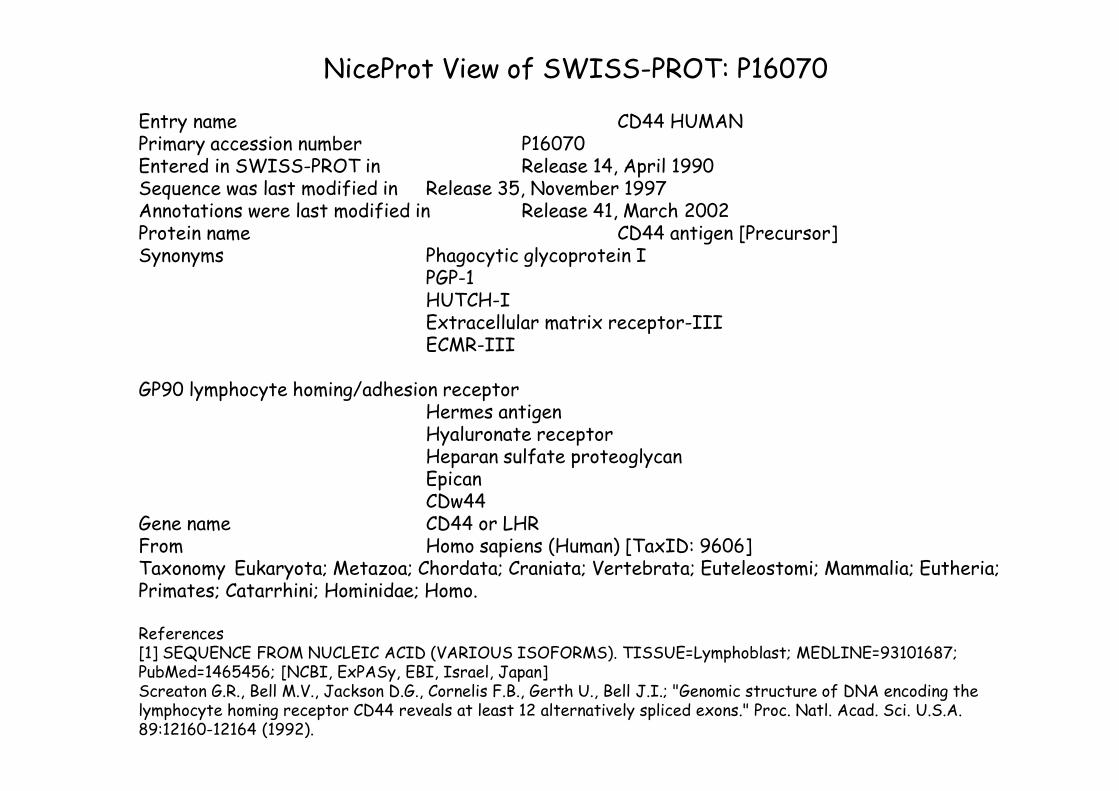
NiceProt View of SWISS-PROT: P16070
Entry name CD44 HUMANPrimary accession number P16070Entered in SWISS-PROT in Release 14, April 1990Sequence was last modified in Release 35, November 1997Annotations were last modified in Release 41, March 2002Protein name CD44 antigen [Precursor]Synonyms Phagocytic glycoprotein I
PGP-1HUTCH-IExtracellular matrix receptor-IIIECMR-III
GP90 lymphocyte homing/adhesion receptorHermes antigenHyaluronate receptorHeparan sulfate proteoglycanEpicanCDw44
Gene name CD44 or LHRFrom Homo sapiens (Human) [TaxID: 9606]Taxonomy Eukaryota; Metazoa; Chordata; Craniata; Vertebrata; Euteleostomi; Mammalia; Eutheria; Primates; Catarrhini; Hominidae; Homo.
References[1] SEQUENCE FROM NUCLEIC ACID (VARIOUS ISOFORMS). TISSUE=Lymphoblast; MEDLINE=93101687; PubMed=1465456; [NCBI, ExPASy, EBI, Israel, Japan]Screaton G.R., Bell M.V., Jackson D.G., Cornelis F.B., Gerth U., Bell J.I.; "Genomic structure of DNA encoding the lymphocyte homing receptor CD44 reveals at least 12 alternatively spliced exons." Proc. Natl. Acad. Sci. U.S.A. 89:12160-12164 (1992).
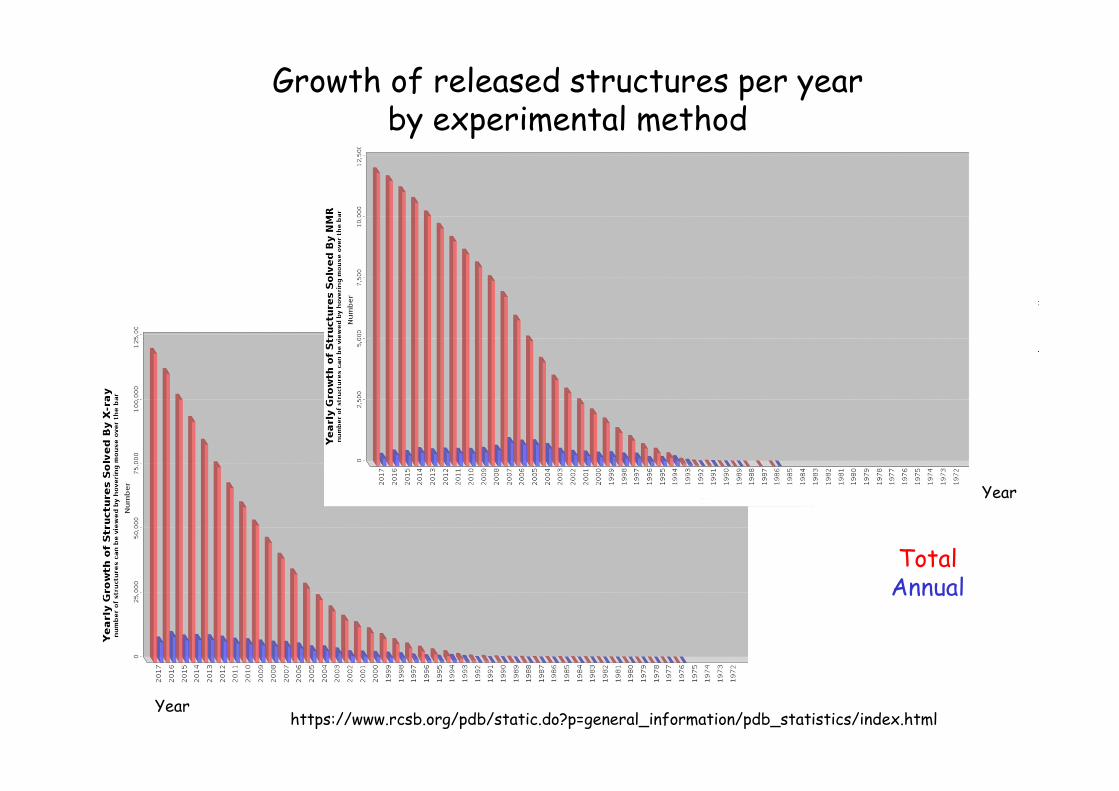
Growth of released structures per year by experimental method
https://www.rcsb.org/pdb/static.do?p=general_information/pdb_statistics/index.html
Year
TotalAnnual
Year

Growth of released structures per year by molecular type
https://www.rcsb.org/pdb/static.do?p=general_information/pdb_statistics/index.html
Year
Year
Advantages of the method
– Mass Spectrometry: high sensitivity and precise molecular mass deterimantion, user-friendly instruments
– Protein sequence databases: a lot of information
– Bioinformatics: searching engines → fast results

Cell mappingExpression profile analysis
Signal transmission
Application of proteomics
Toxicity profiling of drugsDrug targeting
Analysis of the mechanism of action
Identification of biomarkersMetabolic analysis of aging Monitoring of patients of neuro/immunological disorders
Proteome analysisPost translational analysis
Studies on expression mechanism
Food analysisAgro products: protein profile
Microbiology: identification of useful proteins to produce
Structural genomicsBioinformatics
Protein chipIdentification of differences
Proteomics(2DE, MS)
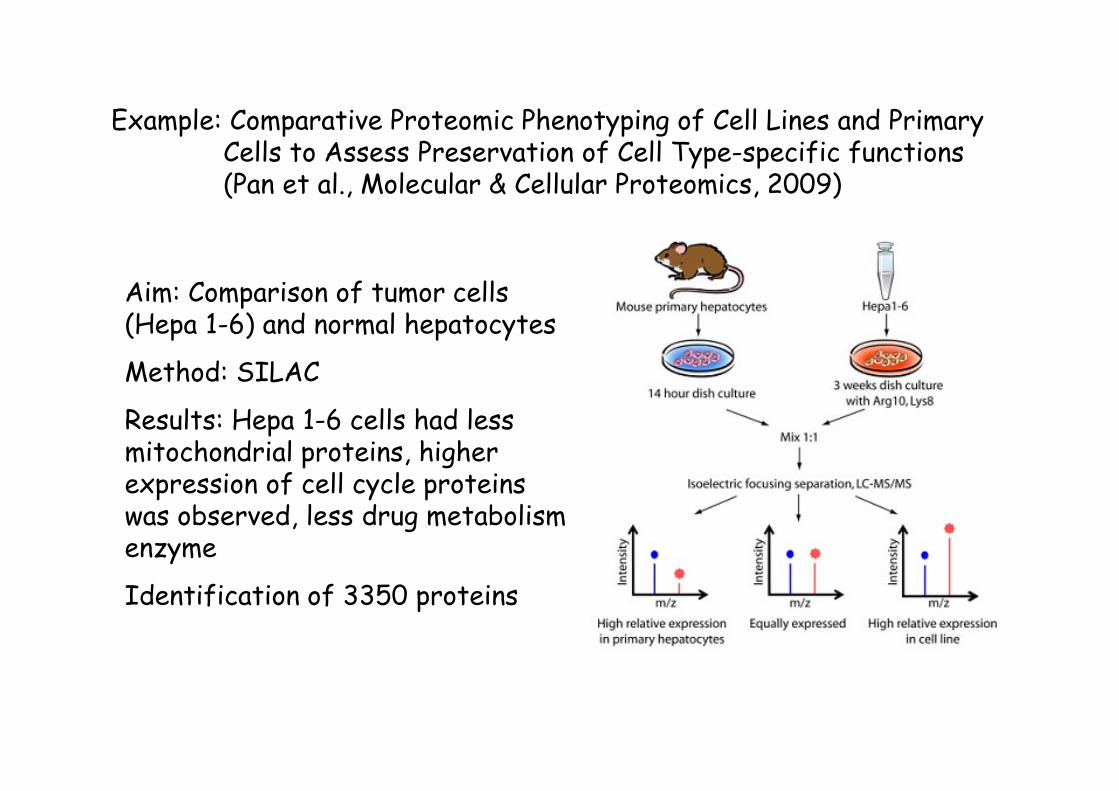
Example: Comparative Proteomic Phenotyping of Cell Lines and Primary Cells to Assess Preservation of Cell Type-specific functions(Pan et al., Molecular & Cellular Proteomics, 2009)
Aim: Comparison of tumor cells (Hepa 1-6) and normal hepatocytes
Method: SILAC
Results: Hepa 1-6 cells had less mitochondrial proteins, higher expression of cell cycle proteins was observed, less drug metabolism enzyme
Identification of 3350 proteins
An example from our lab

Site of action
degradation
lyzosome
degradation
fluidicendocytosis
receptor mediatedendocytosis
diffusion/activetransport
Uptake and liberation of bioactive entities
lyzosome
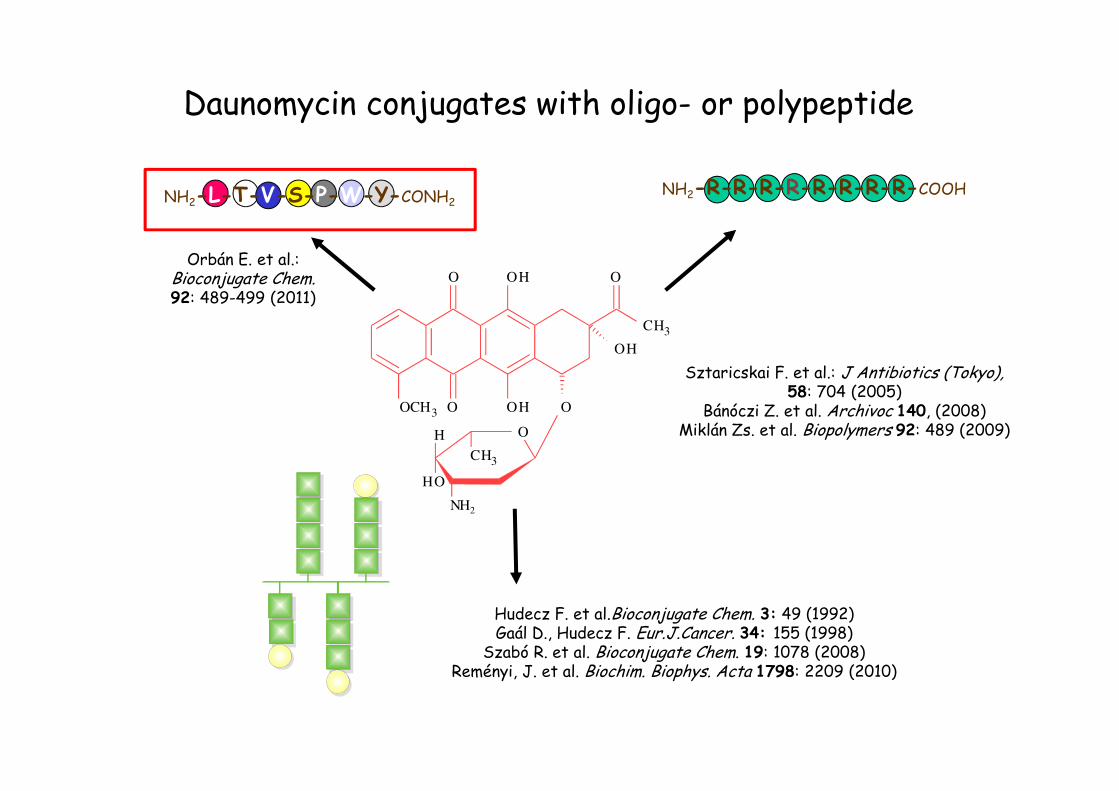
Daunomycin conjugates with oligo- or polypeptide
NH2-R-R-R-R-R-R-R-R-COOH
O
O
OH
OH
CH3
O
OH
OCH3 O
O
CH3
H
OH
NH2
NH2-L-T-V-S-P-W-Y-CONH2
Hudecz F. et al.Bioconjugate Chem. 3: 49 (1992)Gaál D., Hudecz F. Eur.J.Cancer. 34: 155 (1998)
Szabó R. et al. Bioconjugate Chem. 19: 1078 (2008)Reményi, J. et al. Biochim. Biophys. Acta 1798: 2209 (2010)
Orbán E. et al.: Bioconjugate Chem.92: 489-499 (2011)
Sztaricskai F. et al.: J Antibiotics (Tokyo),58: 704 (2005)
Bánóczi Z. et al. Archivoc 140, (2008)Miklán Zs. et al. Biopolymers 92: 489 (2009)
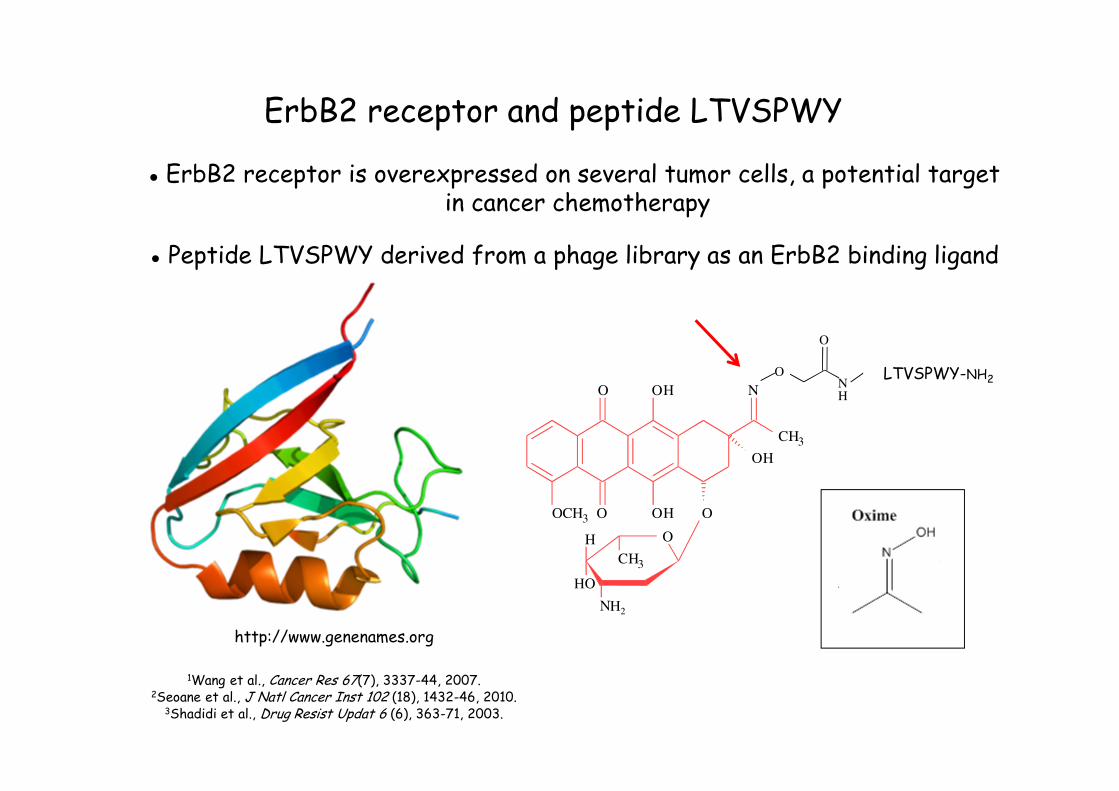
ErbB2 receptor and peptide LTVSPWY
● ErbB2 receptor is overexpressed on several tumor cells, a potential targetin cancer chemotherapy
● Peptide LTVSPWY derived from a phage library as an ErbB2 binding ligand
http://www.genenames.org
NO
H
O
LTVSPWY-NH2 O
O
OH
OH
CH3
N
OH
OCH3 O
O
CH3
H
OH
NH2
1Wang et al., Cancer Res 67(7), 3337-44, 2007. 2Seoane et al., J Natl Cancer Inst 102 (18), 1432-46, 2010.
3Shadidi et al., Drug Resist Updat 6 (6), 363-71, 2003.

NO
H
O
H2N
Leu-Thr-Val-Ser-Pro-Trp-Tyr-NH22
3
+
0.2 M Na acetate (pH 5,5) : DMSO (85 : 15 v/v)
24 hrs, RT
9.5 ml TFA
0.25 ml EDT
0.25 ml water
2 hrs, RT
O
O
OH
OH
CH3
O
OH
OCH3 O
O
CH3
H
OH
NH2
NO
H
O
Leu-Thr-Val-Ser-Pro-Trp-Tyr-NH2O
O
OH
OH
CH3
N
OH
OCH3 O
O
CH3
H
OH
NH2
H
Leu-Thr(tBu)-Val-Ser(tBu)-Pro-Trp(Boc)-Tyr(tBu)N
O
H
OO
OCH3
CH3
CH
N
Synthesis of Dau-heptapeptide conjugate with oxime bond
Orbán et al. Bioconjugate Chem. 92: 489 (2011)

pH stability of of Dau=Aoa-LTVSPWY-amide conjugate with oxime bond
Analytical RP-HPLC chromatogramin 0.1 M Na citrate buffer, pH 5.0
Analytical RP-HPLC chromatogramin 0.1 M Na citrate buffer, pH 2.5
Analytical RP-HPLC chromatogramin 0.1 M Na citrate buffer, pH 7.0
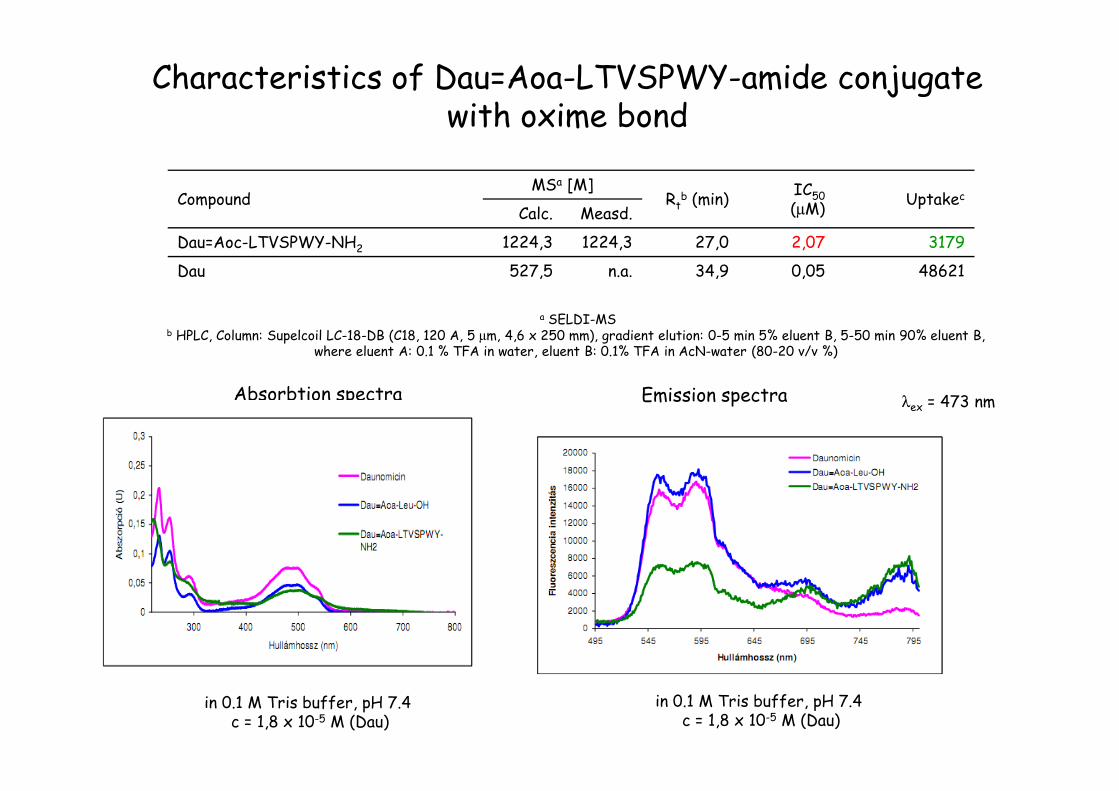
CompoundMSa [M]
Rtb (min)
IC50(µM)
UptakecCalc. Measd.
Dau=Aoc-LTVSPWY-NH2 1224,3 1224,3 27,0 2,07 3179
Dau 527,5 n.a. 34,9 0,05 48621
a SELDI-MSb HPLC, Column: Supelcoil LC-18-DB (C18, 120 A, 5 µm, 4,6 x 250 mm), gradient elution: 0-5 min 5% eluent B, 5-50 min 90% eluent B,
where eluent A: 0.1 % TFA in water, eluent B: 0.1% TFA in AcN-water (80-20 v/v %)
Absorbtion spectra λex = 473 nm
Characteristics of Dau=Aoa-LTVSPWY-amide conjugate with oxime bond
in 0.1 M Tris buffer, pH 7.4 c = 1,8 x 10⁻⁵ M (Dau)
in 0.1 M Tris buffer, pH 7.4 c = 1,8 x 10⁻⁵ M (Dau)
Emission spectra
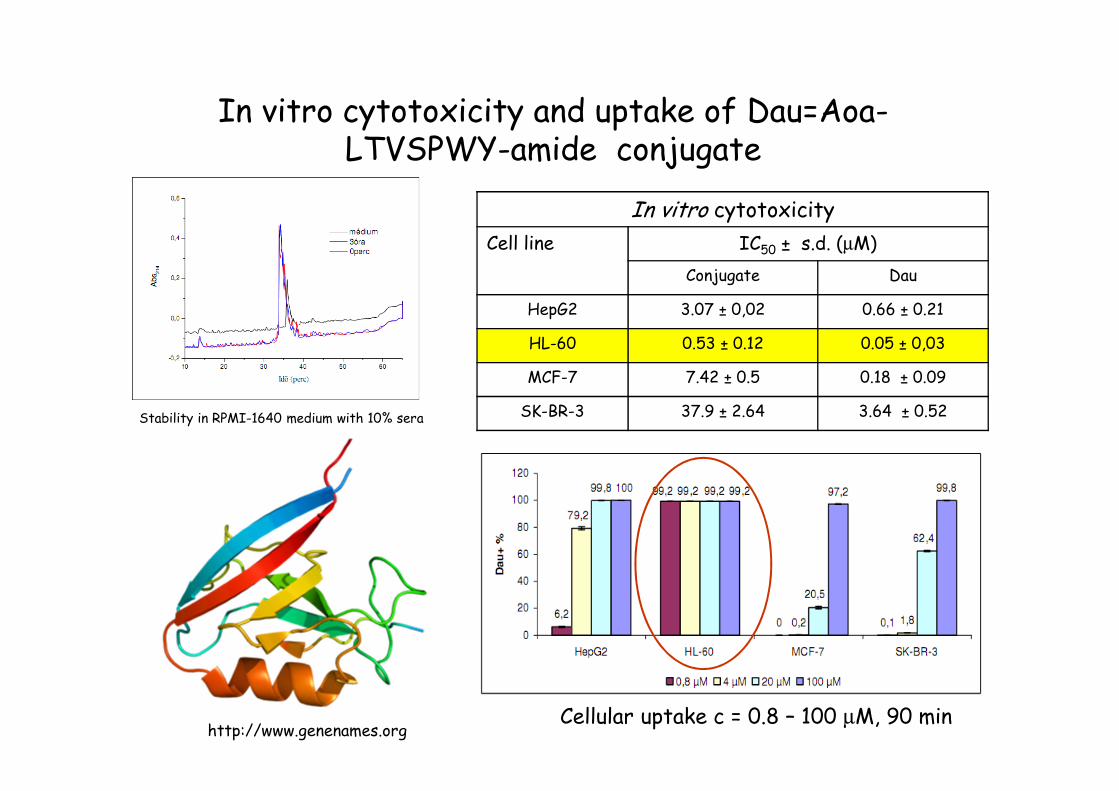
In vitro cytotoxicity and uptake of Dau=Aoa-LTVSPWY-amide conjugate
http://www.genenames.orgCellular uptake c = 0.8 – 100 µM, 90 min
In vitro cytotoxicity
Cell line IC50 ± s.d. (µM)
Conjugate Dau
HepG2 3.07 ± 0,02 0.66 ± 0.21
HL-60 0.53 ± 0.12 0.05 ± 0,03
MCF-7 7.42 ± 0.5 0.18 ± 0.09
SK-BR-3 37.9 ± 2.64 3.64 ± 0.52Stability in RPMI-1640 medium with 10% sera
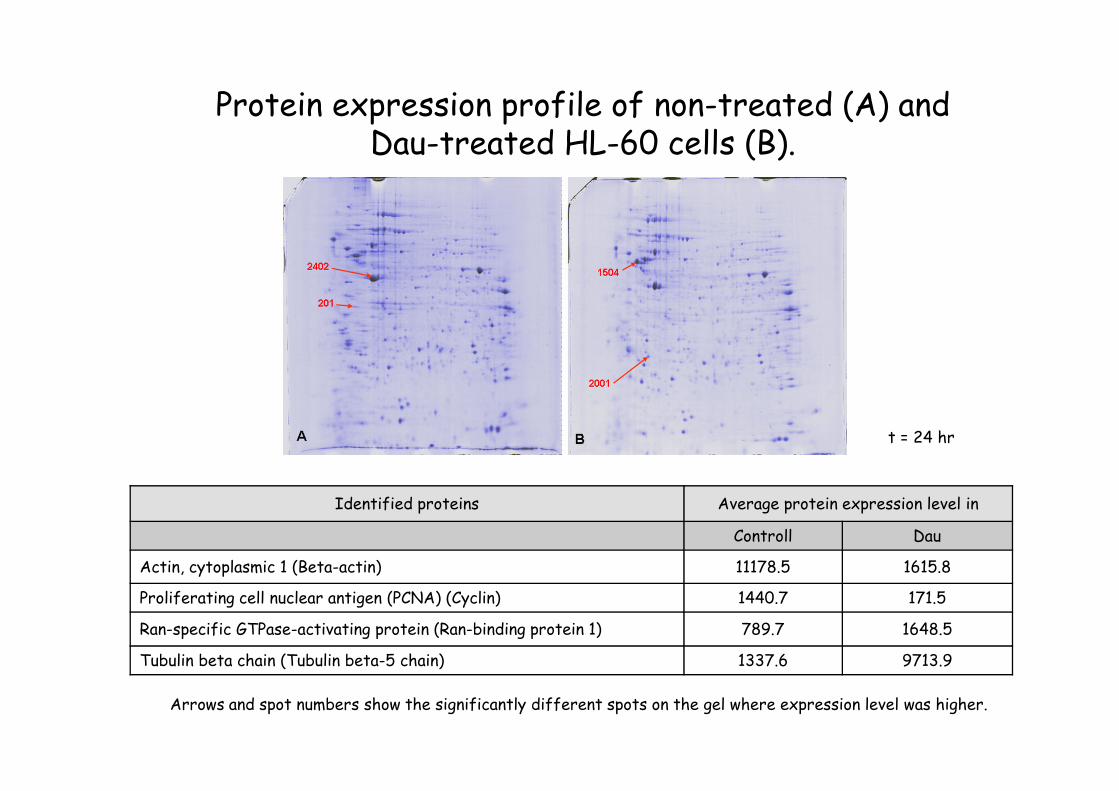
Protein expression profile of non-treated (A) and Dau-treated HL-60 cells (B).
Arrows and spot numbers show the significantly different spots on the gel where expression level was higher.
Identified proteins Average protein expression level in
Controll Dau
Actin, cytoplasmic 1 (Beta-actin) 11178.5 1615.8
Proliferating cell nuclear antigen (PCNA) (Cyclin) 1440.7 171.5
Ran-specific GTPase-activating protein (Ran-binding protein 1) 789.7 1648.5
Tubulin beta chain (Tubulin beta-5 chain) 1337.6 9713.9
t = 24 hr
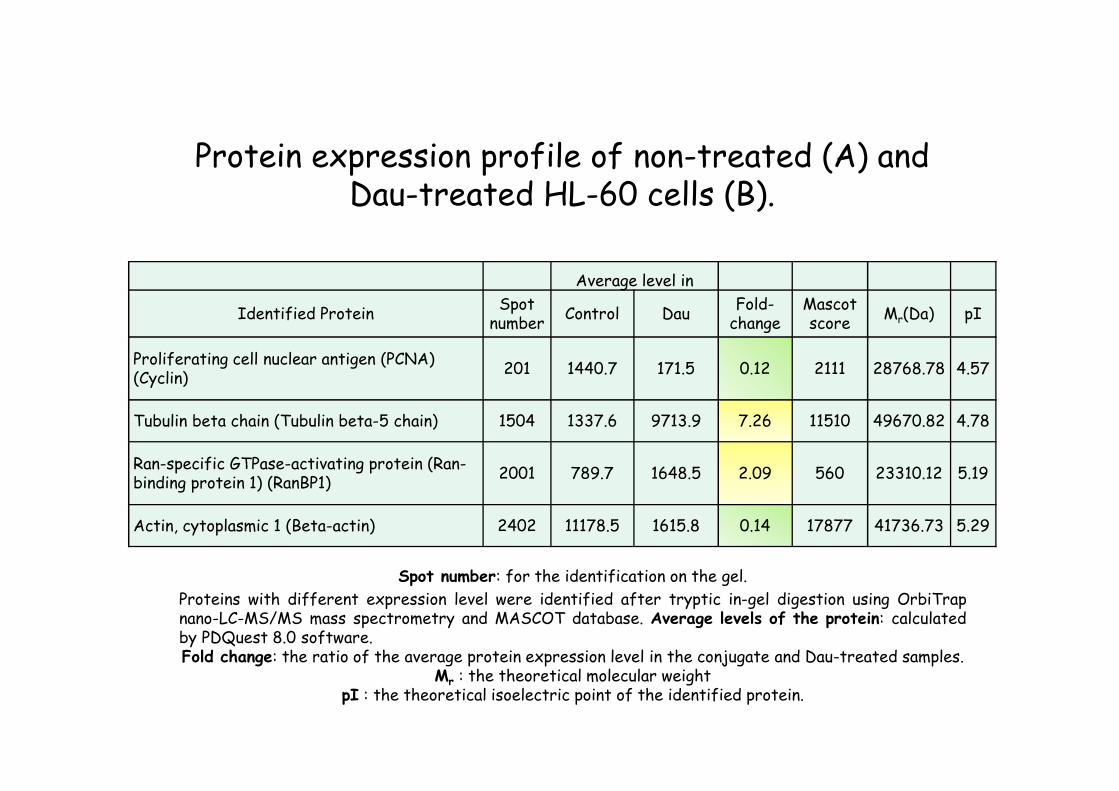
Average level in
Identified ProteinSpot
numberControl Dau
Fold-change
Mascot score
Mr(Da) pI
Proliferating cell nuclear antigen (PCNA) (Cyclin)
201 1440.7 171.5 0.12 2111 28768.78 4.57
Tubulin beta chain (Tubulin beta-5 chain) 1504 1337.6 9713.9 7.26 11510 49670.82 4.78
Ran-specific GTPase-activating protein (Ran-binding protein 1) (RanBP1)
2001 789.7 1648.5 2.09 560 23310.12 5.19
Actin, cytoplasmic 1 (Beta-actin) 2402 11178.5 1615.8 0.14 17877 41736.73 5.29
Protein expression profile of non-treated (A) and Dau-treated HL-60 cells (B).
Spot number: for the identification on the gel.
Proteins with different expression level were identified after tryptic in-gel digestion using OrbiTrapnano-LC-MS/MS mass spectrometry and MASCOT database. Average levels of the protein: calculatedby PDQuest 8.0 software.Fold change: the ratio of the average protein expression level in the conjugate and Dau-treated samples.
Mr : the theoretical molecular weightpI : the theoretical isoelectric point of the identified protein.

Protein expression profile of non-treated (A) and Dau=Aoa-LTVSPWY-NH2 conjugate-treated HL-60 cells (B)
Identified proteins Average protein expression level in
Control Dau=Aoa-LTVSPWY-NH2
D-3-phosphoglycerate dehydrogenase (EC 1.1.1.95) (3-PGDH) 1067.9 526.0
Fructose-bisphosphate aldolase A (EC 4.1.2.13) (Muscle-type aldolase) 2105.1 999.3
Heat shock cognate 71 kDa protein (Heat shock 70 kDa protein 8) 6507.8 5.6
Plastin-2 (L-plastin) (Lymphocyte cytosolic protein 1) (LCP-1) 482.3 1065.6
Ran-specific GTPase-activating protein (Ran-binding protein 1) 789.7 1805.0
Rho GDP-dissociation inhibitor 2 (Rho GDI 2) (Rho-GDI beta) (Ly-GDI) 2253.9 5.6
Transitional endoplasmic reticulum ATPase (Valosin-containing protein) (VCP) 994.4 271.7
Translationally-controlled tumor protein (TCTP) (p23) (Histamine-releasing factor) 1406.2 5.6
t = 24 hr
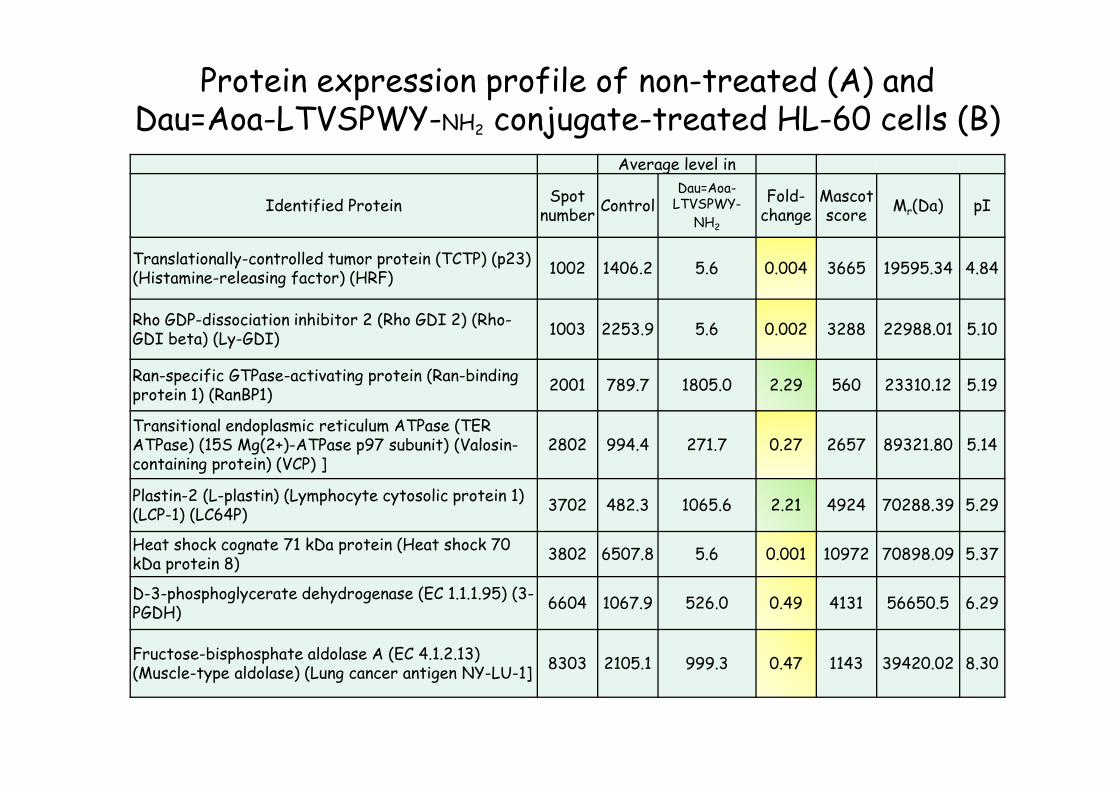
Average level in
Identified ProteinSpot
numberControl
Dau=Aoa-LTVSPWY-
NH2
Fold-change
Mascot score
Mr(Da) pI
Translationally-controlled tumor protein (TCTP) (p23) (Histamine-releasing factor) (HRF)
1002 1406.2 5.6 0.004 3665 19595.34 4.84
Rho GDP-dissociation inhibitor 2 (Rho GDI 2) (Rho-GDI beta) (Ly-GDI)
1003 2253.9 5.6 0.002 3288 22988.01 5.10
Ran-specific GTPase-activating protein (Ran-bindingprotein 1) (RanBP1)
2001 789.7 1805.0 2.29 560 23310.12 5.19
Transitional endoplasmic reticulum ATPase (TER ATPase) (15S Mg(2+)-ATPase p97 subunit) (Valosin-containing protein) (VCP) ]
2802 994.4 271.7 0.27 2657 89321.80 5.14
Plastin-2 (L-plastin) (Lymphocyte cytosolic protein 1) (LCP-1) (LC64P)
3702 482.3 1065.6 2.21 4924 70288.39 5.29
Heat shock cognate 71 kDa protein (Heat shock 70 kDa protein 8)
3802 6507.8 5.6 0.001 10972 70898.09 5.37
D-3-phosphoglycerate dehydrogenase (EC 1.1.1.95) (3-PGDH)
6604 1067.9 526.0 0.49 4131 56650.5 6.29
Fructose-bisphosphate aldolase A (EC 4.1.2.13) (Muscle-type aldolase) (Lung cancer antigen NY-LU-1]
8303 2105.1 999.3 0.47 1143 39420.02 8.30
Protein expression profile of non-treated (A) and Dau=Aoa-LTVSPWY-NH2 conjugate-treated HL-60 cells (B)

Protein expression profile of Dau-treated (A) and Dau=Aoa-LTVSPWY-NH2 conjugate-treated HL-60 cells (B)
Identified proteins Average protein expression level in
Proliferating cell nuclear antigen (PCNA) (Cyclin 171.5 2165.8
14-3-3 protein gamma (Protein kinase C inhibitor protein 1) (KCIP-1) 157.7 1814.0
Tubulin beta chain (Tubulin beta-5 chain 9713.9 1981.3
Arrows and spot numbers show the significantly different spots on the gel where expression level was higher.
t = 24 hr
A = Dau, c = 0.024 µM B = Dau=Aoa-LTVSPWY-NH2 conjugate c = 9 µM
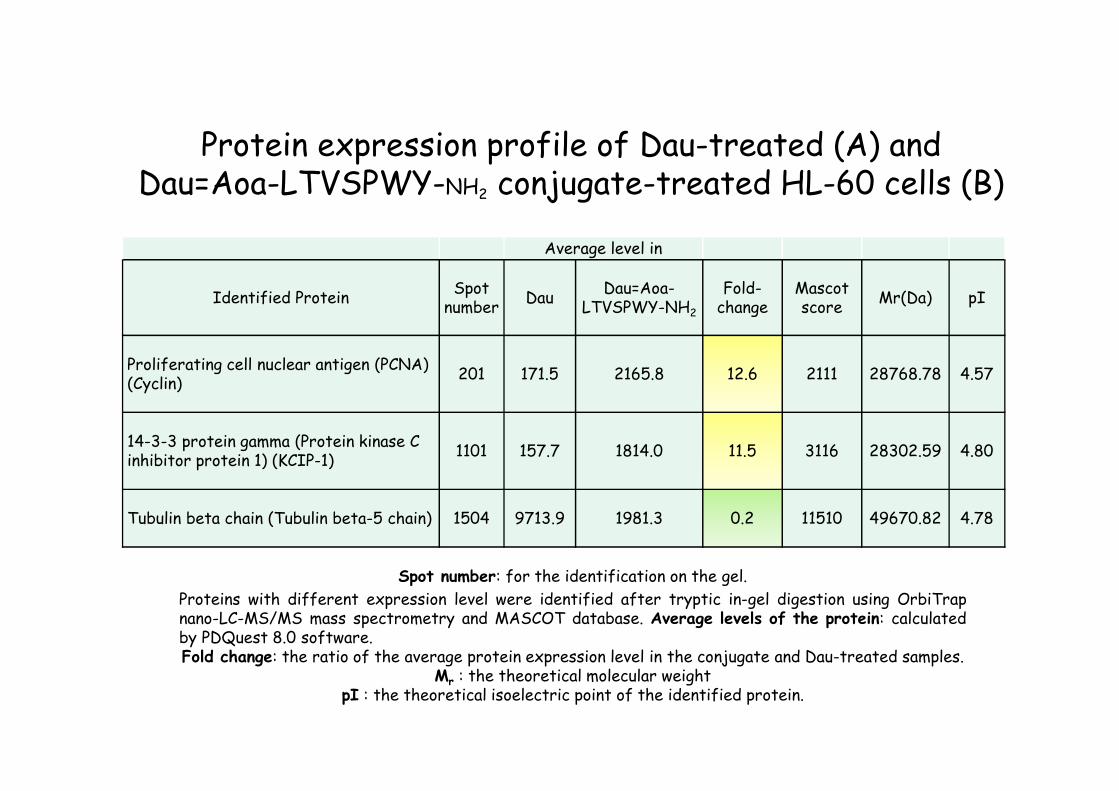
Average level in
Identified ProteinSpot
numberDau
Dau=Aoa-LTVSPWY-NH2
Fold-change
Mascotscore
Mr(Da) pI
Proliferating cell nuclear antigen (PCNA) (Cyclin)
201 171.5 2165.8 12.6 2111 28768.78 4.57
14-3-3 protein gamma (Protein kinase C inhibitor protein 1) (KCIP-1)
1101 157.7 1814.0 11.5 3116 28302.59 4.80
Tubulin beta chain (Tubulin beta-5 chain) 1504 9713.9 1981.3 0.2 11510 49670.82 4.78
Protein expression profile of Dau-treated (A) and Dau=Aoa-LTVSPWY-NH2 conjugate-treated HL-60 cells (B)
Spot number: for the identification on the gel.
Proteins with different expression level were identified after tryptic in-gel digestion using OrbiTrapnano-LC-MS/MS mass spectrometry and MASCOT database. Average levels of the protein: calculatedby PDQuest 8.0 software.Fold change: the ratio of the average protein expression level in the conjugate and Dau-treated samples.
Mr : the theoretical molecular weightpI : the theoretical isoelectric point of the identified protein.
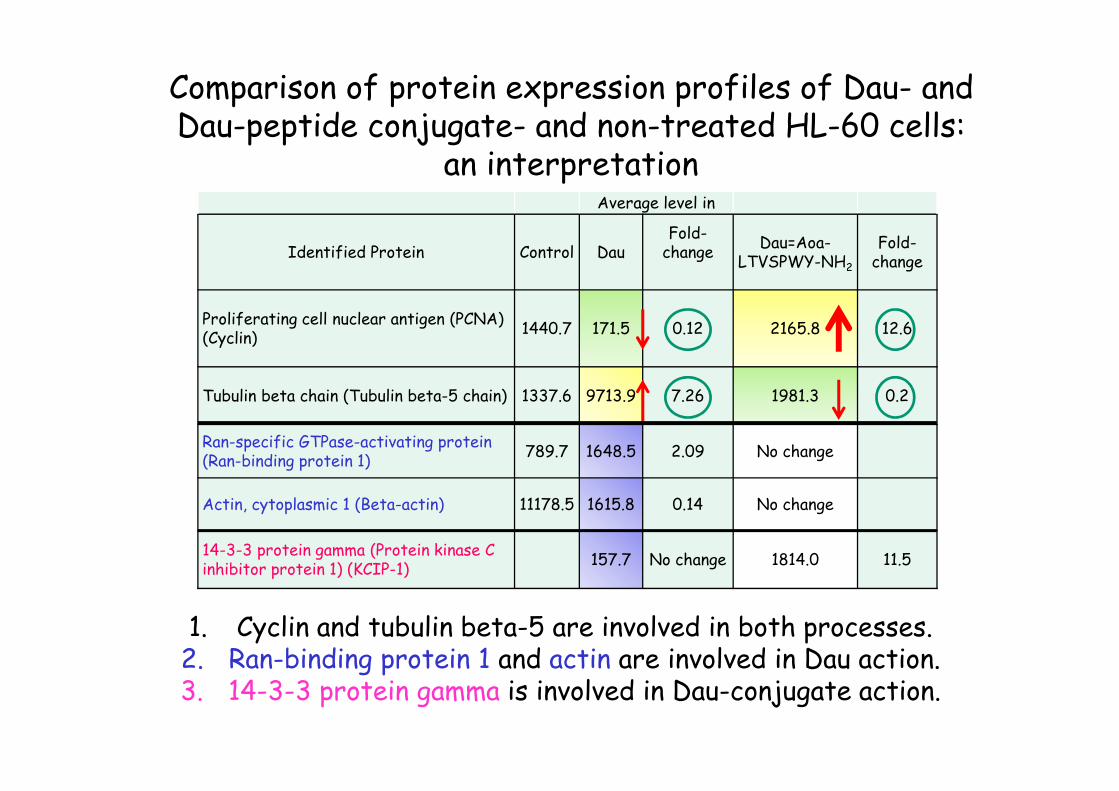
Average level in
Identified Protein Control DauFold-change
Dau=Aoa-LTVSPWY-NH2
Fold-change
Proliferating cell nuclear antigen (PCNA) (Cyclin)
1440.7 171.5 0.12 2165.8 12.6
Tubulin beta chain (Tubulin beta-5 chain) 1337.6 9713.9 7.26 1981.3 0.2
Ran-specific GTPase-activating protein (Ran-binding protein 1)
789.7 1648.5 2.09 No change
Actin, cytoplasmic 1 (Beta-actin) 11178.5 1615.8 0.14 No change
14-3-3 protein gamma (Protein kinase C inhibitor protein 1) (KCIP-1)
157.7 No change 1814.0 11.5
1. Cyclin and tubulin beta-5 are involved in both processes.2. Ran-binding protein 1 and actin are involved in Dau action.3. 14-3-3 protein gamma is involved in Dau-conjugate action.
Comparison of protein expression profiles of Dau- and Dau-peptide conjugate- and non-treated HL-60 cells:
an interpretation

The expression level of several proteins altered due to the treatment with the free drug (Dau) or its conjugate in comparison with proteins
from untreated cells.
After treatment with Dau for 24 h, the expression levels of cytoskeletal as well as cell-cycle regulatory proteins (four) have been changed.
Three proteins were identified, whose expression was lower (tubulin beta chain) or markedly higher (proliferating cell nuclear antigen and protein kinase C inhibitor protein 1) after administration of HL-60 cells with Dau-peptide conjugate vs free drug. These proteins are cytoskeletal proteins
or involved in signalisation or metabolism.
Conclusions