prototype repository – validation of retrieved sensors ... · this report concerns a study which...
TRANSCRIPT

Svensk Kärnbränslehantering ABSwedish Nuclear Fueland Waste Management Co
Box 250, SE-101 24 Stockholm Phone +46 8 459 84 00
P-13-31
Prototype RepositoryValidation of retrieved sensors from the Prototype experiment at Äspö Hard Rock Laboratory
Ulf Nilsson, Clay Technology AB
August 2014

Tänd ett lager: P, R eller TR.
Prototype RepositoryValidation of retrieved sensors from the Prototype experiment at Äspö Hard Rock Laboratory
Ulf Nilsson, Clay Technology AB
August 2014
ISSN 1651-4416
SKB P-13-31
ID 1398761
Keywords: Validation of sensors, Prototype repository, Pore pressure, Total pressure, Humidity.
This report concerns a study which was conducted for SKB. The conclusions and viewpoints presented in the report are those of the author. SKB may draw modified conclusions, based on additional literature sources and/or expert opinions.
Data in SKB’s database can be changed for different reasons. Minor changes in SKB’s database will not necessarily result in a revised report. Data revisions may also be presented as supplements, available at www.skb.se.
A pdf version of this document can be downloaded from www.skb.se.

SKB P-13-31 3
Abstract
This report describes the validation of sensors which were retrieved from the Prototype Repository section 2.
Of the sensors that were still working at the retrieval, the majority gave correct values when they were tested. The signal evaluation of the raw signal was however not correct in some cases. The rest of the sensors were not responding or were damaged beyond working.
45 pore pressure sensors were installed whereof 27 were installed in the buffer and 18 in the backfill. They measured the water pressure in the system. 68 pressure sensors, 53 in the buffer and 15 in the backfill were also installed for measuring the total pressure in the buffer and the backfill. The satura-tion of the buffer was monitored by means of humidity sensors. 68 humidity sensors of two makes and 34 soil psychrometers were installed in the buffer, and 32 psychrometers were installed in the backfill. 80 thermocouples measured the temperature in the buffer and backfill. In pressure sensors, soil psychrometers and humidity sensors temperature readings were also obtained. Furthermore a fiber optic temperature reading system was installed on the surfaces of the two canisters.
At the dismantling of the experiment the priority was to, as efficient as possible remove the buffer and backfill and to get samples from the buffer and the backfill for further investigations in the laboratory. The retrieval of sensors had a lower priority and therefore only a limited number of sensors were retrieved.
The experiences from the dismantling of both the Canister Retrieval Test and the Temperature Buffer Test experiment of retrieving of humidity sensors and soil psychrometers show that most of them were drenched in saline water during the test and thus were not possible to validate after the test. It was found out that for the Prototype Repository this was also the case. None of the retrieved relative humidity sensors could be tested afterwards.
Also thermocouples were discarded on site since they had to be cut in order to be able to continue the work with the dismantling of the test.
32 of the retrieved sensors could be validated. The majority of these sensors gave a correct reading. For a group of pressure sensors an equation used gave erroneous results for the used pressure range. These were recalculated. The sensors that could not be validated had mechanical damages.

Sammanfattning
Denna rapport beskriver den validering som gjorts för de givare som plockats ut från Prototypförvaret sektion 2.
45 portrycksgivare var installerade varav 27 i bufferten och 18 i tunnel återfyllningen. Dessa mätte endast vattentrycket. 68 tryckgivare, varav 53 i bufferten och 15 i återfyllningen var också installerade för att mäta totaltrycket. Buffertens mättnad bestämdes genom att mäta relativa fuktigheten(RH). 68 RH-givare av två olika fabrikat och 34 psykrometerar var installerade i buffereten. Ytterligare 32 psykrometrar installerades i återfyllningen. 80 termoelement mätte temperaturen i bufferten och återfyllningen. Förutom dessa gav flertalet tryckgivare och fuktighetsmätare också temperaturdata. Det fanns även ett fiberoptiskt mätsystem installerat på kapslarnas yta för att mäta temperaturen.
Vid brytningen av försöket var första prioritet att så effektivt som möjligt avlägsna återfyllningen och bufferten, samt ta prov på dessa för senare analyser i laboratorier. Tillvaratagande av givare var av lägre prioritet, på grund av detta är antalet tillvaratagna givare begränsat.
Erfarenheten från demonterningen givare vid både Återtags- och TBT- försöken har visat att både RH-givare och psykrometrar vanligen dränks i saltvatten under försökens gång och dessa är inte möjliga att kontrollera efteråt. Det visade sig stämma även för detta försök. Inga fuktighetsmätare kunde kontrolleras.
Även termoelementen skrotades på plats då dessa fick kapas för att kunna utföra brytningen av försöket.
32 av de tillvaratagna givarna kunde valideras. Majoriteten av dessa givare gav korrekta värden. För en grupp tryckgivare användes i utvärderingen en ekvation som ledde till felaktiga resultat i det använda mätområdet. Värdena kunde räknas om till korrekta mätvärden. De givare som inte kunde valideras hade huvudsakligen mekaniska skador.

SKB P-13-31 5
Contents
1 Introduction 7
2 First sorting of the sensors to be validated 92.1 Pressure sensors Geokon, Pore pressure 92.2 Pressure sensors Geokon, Total pressure, Buffer 92.3 Pressure sensors Kulite, Total pressure, Buffer 92.4 Pressure sensors Geokon, Total pressure, Backfill 92.5 Relative humidity sensors 92.6 Thermocouples 102.7 Soil psychrometers 102.8 Optical thermal measurements 102.9 GRS geoelectric sensors 10
3 Testing methodology 113.1 Pressure sensors 113.2 Other sensors 13
4 Results 154.1 Geokon pore pressure, Buffer and Backfill 154.2 Geokon total pressure, Buffer 164.3 Geokon total pressure, Backfill 164.4 Difference between linear and polynomial equation for Geokon total pressure
sensors 174.5 Kulite sensors 19
5 Example of damages on the retrieved sensors 215.1 Geokon total pressure sensors 215.2 Kulite total pressure sensors 21
6 Data from the validation of the Geocon sensors 276.1 Geokon pore pressure, Buffer 276.2 Geokon pore pressure, Backfill 286.3 Geokon total pressure, Buffer 306.4 Geokon total pressure, Backfill 30
7 Conclusions and comments 357.1 Cause of damages 357.2 Representative results 357.3 Lifetime of sensors 357.4 Lessons learned 36
References 37

SKB P-13-31 7
1 Introduction
The Prototype experiment at Äspö Hard Rock Laboratory is a full scale test. It consists of two sections, an inner (Section 1) with 4 deposition holes and a backfilled tunnel and an outer section (Section 2) with 2 deposition holes. A concrete plug is separating Section 1 and 2. The outer section was installed in 2003 and excavated during 2011. See Figure 1-1.
Since this is the first full scale experiment with both deposition holes and backfilled tunnel and with long cable leads troughs in the rock that has been dismantled the performance of the sensors was of great interest, both for verifying the obtained data and as feedback for new installations. The feedback includes, but not limited to, performance, suitability, selection criteria and installation details. Detailed information on the position and fabricate can be obtained from either Installation report (Johannesson et al. 2004) or Sensors data report (Goudarzi 2014).
45 pore pressure sensors were installed in the outer section whereof 27 in the buffer and 18 in the backfill. Two types of sensors with different measuring principle were used, vibrating wire (Geokon) and Wheatstone bridge (Kulite). They measured the water pressure in a chamber in contact with the bentonite via a filter.
68 total pressure sensors, 53 in the buffer and 15 in the backfill were installed. Again sensors from both Geokon (vibrating wire) and Kulite (Wheatstone bridge) were installed. They measured the total pressure in the buffer and the backfill.
The saturation of the buffer and the backfill could be monitored by means of humidity sensors. Sensors from Vaisala and Rotronic, both capacitive sensor but with different technologies were used. Suction was measured with 66 Wescor soil psychrometers, 35 of them were installed the buffer and the rest in the backfill.
80 thermocouples measured the temperature in the buffer and backfill. In the pressure, suction and humidity sensors a temperature reading was also obtained. A fiber optic temperature reading system was also installed for measuring the surface temperature on the canisters. In the backfill a Geoelectric monitoring grid was installed, it was run by Gesellschaft für Anlagen- und Reaktorsicherheit (GRS) and is not reported here.
All sensors were either made in titanium with a tube connection or encapsulated in titanium housing with a tube connection. The wires were run in titanium tubes in the buffer and in polyamide tubes in the backfill. These were lead through the rock to an adjacent tunnel were the logging equipment was installed. The connection was made with steel flanges and individual sealing for each tube.
Figure 1‑1. Prototype repository.

8 SKB P-13-31
The sensors in the Prototype Repository have been subjected to increased temperatures and pressure in addition to saline water. Movements in the buffer during the test may also have affected the sen-sors. The way of removing the buffer and backfill, when the test parcels were dismantled, affected also the sensors i.e. damages on the sensors occurred at the dismantling. A number of sensors were in such condition that they could not be tested. The sensors which could be tested were placed in the buffer and the majority of the Geokon pore pressure sensors had small errors.
When the reading of the Geokon total pressure sensors was evaluated using the linear equation a large error was discovered but not when a polynomial equation was used.
The first sorting of sensors is described in Chapter 2. The methodologies of these tests are presented in Chapter 3. The testing results are presented in Chapter 4. Examples of damaged sensors are illustrated in Chapter 5. In Chapter 6 the complete validation results for the Geokon sensors are presented, including the linear regression analyses. Conclusions and comments are made in Chapter 7.
The sensors are identified by their serial number. A name adapted to the type and position was also assigned to all sensors with the following key. Position 1: P stands for Total pressure, U Pore pressure, W humidity, T temperature. Position 2 & 3: B for buffer and FA backfill. First numeral for buffer sensors describes which hole it was installed in (5–6). Numeral 2 & 3 is an order number for that type of sensor. For backfill sensors the numerals are an order nr. E.g. PFA10 is a Total Pressure sensor in the Backfill and is the tenth sensor of those, while TB610 is a temperature sensor in the buffer in hole 6. Details in Data report (Goudarzi 2014) or Installation report (Johannesson et al. 2004).

SKB P-13-31 9
2 First sorting of the sensors to be validated
When the sensors arrived to the laboratory, a quick sorting was made where several sensors could be directly excluded based on the state of them. Due to the obvious damage such as missing cables or parts which made validation impossible. There is also a requirement that the parts of a pressure sensor used for sealing towards the test cell should be without severe damages. Water pressure could otherwise not be obtained in the vessel due to leakage. Some observed damages are likely to have occurred during dismantling of the test while others occurred during the running or at the installation of the tests.
2.1 Pressure sensors Geokon, Pore pressureAll of the 17 received sensors were initially deemed testable.
2.2 Pressure sensors Geokon, Total pressure, BufferOf 19 received sensors, 10 were initially deemed testable, i.e. no superficially damages were observed. 9 were either missing the cable or had damage on the tube close to the sensor housing.
2.3 Pressure sensors Kulite, Total pressure, BufferOut of 7 received sensors, 2 were initially deemed testable. Broken connection to the sensor was the main reason for faults for the case when the sensor was installed as delivered. Some sensors were cast in an epoxy resin for protecting the coupling between the sensor body and the tube. This protec-tion worked for the recovered sensors but in most cases the cable was missing or connection lost.
2.4 Pressure sensors Geokon, Total pressure, BackfillOut of 7 received sensors 6 were initially deemed testable, i.e. no superficially damages were observed on the sensors.
2.5 Relative humidity sensorsNone of the retrieved sensors could be tested since either the sensors or the boxes with electronics had been drenched during the test.
Table 2‑1. Summary of the number of different sensors described.
Sensor type Installed Working at end Received Initially Testable
Geokon 4800 Total Pressure Buffer 31 24 19 10Geokon 4500 Pore Pressure 28 17 17 17Geokon 4850 Total Pressure Backfill 8 8 7 6Kulite 49 12 7 2Rh, Rotronic, Vaisala, Wescor 147 45 7 0Other 8 4 0 0

10 SKB P-13-31
2.6 ThermocouplesNone of the installed thermocouples was recovered. In most cases they were cut during dismantling in order to be able to work in the deposition holes. Since readings from a thermocouple are the result of voltage from the hot junction between two metals they don’t experience drift or other degradation (degradation due to high temperatures is not probable in this application). When they work they are giving reliable values, errors are primarily break or short circuit resulting in unrealistic values.
2.7 Soil psychrometersNone of this type of sensors was recovered.
2.8 Optical thermal measurementsThe optical fiber system for measuring the temperature on the canister surfaces stopped working approximately 3 years after the start of the test. Water seeping in from the fiber to the readout box indicates fractures on the fiber, probably due to movements of the canister and/or the buffer at the running of the test.
This system was not tested.
2.9 GRS geoelectric sensorsGesellschaft für Anlagen- und Reaktorsicherheit (GRS) mbH have a geoelectric measurement system in the prototype repository experiment. They have evaluated a system installed in the excavated part. Their findings are that the measurements taken are in line with other measurements and the erroneous electrodes in the buffer were due to the heave of the buffer resulting in loss of contact with the elec-trodes when the cables were stretched. This was made by GRS and is reported separately (Wieczorek K 2013, personal communication).

SKB P-13-31 11
3 Testing methodology
3.1 Pressure sensorsGeokonTotal pressure cells (type: 4800-1X) were immersed in a pressure vessel and the tube with the wire was led through the lid, see Figure 3-1. A Swagelok 8 mm coupling was used to seal the tube and this is the reason why sensors with short or damaged tubes could not be tested. The maximum pressure the vessel could take was 4.5 MPa. This pressure is above the maximum reading for all but three sensors, which had a maximum pressure of about 6 MPa during the test.
The sensors were connected to a handheld Geokon GK-404 readout box. The pressure was delivered from a GDS instruments Volume Pressure Controller. The pressure controller was validated against a manometer calibrated at SP Technical Research Institute of Sweden. Complementing testing where a mechanical force was applied on the total pressure cells was also made. These tests were made in a hydraulic press with rubber pads for transferring the load to the cell, see Figure 3-2.
Total pressure cells (type: 4850) were placed in a hydraulic press with heavy rubber padding for distributing the load from the load frame to the sensors, see Figure 3-3. Steel plates were used to distribute the pressure over the rubber pad. Since this test setup is not ideal, it can be seen more as an indicative test of the sensor function.
A number of different tests with rubber and wood padding were made to investigate the method. The repeatability within the same set up was good but different set up gave different results. This means that the results can only be used to test the sensors function and if the signal is linear to the load but not as absolute values.
Figure 3‑1. Test cell with a total pressure sensor before immersion into water.

12 SKB P-13-31
Figure 3‑2. Total pressure sensor tested with mechanical force and a rubber pad.
Figure 3‑3. Total pressure cell under testing, the cell was installed in the backfill.

SKB P-13-31 13
Pore pressure cells (Type: 4500 TiX) were tested in a similar fashion but with another pressure vessel where the sensor tip was led through the lid implying that only the active parts were immersed into the vessel, see Figure 3-4. The front part of the housing with the filter was thus excluded.
KuliteThe sensors were tested in the same way as the Geokon sensors (total immersion). The reading of the current signal was made with a DMM (Digital MultiMeter). The power supply and resistive load were the same as in the original manufactory test (supply 28 V and a load of 250 Ω).
3.2 Other sensorsSince no other type of sensors were retrieved, other tests were not relevant.
Figure 3‑4. The lid of the test cell with a pore pressure sensor installed.
SKB P-13-31 15
4 Results
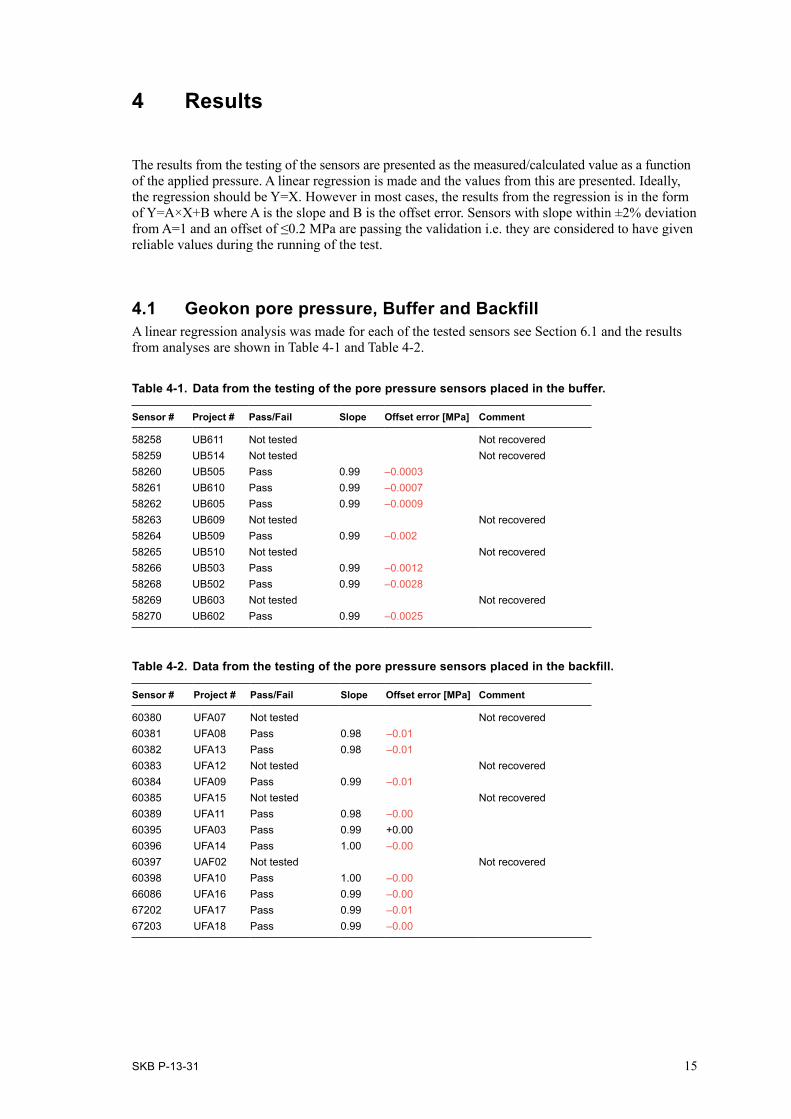
The results from the testing of the sensors are presented as the measured/calculated value as a function of the applied pressure. A linear regression is made and the values from this are presented. Ideally, the regression should be Y=X. However in most cases, the results from the regression is in the form of Y=A×X+B where A is the slope and B is the offset error. Sensors with slope within ±2% deviation from A=1 and an offset of ≤0.2 MPa are passing the validation i.e. they are considered to have given reliable values during the running of the test.
4.1 Geokon pore pressure, Buffer and BackfillA linear regression analysis was made for each of the tested sensors see Section 6.1 and the results from analyses are shown in Table 4-1 and Table 4-2.
Table 4‑1. Data from the testing of the pore pressure sensors placed in the buffer.
Sensor # Project # Pass/Fail Slope Offset error [MPa] Comment
58258 UB611 Not tested Not recovered58259 UB514 Not tested Not recovered58260 UB505 Pass 0.99 –0.000358261 UB610 Pass 0.99 –0.000758262 UB605 Pass 0.99 –0.000958263 UB609 Not tested Not recovered58264 UB509 Pass 0.99 –0.00258265 UB510 Not tested Not recovered58266 UB503 Pass 0.99 –0.001258268 UB502 Pass 0.99 –0.002858269 UB603 Not tested Not recovered58270 UB602 Pass 0.99 –0.0025
Table 4‑2. Data from the testing of the pore pressure sensors placed in the backfill.
Sensor # Project # Pass/Fail Slope Offset error [MPa] Comment
60380 UFA07 Not tested Not recovered60381 UFA08 Pass 0.98 –0.0160382 UFA13 Pass 0.98 –0.0160383 UFA12 Not tested Not recovered60384 UFA09 Pass 0.99 –0.0160385 UFA15 Not tested Not recovered60389 UFA11 Pass 0.98 –0.0060395 UFA03 Pass 0.99 +0.0060396 UFA14 Pass 1.00 –0.0060397 UAF02 Not tested Not recovered60398 UFA10 Pass 1.00 –0.0066086 UFA16 Pass 0.99 –0.0067202 UFA17 Pass 0.99 –0.0167203 UFA18 Pass 0.99 –0.00

16 SKB P-13-31
4.2 Geokon total pressure, BufferAt the validation of these sensors linear regressions was used. In analyses both linear errors and offset errors were observed. For the total pressure sensors in the buffer the simple linear equation resulted in large errors. At the analysis of the raw data from the calibration protocol, the conclusion was then that for these sensors the polynomial equation was much better compared to the linear equation. For these sensors an error of 30% was found for readings in the lower span when using the linear equation compared to less than 1% when using the polynomial equation, see Table 4-3. Therefore the recommendation is to recalculate the values using the polynomial equation.
4.3 Geokon total pressure, BackfillAs described in Section 2.4 the backfill total pressure cell were tested in a press with a load distributing rubber padding. The results from the analyses are presented in Table 4-4. This test method is not ideal. The test cannot be used as a validation but merely as a test of the function of the sensor. The result shows that the sensors have a small offset and the linearity is good (the results follow a straight line).
Table 4‑3. Data from the testing of the pore pressure sensors placed in the buffer.
Sensor # Project # Pass/Fail Slope Offset error [MPa] Comment
59076 PB513 Not tested Not recovered59077 PB623 Not tested Not recovered59078 PB511 Not tested Not recovered59081 PB514 Not tested Not recovered62274 PB627 Not tested Wire missing62276 PB525 Not tested Tube damaged close to housing62277 PB522 Not tested Tube damaged close to housing62278 PB626 Pass with Poly 1.00 –0.1262279 PB524 Not tested No signal62280 PB517 Pass with Poly 1.01 +0.0262281 PB527 Not tested Tube damaged close to housing62282 PB523 Pass with Poly 1.00 +–0.1562283 PB526 Pass with Poly 1.01 –0.0862284 PB521 Not tested Wire missing62285 PB625 Not tested No signal62286 PB620 Pass with Poly 1.01 –0.1762287 PB616 Not tested Not recovered62288 PB621 Pass with Poly 0.98 –0.1562289 PB508 Pass with Poly 0.98 –0.1862290 PB501 Not tested Not recovered62291 PB502 Fail 0.96 –0.1862292 PB606 Not tested Tube damaged close to housing62293 PB613 Not tested Tube damaged close to housing62294 PB614 Not tested Tube damaged close to housing62295 PB607 Not tested Wire missing70062 PB601 Not tested Not recovered
Table 4‑4. Data from the testing of the total pressure sensors placed in the backfill.
Sensor # Project # Pass/Fail Slope Offset error [MPa] Comment
60399 PFA08 0.85 –0.1060400 PFA02 0.91 –0.1760403 PFA14 0.88 –0.1560405 PFA15 0.81 –0.1060412 PFA13 0.91 +0.0266730 PFA03 Not recovered66731 PFA04 0.82 +0.03

SKB P-13-31 17
4.4 Difference between linear and polynomial equation for Geokon total pressure sensors
The signal from the total pressure sensors is given as a frequency and the pressure is calculated with the use of a calibration equation. In the unique calibration report for each sensor two equations are given, a linear and a polynomial equation. At the validation of the sensors the linear equation was used, as in the test, to calculate the pressure, see Figure 4-1. In this figure we see the applied standard pressure on the x-axis and the calculated pressure from the sensor using the linear equation on the y-axis. The results show a strong disagreement of pressures below 5 MPa (more than 30%). A number of additional tests were therefore made to eliminate possible handling errors. New sensors were tested and dual pressure transmitters were used. Tests were also made in a climate chamber with elevated temperatures and thus the given temperature correction was used. All these tests gave similar results.
When a further examination showed that the raw frequency signal was almost the same as in the calibration report even when the calculated pressure value was far off, a check of the factory given equations was made. In Figure 4-2 the raw frequency signal is plotted against the applied standard pressure, both validation results (blue diamonds) and the factory data (red boxes) are plotted. Here can be seen that the frequency signals from the factory data and the validation are almost identical, (at zero and 3 MPa pressure). The line is the linear regression that is used to determine the factors in the linear equation.
Comparisons between the results from the different equations were therefore made. This is plotted in Figure 4-3 were the results from both the linear equation (blue diamonds) and the polynomial equation (red boxes) are presented. When using the polynomial equation on the same raw data we get a much better result, see Figure 4-3. The sensor deviates only 1% from the ideal line y=x. The polynomial equation is therefore better to use when evaluating the data.
A calculation of the error for the different equations can be made. Error is defined here as the differ-ence between read value and applied value divided by applied value. The calculated errors are large in the lower pressure range when using the linear equation and smaller when using the polynomial equation in the whole range, see Figure 4-4.
Figure 4‑1. Linear equation applied to values from sensor 62283.
y = 1.3479x + 0.048
R² = 0.9995
0
1
2
3
4
5
6
0 1 2 3 4 5
Cal
cula
ted
pres
sure
[MPa
]
Applied Standard Pressure [MPa]

18 SKB P-13-31
Figure 4‑2. Raw signal plotted against applied pressure. Blue diamond validation values, red box factory values from calibration report. The line is linear regression of the factory values.
Figure 4‑3. Relation between calculated pressure and applied pressure using linear equation (blue diamonds) and polynomial equation (red boxes). The lines are linear regression.
3,000
4,000
5,000
6,000
7,000
8,000
9,000
10,000
0 5 10 15 20
Rea
dout
[Hz]
Standard Pressure [MPa]
y = 1.3479x + 0.048R² = 0.9995
0
1
2
3
4
5
6
0 1 2 3 4 5
Cal
cula
ted
pres
sure
[MPa
]
Applied Standard Pressure [MPa]
y = 1.0104x–0.0819 R² = 0.9958

SKB P-13-31 19
By using the raw data from this sensor (PB523 #62282) and applying both equations the pressure has been recalculated, see Figure 4-5. Since the values are in the low range for the senor the difference between the two calculations is quite large. A check of the calibration data for the rest of the sensors shows that the difference between linear and polynomial equation is large for only this model variant of the sensor (special design for SKB). Later installations of the same type sensors used in other experiment have not shown this difference.
The conclusion/recommendation is to recalculate all the values from these total pressure sensors.
4.5 Kulite sensorsBoth Kulite sensors that were initially deemed testable i.e. intact were unresponsive when connected to a readout and was therefore untestable.
Figure 4‑4. Error plotted as a function of the pressure, blue diamonds linear eqn. and factory data, red boxes polynomial eqn. and factory data, green triangles linear eqn. and validation data, orange circles polynomial eqn. and validation data.
–20
–10
0
10
20
30
40
50
0 5 10 15
Erro
r [%
]
Applied Pressure [MPa]

20 SKB P-13-31
Figure 4‑5. Pressure calculated with both linear and polynomial equations. Example from a total pressure sensor in the buffer in hole 1 (Sensor PBU10002).
0
1
2
3
4
5
6
7
0 500 1,000 1,500 2,000
Pres
sure
[MPa
]
Days
Linear
Polynomial
SKB P-13-31 21
5 Example of damages on the retrieved sensors
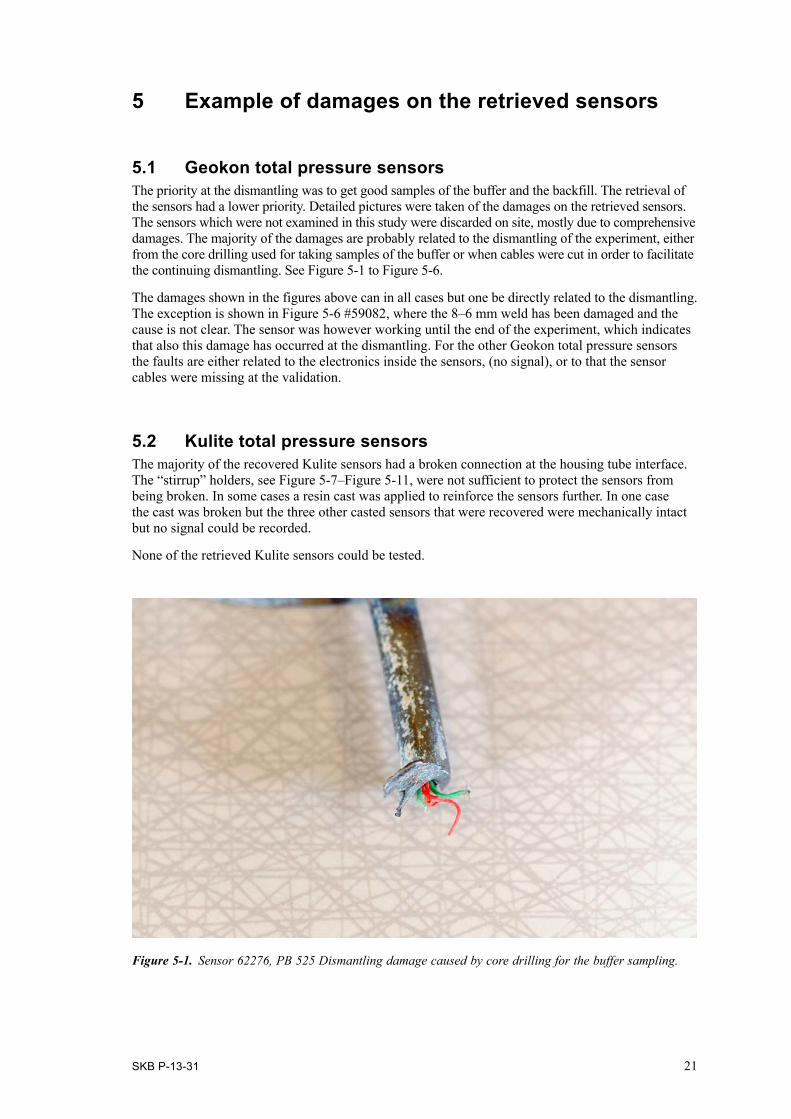
5.1 Geokon total pressure sensorsThe priority at the dismantling was to get good samples of the buffer and the backfill. The retrieval of the sensors had a lower priority. Detailed pictures were taken of the damages on the retrieved sensors. The sensors which were not examined in this study were discarded on site, mostly due to comprehensive damages. The majority of the damages are probably related to the dismantling of the experiment, either from the core drilling used for taking samples of the buffer or when cables were cut in order to facilitate the continuing dismantling. See Figure 5-1 to Figure 5-6.
The damages shown in the figures above can in all cases but one be directly related to the dismantling. The exception is shown in Figure 5-6 #59082, where the 8–6 mm weld has been damaged and the cause is not clear. The sensor was however working until the end of the experiment, which indicates that also this damage has occurred at the dismantling. For the other Geokon total pressure sensors the faults are either related to the electronics inside the sensors, (no signal), or to that the sensor cables were missing at the validation.
5.2 Kulite total pressure sensorsThe majority of the recovered Kulite sensors had a broken connection at the housing tube interface. The “stirrup” holders, see Figure 5-7–Figure 5-11, were not sufficient to protect the sensors from being broken. In some cases a resin cast was applied to reinforce the sensors further. In one case the cast was broken but the three other casted sensors that were recovered were mechanically intact but no signal could be recorded.
None of the retrieved Kulite sensors could be tested.
Figure 5‑1. Sensor 62276, PB 525 Dismantling damage caused by core drilling for the buffer sampling.

22 SKB P-13-31
Figure 5‑2. Sensor 62281, PB 527 Dismantling damage caused by core drilling for the buffer sampling.
Figure 5‑3. Sensor 62292, PB 606 Dismantling damage caused by core drilling for the buffer sampling.

SKB P-13-31 23
Figure 5‑4. Sensor 62293, PB 613 Dismantling damage caused by core drilling for the buffer sampling.
Figure 5‑5. Sensor 62294, PB 614 Dismantling damage caused by core drilling for the buffer sampling.

24 SKB P-13-31
Figure 5‑6. Sensor 59082, PB515 Damage on the 8–6 mm connection where the 6 mm tube has been drawn out, unknown how or when. The missing 6 mm tube was inserted into the 8 mm tube on the sensor and the tubes was welded at the 8 mm tube end.
Figure 5‑7. Sensor 6655-6-48 Kulite; broken connection at housing.

SKB P-13-31 25
Figure 5‑8. Sensor 6605-6-33 Kulite; broken connection at housing.
Figure 5‑9. Sensor 66609-6-42 Kulite; damage caused by core drilling for the buffer sampling.

26 SKB P-13-31
Figure 5‑10. Sensor 6605-6-31 Kulite; broken connection at housing, probable resin cast in Figure 5-11.
Figure 5‑11. Cast resin for Kulite sensor; broken. No dirt or colloids in the fracture indicating no long exposure in the buffer after the fracture until dismantling.

SKB P-13-31 27
6 Data from the validation of the Geocon sensors
In this chapter the data from the validation of the tested sensors are presented. The results are given in diagrams and in Tables. For all presented diagrams the x-axis represents the standard pressure in MPa, applied on the sensors by the GDS devices and the y-axis represents the readings of the sensors. A linear regression is calculated. Sensors with slope within ±2% and an offset ≤0.2 MPa are considered to pass. In the table below the values for each sensor are given. The maximum pressure during operation is also noted.
6.1 Geokon pore pressure, BufferThe results from the validation of sensors for measuring the pore pressure in the buffer and with the technique of vibrating wire measurement are shown in Figure 6-1 and Table 6-1. All validated sensors showed good linearity (small deviation from the straight line), slopes near 1 and small offset errors.
Figure 6‑1. Geokon Pore pressure sensors, readings vs applied pressure in MPa.
#58260, UB 505 #58261, UB 610
#58264, UB 509 #58266, UB503
y = 0.9876x–0.0003 R² = 1
0
1
2
3
0 1 2 3
y = 0.99x–0.0007 R² = 1
0
1
2
3
0 1 2 3
y = 0.9851x–0.0021 R² = 1
0
1
2
3
0 1 2 3
y = 0.9886x–0.0012 R² = 1
0
1
2
3
0 1 2 3
#58268, UB 502 #58270, UB 602
y = 0.9862x–0.0028 R² = 1
0
1
2
3
0 1 2 3
y = 0.9886x–0.0025 R² = 1
0
1
2
3
0 1 2 3

28 SKB P-13-31
Table 6‑2. Geokon pore pressure sensors (backfill).
Sensor # Project # Pass/Fail Slope Offset error [MPa] Max reading
60381 UFA08 Pass 0.98 –0.01 <1.6 MPa60382 UFA13 Pass 0.98 –0.01 <1.8 MPa60384 UFA09 Pass 0.99 –0.01 <1.2 MPa60389 UFA11 Pass 0.98 –0.00 <1.0 MPa60395 UFA03 Pass 0.99 +0.00 <1.6 MPa60396 UFA14 Pass 1.00 –0.00 <1.8 MPa60398 UFA10 Pass 1.00 –0.00 <1.6 MPa66086 UFA16 Pass 0.99 –0.00 <1.8 MPa67202 UFA17 Pass 0.99 –0.01 <1.6 MPa67203 UFA18 Pass 0.99 –0.00 <1.6 MPa
Table 6‑1. Geokon pore pressure sensors (buffer).
Sensor # Project # Pass/Fail Slope Offset error [MPa] Max reading
58260 UB505 Pass 0.99 –0.0003 <0.1 MPa58261 UB610 Pass 0.99 –0.0007 <1.2 MPa58262 UB605 Pass 0.99 –0.0009 <0.8 MPa58264 UB509 Pass 0.99 –0.002 <0.1 MPa58266 UB503 Pass 0.99 –0.0012 <0.1 MPa58268 UB502 Pass 0.99 –0.0028 <0.1 MPa58270 UB602 Pass 0.99 –0.0025 <0.2 MPa
6.2 Geokon pore pressure, BackfillThe results from the validation of sensors for measuring the pore water pressure in the backfill with the technique of vibrating wire measurement principle are shown in Figure 6-2 and Table 6-2. All validated sensors showed good linearity (small deviation from the straight line), slopes near 1 and small offset errors.

SKB P-13-31 29
Figure 6‑2. Geokon Pore pressure sensors, readings vs applied pressure in MPa.
#60381, UFA 08 #60382, UFA 13
y = 0.9827x–0,0052 R² = 1
0
1
2
3
0 1 2 3
y = 0.981x–0.0043 R² = 1
0
1
2
3
0 1 2 3
#60384, UFA 09 #60389, UFA 11
#60395, UFA 03 #60396, UFA 14
#60398, UFA 10 #66086, UFA 16
#67202, UFA 17 #67203, UFA 18
y = 0.9858x–0.0059 R² = 1
0
1
2
3
0 1 2 3
y = 0.981x–0.0035 R² = 1
0
1
2
3
0 1 2 3
y = 0,9948x + 0.0041R² = 1
0
1
2
3
0 1 2 3
y = 1.0044x–0.0024R² = 1
0
1
2
3
0 1 2 3
y = 0.9956x–0.0032 R² = 1
0
1
2
3
0 1 2 3
y = 0.985x–0.0037 R² = 1
0
1
2
3
0 1 2 3
y = 0.9941x–0.0062 R² = 1
0
1
2
3
0 1 2 3
y = 0.9929x–0.0022 R² = 1
0
1
2
3
0 1 2 3

30 SKB P-13-31
Table 6‑3. Geokon total pressure sensors (buffer).
Sensor # Project # Pass/Fail Slope Offset error [MPa] Max reading
62278 PB 626 Pass with poly 1.00 <2 MPa62280 PB 517 Pass with poly 1.01 +0.02 <0.2 MPa62282 PB 509 Pass with poly 1.00 –0.14 <6 MPa62283 PB 523 Pass with poly 1.01 –0.08 <2 MPa62286 PB 620 Pass with poly 1.01 –0.17 <6 MPa62288 PB 621 Pass with poly 0.99 –0.15 <5 MPa62291 PB 502 Fail 0.96 –0.18 <0.1 MPa62289 PB 508 Pass with poly 0.98 –0.17 <5 MPa
6.3 Geokon total pressure, BufferThe results from the validation of sensors for measuring the total pressure in the buffer with the tech-nique of vibrating wire are shown in Figure 6-3 and Table 6-3. For this type of sensors two equations are presented by the supplier; a simpler linear equation and a polynomial equation. When the polyno-mial equation is used all but one validated sensors are showing good linearity (small deviation from the straight line), a slope near 1 and a minor offset error. When the linear equation is used the errors for the slopes of the lines are large. The error is particularly large at the lower range of the sensor and since many sensors are working in this range it’s not negligible. See also Section 4.4 where the equations are discussed. Figure 6-4 shows the distribution of the validated sensors in the experiment. As can be seen there are sensors from most parts in the test, however there is lacking of retrieved sensors from the mid heigth of the canister.
6.4 Geokon total pressure, BackfillThe results from the validation of sensors for measuring the total pressure in the backfill with the tech-nique of vibrating wire are shown in Figure 6-5 and Table 6-4. The test method cannot be considered as a validation but more a functionality test. The sensors are showing good linearity (small deviation from the straight line), a small offset error. The slopes of the lines are not 1 indicating that the applied loads are not fully transferred to the sensors. For one sensor a test of both sensor equations is made, but the difference is small.
Diamonds are the linear equation and the squares the polynomial equation.

SKB P-13-31 31
Figure 6‑3. Geokon Pore pressure sensors, readings vs applied pressure in MPa. Blue diamond:s the linear equation, red squares: the polynomial equation.
#62291, PB 502 #62289, PB 508
#62280, PB 517 #62282, PB V
#62283, PB V #62286, PB 620
y = 1.3027x + 0.0165R² = 0,9989
y = 0.9594x–0.1829 R² = 0.9964
0
1
2
3
4
5
6
0 2 4 6
y = 1.3197x + 0.1546R² = 0.9968
y = 0,9824x–0,1688 R² = 0,9991
0
1
2
3
4
5
6
0 1 2 3 4 5
y = 1.3201x + 0.1302R² = 0.998
y = 1.0148x + 0.0218R² = 0.9989
0
1
2
3
4
5
6
0 2 4 6
y = 1.3445x + 0.1548R² = 0.997
y = 0.9965x–0.1453 R² = 0.9986
0
1
2
3
4
5
6
0 2 4 6
y = 1.0104x–0.0819 R² = 0.9958
y = 1.3479x + 0.048R² = 0.9995
0
1
2
3
4
5
6
0 1 2 3 4 5
y = 1.3813x + 0.1435R² = 0.9974
y = 1.0074x–0.1738 R² = 0.9976
0
1
2
3
4
5
6
0 1 2 3 4 5
#62288, PB 621 #62278, PB 626
y = 1.3454x + 0.1336
R² = 0.998
y = 0.9862x–0.15
R² = 0.9981
0
1
2
3
4
5
6
0 2 4 6
y = 1.3519x + 0.1408
R² = 0.9977
y = 1.0037x– 0.1226
R² = 0.9982
0
1
2
3
4
5
6
0 2 4 6

32 SKB P-13-31
Figure 6‑4. Distribution of Geokon Total pressure Sensors in the experiment.
Table 6‑4. Geokon total pressure sensors (backfill).
Sensor # Project # Pass/Fail Slope Offset error [MPa] Max reading
60399 PFA08 0.85 –0.10 <2 MPa60400 PFA02 0.91 –0.17 <2 MPa60403 PFA14 0.88 –0.15 <2 MPa60405 PFA15 0.81 –0.10 <2 MPa60412 PFA13 0.91 +0.02 <2 MPa66731 PFA04 0.82 +0.03 <2 MPa

SKB P-13-31 33
Figure 6‑5. Geokon Pore pressure sensors, readings vs applied pressure in MPa.
#60399, PFA 08 #60400, PFA 02
#60403, PFA 14 #60405, PFA 15
#60412, PFA 13 #66731, PFA 04
y = 0.852x–0.0909 R² = 0.9976
0
1
2
3
4
5
6
7
0 2 4 6 8
y = 0.9063x–0.116 R² = 0.9984
0
1
2
3
4
5
0 2 4 6
y = 0.8764x–0.1509
R² = 0.9978
y = 0.8628x–0.0885 R² = 0.9962
0
1
2
3
4
5
0 2 4 6
y = 0.8142x–0.0988 R² = 0.9987
0
1
2
3
4
5
0 2 4 6
y = 0.9072x + 0.0158R² = 0.9999
0
1
2
3
4
5
0 2 4 6
y = 0.8206x + 0.0275R² = 0.9994
0
1
2
3
4
5
0 2 4 6

SKB P-13-31 35
7 Conclusions and comments
The majority of the tested sensors that were functional are giving correct readings when loads or pres-sures are applied on them. Two exceptions are, the total pressure sensors in the buffer and the backfill:
• For the total pressure sensors installed in the buffer the readings are correct but the previously used evaluation was incorrect, this has been corrected. Sensors of the same type delivered later have not this problem. The latest data report has the corrected values which also are reported to the Sicada database.
• For the total pressure sensors installed in the backfill the testing method was not sufficient for testing the sensors with good accuracy however the result indicated that the sensor was linear and functioning.
7.1 Cause of damagesThe main cause of damages appears to have occurred in the connection between the body of the sensor and the pipe/tube leading the cable to the data collecting system. This is relevant for both Kulite and Geokon sensors. A second cause for damages is water intrusion into the sensor.
7.2 Representative resultsThe majority of the pore pressure sensors and the total pressure sensors placed in the buffer and backfill, were tested. They show deviation from the applied pressure within ±2% with one exception. This sensor had a deviation of –4%. The data from the installed sensors can thus be trusted as long as readings were acquired.
8 out of 26 total pressure sensors in the buffer were tested. All of the validated sensors worked cor-rectly, but an error in the evaluation was identified and corrected. The evaluated sensors were placed in most parts of the experiment and could therefore be seen as representative, see Figure 6-4.
The judgment is that all the Geokon sensors have given reliable readings until failure or termination of the experiment. However the evaluation of the reading was not done correctly for some sensors.
Other sensorsSince no Kulite sensor could be tested no conclusions could be drawn regarding their readings.
The GRS geoelectric sensors described in 2.9 gave correct readings or suffered from strained cables.
Geokon rock sensors were also installed but not tested or excavated have had unexpected readings. However the problem is probably more due to use is out of range and installation effects.
7.3 Lifetime of sensorsIn Figure 7-1 the numbers of still working sensors in the backfill and the buffer of Section 2 are plotted as function of time from May 2003. The figure shows that the majority of the broken sensors are RH-sensors and that the numbers of broken sensors increased after November 2004 when the drainage of the tunnel was closed and thus high water pressures were measured both in the buffer and the backfill. Details of all events can be found in Data report (Goudarzi 2014).

36 SKB P-13-31
7.4 Lessons learnedThe titanium sensors showed no sign of corrosion and in general functioned well. Two weak points have been discovered. The transition from the housing to the tube has been broken in a number of sensors of all kinds. Any leakage in joints or tubes wherein the cable lies is directly open to the inner part of the sensor, a watertight seal in the sensor would have saved a number of sensors.
Another lessons learned is that a “System test” should have been done. “System test” i.e. all types of sensors are connected to the acquisition system with software and tested with known load. This to see that all parts are functioning and the data handling is correct.
Figure 7‑1. The numbers of still working sensors placed in the buffer and backfill in Section 2 as function of date (at start 343). The coloured fields are representing the four types of installed sensors.
0
50
100
150
200
250
300
350
400
2003-05-01 2004-07-01 2005-09-01 2006-11-01 2008-01-01 2009-03-01 2010-05-01
Still
wor
king
sen
sors
Relative Humidity
Pore Pressure
Total Pressure
Temperature
4-07-07777777777 1
Closed drainage2004-11

SKB P-13-31 37
References
SKB’s (Svensk Kärnbränslehantering AB) publications can be found at www.skb.se/publications.
Gourdazi R, 2014. Prototype Repository – Sensor data report (Period 010917–130101). Report No 25. SKB P-13-39, Svensk Kärnbränslehantering AB.
Johannesson L-E, Gunnarsson D, Sandén T, Börgesson L, Karlzén R, 2004. Äspö Hard Rock Laboratory. Prototype repository. Installation of buffer, canisters, backfill, plug and instruments in Section II. SKB IPR-04-13, Svensk Kärnbränslehantering AB.