prove marketing roi with campaign tracking in #googleanalytics
TRANSCRIPT

PRESENTERS:
Ryan LindsayRachel Dohmann
Webinar: Prove Marketing ROI with Campaign Tracking in #GoogleAnalytics
CONVERGE CONSULTING | 1.28.16

Ryan Lindsay

RACHEL DOHMANN

ABOUT CONVERGE
4

AGENDA
5
Campaign Tracking Overview
Governance Strategy For Campaign Tracking
Reporting on Campaigns Using Dashboards
Segmenting Data Using Campaigns
Campaign Tracking Case Study

AGENDA
6
2015 Inbound Marketing in Higher Education Survey• Methodology• Results• Trends
2016 Predictions in Three Key Areas:• Digital Advertising• Content Marketing• Measurement
Campaign Tracking Overview

Default Channel Groupings

When Do You Use It?

http://www.convergeuniversity.edu/admissions?utm_source=facebook&utm_medium=social&utm_campaign=spring-2016-
campaign&utm_content=video-1
http://gaconfig.com/
What Is It?

In The Reporting

The Three Facets
Source: “The brand name”facebook, newsletter, affiliate link, google
Medium:The bucketemail, social, cpc, ppc, display
Campaign:The message/contentdate, fall2014, alumni2014-8-15

Easier Than You Think

Set Campaign Goals
13

AGENDA
14
2015 Inbound Marketing in Higher Education Survey• Methodology• Results• Trends
2016 Predictions in Three Key Areas:• Digital Advertising• Content Marketing• Measurement
Governance Strategy

Make a Plan

Record Your Plan

That URL Is SO Long…

That URL Is SO Long…

All In One!

AGENDA
20
2015 Inbound Marketing in Higher Education Survey• Methodology• Results• Trends
2016 Predictions in Three Key Areas:• Digital Advertising• Content Marketing• Measurement
Reporting Using Dashboards
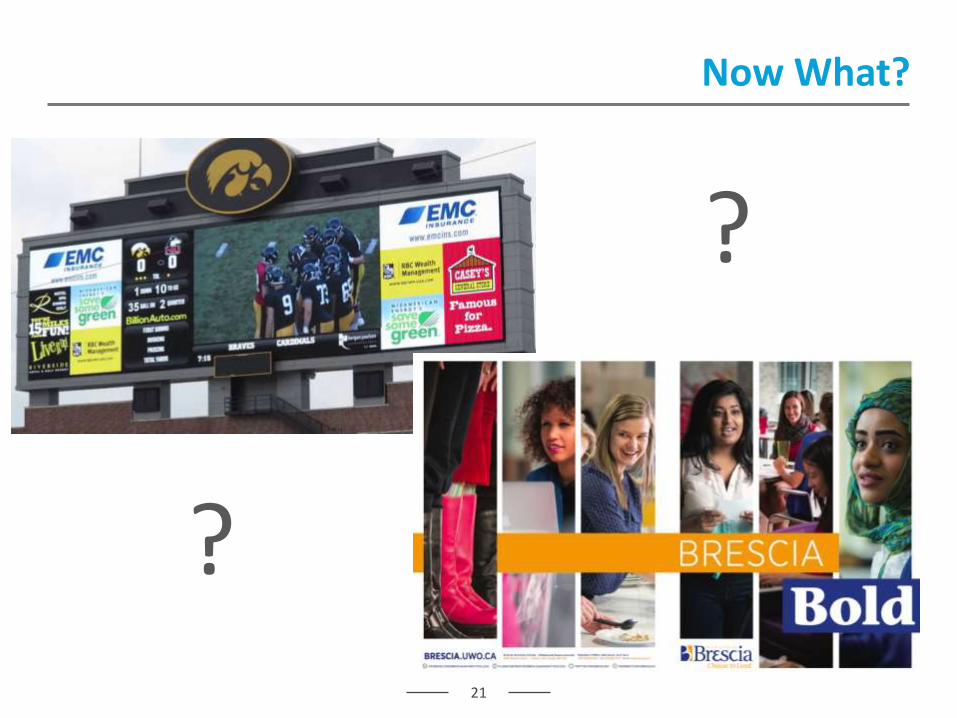
Now What?
21
?
?

The Data Starts Rolling In!
22

Consolidating That Data
23

Overall or Campaign Specific
24

Takeaway: Downloadable Dashboard
25
Import Your Dashboard Here!

Takeaway: Downloadable Dashboard
26
Import Your Dashboard Here!

AGENDA
27
2015 Inbound Marketing in Higher Education Survey• Methodology• Results• Trends
2016 Predictions in Three Key Areas:• Digital Advertising• Content Marketing• Measurement
Campaigns For Segmenting Data

Diving Deeper With Segmentation
28

Diving Deeper With Segmentation
29

Diving Deeper With Segmentation
30

Accessing Segments
31

Takeaway: Downloadable Segment
32
Import Your Segment Here!

Takeaway: Downloadable Segment
33
Import Your Segment Here!

AGENDA
34
2015 Inbound Marketing in Higher Education Survey• Methodology• Results• Trends
2016 Predictions in Three Key Areas:• Digital Advertising• Content Marketing• Measurement
Campaign Tracking Case Study

CASE STUDY: TEXAS A&M FOUNDATION

Phase I
• Pre-Launch Assessment and Project Planning
• Domain and Sub-domain mapping
• Audience prioritization and goal mapping
Phase II
• Google Tag Manager creation and implementation
• Testing
Phase III
• Event tracking and goal implementation
• Dashboard reporting
Phase IV
• User ID Integration
• Dimension Widening (importing donor levels to attach to unique IDs)
PROJECT TIMELINE

SUBDOMAIN AND DOMAIN MAPPING

GOAL MAPPING

GOALS
1. Donate2. Contact Us3. Apply for a scholarship4. Apply for Maroon Coats

GOALS

CONVERSIONS

CAMPAIGN TRACKING

E-NEWSLETTER
ANALYSIS

Proposed Solutions
• Make sure it looks and
functions well on mobile
• 40-60% of consumers are
reading email on smartphones
44

Overview: Landing Pages (top 10)
45

Education Industry Email Averages
• Open Rate: 23.15%
• Click Thru Rate: 3.11%
• Hard Bounce: 0.60%
• Unsubscribe: 0.21%
46

47
Open Rate Click Thru Rate Bounce Rate Unsubscribe
Industry Average 23.15% 3.11% 0.60% 0.21%
October 2014 23.42% 3.13% 1.66% 0.69%
November 2014 27.70% 3.40% 0.05% 0.48%
December 2014 24.00% 3.00% 0.07% 0.45%
January 2015 25.00% 3.00% 0.06% 0.37%
February 2015 26.00% 3.00% 0.25% 0.29%
March 2015 25.00% 4.00% 0.07% 0.22%
April 2015 24.85% 3.45% 0.33% 0.23%
TAMF Newsletters

Proposed Solutions: Main CTA
48
Continue to segment CTAs (role based)

Overview: Compared to All

50

51
Assisted Conversions

SOCIAL MEDIA
ANALYSIS

Overview: Landing Pages (top 10)
53

Tuesday, December 16th, 2014
54

Overview: Conversion Rates
55

Facebook Campaigns
56

Facebook Campaigns
57
*Most variety

Facebook: Student-Impact
58

Twitter Campaigns
59

LinkedIn Campaigns
60

Takeaways
• Facebook drive the highest quality traffic
• Giveaway content drive the most conversions, followed by
Maroon Coats
• Social is bringing in more new visitors, but they stay less
time and bounce more frequently
• 64% of social traffic is mobile
61
Ask Yourself Questions
• Which channels are you spending the most time on?
Money? Does that line up with outcomes?
• Is it reasonable/worth it to match up more of the exact
social examples?
› Is this documented somewhere?
• Are we fully utilizing the giveaway conversions?
• Are the landing pages we’re driving to mobile friendly?
62

OFFLINE TO ONLINE:
BUGLE CALL TRACKING

OPPORTUNITIES

USER ID AND DIMENSION WIDENING

Additional Converge Resources
67
Converge Blog:- 7 Helpful Google Analytics Dashboards- Tracking Campaigns in Google Analytics- Converge Consulting’s Most Valuable Resources on Google
Analytics
Converge Webinars:- Google Analytics – Top 5 Things to Know- Why and How to Switch to Universal Analytics

NEXT WEBINAR
68

69