proventia server ips: administrator guide for proventia server for
TRANSCRIPT

Social Interactions and Entrepreneurial Activity
Current version: November 2004
Mariassunta Giannetti∗ Andrei Simonov
Abstract. We study whether the individual decision to become an entrepreneur, entrepreneurial profits and investment are affected by the decisions of other individuals belonging to the same social group. We use local labor markets as economic areas of analysis. Additionally, we define social groups (within the local labor market) on the basis of the municipalities where individuals live. To overcome identification problems, we include local labor market fixed effects, social group fixed effects, and extensive controls. Moreover, we instrument the level of entrepreneurial activity in the individual’s social group. The results show that in social groups where entrepreneurship is more widespread individuals are more likely to become entrepreneurs and invest more in their own businesses, even though their entrepreneurial profits are lower. This suggests that social norms create non-pecuniary benefits from entrepreneurial activity thus playing an important role in the decision to become an entrepreneur. We also evaluate alternative explanations, such as entry costs, knowledge spillovers, competition and informal credit markets. However, they do not find support in the data. Keywords: Entrepreneurial choice; peer effects; social norms; agglomeration economies JEL Codes: M13; J24; Z13; R12 Acknowledgments. Previous versions of this paper were circulating under the title “Does Prestige Matter More then Profits? Evidence from Entrepreneurial Choice.” We are grateful to Howard Aldrich, Wendi Carlin, Luigi Guiso, Augustin Landier, Mitchell Petersen, Elaina Rose, and seminar participants at the EVI conference at the Stern School of Business at New York University, the Kellogg Graduate School of Business at Northwestern University, American Economic Association, CEPR Workshop on “Understanding Productivity Differences” in Alghero, the Institute of International Economic Studies, the University of Uppsala, the Research Institute on Industrial Economics (IUI) in Stockholm, the Stockholm School of Economics, the Center for Economic and Business research in Copenhagen, the European Meeting of the Econometric Society in Stockholm, the University College of Dublin, and the ESF conference on Transition and Development for comments. We are also grateful to Jonas Vlachos for providing some of the municipality data we use in this paper. Any errors and omissions are entirely our own. The authors also wish to acknowledge financial support from the Jan Wallander and Tom Hedelius Foundation.
∗ Department of Finance and SITE, Stockholm School of Economics, CEPR, and ECGI, Sveavägen 65, Box 6501, SE-113 83, Stockholm, Sweden. E- mail: [email protected] Department of Finance, Stockholm School of Economics, Sveavägen 65, Box 6501, SE-113 83, Stockholm,
Sweden. E-mail: [email protected]
1
Social Interactions and Entrepreneurial Activity
Abstract. We study whether the individual decision to become an entrepreneur, entrepreneurial profits and investment are affected by the decisions of other individuals belonging to the same social group. We use local labor markets as economic areas of analysis. Additionally, we define social groups (within the local labor market) on the basis of the municipalities where individuals live. To overcome identification problems, we include local labor market fixed effects, social group fixed effects, and extensive controls. Moreover, we instrument the level of entrepreneurial activity in the individual’s social group. The results show that in social groups where entrepreneurship is more widespread individuals are more likely to become entrepreneurs and invest more in their own businesses, even though their entrepreneurial profits are lower. This suggests that social norms create non-pecuniary benefits from entrepreneurial activity thus playing an important role in the decision to become an entrepreneur. We also evaluate alternative explanations, such as entry costs, knowledge spillovers, competition and informal credit markets. However, they do not find support in the data. Keywords: Entrepreneurial choice; peer effects; social norms; agglomeration economies JEL Codes: M13; J24; Z13; R12
2
1. Introduction
Entrepreneurial activity and new firm formation are unquestionably considered
engines of economic growth and innovation (Baumol, 1990; Murphy, Shleifer and Vishny,
1991). As such, they are among the ultimate determinants of the large regional differences in
economic performance. The importance of new firm formation for growth has been
recognized since Schumpeter (1934). Despite this, the economic profession is still far from a
complete understanding of what drives an individual to start a new business. Research
analyzing the determinants of the decision to start a new business so far has stressed the role
of individual characteristics, access to capital and institutions. However, also social factors
may play a role in the decision to become an entrepreneur because, as shown by a growing
literature, social interactions affect the payoffs from a variety of economic decisions.1
There are several reasons why social interactions may affect the decision to become an
entrepreneur. Individuals may learn how to run a business by observing their neighbors.
Thanks to knowledge spillovers, individuals belonging to highly entrepreneurial social groups
may be more productive and thus more prone to start their own business than individuals with
similar characteristics (who are not part of these social groups). Alternatively, social
interactions may create social norms affecting whether entrepreneurs are highly regarded.
These social norms may have a major influence on occupational choice because social status,
prestige and the like enter directly into the utility function (Cole, Mailath and Postlewaite,
1992 and Bernheim, 1994). Finally, individuals may desire to conform or simply prefer to
become entrepreneurs if their peers do so.
Social scientists other than economists have long recognized the importance of social
factors in the decision to become an entrepreneur.2 Balazs (1964), for instance, explains not
only the low level of entrepreneurship, but also the failure of China to start an industrial
revolution despite the apparent prosperity of the Sung period (960-1270), by using desire for
prestige, popularity and esteem. Nevertheless, a quantitative exploration of these factors is
missing.
In this paper, we make a first step in this direction. To perform this challenging task, we
proceed as follows. We formulate predictions about the consequences of peer effects on
different aspects of entrepreneurial activity. If peer effects matter, we expect that the
probability of an individual becoming an entrepreneur is positively affected by the level of
1 For empirical evidence, see, for instance, Glaeser, Sacerdote and Scheinkman (1996), Borjas and Hilton (1996), Bertrand, Luttmer and Mullainathan (2000), Duflo and Saez (2002), Hong, Kubik and Stein (2004). 2 See Aldrich (2003) for a comprehensive survey.

3
entrepreneurial activity in her social group. Additionally, if peer effects influence how
desirable being an entrepreneur is, an individual’s entrepreneurial profits (investment) may be
lower (higher) is she belongs to a social group that values entrepreneurial activity. This is
because social norms may increase the utility from investing in the entrepreneurial activity.
This prediction contrasts with what knowledge spillovers (or other forms of agglomeration
economies) would imply (see Glaeser et al., 1992, and Rauch, 1993), as entrepreneurial
profits would be higher if these factors were important.
To test these hypotheses, we exploit a Swedish data set that provides very detailed –
probably unique– information on individual characteristics, sources of income and economic
environment. The richness of this data set allows us to exploit strategies for identifying peer
effects similar to the ones that have previously been used in different contexts.
A major problem in the identification of peer effects is that the correlation between
individual and aggregate occupational choices could depend on several other factors such as
unobserved characteristics of the social group or economic conditions. Thanks to the richness
of our data set, however, we can analyze the individual decision to become an entrepreneur
within a given local labor market (henceforth, LLM). Within a LLM economic incentives and
opportunities are homogeneous because individuals can commute to jobs without incurring
moving costs. Still, individuals living in different municipalities (within the LLM) have closer
interactions with their neighbors. We thus identify social groups with municipalities. If peer
effects exist, entrepreneurial activity in the municipality where an individual lives should
affect her occupational choice.
We exploit this intuition and study the probability than an individual becomes an
entrepreneur, entrepreneurial profits and investment after controlling for LLM fixed effects
(which capture omitted economic factors), dummies for the richest and poorest municipalities
within a local labor market (which capture the fact that some social groups segregate in some
areas and may have unobservable characteristics that affect their propensity to entrepreneurial
activity) and extensive individual and municipality level controls.
To further ensure that our estimates are not affected by omitted characteristics of the
social group –that are not properly accounted by the dummies for the richest and poorest
municipalities and the other individual and municipality controls—we use a methodology
suggested by Case and Katz (1991) and followed by, among others, Cutler and Glaeser (1997)
and Duflo and Saez (2002). We identify some instruments that do not directly affect an
individual’s decision to become an entrepreneur, but that do affect entrepreneurial activity
(without being affected by it). The instruments we use are the proportion of pensioners who

4
are members of the state church and the proportion of individuals who voted for right-wing
parties in the early 1980s.
Our instruments capture different social groups’ cultural values, which –as we show—
are related to differences in entrepreneurial activity. Both instruments are predetermined with
respect to entrepreneurial activity in our sample period (the second half of the nineties).
Hence they cannot have been affected by the current level of entrepreneurial activity.
Additionally, Sweden underwent profound economic transformation in the 1980s and early
1990s. It experienced a banking crisis followed by widespread bankruptcies, a major tax
reform in 1990-91 and the dissolution of the centralized wage-setting arrangements, which
significantly modified Swedish industrial structure (Davis and Henrekson, 2004). To some
extent, entrepreneurial activity has emerged as a result of these events and cultural values in
the early 1980s can be considered exogenous with respect to the level of entrepreneurial
activity in our sample period.
We are also confident that these cultural characteristics neither directly affect the
decision to become an entrepreneur nor are correlated with some unobserved determinants of
this decision. In fact, we are able to control for roughly the corresponding individual cultural
traits. Additionally, we are not able to reject the null hypothesis that our instruments do not
directly affect the decision of becoming an entrepreneur, entrepreneurial profits or investment.
We find that individuals belonging to highly entrepreneurial social groups are more
likely to become entrepreneurs. Moreover, they invest more but have lower entrepreneurial
profits than entrepreneurs belonging to social groups with lower levels of entrepreneurial
activity. Overall, our results suggest that social interactions are important. Additionally, peer
effects seem to matter because they affect an individual’s utility from entrepreneurial
investment, and not because, by creating knowledge spillovers, they increase productivity in
the entrepreneurial activity.
Our findings are robust to the use of different proxies for entrepreneurial activity, the
introduction of additional controls, and the use of different subsamples. They are also
confirmed by several robustness checks. First, by looking at the behavior of movers, we can
exclude that the correlation between individual and aggregate occupational choices is due to
sorting of individuals more prone to entrepreneurial activity in some municipalities.
Second, to increase the confidence in our identification strategy, we check that our
results hold for young individuals who were not part of the labor force in the early 1980s, and
who definitively cannot have affected the cultural values we use as instruments. Most
importantly, in this subsample we are able to control for the capital income of the parents.
5
This variable proxies for initial capital that may be informally available to potential
entrepreneurs and the fact that children of entrepreneurs are known to be more prone to start a
business. Although the sample is dramatically reduced, our results remain qualitatively
invariant.
Finally, we test whether social networks in high entrepreneurship municipalities ease
access to credit. We find that small firms in high entrepreneurship municipalities do not rely
on trade credit and informal loans to a larger extent than companies in other municipalities.
This suggests that informal credit markets are unlikely to foster entry of entrepreneurs with
lower expected profits. Hence, the mechanism relating social interactions and entrepreneurial
activity appears to be non-pecuniary.
This paper is related to the rich literature on entrepreneurial choice (Evans and
Leighton, 1989; Evans and Jovanovic, 1989), which analyzes the characteristics of individuals
who are more likely to become self-employed. With respect to this literature, we take a step
forward. We recognize that not only individual characteristics but also the social group an
individual belongs to matter.
Our findings are consistent with the findings of some recent papers showing that
entrepreneurial activity may involve substantial non-pecuniary benefits (Hamilton, 2000 and
Moskovitz and Vissing-Jorgensen, 2002). Our contribution is to show that there may be
systematic differences in non-pecuniary benefits across social groups.
The rest of this paper is organized as follows. Section 2 presents a simple framework to
describing how individual characteristics, social norms, and economic conditions affect
entrepreneurial choice, profits and investment. Section 3 describes the data. The results and
the robustness checks are presented in Sections 4 and 5, respectively. Section 6 concludes.
2. The determinants of entrepreneurial choices
2.1 A simple framework
In this section, we sketch a simple model of occupational choice and illustrate how
differences in productivity across locations, social interactions, and individual characteristics
affect the decision to become an entrepreneur, entrepreneurial profits and investment.
We model the idea that in some social groups being an entrepreneur is considered
valuable by assuming that the utility of entrepreneurs increases not only in entrepreneurial
profits, but also in the output from the entrepreneurial activity. In other words, the extent to
which entrepreneurial investment is weighted in the utility function depends on the social

6
norm prevailing in an individual’s peer group. This aims to capture any non-pecuniary
benefits of entrepreneurial activity, which may be substantial, as shown by Hamilton (2000)
and Moskovitz and Vissing-Jorgensen (2002). Unlike these papers, however, we assume that
non-pecuniary benefits vary across social groups so that we can derive testable implications
and evaluate the importance of social norms – which involve a social group and not the
preference of a single individual.
Formally, the utility of an individual, i, involved in the entrepreneurial activity is:
(1 )Ei ig ir iU Y Iσ= + − .
Here, irY is the output from the entrepreneurial activity of individual i in location r; iI is
the entrepreneurial investment of individual i; igσ is the value attributed to entrepreneurial
investment by the social group g, individual i belongs to. In other words, igσ is the parameter
capturing social norms. We assume that 0.igσ ≥ If 0igσ = , only entrepreneurial profits,
ir ir iY Iπ ≡ − , affect the utility from entrepreneurial activity. If 0igσ > , entrepreneurs derive
utility from being able to invest in their own business.3
Entrepreneurial profits, irπ , depend on individual productivity, indexed by i, and the
location where an individual lives. This follows from our assumptions on entrepreneurial
technology. The output from the entrepreneurial activity ( irY ) increases in entrepreneurial
investment ( iI ) and productivity ( irA ) as follows: ir ir iY A I γ= . The entrepreneurial
productivity of individual i, in turn, depends positively on her skills, is , and the strength of
agglomeration economies in her location r, ra :
( , ).ir i rA A s a=
We also assume that 2
0.ir
r i
Aa sδδ δ
>
Here we assume, as is common in models of occupational choice, that individuals have
heterogeneous skills that influence their productivity in running their own business. An
entrepreneur’s productivity also depends on the location: If location r, offers good
infrastructure, easy access to intermediate goods, or other sources of agglomeration
economies exist, an individual becomes more productive in organizing her own business. It is
important to note that knowledge spillovers, which may also be the result of social

7
interactions, would affect individuals similarly to agglomeration economies because they
increase individual productivity in the entrepreneurial activity.
Entrepreneurs choose the level of investment maximizing their utility. If 0igσ > , they
over-invest in the entrepreneurial activity and have lower profits than profit-maximizing
entrepreneurs.
The utility of a worker depends merely on her wage, rw . We recognize that wages may
differ across locations according to differences in labor demand that we do not model.
Individuals make their occupational choices by comparing the utility from setting up their
own business with being employed.
We solve the simple model in the Appendix. Here we summarize the main implications
of social norms and agglomeration economies. As usual, individuals who are more productive
in entrepreneurial activity are more likely to become entrepreneurs because they can earn
higher profits ( irπ is increasing in is ). This implies that in a given location the most skilled
individuals set up their own business. The skill level of the marginal entrepreneur (i.e., the
individual who is indifferent to being an entrepreneur or an employee) varies across locations
for several reasons. First, the level of agglomeration economies in a location, ra , affects
individual productivity positively: For any given level of wages, relatively less skilled
individuals will choose to become entrepreneurs if the location’s advantage is stronger,
because ,i rA and hence ,i rπ are higher. Second, in locations where wages are higher, fewer
individuals will choose entrepreneurial activity, as income from paid employment is high.
Finally, for any given level of entrepreneurial profits and wages, social norms matter: If the
status attributed to being an entrepreneur is high relative to other occupations, even
individuals who are relatively less productive prefer to become entrepreneurs. Additionally,
they over-invest in the entrepreneurial activity because they derive utility from doing so.
Their entrepreneurial profits will thus be lower than elsewhere.
Proposition 1 summarizes the main findings that will be useful in the empirical analysis:
Proposition 1. Individuals belonging to social groups that value more highly entrepreneurial
investment:
1. are more likely to become entrepreneurs;
3 It would be straightforward to re-parameterize the utility function in such a way that the utility decreases in the effort or investment needed to run a business. In this case, the marginal disutility of effort (or investment) should be lower for individuals belonging to social groups that value entrepreneurial activity to a larger extent.
8
2. invest more in the entrepreneurial activity;
3. have lower profits from the entrepreneurial activity.
Individuals in locations where agglomeration economies are stronger:
4. are more likely to become entrepreneurs;
5. invest more in the entrepreneurial activity;
6. have higher profits from the entrepreneurial activity.
Note the decision whether to become an entrepreneur may be correlated across
individuals for very different reasons. Interestingly, though, if social norms drive
entrepreneurial choice, for given entrepreneurial skills, an individual’s entrepreneurial profits
are expected to be lower for individuals who belong to highly entrepreneurial social groups.
In contrast, if knowledge spillovers, agglomeration economies or other unobserved
differences in the distribution of skills across locations drive –or, at least, are relatively more
important for– entrepreneurial choice, we would expect an individual’s entrepreneurial profits
to be higher in locations where entrepreneurship is more widespread.
Additionally, the model suggests that wage differentials may determine the observed
correlation between individual and aggregate occupational choices. We will take this into
account in the econometric analysis.
2.2 What are social norms?
In the previous subsection, we have identified social norms as a factor that enters
directly into the utility function. Members of a social group derive utility from following the
prevalent social norm because of social interactions. In some social groups, independently of
profits, individuals derive higher utility from entrepreneurial investment. In others, they prefer
paid employment. To put it differently, we posit that there are non-pecuniary benefits from
entrepreneurial activity that vary systematically across social groups because of social norms.
The methodology we put forward in the following sections aims to evaluate the
importance of these systematic differences in non-pecuniary benefits, deriving from peer
effects. It is beyond the scope of this paper, however, to identify who the peers are and why
individuals derive benefits from following the social norm.
More specifically, because of data limitations, we are unable to distinguish whether
peer effects are determined by the larger circle of acquaintances of an individual or by a more
restricted family circle. Like most of the existing literature (for instance, Bertrand, Luttmer
9
and Mullainathan, 2000), we assume that social groups are defined by administrative
boundaries and can thus test only indirectly how social interactions operate. In Subsection 5.2,
however, estimates based on a subsample of young individuals suggest that peer effects
matter beyond the restricted family circle.
Moreover, social norms can affect the utility function for several reasons. In this
context, the most direct interpretation of social norms is probably that different social groups
confer prestige, popularity and esteem to different occupations. The interpretation would be
analogous if individuals were influenced by their peers’ actions only because they desire to
conform.
Social norms may also influence the ease with which an individual expects to run her
own business, for instance, because she trusts and is trusted by others (Bhidé, 2000). Social
contacts that facilitate access to input providers or potential customers may reduce the effort
involved in running a business. Utility increases if the level of trust is higher or social contacts
more intense. Social norms that increase trust or social contacts may also have a positive
effect on entrepreneurial profits. In other words, they may induce pecuniary benefits. Hence,
their effect is largely undistinguishable from agglomeration economies ( ra in the above
model). To the extent that trust can increase utility without affecting profits (by, e.g., reducing
the effort otherwise required in entrepreneurial activity), we also capture this effect of social
norms. Put differently, individuals may imitate their neighbors just because they perceive that
it is easier or because it yields higher utility.
We view as beyond the scope of this paper to try to distinguish between prestige,
desire for conformity, availability of social contacts, and trust, to the extent that they affect
the way entrepreneurial activity is perceived but do not affect entrepreneurial choice for
pecuniary reasons.
Finally, social interactions may matter for pecuniary reasons. First, the correlation
among individual occupational choices may well be due to knowledge spillovers, which
increase individual productivity, as Glaeser et al. (1992) note. Knowledge spillovers,
however, would constitute a regional advantage, like the availability of infrastructure, and
would affect equilibrium as any other form of agglomeration economies would. Hence, they
are distinguishable from social norms whose effect we aim to evaluate. Second, thanks to
social interactions informal credit market may arise. These may lower the cost of external
finance and stimulate entry (and investment) of entrepreneurs with lower productivity, like
social norms. We explore this possibility in Subsection 5.3.

10
3. Data Description and Identification Strategy
3.1 Sources
Our main data source is Linda, a register-based longitudinal data set for Sweden,
providing information about household organization, labor status, sources of income, wealth,
housing, and other socio-economic characteristics. We match the individual data provided by
Linda with information about the 109 Swedish local labor markets (LLMs) –which in turn
include 289 Swedish municipalities (kommun) 4 – provided by Statistics Sweden. In addition,
we use Market Manager, a data set collecting the balance sheets of all private and public
companies incorporated in Sweden to obtain information about firm size and the success of
entrepreneurial activity in different municipalities.
The Swedish data provide an ideal setting for studying the effect of social interactions
on entrepreneurial choice for several reasons. First, Statistics Sweden creates local labor
market (LLM) areas according to the observed commuting patterns. Within a LLM, economic
incentives are likely to be homogeneous. LLM include several municipalities. It seems
reasonable that an individual interacts more with individuals residing in the same
municipality, while her economic incentives in choosing among occupations depend on the
LLM. This provides a setting that, as we discuss in Section 3.3, we can exploit for identifying
peer effects.
Second, the dataset we use is much more representative of the population than other
data sets previously used in a similar context. Linda is a representative sample including some
300,000 households, or approximately 4% of the Swedish population. In contrast, the U.S.
National Longitudinal Survey, used by Evans and Jovanovic (1989) and Evans and Leighton
(1989), includes only 5,225 individuals. Analogously, the Survey of Consumer Finances used
by Moskowitz and Vissing-Jorgensen (2002) includes only 4,000 U.S. households. Even if
these U.S. data could be matched with information about households’ neighborhoods, it
would be very difficult to draw any conclusions about how social group characteristics
influence individual occupational choice, because the data do not provide a sufficient number
of observations for individuals who belong to a social group. This is not the case with Linda:
Our sample includes on average 5% of the population (1,584 individuals per municipality) for
all Sweden’s 289 municipalities and never less than 3.9% of the population (106 individuals
per municipality).

11
Finally, starting from 1995, Linda provides detailed information on whether an
individual reports to the tax authority any capital income she has received from a company in
which she works at least part-time and that she controls. This enables us to define
entrepreneurial activity using tax returns, as did Holtz-Eakin, Joulfaian and Rosen (1994). For
this reason, we limit our sample to 1995-2000.
3.2 Definition of entrepreneur and measures of entrepreneurial activity
Our definition of entrepreneur includes all individuals who report any capital income
from a company in which they work at least part-time and that they control. Similarly to
Holtz-Eakin, Joulfaian and Rosen (1994), it includes both individuals who are truly self-
employed and those who run their own business as a second job. We include these individuals
because all businesses, even the most successful ones, are generally started with very small
investments. It is very difficult to predict ex ante which businesses will indeed be successful
(Bhidé, 2000). Even individuals who run their own business on the side may become very
successful entrepreneurs. Additionally, thanks to the detailed information reported in Linda,
we can identify individuals who receive salaries from a firm they own. We also classify these
individuals as entrepreneurs.
Like most of the previous literature on entrepreneurial choice, we restrict our sample to
individuals aged between 18 and 60, since individuals who are too young or too old are
unlikely to set up a proper entrepreneurial activity. Additionally, we exclude individuals
involved in agriculture, farming, and forestry, which are concentrated in rural areas and could
bias our results towards finding a correlation between individual and aggregate occupational
choices.
According to our definition, approximately 5 percent of the population is involved in
entrepreneurial activities, slightly less than in previous studies (see, for instance,
Blanchflower, 2000 and Blanchflower, Oswald and Stutzer, 2001), which mostly also include
farmers.
We study the decision to become self-employed, looking at individuals who, according
to our definition, can be classified as entrepreneurs in year t but not in year t-1. These people
represent approximately 1% of the working-age population each year. We use a dummy
variable equal to 1 if we observe that individual i becomes an entrepreneur and equal to zero
4 We have only 288 municipalities until 1999, when one of the municipalities was split in two.

12
otherwise as dependent variable to estimate the probability of an individual becoming an
entrepreneur.5
To analyze peer effects, we need to define entrepreneurial activity within an
individual’s social group. Since individuals are likely to interact more closely with their
neighbors, we assume that peer groups are delimited by administrative boundaries. Hence we
identify social groups with municipalities.
We use several proxies for entrepreneurial activity within the municipality: The first one
uses the individuals who are classified as entrepreneurs relative to all individuals under the
age of 60 in a given municipality included in Linda. The second definition takes into account
that individuals may have closer interactions with individuals with similar educational
achievement within the same municipality. Hence we define social groups using educational
achievement. Using Linda, for any individual, we can construct a peer group of individuals in
the municipality with a similar education level. We rely on three educational groups:
individual with less than high school diploma, with a high school diploma and with a
university degree. We define the variable of interest as the proportion of entrepreneurs with a
given educational achievement in the municipality population with that educational
achievement. Since individuals with different educational achievements may have different
propensities to become entrepreneurs, we include education dummies.
Finally, we use a measure based on economic outcome, namely the proportion of
entrepreneurs in the top quartile of the income distribution in each municipality. This proxy
captures the fact that in municipalities where the richest individuals are entrepreneurs, this
profession must be considered highly prestigious. Hence, this variable may be a more direct
proxy for the existence of role models when we look at its effect on individuals in the lowest
three quartiles of income distribution. It is also less likely to be affected by omitted variable
bias as the occupational choices of the most successful individuals should have different
determinants from the occupational choices of the rest of the population.
We use the proxy of entrepreneurship at t-1 to explain the probability of an individual
becoming an entrepreneur at time t. For this reason, we lose one year. Our final sample
consists of 469,504 individuals, and a total of 1,684,596 individual-year observations from
1996 to 2000.
Table 1 shows that there is substantial variation across municipalities both in the
proportion of individuals who are entrepreneurs and in those who become entrepreneurs.
5 Individuals who already are entrepreneurs at t-1 are excluded from the sample.

13
Although the statistics presented include both cross-section and time-series variation, most of
the variation comes from the cross-sectional differences among Swedish municipalities.
3.3 Identification
Interpreting the effect of alternative proxies for entrepreneurial activity on the
probability of an individual becoming an entrepreneur (entrepreneurial income and
investment) is problematic, because our variable of interest could be correlated with
individual or municipality characteristics that we do not observe, and that may have an
independent impact on the dependent variable (Manski, 1993). Luckily, our data set presents
features that allow us the use of methodologies similar to the ones successfully used in
identifying peer effects in different contexts.
In our data set, municipalities –which we have selected to identify social groups—do
not coincide with the most natural economic unit of analysis. From an economic point of
view, the relevant unit of analysis is the local labor market (see Vlachos, 2004 for a similar
argument). LLMs are constructed by Statistics Sweden on the basis of individuals’
commuting patterns to jobs. LLMs are quite small and economically homogeneous
geographical units because individuals living in a LLM face the same incentives and
opportunities. Municipalities are administrative units of analysis which coincide with different
neighborhoods within a LLM.
Figure 1 shows the 109 LLMs and the municipalities within each LLM. To put things in
perspective, Sweden has a population of nearly 9 million and comprises 109 LLMs. The
average (median) population of a LLM is 81,200 (26,700). The average (median) area is
3,770 (2318) sq km. The more densily populated LLM is Stockholm with 1,862,000
inhabitants and an area of 8,036 sq km. The second most populated LLM is Göteborg, another
major urban area with a population (area) of 896,000 (5468 sq km). The less populated LLM
is Sorslee, a rural area in the North with a population (area) of 3,300 (7493 sq km). LLMs
include a very different number of municipalities. For instance, Stockholm includes 30
municipalities, Göteborg includes 16, while 61 LLMs –the less populated ones– include only
one municipality.
From Figure 1 is apparent that in the South and the Center LLMs have smaller
extension and more municipalities –meaning that they are more densely populated. In the
econometric analysis, since as it will be clear below we include LLM fixed effects, the
extended and less populated LLMs in the North (which mostly have only one municipality)

14
do not contribute –or contribute very little– to the identification of the coefficient of our
variable of interest.
We believe that it is reasonable to assume that economic incentives are homogeneous
within a LLM because individuals being able to commute to jobs without incurring moving
costs, have similar incentives to choose among occupations. Since individuals are more likely
to interact with their neighbors, we treat municipalities within a LLM as an individual’s peer
group. Arguably, individuals sort across municipalities according to their wealth but have
similar economic incentives to individuals residing in other municipalities within the LLM.
Their attitude towards entrepreneurial activity may still differ because they interact more
closely with the members of different social groups.
The context we have just described is similar to the one in which Bertrand, Luttmer and
Mulainathan (2000) examine the role of social networks in welfare participation. Like them,
we include LLM fixed effects to control for economic factors affecting incentives. Including
LLM fixed effects, we can be confident that differences in economic incentives or
opportunities to undertake the entrepreneurial activity –such as differences in entry costs,
financial development, or labor market conditions– are controlled for. Similarly, LLM fixed
effects capture differences in demand, competition, and market structure.
Individuals in different social groups (municipalities) within a LLM may however have
different characteristics affecting their propensity to become entrepreneurs. To take this into
account, we conjecture that individuals sort in different municipalities on the basis of their
initial wealth and include dummy variables for the richest and the poorest municipalities
within the LLM. This is again similar to Bertrand, Luttmer and Mullainathan (2000). They
infer an individual’s network from the availability of contacts with individuals speaking the
same language, and control for group heterogeneity including language group fixed effects.
We recognize that the dummies for the richest and poorest municipalities are very likely
to fall short of capturing group heterogeneity across municipalities. To address, this problem
we use instruments for our proxies of entrepreneurial activity and include extensive
municipality and individual level controls that we describe in Section 3.4.
In selecting the instruments, we follow the methodology suggested by Case and Katz
(1991), and followed, among others, by Cutler and Glaeser (1997) and Duflo and Saez (2002).
We identify some instruments that are not expected to directly affect the individual decision
to become an entrepreneur, but that do affect entrepreneurial activity, without being affected
by it. We use two instruments that we believe to satisfy these criteria: the proportion of

15
pensioners who are members of the state church6 and the proportion of individuals who voted
for right-wing parties in the early 1980s.
Since in principle municipality culture, and therefore religious beliefs and political
orientation, could be affected by entrepreneurial activity, we use predetermined proxies for
cultural values. Even if we use current pensioners’ religious beliefs, these are most often
lifetime beliefs, and are therefore extremely unlikely to be affected by the current level of
entrepreneurial activity.
Our instruments are unlikely to be jointly determined with the current level of economic
activity (for instance because they are both related to entrepreneurial activity in the early
eighties) for the following reason. During the 1980s and early 1990s, Sweden underwent
profound economic transformation. It experienced a banking crisis followed by widespread
bankruptcies, a major tax reform in 1990-91 and the dissolution of the centralized wage-
setting arrangements, which significantly modified Swedish industrial structure (Davis and
Henrekson, 2004). Much of the entrepreneurial activity we observe in our sample was
initiated because of this process. Cultural values in the early 1980s can thus be considered
exogenous with respect to the current level of entrepreneurial activity.
We conjecture that our instruments can explain the current level of entrepreneurial
activity for the following reasons. First, in Sweden, left-wing parties have generally favored
the expansion of the public sectors and large established companies (Hogfeldt, 2004). A high
fraction of votes for right-wing parties in the early eighties may be related to the aversion
towards large companies and public sector and to the prestige attributed to self-employment.
This may have affected the attitude towards entrepreneurial activity once institutions became
more favorable to it. Similarly, as Weber (1905) first argued, religious beliefs are associated
with different economic attitudes. More recently, Barro and McCleary (2003) and Guiso,
Sapienza and Zingales (2003) find that religion is positively associated with economic
performance attitudes that are conducive to market-oriented institutions. Religiosity may thus
create positive attitudes towards entrepreneurial activity.
The first-stage regression (which uses the proportion of entrepreneurs in the population
as dependent variable) we report below shows that our instruments have indeed high
explanatory power for entrepreneurial activity:
6 In Sweden, individuals who are members of evangelical churches are generally also members of the state church.

16
(15.40) (16.71) (26.45)1982
2
- -0.24 0.27 0.20
0.42 1442.
tt
Entrepreneurs Pensioners member of state church Right wing votesPopulation Pensioners Total Votes
RNumber of observations
⎛ ⎞ ⎛ ⎞ ⎛ ⎞= + +⎜ ⎟ ⎜ ⎟ ⎜ ⎟⎝ ⎠ ⎝ ⎠⎝ ⎠
==
We show more formally in Tables 3 to 5 that the F test of the regression of our variable
of interest on the instruments is always strongly statistically significant, even after controlling
for the control variables we include in estimating the probability that an individual becomes
an entrepreneur, entrepreneurial profits and investment. Hence, we do not have to worry about
possible inconsistency problems arising in instrumental variable estimation when the
correlation between the instruments and the endogenous explanatory variable is weak, as
Bound, Jaeger and Baker (1995) suggest.
Still, these instruments are valid to assess the importance of peer effects only if they do
not directly affect the individual decision to become an entrepreneur and are not correlated
with unobserved determinants of the individual decision (see Duflo and Saez, 2002 for a
similar argument). We are confident that our instruments are valid for the following reasons.
First, we are able to control for roughly the corresponding individual cultural traits. We do
observe whether an individual is part of the state church, and therefore we can control for the
fact that individual religious beliefs can directly affect the choice to become an entrepreneur.
Additionally, we can control for individual income and wealth, which are highly correlated
with the decision to vote for right-wing parties. Finally, we can control for factors affecting
labor demand which could be affected by a rightist local administration, such as the
proportion of individuals employed in the public sector and the rate of unemployment.
Second, and most importantly, in Section 4 we perform tests of over-identifying
restrictions. These tests never allow us to reject the null that our instruments do not have a
direct effect on the probability of becoming an entrepreneur, entrepreneurial profits and
investment.
3.4 Control variables
Besides including LLM fixed effects and dummies for the richest and poorest
municipalities, we control for many individual and municipality characteristics that can affect

17
the decision to become an entrepreneur, entrepreneurial profits or investment, as suggested by
our simple model or by previous studies.
Panel A of Table 2 summarizes the individual characteristics. These are:
1. The logarithm of the salary received by an individual (LABOR INCOME) and the
logarithm of the income of the other members of the household (INCOME OF OTHER
HH MEMBERS), both measured the year before the occupational choice. These variables
proxy for how remunerative the status of employee is for an individual, and the resources
available to the household. While an increase in the non-entrepreneurial income is
expected to decrease the probability of an individual becoming an entrepreneur, the
income of the other household members may have a positive effect because more
resources are available to set up a new business.
2. EXPERIENCE is a dummy variable that takes value 1 if an individual has been self-
employed for more than one year and zero otherwise.
3. A dummy variable that takes value 1 if the individual earn less than 80 percent of the
income from the entrepreneurial activity, and zero otherwise (PART_TIME). This
variable takes into account that an individual may have lower entrepreneurial income
because she is only involved part-time in the entrepreneurial activity.
4. The logarithm of wealth (WEALTH) and the square of the logarithm of wealth
(WEALTH^2) of an individual’s household. These variables have been included because
wealthy individuals are less likely to be subject to liquidity constraints that keep them
from starting a business (Evans and Jovanovic, 1989, and Holtz-Eakin, Joulfaian and
Rosen, 1994). We also include the quadratic term because individuals who are already
very wealthy may not have an incentive to undertake the entrepreneurial activity.
5. The logarithm of the ratio of liquid assets, including securities and bank accounts, to total
wealth (SHARE OF LIQUID ASSETS IN HH WEALTH), which takes into account that
only the most liquid assets may be available to fund a new business.
6. The individual age (AGE) and its square (AGE^2), which are commonly believed to be
negatively correlated with risk aversion (Evans and Leighton, 1989), and should therefore
be negatively related to the probability of an individual setting up her own business.
7. A dummy equal to 1 for men (MALE), to account for possible gender differences.
8. A dummy equal to 1 for married individuals (MARRIED), a dummy equal to 1 for
divorced individuals (DIVORCED), the logarithm of the number of children in the
household (NUMBER OF CHILDREN), a dummy equal to 1 if either the number of
children or the marital status changed in the last year (CHANGES IN FAMILY

18
STRUCTURE). These variables may be related to the risk aversion of an individual
because they proxy for the responsibility an individual has towards the household (Evans
and Leighton, 1989). Moreover, individuals whose status recently changed may have a
stronger need for extra resources. This may affect their willingness to start a new business.
9. A dummy variable equal to 1 if an individual is an immigrant (IMMIGRANT); and,
similarly, a dummy variable equal to 1 if an individual changed municipality during the
last year (MOVER) and a dummy equal to 1 if an individual was unemployed the year
before starting the entrepreneurial activity (UNEMPLOYED).
10. The wage premium or discount (WAGE PREMIUM) an individual receives, once the
observable characteristics of the individual and of her job have been taken into account.
This variable has been computed as the residual of the regression of the individual’s salary
on her age and its square, the variables regarding the family status mentioned before, a
dummy equal to 1 for immigrants, a dummy equal to 1 for individuals with a handicap, a
dummy equal to 1 for individuals who are recorded to be unemployed.
11. A dummy equal to 1 for individuals who are members of the state church (CHURCH).
Panel B of Table 2 summarizes the municipality characteristics from Market Manager
and Statistics Sweden that we use to capture any characteristics of an individual’s social
group which are not accounted by the richest and poorest municipality dummies. These are
the following:
1. The level of unemployment in a municipality (UNEMPLOYMENT RATE) and the
proportion of public employees in the population (PROPORTION OF PUBLIC SECTOR
EMPLOYEES). This account for the labor market status of individuals in a given
municipality. To this extent it provides important information on the characteristics of the
social group.
2. The proportion of unemployed enrolled in entrepreneurship programs (PROPORTION OF
UNEMPLOYED IN ENTREPRENEURSHIP PROGRAMS), which is obviously
expected to have a positive effect on the decision to become an entrepreneur.
3. The proportion of employment in the financial sector (PROPORTION OF FINANCIAL
SECTOR EMPLOYEES), which proxies for differences in access to capital across
municipalities. Although this variable is endogenous, and a more developed financial
sector may certainly depend on higher demand for financial services in municipalities
with more entrepreneurs, we include it as a control variable because we know that the rate

19
of firm creation is positively affected by financial development (see, for instance, Guiso,
Sapienza and Zingales, 2004). If we did not control for this variable, one of the reasons
the stock of entrepreneurs in a municipality may help explain occupational choices could
be the greater availability of financial services.
4. The share of the top five industries in local employment to the share of the top five
industries in national employment (SPECIALIZATION), which provides a measure of
specialization of the municipality. This variable proxies for the existence of dynamic
externalities (Glaeser et al., 1992), which may increase productivity in areas that
specialize in few sectors, and could have an independent effect on the choice to become
an entrepreneur.
5. The number of firms per employee incorporated in a municipality relative to the number
of firms per employee in Sweden (COMPETITION).7 This variable measures average
firm size in a municipality, and has been used as a proxy for competition in the labor
market (Glaeser et al., 1992). In our case, this variable also helps to control for
competition in the product market that may drive down profits and affect the decision to
become self-employed.
6. Per capita income (INCOME PER CAPITA) and per capita wealth tax (WEALTH TAX
PER CAPITA). Both variables proxy for the availability of funds in a given social group.
7. Entrepreneurial entry (ENTRY RATE) and exit rates (EXIT RATE), which control for
differences in firm dynamics that can influence our results. If, in municipalities with a
high proportion of entrepreneurs, more firms die and are replaced by new ones, we could
observe a positive correlation between the individual decision to become an entrepreneur
and the proportion of entrepreneurs in a municipality. This, however, would not indicate
either knowledge spillovers or social norms but would simply be related to firm dynamics.
By controlling for firm birth and exit rates, we overcome this problem.
Additionally, we include two education-group fixed effects (for individuals with high
school diplomas and university education, respectively) to capture systematic differences
across individuals with different educational achievements, 11 sectoral dummies, which refer
to the sector in which an individual is employed, and four year dummies. Finally, as we
explained discussing our identification strategy, we include 108 fixed effects capturing
7 The number of firms incorporated in a municipality differs from the number of self-employed, because in many cases firms are not incorporated.

20
systematic differences across LLMs and dummies for the richest and poorest municipalities
within a LLM. 8
4. Results
4.1 The decision to become an entrepreneur
We present estimates of the probability that an individual becomes an entrepreneur
using a probit model, a linear probability model, and two-stage least squares. In all the
specifications except the probit model, we include 108 LLM fixed effects. When using the
probit model, which notoriously creates problems when fixed effects are included, we include
only 7 regional dummies.
Table 3 presents the parameter estimates. Results show that individual and aggregate
occupational choices are correlated: The proportion of entrepreneurs in a social group
(municipality) has a positive and significant effect on the probability of an individual
becoming an entrepreneur.
Results are qualitatively similar when we use only one of the two available instruments
and for the alternative measures of entrepreneurship. Interestingly, the marginal effect of the
proxy for entrepreneurial activity is similar in the probit model –when LLM fixed effects are
not included– and in the linear probability model. Our results are also confirmed by the use of
the third variable measuring entrepreneurial activity: We check whether for individuals in the
three lowest quartiles of income distribution the decision to become an entrepreneur is
affected by the proportion of entrepreneurs in the highest quartile. We find that indeed this is
the case.
Since we control for LLM fixed effects, the positive correlation between individual and
aggregate occupational choice cannot be due to differences in entry costs, labor market
conditions or other omitted economic factors. We can interpret our estimates of the coefficient
of the variable that measures the level of entrepreneurial activity as evidence in favor of peer
effects if we believe that our instruments are not correlated with any omitted individual or
social group (municipality) characteristics that could have an independent effect on
occupational choices. We are confident that this is so because we control for a long list of
individual and municipality characteristics. Most importantly, we test over-identifying
8 In other specifications, we also control for other municipality characteristics including proxies for firm performance and population density, and a variable ranging from 1 to 6 that measures the individual educational level more precisely than the fixed effects. Since these variables are not statistically significant and do not affect the coefficients of the other explanatory variables, we do not report the results.

21
restrictions using Hansen’s J-statistics. We can never reject the null hypothesis that the
instruments do not have a direct impact on the choice of becoming an entrepreneur with
approximately 10 percent confidence level. As we discuss below the probability that the null
hypothesis is true is even higher in our favored specifications.
Peer effects appear significant also from an economic point of view. One standard-
deviation increase in the proportion of entrepreneurs in a municipality increases the
probability of an individual becoming an entrepreneur by approximately 0.27 percentage
points in the two-stage least squares estimates when we use the proportion of entrepreneurs
and the proportion of entrepreneurs with a given educational achievement as measures of
entrepreneurial activity (our favored specifications). The economic magnitude is larger when
we use the proportion of entrepreneurs in the top quartile of the income distribution. In this
case, a one-standard deviation increase in the proxy for entrepreneurial activity increases the
probability that an individual becomes an entrepreneur by 0.72 percentage points.9
Our specification tests for the quality of instruments however suggest that the more
conservative estimates based on the proportion of entrepreneurs are more reliable. In fact,
when we use the proportion of entrepreneurs in the top quartile of income distribution, our
instruments are weak according to the Bound –Jaeger-Baker test. Additionally, the test for
over-identifying restrictions suggests that the probability that the instruments have no direct
impact on the entrepreneurial profits is slightly lower than 10 percent.
Some of the control variables also provide interesting information. Individuals who
perceive a high wage premium, high salaries or are part of households whose members earn
high incomes are less likely to become entrepreneurs. As expected, wealth increases the
probability of any individual becoming an entrepreneur because liquidity constraints are less
likely. Surprisingly, the individual employment status has no effect on the decision to become
an entrepreneur and unemployed individuals are even less likely to become entrepreneurs if
they belong to high unemployment social groups.
Municipality characteristics, other than those proxying for entrepreneurial activity, have
a marginal impact on the decision to become an entrepreneur suggesting that individual level
controls capture most of the heterogeneity in the population within the LLM.
9 The magnitude of the effect is similar if we use the whole sample instead of only the individuals in the lowest three quartiles of income distribution. This suggests that the larger impact is due to the different proxy for entrepreneurial activity and not to the different sample.
22
4.2 Entrepreneurial profits and investment
In analyzing the determinants of entrepreneurial profits, we take into account that
individuals self-select into the entrepreneurial activity. Therefore, we use a two-stage
Heckman procedure. In the first stage, we estimate the probability of individual i being an
entrepreneur, using a specification similar to the one that we use to estimate the probability of
individual i becoming an entrepreneur. To correct the bias due to self-selection, we use the
first-stage estimates to compute the Mills’ ratio. In the second stage, we include the inverse
Mills’ ratio in the equation for the individual profits, together with our main variable of
interest, capturing social interactions, and control variables that pick up heterogeneity in
individual and social groups characteristics expected to influence entrepreneurial profits.10 We
estimate the profits equation both by ordinary least squares and two-stage least squares.
The results are presented in Table 4. The first stage estimates hold no surprises: The
probability of an individual being an entrepreneur has largely the same determinants of the
probability of an individual becoming an entrepreneur. The only difference is that this time
we include also a dummy that takes value 1 if the individual was also an entrepreneur the
previous year in the equation. The inverse Mills’ ratio enters significantly into the second
stage regression for entrepreneurial profits, indicating that there is self-selection.
The results that emerge from the second stage regression are striking: Individuals who
belong to more entrepreneurial social groups earn lower profits.11 A one-standard deviation
increase in the proportion of entrepreneurs (the proportion of entrepreneurs with a given
educational achievement in the social group) decreases entrepreneurial profits by slightly
more than 10 percent. Also in this case, the effect is more pronounced when we use the
proportion of entrepreneurs in the top quartile of income distribution as a proxy for
entrepreneurial activity: A one-standard deviation increase in the proxy is associated with a 35
percent decrease in the entrepreneurial profits of the individuals in the three lowest quartiles
of income distribution.12 Also in this case, however, our specification tests for the quality of
instruments suggest that the more conservative estimates based on the proportion of
entrepreneurs are more reliable. The specification tests for the first two proxies for 10 The system is identified because in the second stage we do not include the individual’s salary and the income of the other household members, which should be unrelated to the productivity of the entrepreneurial activity. 11 Entrepreneurial income is often underreported for tax reasons. However, this does not affect our results because we compare entrepreneurial income in different locations, not entrepreneurial income with employees’ wages.

23
entrepreneurial activity suggest that according to the Bound –Jaeger-Baker test our
instruments are strong. Most importantly, we cannot reject the null that the instruments have
no direct impact on the entrepreneurial profits. When we use the proportion of entrepreneurs
in the top quartile of income distribution, however, our instruments are weak according to the
Bound–Jaeger-Baker test. Additionally, the test for over-identifying restrictions suggests that
the probability that the instruments have no direct impact on entrepreneurial profits is slightly
lower than 10 percent.
It is important to note that our results do not depend on the fact that there may be more
part-time entrepreneurs in some municipalities, as the coefficient of our variable of interest
remains negative and significant when we control for the share of individual income earned in
the entrepreneurial activity (either by including a dummy for part-time entrepreneurs or
controlling for the share of income earned from the entrepreneurial activity).
These findings are compatible with the existence of social norms, which drive the
decision to start a new business. They could not be explained by stronger competition in the
labor or the product market in municipalities where there are more entrepreneurs. First, the
relevant market to measure competition is the LLM. The LLM fixed effects should thus
control for differences in the competitive environment. Additionally, we include a variable
measuring the number of firms per employee in a municipality relative to the number of firms
per employees in Sweden, which Glaeser at al. (1992) use as a proxy for competition. This
variable is indeed negative and significant, and should capture the effect of competition on
profits.
The result that entrepreneurial profits are lower in municipalities where the
entrepreneurship rate is higher is not completely surprising in the light of some recent papers
suggesting that the non-pecuniary benefits of self-employment are substantial. Moskovitz and
Vissing-Jorgensen (2002), for instance, show that entrepreneurs largely under-diversify their
portfolios investing in their own businesses, and the returns they enjoy on their
entrepreneurial activities are too low to justify their behavior. As a consequence, they expect
entrepreneurs to enjoy large non-pecuniary benefits. Along the same line, Hamilton (2000)
finds that entrepreneurs enter and persist in business despite the fact that they have both lower
initial earnings and lower earnings growth than they would as employees. In this respect, our
12 Also in this case, the magnitude of the effect is similar if we use the whole sample instead of only the individuals in the lowest three quartiles of income distribution. This suggests that the larger impact is due to the different proxy for entrepreneurial activity and not to the different sample.
24
contribution is to show that the importance of non-pecuniary benefits may vary substantially
across social groups.
To further check our interpretation of the empirical evidence, we analyze
entrepreneurial investment, which we observe for a subsample of entrepreneurs. We analyze
how entrepreneurial activity is related to entrepreneurial investment similarly to what we do
for entrepreneurial profits. We conjecture that if peer effects increase the utility from
entrepreneurial activity, individuals in high entrepreneurship municipalities invest more, even
if ceteris paribus they earn lower profits than entrepreneurs in other municipalities. We
control for the return to entrepreneurial activity by including entrepreneurial profits.
Additionally we take into account that individuals self-select into the entrepreneurial activity
by using a two-stage Heckman procedure (as we did for entrepreneurial profits).
Our conjecture is confirmed in Table 5 when we instrument our proxy for
entrepreneurial activity. Overall, it appears that entrepreneurial investment is larger when peer
effects are stronger. A one-standard deviation increase in the proxy for entrepreneurial
activity is associated with an almost 30 percent increase in investment.
These findings provide important insights for the reasons why peer effects matter. As
we argue above, since we control for LLM fixed effects our results cannot be interpreted as
the consequence of differences in entry costs across areas. Yet social interactions within the
municipality could generate valuable information on how to start a business. This information
could lower the (fixed) entry cost without increasing the productivity in the entrepreneurial
activity (entrepreneurial profits are lower in higher entrepreneurship municipalities).
Differences in entry costs however cannot explain why individuals invest more if they are
surrounded by entrepreneurs. Less productive entrepreneurs who start a business in
supposedly low-entry cost municipalities should invest less, not more than similar
entrepreneurs. Non-pecuniary benefits from entrepreneurial activity deriving from peer effects
can instead explain our findings on both entrepreneurial profits and investment.
5. Robustness and alternative explanation
5.1 Sorting
One possible problem with the estimates we presented so far is that entrepreneurs or
potential entrepreneurs may move to municipalities that are more favorable to entrepreneurial
activity. In this case, the positive correlation between individual and aggregate occupational
choices could be biased.

25
We can test whether sorting of individuals more prone to entrepreneurial activity can
explain our results by looking at movers: We find that individuals who move to municipalities
with more entrepreneurs are not more likely to become entrepreneurs than similar individuals
(as suggested by the insignificant coefficient of the variable obtained interacting the mover
dummy with the proportion of entrepreneurs in the destination municipality in Panel A of
Table 6). The result does not depend on the time horizon we choose for identifying movers.
The coefficient of the interaction variable continues to be insignificant if we define as movers
individuals who moved between 1 and 3 years before.
Furthermore, in Panel B of Table 6, we analyze individual moving decisions. We find
that entrepreneurs are always less likely to move. Most importantly, individuals who are not
entrepreneurs are more likely to move to higher entrepreneurship municipalities than are
entrepreneurs. Overall, the evidence does not support the possibility that individuals who are
inclined to become entrepreneurs or are already self-employed sort in municipalities where
there are more entrepreneurs.
5.2 Young people’s entrepreneurial choices
To further understand why the level of entrepreneurial activity affects individual
occupational choice, we analyze the occupational choice of young people, whose age range
between 18 and 30 in 1995. For this subsample, we are able to observe the capital profits of
the parents. This is a good proxy for family wealth and an imperfect proxy for whether an
individual’s parents were involved in entrepreneurial activity. We can thus test whether social
interactions within the municipality still matter after controlling for the fact that an individual
may have inherited a business or received loans and transfers from the parents.
The young people subsample also allows us to further check the quality of our
instruments. Our identification strategy so far has relied on the fact that, thanks to the large
institutional changes that affected Sweden during the 1980s, differences in culture in the early
1980s are predetermined with respect to the current level of entrepreneurial activity.
Entrepreneurial activity was without doubt a much less common phenomenon in the early
1980s. However, there may have been some preexisting differences in entrepreneurial activity
that affected the local culture. Also, if individuals persist in entrepreneurial activity, some of
the entrepreneurial activity we observe nowadays may have affected the local culture.
Our instruments, however, are certainly exogenous with respect to the occupational
choices of young individuals who were not part of the labor force in the early 1980s. We re-

26
estimate both our equations of interest considering only the level of entrepreneurial activity
among young people and how this affects other young people’s occupational choices and
entrepreneurial profits.
Table 7 shows that our main results are qualitatively unchanged: Entrepreneurial
activity has a positive (negative) effect on the probability of becoming an entrepreneur
(entrepreneurial profits) as we find in Section 4.13 Family wealth, as proxied by the capital
income of the parents, does not have a significant effect on the decision of becoming an
entrepreneur. It is however negatively related to entrepreneurial profits, suggesting that
wealthy individuals may enjoy higher utility from the entrepreneurial activity. This finding is
consistent with Hurst and Lusardi (2004) who argue that being an entrepreneur may be a sort
of luxury good.
5.3 Informal credit markets
The estimates reported in Section 4 and the tests of over-identifying restrictions allow
us to exclude that our instruments have an effect on the decision of becoming an entrepreneur,
entrepreneurial profits and investment that does not pass through the level of entrepreneurial
activity. We can also exclude that the level of entrepreneurial activity affects the decision to
become an entrepreneur because it increases the profits of entrepreneurial activity. However,
the reasons why peer effects affect entrepreneurial activity might not be necessarily non-
pecuniary as we implicitly assumed so far. In high entrepreneurship municipalities, social
networks might favor informal credit markets, which facilitate entry and investment for less
profitable entrepreneurs.
To explore this possibility, we use data from Market Manager. We examine the capital
structure of firms that have less than 50 employees and less than SEK 1,000,000
(approximately USD 130,000) in assets. If our results were driven by the availability of cheap
informal credit, small firms, incorporated in municipalities where entrepreneurial activity is
higher, should use more trade credit and other informal loans.
To explore this possibility we investigate how firms finance their assets distinguishing
among loans from financial institutions, trade credit, and other loans. We also look at how
much trade credit firms grant. If informal loans help to spur entrepreneurial activity, we
13 The economic effect of the proxy for entrepreneurial activity on the probability of becoming an entrepreneur is only 0.19 percentage points. The effect on the income is however larger in this subsample. A one-standard deviation increase in entrepreneurial activity is associated with a 40 percent decrease in income.
27
should observe that small firms receive and grant more trade credit, and fund their assets with
loans that are not granted by financial institutions to a larger extent in municipalities with
higher level of entrepreneurial activity.
The estimates reported in Table 8 show that our proxy for entrepreneurial activity is not
related to the firm financial ratios neither in ordinary least squares nor in 2SLS regressions. If
anything, firms in high entrepreneurship municipalities grant less trade credit. This casts
doubts on the importance of informal credit markets and supports the interpretation that peer
effects matter because they affect the desirability of entrepreneurial activity.
5.4 Over-confidence
In principle our findings that some individuals have lower profits from entrepreneurial
activity and at the same time invest more could be explained by the fact that they are
overconfident. In this case, our instruments should capture an omitted characteristic of the
individual –over-confidence—and using Manski’s (1993) terminology, the correlation we
observe would be due to correlated effects.
The tests of over-identifying restrictions however allow us to exclude this possibility
with a reasonably high level of confidence.14 This implies that we can exclude that our
instruments are related to an omitted factor which is not included in the regression. Religiosity
and political orientation enter in the equation only through the level of entrepreneurial
activity. Hence it is the very fact that some individuals are entrepreneurs to affect the
individual occupational choice and the outcome of the entrepreneurial activity.
The level of entrepreneurial activity however could create herding problems similarly to
Bernardo and Welch (2001): Some individuals observing high level of entrepreneurial activity
may revise upward (downward) their expectations on entrepreneurial profits (effort) and thus
be more likely to become entrepreneurs. In this respect, high level of entrepreneurial activity
would endogenously generate over-confidence. Social interactions would increase the utility
from entrepreneurial activity without affecting the actual profitability (effort).
We view this as a non-pecuniary effect of social interactions, similar to desire for
conformity or prestige. We are unable to fully distinguish between these effects. We can
provide however time-series evidence suggesting that social interactions are unlikely to
generate over-confidence. Individuals should have become particularly over-confident in the
14 We can definitively exclude that our instruments have a direct impact on the dependent variable when we use the proportion of entrepreneurs and the proportion of entrepreneurs with a given educational achievement.

28
late 1990s, during the high-tech boom, when the number of IPOs dramatically increased and a
lot of entrepreneurs made fortunes. Potentially, in areas with more successful entrepreneurs,
some individuals may have over-estimated their expected profits from the entrepreneurial
activity, and decided to become entrepreneurs. In this case, our results should be driven by the
correlation between individual and aggregate occupational choices in the second part of the
sample (1998-2000). In fact, the results for the subperiods 1996-1997 and 1998-2000 are
similar to the ones we report. This suggests that herding phenomena are unlikely to explain
our findings.
5.5 Further robustness checks
Our results are robust to a number of modifications of the equations we present. For
instance, we have checked whether the definition of entrepreneurship is a key determinant of
our results. In fact, it is not. The estimates remain qualitatively invariant if we define as
entrepreneurs only the individuals for whom at least 30 percent of the income comes from
entrepreneurial activity.
To gauge better understanding of why entrepreneurial activity matter, we explore the
mechanism through which social interactions and social norms should operate. If social norms
indeed matter, individuals are expected to imitate the occupational choice of the individuals
they more often interact with. Our proxies for entrepreneurial activity capture closer and more
frequent interactions, especially in less densely populated communities. Therefore, if the
parameter estimates of our variable of interest are due to social interactions, we expect our
results to be stronger in less densely populated LLMs. If, instead, our results depend on the
failure of appropriately controlling for social group heterogeneity we would expect the
correlation between the proxies for entrepreneurial activity and our variable of interest to be
stronger for the more densely populated LLMs, which correspond to the larger urban areas
(Stockholm, Göteborg, Malmö and Uppsala). In this case, in fact, a LLM includes more
municipalities and the LLM and richest and poorest municipalities fixed effects may capture
social group heterogeneity to a lesser extent.
To test whether this is the case, we separate the municipalities that belong to urban areas
from non-urban municipalities, where approximately two-thirds of the individuals represented
in our sample live. We re-estimate the two equations of interest by interacting our proxy for
entrepreneurship with two dummies, one equal to 1 for urban areas and the other equal to 1
for non-urban areas. We find that the effect of the variable proxying for social interactions on

29
the decision to become an entrepreneur is positive and significant for both urban and non-
urban areas. However, only in non-urban municipalities, entrepreneurial profits is negatively
related to the proxy for entrepreneurial activity. Hence entrepreneurs seem to enjoy non-
pecuniary benefits by conforming to other individuals’ choices only where we expect peer
effects to be stronger (in the non-urban LLMs in central and Southern Sweden that have more
than one municipality).
Finally, we have tried to remove subsets of the control variables, and, in particular, the
education and LLM fixed effects, and firm entry and exit rates. None of these robustness
checks produces results that are significantly different from the ones we report. This increases
our confidence that our results are not due to omitted variable bias. If unobservable
characteristics about individuals or municipalities drove our results, one would expect that
increasing the set of unobservable characteristics by treating observable characteristics as
unobservable would have a large impact on the estimate of the social interaction term. In fact,
the estimates are almost invariant.
6. Conclusions
This paper shows that occupational choices do not have only economic determinants.
Peer effects appear to play a significant role in the individual decision to become an
entrepreneur. Additionally, individuals who belong to more entrepreneurial social groups earn
lower entrepreneurial profits and invest more. This suggests that peer effects influence
individual utility from entrepreneurial investment.
Alternative explanations, such as agglomeration economies or knowledge spillovers that
could also generate a correlation between individual and aggregate occupational choices do
not find support in the data. In these cases, a high entrepreneurship rate would be positively
correlated with entrepreneurial productivity. Instead, we find that entrepreneurial profits are
lower in municipalities where entrepreneurial activity is higher suggesting that private
benefits of entrepreneurial activity may be higher there.
Our results indicate that cultural values may have an indirect effect on economic
decisions. We find that in religious communities, there are more entrepreneurs, and for this
reason an individual is ceteris paribus more likely to choose the entrepreneurial activity. This
suggests that social capital measures that have been shown to be related to economic
performance (Knack and Keefer, 1997) and financial decisions (Guiso, Sapienza, and
Zingales, 2004), may matter because generate peer effects (individuals who trust others buy

30
more stocks and are imitated because of peer effects by non-trustful individuals) rather than
only because of a direct effect of trust on economic choices. In this respect, small differences
in social capital or cultural values may lead to dramatic differences in economic outcomes.
We believe that this is an interesting topic for future research.
Appendix
Solution of the occupational choice model
To solve the model, we first determine the optimal investment of an individual who has
chosen the entrepreneurial activity. Hence we solve the following program:
max (1 )Ei ig ir i iI
U A I Iγσ= + − .
The first order condition is:
1 11ir i
ig
A I γγσ
− =+
.
If there were no social norms ( gσ =0), entrepreneurs would maximize profits and equate
the marginal utility of investment to its marginal cost: 1 1ir iA I γγ − = . The term 1 igσ+ indicates
the extent of over-investment which is increasing in the strength of the social norm ( igσ ).
An individual chooses to become an entrepreneur if *( ) .Ei i rU I w≥ Since
*( ) 0Ei i
r
U Ia
∂>
∂,
more individuals will choose to become entrepreneurs in locations with stronger
agglomeration economies. Additionally, *( ) 0
Ei i
ig
U Iσ
∂>
∂. Hence more individuals become
entrepreneurs in social groups that value the entrepreneurial activity more highly.
Since the extent of over-investment is larger for individuals who belong to social groups
that value entrepreneurial activity more, their entrepreneurial profits are lower.

31
References
Aldrich, Howard E. (2003), Entrepreneurship, Forthcoming in Handbook of Economic Sociology, Neil Smelser and Richard Swedberg eds., Princeton University Press.
Balazs, Etienne (1964), Chinese Civilization and Bureaucracy: Variations on a Theme, New Haven,
Conn.: Yale University Press. Barro, Robert J. and Rachel M. McCleary (2003), Religion and Economic Growth, NBER W.P. No.
9682. Baumol, William (1990), Entrepreneurship: Productive, Unproductive and Destructive, Journal of
Political Economy 98, 893-921. Bernardo, Antonio E. and Ivo Welch (2001), On the Evolution of Overconfidence and
Entrepreneurs, Journal of Economics and Management Strategy 10, 301-330. Bernheim, B. Douglas (1994), A Theory of Conformity, Journal of Political Economy 102, 841-
877.
Bertrand, Marianne, Erzo F.P. Luttmer and Sendhil Mullainathan (2000), Network Effects and Welfare Cultures, Quarterly Journal of Economics 115, 1019-1055.
Bhidé, Amar (2000), The Origins and Evolution of New Businesses, Oxford, Oxford University
Press. Blanchflower, David G. (2000), Self-employment in OECD countries, Labour Economics 7, 471-
505. Blanchflower, David, Andrew Oswald and Alois Stutzer (2001), Latent Entrepreneurship Across
Nations, European Economic Review 45, 680-691. Borjas, George J. and Lynette Hilton (1996), Immigration and the Welfare State: Immigrant
Participation in Means-Tested Entitlement Programs, Quarterly Journal of Economics 111, 575-604.
Bound, John, David A. Jaeger, and Regina M. Baker (1995), Problems with Instrumental Variables
Estimation When the Correlation between the Instruments and the Endogenous Explanatory Variable is Weak, Journal of the American Statistical Association 90, 443-450.
Case, Anne C. and Lawrence F. Katz (1991), The Company You Keep: The Effects of Family and
Neighborhood on Disadvantaged Youth, NBER W.P. No. 3705. Cole, Harold L., George J. Mailath, and Andrew Postlewaite (1992), Social Norms, Saving
Behavior, and Growth, Journal of Political Economy 100, 1092-1125. Cutler, David M. and Edward L. Glaeser (1997), Are Ghettos Good or Bad?, Quarterly Journal of
Economics 112, 827-872.

32
Davis, Steven J. and Magnus Henrekson (2004), Wage-Setting Institutions as Industrial Policy, forthcoming Labour Economics.
Duflo, Esther and Emmanuel Saez, Participation and Investment Decisions in a Retirement Plan:
The Influence of Colleagues’ Choices, Journal of Public Economics 85, 121-148. Evans, David S. and Linda S. Leighton (1989), Some Empirical Aspects of Entrepreneurship,
American Economic Review 79, 519-535. Evans, David S. and Boyan Jovanovic (1989), An Estimated Model of Entrepreneurial Choice
under Liquidity Constraints, Journal of Political Economy 97, 808-827. Glaeser, Edward L., Hedi D. Kallal, José A. Scheinkman and Andrei Shleifer (1992), Growth in
Cities, Quarterly Journal of Economics 100, 1126-1152. Glaeser, Edward L., Bruce Sacerdote, and José A. Scheinkman (1996), Crime and Social
Interactions, Quarterly Journal of Economics 114, 502-548. Guiso, Luigi, Paola Sapienza, and Luigi Zingales (2004), The role of social capital in financial
development, American Economic Review 94, 526-556. Guiso, Luigi, Paola Sapienza, and Luigi Zingales (2003), People’s opium? Religion and Economic
Attitudes, Journal of Monetary Economics 50, 225-252. Guiso, Luigi, Paola Sapienza, and Luigi Zingales (2002), Does Local Financial Development
Matter?, forthcoming Quarterly Journal of Economics. Hamilton, Barton H. (2000), Does Entrepreneurship Pay? An Empirical Analysis of the Returns to
Self-Employment, Journal of Political Economy 108, 604-631. Hogfeldt, Peter (2004), The History and Politics of Corporate Ownership in Sweden, NBER W.P.
10641. Hong, Harrison, Jeffrey D. Kubik and Jeremy C. Stein (2004), Social Interaction and Stock Market
Participation, Journal of Finance 59, 137-163. Holtz-Eakin, Douglas, David Joulfaian and Harvey S. Rosen (1994), Sticking It Out:
Entrepreneurial Survival and Liquidity Constraints, Journal of Political Economy 102, 53-75. Hurst, Erik and Annamaria Lusardi (2004), Liquidity Constraints, Household Wealth and
Entrepreneurship, Journal of Political Economy 112, 319-347. Knack, Stephen and Philip Keefer (1997), Does Social Capital Have an Economic Payoff? A Cross-
Country Investigation, Quarterly Journal of Economics 112, 1251-1288. Manski, Charles F. (1993), Identification of Endogenous Social Effects: The Reflection Problem,
Review of Economic Studies 60, 531-542.
Moskowitz, Tobias J. and Annette Vissing-Jørgensen (2002), The Private Equity Premium Puzzle, American Economic Review 92, 745-778.

33
Murphy, Kevin M., Andrei Shleifer and Robert W. Vishny (1991), The Allocation of Talent:
Implications for Growth, Quarterly Journal of Economics 106, 503-530. Rauch, J. E. (1993), Productivity Gains from Geographic Concentration of Human Capital:
Evidence from the Cities, Journal of Urban Economics 34, 380-400. Schumpeter, J. (1934), The Theory of Economic Development, Harvard University Press,
Cambridge, Mass. Vlachos, Jonas (2004), Who wants political integration? Evidence from the Swedish EU-
membership referendum, Journal of Public Economics 88, 1589-1604. Weber, Max (1905), The Protestant Ethic and the Spirit of Capitalism, London: Unwin.

34
Table 1: Cross-municipalities differences in entrepreneurial activity The variable Entrepreneurship is the ratio of entrepreneurs to the population of a municipality; Entry rate is the ratio of new entrepreneurs relative to the number of entrepreneurs in a municipality; Exit rate is the ratio of entrepreneurs abandoning entrepreneurial activity to number of the entrepreneurs in a municipality. The following three rows present the proportion of entrepreneurs with a given education level to the total population of a municipality. The education level is indicated in the first column. Proportion of entrepreneurs in the top quartile is the proportion of entrepreneurs in the top quartile of the income distribution. Entrepreneurial income (investment) is the average income (investment) per entrepreneur within the municipality. The statistics employ observations for all municipalities from 1996 to 2000 (288 from 1996 to 1998, 289 from 1999 to 2000). All individuals aged between 18 and 60 who have some entrepreneurial income are classified as entrepreneurs. The population includes all individuals aged between 18 and 60. Farmers have been excluded.
Standard InterquartileEntrepreneurial activity Mean Median MinimumMaximum Deviation Range
Entrepreneurship 0.057 0.052 0.015 0.183 0.023 0.029
Entry rate 0.241 0.239 0.000 0.750 0.145 0.124Exit rate 0.224 0.204 0.000 0.600 0.144 0.149
Entrepreneurship by education level: Less than high school diploma 0.013 0.011 0.000 0.061 0.009 0.011
High school diploma 0.008 0.006 0.000 0.110 0.014 0.017University education 0.016 0.015 0.000 0.065 0.009 0.011
Proportion of entrepreneurs in the top quartile 0.053 0.050 0.000 0.188 0.027 0.030Entrepreneurial income (SEK 000) 103.81 99.43 14.48 444.35 29.81 24.72
Entrepreneurial investment (SEK 000) 1.46 0.65 0.00 37.50 2.73 1.63
Instruments Proportion of individuals older than 60 member of the state church 0.936 0.947 0.728 1.000 0.040 0.045
Proportion of votes for right-wing parties in 1982 elections 0.460 0.461 0.151 0.747 0.114 0.146

35
Table 2: Descriptive Statistics Panel A: Individual Characteristics
LABOR INCOME is the logarithm of the salary of individual i. INCOME OF OTHER HH MEMBERS is the logarithm of the income of the other household members. EXPERIENCE is a dummy variable that takes value one for individuals who were entrepreneurs both at time t and t-1 and zero otherwise. PART TIME is a dummy variable that takes value one if the individual earn less than 80 percent of the income from the entrepreneurial activity, and zero otherwise. WEALTH is the logarithm of the total wealth. SHARE OF LIQUID ASSETS IN HH WEALTH is the logarithm of proportion of individual wealth invested in bank accounts or securities. AGE is an individual’s age. MALE is a dummy variable that takes value 1 for males and zero otherwise. MOVER is a dummy variable that takes value 1 if the individual moved from a municipality to another during the previous year and zero otherwise. CHANGES IN FAMILY STRUCTURE is a dummy variable that takes value one if there have been any changes in family structure during the previous year and zero otherwise. NUMBER OF CHILDREN is the number of children. MARRIED is a dummy variable that takes value one if the individual is married and zero otherwise. DIVORCED is a dummy variable that takes value one if an individual is divorced and zero otherwise. UNEMPLOYED is a dummy variable that takes value one if the individual is unemployed and zero otherwise. IMMIGRANT is a dummy variable that takes value one if the individual is an immigrant and zero otherwise. The WAGE PREMIUM is the residual of a regression including individual age and its square, the variables regarding the family status mentioned before, a dummy equal to 1 for immigrants, a dummy equal to 1 for individuals with a handicap, a dummy equal to 1 for individuals who are recorded as unemployed, and finally dummy variables controlling for an individual’s education level, industry of employment, the occupation, and the seven Swedish macro-regions. CHURCH is a dummy variable that takes value one if the individual is member of the Church of Sweden and zero otherwise. All observations from 1995 to 2000 are included.
Standard InterquartileVariable Mean Median Minimum Maximum Deviation Range
LABOR INCOME 5.220 5.211 0.000 7.309 5.148 5.193INCOME OF OTHER HH MEMBERS 5.191 5.131 0.000 7.309 5.241 5.377EXPERIENCE 0.056 0.000 0.000 1.000 0.229 0.000PART TIME 0.035 0.000 0.000 1.000 0.184 0.000WEALTH 5.876 5.912 0.000 9.013 0.431 0.429SHARE OF LIQUID ASSETS IN HH WEALTH -1.209 -0.561 -6.695 0.777 1.796 1.261AGE 40.488 40.000 19.000 69.000 11.776 17.000MALE 0.494 0.000 0.000 1.000 0.500 1.000MOVER 0.093 0.000 0.000 1.000 0.290 0.000CHANGES IN FAMILY STRUCTURE 0.173 0.000 0.000 1.000 0.378 0.000NUMBER OF CHILDREN 1.111 1.000 0.000 12.000 1.184 2.000MARRIED 0.551 1.000 0.000 1.000 0.497 1.000DIVORCED 0.072 0.000 0.000 1.000 0.259 0.000UNEMPLOYED 0.135 0.000 0.000 1.000 0.342 0.000IMMIGRANT 0.096 0.000 0.000 1.000 0.295 0.000WAGE PREMIUM 0.011 0.035 -6.663 4.175 0.569 0.390CHURCH 0.824 1.000 0.000 1.000 0.381 0.000

36
Panel B: Municipality Characteristics PROPORTION OF UNEMPLOYED IN ENTREPRENEURSHIP PROGRAMS is the proportion of unemployed enrolled in entrepreneurship programs; UNEMPLOYMENT RATE is the rate of unemployment; PROPORTION OF FINANCIAL SECTOR EMPLOYEES is the share of employment in the financial sector; SPECIALIZATION is the share of employment in the five most important industries; COMPETITION is the number of firms per employee in the municipality relative to the number of firms per employee in Sweden; INCOME PER CAPITA is income per capita; WEALTH TAX PER CAPITA is wealth tax per capita.
Standard InterquartileVariable Mean Median Minimum Maximum Deviation Range
PROPORTION OF UNEMPLOYED IN ENTREPRENEURSHIP PROGRAMS 0.252 0.219 0.027 1.147 0.135 0.136UNEMPLOYMENT RATE 6.335 6.129 1.216 13.789 2.172 3.148PROPORTION OF FINANCIAL SECTOR EMPLOYEES 0.010 0.009 0.003 0.117 0.007 0.003SPECIALIZATION 0.451 0.438 0.341 0.706 0.066 0.078COMPETITION 1.960 1.944 0.703 3.561 0.503 0.644PROPORTION OF PUBLIC SECTOR EMPLOYEES 0.068 0.069 0.038 0.104 0.010 0.014INCOME PER CAPITA 156662 154339 600 340051 21467 22817WEALTH TAX PER CAPITA 1137 1030 300 6986 594 757
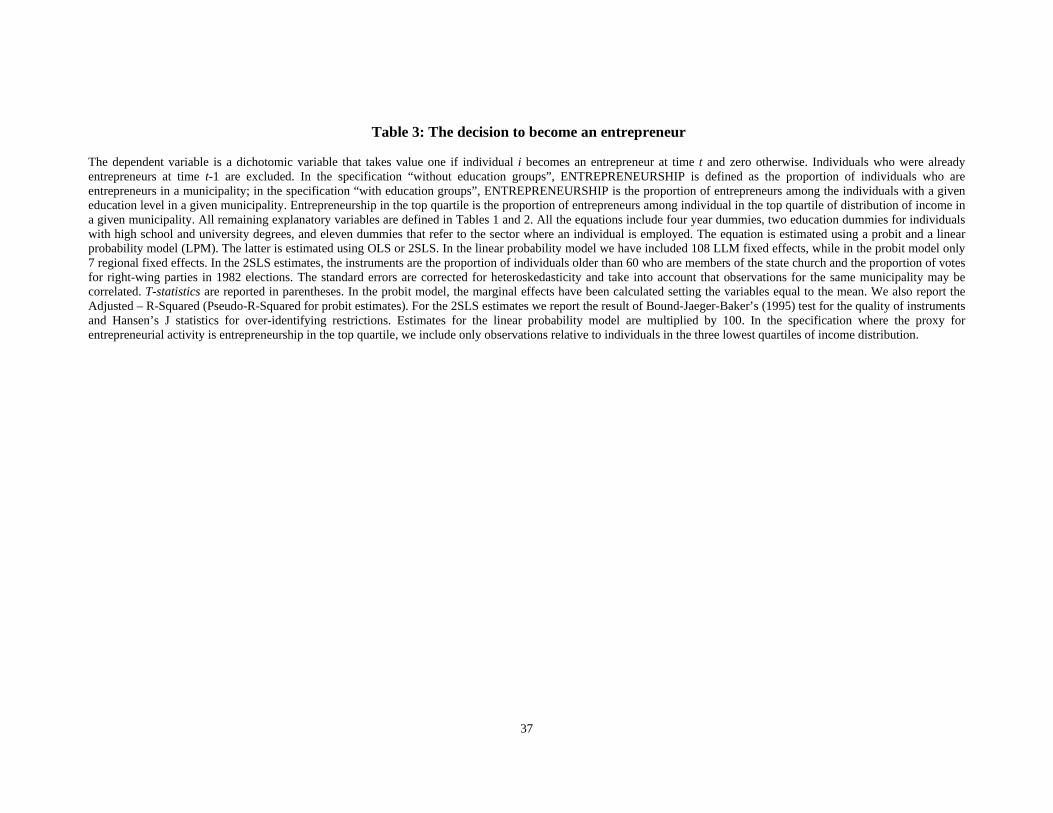
37
Table 3: The decision to become an entrepreneur The dependent variable is a dichotomic variable that takes value one if individual i becomes an entrepreneur at time t and zero otherwise. Individuals who were already entrepreneurs at time t-1 are excluded. In the specification “without education groups”, ENTREPRENEURSHIP is defined as the proportion of individuals who are entrepreneurs in a municipality; in the specification “with education groups”, ENTREPRENEURSHIP is the proportion of entrepreneurs among the individuals with a given education level in a given municipality. Entrepreneurship in the top quartile is the proportion of entrepreneurs among individual in the top quartile of distribution of income in a given municipality. All remaining explanatory variables are defined in Tables 1 and 2. All the equations include four year dummies, two education dummies for individuals with high school and university degrees, and eleven dummies that refer to the sector where an individual is employed. The equation is estimated using a probit and a linear probability model (LPM). The latter is estimated using OLS or 2SLS. In the linear probability model we have included 108 LLM fixed effects, while in the probit model only 7 regional fixed effects. In the 2SLS estimates, the instruments are the proportion of individuals older than 60 who are members of the state church and the proportion of votes for right-wing parties in 1982 elections. The standard errors are corrected for heteroskedasticity and take into account that observations for the same municipality may be correlated. T-statistics are reported in parentheses. In the probit model, the marginal effects have been calculated setting the variables equal to the mean. We also report the Adjusted – R-Squared (Pseudo-R-Squared for probit estimates). For the 2SLS estimates we report the result of Bound-Jaeger-Baker’s (1995) test for the quality of instruments and Hansen’s J statistics for over-identifying restrictions. Estimates for the linear probability model are multiplied by 100. In the specification where the proxy for entrepreneurial activity is entrepreneurship in the top quartile, we include only observations relative to individuals in the three lowest quartiles of income distribution.

38
Without education groups With education groups Entr. in top quartile Probit Estimate OLS estimates 2SLS estimates 2SLS estimates 2SLS estimates
Variable Estimate T-stat 100xME Estimate T-stat Estimate T-stat Estimate T-stat Estimate T-stat ENTREPRENEURSHIP 416.820 (26.22) 14.220 15.094 (17.97) 11.901 (7.53) 12.033 (7.57) 26.712 (3.62) Individual level controls INCOME OF OTHER HH MEMBERS -1.660 (-10.39) -0.060 -0.060 (-10.96) -0.060 (-10.97) -0.058 (-10.50) -0.060 (-10.95) LABOR INCOME -2.450 (-6.91) -0.080 -0.093 (-6.84) -0.093 (-6.83) -0.095 (-7.00) -0.093 (-6.83) WEALTH 1.760 (12.50) 0.060 -0.426 (-10.06) -0.427 (-10.07) -0.427 (-10.27) -0.431 (-10.00) WEALTH^2 -0.030 (-5.87) 0.000 0.093 (13.06) 0.093 (13.08) 0.093 (13.21) 0.094 (12.97) SHARE OF LIQUID ASSETS IN HH WEALTH 0.210 (1.19) 0.010 0.051 (7.71) 0.051 (7.69) 0.051 (7.72) 0.050 (7.42) AGE 5.780 (22.37) 0.200 0.166 (21.60) 0.166 (21.61) 0.156 (20.91) 0.166 (21.66) AGE^2 -0.060 (-19.99) 0.000 -0.002 (-19.21) -0.002 (-19.21) -0.002 (-18.52) -0.002 (-19.25) MALE 25.600 (39.54) 0.870 0.867 (37.08) 0.868 (37.11) 0.869 (36.97) 0.867 (37.25) MOVER 0.200 (0.12) 0.010 0.027 (0.49) 0.026 (0.48) 0.023 (0.42) 0.026 (0.46) CHANGES IN FAMILY STRUCTURE 1.410 (1.65) 0.050 0.063 (1.95) 0.063 (1.96) 0.062 (1.94) 0.064 (1.96) NUMBER OF CHILDREN 1.330 (4.35) 0.050 0.096 (7.96) 0.096 (7.98) 0.097 (8.19) 0.097 (8.01) MARRIED 7.220 (8.70) 0.250 0.238 (7.92) 0.238 (7.91) 0.240 (7.97) 0.243 (8.10) DIVORCED 1.400 (1.06) 0.050 0.074 (1.82) 0.074 (1.81) 0.084 (2.05) 0.080 (1.95) UNEMPLOYED -0.380 (-0.16) -0.010 0.010 (0.14) 0.005 (0.07) 0.001 (0.02) -0.005 (-0.07) IMMIGRANT -4.610 (-1.99) -0.160 -0.080 (-1.07) -0.077 (-1.02) -0.095 (-1.30) -0.046 (-0.58) WAGE PREMIUM -5.730 (-11.07) -0.200 -0.224 (-9.23) -0.224 (-9.24) -0.226 (-9.25) -0.224 (-9.21) CHURCH -1.360 (-1.55) -0.050 -0.092 (-2.91) -0.091 (-2.86) -0.096 (-3.02) -0.085 (-2.66) Municipal level controls DIVERSITY -1.370 (-0.23) -0.050 0.270 (1.55) 0.194 (1.00) 0.203 (1.06) 0.557 (1.43) COMPETITION 2.220 (2.77) 0.080 0.026 (0.89) 0.043 (1.42) 0.044 (1.43) 0.061 (1.11) UNEMPLOYMENT RATE -0.400 (-1.47) -0.010 0.000 (0.03) -0.019 (-1.28) -0.021 (-1.47) -0.022 (-0.79) PROPORTION OF UNEMPLOYED IN ENT. EDUCATION PROGRAMS 2.250 (0.63) 0.080 0.090 (0.88) 0.132 (1.27) 0.121 (1.17) 0.137 (0.81) SHARE OF EMPLOYED IN FIN SECTOR 31.920 (1.11) 1.090 1.454 (1.91) 2.025 (2.22) 1.871 (2.05) -1.777 (-0.86) PROPORTION OF PUBLIC EMPLOYEES 19.540 (0.56) 0.670 0.365 (0.30) -0.241 (-0.19) -0.331 (-0.27) -2.552 (-1.36) INCOME PER CAPITA 0.000 (-0.79) 0.000 -0.201 (-1.26) 0.147 (0.73) 0.147 (0.72) -0.192 (-0.35) WEALTH TAX PER CAPITA 0.000 (0.58) 0.000 0.180 (0.49) -0.709 (-1.37) -0.851 (-1.68) -2.808 (-3.59) UNEMPLOYMENT RATE * UNEMPLOYED -0.560 (-2.40) -0.020 -0.018 (-2.63) -0.017 (-2.56) -0.017 (-2.49) -0.016 (-2.33) PROPORTION OF IMMIGRANTS * IMMIGRANT -35.350 (-1.25) -1.210 -1.524 (-1.78) -1.563 (-1.81) -1.287 (-1.60) -2.107 (-2.17) ENTRY RATE 165.970 (31.57) 5.660 5.679 (20.75) 5.435 (19.84) 5.426 (19.91) 5.557 (13.43) EXIT RATE 3.900 (0.61) 0.130 -0.200 (-1.24) -0.252 (-1.57) -0.267 (-1.66) -2.177 (-3.80) LLM fixed effects NO YES YES YES YES N 1493927 1493927 1493927 1493927 1120445 Adjusted R2 0.040 0.007 0.007 0.007 0.006 Log-Likelihood -100585 Statistics p-value Statistics p-value Statistics p-value Test of over-identifying restrictions 0.158 0.691 0.532 0.466 2.736 0.098 Bound-Jaeger-Baker F-test 28.800 0.000 29.540 0.000 3.490 0.016
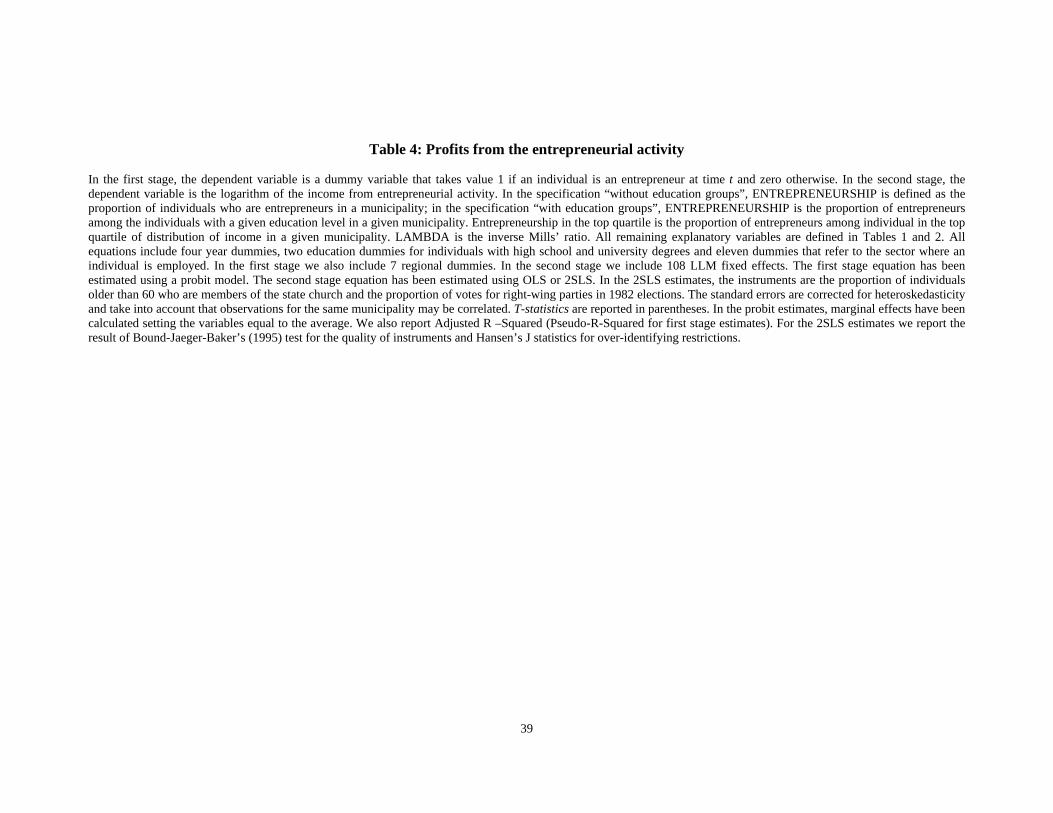
39
Table 4: Profits from the entrepreneurial activity
In the first stage, the dependent variable is a dummy variable that takes value 1 if an individual is an entrepreneur at time t and zero otherwise. In the second stage, the dependent variable is the logarithm of the income from entrepreneurial activity. In the specification “without education groups”, ENTREPRENEURSHIP is defined as the proportion of individuals who are entrepreneurs in a municipality; in the specification “with education groups”, ENTREPRENEURSHIP is the proportion of entrepreneurs among the individuals with a given education level in a given municipality. Entrepreneurship in the top quartile is the proportion of entrepreneurs among individual in the top quartile of distribution of income in a given municipality. LAMBDA is the inverse Mills’ ratio. All remaining explanatory variables are defined in Tables 1 and 2. All equations include four year dummies, two education dummies for individuals with high school and university degrees and eleven dummies that refer to the sector where an individual is employed. In the first stage we also include 7 regional dummies. In the second stage we include 108 LLM fixed effects. The first stage equation has been estimated using a probit model. The second stage equation has been estimated using OLS or 2SLS. In the 2SLS estimates, the instruments are the proportion of individuals older than 60 who are members of the state church and the proportion of votes for right-wing parties in 1982 elections. The standard errors are corrected for heteroskedasticity and take into account that observations for the same municipality may be correlated. T-statistics are reported in parentheses. In the probit estimates, marginal effects have been calculated setting the variables equal to the average. We also report Adjusted R –Squared (Pseudo-R-Squared for first stage estimates). For the 2SLS estimates we report the result of Bound-Jaeger-Baker’s (1995) test for the quality of instruments and Hansen’s J statistics for over-identifying restrictions.

40
Without education groups With education groups Entrepreneurship in top quartile First Stage OLS estimates 2SLS estimates OLS estimates 2SLS estimates OLS estimates 2SLS estimatesVariable Estimate T-stat Estimate T-stat Estimate T-stat Estimate T-stat Estimate T-stat Estimate T-stat Estimate T-statENTREPRENEURSHIP 2.301 (23.82) -2.041 (-4.72) -2.757 (-3.01) -0.650 (-4.07) -2.197 (-2.22) -1.826 (-5.84) -6.987 (-2.63)Individual level controls LABOR INCOME -0.115 (-67.61) INCOME OF OTHER HH MEMBERS -0.014 (-14.18) EXPERIENCE -0.023 (-2.25) -0.023 (-2.26) -0.023 (-2.24) -0.023 (-2.15) -0.022 (-2.21) -0.021 (-2.14)PART TIME -0.508 (-6.79) -0.372 (-6.57) -0.650 (-2.41) -0.293 (-2.17) -0.491 (-1.99) 0.082 (0.53)WEALTH -0.025 (-3.40) -0.034 (-2.43) -0.031 (-2.12) -0.034 (-2.48) -0.025 (-1.57) -0.034 (-2.48) -0.019 (-1.05)WEALTH^2 0.012 (9.12) 0.003 (1.16) 0.002 (0.64) 0.003 (1.16) -0.002 (-0.46) 0.002 (1.09) -0.005 (-1.01)SHARE OF LIQUID ASSETS IN HH WEALTH 0.016 (15.16) -0.011 (-4.19) -0.013 (-3.88) -0.012 (-4.29) -0.017 (-3.75) -0.012 (-4.33) -0.022 (-3.35)AGE 0.048 (40.24) -0.010 (-2.08) -0.014 (-1.95) -0.010 (-2.11) -0.026 (-2.31) -0.011 (-2.29) -0.040 (-2.29)AGE^2 0.000 (-35.94) 0.000 (1.70) 0.000 (1.74) 0.000 (1.70) 0.000 (2.18) 0.000 (1.88) 0.000 (2.22)MALE 0.136 (55.46) 0.039 (3.61) 0.029 (1.77) 0.037 (3.47) -0.004 (-0.14) 0.036 (3.35) -0.035 (-0.85)MOVER -0.254 (-27.75) -0.173 (-8.70) -0.153 (-4.26) -0.169 (-8.52) -0.084 (-1.43) -0.165 (-8.33) -0.014 (-0.16)CHANGES IN FAMILY STRUCTURE -0.024 (-7.82) -0.026 (-2.21) -0.024 (-1.95) -0.026 (-2.19) -0.016 (-1.22) -0.026 (-2.18) -0.009 (-0.66)NUMBER OF CHILDREN 0.008 (5.20) 0.013 (2.62) 0.013 (2.51) 0.012 (2.49) 0.010 (1.96) 0.012 (2.48) 0.009 (1.58)MARRIED 0.047 (11.47) 0.020 (1.35) 0.017 (1.16) 0.020 (1.32) 0.008 (0.47) 0.019 (1.25) -0.003 (-0.17)DIVORCED 0.004 (0.74) 0.147 (7.11) 0.145 (6.93) 0.147 (7.12) 0.141 (6.66) 0.146 (7.08) 0.136 (6.17)UNEMPLOYED -0.168 (-16.05) -0.079 (-1.92) -0.068 (-1.48) -0.073 (-1.79) -0.018 (-0.32) -0.071 (-1.72) 0.029 (0.39)IMMIGRANT -0.096 (-9.58) 0.168 (5.12) 0.175 (5.09) 0.165 (5.00) 0.194 (5.14) 0.161 (4.86) 0.201 (5.15)WAGE PREMIUM 0.073 (29.71) 0.048 (7.77) 0.043 (4.13) 0.048 (7.74) 0.029 (2.01) 0.047 (7.67) 0.015 (0.78)CHURCH 0.009 (2.21) -0.050 (-3.70) -0.049 (-3.71) -0.051 (-3.77) -0.052 (-3.89) -0.051 (-3.81) -0.055 (-3.99)Municipality level controls DIVERSITY -0.050 (-1.95) -0.064 (-0.52) -0.067 (-0.54) -0.067 (-0.54) -0.081 (-0.65) -0.100 (-0.83) -0.192 (-1.32)COMPETITION 0.005 (1.22) -0.032 (-1.93) -0.030 (-1.84) -0.040 (-2.33) -0.040 (-2.41) -0.040 (-2.35) -0.043 (-2.19)UNEMPLOYMENT RATE -0.002 (-1.23) 0.024 (3.04) 0.021 (2.41) 0.034 (4.36) 0.031 (3.80) 0.032 (4.20) 0.026 (2.91)PROPORTION OF UNEMPLOYED IN ENT. EDUCATION PROGRAMS 0.005 (0.29) -0.005 (-0.09) 0.004 (0.07) -0.040 (-0.69) -0.036 (-0.64) -0.038 (-0.67) -0.047 (-0.73)SHARE OF EMPLOYED IN FIN SECTOR 1.053 (7.86) -0.716 (-1.75) -0.692 (-1.48) -0.833 (-1.99) -0.878 (-1.84) -0.491 (-1.04) 0.073 (0.09)PROPORTION OF PUBLIC EMPLOYEES -0.082 (-0.43) -0.126 (-0.17) -0.191 (-0.26) 0.040 (0.05) -0.100 (-0.14) 0.065 (0.09) 0.217 (0.35)INCOME PER CAPITA -0.046 (-2.10) 0.221 (2.34) 0.292 (2.46) 0.038 (0.44) 0.137 (1.32) 0.076 (0.85) 0.251 (1.77)WEALTH TAX PER CAPITA 0.067 (1.21) -0.083 (-0.31) -0.259 (-0.80) 0.428 (1.65) 0.239 (0.86) 0.483 (1.85) 0.582 (1.72)UNEMPLOYMENT RATE * UNEMPLOYED 0.000 (-0.08) 0.005 (1.38) 0.006 (1.48) 0.005 (1.28) 0.005 (1.35) 0.005 (1.29) 0.005 (1.33)PROPORTION OF IMMIGRANTS * IMMIGRANT 0.171 (1.46) -1.490 (-4.39) -1.503 (-4.50) -1.425 (-4.07) -1.485 (-4.36) -1.326 (-3.71) -1.240 (-3.61)ENTRY RATE 0.327 (17.95) -0.274 (-3.64) -0.342 (-2.93) -0.139 (-1.97) -0.306 (-2.36) -0.143 (-1.99) -0.401 (-2.62)EXIT RATE -0.067 (-3.15) -0.016 (-0.16) -0.013 (-0.13) 0.034 (0.36) 0.067 (0.69) 0.211 (2.17) 0.724 (2.59)LAMBDA -0.318 (-17.42) -0.368 (-5.16) -0.326 (-18.03) -0.523 (-4.08) -0.333 (-18.91) -0.678 (-3.45)LLM fixed effects NO YES YES YES YES YES YESN obs 1684596 79356 79356 79356 79356 56642 56642Log-likelihood -446016 Adjuster R2 0.470 0.170 0.170 0.170 0.169 0.170 0.165 Statistics p-value Statistics p-value Statistics p-valueTest of over-identifying restrictions 0.877 0.349 1.034 0.309 4.628 0.099Bound-Jaeger-Baker F-test 29.210 0.000 30.230 0.000 2.120 0.097

41
Table 5: Entrepreneurial Investment In the first stage (not reported), the dependent variable is a dummy variable equal to 1 if an individual is an entrepreneur at time t and equal to zero otherwise. In the second stage, the dependent variable is the logarithm of entrepreneurial investment. ENTREPRENEURSHIP is defined as the proportion of individuals who are entrepreneurs in a municipality. LAMBDA is the inverse Mills’ ratio. All remaining explanatory variables are defined in Tables 1 and 2. All the equations include four year dummies, two education dummies for individuals with high school and university degrees and eleven dummies that refer to the sector where an individual is employed. In the first stage we also include 7 regional dummies. In the second stage we include 108 LLM fixed effects. The first stage equation has been estimated using a probit model. The second stage equation has been estimated using OLS or 2SLS. In the 2SLS estimates, the instruments are the proportion of individuals older than 60 who are members of the state church and the proportion of votes for right-wing parties in 1982 elections. The standard errors are corrected for heteroskedasticity and take into account that observations for the same municipality may be correlated. T-statistics are reported in parentheses. The marginal effects have been calculated setting the variables equal to the average. We also report Adjusted R –Squared (Pseudo-R-Squared for first stage estimates). For the 2SLS estimates we report the result of Bound-Jaeger-Baker’s (1995) test for the quality of instruments and Hansen’s J statistics for over-identifying restrictions.

42
OLS estimates 2SLS estimates Variable Estimate T-stat Estimate T-stat
ENTREPRENEURSHIP 1.230 (1.28) 4.875 (2.16)
Individual level controls
ENTREPRENEURIAL INCOME 0.019 (4.34) 0.019 (4.10)
EXPERIENCE -0.059 (-2.62) -0.057 (-2.40)
PART_TIME -0.283 (-2.40) -0.490 (-2.96)
WEALTH -0.024 (-0.92) -0.027 (-0.88)
WEALTH^2 0.007 (1.65) 0.010 (1.80)
SHARE OF LIQUID ASSETS IN HH WEALTH 0.008 (1.31) 0.014 (1.76)
AGE 0.034 (2.71) 0.050 (3.10)
AGE^2 0.000 (-2.07) 0.000 (-2.54)
MALE 0.313 (10.23) 0.354 (8.46)
MOVER -0.110 (-1.56) -0.198 (-2.46)
CHANGES IN FAMILY STRUCTURE 0.011 (0.41) 0.000 (-0.01)
NUMBER OF CHILDREN 0.024 (2.50) 0.027 (2.26)
MARRIED 0.110 (4.02) 0.121 (3.92)
DIVORCED 0.058 (1.27) 0.065 (1.15)
UNEMPLOYED -0.064 (-0.42) -0.109 (-0.75)
IMMIGRANT -0.156 (-2.19) -0.190 (-2.78)
WAGE PREMIUM -0.017 (-0.86) 0.003 (0.11)
CHURCH 0.030 (1.02) 0.030 (0.93)Municipality level controls
DIVERSITY 0.342 (1.36) 0.354 (1.35)
COMPETITION 0.061 (1.93) 0.047 (1.59)
UNEMPLOYMENT RATE -0.018 (-0.91) 0.007 (0.28)
PROPORTION OF UNEMPLOYED IN ENT. EDUCATION PROGRAMS 0.359 (1.66) 0.307 (1.21)
SHARE OF EMPLOYED IN FIN SECTOR 1.552 (1.39) 1.396 (1.78)
PROPORTION OF PUBLIC EMPLOYEES -0.836 (-0.55) -0.837 (-0.51)
INCOME PER CAPITA 0.116 (0.54) -0.247 (-0.80)
WEALTH TAX PER CAPITA -0.539 (-0.98) 0.398 (0.52)
UNEMPLOYMENT RATE * UNEMPLOYED -0.010 (-0.35) -0.013 (-0.47)
PROPORTION OF IMMIGRANTS * IMMIGRANT 1.437 (1.60) 1.557 (2.35)
ENTRY RATE -0.052 (-0.25) 0.313 (1.14)
EXIT RATE 0.310 (1.22) 0.323 (1.43)
LAMBDA 0.173 (1.64) 0.363 (2.43)
LLM fixed effects YES YES
N 33192 33192
Adjusted R2 0.007 0.007
Statistics P-value
Test of over-identifying restrictions 1.872 0.392
Bound-Jaeger-Baker F-test 18.01 0.000

43
Table 6: The decision to become an entrepreneur and sorting In Panel A, the dependent variable is a dichotomic variable with a value equal to 1 if individual i becomes an entrepreneur at time t and equal to zero otherwise. Individuals who were already entrepreneurs at time t-1 are excluded. ENTREPRENEURSHIP is defined as the proportion of individuals who are entrepreneurs in a municipality. DIFF(ENTREPRENEURSHIP) is the difference between level of entrepreneurial activity in the municipality of residence and the previous municipality. MOVER is the dummy which is equal to 1 if an individual moved within 1 or 3 years (column 1 and 2, respectively) and equal to zero otherwise. All remaining explanatory variables are defined in Tables 1 and 2. All the equations include year dummies, two education dummies for individuals with high school and university degrees, 108 LLM fixed effects and 11 dummies that refer to the sector where an individual is employed. The equation has been estimated using OLS. The standard errors are corrected for heteroskedasticity and take into account that observations for the same municipality may be correlated. T-statistics are reported in parentheses. We also report the Adjusted R-Squared. Estimates for the linear probability model are multiplied by 100.

44
Panel A: The decision to become an entrepreneur and sorting
Movers within 1 year Movers within 3 year Variable Estimate T-stat Estimate T-stat
ENTREPRENEURSHIP 15.458 (16.39) 15.882 (8.22)
MOVER* DIFF(ENTREPRENEURSHIP) 0.335 (0.20) 3.094 (1.41)
Individual level controls
INCOME OF OTHER HH MEMBERS -0.058 (-9.30) -0.053 (-5.65)
LABOR INCOME -0.094 (-6.28) -0.118 (-5.34)
WEALTH -0.418 (-9.93) -0.305 (-6.06)
WEALTH^2 0.091 (12.76) 0.072 (7.96)
SHARE OF LIQUID ASSETS IN HH WEALTH 0.051 (7.10) 0.047 (5.02)
AGE 0.163 (19.12) 0.123 (9.24)
AGE^2 -0.002 (-16.89) -0.001 (-8.22)
MALE 0.864 (32.89) 0.863 (24.78)
MOVER 0.073 (1.20) 0.147 (1.33)
CHANGES IN FAMILY STRUCTURE 0.052 (1.37) 0.007 (0.14)
NUMBER OF CHILDREN 0.095 (7.27) 0.117 (5.64)
MARRIED 0.216 (6.87) 0.233 (4.69)
DIVORCED 0.076 (1.67) 0.163 (2.36)
UNEMPLOYED 0.006 (0.08) -0.159 (-0.89)
IMMIGRANT -0.064 (-0.84) 0.016 (0.16)
WAGE PREMIUM -0.229 (-7.57) -0.248 (-5.29)
CHURCH -0.089 (-2.47) -0.046 (-0.79)
Municipal level controls
DIVERSITY 0.205 (1.02) -0.116 (-0.37)
COMPETITION 0.015 (0.51) 0.011 (0.23)
UNEMPLOYMENT RATE 0.010 (0.75) 0.028 (0.93)
PROPORTION OF UNEMPLOYED IN ENT. EDUCATION PROGRAMS -0.061 (-0.28) 0.170 (0.46)
SHARE OF EMPLOYED IN FIN SECTOR 1.134 (1.64) 0.658 (0.71)
PROPORTION OF PUBLIC EMPLOYEES 0.444 (0.33) 1.543 (0.70)
INCOME PER CAPITA -0.147 (-0.76) -0.306 (-0.92)
WEALTH TAX PER CAPITA 0.230 (0.50) 0.732 (0.81)
UNEMPLOYMENT RATE * UNEMPLOYED -0.016 (-2.09) 0.001 (0.04)
PROPORTION OF IMMIGRANTS * IMMIGRANT -1.590 (-1.79) -1.933 (-1.88)
ENTRY RATE 5.557 (18.17) 5.875 (11.22)
EXIT RATE -0.270 (-1.37) -0.099 (-0.29)
LLM fixed effects YES YES
N 1179314 497308
Adjusted R2 0.007 0.007

45
Panel B: Mobility for entrepreneurs and non-entrepreneurs
Non-
entrepreneurs Entrepreneurs 1 year 3 years 1 year 3 years
Did not move 96.44% 92.60% 97.87% 94.78%
Move to higher entrepreneurship area 1.78% 3.23% 1.03% 2.09%
Move to lower entrepreneurship
area 1.78% 4.17% 1.10% 3.13%

46
Table 7: Young People’s Entrepreneurial Choice Only young individuals (defined as individuals younger than 18 in 1983) are included in the sample. We report the estimates for the linear probability model (as in Table 3) and second stage of estimates for entrepreneurial income (as in Table 4). The explanatory variables are defined in Tables 1 and 2. LAMBDA is the inverse Mills’ ratio. The standard errors are corrected for heteroskedasticity and take into account that observations for the same municipality may be correlated. T-statistics are reported in parentheses. We also report the Adjusted R-Squared. The coefficient for PARENTAL CAPITAL INCOME in 1970 in income equation is multiplied by 1000.

47
Decision to become an entrepreneur Entrepreneurial profits OLS estimates 2SLS estimates OLS estimates 2SLS estimates Estimate T-stat Estimate T-stat Estimate T-stat Estimate T-stat ENTREPRENEURSHIP 12.787 (3.54) 8.391 (1.60) -4.569 (-2.25) -9.955 (-1.98)Individual level controls PARENTS' CAPITAL INCOME in 1970 0.356 (1.46) 0.355 (1.46) 0.199 (-3.99) 0.203 (-7.96)EXPERIENCE -0.021 (-0.44) -0.024 (-0.49)PART_TIME -0.433 (-10.51) -0.393 (-5.59)INCOME OF OTHER HH MEMBERS -0.071 (-3.64) -0.071 (-3.64) LABOR INCOME -0.092 (-2.24) -0.090 (-2.20) WEALTH -0.240 (-3.18) -0.230 (-3.07) 0.064 (1.19) 0.101 (1.45)WEALTH^2 0.057 (4.14) 0.056 (4.07) -0.032 (-2.80) -0.044 (-2.54)SHARE OF LIQUID ASSETS IN HH WEALTH 0.017 (0.73) 0.015 (0.68) -0.048 (-2.58) -0.058 (-3.40)AGE 0.258 (2.02) 0.258 (2.01) 0.225 (1.76) 0.207 (1.60)AGE^2 -0.003 (-1.18) -0.003 (-1.19) -0.007 (-2.62) -0.007 (-2.61)MALE 0.639 (8.39) 0.642 (8.51) -0.177 (-2.09) -0.273 (-2.55)MOVER 0.062 (0.60) 0.060 (0.60) 0.110 (1.00) 0.220 (1.48)CHANGES IN FAMILY STRUCTURE 0.262 (2.81) 0.259 (2.77) 0.128 (1.64) 0.191 (2.14)NUMBER OF CHILDREN -0.004 (-0.08) -0.001 (-0.02) 0.168 (3.38) 0.227 (3.25)MARRIED 0.259 (2.06) 0.255 (2.03) 0.104 (1.35) 0.112 (1.40)DIVORCED -0.299 (-1.15) -0.314 (-1.21) 0.761 (2.40) 0.792 (4.80)UNEMPLOYED -0.003 (-0.01) -0.079 (-0.30) 0.115 (0.56) 0.159 (0.66)IMMIGRANT -0.283 (-0.63) -0.345 (-0.78) 0.292 (0.87) 0.376 (1.25)WAGE PREMIUM -0.049 (-0.72) -0.054 (-0.79) -0.022 (-0.53) -0.059 (-1.25)CHURCH -0.285 (-1.56) -0.276 (-1.51) -0.180 (-1.89) -0.201 (-1.91)Municipality level controls DIVERSITY -2.073 (-2.45) -0.553 (-0.71) 0.686 (1.21) 0.820 (1.47)COMPETITION -0.143 (-1.07) -0.079 (-0.64) 0.082 (1.16) 0.115 (1.44)UNEMPLOYMENT RATE 0.075 (1.40) -0.038 (-0.76) 0.006 (0.19) -0.015 (-0.38)PROPORTION OF UNEMPLOYED IN ENT EDUCATION PROGRAMS -0.328 (-0.68) -0.374 (-0.90) 0.472 (1.54) 0.621 (1.73)SHARE OF EMPLOYED IN FIN SECTOR 2.401 (0.68) 2.525 (0.90) -2.608 (-1.10) -3.000 (-1.29)PROPORTION OF PUBLIC EMPLOYEES IN POPULATION 3.699 (0.63) -1.570 (-0.33) -3.233 (-1.02) -4.490 (-1.48)INCOME PER CAPITA -1.594 (-1.95) -0.373 (-0.41) -0.143 (-0.34) 0.320 (0.57)WEALTH TAX PER CAPITA 3.327 (1.85) -1.122 (-0.51) 0.038 (0.03) -1.229 (-0.78)UNEMPLOYMENT RATE* UNEMPLOYED -0.031 (-1.43) -0.023 (-1.05) 0.004 (0.18) 0.009 (0.39)PROPORTION OF IMMIGRANTS * IMMIGRANT 4.376 (0.81) 5.158 (0.97) 2.147 (0.53) 2.495 (0.80)ENTRY RATE 2.862 (3.90) 2.670 (3.47) -0.629 (-1.24) -1.314 (-1.78)DEATH RATE 0.761 (0.97) 0.990 (1.24) -0.876 (-1.61) -1.061 (-1.88)LAMBDA -1.062 (-4.30) -1.427 (-3.67)LLM fixed effects YES YES YES YES N obs 81185 81185 1946 1946 Adjuster R2 0.006 0.005 0.188 0.184
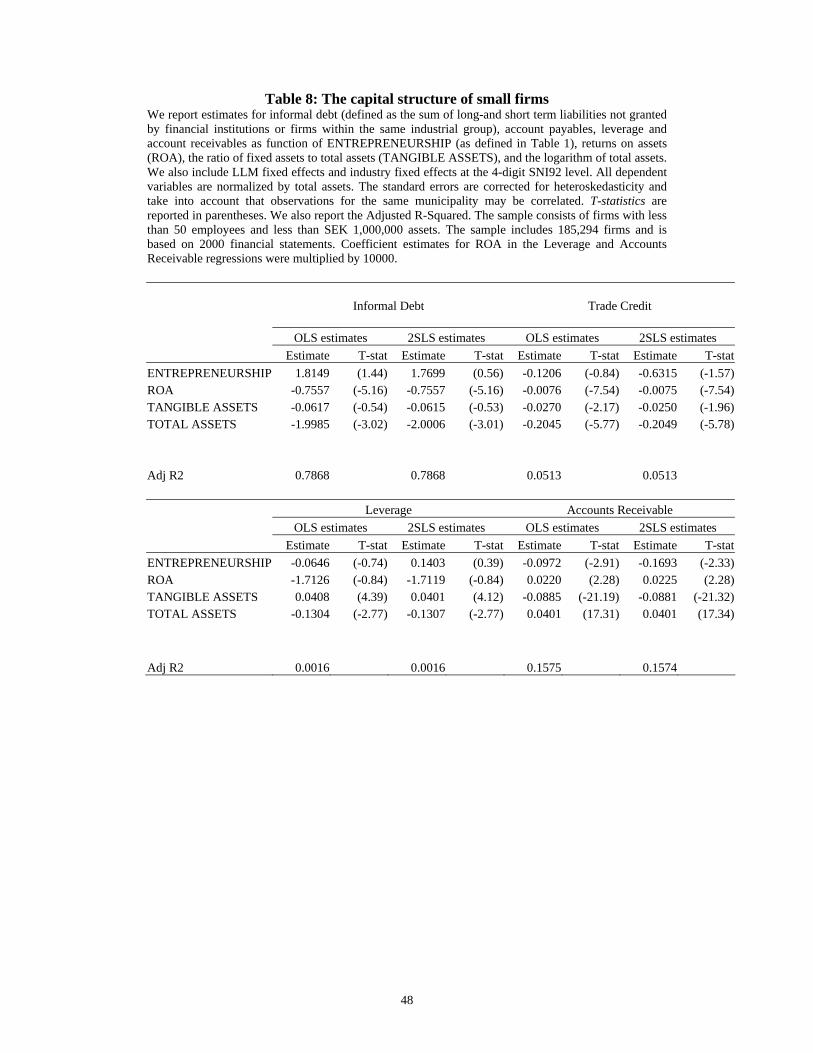
48
Table 8: The capital structure of small firms We report estimates for informal debt (defined as the sum of long-and short term liabilities not granted by financial institutions or firms within the same industrial group), account payables, leverage and account receivables as function of ENTREPRENEURSHIP (as defined in Table 1), returns on assets (ROA), the ratio of fixed assets to total assets (TANGIBLE ASSETS), and the logarithm of total assets. We also include LLM fixed effects and industry fixed effects at the 4-digit SNI92 level. All dependent variables are normalized by total assets. The standard errors are corrected for heteroskedasticity and take into account that observations for the same municipality may be correlated. T-statistics are reported in parentheses. We also report the Adjusted R-Squared. The sample consists of firms with less than 50 employees and less than SEK 1,000,000 assets. The sample includes 185,294 firms and is based on 2000 financial statements. Coefficient estimates for ROA in the Leverage and Accounts Receivable regressions were multiplied by 10000.
Informal Debt
Trade Credit
OLS estimates 2SLS estimates OLS estimates 2SLS estimates Estimate T-stat Estimate T-stat Estimate T-stat Estimate T-statENTREPRENEURSHIP 1.8149 (1.44) 1.7699 (0.56) -0.1206 (-0.84) -0.6315 (-1.57)ROA -0.7557 (-5.16) -0.7557 (-5.16) -0.0076 (-7.54) -0.0075 (-7.54)TANGIBLE ASSETS -0.0617 (-0.54) -0.0615 (-0.53) -0.0270 (-2.17) -0.0250 (-1.96)TOTAL ASSETS -1.9985 (-3.02) -2.0006 (-3.01) -0.2045 (-5.77) -0.2049 (-5.78) Adj R2 0.7868 0.7868 0.0513 0.0513 Leverage Accounts Receivable
OLS estimates 2SLS estimates OLS estimates 2SLS estimates Estimate T-stat Estimate T-stat Estimate T-stat Estimate T-statENTREPRENEURSHIP -0.0646 (-0.74) 0.1403 (0.39) -0.0972 (-2.91) -0.1693 (-2.33)ROA -1.7126 (-0.84) -1.7119 (-0.84) 0.0220 (2.28) 0.0225 (2.28)TANGIBLE ASSETS 0.0408 (4.39) 0.0401 (4.12) -0.0885 (-21.19) -0.0881 (-21.32)TOTAL ASSETS -0.1304 (-2.77) -0.1307 (-2.77) 0.0401 (17.31) 0.0401 (17.34) Adj R2 0.0016 0.0016 0.1575 0.1574

49
Figure 1
Local labor market and municipalities