provide an efficient, well-connected transportation … an efficient, well-connected transportation...
TRANSCRIPT

TANGIBLE RESULT #5
Provide an Efficient, Well-Connected Transportation Experience
MDOT will provide an easy, reliable transportation experience throughout the system. This includes good connections and world class transportation facilities and services.
RESULT DRIVER:Phil Sullivan Maryland Transit Administration (MTA)
73
Provide an Efficient, Well-Connected Transportation Experience
TANGIBLE RESULT DRIVER:Phil Sullivan Maryland Transit Administration (MTA)
PERFORMANCE MEASURE DRIVER:John O’Neill Maryland Transportation Authority (MDTA)
PURPOSE OF MEASURE:To assess average wait time at our facilities
FREQUENCY:Quarterly
DATA COLLECTION METHODOLOGY:Verification of average wait times at our facilities for services
NATIONAL BENCHMARK:N/A
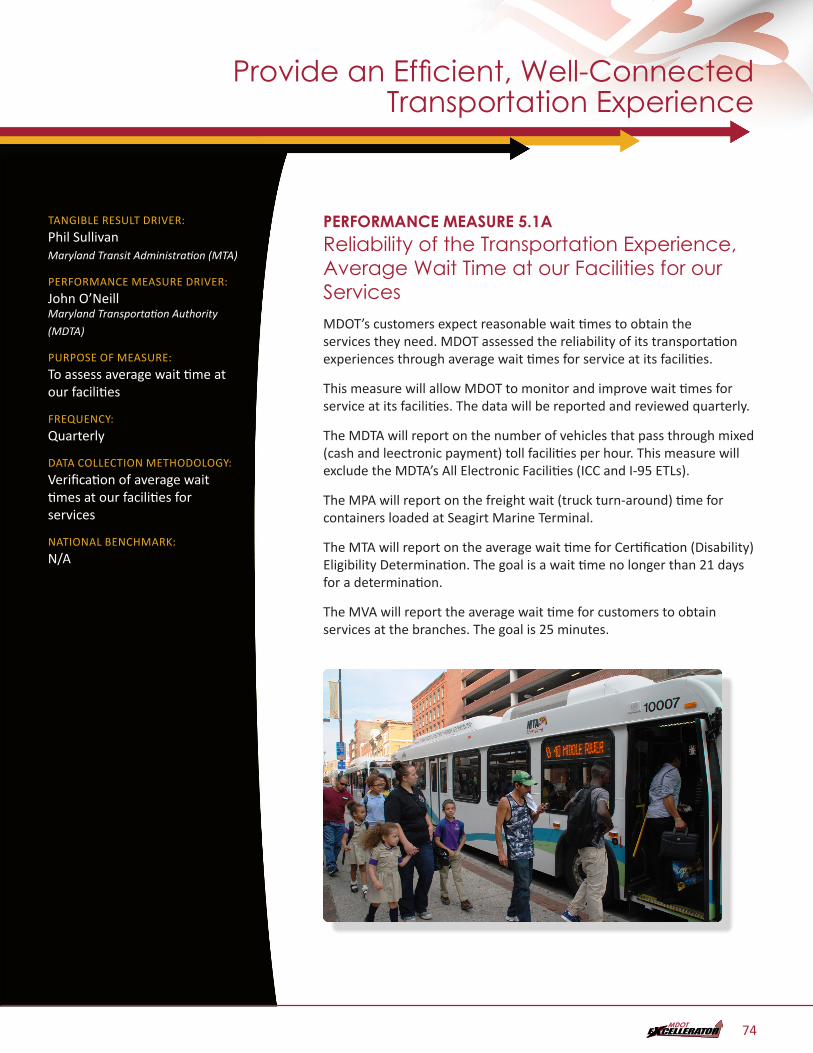
PERFORMANCE MEASURE 5.1AReliability of the Transportation Experience, Average Wait Time at our Facilities for our ServicesMDOT’s customers expect reasonable wait times to obtain the services they need. MDOT assessed the reliability of its transportation experiences through average wait times for service at its facilities.
This measure will allow MDOT to monitor and improve wait times for service at its facilities. The data will be reported and reviewed quarterly.
The MDTA will report on the number of vehicles that pass through mixed (cash and leectronic payment) toll facilities per hour. This measure will exclude the MDTA’s All Electronic Facilities (ICC and I-95 ETLs).
The MPA will report on the freight wait (truck turn-around) time for containers loaded at Seagirt Marine Terminal.
The MTA will report on the average wait time for Certification (Disability) Eligibility Determination. The goal is a wait time no longer than 21 days for a determination.
The MVA will report the average wait time for customers to obtain services at the branches. The goal is 25 minutes.
74

PERFORMANCE MEASURE 5.1AReliability of the Transportation Experience, Average Wait Time at our Facilities
Average Volume, Peak Hours All Mixed Facilities
PM5.1a1
Average Annual Truck Turn Around Time per Unit (Box) at Seagirt Marine TerminalPM5.1a2 - Average Annual Truck Turn Around Time per Unit (Box) at Seagirt Marine Terminal - DONE
27.5
28
28.5
29
29.5
30
30.5
FY2012 FY2013 FY2014 FY2015
Provide an Efficient, Well-Connected Transportation Experience
75

PERFORMANCE MEASURE 5.1AReliability of the Transportation Experience, Average Wait Time at Our Facilities
Average Wait Time for Certification Eligibility DeterminationPM5.1a3
12
7
3027
25
2119
16
0
5
10
15
20
25
30
35
40
45
50
Jan Feb Mar Apr May Jun Jul Aug Sep Oct Nov Dec
Average Wait Time at MVA Branch OfficesPM5.1a4 - Average Wait Time at MVA Branch Offices - DONE
0
5
10
15
20
25
30
35
QTR1 QTR2 QTR3 QTR4
Min
utes
FY2015 FY2014 FY2013
Provide an Efficient, Well-Connected Transportation Experience
76

TANGIBLE RESULT DRIVER:Phil Sullivan Maryland Transit Administration (MTA)
PERFORMANCE MEASURE DRIVER:John O’Neill Maryland Transportation Authority (MDTA)
PURPOSE OF MEASURE:To assess percent of on-time performance
FREQUENCY:Monthly
DATA COLLECTION METHODOLOGY:Track and report the average percentage of on time performance
NATIONAL BENCHMARK:78% for bus and 90% for rail. Source: American Public Transportation Association (APTA)
PERFORMANCE MEASURE 5.1BRealibility of Transportation Experience : Percentage of On-Time PerformanceReliability of transportation services is important to MDOT customers. Many rely on posted arrival and departure times to make needed connections and for critical appointments. This measure will allow the TBUs to focus resources in areas where the on-time performance is faltering.
MAA will report on the customers wait time for airport shuttles at the BWI facilities. The national standard for on-time arrivals for bus service is 78%. MAA is exceeding the national average.
MTA will report on-time arrivals for Bus, Light Rail, MARC, Metro and Mobility Services. The national average per the American Public Transportation Association for on-time arrival for bus is 78% and rail 90%. MTA is exceeding the national average.
2015 BWI Shuttle On Time PerformancePM5.1b - 2015 BWI Shuttle On Time Performance - DONE
82.00%
84.00%
86.00%
88.00%
90.00%
92.00%
94.00%
96.00%
98.00%
January February March April
May June July August
September October November December
Provide an Efficient, Well-Connected Transportation Experience
77

PERFORMANCE MEASURE 5.1BPercentage of On-Time Performance
On Time PerformancePM5.1b
88.6
83 83.1
87
85.4
89.6
93.2 93.1
88.8 88.7 88.9
91.8
93.7
90.6
75
77
79
81
83
85
87
89
91
93
95
Jan Feb Mar Apr May Jun Jul Aug Sep Oct Nov Dec
MTA On Time Performance
MTA On Time Performance FY13 Avg
FY14 Avg
FY15 Avg
Bus 81.7% 80.8% 80.9%
Metro 97.2% 96.2% 95.4%
Light Rail 97.5% 95.9% 96.7%
Mobility 89.4% 91.2% 87.7%
MARC Total 93.3% 92.0% 92.3%
MARC - Brunswick 93.5% 93.8% 94.3%
MARC - Camden 95.5% 89.4% 93.3%
MARC - Penn 93.1% 92.1% 89.2%
Provide an Efficient, Well-Connected Transportation Experience
78

TANGIBLE RESULT DRIVER:Phil Sullivan Maryland Transit Administration (MTA)
PERFORMANCE MEASURE DRIVER:John O’Neill Maryland Transportation Authority (MDTA)
PURPOSE OF MEASURE:To provide customers reliable travel times on our highways to key destinations
FREQUENCY:Annually
DATA COLLECTION METHODOLOGY:Formula based
NATIONAL BENCHMARK:A Planning Time Index (PTI) which is < = 2.5
PERFORMANCE MEASURE 5.1CPlanning Time Index for Highway TravelMDOT highway customers expect reliable travel times on Maryland highways to reach key destinations. Customers make decisions on when to depart for daily commute, travel connections and critical appointments based on the travel times on highways across the State.
The Planning Time Index (PTI) is a good tool to gauge the reliability of travel on these heavily-utilized routes. Providing an index for travel times allows MDOT’s customers to plan extra time if the PTI is higher in order to arrive at their destination on time.
A PTI of < 1.5 is considered reliable,a PTI >1.5 and < 2.5 is considered moderately unreliable, and a PTI of > 2.5 is considered highly to extremely unreliable. The goal is to maintain travel times of less than 2.5 times the expected free flow travel time for peak periods.
PM5.1c
0
20
40
60
80
100
120
10 11 12 13 14 15 16 17 18 19 20 21 22 23 24
Num
ber o
f Trip
s
Travel Time (Minutes)
Free Flow Travel Time
Buffer Time
Avg. Travel Time 95th Percentile
Provide an Efficient, Well-Connected Transportation Experience
79

PERFORMANCE MEASURE 5.1C: Planning Time Index for Highway Travel
Provide an Efficient, Well-Connected Transportation Experience
80

TANGIBLE RESULT DRIVER:Phil Sullivan Maryland Transit Administration (MTA)
PERFORMANCE MEASURE DRIVER:David Thomas Maryland Port Administration (MPA)
PURPOSE OF MEASURE:To assess the quality of ride that a customer experiences across three different travel modes; highway, rail and water
FREQUENCY:Annually
DATA COLLECTION METHODOLOGY:Highway is measured by the International Roughness Index (IRI)
Rail is measured by the percentage of available track with no restrictions
Water is measured by the number of Bay Channel segments inspected to authorized depths
NATIONAL BENCHMARK:Highway : 87%
Rail: TBD
Water: 90%
PERFORMANCE MEASURE 5.2Ride Quality Experience: Highway, Transit and Bay ChannelsMDOT has identified ride quality as important for the safe, efficient and cost-effective transport of people and goods within Maryland. The three primary modes for this assessment of transport involve highway, transit and water. All modes must provide a high quality level of ride on Maryland highways, rail transit and service that is consistent, predictable and reliable in order to satisfy customers’ expectations.
Provide an Efficient, Well-Connected Transportation Experience
81

PERFORMANCE MEASURE 5.2ARide Quality Experience: Highway MDTA and SHA define high-quality service for highways as per FHW) standards and a measure defined by the International Roughness Index (IRI). This measure not only indicates the level of smooth ride but will also be used to develop system preservation strategies.
Percent of SHA and MDTA Roadway Mileage with Acceptable (Smooth) Ride Quality
PM5.2a – No data
Under a new initiative, the MTA Light Rail and Metro systems will collect data by using operational-issued bulletins and the Maximo database. These measures will analyze and compare system-wide track lengths against fully-operational track lengths operating absent of any restricted speed advisories. These measures have a direct correlation to on-time performance and meeting the customer’s high-quality expectations.
Provide an Efficient, Well-Connected Transportation Experience
82

PERFORMANCE MEASURE 5.2BRide Quality Experience: Transit
Percentage of MTA Owned Rail in Good QualityPM5.2b – Ride Quality Experience: Percentage of MTA Owned Rail in Good Quality - DONE
86.00%
88.00%
90.00%
92.00%
94.00%
Light Rail CY2016 Metro Rail CY2016
PERFORMANCE MEASURE 5.2CRide Quality Experience: Bay ChannelsMPA is responsible for ensuring that each of the U.S. Federal Channel Segments in the Chesapeake Bay are inspected by the Army Corp of Engineers so that commercial cargo and passengers vessels can safely navigate the inland waterway serving the seaport facilities. The integrity of this “marine highway” is critical to the welfare of the Port and the overall positive economic impact to the State.
Percentage of Channel Segments with US Army Corp of Engineers Inspection Surveys Less Than One Year OldPM5.2c - 5.2c: Percentage of channel segments with Army Corps of Engineers channel inspection surveys ≤ 1 year old - DONE
0%
20%
40%
60%
80%
100%
Age of Surveys
50%
84% 81% 84%94%
2011 2012 2013 2014 2015
Provide an Efficient, Well-Connected Transportation Experience
83

TANGIBLE RESULT DRIVER:Phil Sullivan Maryland Transit Administration (MTA)
PERFORMANCE MEASURE DRIVER:Glenn McLaughlin State Highway Administration (SHA)
PURPOSE OF MEASURE:This measure helps to better understand the impact on efficiency of quickly restoring transportation services after incidents
FREQUENCY:Annually
DATA COLLECTION METHODOLOGY:The methodology involves an Analysis of Operational Records collected in real-time, and results are contingent on the scale, number and types of incident/disruptions.
BENCHMARK:North Carolina – 69 minutes / Missouri – 24 minutes
PERFORMANCE MEASURE 5.3AMaintenance of Continuity of Operations: Average Time to Restore Normal Operations After Incidents or Disruptions MDOT’s customers expect a safe, well-maintained, efficient and reliable transportation system with minimal disruption to travel and rapid response to, and management and clearance of incidents and disruptions, when they occur. Efforts to enhance operations and improve coordination and cooperation among TBUs) and regional partner-agencies, contribute to the reduction in response times and the overall average incident duration.
In order to better understand the performance of the agency, SHA, through its Office of CHART & ITS Development, collects (through both in-house and independent evaluations) the average incident duration for incidents occurring on Maryland highways. The “average incident duration” is a measure of the time it takes a response unit to arrive, plus the elapsed time between the arrival of the first unit and the time stamp in the CHART system denoting the restoration of normal operating conditions. This data is tracked and recorded in real-time by operators and the CHART system, and is reported on an annual basis.
As shown in the figure below, the average incident duration between CY 2009 and CY 2014 has consistently been less than 30 minutes, and has been less than the lower benchmark value (24 minutes – Missouri) for the last four years (CY 2011 – CY 2014). Considering this, the desired short-term goal is to continue to identify strategies that will maintain the downward trend and facilitate further improvement in this area.
Average Highway Incident DurationPM5.3a - DONE
0
5
10
15
20
25
30
28.35 27.6
22.14 21.95 21.64 23.32
2009 2010 2011 2012 2013 2014
Provide an Efficient, Well-Connected Transportation Experience
84

TANGIBLE RESULT DRIVER:Phil Sullivan Maryland Transit Administration (MTA)
PERFORMANCE MEASURE DRIVER:Glenn McLaughlin State Highway Administration (SHA)
PURPOSE OF MEASURE:To better understand the impact on efficiency of quickly restoring transportation services after weather events.
FREQUENCY:Annually
DATA COLLECTION METHODOLOGY:The methodology involves an Analysis of Operational Records collected in real-time, and results are contingent on the scale, number and types of weather events.
BENCHMARK:Missouri – 3.8 hours
PERFORMANCE MEASURE 5.3BMaintenance of Continuity of Operations: Average Time to Restore Normal Operatrions After Weather Events MDOT’s customers expect a safe, well-maintained, efficient and reliable transportation system with minimal disruption to travel. Disruptions in travel due to inclement weather (snow, ice, etc.) require specialized operations experience and rapid response to restore normal operating conditions.
In order to better understand the performance of the agency, SHA, through its Office of Maintenance, collects data on the “average time to restore normal operations after weather events.” Performance is tracked and measured against prior years to identify trends and improve statewide and local operations. The performance measure is calculated by identifying the lapse in time from the ending of frozen precipitation in a maintenance shop’s area of responsibility and the occurrence of bare (wet or dry) pavements on the interstate and primary highways it maintains. The latest SHA-wide datum reported was for FY 2015 and is 2.2 hours (four hours was the target).
As shown in the figure below, the average time to restore normal operations after weather events for the years 2011 - 2014 has consistently been less than the benchmark value (3.8 hours –Missouri).Considering this, the desired short-term goal is to continue to identify strategies to reduce time to restore normal operations after these events.
Hours to Regain Bare Pavement After SnowPM5.3b – DONE
0
1
2
3
4
54.35
1.20.6 0.4
1.732.2
2010 2011 2012 2013 2014 2015
Provide an Efficient, Well-Connected Transportation Experience
85

TANGIBLE RESULT DRIVER:Phil Sullivan Maryland Transit Administration (MTA)
PERFORMANCE MEASURE DRIVER:Michelle Martin State Highway Administration (SHA)
PURPOSE OF MEASURE:This measure helps to better understand the bicycle accommodations and the bicyclist’s level of comfort while riding on State-owned roadways
FREQUENCY:Annually
DATA COLLECTION METHODOLOGY:Formula accounts for multiple factors, including outside lane width, the presence of on-street parking, roadway speed and shoulder width and truck percentage.
BENCHMARK:N/A
PERFORMANCE MEASURE 5.4AWell-Connected Pedestrian and Bicycle Options: Percent of State-Owned Roadway Centerline Miles with Bicycle Clevel of Comfort Grade of “D” or Better MDOT customers want a transportation network that has comfortable, safe and convenient transportation connections for all users. Accommodating bicycle travel safely and comfortably along our transportation network is important, otherwise, customers will choose not to travel by bicycle.
In order to better understand how comfortable and safe our transportation network is for bicycles, we measure the Bicycle Level of Comfort (BLOC), which uses a scale of “A” to “F” to assess the quality of the statewide roadway system for its comfort and compatibility with bicycle users. This formula-based measure accounts for multiple factors, including outside lane width, the presence of on-street parking, roadway speed, shoulder width and truck percentage, with the greatest driving factors being shoulder width, speed and truck percentage.
The BLOC for the transportation network shows a positive trend due to increased funding for bicycle improvements along State-owned roadways, such as $2.8 million invested in FY 2015 for dedicated bicycle improvement projects.
Percent of Centerline Miles BLOC Grade “D” or BetterPM5.4a NO 2015 DATA
50
52
54
56
58
Percent of Centerline Miles BLOC Grade "D" or Better
52.6 53.7 53.9 54.9 56.2
2010 2011 2012 2013 2014 2015
Provide an Efficient, Well-Connected Transportation Experience
86

TANGIBLE RESULT DRIVER:Phil Sullivan Maryland Transit Administration (MTA)
PERFORMANCE MEASURE DRIVER:Robert Pond Maryland Transit Administration (MTA)
PURPOSE OF MEASURE:To understand how well our facilities and transit vehicles accommodate bicycles and pedestrians connecting between modes of travel
FREQUENCY:Annually
DATA COLLECTION METHODOLOGY:Survey Business Unit facilities to understand bicycle and pedestrian accessibility
NATIONAL BENCHMARK:N/A
PERFORMANCE MEASURE 5.4BWell-Connected Pedestrian and Bicycle Options: Percent of MDOT Facilities and Transit Vehicles with Bicycle AccommodationsMDOT customers benefit from multiple travel options.
Presently, MAA, MPA, MTA and MVA have some form of pedestrian and bicycle access to their facilities. SHA is covered under performance measure 5.4a (BLOC) and will not be reported here.
Obviously MAA and MTA, which specialize in the mass movement of people, have the highest saturation rate for pedestrian and bicycle access. It should be noted that MTA is 100% bicycle-capable on its core services; Local Bus, Light Rail and Metro Rail. MTA MARC service has recently introduced four bicycle cars to their fleet on the Penn Line.
MDTA does not support pedestrian or bicycle access at this time for safety reasons due to high frequency and high speed vehicle traffic. However, beginning on July 1, 2016, bicycle traffic will be permissible on the Thomas Hatem Bridge on Rt. 40 in Cecil County.
Percent of MDOT Facilities, Transit Vehicles, and Parking Lots with Bike Racks and Other Bicycle/Pedestrian Accommodations
PM5.4b - 5.4b. Percent of MDOT Facilities, Transit Vehicles, and Parking Lots with Bike Racks and Other Bicycle/Pedestrian Accommodations - DONE
0.0%
20.0%
40.0%
60.0%
80.0%
100.0%
MAA MPA MTA MdTA MVA TSO
100.
0%
7.7%
50.0
%
0.0% 4.
2%
100.
0%
100.
0%
7.7%
50.0
%
0.0% 4.
2%
100.
0%
100.
0%
7.7%
66.7
%
0.0% 8.
3%
100.
0%
FY13 FY14 FY15
Provide an Efficient, Well-Connected Transportation Experience
87

TANGIBLE RESULT DRIVER:Phil Sullivan Maryland Transit Administration (MTA)
PERFORMANCE MEASURE DRIVER:Sharon Rutzebeck Motor Vehicle Administration (MVA)
PURPOSE OF MEASURE:To catalog all eligible transportation services and products that customers procure and MDOT will produce a percentage of those services through alternate methods other than in-person.
FREQUENCY:Semi-Annually
DATA COLLECTION METHODOLOGY:Formula accounts for total transportation services and products acquired by customers compared to those acquired by alternate methods.
NATIONAL BENCHMARK:FY2018 - 68%
PERFORMANCE MEASURE 5.5Percent of Transportation Services and Products Provided Through Alternative Service Delivery (ASD) Methods MDOT customers want easy and reliable access to procure transportation services and products. According to a 2015 Pew Research Center study, nearly two-thirds of Americans now own smartphones, and for many, these devices are a key entry point to the online world.
Presently, MVA, SHA, MDTA and MTA provide services and products to customers through alternative service delivery (ASD) methods such as web, kiosk, call center/IVR and mail-in. MDOT is researching the possibility of providing alternate customer access where applicable.
For the reporting period FY 2015 (July 2014 – June 2015), MVA conducted 57% of its customer transactions through ASD; SHA achieved 100% and MDTA was 84% of its total eligible services and products via alternate methods. Combined, these TBUs achieved an ASD rate of 78% which exceeds the FY 2018 national standard of 68%.
Provide an Efficient, Well-Connected Transportation Experience
88

PERFORMANCE MEASURE 5.5Percent of Transportation Services Provided Through Alternate Service Delivery Methods
Percent of Transportation Services Provided Through Alternative Delivery MethodsPM5.5
0.0%
20.0%
40.0%
60.0%
80.0%
100.0%
MVA ASD % SHA ASD % MDTA ASD %
FY13 (Jul-Dec) FY13 (Jan-Jun) FY14 (Jul-Dec) FY14 (Jan-Jun) FY15 (Jul-Dec) FY15 (Jan-Jun)
National FY18
(68 %)
0.0%
20.0%
40.0%
60.0%
MVA ASD %
44.7%45.5% 51.1%52.0%54.8% 56.9%
FY13 (Jul-Dec) FY13 (Jan-Jun) FY14 (Jul-Dec)FY14 (Jan-Jun) FY15 (Jul-Dec) FY15 (Jan-Jun)
National FY18
(68 %)
0.00%
50.00%
100.00%
SHA ASD %
100.
00%
100.
00%
100.
00%
100.
00%
100.
00%
100.
00%
FY13 (Jul-Dec) FY13 (Jan-Jun) FY14 (Jul-Dec)FY14 (Jan-Jun) FY15 (Jul-Dec) FY15 (Jan-Jun)
0.0
20.0
40.0
60.0
80.0
100.0
MDTA ASD %
70.5 73.3 79.3 84.2 85.8 84.3
FY13 (Jul-Dec) FY13 (Jan-Jun) FY14 (Jul-Dec)FY14 (Jan-Jun) FY15 (Jul-Dec) FY15 (Jan-Jun)
National FY18
(68 %)
$-
$10,000
$20,000
$30,000
$40,000
MTA ASD $
$16,
289 $3
0,16
0
$17,
567
$16,
763
$18,
606
$21,
008
FY13 (Jul-Dec) FY13 (Jan-Jun) FY14 (Jul-Dec)FY14 (Jan-Jun) FY15 (Jul-Dec) FY15 (Jan-Jun)
Provide an Efficient, Well-Connected Transportation Experience
89

TANGIBLE RESULT DRIVER:Phil Sullivan Maryland Transit Administration (MTA)
PERFORMANCE MEASURE DRIVER:Ralign T. Wells Maryland Aviation Administration (MAA)
PURPOSE OF MEASURE:To assess the percentage of the functionality of real-time signage and information systems offered that have such systems
FREQUENCY:Quarterly (for functionality)
Annually (for customer satisfaction)
DATA COLLECTION METHODOLOGY:Sampling of Real-Time signage or IVR systems to determine a percentage of functionality.
Survey users within to assess their opinion of usefulness and satisfaction with Real-Time Information Systems
NATIONAL BENCHMARK:N/A
PERFORMANCE MEASURE 5.6A AND 5.6BPercent of Functional Real-Time Signage Provided; Usefulness and Customer SatsisfactionMDOT customers of MTA, MVA, MAA, SHA and MDTA, benefit from “real-time” information systems installed throughout the transportation network offering users the most accurate information available to help them prepare for, and manage their time while using, statewide transportation services. For example, MTA Light Rail and bus services and MAA shuttles have or will soon offer next vehicle arrival information signage. MVA offers Interactive Voice Response (IVR) systems, providing users with predicted wait time information. CHART, a joint effort of MDOT, MDTA and MSP in cooperation with federal, state and local agencies, uses a teamwork approach and state of the art technology to provide “real-time” travel information to highway network users.
These real-time systems must be operational at all times to ensure that users have access to the best available information. System inspections are critical to ensuring that the information systems are functioning as designed. Further, annual surveys are being developed to assess customer satisfaction with the real-time information system.
Percent of Functional Real-Time Information Systems Provided FY2016PM5.6a - Percent (%) of Functional Real-Time Information Systems Provided FY 2016 - DONE
0.0%10.0%20.0%30.0%40.0%50.0%60.0%70.0%80.0%90.0%
100.0%
MTA CHART MAA MVA
FY16 (Jul-Sep) FY16 (Oct-Dec) FY16 (Jan-Mar) FY16 (Mar-Jun)
Functionalitydata not yet collected.
System not accepted and operational asof this time.
Provide an Efficient, Well-Connected Transportation Experience
90