providence water supply board - rhode island...providence, rhode island report on the financial...
TRANSCRIPT

step forward →
PROVIDENCE WATER SUPPLY BOARD (AN ENTERPRISE FUND OF THE CITY OF PROVIDENCE, RHODE ISLAND)
FINANCIAL STATEMENTS FOR THE YEARS ENDED JUNE 30, 2019 AND 2018

PROVIDENCE WATER SUPPLY BOARD (AN ENTERPRISE FUND OF THE CITY OF PROVIDENCE, RHODE ISLAND) CONTENTS
Independent Auditors’ Report 1-2 Management’s Discussion and Analysis 3-7 Financial Statements:
Statements of Net Position 8-9 Statements of Revenues, Expenses and Changes in Net Position 10 Statements of Cash Flows 11
Notes to the Financial Statements 12-31 Required Supplementary Information:
Schedule of Changes in the Net Pension Liability and Related Ratios 32 Schedule of Employer Contributions 33 Schedule of Investment Returns Schedule of Changes in the Total OPEB Liability and Related Ratios
34 35
Independent Auditors’ Report on Internal Control Over Financial Reporting and
on Compliance and Other Matters Based on an Audit of Financial Statements Performed in Accordance with Government Auditing Standards 36-37

1
Independent Auditors’ Report
To the Board of Directors of Providence Water Supply Board Providence, Rhode Island
Report on the Financial Statements
We have audited the accompanying financial statements of Providence Water Supply Board (Water Supply Board) of the City of Providence, Rhode Island, as of and for the years ended June 30, 2019 and 2018, and the related notes to the financial statements, as listed in the table of contents.
Management’s Responsibility for the Financial Statements
Management is responsible for the preparation and fair presentation of these financial statements in accordance with accounting principles generally accepted in the United States of America; this includes the design, implementation, and maintenance of internal control relevant to the preparation and fair presentation of financial statements that are free from material misstatement, whether due to fraud or error.
Auditors’ Responsibility
Our responsibility is to express an opinion on these financial statements based on our audits. We conducted our audits in accordance with auditing standards generally accepted in the United States of America and the standards applicable to financial audits contained in Government Auditing Standards, issued by the Comptroller General of the United States. Those standards require that we plan and perform the audit to obtain reasonable assurance about whether the financial statements are free from material misstatement.
An audit involves performing procedures to obtain audit evidence about the amounts and disclosures in the financial statements. The procedures selected depend on the auditors’ judgment, including the assessment of the risks of material misstatement of the financial statements, whether due to fraud or error. In making those risk assessments, the auditors consider internal control relevant to the entity’s preparation and fair presentation of the financial statements in order to design audit procedures that are appropriate in the circumstances, but not for the purpose of expressing an opinion on the effectiveness of the entity’s internal control. Accordingly, we express no such opinion. An audit also includes evaluating the appropriateness of accounting policies used and the reasonableness of significant accounting estimates made by management, as well as evaluating the overall presentation of the financial statements.
We believe that the audit evidence we have obtained is sufficient and appropriate to provide a basis for our audit opinions.

2
Opinion
In our opinion, the financial statements referred to above present fairly, in all material respects, the respective financial position of the Water Supply Board as of June 30, 2019 and 2018, and the respective changes in financial position and cash flows thereof for the years then ended in accordance with accounting principles generally accepted in the United States of America.
Emphasis of Matter
As discussed in Note 1, the financial statements of the Water Supply Board are intended to present the financial position, the changes in financial position and, where applicable, cash flows of only that portion of the business-type activities of the City of Providence that are attributable to the transactions of the Water Supply Board. They do not purport to, and do not, present fairly the financial position of the City of Providence as of June 30, 2019 and 2018, the changes in its financial position, or where applicable, its cash flows for the years then ended in conformity with accounting principles generally accepted in the United States of America. Our opinion is not modified with respect to this matter.
Other Matters
Required Supplementary Information
Accounting principles generally accepted in the United States of America require that the management’s discussion and analysis, and the pension and OPEB schedules, as listed in the table of contents, be presented to supplement the basic financial statements. Such information, although not a part of the basic financial statements, is required by the Governmental Accounting Standards Board, who considers it to be an essential part of financial reporting for placing the basic financial statements in an appropriate operational, economic or historical context. We have applied certain limited procedures to the required supplementary information in accordance with auditing standards generally accepted in the United States of America, which consisted of inquiries of management about the methods of preparing the information and comparing the information for consistency with management’s responses to our inquiries, the basic financial statements and other knowledge we obtained during our audit of the basic financial statements. We do not express an opinion or provide any assurance on the information because the limited procedures do not provide us with sufficient evidence to express an opinion or provide any assurance.
Other Reporting Required by Government Auditing Standards
In accordance with Government Auditing Standards, we have also issued our report dated January 27, 2020, on our consideration of the Water Supply Board’s internal control over financial reporting and on our tests of its compliance with certain provisions of laws, regulations, contracts, and grant agreements and other matters. The purpose of that report is solely to describe the scope of our testing of internal control over financial reporting and compliance and the results of that testing, and not to provide an opinion on the effectiveness of the Water Supply Board’s internal control over financial reporting or on compliance. That report is an integral part of an audit performed in accordance with Government Auditing Standards in considering the Water Supply Board’s internal control over financial reporting and compliance.
Cranston, Rhode Island January 27, 2020

PROVIDENCE WATER SUPPLY BOARD (AN ENTERPRISE FUND OF THE CITY OF PROVIDENCE, RHODE ISLAND) MANAGEMENT’S DISCUSSION AND ANALYSIS JUNE 30, 2019 AND 2018
3
The management of the Providence Water Supply Board (the Water Supply Board) offers readers of our financial statements the following narrative overview and analysis of our financial activities for the years ended June 30, 2019 and 2018.
Financial Statements
Our financial statements are prepared using proprietary fund (enterprise fund) accounting that uses the same basis of accounting as private-sector business enterprises. Under this method of accounting an economic resources measurement focus and the accrual basis of accounting are used.
Revenue is recorded when earned and expenses are recorded when incurred. The financial statements include statements of net position, statements of revenues, expenses and changes in net position, and statements of cash flows. These statements are followed by notes to the financial statements.
• The statements of net position present information on the assets and liabilities, with the difference between the two reported as net position. Over time, increases or decreases in net position may serve as a useful indicator of whether the financial position of the Water Supply Board is improving or deteriorating.
• The statements of revenues, expenses and changes in net position report the operating and nonoperating revenues and expenses of the Water Supply Board for the fiscal year with the difference - the net income or loss - being combined with any capital contributions to determine the change in net position for the fiscal year. That change combined with the previous year-end net position total reconciles to the net position at the end of the fiscal year.
• The statements of cash flows report cash and cash equivalents activity for the fiscal year resulting from operating activities, noncapital financing activities, capital and related financing activities, and investing activities. The net result of these activities added to the beginning of the year cash balance reconciles to the cash and cash equivalents balance at the end of the fiscal year.

PROVIDENCE WATER SUPPLY BOARD (AN ENTERPRISE FUND OF THE CITY OF PROVIDENCE, RHODE ISLAND) MANAGEMENT’S DISCUSSION AND ANALYSIS JUNE 30, 2019 AND 2018
4
Condensed Financial Information
2019 2018 2017
Total current assets $ 48,323,882 $ 58,575,820 $ 54,554,469Total long-term assets 441,096,391 406,430,789 391,547,959
Total assets 489,420,273 465,006,609 446,102,428
Deferred outflows of resources 3,396,558 3,418,884 4,739,191
Total current liabilities 14,062,833 13,098,064 11,953,738Total long-term liabilities 189,514,439 176,556,035 170,282,008
Total liabilities 203,577,272 189,654,099 182,235,746
Deferred inflows of resources 3,562,081 3,256,637 786,585
Net position:Net investment in capital assets 319,818,541 294,002,639 273,631,269 Restricted fund 33,525,802 43,396,562 41,155,297 Unrestricted fund (67,666,865) (61,884,444) (46,967,278)
Total Net Position $ 285,677,478 $ 275,514,757 $ 267,819,288
Total operating revenue $ 72,330,415 $ 75,085,420 $ 71,778,075 Total operating expenses 49,998,732 46,380,902 45,438,116 Depreciation 9,429,564 9,696,365 10,327,272
Total operating expenses including depreciation 59,428,296 56,077,267 55,765,388 Operating income 12,902,119 19,008,153 16,012,687
Nonoperating expense (3,655,366) (1,943,854) (2,622,675) Capital grants and contributions 915,968 4,245,111 405,252
Change in Net Position $ 10,162,721 $ 21,309,410 $ 13,795,264
*The 2017 data above reflects the information that was included in financial statements issued in a prior period. It does not reflect the restatements relative to the GASB Statement No. 75, Accounting and Financial Reporting for Postemployment Benefits Other than Pensions.

PROVIDENCE WATER SUPPLY BOARD (AN ENTERPRISE FUND OF THE CITY OF PROVIDENCE, RHODE ISLAND) MANAGEMENT’S DISCUSSION AND ANALYSIS JUNE 30, 2019 AND 2018
5
Financial Highlights
During the fiscal year 2019, the Water Supply Board had operating revenues that exceeded operating expenses by $10.2 million. These are primarily due to rate relief to support the continued commitment to the replacement of aging infrastructure, careful management of operating costs, and unexpended revenues allocated for restricted funds. Total assets were $489.4 million, up $24.4 million from last year’s total assets of $465.0 million. Current assets, principally cash, decreased by $10.3 million, and net plant increased by $34.8 million.
The Water Supply Board’s net position totaled $285.7 million at June 30, 2019, an increase of $10.2 million from June 30, 2018. The increase is the result of unexpended revenue allocated for restricted funds. Also, reflected in the change to our net position is net operating income of $12.9 million, net non-operating expenses of $3.7 million, and capital contributions of $0.9 million.
The Water Supply Board’s net position totaled $275.5 million at June 30, 2018, an increase of $21.3 million from June 30, 2017. The increase is the result of unexpended revenue allocated for restricted funds. Also reflected in the change to our net position is net operating income of $19.0 million, net non-operating expenses of $1.9 million, and capital contributions of $4.2 million.
The Water Supply Board’s total operating revenues were $72.3 million for fiscal year 2019 which was a $2.7 million or 3.67% decrease over the prior year. The primary reason for the decrease is the continued decline in consumption across all customer classes.
The Water Supply Board’s total operating revenues were $75.1 million for fiscal year 2018, which was $3.3 million more than fiscal year 2017. Total operating expenses of the water system amounted to $56.1 million, which was a slight increase over the prior year’s amount of $55.7 million. Fiscal year 2018 non-operating revenue consisted of interest income amounting to $1.1 million and other revenue which is derived from a tax relief payment agreement between the Water Supply Board and t h e Town of Foster. The agreement called for the Town of Foster to reimburse the Water Supply Board a total of $1.6 million plus interest over the next 10 years. Non-operating expense of $2.9 million was principally interest expense on long-term debt. Capital grants and contributions in fiscal year 2018 amounted to $4.2 million.

PROVIDENCE WATER SUPPLY BOARD (AN ENTERPRISE FUND OF THE CITY OF PROVIDENCE, RHODE ISLAND) MANAGEMENT’S DISCUSSION AND ANALYSIS JUNE 30, 2019 AND 2018
6
Capital Assets and Debt Administration
Capital Assets:
At June 30, 2019, the Water Supply Board had $440.2 million invested in various capital assets, including land, buildings and improvements, transmission and distribution mains, reservoirs, services, hydrants and appurtenances, machinery and equipment, and construction work in progress. This amount represents a net increase in capital assets of $34.8 million, or 8.6%, over the prior year.
At June 30, 2018, the Water Supply Board had $405.4 million invested in various capital assets. This amount represented a net increase of $15.0 million, or 3.8%, over the previous year.
Major project expenditures in fiscal year 2019 included (in millions):
* Water Distribution Main Rehabilitation (6” – 12”) $ 14.27* 102” & 78” Aqueducts – Inspection and Rehabilitation $ 6.99* Various Treatment Plant Improvements $ 1.50* Various Pumping Station Improvements
$ 1.42* Lead Service Replacements $ 0.86* Various Distribution Improvements $ 0.84* Various Storage Tank Improvements $ 0.83* Various Inspections and Improvements to PW $ 0.75* Computer/IT Improvements
$ 0.67* Asset Management System Upgrades $ 0.60* Full Scale Orthophosphate Integration $ 0.20* Renewable Energy Projects
$ 0.11* Various Transmission Main Improvements (16’ – 102”) $ 0.10* Administrative Facility Improvements $ 0.02
The Water Supply Board’s fiscal year 2019 capital budget included project expenditures of $25.34 million for infrastructure and capital projects. The major projects were: continuation of the water main replacements and upgrades, 102” and 78” aqueducts rehabilitation, replacement of lead services and aging fire hydrants, plant influent and aerator upgrades, and upgrades to aging pump stations. The majority of infrastructure projects are financed on a pay-as-you-go, cash basis from rate revenues. The major project – water main rehabilitation/replacement - was funded from bond proceeds issued through the Rhode Island Infrastructure Bank (RIIB) in fiscal year 2019. New major capital investments that will benefit ratepayers for many years are generally funded with long-term debt financing.

PROVIDENCE WATER SUPPLY BOARD (AN ENTERPRISE FUND OF THE CITY OF PROVIDENCE, RHODE ISLAND) MANAGEMENT’S DISCUSSION AND ANALYSIS JUNE 30, 2019 AND 2018
7
Private Side Lead Service Line Replacement Loan Program:
In February of 2017, The Rhode Island Public Utilities Commission (PUC) approved, as part of the application for new rates (PUC Docket 4618) $250,000 of rate revenue per year be used to finance a 0% interest loan with a 3-year repayment schedule program to assist homeowners replace the private side lead service lines that carry water from the water mains in the street to the home. This program is to address the reduction of lead found in homes that could be harmful to the residents, especially children.
The program entered into its first loan in April of 2018 and through June 30, 2019, 190 loans had been executed in the amount of $681,677.86. A 0% interest loan for $1 million from the RIIB allowed Providence Water to capitalize these loans at an accelerated rate.
Debt:
At June 30, 2019, the Water Supply Board had $120.4 million in bonds and notes outstanding versus $111.4 million in the previous year. This represented an increase of $8.9 million or 8.1%. Providence Water Supply Board sought and received approval from the RI Division of Public Utilities (the Division) to borrow $14.7 million from the RI Infrastructure Bank to finance the replacement and rehabilitation of water mains in the distribution system. The new $14.7 million was issued in June of 2019, and the necessary rates were approved by the PUC as a part of the new rates approved in February of 2017.
At June 30, 2018, the Water Supply Board had $111.4 million in bonds and notes outstanding versus $116.7 million in the previous year. This represented a decrease of $5.3 million, or 4.58%. This is due to the retirement of previously issued debt.
Subsequent Events
In December 2, 2019, Providence Water Supply Board filed a request for an increase in rates with the RI Public Utilities Commission.
On December 13, 2019, Providence Water entered into a new tax treaty with the Town of Scituate which will lock in the amount of taxes that Providence Water will pay to the Town for the watershed land for the next 10 years.
Union Contract
The labor force of the Water Supply Board, with the exception of management, is covered by a union contract which is effective for the period of July 1, 2019 through June 30, 2022.
Contacting Providence Water’s Financial Management
This financial report is designed to provide our customers, investors and creditors with a general overview of the Providence Water Supply Board’s finances and to illustrate the Providence Water Supply Board’s accountability for the monies it receives. If you have questions about this report or need additional financial information, please contact the Finance Department at the Providence Water Supply Board, 125 Dupont Drive, Providence, RI 02907.

EXHIBIT IPROVIDENCE WATER SUPPLY BOARD (AN ENTERPRISE FUND OF THE CITY OF PROVIDENCE, RHODE ISLAND) STATEMENTS OF NET POSITION JUNE 30, 2019 AND 2018
2019 2018Assets:
Current unrestricted assets:Cash and cash equivalents $ 1,398,434 $ 1,430,099 Accounts receivable, net of allowance for uncollectible accounts of $1,876,433 in 2019 and $1,205,140 in 2018 6,361,146 6,546,218 Accounts receivable - unbilled 3,570,344 4,392,511 Inventory 429,749 412,931 Other assets 52,174 65,495
Total current unrestricted assets 11,811,847 12,847,254
Current restricted assets: Cash and cash equivalents 35,698,462 45,374,638 Accounts receivable 672,942 217,794 Notes receivable - short term 140,631 136,134
Total current restricted assets 36,512,035 45,728,566
Total current assets 48,323,882 58,575,820
Capital assets:Land 25,220,803 24,342,006 Building and improvements 123,990,544 123,451,054 Improvements other than buildings 412,532,325 361,185,960 Machinery and equipment 40,598,540 33,510,818 Scituate Reservoir Project 18,681,695 18,681,695 Construction in progress 66,933,822 82,567,540
687,957,729 643,739,073 Less accumulated depreciation and amortization 247,778,320 238,348,756
Total capital assets, net 440,179,409 405,390,317
Other noncurrent assets: Notes receivable - long term 916,982 1,040,472
Deferred Outflows of Resources:OPEB-related deferred outflows of resources 903,277 - Pension-related deferred outflows of resources 2,493,281 3,418,884
Total deferred outflows of resources 3,396,558 3,418,884
Total assets and deferred outflows of resources 492,816,831 468,425,493
The accompanying notes are an integral part of the financial statements
8

EXHIBIT IPROVIDENCE WATER SUPPLY BOARD (AN ENTERPRISE FUND OF THE CITY OF PROVIDENCE, RHODE ISLAND) STATEMENTS OF NET POSITION (CONTINUED) JUNE 30, 2019 AND 2018
2019 2018Liabilities:
Current: Current portion of long-term debt $ 6,269,032 $ 6,077,425Due to City of Providence General Fund 770,963 656,560Accounts payable 1,369,261 1,330,981Accrued liabilities 2,667,344 2,701,094
11,076,600 10,766,060
Amounts to be paid from current restricted assets: Due to Water Resources Board 215,859 334,492Accounts payable 2,770,374 1,997,512
2,986,233 2,332,004
Total current liabilities 14,062,833 13,098,064
Noncurrent liabilities: General revenue bonds 114,091,836 105,310,253Net pension liability 51,964,714 50,780,782Total OPEB liability 23,457,889 20,465,000
Total noncurrent liabilities 189,514,439 176,556,035
Total liabilities 203,577,272 189,654,099
Deferred Inflows of Resources:OPEB-related deferred inflows of resources 2,948,701 2,355,000Pension-related deferred inflows of resources 613,380 901,637
Total deferred inflows of resources 3,562,081 3,256,637
Net Position: Net investment in capital assets 319,818,541 294,002,639 Restricted 33,525,802 43,396,562 Unrestricted (67,666,865) (61,884,444)
Total Net Position $ 285,677,478 $ 275,514,757
The accompanying notes are an integral part of the financial statements
9

EXHIBIT IIPROVIDENCE WATER SUPPLY BOARD (AN ENTERPRISE FUND OF THE CITY OF PROVIDENCE, RHODE ISLAND) STATEMENTS OF REVENUES, EXPENSES AND CHANGES IN NET POSITION FOR THE YEARS ENDED JUNE 30, 2019 AND 2018
2019 2018
Operating Revenues: Charges for services:
Water sales: General customers $ 51,288,398 $ 53,225,723Other local water suppliers 15,852,358 16,146,509Fire protection services 2,719,310 2,699,184
Maintenance charges and other revenue 2,470,349 3,014,004Total operating revenues 72,330,415 75,085,420
Operating Expenses: Source of supply 2,865,212 3,191,527Pumping operations 859,524 792,204Water treatment 8,615,608 7,792,596Transmission and distribution 6,165,986 6,508,566Charge for services provided by other City departments 839,167 839,167Customer accounts and service 3,990,544 3,700,265Administrative and general 19,075,957 16,145,222Depreciation 9,429,564 9,696,365Property taxes - other local governments 7,586,734 7,411,355
Total operating expenses 59,428,296 56,077,267
Operating Income 12,902,119 19,008,153
Nonoperating Revenue (Expense): Interest income 505,659 1,052,158Interest expense and other (3,059,841) (2,996,012) Loss on sale of asset (1,101,184)
Net nonoperating expense (3,655,366) (1,943,854)
Capital Grants and Contributions 915,968 4,245,111
Change in Net Position 10,162,721 21,309,410
Net Position - Beginning of Year 275,514,757 254,205,347
Net Position - End of Year $ 285,677,478 $ 275,514,757
The accompanying notes are an integral part of the financial statements
10

EXHIBIT IIIPROVIDENCE WATER SUPPLY BOARD (AN ENTERPRISE FUND OF THE CITY OF PROVIDENCE, RHODE ISLAND)
FOR THE YEARS ENDED JUNE 30, 2019 AND 2018
2019 2018Cash Flows from Operating Activities:
Receipts from customers $ 72,673,536 $ 73,429,595 Payments to vendors (21,733,004) (23,749,054) Payments to employees (22,782,502) (19,447,305)
Net cash provided by operating activities 28,158,030 30,233,236
Cash Flows from Capital and Related Financing Activities:Acquisition and construction of capital assets (45,319,840) (24,721,196) Interest and issuance costs paid on debt (3,059,841) (2,996,012) Proceeds from bond issuance 15,130,326 Principal payments on long-term debt (6,157,136) (5,352,407) Proceeds from note receivable 118,993 131,781 Capital grants 915,968 4,245,111
Net cash used in capital and related financing activities (38,371,530) (28,692,723)
Cash Flows from Investing Activities:Investment income 505,659 1,052,158
Net cash provided by investing activities 505,659 1,052,158
Net Increase (Decrease) in Cash and Cash Equivalents (9,707,841) 2,592,671
Cash and Cash Equivalents - Beginning of Year 46,804,737 44,212,066
Cash and Cash Equivalents - End of Year $ 37,096,896 $ 46,804,737
Unrestricted Cash and Cash Equivalents $ 1,398,434 $ 1,430,099 Restricted Cash and Cash Equivalents 35,698,462 45,374,638
$ 37,096,896 $ 46,804,737
Reconciliation of Operating Income to Net Cash Provided by Operating Activities:
Operating income $ 12,902,119 $ 19,008,153 Adjustments to reconcile operating income to net cash provided by operating activities:
Depreciation 9,429,564 9,696,365 Provision for doubtful accounts (205,964) 138,644 Changes in assets and liabilities:
(Increase) decrease in accounts receivable 758,055 (1,763,087) (Increase) decrease in inventories (16,818) 157,762 (Increase) decrease in other assets 13,321 48,221 (Increase) decrease in deferred outflows of resources 22,326 1,320,307 Increase (decrease) in due to other funds 114,403 (86,614) Increase (decrease) in accounts payable and accrued expenses 658,759 545,136 Increase (decrease) net pension liability 1,183,932 478,238 Increase (decrease) net OPEB liability 2,992,889 (1,779,941) Increase (decrease) in deferred inflows of resources 305,444 2,470,052
Net Cash Provided by Operating Activities $ 28,158,030 $ 30,233,236
STATEMENTS OF CASH FLOWS
The accompanying notes are an integral part of the financial statements
11

PROVIDENCE WATER SUPPLY BOARD (AN ENTERPRISE FUND OF THE CITY OF PROVIDENCE, RHODE ISLAND) NOTES TO FINANCIAL STATEMENTS
12
1. NATURE OF BUSINESS AND SIGNIFICANT ACCOUNTING POLICIES
A. REPORTING ENTITY
The Providence Water Supply Board, an enterprise fund of the City of Providence, (the Water Supply Board) was created in 1940 by Chapter 832 of the Public Laws of the State of Rhode Island. Membership of the Water Supply Board is comprised of four persons appointed by the Mayor, who serve for four-year staggered terms and two City Council members elected by the City Council who serve during their four-year City Council term. The Finance Director of the City of Providence also serves as an ex-officio Water Supply Board member.
The Water Supply Board provides water supply services through metered sales in Providence and parts of the surrounding communities of North Providence, Johnston and Cranston. The Water Supply Board also sells water to other local water supply systems on a wholesale basis. The Water Supply Board’s source of water supply is the Scituate Reservoir, located in the Town of Scituate, Rhode Island, and five tributary reservoirs.
The financial statements of the Providence Water Supply Board are intended to present the financial position, the changes in financial position and, where applicable, cash flows of only the business-type activities of the City of Providence that are attributable to the transactions of the Providence Water Supply Board. They do not purport to, and do not, present fairly the financial position of the City of Providence as of June 30, 2019, the changes in its financial position, or where applicable, its cash flows for the year then ended in conformity with accounting principles generally accepted in the United States of America.
B. SIGNIFICANT ACCOUNTING POLICIES
Basis of Presentation
The Water Supply Board is considered an enterprise fund of the City of Providence (the City). The operations of the Water Supply Board are accounted for with a separate set of self-balancing accounts organized on a Proprietary Fund type (Enterprise Fund) basis.
Enterprise Funds are used to account for operations (a) that are financed and operated in a manner similar to private business enterprises where the intent of the governing body is that the costs (including depreciation) of providing goods and services to the general public on a continuing basis be financed or recovered primarily through user charges; or (b) where the governing body has decided that periodic determination of revenues earned, expenses incurred, and/or change in net position is appropriate for capital maintenance, public policy, management control, accountability or other purposes.
The Water Supply Board utilizes the accrual basis of accounting, under which revenues are recognized when earned and expenses are recognized when incurred regardless of the timing of the related cash flows.
Regulations and Operations
The Water Supply Board is subject, as to rates and other matters, to the regulatory authority of the State of Rhode Island Public Utilities Commission (PUC).
Cash Equivalents
The Water Supply Board considers all highly liquid instruments with an original maturity of three months or less, when purchased, to be cash equivalents.

PROVIDENCE WATER SUPPLY BOARD (AN ENTERPRISE FUND OF THE CITY OF PROVIDENCE, RHODE ISLAND) NOTES TO FINANCIAL STATEMENTS
13
Investments
The Water Supply Board accounts for investments at fair values, which are established by quoted market prices in active markets that are accessible at the measurement date for identical, unrestricted assets. Fair value is defined as the price that two parties are willing to pay to acquire an asset or settle a liability in an orderly transaction in the market place.
Inventory
Inventory, consisting of materials and supplies, is valued at the lower of average cost or market using the first-in, first-out method.
Capital Assets, Depreciation and Amortization
Capital assets owned by the Water Supply Board are stated at cost and are defined as assets with an initial cost of more than $3,000 and an estimated useful life in excess of 1 year. Depreciation and amortization is provided over the estimated useful lives using the straight-line method. The estimated useful lives are as follows:
Building, source of supply structures and improvements 5-75 years Improvements other than buildings 3-75 years Equipment 3-50 years
Depreciation expense is not reflected for construction in progress until such time as it is placed in service. Assets under capital leases are amortized under the Water Supply Board’s normal depreciation policies for similar assets.
Restricted Funds for Construction of Assets
Restricted funds for construction of assets represent unexpended revenue bond proceeds obtained specifically for construction of water facilities, as well as revenues restricted for capital improvements by the PUC. These funds are included in restricted assets.
Capital Contributions
Capital contributions consist of property and equipment paid for by customers for water installations. Once the installation is complete, the property and equipment transfers to the Water Supply Board at fair value.
Impact Fees
The impact fees assessment was established in 1996 when the Water Supply Board acquired the water distribution system in the City of Cranston. As part of the agreement for the acquisition, the Water Supply Board assumed all operation obligation, benefits and assets, and debt service related to the water distribution system, and created an impact fee agreement with the City of Cranston. In accordance with the City of Cranston ordinance, impact fee for the water system improvement must be set aside by the City of Cranston and paid to the Water Supply Board or deducted from the debt services the Water Supply Board pays to the City of Cranston.

PROVIDENCE WATER SUPPLY BOARD (AN ENTERPRISE FUND OF THE CITY OF PROVIDENCE, RHODE ISLAND) NOTES TO FINANCIAL STATEMENTS
14
The impact fee is assessed by the City of Cranston based on the agreement with the Water Supply Board. If new water systems facilities are required to serve areas where no water system presently exists, the Water Supply Board will collect a subdivision processing fee, and the City of Cranston will collect a water impact fee for the benefit of the Water Supply Board as follows: 1) residential $1,352 per unit; and 2) industrial and commercial $6,003 per acre. The Water Supply Board in turn agreed to use the said impact fee solely for the purpose of construction of new water system facilities required to serve areas where no water system presently exists. In 2019, the $87,087 in fees that had been collected was recognized by the Water Supply Board as revenue. In 2018, the $81,878 in fees that had been collected was recognized by the Water Supply Board as revenue.
Revenues, Operating Revenues and Expenses
Revenues include amounts billed and unbilled to all customers, including those customers outside the City of Providence. All billed charges are based on rates approved by the PUC. Revenues for unbilled amounts to general customers are estimated based on billing amounts subsequent to year end. The Water Supply Board distinguishes operating revenues and expenses from nonoperating. Operating revenues result from charges to customers for water and related services. Operating expenses include the cost of operations, maintenance, sales and service, administrative expenses and depreciation. All revenues and expenses not meeting this definition are reported as nonoperating or capital contributions.
Concentration of Credit Risk
The Water Supply Board’s financial instruments that are exposed to concentrations of credit risk consist primarily of accounts receivable. Exposure to losses on receivables is principally dependent on each customer’s financial condition. Concentration of credit risk with respect to receivables is limited due to the large number of customers. The Water Supply Board monitors its exposure for credit losses and maintains allowances for anticipated losses.
Deferred Outflows/Inflows of Resources
In addition to assets, the statement of net position can report deferred outflows of resources. Deferred outflows of resources represent a consumption of net position that applies to a future period which will not be recognized as an outflow of resources (expense) until that later date. At June 30, 2019 and 2018, the Water Supply Board reports deferred outflows related to pension and OPEB in the statements of net position. A deferred outflow of resources related to pension results from differences between expected and actual experience, changes in assumptions or other inputs. These amounts are deferred and included in pension and OPEB expense in a systematic and rational manner over a period equal to the average of the expected remaining service lives of all employees that are provided with benefits through the pension and OPEB plans (active employees and inactive employees).
In addition to liabilities, the statement of net position can report deferred inflows of resources. Deferred inflows of resources represent the acquisition of net position that applies to a future period and which will not be recognized as an inflow of resources (revenue) until a later date. At June 30, 2019 and 2018, the Water Supply Board reports deferred inflows related to pension and OPEB in the statements of net position. A deferred inflow of resources related to pension and OPEB results from differences between expected and actual experience, changes in assumptions or other inputs. These amounts are deferred and included in pension and OPEB expense in a systematic and rational manner over a period equal to the average of the expected remaining service lives of all employees that are provided with benefits through the pension and OPEB plans (active employees and inactive employees).

PROVIDENCE WATER SUPPLY BOARD (AN ENTERPRISE FUND OF THE CITY OF PROVIDENCE, RHODE ISLAND) NOTES TO FINANCIAL STATEMENTS
15
Compensated Absences Employees accumulate sick leave hours for subsequent use or for payment upon retirement. Sick leave and vacation may be carried forward into the following calendar year, but not to exceed 135 days and 30 days, respectively. Vested sick leave and accumulated vacation leave are recorded as expenses and liabilities as the benefits accrue to employees. Use of Estimates
The preparation of the financial statements in conformity with accounting principles generally accepted in the United States of America requires management to make estimates and assumptions that affect the reported amounts of assets and liabilities and disclosure of contingent assets and liabilities as of the date of the financial statements and the reported amounts of revenues and expenses during the reporting period. Actual results could differ from those estimates.
2. RESTRICTED ASSETS
The State of Rhode Island enacted the Public Drinking Water Protection Act of 1987 (the Act) that empowers suppliers of public drinking water to levy a surcharge (the surcharge) of one cent ($0.01) per hundred gallons of water for all customers. The surcharge has been amended several times since 1987. The last increase was on July 1, 2002, when the surcharge increased to $0.0292 per hundred gallons of water for all customers. Of those collected funds, the Water Supply Board will retain 36.1% of the surcharge in its Water Quality Protection Fund, remit 57.0% to the State Water Resources Board and retain 6.9% for general operations. The funds collected in the Water Quality Protection Fund are to be expended in the following manner:
• at a minimum, 55% of the funds are to be spent for the acquisition of land or land rights or physical improvements to acquired land to protect the quality of the raw water of the water supply system;
• 35% may be used to acquire a fee simple interest or a conservation restriction that directly protects the quality and safety of the public drinking water supply; and
• 0% may be used by the supplier for any purpose relating to its operations.
The restricted investments are pooled with the cash and cash equivalents and investments of other funds maintained by the City of Providence. The earnings from investments are allocated in proportion to each fund’s balance.

PROVIDENCE WATER SUPPLY BOARD (AN ENTERPRISE FUND OF THE CITY OF PROVIDENCE, RHODE ISLAND) NOTES TO FINANCIAL STATEMENTS
16
3. CASH
The following is a summary of cash and investments as of June 30, 2019 and 2018:
2019 2018
Cash and cash equivalents $ 1,398,434 $ 1,430,099 Restricted cash and cash equivalents 35,698,462 45,374,638
$ 37,096,896 $ 46,804,737
Responsibility for custodial credit risk of deposits, investment risk, interest rate risk and concentration of investments rests with the City. However, the deposits for the Water Supply Board are supported by collateralization agreements with its main banking institutions. These agreements collateralize the deposits at 102%. Of the cash and cash equivalent balances at June 30, 2019 of $37,096,896, $250,000 is covered by Federal Deposit Insurance Corporation (FDIC) insurance and $1,148,434 of the balance is covered by the collateral agreements. Of the cash and cash equivalent balances at June 30, 2018 of $46,804,737, $250,000 is covered by FDIC insurance and $1,180,099 of the balance is covered by the collateral agreements.
4. CAPITAL ASSETS
The following is a summary of the activity in capital assets as of June 30, 2019:
Beginning Disposals/ Ending
Balance Additions Transfers Balance
Business-type activities:
Capital assets not being depreciated:
Land $ 24,342,006 $ 878,797 $ $ 25,220,803
Scituate Reservoir Project 18,681,695 18,681,695
Construction in progress 82,567,540 50,630,780 66,264,498 66,933,822
Total capital assets not being depreciated 125,591,241 51,509,577 66,264,498 110,836,320
Capital assets being depreciated:
Buildings and improvements 123,451,054 1,621,935 1,082,445 123,990,544
Sewer and infrastructure 361,185,960 51,346,365 412,532,325
Equipment 33,510,818 7,106,461 18,739 40,598,540
Total capital assets being depreciated 518,147,832 60,074,761 1,101,184 577,121,409
Less accumulated depreciation for:
Buildings and improvements 76,283,082 3,578,289 79,861,371
Sewer and infrastructure 132,060,079 4,793,305 136,853,384
Equipment 30,005,595 1,057,970 31,063,565
Total accumulated depreciation 238,348,756 9,429,564 - 247,778,320
Total capital assets being depreciated, net 279,799,076 50,645,197 1,101,184 329,343,089
Capital Assets, Net $ 405,390,317 $ 102,154,774 $ 67,365,682 $ 440,179,409

PROVIDENCE WATER SUPPLY BOARD (AN ENTERPRISE FUND OF THE CITY OF PROVIDENCE, RHODE ISLAND) NOTES TO FINANCIAL STATEMENTS
17
The following is a summary of the activity in capital assets as of June 30, 2018:
Beginning Disposals/ Ending
Balance Additions Transfers Balance
Capital assets not being depreciated:
Land $ 24,113,598 $ 228,408 $ $ 24,342,006
Scituate Reservoir Project 18,681,695 18,681,695
Construction in progress 85,556,950 48,676,675 51,666,085 82,567,540
Total capital assets not being depreciated 128,352,243 48,905,083 51,666,085 125,591,241
Capital assets being depreciated:
Buildings and improvements 117,974,309 5,476,745 123,451,054
Sewer and infrastructure 339,975,131 21,210,829 361,185,960
Equipment 32,722,062 788,756 33,510,818
Total capital assets being depreciated 490,671,502 27,476,330 - 518,147,832
Less accumulated depreciation for:
Buildings and improvements 71,950,734 4,332,348 76,283,082
Sewer and infrastructure 127,386,457 4,673,622 132,060,079
Equipment 29,315,200 690,395 30,005,595
Total accumulated depreciation 228,652,391 9,696,365 - 238,348,756
Total capital assets being depreciated, net 262,019,111 17,779,965 - 279,799,076
Capital Assets, Net $ 390,371,354 $ 66,685,048 $ 51,666,085 $ 405,390,317
5. LONG-TERM DEBT
The following is the long-term debt activity as of June 30, 2019:
Beginning Ending Due WithinBalance Additions Reductions Balance One Year
Bonds payable:
Revenue bonds $ 111,387,678 $ 15,130,326 $ 6,157,136 $ 120,360,868 $ 6,269,032 Net pension liability 50,780,782 1,183,932 51,964,714 Total OPEB liability 20,465,000 2,992,889 23,457,889
Long-Term Liabilities $ 182,633,460 $ 19,307,147 $ 6,157,136 $ 195,783,471 $ 6,269,032
2019

PROVIDENCE WATER SUPPLY BOARD (AN ENTERPRISE FUND OF THE CITY OF PROVIDENCE, RHODE ISLAND) NOTES TO FINANCIAL STATEMENTS
18
The following is the long-term debt activity as of June 30, 2018:
Beginning Ending Due WithinBalance Additions Reductions Balance One Year
Bonds payable:
Revenue bonds $ 116,740,085 $ $ 5,352,407 $ 111,387,678 $ 6,077,425 Net pension liability 50,302,544 478,238 50,780,782 Total OPEB liability 22,244,941 1,779,941 20,465,000
Long-Term Liabilities $ 189,287,570 $ 478,238 $ 7,132,348 $ 182,633,460 $ 6,077,425
2018
The following is a summary of bonds and notes outstanding at June 30, 2019 and 2018:
Amount ofInterest Outstanding Outstanding
Description Rate (%) June 30, 2019 June 30, 2018
Safe Drinking Water Bonds (CWFA FY2002) 3.61% $ 485,996 $ 637,250 Scituate Reservoir Project (PPBA FY 2011) 5.40% 76,853 Safe Drinking Water Bonds (CWFA FY2008) 2.85% 21,995,000 23,613,000 Safe Drinking Water Bonds (CWFA FY2010) .0410% to 3.14% 6,237,250 6,655,250 Safe Clean Water Bonds (CWFA FY2012) .072% to 3.26% 2,228,000 2,361,000 Safe Clean Water Bonds (CWFA FY2013) .019% - 2.53% 3,296,000 3,480,000 Safe Drinking Water Bonds (CWFA FY2013) .022% - 2.63% 20,785,000 21,855,000 Safe Drinking Water Bonds (CWFA FY2013) .022% - 3.01% 6,656,000 6,997,000 Safe Drinking Water Bonds (CWFA FY2015) .022% - 3.01% 27,373,000 28,693,000 Safe Drinking Water Bonds (CWFA FY2017) .022% to 1.95% 15,560,095 16,271,095 Safe Drinking Water Bonds (RIIB- FY2018) 0.00% 350,615 Safe Drinking Water Bonds (CWFA FY2019) .022% to 1.95% 14,700,000 East Smithfield Water District DWSRF Bonds Series 2009A (RIIB- FY2009 Bond) 3.51% 135,172 155,909 East Smithfield Water District DWSRF Loan Series 2009A (RIIB- FY2009 Loan) 3.00% 110,000 120,000 East Smithfield Water District DWSRF Bond Series 2014A (RIIB- FY2014 Bond) 1.30% - 3.43% 448,740 472,321
Total $ 120,360,868 $ 111,387,678

PROVIDENCE WATER SUPPLY BOARD (AN ENTERPRISE FUND OF THE CITY OF PROVIDENCE, RHODE ISLAND) NOTES TO FINANCIAL STATEMENTS
19
Scheduled principal maturities at June 30, 2019 of long-term debt are as follows:
Fiscal Year Principal
ARRA / SRF Principal
ForgivenessInterest and
Fees Total
2020 $ 6,269,032 $ (333,541) $ 3,007,334 $ 8,942,825 2021 7,184,262 (341,025) 3,018,265 9,861,502 2022 7,176,224 (348,269) 2,864,970 9,692,925 2023 7,024,989 (356,560) 2,701,330 9,369,759 2024 7,194,757 (365,004) 2,530,072 9,359,825 2025-2029 38,665,982 (1,947,633) 9,031,953 45,750,303 2030-2034 32,568,527 (1,766,254) 4,272,905 35,075,179 2035-2039 13,363,095 (503,950) 729,676 13,588,821 2040-2044 914,000 13,344 927,344
Total $ 120,360,868 $ (5,962,235) $ 28,169,849 $ 142,568,482
6. TRANSACTIONS WITH CITY OF PROVIDENCE, RHODE ISLAND
The City of Providence performs various services for the Water Supply Board including certain accounting, personnel and cash management services and working capital support. The total billing to the Water Supply Board for services performed amounted to $839,167 for each of the years ended June 30, 2019 and 2018. This amount is established by the City, approved by the Water Supply Board and ultimately approved by the PUC. The Water Supply Board also provides services to various City funds and departments, the charges for which have been included as revenue in the accompanying financial statements. Included within the due to City of Providence General Fund balance on the statements of net position are the related balances due for the services described above. The balance also includes payments for pension and post-employment benefits. The total balance due to the City of Providence General Fund at June 30, 2019 and 2018 totaled $770,963 and $656,560, respectively.
7. LINE OF CREDIT
The Water Supply Board opened a line of credit with Century Bank of $5,000,000 in 2013. This line of credit is used for infrastructure replacement and renewed annually per the agreement terms. The balance as of June 30, 2019 and 2018 was $-0-.
8. COMMITMENTS AND CONTINGENCIES
Risk Management
The Water Supply Board has a complete comprehensive insurance program protecting all facilities, employees and liability claims.
The Water Supply Board is subject to various claims and litigation that arise in the ordinary course of its operations. Legal counsel and management are of the opinion that the Water Supply Board’s liabilities in such cases, if decided adversely to the Water Supply Board, would not materially affect the financial statements.

PROVIDENCE WATER SUPPLY BOARD (AN ENTERPRISE FUND OF THE CITY OF PROVIDENCE, RHODE ISLAND) NOTES TO FINANCIAL STATEMENTS
20
Union Contract
The labor force of the Water Supply Board, with the exception of management, is covered by a union contract, which is effective for the period July 1, 2018 to June 30, 2022.
Lead Service Replacement Program
The Water Supply Board is committed to reducing lead at our customers’ taps. The Water Supply Board is striving to meet the Environmental Protection Agency (EPA) goal of 0 parts per million (ppm) of lead. In order to achieve this goal, the Water Supply Board has implemented a four-pronged approach.
Water Main Rehabilitation Distribution Water Main Flushing Corrosion Control Public Education and Outreach
Water Main Rehabilitation The Water Supply Board operates an aging distribution system, composed mainly of unlined cast iron pipes. The Water Supply Board is committed to renew and/or replace much of the buried infrastructure. Water main rehabilitation improves water quality, reduces pipe breaks and the resulting loss of service, curtails leakage, and improves hydraulic capacity as needed for residential, commercial, and industrial users and fire protection. The Water Supply Board’s Water Main Replacement/Rehabilitation Program (WMR) is now targeting areas of high iron and lead corrosion as indicated by LCR compliance sites and additional water quality monitoring within the distribution system. In FY 2019, the Water Supply Board rehabilitated 10.0 miles at a cost of approximately $14.3 million.
During FY 2019, the Water Supply Board replaced 481 public side lead services at a cost of $857,061. Since its inception of the reporting of the IFR program and the public lead services replacement program to the RIPUC (July 1, 1996), the Water Supply Board has replaced 18,668 lead services to the end of fiscal year 2019 (June 30, 2019) at cost of $60,097,833. In addition to replacing the public side lead services, the Water Supply Board has implemented a no interest, three-year loan program to encourage our customers to replace their (private) side of the lead service. The Water Supply Board has $250,000 per year allocated in rates to facilitate these loans. The Water Supply Board also has a $1 million loan with the Clean Water Finance Agency.
Corrosion Control The Water Supply Board is evaluating corrosion control treatment techniques. The Water Supply Board is working with a panel of nationally recognized corrosion control experts to optimize treatment. As part of this effort, the Water Supply Board implemented a full-scale pilot of orthophosphate treatment in the Fruit Hill section of our distribution system. If the pilot is successful, the Water Supply Board will implement orthophosphate system wide.
Flushing Program Beginning in 2013, the Water Supply Board initiated a unidirectional flushing (UDF) program to improve water quality through removal of accumulations from the distribution system. In FY 2019, the Water Supply Board flushed approximately 82 miles of main. Because of the Water Supply Board’s aging distribution system, some of the assets (valves and hydrants) that are utilized for flushing need to be repaired or replaced. In addition to the water quality benefits, the flushing program has the secondary benefit of being a valve exercise program.

PROVIDENCE WATER SUPPLY BOARD (AN ENTERPRISE FUND OF THE CITY OF PROVIDENCE, RHODE ISLAND) NOTES TO FINANCIAL STATEMENTS
21
Public Education and Outreach Utilizing social media, our website and direct mailings, the Water Supply Board provides educational material to our customers on the hazards of lead in water and the steps they can take to minimize lead at their tap. In addition, the Water Supply Board offers free lead testing for customers within our retail area.
9. DEFINED BENEFIT PENSION PLANS
Substantially all employees of the Water Supply Board participate in the Employees’ Retirement System of the City of Providence (ERS or the Plan), a defined-benefit, single-employer plan. Water Supply Board employees participating in the Plan are eligible to retire at age 55 if hired prior to July 1, 2004, at age 60 if hired between July 1, 2004 and June 30, 2009, at age 62 with 10 years of service if hired on or after July 1, 2009 or at any age after 25 years of service if hired prior to July 1, 1995, or at any age after 30 years of service if hired on or after July 1, 1995. The total retirement allowance is equal to an annuity, which is the actuarial equivalent of accumulated contributions at the time of retirement, plus a pension, which when added together either: 1) equals 1/40 of final compensation for each year of total service up to 20 years and 1/50 of final compensation for each year of service in excess of 20 years if hired prior to July 1, 1996; or 2) equals 1/50 of final compensation for each year of total service credited if hired on or after July 1, 1996. These benefit provisions and all other requirements are established by City ordinance.
ERS is governed by an Employee Retirement Board provided by the Providence Home Rule Charter. The ERS consists of elected officials, management and employee representation and provides for establishing rules and regulations and is responsible for the administration and operation of the City employee retirement system. The Board has the discretion and authority to interpret the Plan and to determine the eligibility and benefits of participants and beneficiaries pursuant to the provisions of the Plan. On all such matters, the decision of a majority of the then members of the Board shall govern and be binding upon the employer, participants and beneficiaries.
Membership of the ERS plan for the Water Supply Board consisted of the following at June 30, 2018, the date of the latest actuarial valuation:
Inactive plan members or beneficiaries currently receiving benefits 167 Inactive employees entitled to but not yet receiving benefits 27 Active employees 236
Total 430
The total pension liability was determined by an actuarial valuation as of June 30, 2018 and rolled forward to June 30, 2019, using the following actuarial assumptions, applied to all periods included in the measurement:
Inflation 3.50% Salary increases 3.50% per year, before reflecting increases due to longevity Investment rate of return 8.00%, net of pension plan investment expense, including
inflation
For the year ended June 30, 2019, the annual money-weighted rate of return on pension plan investments, net of pension plan investment expenses, was 4.50%. The money-weighted rate of return expresses investment performance, net of investment expense, adjusted for the changing amounts actually invested.

PROVIDENCE WATER SUPPLY BOARD (AN ENTERPRISE FUND OF THE CITY OF PROVIDENCE, RHODE ISLAND) NOTES TO FINANCIAL STATEMENTS
22
The Plan’s investment policy in regard to the allocation of invested assets is established and may be amended by the City. It is the policy of the City to pursue an investment strategy that reduces risk through the prudent diversification of the portfolio across a broad selection of distinct asset classes. The pension Plan’s investment policy discourages the use of cash equivalents, except for liquidity purposes, and aims to refrain from dramatically shifting asset class allocations over short time spans.
The long-term expected rate of return on Plan investments was determined using a building block method in which best-estimate ranges of expected future real rates of return (expected returns, net of pension plan investment expense and inflation) are developed for each major asset class. These ranges are combined to produce the long-term expected rate of return by weighting the expected future real rates of return by the target asset allocation percentage and by adding expected inflation. Best estimates of arithmetic real rates of return for each major asset class included in the pension plan’s target allocation as of June 30, 2019 are summarized as follows:
Asset Class
Target Allocation
Long-Term Expected Real Rate of Return
Domestic equity 45.25 % 6.16 %International developed markets equity 12.75 6.69Core fixed income 26.00 1.89Hedge fund, GTAA, Risk parity 16.00 3.68
100.00 %
Contributions
Class A members and police officers are required to contribute 8% of their salary to the Plan. Class B members, other than police officers, are required to contribute 9.5% of their salary to the Plan. Water Supply Board employees are Class A members. The Mayor and City Council contribute to the Plan at a rate of $350 per year. Additionally, the City shall contribute from time to time amounts sufficient with the contributions of elected officials to provide the special pensions granted to them. The Water Supply Board’s contributions to the ERS for the year ended June 30, 2019 was $4,180,000.
Investment Policy
The City policy for pension investments is under the oversight of the Board of Investment Commissioners (the Board). The Board contracts with an investment advisory firm and approves any new investment vehicles presented by the consultant. The Board follows all applicable state statutes and Section 17-189 of the City Ordinance, which states, “The Board of Investment Commissioners is authorized and empowered to execute the disposition and investment of the funds which are within its control in any securities and investments as would be acquired by prudent persons of discretion and intelligence in these matters, who are seeking a reasonable income and the preservation of their capital.”
Net Pension Liability
The net pension liability was measured as of June 30, 2019, and the total pension liability used to calculate the net pension liability was determined by an actuarial valuation as of that date.

PROVIDENCE WATER SUPPLY BOARD (AN ENTERPRISE FUND OF THE CITY OF PROVIDENCE, RHODE ISLAND) NOTES TO FINANCIAL STATEMENTS
23
The components of the net pension liability of the Retirement System for the Water Supply Board were as follows:
June 30, 2019 June 30, 2018
Total pension liability $ 70,014,956 $ 68,687,560Plan fiduciary net position 18,050,242 17,906,778
Net Pension Liability $ 51,964,714 $ 50,780,782
Plan fiduciary net position as a percentageof the total pension liability 25.78% 26.07%
Changes in the Net Pension Liability for the Water Supply Board
Total Pension Plan Fiduciary Net PensionLiability Net Position Liability
(a) (b) (a)-(b)
Balances as of July 1, 2018 $ 68,687,560 $ 17,906,778 $ 50,780,782
Changes for the year:Service cost 979,926 979,926Interest on total pension liability 5,396,418 5,396,418Differences between expected and actual experience 107,440 107,440Employer contributions 4,180,000 (4,180,000)Member contributions 634,544 (634,544)Net investment income 764,455 (764,455)Benefit payments, including refund to employee contributions (5,156,388) (5,426,927) 270,539 Administrative expenses (8,608) 8,608
Net changes 1,327,396 143,464 1,183,932
Balances as of June 30, 2019 $ 70,014,956 $ 18,050,242 $ 51,964,714
Increase (Decrease)

PROVIDENCE WATER SUPPLY BOARD (AN ENTERPRISE FUND OF THE CITY OF PROVIDENCE, RHODE ISLAND) NOTES TO FINANCIAL STATEMENTS
24
Total Pension Plan Fiduciary Net PensionLiability Net Position Liability
(a) (b) (a)-(b)
Balances as of July 1, 2017 $ 67,816,389 $ 17,513,845 $ 50,302,544
Changes for the year:Service cost 980,977 980,977Interest on total pension liability 5,258,402 5,258,402Differences between expected and actual experience 288,353 288,353Change from inputs in proportionate share (478,117) (54,698) (423,419)Employer contributions 3,828,000 (3,828,000)Member contributions 610,831 (610,831)Net investment income 1,198,417 (1,198,417)Benefit payments, including refund to employee contributions (5,178,444) (5,178,444) - Administrative expenses (11,173) 11,173
Net changes 871,171 392,933 478,238
Balances as of June 30, 2018 $ 68,687,560 $ 17,906,778 $ 50,780,782
Increase (Decrease)
Additional information as of the latest actuarial valuation follows:
Valuation Date July 1, 2018 Actuarial cost method Entry age normal cost method Amortization cost method Level dollar for the 1995 deferral liability and
increasing 3.5% per year for the remaining unfunded liability.
Remaining amortization period Market value of assets as represented by the City less unrecognized returns in each of the last five years plus the discounted contribution paid by the city in the following year. Unrecognized return is equal to the difference between the actual market return and the expected market return and is recognized over a five-year period, further adjusted, if necessary, to be within 20% of the market value.
Actuarial assumptions: Investment rate of return
8.00%, net of pension plan investment and administrative expenses, including inflation.
Inflation rate 3.50% Projected salary increases 3.50% per year before reflecting increases due
to longevity compensation

PROVIDENCE WATER SUPPLY BOARD (AN ENTERPRISE FUND OF THE CITY OF PROVIDENCE, RHODE ISLAND) NOTES TO FINANCIAL STATEMENTS
25
Cost of living adjustments COLAs commence on January 1, 2023, except for participants identified by the City who opted out of the Consent Judgements agreed to by the City. For these participants, COLAs will commence on January 1, 2036, when the Plan was projected to be greater than 70% funded with the prior valuation. Any Class B retired participant whose total benefit is greater than the base of compensation of a current employee holding the same rank that the retiree held at the time of retirement will not receive a COLA in any year until this is no longer true. We have assumed that Class B average compensation for all ranks will increase by 3.5% per year. Future COLAs will not exceed 3% per year.
Mortality Rates: Healthy: RP-2006 Employee and Healthy Annuitant Mortality Tables projected generationally with Scale BB2D, set forward 1-year post-retirement for Class A employees and the RP-2006 Blue Collar Employee and Healthy Annuitant Mortality Tables projected generationally with Scale BB2D, set forward 1-year post-retirement for Class B employees. Disabled Retiree: RP-2006 Blue Collar Healthy Annuitant Mortality Table projected generationally with Scale BB2D, set forward three years.
Discount Rate
The discount rate used to measure the total pension liability at June 30, 2019 and 2018 was 8.00%. The projection of cash flows used to determine the discount rate assumed plan member contributions will be made at the current contribution rate and that the City of Providence’s contributions will be made at the actuarially determined contribution rates. Based on those assumptions, the pension plan’s fiduciary net position was projected to be available to make all projected future benefit payments of current plan members. Therefore, the long-term expected rate of return on pension plan investments was applied to all periods of projected benefit payments to determine the total pension liability.
Sensitivity of the Net Pension Liability to Changes in the Discount Rate.
The following presents the net pension liability of the Retirement System, calculated using the discount rate of 8.00%, as well as what the System’s net pension liability would be if it were calculated using a discount rate that is 1 percentage point lower (7.00%) or 1 percentage point higher (9.00%) than the current rate at June 30, 2019:
1% Decrease
(7.00%)
Current Discount
Rate (8.00%)
1% Increase (9.00%)
Net Pension Liability $ 59,785,158 $ 51,964,714 $ 45,420,426

PROVIDENCE WATER SUPPLY BOARD (AN ENTERPRISE FUND OF THE CITY OF PROVIDENCE, RHODE ISLAND) NOTES TO FINANCIAL STATEMENTS
26
The following presents the net pension liability of the Retirement System, calculated using the discount rate of 8.00%, as well as what the System’s net pension liability would be if it were calculated using a discount rate that is 1 percentage point lower (7.00%) or 1 percentage point higher (9.00%) than the current rate at June 30, 2018:
1% Decrease
(7.00%)
Current Discount
Rate (8.00%)
1% Increase (9.00%)
Net Pension Liability $ 58,406,765 $ 50,780,782 $ 44,397,801
Pension Expense and Deferred Outflows of Resources and Deferred Inflows of Resources Related to Pensions
For the years ended June 30, 2019 and 2018, the Water Supply Board recognized pension expense of $6,001,525 and $5,741,597, respectively.
At June 30, 2019, the Water Supply Board reported deferred outflows of resources and deferred inflows of resources related to pensions from the following sources:
Deferred Outflows of Resources
Deferred Inflows of Resources
Differences between expected and actual experience $ 491,266 $ 43,434 Changes of assumptions 604,887Changes in proportion and differences between
employer contributions and proportionate share of contributions 755,911 569,946
Net difference between projected and actual earningon pension plan investments 641,217
$ 2,493,281 $ 613,380
At June 30, 2018, the Water Supply Board reported deferred outflows of resources and deferred inflows of resources related to pensions from the following sources:
Deferred Outflows of Resources
Deferred Inflows of Resources
Differences between expected and actual experience $ 592,546 $ 87,128 Changes of assumptions 1,211,752Changes in proportion and differences between
employer contributions and proportionate share of contributions 1,208,421 814,509
Net difference between projected and actual earningon pension plan investments 406,165
$ 3,418,884 $ 901,637

PROVIDENCE WATER SUPPLY BOARD (AN ENTERPRISE FUND OF THE CITY OF PROVIDENCE, RHODE ISLAND) NOTES TO FINANCIAL STATEMENTS
27
Amounts reported as deferred outflows of resources and deferred inflows of resources related to pensions will be recognized in pension expense as follows:
Year Ending June 30:
2020 $ 1,380,1272021 77,8332022 216,0692023 205,872 $ 1,879,901
Payable to the Plan
At June 30, 2019, the Water Supply Board had made full payment of the required pension contribution for the year ended June 30, 2019.
10. POST EMPLOYMENT BENEFITS
Plan Description
The Water Supply Board’s Post-Employment Medical Benefit Plan is a single-employer defined benefit postretirement health insurance program administered by the City. The City provides for a portion of the lifetime health care benefits to substantially all retired employees and their spouses. Health care benefits are provided through the City’s self-insured health insurance program covering both active and retired employees. The Plan does not issue a separate financial report. These benefits are provided for and amended under various provisions of Rhode Island General Law, City Ordinances and the terms of collective bargaining agreements.
OPEB Funding Policy
The contribution requirements of plan members and the City are established and may be amended through provisions of Rhode Island General Law, City Ordinances and through collective bargaining. The required contribution is based on pay as you go financing requirements. The Plan can cover 100% of the costs of the benefit; however, retirees and their spouses are potentially required to fund a portion of the Plan costs depending upon the class an employee has been assigned and their date of hire. Current employee co-share for the retiree health insurance benefit requires a co-share of .01 of final average salary with a maximum limit of $400.
The following is a current census of the Water Supply Board participants as of July 01, 2018:
Active members 205 Retirees 128 Total 333
Total OPEB Liability
For the years ended June 30, 2019 and 2018, the Water Supply Board recognized OPEB liability of $23,457,889 and $20,465,000, respectively.

PROVIDENCE WATER SUPPLY BOARD (AN ENTERPRISE FUND OF THE CITY OF PROVIDENCE, RHODE ISLAND) NOTES TO FINANCIAL STATEMENTS
28
Actuarial Assumptions and Other Inputs
The total OPEB liability at June 30, 2019 was measured by an actuarial valuation as of June 30, 2018 using the following actuarial assumptions and other inputs, applied to all periods included in the measurement unless otherwise specified:
Inflation
3.50%
Salary increases
3.50% per year before reflecting longevity. Longevity compensation varies from 3.0% to 11.0% based on years of service, date of hire and Class
Health care trend rates
Non-Medicare medical: 7.0% decreasing by 0.25% for 10 years to an ultimate level of 4.5% per year
Medicare medical: 6.0% decreasing by 0.25% for 6 years to an ultimate level of 4.5% per year
Prescription drug: 9.0% decreasing by 0.25% for 18 years to an ultimate level of 4.5% per year
Part B: 4.5%
Administrative: 3.0%
Mortality rates
Pre-Retirement
Class A Heathy: RP-2006 Employee Mortality Table projected generationally with Scale BB2D
Class B Heathy: RP-2006 Blue Collar Healthy Annuitant Mortality Table projected generationally with Scale BB2D
Post-Retirement
Class A Heathy: RP-2006 Healthy Annuitant Mortality Table projected generationally with Scale BB2D, set forward one year
Class B Heathy: RP-2006 Blue Collar Healthy Annuitant Mortality Table projected generationally with Scale BB2D, set forward one year
Class A and B Disabled Retirees: RP-2006 Blue Collar Healthy Annuitant Mortality Table projected generationally with Scale BB2D, set forward three years

PROVIDENCE WATER SUPPLY BOARD (AN ENTERPRISE FUND OF THE CITY OF PROVIDENCE, RHODE ISLAND) NOTES TO FINANCIAL STATEMENTS
29
Changes in the Total OPEB Liability for the Water Supply Board
Total OPEBLiability
Balances as of July 1, 2018 $ 20,465,000
Changes for the year: Service cost 519,464 Interest on total OPEB liability 819,280 Changes in assumptions (1,003,396) Differences between expected and actual experience 1,083,932 Change from difference in proportionate share 2,221,628 Benefit payments (648,019)
Net changes 2,992,889
Balances as of June 30, 2019 $ 23,457,889
Changes of assumptions reflect a change in the discount rate from 3.58% as of June 30, 2017 to 3.87% as of June 30, 2018.
Total OPEBLiability
Balances as of July 1, 2017 $ 22,244,941
Changes for the year: Service cost 702,371 Interest on total OPEB liability 653,760 Changes in assumptions (2,858,494) Change from difference in proportionate share 257,102 Benefit payments (534,680)
Net changes (1,779,941)
Balances as of June 30, 2018 $ 20,465,000
Changes of assumptions reflect a change in the discount rate from 2.85% as of June 30, 2016 to 3.58% as of June 30, 2017.

PROVIDENCE WATER SUPPLY BOARD (AN ENTERPRISE FUND OF THE CITY OF PROVIDENCE, RHODE ISLAND) NOTES TO FINANCIAL STATEMENTS
30
Sensitivity of the Total OPEB Liability to Changes in the Discount Rate
The following presents the total OPEB liability of the City, as well as what the City’s total OPEB liability would be if it were calculated using a discount rate that is 1 percentage point lower (2.87%) or 1 percentage point higher (4.87%) than the current discount rate at June 30, 2019:
CurrentDiscount
1% Decrease Rate 1% Increase2.87% 3.87% 4.87%
Total OPEB Liability $ 27,186,053 $ 23,457,889 $ 20,485,988
The following presents the total OPEB liability of the City, as well as what the City’s total OPEB liability would be if it were calculated using a discount rate that is 1 percentage point lower (2.58%) or 1 percentage point higher (4.58%) than the current discount rate at June 30, 2018:
CurrentDiscount
1% Decrease Rate 1% Increase2.58% 3.58% 4.58%
Total OPEB Liability $ 24,216,062 $ 20,465,000 $ 17,546,733
Sensitivity of the Total OPEB Liability to Changes in the Healthcare Cost Trend Rates
The following presents the total OPEB liability of the City, as well as what the City’s total OPEB liability would be if it were calculated using healthcare cost trend rates that are 1 percentage point lower or 1 percentage point higher than the current healthcare cost trend rates at June 30, 2019:
HealthcareCost Trend
1% Decrease Rate 1% Increase
Total OPEB Liability $ 20,048,240 $ 23,457,889 $ 27,828,133
The following presents the total OPEB liability of the City, as well as what the City’s total OPEB liability would be if it were calculated using healthcare cost trend rates that are 1 percentage point lower or 1 percentage point higher than the current healthcare cost trend rates at June 30, 2018:
HealthcareCost Trend
1% Decrease Rate 1% Increase
Total OPEB Liability $ 19,877,371 $ 20,465,000 $ 21,145,453
PROVIDENCE WATER SUPPLY BOARD (AN ENTERPRISE FUND OF THE CITY OF PROVIDENCE, RHODE ISLAND) NOTES TO FINANCIAL STATEMENTS
31
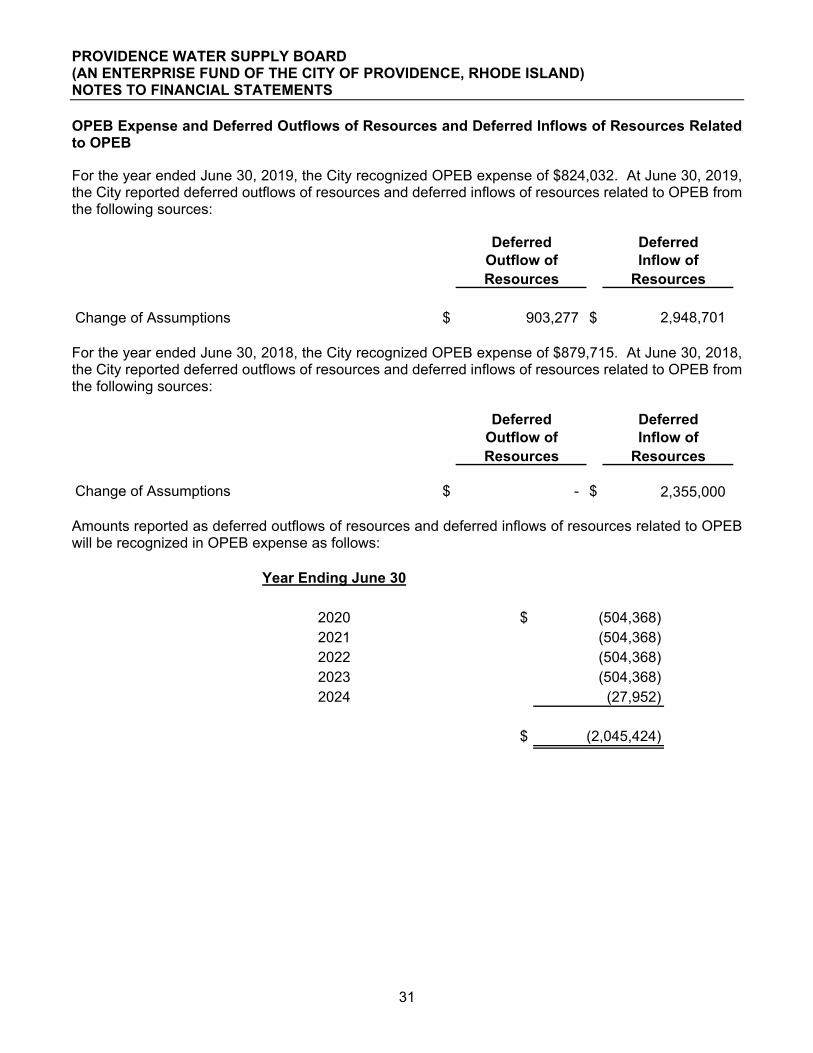
OPEB Expense and Deferred Outflows of Resources and Deferred Inflows of Resources Related to OPEB
For the year ended June 30, 2019, the City recognized OPEB expense of $824,032. At June 30, 2019, the City reported deferred outflows of resources and deferred inflows of resources related to OPEB from the following sources:
Deferred DeferredOutflow of Inflow ofResources Resources
Change of Assumptions $ 903,277 $ 2,948,701
For the year ended June 30, 2018, the City recognized OPEB expense of $879,715. At June 30, 2018, the City reported deferred outflows of resources and deferred inflows of resources related to OPEB from the following sources:
Deferred DeferredOutflow of Inflow ofResources Resources
Change of Assumptions $ - $ 2,355,000
Amounts reported as deferred outflows of resources and deferred inflows of resources related to OPEB will be recognized in OPEB expense as follows:
Year Ending June 30
2020 $ (504,368) 2021 (504,368) 2022 (504,368) 2023 (504,368) 2024 (27,952)
$ (2,045,424)

RSI-1PROVIDENCE WATER SUPPLY BOARD (AN ENTERPRISE FUND OF THE CITY OF PROVIDENCE, RHODE ISLAND) SCHEDULE OF CHANGES IN NET PENSION LIABILITY AND RELATED RATIOS LAST SIX FISCAL YEARS*
2019 2018 2017 2016 2015 2014
Total pension liability:Service cost $ 979,926 $ 980,977 $ 1,017,119 $ 941,053 $ 854,182 $ 893,162 Interest 5,396,418 5,258,402 5,172,289 5,130,041 5,509,989 4,946,549 Differences between expected and actual experience 107,440 288,353 579,761 (223,279) 79,253 Change from difference in proportionate share (478,117) (1,181,115) 3,875,236 Changes of assumptions 3,083,805 40,391 Benefit payments, including refunds of member contributions (5,156,388) (5,178,444) (5,178,542) (5,531,918) (4,663,093) (4,973,233)
Net change in total pension liability 1,327,396 871,171 409,512 7,274,938 1,820,722 866,478 Total pension liability - beginning 68,687,560 67,816,389 67,406,877 60,131,939 58,311,217 57,444,739
Total pension liability - ending 70,014,956 68,687,560 67,816,389 67,406,877 60,131,939 58,311,217
Plan fiduciary net position: Contributions - employer 4,180,000 3,828,000 3,636,754 3,615,102 3,212,354 2,945,209 Contributions - member 634,544 610,831 573,624 615,760 1,037,505 911,508 Net investment income 764,455 1,198,417 1,752,168 401,320 331,724 1,210,438 Change from difference in proportionate share (54,698) (298,595) 1,086,733 Benefit payments, including refunds of member contributions (5,426,927) (5,178,444) (5,178,542) (5,531,918) (4,663,093) (4,973,233) Administrative expense (8,608) (11,173) (12,559) (9,408) (9,367) (71,955)
Net change in plan fiduciary net position 143,464 392,933 472,850 177,589 (90,877) 21,967 Plan fiduciary net position - beginning 17,906,778 17,513,845 17,040,995 16,863,406 16,954,283 16,932,316
Plan fiduciary net position - ending 18,050,242 17,906,778 17,513,845 17,040,995 16,863,406 16,954,283
Net Pension Liability - Ending $ 51,964,714 $ 50,780,782 $ 50,302,544 $ 50,365,882 $ 43,268,533 $ 41,356,934
Plan fiduciary net position as a percentage of the total pension liability 25.78% 26.07% 25.83% 25.28% 28.04% 29.08%
Covered payroll $ 13,580,693 $ 13,790,686 $ 12,980,186 $ 13,096,208 $ 12,930,447 $ 11,900,000
Net pension liability as a percentage of covered payroll 382.64% 368.23% 387.53% 384.58% 334.63% 347.54%
*Notes:
2. This schedule is intended to show information for 10 years - additional years will be displayed as they become available.1. The amounts presented for each fiscal year were determined as of a June 30 measurement date prior to the fiscal year end.
32

RSI-2PROVIDENCE WATER SUPPLY BOARD (AN ENTERPRISE FUND OF THE CITY OF PROVIDENCE, RHODE ISLAND) SCHEDULE OF EMPLOYER CONTRIBUTIONSLAST SIX FISCAL YEARS*
2019 2018 2017 2016 2015 2014
Actuarially determined contribution $ 4,180,000 $ 3,828,000 $ 3,636,754 $ 3,615,102 $ 3,212,354 $ 2,945,209 Contributions in relation to the actuarially
determined contribution 4,180,000 3,828,000 3,636,754 3,615,102 3,212,354 2,945,209
Contribution deficiency (excess) $ - $ - $ - $ - $ - $ -
Covered payroll $ 13,580,693 $ 13,790,686 $ 12,980,186 $ 13,096,208 $ 12,930,447 $ 11,900,000
Contributions as a percentage of covered payroll 30.78% 27.76% 28.02% 27.60% 24.84% 24.75%
Notes to Schedule
Valuation date: July 1, 2018Measurement date: June 30, 2019Actuarially determined contribution rates are calculated as of June 30, two years prior to the end of the fiscal year in which contributions are reported
Methods and assumptions used to determine contribution rates: Actuarial cost method Individual entry age methodAmortization method Level dollar for the 1995 deferral liability and increasing 3.5% per year for the remaining unfunded liability.Remaining amortization period 24 years remaining as of July 1, 2017 (15 years remaining as of July 1, 2016 for the 1995 deferral).Asset valuation method
Inflation 3.50%Salary increases 3.50% per year before reflecting increases due to longevity compensationDiscount rate 8.00%Investment rate of return 8.00%, net of pension plan investment and administrative expenses, including inflation.Benefit changes There have been no changes in benefit provisions since GASB 67/68 implementation.Cost of living adjustments
*Note - This schedule is intended to show information for 10 years - additional years will be displayed as they become available.
Market value of assets as represented by the City less unrecognized returns in each of the last five years plus the discounted contribution paid by the city in the following year. Unrecognized return is equal to the difference between the actual market return and the expected market return and is recognized over a five-year period, further adjusted, if necessary, to be within 20% of the market value.
COLAs commence on January 1, 2023, except for participants identified by the City who opted out of the Consent Judgements agreed to by the City. For these participants, COLAs will commence on January 1, 2036, when the Plan was projected to be greater than 70% funded with the prior valuation. Any ClassB retired participant whose total benefit is greater than the base of compensation of a current employee holding the same rank that the retiree held at the time of retirement will not receive a COLA in any year until this is no longer true. We have assumed that Class B average compensation for all ranks will increase by 3.5% per year. Future COLAs will not exceed 3% per year.
33

RSI-3PROVIDENCE WATER SUPPLY BOARD (AN ENTERPRISE FUND OF THE CITY OF PROVIDENCE, RHODE ISLAND) SCHEDULE OF INVESTMENT RETURNSLAST SIX FISCAL YEARS*
2019 2018 2017 2016 2015 2014
Annual money-weighted rate of return, net of investment expense 4.50% 7.30% 12.20% 2.60% 5.56% 14.04%
1. The amounts presented for each fiscal year were determined as of a June 30 measurement date prior to the fiscal year end.
*Notes:
2. This schedule is intended to show information for 10 years - additional years will be displayed as they become available.
34

RSI-4PROVIDENCE WATER SUPPLY BOARD (AN ENTERPRISE FUND OF THE CITY OF PROVIDENCE, RHODE ISLAND) SCHEDULE OF CHANGES IN THE TOTAL OPEB LIABILITY AND RELATED RATIOSLAST TWO FISCAL YEARS*
2019 2018
Total OPEB liability: Service cost $ 519,464 $ 702,371 Interest on the total OPEB liability 819,280 653,760 Changes of assumptions (1,003,396) (2,858,494) Differences between expected and actual experience 1,083,932 Change from difference in proportionate share 2,221,628 257,102 Benefit payments (648,019) (534,680)
Net change in total OPEB liability 2,992,889 (1,779,941) Total OPEB liability - beginning 20,465,000 22,244,941
Total OPEB Liability - Ending $ 23,457,889 $ 20,465,000
*Note - This schedule is intended to show information for 10 years - additional years will be displayed as they become available.
35

36
Independent Auditors’ Report on Internal Control over Financial Reporting and on Compliance and Other Matters Based on an Audit of Financial Statements Performed in Accordance with Government Auditing Standards
To the Board of Directors Providence Water Supply Board Providence, Rhode Island
We have audited, in accordance with the auditing standards generally accepted in the United States of America and the standards applicable to financial audits contained in Government Auditing Standards, issued by the Comptroller General of the United States, the financial statements of the Providence Water Supply Board (the Water Supply Board), as of and for the year ended June 30, 2019, and the related notes to the financial statements, which collectively comprise the Water Supply Board’s basic financial statements, and have issued our report thereon dated January 27, 2020.
Internal Control over Financial Reporting
In planning and performing our audit of the financial statements, we considered the Water Supply Board’s internal control over financial reporting (internal control) to determine the audit procedures that are appropriate in the circumstances for the purpose of expressing our opinions on the financial statements, but not for the purpose of expressing an opinion on the effectiveness of the Water Supply Board’s internal control. Accordingly, we do not express an opinion on the effectiveness of the Water Supply Board’s internal control.
A deficiency in internal control exists when the design or operation of a control does not allow management or employees, in the normal course of performing their assigned functions, to prevent, or detect and correct, misstatements on a timely basis. A material weakness is a deficiency, or a combination of deficiencies, in internal control such that there is a reasonable possibility that a material misstatement of the entity’s financial statements will not be prevented, or detected and corrected on a timely basis. A significant deficiency is a deficiency, or a combination of deficiencies, in internal control that is less severe than a material weakness yet important enough to merit attention by those charged with governance.
Our consideration of internal control was for the limited purpose described in the first paragraph of this section and was not designed to identify all deficiencies in internal control that might be material weaknesses or significant deficiencies. Given these limitations, during our audit we did not identify any deficiencies in internal control that we consider to be material weaknesses. However, material weaknesses may exist that have not been identified.

37
Compliance and Other Matters
As part of obtaining reasonable assurance about whether the Water Supply Board’s financial statements are free from material misstatement, we performed tests of its compliance with certain provisions of laws, regulations, contracts and grant agreements, noncompliance with which could have a direct and material effect on the determination of financial statement amounts. However, providing an opinion on compliance with those provisions was not an objective of our audit, and, accordingly, we do not express such an opinion. The results of our tests disclosed no instances of noncompliance or other matters that are required to be reported under Government Auditing Standards.
Purpose of this Report
The purpose of this report is solely to describe the scope of our testing of internal control and compliance and the results of that testing, and not to provide an opinion on the effectiveness of the Water Supply Board’s internal control or on compliance. This report is an integral part of an audit performed in accordance with Government Auditing Standards in considering the Water Supply Board’s internal control and compliance. Accordingly, this communication is not suitable for any other purpose.
Cranston, Rhode Island January 27, 2020