providing income for a lifetime: bridging the gap … income for a lifetime: bridging the gap...
TRANSCRIPT
Providing Income for a Lifetime:
Bridging the Gap between Academic
Research and Practical Advice
Anthony Webb Center for Retirement Research
Boston College

Providing Income for a Lifetime:
Bridging the Gap between Academic
Research and Practical Advice
Anthony Webb Center for Retirement Research
Boston College
AARP’s Public Policy Institute informs and stimulates public debate on the issues we face as we age. Through research, analysis and dialogue with the nation’s leading experts, PPI promotes development of sound, creative policies to address our common need for economic security, health care, and quality of life.
The views expressed herein are for information, debate, and discussion, and do not necessarily represent official policies of AARP.
2009-11 June 2009 © 2009, AARP Reprinting with permission only
AARP Public Policy Institute 601 E Street, NW, Washington, DC 20049 http://www.aarp.org/ppi


iii
TABLE OF CONTENTS
EXECUTIVE SUMMARY ..................................................................................................V
INTRODUCTION............................................................................................................... 1
1. THE SOCIAL SECURITY CLAIMING DECISION ........................................................ 1
Discussion..................................................................................................................... 2
2. THE ASSET ALLOCATION DECISION ....................................................................... 7
Discussion..................................................................................................................... 8
3. THE ANNUITIZATION DECISION.............................................................................. 10
Discussion................................................................................................................... 11
4. THE DECUMULATION RATE DECISION.................................................................. 14
Discussion................................................................................................................... 14
5. THE HOUSING WEALTH DECISION ........................................................................ 18
Discussion................................................................................................................... 19
The Reverse Mortgage Decision................................................................................. 20
CONCLUSIONS.............................................................................................................. 21
APPENDIX...................................................................................................................... 23
REFERENCES................................................................................................................ 24


Asset Decumulation in Retirement: Bridging the Gap between Academic Research and Practical Advice
v
EXECUTIVE SUMMARY
Workers and families nearing retirement face a number of increasingly complicated decisions. These include when to claim Social Security, how to allocate a portfolio of financial assets, whether to purchase an annuity (and if so, when and what type), how quickly to spend unannuitized wealth, and whether to pay off any outstanding mortgage or purchase a reverse mortgage. This paper describes, for each of these decisions, what most households actually do, the conventional wisdom as to what they should do, and what a careful economic analysis suggests that most people should do.1
It appears that a substantial number of households make errors with respect to these five decisions; that is, what people typically do does not comport with a careful economic analysis. Many retirees claim Social Security benefits as soon as possible, whereas married couples would often be better off by waiting until the primary earner reaches full retirement age. Many retirees hold a large share of assets in short-term deposits, when a portfolio of bonds and some stock would provide greater income security. Few retirees purchase annuities. We suspect that many retirees pay insufficient attention to the rate at which they should spend down their assets, and what they should do with their housing wealth.
Household may make these errors for a number of reasons. First, households may misunderstand the nature of risk. They appear to be overly concerned with the possibility of a short-term nominal loss and insufficiently concerned with the risk of being unable to sustain consumption over the long run. This may explain the reluctance to annuitize or to invest sufficiently in stocks or long-term bonds.
Second, households appear to be short-sighted, claiming Social Security at the earliest opportunity, carrying mortgages into retirement, and again, failing to annuitize. But it is not clear whether this behavior is explained by a preference for consumption now rather than in the future, or by a misunderstanding of the long-term consequences.
Third, households may practice mental accounting or rules of thumb, rather than carefully considering all of their assets and long-term needs. This could lead them to view interest and dividends but not capital as available for consumption and to follow defaults and norms about when to claim Social Security or whether to annuitize, rather than making a careful plan.
1 The recommendations provided are those of the authors, and not necessarily those of AARP.
Asset Decumulation in Retirement: Bridging the Gap between Academic Research and Practical Advice
1
INTRODUCTION
This paper examines the major financial decisions facing a household approaching retirement. These decisions are critical in this new 401(k) world, where retirement responsibility has shifted to the individual. For each decision, we summarize what most households do in practice. Next, we describe conventional wisdom, that is, the kind of general financial advice that is commonly discussed in the media—not the more nuanced guidance that an individual might receive from a financial planner. We then briefly state what economic theory would suggest is appropriate for the bulk of the population, identifying any major uncertainties. We follow this statement with a detailed narrative, supported where appropriate by figures and tables, justifying our recommendation, and highlighting any important fallacies in conventional wisdom.2
The household’s financial assets cannot be analyzed in isolation from the remainder of its balance sheet, including the house, any mortgage debt, and the present value of Social Security benefits, which is, for most households, the largest single component of total wealth. This interdependency complicates matters, because a household’s decision in one area may affect what is optimal in another. To illustrate, a household can delay claiming Social Security, thereby increasing the amount of income paid in the form of a guaranteed inflation-protected annuity. It may well be optimal for such a household to invest its remaining wealth more aggressively, while the additional “purchases” of Social Security annuity may also substitute for private annuity purchases.
We focus on five important questions. First, when should the household claim Social Security? Second, how should it allocate its financial assets, and how should that allocation evolve during the course of retirement? Third, should the household annuitize its financial wealth, and if so, what proportion, and at what age, and should it take a fixed, variable, or inflation-protected annuity? Fourth, at what rate should the household decumulate its unannuitized wealth? Fifth, should it repay any outstanding mortgage debt or take a reverse mortgage, and if so, at what ages.3
1. THE SOCIAL SECURITY CLAIMING DECISION
What most households do in practice:
Most households claim as soon as they are eligible.4
Conventional wisdom:
Until recently, households and their advisors have paid scant attention to the question of when to claim Social Security. It is unclear whether
2 The recommendation is our own, and not necessarily that of AARP.
3 We do not address specific tax issues, given their complexity, and the uncertainty surrounding future tax rates.
4 According to Table 6.B5 of Social Security’s 2007 Annual Statistical Supplement, in 2006, 52 percent of men and 56 percent of women who claimed retired-worker benefits were age 62, after excluding beneficiaries who switched from disability benefit to retired worker benefit at age 65.
Asset Decumulation in Retirement: Bridging the Gap between Academic Research and Practical Advice
2
households are aware of the benefits of delayed claiming, and to what extent early claiming reflects a framing of delay as a risky gamble that the household will lose if it fails to live to its life-expectancy.
Appropriate advice for most people:
Social Security provides a government-guaranteed, inflation-protected, lifetime income. Households that delay claiming increase the amount of this income. Households should think of delay not as a risky gamble, but as a means of increasing retirement security, of increasing the floor below which their income can never fall, regardless of how long they live, or how badly their investments perform.
In practice, many retired households lack the financial resources to delay claiming, while others may be uncomfortable with the idea of tapping their retirement savings to make good the income shortfall during the period from retirement until receipt of benefits. Given that only a minority can afford to retire early, the best advice for most households is to delay both retirement and claiming, health and employment opportunities permitting.
As a general rule, married men and all single individuals should delay both retirement and benefit receipt until at least their Social Security Full Retirement Age. Although some married women will maximize their lifetime benefits if they claim before their husband, in many cases a married woman’s optimal strategy is to retire and claim benefits at the same time as her husband, one that accords with many couples’ stated desire for joint retirement.
DISCUSSION
Individuals can claim retired worker benefits at any age from 62 to 70. The Full Retirement Age for those born between 1943 and 1954 is 66. The benefits of individuals claiming before that age are actuarially reduced, by 25 percent for those claiming at age 62. The benefits of those claiming late are actuarially increased, by 32 percent for those claiming at 70.
Spouses of retired workers can claim a spousal benefit, if that exceeds their own retired worker benefit, provided they have turned 62 and their spouse has already claimed his or her benefit.5 At their own Full Retirement Age, wives are entitled to a benefit of one half of their husband’s Primary Insurance Amount, or PIA (the benefit the husband could claim at his Full Retirement Age). The benefits of spouses claiming early are actuarially reduced, by as much as 30 percent for those claiming at age 62. The spousal benefit does not increase beyond the wife’s Full Retirement Age.
The reductions and increases for retired workers are approximately actuarially fair in the sense that the expected present value (EPV) of Social Security benefits, discounted by a three percent real rate of interest and annual survival probabilities, varies little with the
5 Spousal benefits may be claimed by both men and women. But currently, very few men earn so little relative to their wives to be eligible, and almost all spousal benefits are paid to women.
Asset Decumulation in Retirement: Bridging the Gap between Academic Research and Practical Advice
3
age of claiming. But this misses the impact of the claiming age on Social Security survivor and spousal benefits.
Most wives have lower lifetime earnings than their husbands, and will therefore qualify for survivor benefits on their husband’s death. Survivor benefits can be claimed as early as age 60. For women born between 1945 and 1956, this benefit equals 100 percent of their husband’s benefit if he dies when she is 66 or older, subject to a floor of 82.5 percent of his Primary Insurance Amount. If her husband dies before she attains age 66, her benefit is subject to an actuarial reduction of as much as 28.5 percent, but is subject to a floor of 71.5 percent of her husband’s Primary Insurance Amount. Most women outlive their husbands, often by a considerable margin, but are usually considerably older than 66 when their husband dies. A husband who delays claiming his benefit from age 62 to 70 therefore usually increases the annual amount of his widow’s survivor benefit by 60 percent.6 So, delay significantly increases the present value of the total of the retired worker and survivor benefits payable over his and his wife’s joint lifetime, even though it has only a small impact on the present value of the retired worker benefit payable during his lifetime.
As the amount of the survivor benefit is based on the husband’s, not the wife’s claim age, a married woman who delays claiming can expect to get an increased retired worker or spousal benefit not for her lifetime, but for the shorter period ending on her husband’s death. This reduces the advantage of delaying and means that it is optimal for married women to claim benefits at younger ages than otherwise identical single women. But a spousal benefit can only be claimed once the husband has claimed his retired worker benefit. Although early claiming of the retired worker benefit will often facilitate early claiming of the spousal benefit, thereby increasing its present value, it will also reduce the value of the wife’s survivor benefit.
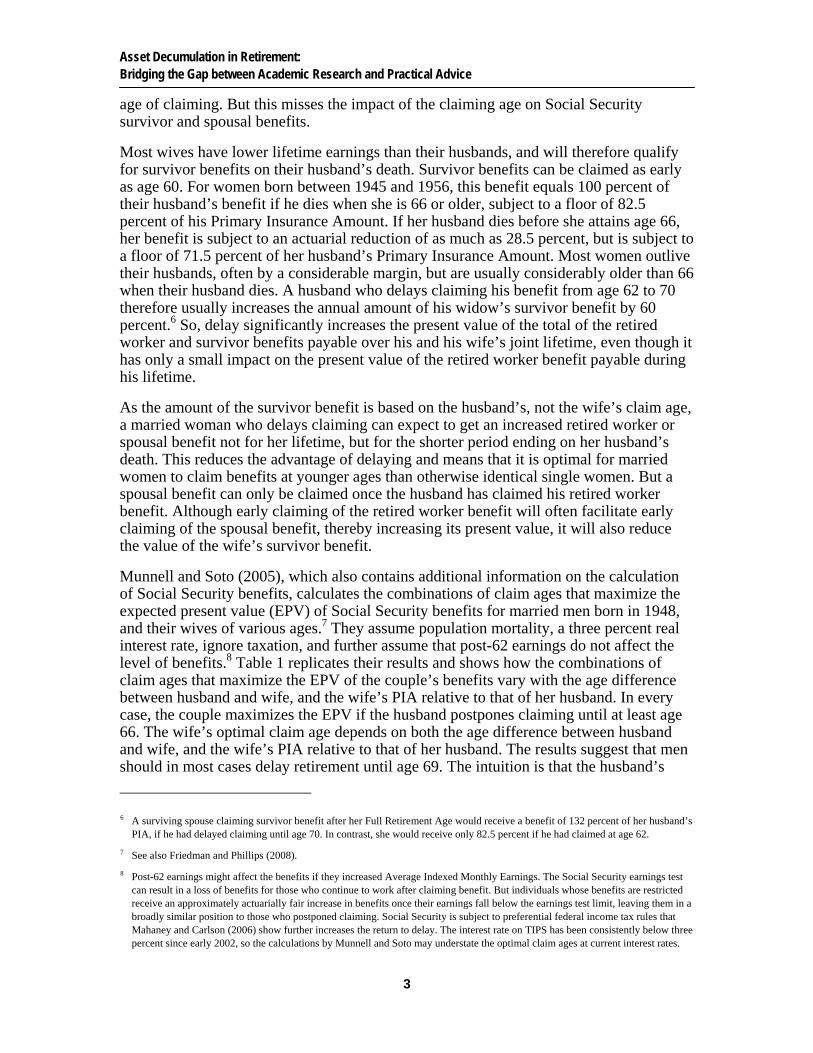
Munnell and Soto (2005), which also contains additional information on the calculation of Social Security benefits, calculates the combinations of claim ages that maximize the expected present value (EPV) of Social Security benefits for married men born in 1948, and their wives of various ages.7 They assume population mortality, a three percent real interest rate, ignore taxation, and further assume that post-62 earnings do not affect the level of benefits.8 Table 1 replicates their results and shows how the combinations of claim ages that maximize the EPV of the couple’s benefits vary with the age difference between husband and wife, and the wife’s PIA relative to that of her husband. In every case, the couple maximizes the EPV if the husband postpones claiming until at least age 66. The wife’s optimal claim age depends on both the age difference between husband and wife, and the wife’s PIA relative to that of her husband. The results suggest that men should in most cases delay retirement until age 69. The intuition is that the husband’s
6 A surviving spouse claiming survivor benefit after her Full Retirement Age would receive a benefit of 132 percent of her husband’s PIA, if he had delayed claiming until age 70. In contrast, she would receive only 82.5 percent if he had claimed at age 62.
7 See also Friedman and Phillips (2008).
8 Post-62 earnings might affect the benefits if they increased Average Indexed Monthly Earnings. The Social Security earnings test can result in a loss of benefits for those who continue to work after claiming benefit. But individuals whose benefits are restricted receive an approximately actuarially fair increase in benefits once their earnings fall below the earnings test limit, leaving them in a broadly similar position to those who postponed claiming. Social Security is subject to preferential federal income tax rules that Mahaney and Carlson (2006) show further increases the return to delay. The interest rate on TIPS has been consistently below three percent since early 2002, so the calculations by Munnell and Soto may understate the optimal claim ages at current interest rates.
Asset Decumulation in Retirement: Bridging the Gap between Academic Research and Practical Advice
4
delay increases the value of the survivor’s benefits more than it reduces his retired worker benefit and his wife’s spousal benefit. When the wife’s PIA is very small relative to that of her husband, the EPV of benefits will be maximized if the husband and wife claim at the same time. This is because the wife would receive only a very small retired worker benefit if she claimed before her husband, but would permanently reduce the level of the larger spousal benefit payable from the date her husband claimed his retired worker benefit. The overall effect is that wife claims somewhat later and the husband somewhat earlier than when the wife’s PIA is larger relative to that of her husband.
Table 1 Claim Ages at Which Expected Present Value
of Social Security Benefits is Maximized (Husband, Wife)
Age Difference 0–30 30–40 40–100
0 66,66 67,66 69,62
1 67,66 67,66 69,62
2 68,66 68,65 69,62
3 68,65 69,62 69,62
4 68,64 69,62 69,62
5 68,62 69,62 69,62
6 68,62 69,62 69,62
Percent of households 32 11 47 Note: Age difference equals number of years the husband is older than the wife.
Source: Munnell and Soto (2005).
The calculations focus solely on the EPV of Social Security benefits and ignore the value of the longevity insurance they provide. Because Social Security benefits are paid for life, they insure the household against the risk of being “unlucky” enough to live unusually long, outliving their financial assets. A household that delays claiming is, in effect, buying additional amounts of longevity insurance. In exchange for giving up current benefits, it increases the amount of income it will receive, regardless of how long it lives For example, a single individual with a PIA of $1,000 can receive $750 a month for life at age 62, or can delay until age 63 and receive $800 a month for life. If he delays, he increases his inflation-protected lifetime income by $50 a month ($800 minus $750), or $600 a year, at a cost of $9,000 ($750 a month for 12 months). If he further delays from age 63 to 64, his income further increases from $800 to $866.67, an increase of $66.67.
Although the returns to delay vary with age, they are on average approximately actuarially fair.
We calculate optimal claiming strategies, and the cost of adopting a sub-optimal strategy, taking account of longevity insurance9. We consider two types of single-earner couples: those who are the same age and those in which the wife is three years younger than the husband (see Appendix for details on the calculations). Tables 2A and 2B report Social
9 Assuming constant relative risk aversion with a coefficient of risk aversion of five, within the range reported in the literature, which tends to cluster between 2 and 10 depending in part on whether the estimates are derived from portfolio theory, purchases of insurance, economic experiments, or preferences over lotteries (Chetty 2003).
Asset Decumulation in Retirement: Bridging the Gap between Academic Research and Practical Advice
5
Security Equivalent Income (SSEI) for these two household types. We define SSEI as the factor by which the Social Security income of a household claiming at a sub-optimal combination of ages must be multiplied so that it is as well off in expected utility terms as a household claiming at the optimal ages. By definition, the optimal combination of ages is when SSEI equals 1.00—it requires a zero percent increase to get to the optimum. Any cell with a value greater than 1.00 is sub-optimal, because the household requires its benefits at that combination of claim ages to be multiplied by an amount greater than one to make it indifferent between claiming at those ages and at the optimal combination of ages. The optimal combination of claim ages is 68 and 68 (the Full Retirement Age) for a couple who are both the same age, compared with the Munnell and Soto (2005) optimal combination of 66 and 66 when the household’s objective was simply to maximize the money’s worth of benefits. If the husband’s Primary Insurance Amount is $1,000, the household would receive a retired worker benefit of $1,000 and a spousal benefit of $500. Suppose instead that the husband and wife both claimed at 62. The husband would receive a retired worker benefit of $750, and the wife a spousal benefit of $350. But they would actually require $833 and $389 ($750 and $350 multiplied by the 1.111 SSEI factor reported in the cell in Table 2A for the case in which both husband and wife claim at age 62) to be as well off as they would have been had they delayed claiming until age 68. Claiming early costs them the equivalent of $124 a month for life ($833 plus $389 minus $750 minus $350). Sun and Webb (2009) calculate that plausible variations in subjective mortality beliefs have little effect on either the optimal claiming age or the losses households incur as a result of claiming at sub-optimal ages.
SSEI is greater than 1.000 at claim ages greater than 68, indicating that delay after this age makes the household worse off in expected utility terms. For example, a household that delays claiming until age 70, past the optimal age, would require a 0.8 percent increase in benefits as compensation. But the costs of delay beyond the optimal age are much less than those of claiming too early.
Table 2a Social Security Equivalent Income
(Assumes Wife is Same Age as Husband)
Wife’s Claim Age Husband’s Claim Age
62 63 64 65 66 67 68 69 70
62 1.111 1.110 1.102 1.094 1.094 1.113 1.132 1.151 1.170
63 1.102 1.094 1.087 1.087 1.106 1.125 1.144 1.162
64 1.067 1.062 1.060 1.079 1.097 1.115 1.133
65 1.035 1.033 1.051 1.068 1.085 1.102
66 1.012 1.029 1.046 1.063 1.079
67 1.004 1.020 1.035 1.051
68 1.000 1.015 1.031
69 1.001 1.016
70 1.008
Note: Coefficient of Risk Aversion = 5
Asset Decumulation in Retirement: Bridging the Gap between Academic Research and Practical Advice
6
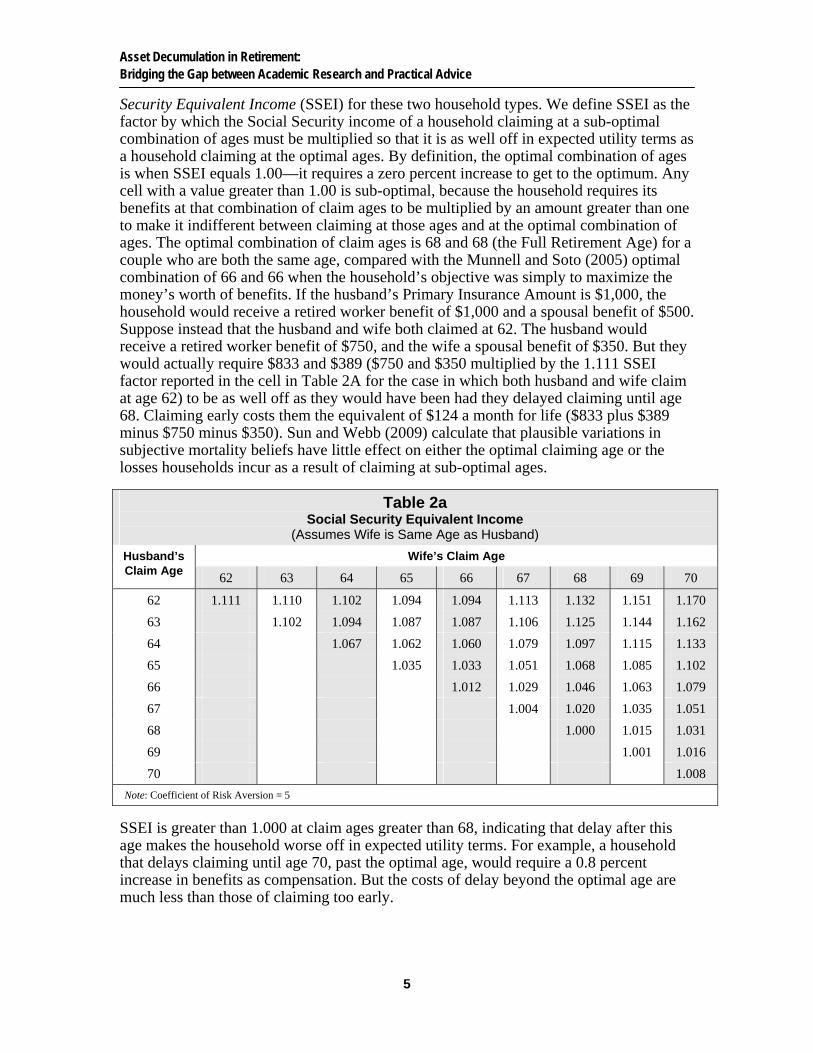
Certain combinations of claim ages are either infeasible or clearly sub-optimal. The wife in this one earner example cannot claim her spousal benefit before her husband has claimed his retired worker benefit. It makes no sense for the wife of a husband who has already claimed benefit to delay claiming spousal benefit after her Full Retirement Age because the amount of her benefit is no longer increased.
In results that are not reported, we calculate SSEI when the household’s objective is simply to maximize the money’s worth of benefits. SSEI equals 1.027 if the husband and wife both claim at age 62, compared with 1.111 when account is taken of the value of the additional longevity insurance acquired as a result of delay. Money’s worth calculations substantially underestimate the costs of early claiming.
The results for the household in which there is a three-year age difference differ in two significant ways. First, it now becomes optimal for the husband to delay one additional year, to age 69, at which age his wife attains her Full Retirement Age and the spousal benefit is no longer increased. Second, the cost of claiming at age 62 is now substantially greater. A household with a three-year age difference would now require a 15.9 percent increase in benefits as compensation for claiming at age 62.
As stated in the introduction, the majority of households claim Social Security at age 62 or soon thereafter, and would appear to be making a costly mistake. Brown, Casey, and Mitchell (2008) indicates that undervaluation of the Social Security annuity is more widespread than could be plausibly explained by impatience alone, suggesting that most households are ill-equipped to undertake the quite complex calculations involved in comparing lump sums with income streams.
Table 2b Social Security Equivalent Income
(Assumes Wife is Three Years Younger Than Husband)
Wife’s claim age Husband’s Claim Age
62 63 64 65 66 67 68 69 70
62 1.159 1.160 1.153 1.149 1.149 1.167 1.185 1.202 1.219
63 1.153 1.153 1.147 1.144 1.144 1.162 1.180 1.197 1.214
64 1.124 1.125 1.119 1.116 1.116 1.133 1.150 1.166 1.182
65 1.095 1.096 1.090 1.088 1.087 1.104 1.119 1.135 1.150 66 1.074 1.069 1.066 1.065 1.081 1.096 1.111 1.126
67 1.040 1.037 1.037 1.052 1.066 1.081 1.095
68 1.016 1.016 1.030 1.044 1.058 1.072 69 1.000 1.014 1.028 1.042 1.055
70 1.004 1.018 1.032 1.045
Note: Coefficient of Risk Aversion = 5
Asset Decumulation in Retirement: Bridging the Gap between Academic Research and Practical Advice
7
2. THE ASSET ALLOCATION DECISION
What most households do in practice:
There is considerable heterogeneity in investment allocations. A large percentage of households own no stocks whatsoever, and most hold a substantial proportion of their financial assets in short-term deposits.
Conventional wisdom:
Over the course of retirement, households should reallocate their portfolios away from stocks and in favor of both bonds and cash.
The traditional explanation is that equities are relatively riskier over short time horizons.10
Appropriate advice for most people:
1) The optimal allocation of financial wealth to stocks will depend on the household’s risk preferences, non-financial wealth, and other sources of income. However, all but the most risk-averse households should hold at least some proportion of their wealth in a diversified portfolio of stocks, which most economists believe will continue to provide a higher return than either bonds or short-term deposits, albeit at the cost of greater risk.
2) Households should rebalance their portfolios away from stocks and in favor of bonds during their working lives. The case for further rebalancing during the course of retirement is much less clear-cut.
3) Most households hold an excessive proportion of their financial assets in short-term deposits. These are not risk-free for long-term investors because the real short-term interest rate fluctuates, exposing the household to the risk of reductions in income and consumption.
4) The true risk-free investment for long-term investors is a portfolio of inflation-indexed bonds of appropriate maturities, such as Treasury Inflation Protected Securities (TIPS).
5) Nominal bonds of appropriate maturities insure households against reductions in the nominal interest rate. But the risk of persistent variations in inflation make nominal bonds a more risky asset class than TIPS for conservative investors.
10 For example, the Securities and Exchange Commission advises households that: “An investor with a longer time horizon may feel more comfortable taking on a riskier, or more volatile, investment because he or she can wait out slow economic cycles and the inevitable ups and downs of our markets.” (See http://www.sec.gov/investor/pubs/assetallocation.htm.) This claim is repeated in a variety of personal finance guidebooks scrutinized by Jagannathan and Kocherlakota (1996). For example, Malkiel (1996) advises “the longer the time period over which you can hold on to your investments, the greater should be the share of common stocks in your portfolio.”
Asset Decumulation in Retirement: Bridging the Gap between Academic Research and Practical Advice
8
DISCUSSION
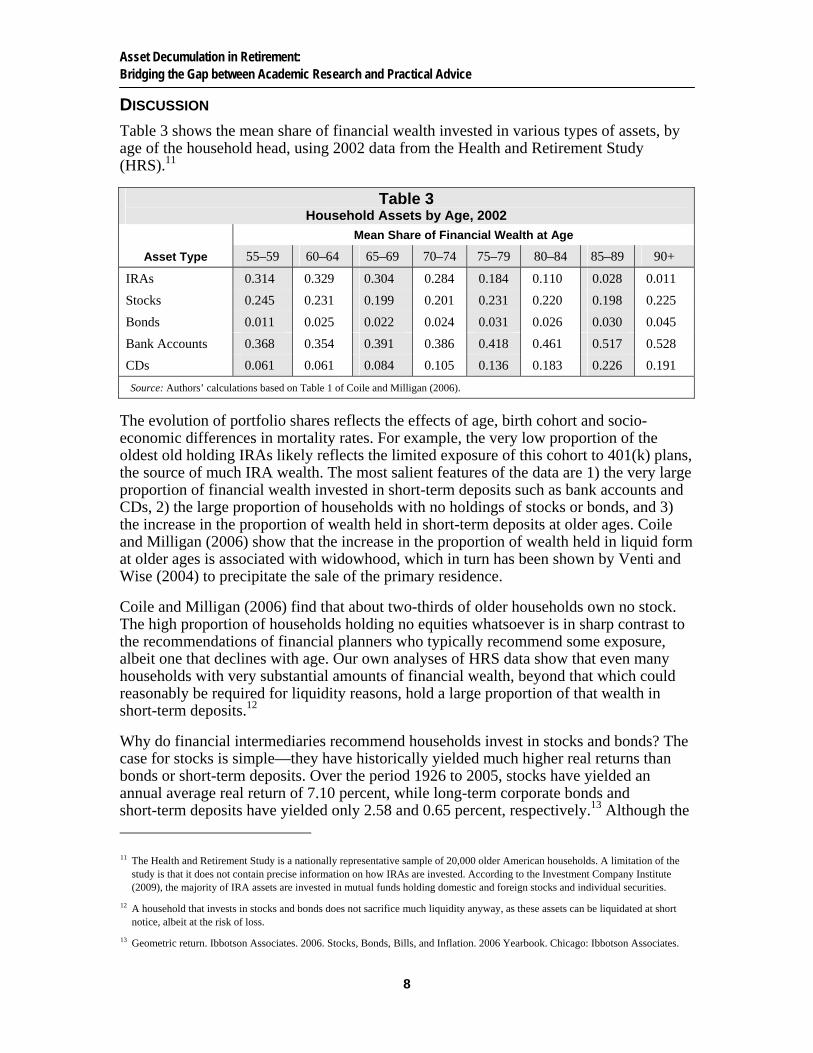
Table 3 shows the mean share of financial wealth invested in various types of assets, by age of the household head, using 2002 data from the Health and Retirement Study (HRS).11
Table 3 Household Assets by Age, 2002
Mean Share of Financial Wealth at Age
Asset Type 55–59 60–64 65–69 70–74 75–79 80–84 85–89 90+
IRAs 0.314 0.329 0.304 0.284 0.184 0.110 0.028 0.011
Stocks 0.245 0.231 0.199 0.201 0.231 0.220 0.198 0.225
Bonds 0.011 0.025 0.022 0.024 0.031 0.026 0.030 0.045
Bank Accounts 0.368 0.354 0.391 0.386 0.418 0.461 0.517 0.528
CDs 0.061 0.061 0.084 0.105 0.136 0.183 0.226 0.191
Source: Authors’ calculations based on Table 1 of Coile and Milligan (2006).
The evolution of portfolio shares reflects the effects of age, birth cohort and socio-economic differences in mortality rates. For example, the very low proportion of the oldest old holding IRAs likely reflects the limited exposure of this cohort to 401(k) plans, the source of much IRA wealth. The most salient features of the data are 1) the very large proportion of financial wealth invested in short-term deposits such as bank accounts and CDs, 2) the large proportion of households with no holdings of stocks or bonds, and 3) the increase in the proportion of wealth held in short-term deposits at older ages. Coile and Milligan (2006) show that the increase in the proportion of wealth held in liquid form at older ages is associated with widowhood, which in turn has been shown by Venti and Wise (2004) to precipitate the sale of the primary residence.
Coile and Milligan (2006) find that about two-thirds of older households own no stock. The high proportion of households holding no equities whatsoever is in sharp contrast to the recommendations of financial planners who typically recommend some exposure, albeit one that declines with age. Our own analyses of HRS data show that even many households with very substantial amounts of financial wealth, beyond that which could reasonably be required for liquidity reasons, hold a large proportion of that wealth in short-term deposits.12
Why do financial intermediaries recommend households invest in stocks and bonds? The case for stocks is simple—they have historically yielded much higher real returns than bonds or short-term deposits. Over the period 1926 to 2005, stocks have yielded an annual average real return of 7.10 percent, while long-term corporate bonds and short-term deposits have yielded only 2.58 and 0.65 percent, respectively.13 Although the
11 The Health and Retirement Study is a nationally representative sample of 20,000 older American households. A limitation of the study is that it does not contain precise information on how IRAs are invested. According to the Investment Company Institute (2009), the majority of IRA assets are invested in mutual funds holding domestic and foreign stocks and individual securities.
12 A household that invests in stocks and bonds does not sacrifice much liquidity anyway, as these assets can be liquidated at short notice, albeit at the risk of loss.
13 Geometric return. Ibbotson Associates. 2006. Stocks, Bonds, Bills, and Inflation. 2006 Yearbook. Chicago: Ibbotson Associates.
Asset Decumulation in Retirement: Bridging the Gap between Academic Research and Practical Advice
9
decline in stock prices during 2008 is almost without precedent, an all-equity portfolio accumulated over a 40-year career ending in 2008 would still have outperformed a bond, a 50:50 bond-stock portfolio, and a life cycle portfolio.14 A substantial literature has considered whether this so-called equity premium has narrowed, but most forecasters believe that stocks will continue to offer a substantially higher return than bonds.15 Although stocks are also riskier than other investments, this additional return is sufficient to justify all but the most risk-averse holding at least a portion of their wealth in stocks.
The case for long-term bonds is less obvious. They have historically provided only slightly higher returns than short-term deposits, but seem substantially more risky. Over the above period, the standard deviations of the returns on stocks, nominal bonds, and short-term deposits amounted to 20.30, 9.97, and 3.99 percent, respectively. But as Campbell and Viceira (2001) explain, these one period measures of relative riskiness understate the riskiness of short-term deposits and overstate the riskiness of bonds. A portfolio of nominal bonds of appropriate durations insures the household against interest rate fluctuations and guarantees its nominal consumption stream. A portfolio of Treasury Inflation Protected Securities (TIPS) guarantees real consumption and is the true risk-free asset to a long-term investor. Although the market value of TIPS may fluctuate with movements in interest rates, a household holding a portfolio of TIPS of appropriate maturities can still fulfill its original consumption plan.
An important implication of the above analysis is that households should reduce the average duration of their household’s bond portfolio as their remaining life expectancy decreases, eventually holding mainly cash and short-term deposits.
The impact of the financial planning horizon on the relative riskiness of equities remains controversial. As noted, conventional wisdom suggests rebalancing in favor of bonds as the household ages because equities are relatively less risky over long time horizons.16 However, this advice is only correct if stock returns exhibit mean reversion, that is, if periods of abnormally poor returns are likely to be followed by periods of abnormally good returns. If stock returns are independently and identically distributed (i.i.d.), then investment allocation should not vary with time horizon. Although the probability that stocks will outperform bonds increases with the time horizon, when returns are i.i.d., this is precisely matched by the increase in the probability of having really bad returns, of having two 1929s in one lifetime.17
Campbell and Viceira (2002) investigated whether stock and bond returns are in fact i.i.d. and considered the implications of mean reversion for portfolio allocation. If investment returns exhibit mean reversion, then the annualized standard deviation over n periods
14 Assuming zero management charges, two percent real wage growth, and a fixed percentage of salary contribution rate.
15 Shiller (2005) reports a survey of academic and Wall Street economists published in the 28 February 2005 edition of the Wall Street Journal, in which the median forecast 44 year geometric real return was 4.6 percent.
16 Another argument in favor of rebalancing in favor of equities during one’s working life is that young households own a large amount of what is usually low-risk human capital (the present value of their future earnings) that has bond-like return characteristics. The value of this human capital declines as retirement approaches, and is zero on retirement.
17 Jagannathan and Kocherlakota (1996) explain in detail. They show that the optimal long-term investment decision can be decomposed into a series of short-term decisions. The household will make the optimal investment allocation for the coming period, knowing that at the end of the period, it will be allowed to re-optimize its investment allocation. In consequence, if financial wealth is the household’s only asset, then the optimal long-run investment allocation is identical to the optimal short-run allocation.
Asset Decumulation in Retirement: Bridging the Gap between Academic Research and Practical Advice
10
should equal the n period standard deviation, divided by n . They found that over long periods, the annualized standard deviation of stock returns was substantially lower, implying mean reversion. Over the period 1952–1999, the annualized standard deviation of stock returns declined from 16 percent at a one-year holding period to 8 percent at a 25-year holding period. But it is also not clear to what extent the magnitude of the observed level of mean reversion reflected the particular economic circumstances of the period.
Unfortunately, this line of research has not yet progressed to the point where it can be translated into actionable recommendations for retired households. Campbell and Viceira (2002) calculate optimal portfolio allocations over an infinite time horizon. But researchers have yet to undertake similar calculations over finite time horizons, or to investigate the extent to which the optimal allocation might vary with one’s assumptions regarding the magnitude of mean reversion. Their optimal portfolio allocations also vary substantially with assumed investment returns. If we believe that future investment returns will differ from those experienced in the past—if, for example, we believe that the equity premium has narrowed or that we are unlikely to experience a repetition of the high inflation of the 1970s—then their calculations may be a poor guide to optimal behavior.
The ownership of other assets such as Social Security, housing, and employer pensions further complicates the analysis. Jagannathan and Kocherlakota (1996) found that low-risk human capital tilted working-age households’ optimal portfolio allocations in favor of equities. Ownership of the above asset classes may have a similar effect on retired households.
3. THE ANNUITIZATION DECISION
What most households do in practice:
Rates of voluntary annuitization are extremely low, and most households appear to exhibit a high degree of annuity aversion.
Conventional wisdom:
Many financial planning tools pay little attention to annuities.
Appropriate advice for most people:
Annuities provide insurance against outliving one’s wealth. All except the extremely wealthy should have sufficient annuity income to cover their day-to-day living expenses. With some exceptions, the cheapest way of obtaining additional annuity income is to postpone claiming Social Security, thereby increasing the monthly benefit. If, as will usually be the case, the household’s day-to-day living expenses exceed its Social Security benefit, it should purchase additional annuity income in the individual annuity market. It is important to shop around, and households in poor health should request a medically underwritten quote. For most households, the best choice is a combination of inflation-protected and variable joint-life immediate annuities, without guarantee.
Asset Decumulation in Retirement: Bridging the Gap between Academic Research and Practical Advice
11
DISCUSSION
Although annuities are actuarially unfair in the sense that the expected present value of the payments, discounted by an interest rate and annual survival probabilities is less than the premium paid, they are a potentially valuable part of retired households’ portfolios because they provide insurance against outliving one’s wealth.18 They give the household a paycheck for life to substitute for the one they lost at retirement.
The value of annuitization can be measured in terms of annuity equivalent wealth. This is the factor by which the household’s financial wealth must be multiplied so that the household is indifferent between undertaking an optimal decumulation of unannuitized wealth and purchasing an annuity. When annuity equivalent wealth exceeds one, the household is better off annuitizing. When annuity equivalent wealth is less than one, the household is better off undertaking an optimal decumulation of unannuitized wealth.
The first paper analyzing the annuitization decision in expected utility terms, Mitchell, Poterba, Warshawsky, and Brown (1999), calculated annuity equivalent wealth for single individuals with either no pre-annuitized Social Security and defined benefit pension wealth, or alternatively one half of initial wealth in such form.19 Under the standard assumption of constant relative risk aversion, the marginal value of further annuity purchases decreases as the proportion of household wealth that is already annuitized increases. The above authors concluded that at plausible levels of actuarial unfairness, annuitization was preferable to an optimal decumulation of unannuitized wealth, even for households with half their wealth in pre-annuitized form, making the low level of voluntary annuitization somewhat of a puzzle. Brown and Poterba (2000) extended the analysis to married couples. They showed that longevity risk-pooling within marriage reduced but did not eliminate the value of annuitization.
Dushi and Webb (2004) showed that the actual proportions of pre-annuitized wealth of households attaining age 65 between 1994 and 2000 were substantially greater than the one half assumed in previous research, reflecting the generally modest amounts of financial wealth and widespread defined benefit pension coverage, and further reducing the value of annuitization. But households do not face an all-or-nothing annuitization decision immediately on retirement. They can postpone annuitization and/or can choose to annuitize only part of their unannuitized wealth. Using the 1995 levels of actuarial unfairness calculated by Mitchell et. al. (1999), Dushi and Webb (2004) showed that those married couples that would benefit from annuitization (the more risk-averse, and those with smaller proportions of pre-annuitized wealth) would generally do better by waiting until their late 70s or early 80s. But the actuarial unfairness of annuities appears to have declined, and Gong and Webb (2008) show that the current benefit from delay is likely to be small.
A number of authors, for example Milevsky (1998, 2000), and Pang and Warshawsky (2007) have argued that households should postpone annuitization to take advantage of
18 Throughout our discussion, we are referring to immediate annuities. Most annuity purchases are of deferred annuities, which can be liquidated by the investor, and therefore lack the essential characteristic of an immediate annuity, the redistribution of wealth from those who die young to those who survive.
19 Yaari (1965) was the first to address the issue; his work is being extended by Davidoff, Brown, and Diamond (2005).
Asset Decumulation in Retirement: Bridging the Gap between Academic Research and Practical Advice
12
the equity premium. But households that annuitize can nowadays retain exposure to equities by buying variable immediate annuities.
To summarize, the above literature concludes that annuities should play a substantial role in retirement wealth decumulation, and many households, particularly those lacking a defined benefit pension plan, should annuitize at least part of their financial assets at some stage during retirement.
Taking an optimal decumulation of unannuitized wealth as the alternative probably understates the value of annuitization. Households that undertake an optimal decumulation must either solve a complex dynamic programming problem or understand and act on some fairly complex advice. Given the low levels of financial literacy documented by authors such as Lusardi and Mitchell (2007), a more appropriate counterfactual may be for some far from optimal rule-of-thumb.
But annuities involve a loss of liquidity, and uncertain medical expenses may contribute to annuity aversion. Research on the impact of uncertain medical expenses on the value of annuitization is at an early stage, and it is not clear to us whether uncertain medical expenses will increase or decrease the value of annuitization, if proper account is taken of Medicaid eligibility rules and the impact of medical expenses on the desired age profile of total consumption, inclusive of such expenses.20
What advice should be offered to households entering retirement? We recommend that households should aim to have enough annuity income to finance their day-to-day living expenses during their joint lifetime and that of a surviving spouse. As noted earlier, at most ages the cheapest source of annuity income is the Social Security Administration. A household that delays claiming Social Security is in effect making an annuity purchase, the annuity income obtained being the increase in Social Security benefits, and the cost of the annuity, the Social Security benefits foregone during the period of delay. But Social Security and defined benefit pensions will be insufficient to fund most households’ day-to-day living expenses, so that any additional annuity income must be purchased on the individual annuity market. The choice is between annuities that provide a fixed or increasing income, those providing an income indexed to the Consumer Price Index, and variable immediate annuities where the income increases if the return on an underlying portfolio exceeds a specified rate, usually in the range of three to five percent, and decreases if the return falls short. In addition, the household can choose between single and joint life products, and products with and without a return of capital in the event of early death.
When choosing, the household needs to consider the impact of inflation. At a 2.5 percent inflation rate, a couple aged 60 faces a 43.4 percent chance of surviving long enough to see the real value of their pension halved.21 Although fixed annuities provide a higher initial return, we consider that inflation-protected dominate fixed annuities. Gong and Webb (2008) calculate that the money’s worth of a fixed annuity—the present value of the income stream discounted by the Treasury STRIP interest rate and annual survival probabilities, and divided by the premium paid—is very similar to that of an inflation-
20 We are aware of only three papers: Turra and Mitchell (2007), Pang and Warshawsky (2007), and Yogo (2008).
21 Author’s calculation based on Social Security Administration population mortality tables for the 1947 birth cohort.
Asset Decumulation in Retirement: Bridging the Gap between Academic Research and Practical Advice
13
protected annuity, discounted at the TIPS term structure of interest rates. But a comparison of a survey of professional forecasters’ long-run inflation expectations with the yield gap between TIPS and nominal Treasury bonds suggests that the latter incorporate a negligible inflation risk premium. It follows that inflation-protected annuities likewise incorporate a negligible inflation risk premium. If we treat the average response to the above survey as an unbiased estimate of anticipated inflation, households should choose inflation-protected in preference to nominal annuities, notwithstanding the lower income yield on the former. 22
The more difficult decision is how to allocate wealth between inflation-protected and variable annuities. Variable immediate annuities offer households the opportunity to benefit from both the equity premium and mortality credits.23 The variable annuity not only provides a higher initial return, but also one that may, on average, increase over time. Thus, Brown, Mitchell, and Poterba (1999) calculate that many households should accept the additional risk of a variable immediate annuity in exchange for the additional return.
But the household faces a small, but significant risk of very low incomes. We are uncertain that the constant relative risk aversion utility function that is used in this and almost all other calculations of optimal investment strategies adequately captures households’ aversion to extremely low consumption.
Unfortunately, it is difficult to even estimate the probability distribution of the incomes obtainable from a variable immediate annuity because that distribution is sensitive to the assumptions one makes regarding prospective equity returns. To illustrate, we calculate that if the mean and variance of equity returns equals that for the period 1926–2005, a household purchasing a variable immediate annuity with a five percent assumed investment return faces an 8.2 percent risk that its real age 85 income will be less than half its initial income. But if mean equity returns only equaled the 4.5 percent average prediction of academic and professional economists, reported in Shiller (2005), then the probability increases to 27.1 percent.
We therefore recommend that the household secure much of its day-to-day living expenses with inflation-protected annuities, covering the remainder with income from variable immediate annuities, and relying on drawdowns of unannuitized wealth to finance additional discretionary consumption.
On balance, we believe households should annuitize immediately on retirement. Although theoretical calculations show a slight benefit from delay, they ignore the risk that annuity rates will become less favorable, or that the household may mismanage its finances in the meantime. The former, but not the latter, can be partially hedged by investing in bonds of appropriate duration.
22 The Survey of Professional Forecasters, Federal Reserve Bank of Philadelphia http://www.philadelphiafed.org/files/spf/spfq108.pdf. TIPS Expected Inflation Estimates, Federal Reserve Bank of Cleveland, http://www.clevelandfed.org/research/inflation/TIPS/index.cfm
23 Mortality credits is the term used to refer to the additional income return provided by an annuitized over an equivalent unannuitized investment as a result of the reallocation of wealth from those who die young to those who live unusually long.

Asset Decumulation in Retirement: Bridging the Gap between Academic Research and Practical Advice
14
Married couples should generally purchase a joint life annuity. We see little value in guarantee periods. These are purchased at the cost of a reduced income, and we believe there are more efficient ways of satisfying whatever bequest motive the household may have.
4. THE DECUMULATION RATE DECISION
What most households do in practice:
The first cohort with substantial amounts of unannuitized pension wealth is only now entering retirement. Little is known about the strategies they are using to manage the decumulation of that wealth.
Conventional wisdom:
Suggested strategies for decumulation include consuming interest and dividends while preserving the capital, spending down over one’s life expectancy, or consuming a fixed percentage of unannuitized wealth.
Appropriate advice for most people:
The decumulation rate should always respond to realized investment returns, so that consumption is cut when returns are worse than expected and increased when returns are better than expected. It should take account of the household’s Social Security and defined benefit pension income, health insurance coverage, attitude towards risk, bequest motive, and so on. Importantly, it also depends on the household’s willingness to accept reductions in its standard of living as it ages.
Even when household preferences are well-defined, it is difficult to lay down guidelines because they will depend on our assumptions regarding prospective investment returns. Assuming households are willing to countenance some reduction in their standard of living as they age, then it might be feasible to consume five percent of current wealth at age 65, increasing to nine percent of remaining wealth by age 85. It is important to note that this strategy will yield an age 65 income that is no greater than that obtainable from an inflation-protected immediate annuity (discussed in section three), yet will likely result in a 20–25 percent reduction in the household’s standard of living by age 85.
DISCUSSION
This section examines how households should decumulate the part of their financial wealth that they have chosen not to annuitize. Little is known about the strategies households use to manage the decumulation of financial wealth during the course of retirement. In part, this reflects the fact that the first cohort with substantial amounts of unannuitized pension wealth is only now entering retirement. But it also reflects the focus of survey data on actions rather than on the strategies and beliefs motivating those actions, and the problems involved in measuring decumulation paths when asset balances are reported with error.
Asset Decumulation in Retirement: Bridging the Gap between Academic Research and Practical Advice
15
DeNardi, French, and Jones (2006) show that the rich decumulate their financial wealth more slowly than the poor. They attribute this to the greater longevity and medical expenditure risk faced by the former, and the greater protection afforded the latter by Medicaid and other social insurance programs. Love, Palumbo, and Smith (2008) show that the ratio of the sum of retired households’ financial, non-financial, and annuitized wealth to remaining life expectancy tends to increase with age. Although these papers suggest that households are generally decumulating conservatively, it is simply not possible to discern from the data the types of decumulation strategies that households are following.
In the absence of evidence as to the strategies that households actually use, we consider three plausible strategies—to consume the interest and dividends while retaining the capital, to spend down capital over one’s life expectancy, and to consume a fixed percentage of one’s wealth at retirement.24 We explain why they are sub-optimal. We then use dynamic programming techniques to derive “optimal” asset decumulation rules for prototypical households.
Spend the interest and dividends, conserve the capital This rule will certainly guarantee that the household does not outlive its wealth. This strategy nonetheless has a number of serious drawbacks. First, the household will die leaving its initial wealth, plus any capital gains, unconsumed. This may be appropriate if the household has a strong bequest motive, but many might conclude that this strategy unnecessarily restricts lifetime consumption.
Second, both the initial level and the time path of consumption depend not on the household’s preferences, but are instead an unplanned consequence of the household’s asset allocation. A household investing mainly in bonds can expect a fairly high initial income, but can also expect that the real purchasing power of that income will be eroded by inflation. On the other hand, a household investing mainly in growth stocks can expect an income that is initially quite low, but increases in real terms over time. It is only by chance that either of these paths will coincide with the household’s preferences.
Perhaps the most serious drawback of this strategy is its potential impact on asset allocation. The objective of the household’s asset allocation strategy should be to achieve the optimal trade-off between risk and reward, not to meet a particular income target. A dollar bill buys the same amount of consumption whether the dollar is a dollar of interest and dividends or a dollar withdrawn from capital. The risk of adopting this strategy is that the household’s consumption requirements start dictating its asset allocation. For example, a household seeking to maximize initial consumption might select a portfolio that is over-weighted in bonds and high-yield stocks, which economic theory indicates is unlikely to also provide the household with the best possible risk-reward tradeoff.
Spend down over one’s life expectancy Financial planning tools frequently evaluate the adequacy of a household’s retirement savings in terms of whether the household has sufficient wealth to sustain its desired standard of living over its life expectancy (say) to age 85. A household that actually
24 Another strategy might be to consume interest, dividends, and capital gains. This would produce an extremely volatile income flow, and is not considered further.
Asset Decumulation in Retirement: Bridging the Gap between Academic Research and Practical Advice
16
implemented a strategy of decumulating its wealth over its life expectancy would face an approximately 50-percent probability of surviving beyond its life expectancy and outliving its wealth. Indeed, a strategy of consuming one’s wealth over any fixed period, even if flawlessly executed, has a probability of failure that equals the probability of surviving to the end of that period.
The “four percent” rule A considerable literature (Bengen, 1994; Cooley, Hubbard, and Walz, 1998) argues, on the basis of Monte-Carlo simulations, that a household with a balanced portfolio of stocks and bonds and which consumes four percent of its initial wealth each year runs a very low risk of outliving its wealth. The first problem with this strategy is that a household can obtain a higher income with a precisely zero probability of outliving its wealth by purchasing an inflation-protected joint life annuity. At the time of writing, households can obtain yields of 4.7 percent at age 60 and 5.3 percent at age 65 from such an investment. For households lacking a bequest motive, and who are prepared to accept the sacrifice of liquidity, the inflation-protected annuity dominates the four percent rule.
The second and related problem is that the withdrawal rate does not respond to movements in stock prices. Suppose the stock market declines by 50 percent between age 60 and 61. At age 61, the household is now consuming eight percent of the current market value of its investments, compared with four percent for a household that happened to retire one year later. At an eight percent withdrawal rate, the household is on track to run out of money in only a few years. A more sensible strategy is therefore to adjust consumption to reflect realized asset returns.
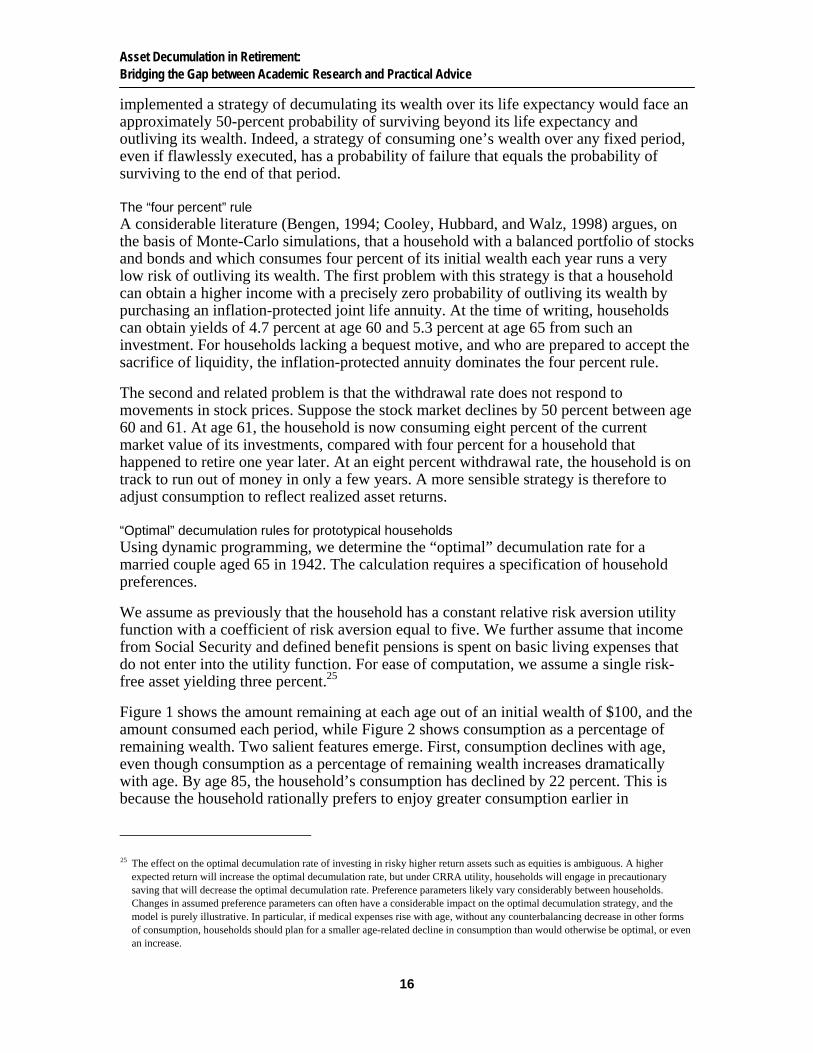
“Optimal” decumulation rules for prototypical households Using dynamic programming, we determine the “optimal” decumulation rate for a married couple aged 65 in 1942. The calculation requires a specification of household preferences.
We assume as previously that the household has a constant relative risk aversion utility function with a coefficient of risk aversion equal to five. We further assume that income from Social Security and defined benefit pensions is spent on basic living expenses that do not enter into the utility function. For ease of computation, we assume a single risk-free asset yielding three percent.25
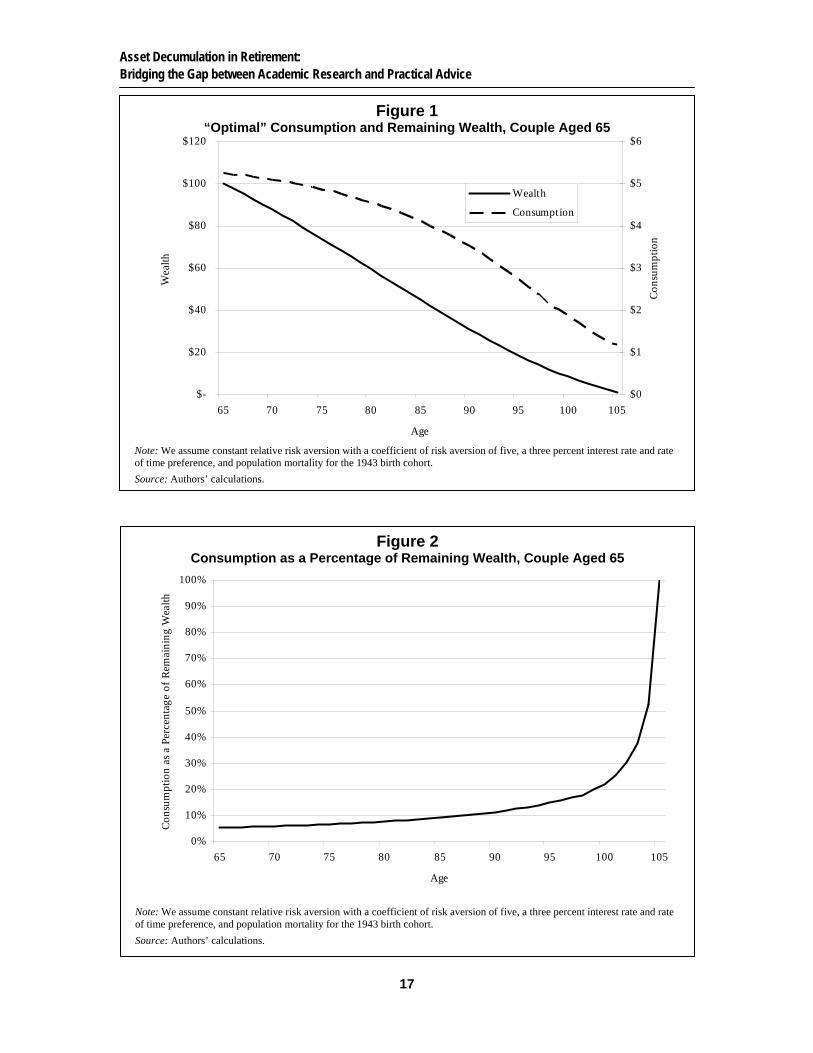
Figure 1 shows the amount remaining at each age out of an initial wealth of $100, and the amount consumed each period, while Figure 2 shows consumption as a percentage of remaining wealth. Two salient features emerge. First, consumption declines with age, even though consumption as a percentage of remaining wealth increases dramatically with age. By age 85, the household’s consumption has declined by 22 percent. This is because the household rationally prefers to enjoy greater consumption earlier in
25 The effect on the optimal decumulation rate of investing in risky higher return assets such as equities is ambiguous. A higher expected return will increase the optimal decumulation rate, but under CRRA utility, households will engage in precautionary saving that will decrease the optimal decumulation rate. Preference parameters likely vary considerably between households. Changes in assumed preference parameters can often have a considerable impact on the optimal decumulation strategy, and the model is purely illustrative. In particular, if medical expenses rise with age, without any counterbalancing decrease in other forms of consumption, households should plan for a smaller age-related decline in consumption than would otherwise be optimal, or even an increase.
Asset Decumulation in Retirement: Bridging the Gap between Academic Research and Practical Advice
17
Figure 2 Consumption as a Percentage of Remaining Wealth, Couple Aged 65
0%
10%
20%
30%
40%
50%
60%
70%
80%
90%
100%
65 70 75 80 85 90 95 100 105
Age
Con
sum
ptio
n as
a P
erce
ntag
e of
Rem
aini
ng W
ealth
Note: We assume constant relative risk aversion with a coefficient of risk aversion of five, a three percent interest rate and rate of time preference, and population mortality for the 1943 birth cohort.
Source: Authors’ calculations.
Figure 1 “Optimal” Consumption and Remaining Wealth, Couple Aged 65
$-
$20
$40
$60
$80
$100
$120
65 70 75 80 85 90 95 100 105
Age
Wea
lth
$0
$1
$2
$3
$4
$5
$6
Con
sum
ptio
n
Wealth
Consumption
Note: We assume constant relative risk aversion with a coefficient of risk aversion of five, a three percent interest rate and rate of time preference, and population mortality for the 1943 birth cohort.
Source: Authors’ calculations.

Asset Decumulation in Retirement: Bridging the Gap between Academic Research and Practical Advice
18
retirement when it is more likely to be alive to enjoy it. Second, consumption at age 65 is only 5.3 percent of initial wealth, which is no greater than that obtainable from the inflation-protected annuity discussed in Section 3. A household that chooses not to annuitize obtains little or no increase in current consumption, yet condemns itself to declining consumption as it ages.26 If households required something closer to level real consumption during the course of retirement, initial consumption would be lower still.
It is for the above reason that we advocate annuitization. We nonetheless recognize that many households remain annuity averse. For these households, the best strategy is to consume no more than five percent or so of remaining wealth early in retirement, increasing to nine percent or so by age 85.
5. THE HOUSING WEALTH DECISION
What most households do in practice:
Most households repay their mortgage by retirement. The proportion of retired households taking a reverse mortgage, although increasing, remains small.
Conventional wisdom:
The house is rarely even mentioned in financial planning tools. There is conflicting advice as to whether households should repay their mortgage on retirement.27 Reverse mortgages are perceived as products that should be used only by impoverished households that have exhausted their financial wealth.
Appropriate advice for most people:
Households should aim to enter retirement debt-free. Although it may be possible to earn a higher after-tax return on financial assets than the after-tax cost of a mortgage, this additional return will usually involve the risk of loss. Given plausible risk preferences and observed household allocations of financial assets, households should not take on this risk.
Reverse mortgages are a valuable, albeit somewhat expensive means of tapping housing equity for non-housing consumption while continuing to live in the house. But a dollar of housing equity spent on non-housing consumption is a dollar plus interest and fees that is unavailable on eventual sale to fund long-term care cost, or to pass on as a bequest.
26 Households that invested in stocks but chose the same percentage decumulation rate would, on average, experience a smaller decline in consumption while risking a much greater decline should markets perform poorly. But the proper comparison for such households is the purchase of a variable immediate annuity.
27 For example, Suze Orman, writing for The Oprah Magazine, recommends repaying the mortgage (http://www.oprah.com/omagazine/200509/omag_200509_suze.jhtml), as does Jonathan Clements of The Wall Street Journal (http://www.realestatejournal.com/buysell/mortgages/20041012-clements.html). But Jack Guttentag, writing for Yahoo Finance, comes out on balance against repaying the mortgage (http://finance.yahoo.com/expert/article/mortgage/40934).

Asset Decumulation in Retirement: Bridging the Gap between Academic Research and Practical Advice
19
Households need to consider how highly they value these alternative potential uses of housing equity.
The amount that can be obtained on a reverse mortgage depends on the value of the house, increases with age, and is inversely related to interest rates. An increase in interest rates, or a decline in house prices could dramatically reduce the amount that can be borrowed on a reverse mortgage. Households preparing for retirement should not regard housing wealth as an adequate substitute for saving in financial assets.
DISCUSSION
Although it remains the goal of many households to repay their mortgage by retirement, an increasing proportion now enter retirement with a mortgage. At the same time, at least until the recent financial crisis, an increasing number of households were entering retirement with substantial amounts of financial assets, as a result of the growth of 401(k) and similar plans.
A household that chooses not to repay its mortgage is, in effect, choosing to invest with borrowed money. It is possible that it can earn a higher after-tax return on stock market investments than the after-tax cost of the mortgage. But for most households the argument is fallacious; they do not need a mortgage to get all the exposure to the stock market they want.
Consider a retired household with $200,000 in financial assets that chooses to repay its $100,000 mortgage. It can allocate its remaining $100,000 financial assets between stocks and bonds. After taking appropriate advice, it decides to allocate its $100,000 wealth 50:50 between stocks and bonds, investing $50,000 in each category.
Suppose that the household instead decides not to repay its mortgage. It now has $200,000 to invest and has to decide whether to increase its investment in stocks. Assume for convenience that the after-tax return that the household can earn on bonds exactly equals the after-tax interest cost of the mortgage. Then the household could simply invest the additional $100,000 in bonds, with the result that its new portfolio produced the same return for the same risk as it did previously.28
But might it instead prefer a different portfolio, (say) $60,000 invested in stocks, and $140,000 in bonds? The answer is “no!” The household could have achieved the balance of risk and reward that goes with a $60,000/$140,000 portfolio and a $100,000 mortgage by choosing a $60,000/$40,000 portfolio and $0 mortgage, but chose not to.
The sole exception to the above rule is for the rare case where the household is so risk tolerant that its optimal investment in stocks exceeds the size of its portfolio—that it faces a binding borrowing constraint. But few households have a 100 percent equity
28 In reality, the situation is somewhat more complicated. The after-tax cost of the mortgage may differ from the after-tax return on bonds. Our investigations indicate that it will usually be greater, but it might be less if the household took out its mortgage when interest rates were unusually low or if the household both itemizes its tax returns and is investing its marginal dollar in tax-deferred accounts. Mortgages often allow prepayment without penalty – equivalent to a bond call option – that will have some value to the household. Households can obtain higher returns on risky bonds. Amromin, Huang, and Sialm (2006) argued that households should retain their mortgages and invest in mortgage-backed securities, viewing them as hedging the household’s mortgage liability. But these have transpired to be highly risky assets. For a further discussion of the issues, see Webb (2009 forthcoming).
Asset Decumulation in Retirement: Bridging the Gap between Academic Research and Practical Advice
20
portfolio, while simple calculations of optimal one-period portfolio allocations suggest that such a portfolio allocation will rarely be appropriate.
THE REVERSE MORTGAGE DECISION
In contrast to a traditional forward mortgage where the household is required to make periodic interest payments, the interest on a reverse mortgage is rolled up until the death of the surviving spouse or the earlier sale of the property. The interest rate on the most widely-used product, the Home Equity Conversion Mortgage, is set at 1.5 percent above the one-year constant maturity Treasury rate. The loan, plus accumulated interest, is capped at the sale proceeds of the property. In return, the borrower pays a premium of two percent of the lesser of the appraised value and the county FHA loan limit, deducted from the loan, plus a 0.5 percent interest supplement. Other costs include an origination fee of a maximum of two percent of the lesser of the appraised value and the county loan limit, plus closing costs that the AARP inform us average $2,000 to $3,000. Although not strictly a closing cost, the present value of servicing costs to age 100 is also deducted from the loan. We calculate that at current interest rates the deduction amounts to around $5,000 at age 65. The loan can be taken in the form of a lump sum, line of credit, or lifetime income. The amount that can be borrowed depends on the local FHA loan limit, the value of the house and the current ten-year Treasury bond interest rate.
Reverse mortgages are widely perceived as a high cost product that should only be used when all other resources have been exhausted. There have also been allegations of mis-selling, and in particular that households have been encouraged to invest the proceeds in unsuitable financial products. 29
Although the fees charged can be substantial in relation to the amount borrowed, the inherent complexity of the product may limit the scope for reductions. Fees do, however, vary, even between providers of HECM mortgages, and prospective borrowers should shop around. Clearly, the level of closing costs is such that a household anticipating selling its house in the near future would be better off tapping alternative sources of funds, if available.
A dollar borrowed on a reverse mortgage and consumed is a dollar (plus interest and closing costs) that is unavailable for other purposes, for example a bequest or medical costs. If the house would otherwise pass as an unintended bequest, then a reverse mortgage makes sense regardless of the interest rate or fees. But if the household has a bequest motive, or views the house as self-insurance against end-of-life medical costs, poor investment returns, or simply the risk of outliving its financial wealth, then the household needs to consider how it wants to trade-off current consumption against the value of that insurance. In particular, it should consider whether it might be appropriate to use part of the proceeds of the reverse mortgage to purchase insurance against the above risks. For example, it might use the proceeds to purchase annuities to insure longevity
29 For example, “Tapping into homes can be pitfall for the elderly” New York Times, 2 March 2008. A deferred annuity lacks the essential characteristic of an immediate annuity, namely the transfer of wealth from those who die to those who survive. In consequence, immediate annuities provide much higher returns, particularly at older ages. Deferred annuities typically also have high commissions and surrender charges.
Asset Decumulation in Retirement: Bridging the Gap between Academic Research and Practical Advice
21
risk, while Stucki (2006) has proposed combining reverse mortgages with the purchase of long-term care insurance.30
As mentioned previously, households may take the proceeds of a HECM mortgage as a lump sum, lifetime income, or line of credit. Sun, Triest, and Webb (2007) concluded that the lifetime income will generally be optimal, unless the household requires the proceeds for a specific purpose. But they also find that at older ages, the household will generally be even better off taking a lump sum and buying an immediate annuity from an insurance company.31 This strategy should not be confused with the use of the proceeds of a reverse mortgage to purchase a deferred annuity. Using the proceeds of a reverse mortgage to purchase a deferred annuity is almost never appropriate as it fails to maximize income, involves a loss of liquidity, and often exposes the household to investment risk.32
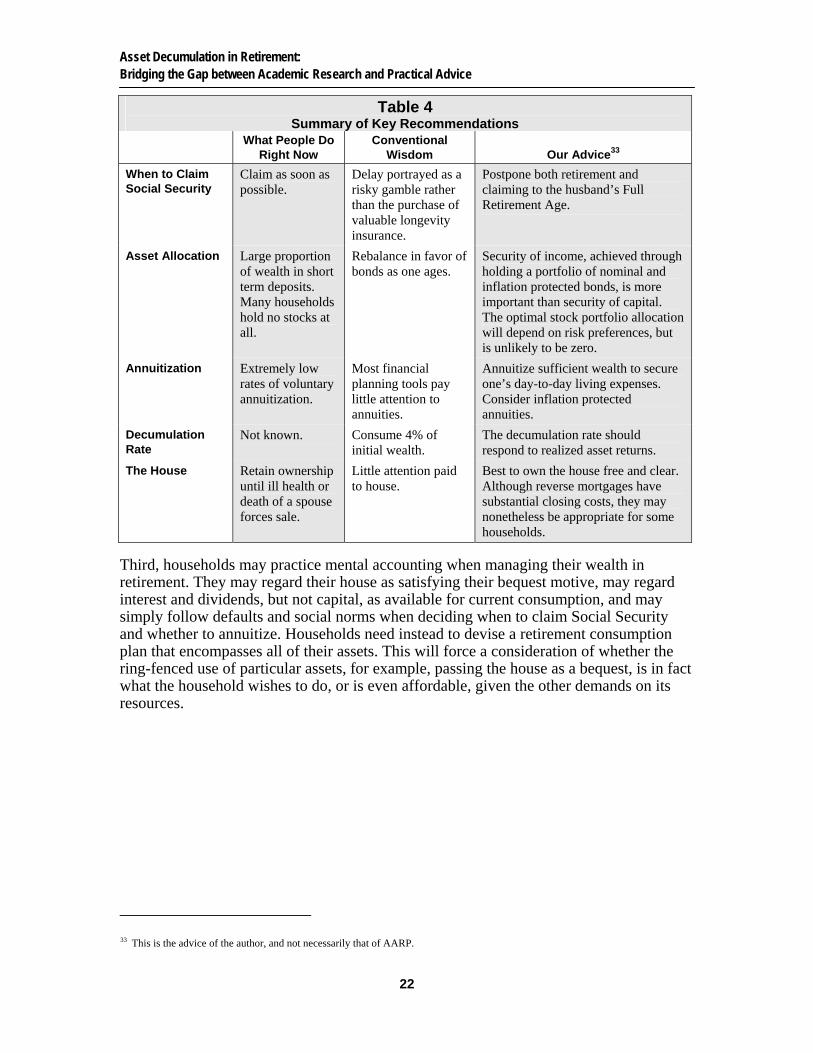
CONCLUSIONS
Table 4 summarizes our key recommendation for each of the five decisions considered. These recommendations constitute general guidelines and any investment or financial planning strategy should be based upon the particular circumstances of the household.
Households appear to make errors in all five of the areas considered. Research into behavioral finance is at an early stage, but it seems plausible that the following factors contribute to poor decision making.
First, households misunderstand the nature of risk, being overly concerned with the possibility of suffering a short-term reduction in the nominal value of their assets, and insufficiently focused on the risk of being unable to sustain real consumption in the long-term. We attribute the reluctance of households to annuitize, and the small proportions of wealth invested in stocks and long-term bonds, particularly inflation-protected bonds to a lack of concern about and awareness of inflation and longevity risk, and an excessive focus on immediate loss-aversion.
Second, households appear to suffer from short-sightedness, taking actions that have no adverse impact on their immediate standard of living, but which will likely cause harm in the long run. Among short-sighted decisions, we would include claiming Social Security at the Early Eligibility Age, carrying a mortgage into retirement, and failing to annuitize. But it is not clear to us whether these actions reflect a high rate of time preference (Warner and Pleeter, 2001) or simply an inability to understand the long-term consequences.
30 Sun, Triest, and Webb (2007) calculate that most households will obtain a higher income by purchasing an immediate annuity with a lump sum advance than taking the reverse mortgage lifetime income option. A discussion of the merits of long-term care insurance is beyond the scope of this paper. Many policies have serious deficiencies. For example, insurers typically have the right to increase premiums, to potentially unaffordable levels, and the duration of payments is typically limited, so that the household still faces some, albeit reduced, risk of extremely high expenses.
31 The annuity strategy reduces the value of the household’s estate, particularly if it dies soon after taking the loan. This is because the reverse mortgage lender is advancing the purchase price of the annuity instead of the income payments as they fall due.
32 The Housing and Economic Recovery Act, 2008, prohibits mortgage lenders from requiring borrowers to purchase other financial products and requires financial companies to institute firewalls to prevent cross-selling. This legislation was a response to the abusive tying of deferred annuities to reverse mortgages, but may also deter the legitimate use of reverse mortgages to purchase long-term care insurance and immediate annuities.
Asset Decumulation in Retirement: Bridging the Gap between Academic Research and Practical Advice
22
Table 4 Summary of Key Recommendations
What People Do
Right Now Conventional
Wisdom Our Advice33
When to Claim Social Security
Claim as soon as possible.
Delay portrayed as a risky gamble rather than the purchase of valuable longevity insurance.
Postpone both retirement and claiming to the husband’s Full Retirement Age.
Asset Allocation Large proportion of wealth in short term deposits. Many households hold no stocks at all.
Rebalance in favor of bonds as one ages.
Security of income, achieved through holding a portfolio of nominal and inflation protected bonds, is more important than security of capital. The optimal stock portfolio allocation will depend on risk preferences, but is unlikely to be zero.
Annuitization Extremely low rates of voluntary annuitization.
Most financial planning tools pay little attention to annuities.
Annuitize sufficient wealth to secure one’s day-to-day living expenses. Consider inflation protected annuities.
Decumulation Rate
Not known. Consume 4% of initial wealth.
The decumulation rate should respond to realized asset returns.
The House Retain ownership until ill health or death of a spouse forces sale.
Little attention paid to house.
Best to own the house free and clear. Although reverse mortgages have substantial closing costs, they may nonetheless be appropriate for some households.
Third, households may practice mental accounting when managing their wealth in retirement. They may regard their house as satisfying their bequest motive, may regard interest and dividends, but not capital, as available for current consumption, and may simply follow defaults and social norms when deciding when to claim Social Security and whether to annuitize. Households need instead to devise a retirement consumption plan that encompasses all of their assets. This will force a consideration of whether the ring-fenced use of particular assets, for example, passing the house as a bequest, is in fact what the household wishes to do, or is even affordable, given the other demands on its resources.
33 This is the advice of the author, and not necessarily that of AARP.
Asset Decumulation in Retirement: Bridging the Gap between Academic Research and Practical Advice
23
APPENDIX
Calculating Optimal Social Security Claiming Strategies Including Value of Longevity Insurance
In this appendix, we explain how we calculate optimal claiming strategies taking account of the value of longevity insurance
We follow the literature by analyzing the household’s decision in expected utility terms, assuming a constant relative risk aversion utility function with the coefficient of risk-aversion assumed to equal two or five.
The household’s expected utility equals the sum of each period’s utility, multiplied by population average survival probabilities for couples currently aged 62, and discounted by a rate of time preference that for consistency with previous research is assumed to equal a three percent real interest rate.34
Under constant relative risk aversion, the value of additional purchases of longevity insurance depends on the proportion of household wealth that is already annuitized.
For consistency with previous research, and to ensure that claiming ages are unaffected by liquidity constraints, we assume that at age 62 unannuitized financial wealth equals the expected present value of Social Security benefits.35 We further assume that the household is a one-earner couple, with the husband born in 1946. We assume that the wife is either the same age or three years younger, the average for this cohort. We defer to further research the analysis of other household types and inclusion of alternative sources of longevity insurance.36
Our strategy is as follows. We use numerical optimization techniques to calculate the household’s optimal decumulation of financial wealth, assuming husband and wife claim at age 62, and note the household’s expected utility. Then, we change the assumed claiming ages, and repeat the calculation. If the household delays claiming, it relies solely on financial wealth to fund consumption prior to claiming, reducing drawings on financial wealth once benefits commence. Having determined the combination of claiming ages that maximizes expected utility, we calculate the factors by which the household’s total wealth must be increased so that it is as well off in expected utility terms claiming at various sub-optimal ages as at the optimum.
34 We assume that the retirement decision has already been taken. To do otherwise would involve making difficult judgments about the amount the household could earn in the labor market, and how leisure entered into the utility function.
35 Dushi and Webb (2004) found that households turning 65 between 1994 and 2000 typically had much higher proportions of pre-annuitized wealth, reflecting the prevalence of defined benefit pension plans among this cohort. Subsequent birth cohorts will likely have smaller proportions of pre-annuitized wealth as Social Security replacement rates decline and unannuitized defined contribution pension plans come to predominate.
36 At older ages, it can be cheaper to buy annuities from insurance companies than from the Social Security Administration, an issue that is considered in Section Five.
Asset Decumulation in Retirement: Bridging the Gap between Academic Research and Practical Advice
24
REFERENCES
Amromin, Gene, Jennifer Huang, and Clemens Sialm. 2007. “The Tradeoff between Mortgage Prepayments and Tax-Deferred Savings Accounts.” Journal of Public Economics 91(10): 2014–2040.
Bengen, William P. 1994. “Determining Withdrawal Rates Using Historical Data” Journal of Financial Planning 7(4): 171–180.
Brown, Jeffrey R., Olivia S. Mitchell, and James M. Poterba. 2001. “The Role of Real Annuities and Indexed Bonds in an Individual Accounts Retirement Program.” in Risk Aspects of Investment-Based Social Security Reform, pp. 321–370. Chicago: University of Chicago Press.
Brown, Jeffrey R. and James M. Poterba. 2000. “Mortality Risk, Inflation Risk, and Annuity Products.” Working Paper No. 7812. Cambridge, MA: National Bureau of Economic Research.
Brown, Jeffrey R., Marcus D. Casey, and Olivia S. Mitchell. 2008. “Who Values the Social Security Annuity? New Evidence on the Annuity Puzzle” Working Paper No. 13,800. Cambridge, MA: National Bureau of Economic Research.
Campbell, John Y. and Luis M. Viceira. 2001. “Who Should Buy Long-Term Bonds?” American Economic Review 91(1): 99–127.
Campbell, John Y. and Luis M. Viceira. 2002. “Is the Stock Market Safer for Long-Term Investors” in Strategic Asset Allocation: Portfolio Choice for Long-Term Investors, pp. 88–120. Oxford: Oxford University Press.
Chetty, Raj. 2006 “A New Method of Estimating Risk Aversion.” American Economic Review 96(5): 1821–1834.
Coile, Courtney and Kevin Milligan. 2006. “How Household Portfolios Evolve After Retirement: The Effect of Aging and Health Shocks.” Working Paper No. 12391. Cambridge, MA: National Bureau of Economic Research.
Cooley, Philip L., Carl M. Hubbard, and Daniel T. Walz. 1998. “Retirement Savings: Choosing a Withdrawal Rate That Is Sustainable.” The American Association of Individual Investors Journal February: 16–21.
Davidoff, Thomas, Jeffrey R. Brown, and Peter A. Diamond. “Annuities and Individual Welfare.” 2005. American Economic Review 95(5): 1573–1590.
De Nardi, Mariacristina, Eric French, and John Bailey Jones. 2006. “Differential Mortality, Uncertain Medical Expenses, and the Saving of Elderly Singles.” Working Paper No. 12554. Cambridge, MA: National Bureau of Economic Research.
Dushi, Irena and Anthony Webb. 2004. “Household Annuitization Decisions: Simulations and Empirical Analyses.” Journal of Pension Economics and Finance 3(2) 109–143.
Asset Decumulation in Retirement: Bridging the Gap between Academic Research and Practical Advice
25
Friedman, Joseph, and Herbert E. Phillips. 2008. “Optimizing Social Security Benefit Initiation and Postponement Decisions: A Sequential Approach” Financial Services Review 17: 155–168.
Gong, Guan and Anthony Webb. 2008. “Evaluating the Advanced Life Deferred Annuity – An Annuity People Might Actually Buy.” Working Paper No. 2007-15. Chestnut Hill, MA: Center for Retirement Research at Boston College.
Investment Company Institute. 2008. “The U.S. Retirement Market, Third Quarter 2008.” Research Fundamentals 17(3).
Jagannathan, Ravi, and Narayana, R. Kocherlakota. 1996. “Why Should Older People Invest Less in Stocks than Younger People?” Federal Reserve Bank of Minneapolis Quarterly Review 20(3): 11–23.
Love, David A., Michael G. Palumbo, and Paul A. Smith. 2009. “The Trajectory of Wealth in Retirement.” Journal of Public Economics 93(1-2): 191–208.
Lusardi, Annamaria and Olivia S. Mitchell. 2007. “Financial Literacy and Retirement Preparedness: Evidence and Implications for Financial Education.” Business Economics 42(1): 35–44.
Mahaney, James and Peter Carlson. 2006. “Innovative Strategies to Help Maximize Social Security Benefits.” Prudential Financial White Paper, April. Available at: http://www.prudential.com/media/managed/IB-InnovativeStrategies.pdf
Malkiel, Burton G. 1996. A Random Walk Down Wall Street: Including a Life-cycle Guide to Personal Investing. Sixth edition. Norton: New York and London.
Milevsky, Moshe A. 1998. “Optimal Asset Allocation towards the End of the Life Cycle: To Annuitize or Not to Annuitize.” Journal of Risk and Insurance 24(1-2): 149–154.
Milevsky, Moshe A. 2000. “Optimal Annuitization Policies: Analysis of the Options.” North American Actuarial Journal 5(1): 57–69.
Mitchell, Olivia S., James M. Poterba, Mark J. Warshawsky, and Jeffrey R. Brown. 1999. “Taxing Retirement Income: Nonqualified Annuities and Distributions from Qualified Accounts.” National Tax Journal 14(3): 219–234.
Munnell, Alicia H. and Mauricio Soto. 2005. “Why Do Women Claim Social Security Benefits So Early.” Issue in Brief No. 35. Chestnut Hill, MA: Center for Retirement Research at Boston College.
Pang, Gaobo and Mark Warshawsky. 2007. “Optimizing the Equity-Bond-Annuity Portfolio in Retirement: The Impact of Uncertain Health Expenses.” Watson-Wyatt Technical Paper.
Shiller, Robert J. 2006. The Life-Cycle Personal Accounts Proposal for Social Security: An Evaluation of President Bush’s Proposal. Journal of Policy Modeling 28(4): 427–444.
Stucki, Barbara. 2006. “Using Reverse Mortgages to Manage the Financial Risk of Long-Term Care.” North American Actuarial Journal 10(4): 90–102.
Asset Decumulation in Retirement: Bridging the Gap between Academic Research and Practical Advice
26
Sun, Wei, Robert K. Triest, and Anthony Webb. 2007. “Optimal Retirement Asset Decumulation Strategies: The Impact of Housing Wealth” Public Policy Discussion Paper No. 07-2. Boston, MA: Federal Reserve Bank of Boston.
Sun, Wei, and Anthony Webb. 2009. “How much Do Households Really lose by Claiming Social Security at Age 62” Center for Retirement Research at Boston College Unpublished Working Paper.
Turra, Cassio M. and Olivia S. Mitchell. 2007. “The Impact of Health Status and Out-of-Pocket Medical Expenditures on Annuity Valuation.” Working Paper No. 2007-30. Philadelphia, PA: The Pension Research Council.
Venti, Steven and David Wise. 2004. “Aging and Housing Equity: Another Look.” In Perspectives on the Economics of Aging. Edited by David A. Wise, pp. 127–180. Chicago, IL: University of Chicago Press.
Warner, John T. and Saul Pleeter. 2001. “The Personal Discount Rate, Evidence from Military Downsizing Programs.” American Economic Review 91(1): 33–53.
Webb, Anthony. 2009 (forthcoming). “Should You Carry a Mortgage into Retirement?” Issue in Brief. Chestnut Hill, MA: Center for Retirement Research at Boston College.
Yaari, Menahem E. 1965. “Uncertain Lifetime, Life Insurance, and the Theory of the Consumer.” Review of Economic Studies 32: 137–150.
Yogo, Motohiro. 2008. “Portfolio Choice in Retirement: Health Risk and the Demand for Annuities, Housing, and Risky Assets.” Unpublished Working Paper.