province-wide lidar data acquisition · 1 1. introduction the data generated by aerial lidar (light...
TRANSCRIPT
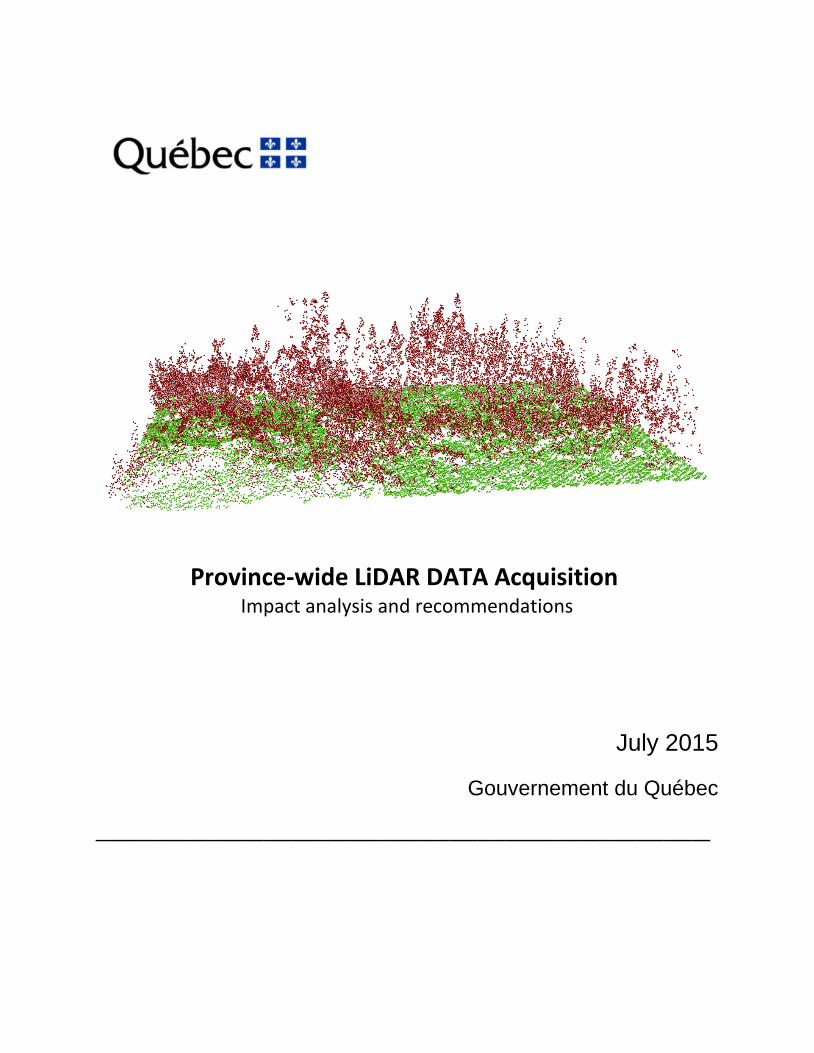
Province-wide LiDAR DATA Acquisition Impact analysis and recommendations
July 2015
Gouvernement du Québec
__________________________________________________________________

WRITTEN BY
Antoine Leboeuf, F.Eng. Ph. D.
CONTRIBUTORS
Antoine Leboeuf, F.Eng. Ph. D. Simon Vézeau, F.Eng. Sébastien Lacroix, F.Eng., M.Sc. WRITTEN IN COLLABORATION WITH
Isabelle Pomerleau, F.Eng. REVISION
Hélène D’Avignon, F.Eng., professional writer
Christine Gardner, professional writer TRANSLATION Brenna Douglas PAGE LAYOUT Julie Barrette, Secretary Magdalena Jacques, Secretary ILLUSTRATIONS
Antoine Leboeuf, F.Eng. Ph. D. For additional information, please contact the Ministère des Forêts, de la Faune et des Parcs (MFFP) du Québec the: Direction des inventaires forestiers 5700, 4e Avenue Ouest, A-108 Québec City (Québec) G1H 6R1 Telephone: 418 627-8669 Toll free: 1 877 9FORÊTS (1 877 936-7387) Fax: 418 646-1995 E-mail: [email protected] Website: www.mffp.gouv.qc.ca/fr/forets/inventaire
© Gouvernement du Québec
Copyright Bibliothèque et archives nationales du Québec 2014 ISBN pdf: 978-2-550-74013-1
Table of Contents
1. Introduction ....................................................................................................... 1
2. Sources of Information, Calculation, Results and Benefits of the Analysis Method .............................................................................................................. 2
2.1 Sources of information ......................................................................................................... 2
2.2 Calculation of benefits .......................................................................................................... 2
2.3 Calculation of benefits for Government ............................................................................... 3
2.4 Calculation of benefits for the forest industry ..................................................................... 4
2.5 Results of the benefit calculation ......................................................................................... 4
2.5.1 For the government departments involved in the project ............................................ 4
2.5.2 For organizations involved in the project ...................................................................... 8
3. Interpretation of the Benefit Analysis Results .................................................... 9
3.1 Benefits for the Québec Government .................................................................................. 9
3.2 Benefits for the forest industry ............................................................................................ 9
4. Conclusion and Recommendations .................................................................. 10
5. References ....................................................................................................... 12
Schedule 1. Government Departments and Organizations Involved in the Project ................................................................................................... 13

1
1. Introduction
The data generated by aerial LiDAR (Light Detection and Ranging) sensors has great potential for use in the fields of base mapping (hydrography, topography), civil engineering (roads, urban planning) and natural resource management (agriculture, forest). Although the cost of this type of data has decreased in recent years, it remains relatively expensive to acquire. On the other hand, the high-precision ground and vegetation information that it provides generates significant benefits in terms of savings. Some provinces have already applied this technology over large areas and have acknowledged the profitability of such an investment.
Alberta, in covering a good part of its territory, has already verified the profitability of using this technology. Ontario has acquired data over approximately 20,000 km² in two sectors, allowing them to demonstrate that the forest industry had benefited from a $1.60/m³ “return on investment” (Lacroix and Charrette, 2013). Since 2013, New Brunswick has embarked on a province-wide LiDAR data acquisition process, in association with its forest inventory. Québec has been continuously acquiring data since 2009 for specific sectors such as road corridors or forest harvesting sites. These applications have shown that the greater the area covered, the lower the acquisition cost per square kilometre. The cost stabilizes once a certain surface area has been attained.
Figure 1. Digital model creation from an aerial LiDAR sensor
For LiDAR technology data acquisition, Québec may also benefit in terms of return on investment. To that end, a team from the Ministère des Forêts, de la Faune et des Parcs (MFFP) has carried out an analysis of the anticipated benefits for both the Government and the forest industry. The goal of this analysis, which used a number of information sources and calculation methods, was to determine if there would be a positive return from an investment in province-wide LiDAR data acquisition.
Digital Surface Model (DSM)
Canopy Height Model (CHM)
Digital Terrain Model (DTM)
Aerial Photography (traditional)

2
This report presents the results of that analysis, from which several recommendations have been derived. The sections address, in order, the origin and nature of the information used to calculate the benefits, and the method of analysis used. This is followed by the analysis results and their interpretation, leading to several recommendations for collective actions.
2. Sources of Information, Calculation, Results and Benefits of the Analysis Method
2.1 Sources of information
The government departments and organizations involved in this province-wide LiDAR data acquisition project all provided information for the purpose of the benefit analysis. Four broad categories of information were provided:
1. Information in the form of raw and processed data, stemming from direct use of LiDAR technology.
2. Information from the literature on the use of LiDAR technology. 3. Estimated information, arising from direct or indirect use of LiDAR technology. 4. Information on the cost of activities and processes related to data acquisition using
methods other than LiDAR technology.
In the context of this analysis, benefits are related to cost reductions resulting from the use of LiDAR technology as opposed to another means of data acquisition. Table 1 presents some details on the data used to calculate and analyze the benefits. Schedule 1 contains a list of the various departments and organizations involved in the province-wide LiDAR data acquisition project.
2.2 Calculation of benefits
Two types of benefits were calculated: quantifiable benefits and non-quantifiable benefits.
Quantifiable benefits are those relating to the cost of activities associated to a lesser or greater extent with field data collection. Examples include transportation and accommodation of technicians in the field, purchase of materials required to complete the mandate, and so on. In most cases, the results of these calculations were compared to costs calculated for LiDAR data acquisition. In some cases, the benefits were estimated on the basis of past experience.
Non-quantifiable benefits are those to which no monetary value is ascribed. They are therefore described qualitatively. Monetary amounts have not been ascribed for two reasons: (1) the representative was not able to confidently quantify the benefit of an activity employing LiDAR data, or (2) the stated benefits could not be quantified. For example, the use of LiDAR data results in more precise eco-forestry or topographic maps.
It should be noted that, to demonstrate the positive return on investment from acquiring LiDAR data over a wide area (for both the Government and the industry), only the monetary amounts of quantifiable benefits were considered and compared with the cost associated with LiDAR acquisition. Non-quantifiable benefits were used to expand the interpretation of the results.

3
Table 1. Sources of information, processing and calculation of benefits used in the analysis
Department or
organization providing
information
Origin and nature of the information Processing and
calculation of benefits
MFFP
(i) MFFP pilot project: 12,000 km² region north of Lac-Saint-Jean (forest management units 24-51) LiDAR data coverage acquired in 2013 and 2014 at a density of 2 points per m²: - Raw data (LAS) - Processed data (CHM, DEM, volume of timber, etc.) derived using Region 02’s LiDAR Suite and the Lastools software. (ii) Information from the literature on the impacts of LiDAR technology use on costs and the time required for certain transactions. (iii) Examples of LiDAR technology use, Lacroix and Charrette (2013), for example.
Acquisition costs:
Analysis of the LiDAR acquisition costs from 2009 to 2013, storage and processing costs (software, licences, etc.).
Quantifiable benefits: Benefits calculated by comparing the cost of the data acquisition process, with or without LiDAR technology.
Non-quantifiable benefits: Estimate of the qualitative benefits of LiDAR data input.
MERN, MSP, MDDELCC, MAPAQ, MTQ, MAMOT
(i) Information from the literature on the impacts of LiDAR use on costs and the time required for certain transactions. (ii) Estimates of the benefits arising from LiDAR use, based on past acquisitions of LiDAR data.
Quantifiable benefits: Estimate of benefits derived from pre-existing sources of information or past acquisitions.
Non-quantifiable benefits: Estimate of the qualitative benefits of LiDAR data input.
Forest industry
(i) MFFP pilot project: 12,000 km² region north of Lac-Saint-Jean (forest management units 24-51) LiDAR data coverage acquired in 2013 and 2014 at a density of 2 points per m²: - Raw data (LAS) - Processed data (CHM, DEM, volume of timber, etc.) derived using Region 02’s LiDAR Suite and the Lastools software. (ii) Information from the literature on the costs of industrial scale operations.
Quantifiable benefits: Benefits calculated by comparing the costs of industrial operating costs, with or without LiDAR technology.
2.3 Calculation of benefits for Government
The benefits have been calculated over a ten-year time horizon. Over this ten-year period, forest characteristics remain relatively stable and the terrain (DEM) does not change. The annual benefits calculated on this horizon were actualized to the current (reference) year, with an assumption of constant dollars and a 4% annual interest rate. It should be noted that the benefits on this horizon might be higher in the case of DEM use, as topographic data can be employed permanently in most regions.

4
2.4 Calculation of benefits for the forest industry
The analysis of benefits for the forest industry was conducted on forest management units 24-51. The benefits were calculated by comparing the cost of those operations that use LiDAR data with the same operations (e.g. road construction) that use other, traditional data sets (ecoforest maps, land plots, etc.). Operating costs and benefits were calculated by economic analysis experts at the MFFP and were based on conversations with forest industry representatives.
2.5 Results of the benefit calculation
2.5.1 For the government departments involved in the project
Tables 2 to 9 present the results of the calculation of quantifiable and non-quantifiable benefits. Non-quantifiable benefits are indicated by “N.A.” in the “Gains” column. Table 2. Acquisition costs and storage
Activity Cost ($/km²)
LiDAR data acquisition 60
Storage, management fees and data processing 8
Subtotal 68
Table 3. Benefits for the Ministère des Forêts, de la Faune et des Parcs (MFFP)
Activity Gains
($/km²) Ecoforest maps: gains with regard to mapping contracts 5.20
Reduced effort for the Wood Marketing Board (BMMB) for pre-harvest inventories 35.18
Greater buyer confidence in the starting price of sites up for bids 8.28
Reduced effort for regional operations for pre-harvest inventories 29.67
Optimized silviculture prescription process 0.56
Gains in person hours per year for marking intervention areas and tracks N.A. Gains of 5 person days per year by reducing the number of requests for changes to the annual forest management activities program (e.g. addition of territory due to missing volumes, forest cut adjustments, etc.)
N.A.
Gains of 2 person days per year by reducing amendments and exemptions for the BMMB
N.A.
Gains of 2 person days per year in checking volumes affected by harvesting, with regard to the forest potential (constraints)
N.A.
Gains of 2 person days per year in the planning required for forest policies (rivers, etc.) and forest management (constraints, orphaned stands, steep slopes)
N.A.
Lower travel expenses for the MFFP’s employees due to fewer on-site visits for exemptions and plot verification
N.A.
Greater compilation accuracy (e.g. volumes by variety) in the forest inventory required for determining forest potential
N.A.
Easier logistics for field work: identifying passable roads and helicopter landing sites N.A.
Subtotal 78.89
5
Note: Gains in terms of person hours have not been added, but serve to present productivity gains for the relevant organizations. These gains in person hours can therefore be attributed to other issues.
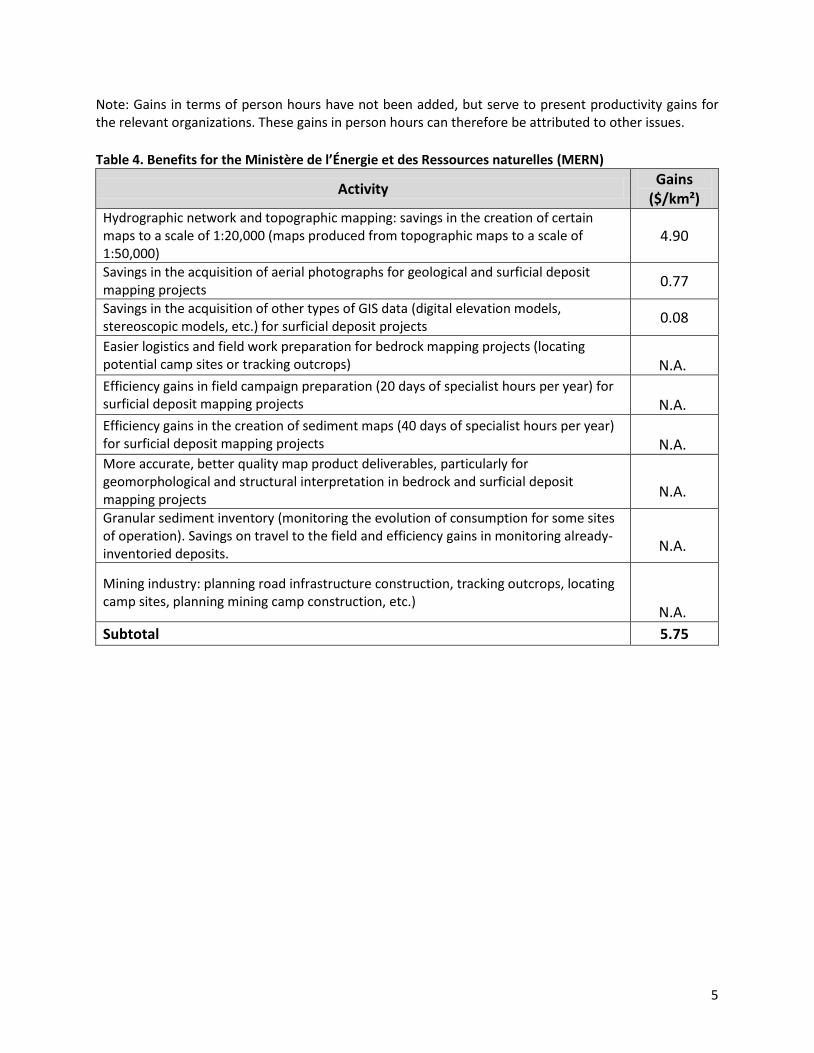
Table 4. Benefits for the Ministère de l’Énergie et des Ressources naturelles (MERN)
Activity Gains
($/km²) Hydrographic network and topographic mapping: savings in the creation of certain maps to a scale of 1:20,000 (maps produced from topographic maps to a scale of 1:50,000)
4.90
Savings in the acquisition of aerial photographs for geological and surficial deposit mapping projects
0.77
Savings in the acquisition of other types of GIS data (digital elevation models, stereoscopic models, etc.) for surficial deposit projects
0.08
Easier logistics and field work preparation for bedrock mapping projects (locating potential camp sites or tracking outcrops)
N.A.
Efficiency gains in field campaign preparation (20 days of specialist hours per year) for surficial deposit mapping projects
N.A.
Efficiency gains in the creation of sediment maps (40 days of specialist hours per year) for surficial deposit mapping projects
N.A.
More accurate, better quality map product deliverables, particularly for geomorphological and structural interpretation in bedrock and surficial deposit mapping projects
N.A.
Granular sediment inventory (monitoring the evolution of consumption for some sites of operation). Savings on travel to the field and efficiency gains in monitoring already-inventoried deposits.
N.A.
Mining industry: planning road infrastructure construction, tracking outcrops, locating camp sites, planning mining camp construction, etc.)
N.A.
Subtotal 5.75
6
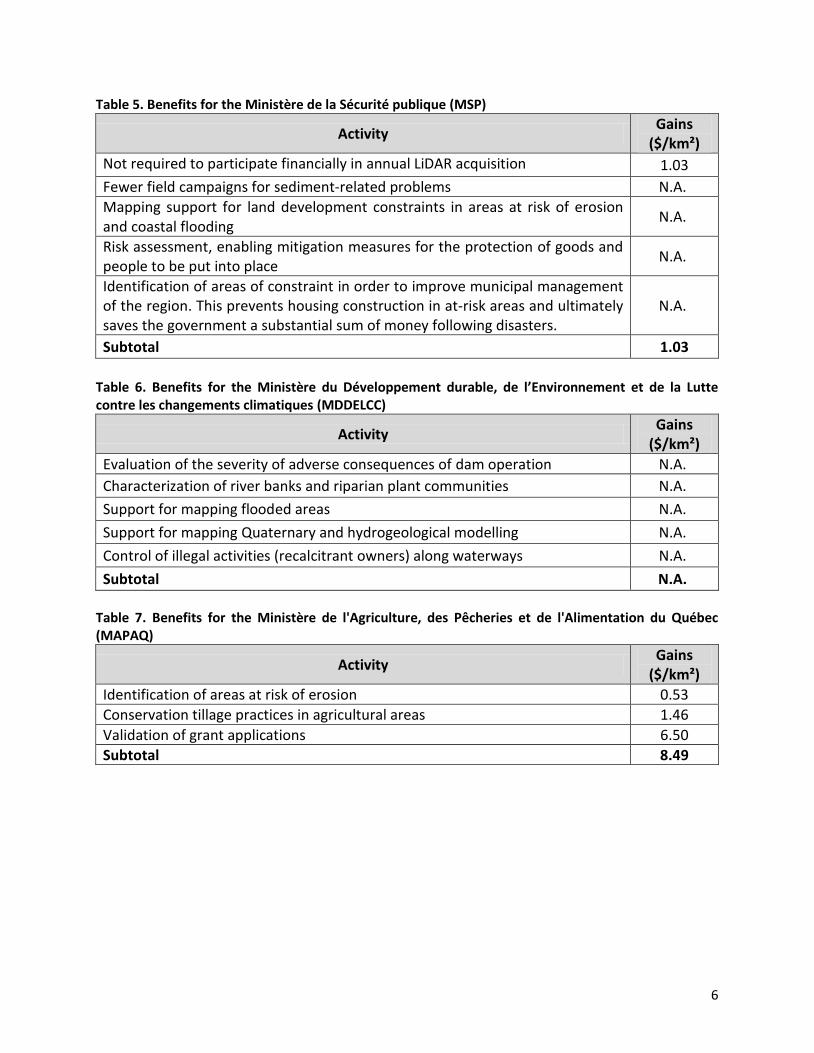
Table 5. Benefits for the Ministère de la Sécurité publique (MSP)
Activity Gains
($/km²)
Not required to participate financially in annual LiDAR acquisition 1.03
Fewer field campaigns for sediment-related problems N.A.
Mapping support for land development constraints in areas at risk of erosion and coastal flooding
N.A.
Risk assessment, enabling mitigation measures for the protection of goods and people to be put into place
N.A.
Identification of areas of constraint in order to improve municipal management of the region. This prevents housing construction in at-risk areas and ultimately saves the government a substantial sum of money following disasters.
N.A.
Subtotal 1.03
Table 6. Benefits for the Ministère du Développement durable, de l’Environnement et de la Lutte contre les changements climatiques (MDDELCC)
Activity Gains
($/km²)
Evaluation of the severity of adverse consequences of dam operation N.A.
Characterization of river banks and riparian plant communities N.A.
Support for mapping flooded areas N.A.
Support for mapping Quaternary and hydrogeological modelling N.A.
Control of illegal activities (recalcitrant owners) along waterways N.A.
Subtotal N.A.
Table 7. Benefits for the Ministère de l'Agriculture, des Pêcheries et de l'Alimentation du Québec (MAPAQ)
Activity Gains
($/km²)
Identification of areas at risk of erosion 0.53
Conservation tillage practices in agricultural areas 1.46
Validation of grant applications 6.50
Subtotal 8.49
7
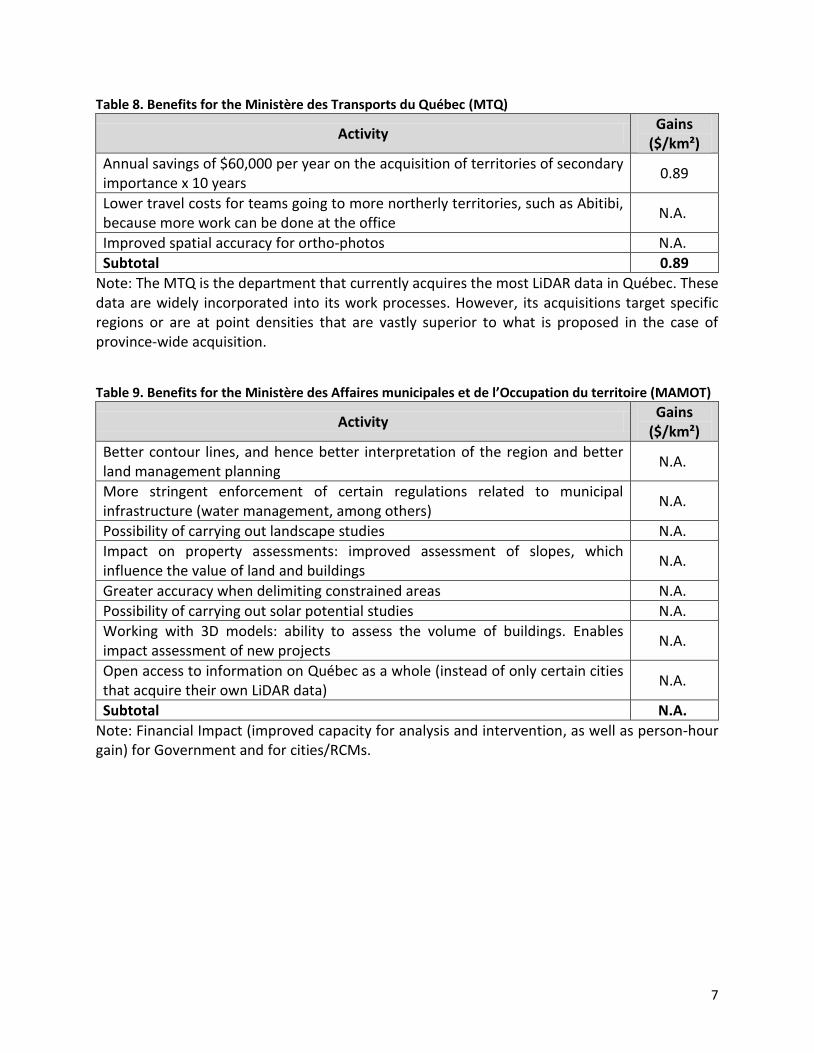
Table 8. Benefits for the Ministère des Transports du Québec (MTQ)
Activity Gains
($/km²)
Annual savings of $60,000 per year on the acquisition of territories of secondary importance x 10 years
0.89
Lower travel costs for teams going to more northerly territories, such as Abitibi, because more work can be done at the office
N.A.
Improved spatial accuracy for ortho-photos N.A.
Subtotal 0.89
Note: The MTQ is the department that currently acquires the most LiDAR data in Québec. These data are widely incorporated into its work processes. However, its acquisitions target specific regions or are at point densities that are vastly superior to what is proposed in the case of province-wide acquisition.
Table 9. Benefits for the Ministère des Affaires municipales et de l’Occupation du territoire (MAMOT)
Activity Gains
($/km²)
Better contour lines, and hence better interpretation of the region and better land management planning
N.A.
More stringent enforcement of certain regulations related to municipal infrastructure (water management, among others)
N.A.
Possibility of carrying out landscape studies N.A.
Impact on property assessments: improved assessment of slopes, which influence the value of land and buildings
N.A.
Greater accuracy when delimiting constrained areas N.A.
Possibility of carrying out solar potential studies N.A.
Working with 3D models: ability to assess the volume of buildings. Enables impact assessment of new projects
N.A.
Open access to information on Québec as a whole (instead of only certain cities that acquire their own LiDAR data)
N.A.
Subtotal N.A.
Note: Financial Impact (improved capacity for analysis and intervention, as well as person-hour gain) for Government and for cities/RCMs.
8
Table 10. Summary of benefits for the Québec Government
Ministry Benefits Percentage
MFFP $78.9/km² 83%
MERN $5.8/km² 6%
MSP $1/km² 1%
MDDELCC N.A.
MAPAQ $8.5/km² 9%
MTQ $0.9/km² 1%
MAMOT N.A.
Total $95.1/km²
2.5.2 For organizations involved in the project
Table 11. Benefits for the Forest Industry
Activity Gains ($/m³)
Fewer modifications to the plan and fewer exemptions 0.04
Clearer identification of wood destinations 0.15
Improved budget estimates 0.02
Time savings when ascertaining fragmented forests or constrained areas 0.20
Less frquent forest wood inventories N.A.
Road construction – quantities and location 0.50
Road construction – quarry location 0.06
Equipment productivity, derived from volume/ha 0.05
Equipment productivity, derived from stem/ha 0.05
Reduced skidding distance 0.39
Selection of best possible equipment for forest stand type N.A.
Fewer machinery movements N.A.
Time savings for forest cuts N.A.
Time savings for loading/unloading wood N.A.
Gains on supervision and forest cut block ribboning (flagging) by the industry 0.07
Time savings for sawing (delivery of suitable wood, optimized sawmill production, increased value of wood products)
0.60
Smaller factory inventories N.A.
Optimization of forestry operations in order to provide the freshest wood possible
N.A.
Improved decision-making regarding the wood chip blend used in pulp production
N.A.
Subtotal 2.13
9
3. Interpretation of the Benefit Analysis Results
3.1 Benefits for the Québec Government
Based on Tables 2 to 9, the cost of acquiring, storing and managing LiDAR data is $68/km², for data acquired at 2 points/m² in a predominately softwood region.
Table 10 shows that the quantifiable benefits amounted to $95.1/km² for the Québec Government as a whole. The return on investment of $27.1/km² is spread over a period of 10 years and is based on the assumption of a constant dollar. In addition to these quantifiable benefits, there are a multitude of non-quantifiable benefits, which may have a very positive impact for organizations or individuals. The Government’s MFFP is the main beneficiary (83%) of data acquisition, with benefits valued at $78.9/km², derived primarily from the fact that fewer inventory plots need to be established in the field if LiDAR data are available.
In the case of large regions, much of the benefit to the Government takes the form of forest-related gains. The analysis showed that government departments and organizations other than the MFFP and the MERN have very targeted areas of interest: road networks, river banks, high voltage lines or reservoirs, for example. Benefits for them therefore become modest when generalized over a large territory.
3.2 Benefits for the forest industry
Table 11 summarizes the benefits of LiDAR acquisition for the forest industry. The benefits were calculated on the basis of coniferous forest harvesting. The results reveal gains totalling $2.13/m³, principally from potential savings relating to forest roads: fewer tracks are required, and construction is less costly for those that must be built. In addition, many of the benefits derive from the fact that LiDAR data use opens up the possibility of harvesting trees in denser forest stands. This would minimize the use of the harvest road network. Also, the precision afforded by LiDAR data would allow for new road locations to be optimized. For example, situating a road near a quarry would minimize transportation of the material required for road construction work.
It should be noted that the total benefits assessed in this review are higher than those evaluated by FPInnovations in Ontario (Lacroix and Charrette, 2013). The environment within which the forest industry operates in the region north of Lac-Saint-Jean would allow for the addition of new benefits stemming from savings relating to two other aspects of fibre harvesting: the type of machinery used and the quality of the fibre itself (better decision-making regarding the wood chip blend used in pulp production). The calculation results have nevertheless been carefully analyzed, and the value of the benefits could in fact be higher than those presented here. Moreover, a comparative analysis of specific balsam fir areas, performed alongside this mandate, returned estimated gains of $2.68/m³. Road construction gains in these areas of forest are higher ($0.96/m³) than in the spruce forest. In addition, the fact that the forest industry could benefit from gains derived from data acquisition partially funded by the Government does not appear to be a problem for the softwood lumber agreement with the United States, since the data acquired through LiDAR is considered to be a contribution to “knowledge and understanding of the forest”, no element of which is mentioned in the agreement.

10
The analysis also revealed the extent of the potential savings for the forest industry from the use of LiDAR data when harvesting coniferous forests. These savings would help the industry to make a quick profit (in only a few years) in cases where it pays the entire cost of acquisition and data management. However, it would need to modify its work procedures to ensure that these benefits are effective.
4. Conclusion and Recommendations
This analysis, the goal of which was to present the benefits derived from LiDAR data acquisition, shows:
- that LiDAR data acquisition and management would cost $68/km²; and - that the projected quantifiable benefits for the Government would be $95.1/km²,
actualized over a period of 10 years.
The vast majority of these benefits flow back to the forest sector and can be quantified at $78.89/km². In light of these figures, we can assert that province-wide aerial LiDAR data acquisition would be profitable on a horizon of less than ten years. In addition, as the analysis shows, LiDAR data acquisition serves as an economic lever, enabling the forest industry to increase its productivity and competitive edge.
However, the benefits do not apply only to those regions with mainly coniferous forests. In the southern part of the province, where deciduous forests are more numerous, we believe the gains should be higher in the municipal, transportation and agriculture spheres than for the forest industry. This assertion will be verified, since we will be analyzing the benefits generated by a LiDAR data acquisition project in a more southerly part of the province, the Mauricie and Outaouais regions, in 2014 and 2015.
Our analysis has identified a multitude of quantifiable and non-quantifiable benefits. Given that LiDAR technology is relatively new and that many new applications are developed on a regular basis, it is difficult to foresee all its potential benefits. Many more could be derived from other uses of LiDAR data. Examples include monitoring water flow in the environment sector, detecting forms of mother rock in the geology sector, or qualifying habitats in the biology sector.
In light of this conclusion, we recommend that:
(i) The Government establish an airborne LiDAR data acquisition project for large and compact areas. We propose data acquisition for all public land under management, and for private holdings, as shown in Figure 2 on the following page. This large-scale coverage would reduce the cost per square kilometre, encouraging financial partnerships and benefitting all users.
(ii) We perform data acquisition at 2 points/m² for coniferous regions (spruce and fir) and at 4 points/m² for the mixed and deciduous forests in southern Québec. We suggest that data acquisition be carried out during the growth season from June to September (leafed trees), in order to meet the need for accurate data on both ground and canopy.
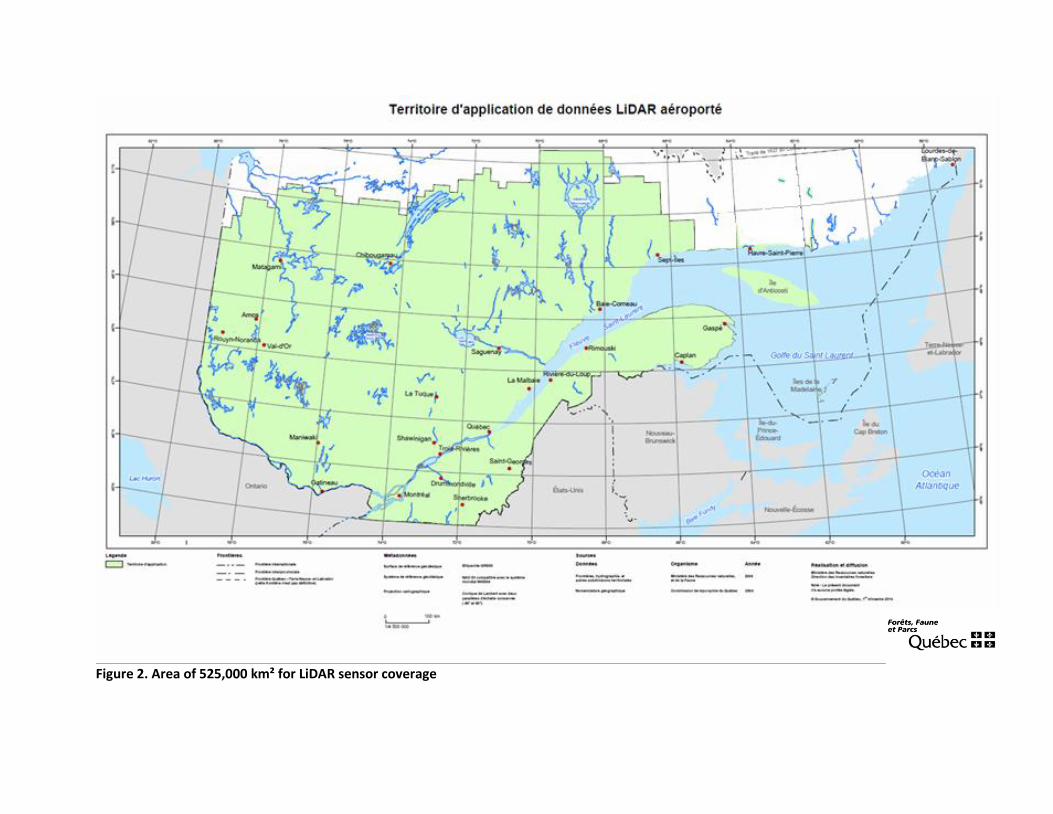
Figure 2. Area of 525,000 km² for LiDAR sensor coverage
5. References
Lacroix, S. and Charrette, F. 2013. Une meilleure planification grâce à l’inventaire forestier amélioré par LiDAR. Rapport Avantage. Vol 14. No. 1. 8 pp. Treitz, P., Lim, K., Woods, M., Pitt, D., Nesbitt, D. and Etheridge D. 2012. LiDAR Sampling Density for Forest Resource Inventories in Ontario, Canada. Remote Sensing. Vol 4. p. 830-848. Viasat GeoTechnologies Inc. 2010. Analyse des opportunités d’affaires liées à l’utilisation de la technologie LiDAR aéroportée au MRN particulièrement en foresterie. 123 pp. White, J., Wulder, M., Varhola, A., Vastaranta, M., Coops, N., Cook, B., Pitt, D. and Woods M. 2013. A best practices guide for generating forest inventory attributes from airborne laser scanning data using an area-based approach. Information Report FI-X-010. 50 pp. Woods, M., Pitt, D., Penner, M., Lim, K., Nesbitt, D., Etheridge, D. and Treitz, P. 2011. Operational implementation of a LiDAR inventory in Boreal Ontario. Forest Chronicle. Vol. 87, p. 512-528.
13
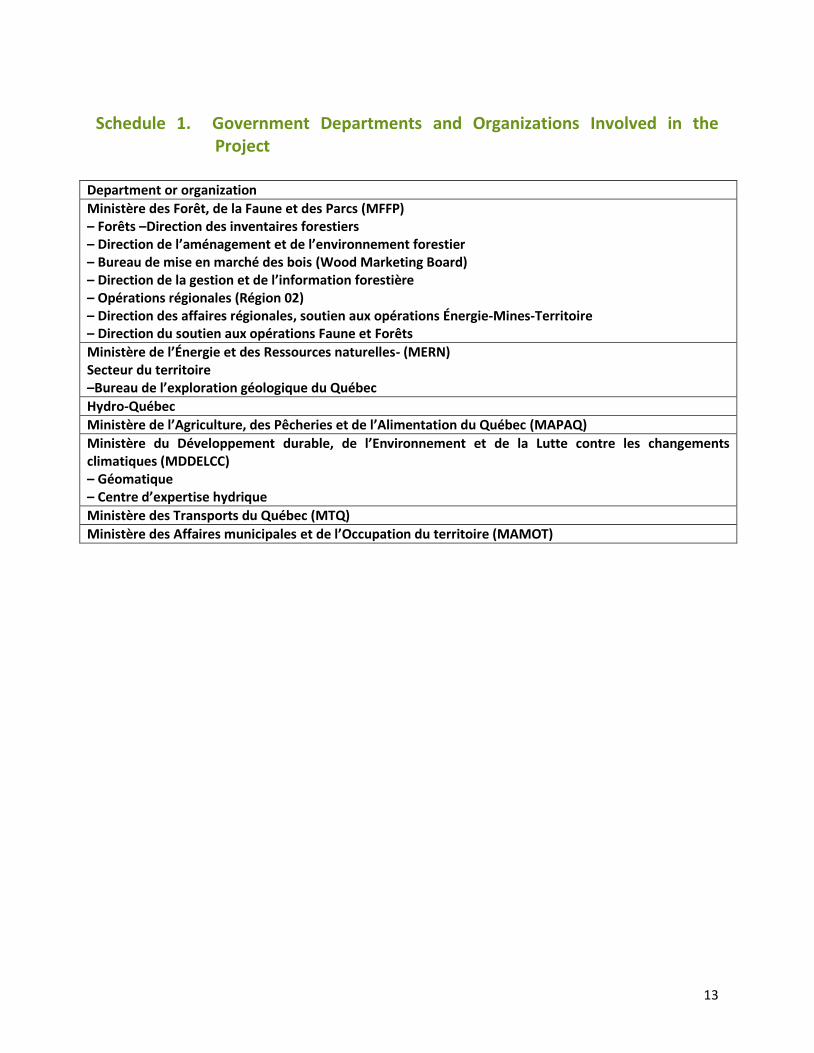
Schedule 1. Government Departments and Organizations Involved in the Project
Department or organization
Ministère des Forêt, de la Faune et des Parcs (MFFP) – Forêts –Direction des inventaires forestiers – Direction de l’aménagement et de l’environnement forestier – Bureau de mise en marché des bois (Wood Marketing Board) – Direction de la gestion et de l’information forestière – Opérations régionales (Région 02) – Direction des affaires régionales, soutien aux opérations Énergie-Mines-Territoire – Direction du soutien aux opérations Faune et Forêts
Ministère de l’Énergie et des Ressources naturelles- (MERN) Secteur du territoire –Bureau de l’exploration géologique du Québec
Hydro-Québec
Ministère de l’Agriculture, des Pêcheries et de l’Alimentation du Québec (MAPAQ)
Ministère du Développement durable, de l’Environnement et de la Lutte contre les changements climatiques (MDDELCC) – Géomatique – Centre d’expertise hydrique
Ministère des Transports du Québec (MTQ)
Ministère des Affaires municipales et de l’Occupation du territoire (MAMOT)