provinces at a glance - statistics south africa at... · statistics south africa census 2011...
TRANSCRIPT

Census 2011 Provinces at a glance
Statistics South Africa
Pali Lehohla Statistician-General
Report No. 03-01-43

Statistics South Africa
Census 2011 Provinces at a glance
Census 2011 Provinces at a glance / Statistics South Africa Published by Statistics South Africa, Private Bag X44, Pretoria 0001 © Statistics South Africa, 2012 Users may apply or process this data, provided Statistics South Africa (Stats SA) is acknowledged as the original source of the data; that it is specified that the application and/or analysis is the result of the user's independent processing of the data; and that neither the basic data nor any reprocessed version or application thereof may be sold or offered for sale in any form whatsoever without prior permission from Stats SA. Stats SA Library Cataloguing-in-Publication (CIP) Data Census 2011 Provinces at a glance / Statistics South Africa. Pretoria: Statistics South Africa, 2012 Report no.: 03-01-43 82 pp ISBN 978-0-621-41390-8 A complete set of Stats SA publications is available at Stats SA Library and the following libraries:
National Library of South Africa, Pretoria Division National Library of South Africa, Cape Town Division Library of Parliament, Cape Town Bloemfontein Public Library Natal Society Library, Pietermaritzburg Johannesburg Public Library Eastern Cape Library Services, King William’s Town Central Regional Library, Polokwane Central Reference Library, Nelspruit Central Reference Collection, Kimberley Central Reference Library, Mmabatho
This report is available on the Stats SA website: www.statssa.gov.za For technical enquiries please contact: For dissemination enquiries contact Printing and Distribution, Statistics South Africa Diego Iturralde Ina du Plessis Tel: 012 310 8922 Email: [email protected] Fax: 086 670 9723 Email: [email protected]

Statistics South Africa
Census 2011 Provinces at a glance
ii
Contents Introduction ......................................................................................................................................................................................................................................................... 1
1. Demographics ............................................................................................................................................................................................................................................. 2
1.1 Population size ...................................................................................................................................................................................................................................... 2 1.2 Age-Sex distribution .............................................................................................................................................................................................................................. 4 1.3 Population group and sex distribution ................................................................................................................................................................................................. 14 1.4 Marital status ....................................................................................................................................................................................................................................... 18
1.4.1 Never Married ......................................................................................................................................................................................................................... 18 1.4.2 Married/living together ............................................................................................................................................................................................................ 19
1.5 Migration .............................................................................................................................................................................................................................................. 20
2. Education ................................................................................................................................................................................................................................................... 21
2.1 No schooling ........................................................................................................................................................................................................................................ 21 2.2 Grade 12 / Std 10 / Matric ................................................................................................................................................................................................................... 22 2.3 Higher education ................................................................................................................................................................................................................................. 23
3. Household goods and services ............................................................................................................................................................................................................... 24
3.1 Households .......................................................................................................................................................................................................................................... 24 3.2 Type of dwelling ................................................................................................................................................................................................................................... 25 3.3 Tenure status ....................................................................................................................................................................................................................................... 27 3.4 Household goods ................................................................................................................................................................................................................................. 29
3.4.1 Cell phone ............................................................................................................................................................................................................................... 29 3.4.2 Computer ................................................................................................................................................................................................................................ 30 3.4.3 Landline .................................................................................................................................................................................................................................. 31 3.4.4 Radio ....................................................................................................................................................................................................................................... 32 3.4.5 Refrigerator ............................................................................................................................................................................................................................. 33 3.4.6 Television ................................................................................................................................................................................................................................ 34 3.4.7 Internet .................................................................................................................................................................................................................................... 35
3.5 Household services ............................................................................................................................................................................................................................. 36 3.5.1 Electricity for cooking, heating and lighting ............................................................................................................................................................................. 36 3.5.2 Refuse removal ....................................................................................................................................................................................................................... 39 3.5.3 Toilet facilities ......................................................................................................................................................................................................................... 40 3.5.4 Piped water ............................................................................................................................................................................................................................. 41
4. Labour force .............................................................................................................................................................................................................................................. 42
5. Household income .................................................................................................................................................................................................................................... 43
APPENDIX .......................................................................................................................................................................................................................................................... 44

Statistics South Africa
Census 2011 Provinces at a glance
iii
List of figures Figure 1.1: Percentage distribution of total population by province: Census 1996, 2001, 2011 and Community Survey 2007 ............................................................................ 3 Figure 1.2: Western Cape: percentage distribution of population by five-year age groups and sex – Census 1996, 2001, 2011 and Community Survey 2007 ........................ 5 Figure 1.3: Eastern Cape: percentage distribution of population by five-year age groups and sex – Census 1996, 2001, 2011 and Community Survey 2007 ......................... 6 Figure 1.4: Northern Cape: percentage distribution of population by five-year age groups and sex – Census 1996, 2001, 2011 and Community Survey 2007 ....................... 7 Figure 1.5: Free State: percentage distribution of population by five-year age groups and sex – Census 1996, 2001, 2011 and Community Survey 2007 .............................. 8 Figure 1.6: KwaZulu-Natal: percentage distribution of population by five-year age groups and sex – Census 1996, 2001, 2011 and Community Survey 2007 ....................... 9 Figure 1.7: North West: percentage distribution of population by five-year age groups and sex – Census 1996, 2001, 2011 and Community Survey 2007 ........................... 10 Figure 1.8: Gauteng: percentage distribution of population by five-year age groups and sex – Census 1996, 2001, 2011 and Community Survey 2007 ............................... 11 Figure 1.9: Mpumalanga: percentage distribution of population by five-year age groups and sex – Census 1996, 2001, 2011 and Community Survey 2007 ........................ 12 Figure 1.10: Limpopo: percentage distribution of population by five-year age groups and sex – Census 1996, 2001, 2011 and Community Survey 2007 ............................. 13 Figure 1.11: Percentage distribution of population group (Black African) and sex by province: Census 1996, 2001, 2011 and Community Survey 2007 ............................... 14 Figure 1.12: Percentage distribution of population group (Coloured) and sex by province: Census 1996, 2001, 2011 and Community Survey 2007 ..................................... 15 Figure 1.13: Percentage distribution of population group (Asian/Indian) and sex by province: Census 1996, 2001, 2011 and Community Survey 2007 ................................ 16 Figure 1.14: Percentage distribution of population group (White) and sex by province: Census 1996, 2001, 2011 and Community Survey 2007 ........................................... 17 Figure 1.15: Percentage distribution of people who are never married together by province: Census 1996, 2001, 2011 and Community Survey 2007 ............................. 18 Figure 1.16: Percentage distribution of people who are married/living together by province: Census 1996, 2001, 2011 and Community Survey 2007 ................................... 19 Figure 1.17: Net migration in thousands (province of enumeration by previous province of residence): Census 2001, 2011 and Community Survey 2007 ............................ 20 Figure 2.1: Level of education (No schooling) for those aged 20 years and older by province: Census 1996, 2001, 2011 and Community Survey 2007 ............................... 21 Figure 2.2: Level of education (Grade12 / Std 10 /Matric) for those aged 20 years and older by province: Census 1996, 2001, 2011 and Community Survey 2007 ............. 22 Figure 2.3: Level of education (Higher education) for those aged 20 years and older by province: Census 1996, 2001, 2011 and Community Survey 2007 ......................... 23 Figure 3.1: Number of households in South Africa. Census 1996, 2001 and 2011 and Community Survey 2007 ............................................................................................. 24 Figure 3.2: Percentage of households living in formal type of dwellings by province: Census 1996, 2001, 2011 and Community Survey 2007 .............................................. 25 Figure 3.3: Percentage of households living in informal type of dwellings by province: Census 1996, 2001, 2011 and Community Survey 2007 ........................................... 26 Figure 3.4: Percentage of households that own and have paid off or own and are still paying off their dwellings by province: Census 2001, 2011 and Community Survey 2007 ........................................................................................................................................................................................................................................................ 27 Figure 3.5: Percentage of households that are renting their dwellings by province: Census 2001, 2011 and Community Survey 2007 ........................................................... 28 Figure 3.6: Percentage of households that have a cell phone in working order by province: Census 2001, 2011 and Community Survey 2007 ............................................. 29 Figure 3.7: Percentage of households that have a computer in working order by province: Census 2001, 2011 and Community Survey 2007 .............................................. 30 Figure 3.8: Percentage of households that have a landline telephone by province: Census 2001, 2011 and Community Survey 2007 ........................................................... 31 Figure 3.9: Percentage of households that have a radio in working order by province: Census 2001, 2011 and Community Survey 2007 ..................................................... 32 Figure 3.10: Percentage of households that have a refrigerator in working order by province: Census 2001, 2011 and Community Survey 2007 .......................................... 33 Figure 3.11: Percentage of households that have a television in working order by province: Census 2001, 2011 and Community Survey 2007 ............................................ 34 Figure 3.12: Percentage of households with access to the internet: Community Survey 2007 and Census 2011 ............................................................................................. 35 Figure 3.13: Percentage of households using electricity for cooking by province: Census 1996, 2001, 2011 and Community Survey 2007 .................................................... 36 Figure 3.14: Percentage of households using electricity for heating by province: Census 1996, 2001, 2011 and Community Survey 2007 .................................................... 37
Statistics South Africa
Census 2011 Provinces at a glance
iv
Figure 3.15: Percentage of households using electricity for lighting by province: Census 1996, 2001, 2011 and Community Survey 2007 ..................................................... 38 Figure 3.16: Percentage of households where refuse is removed by local authority/private company weekly by province: Census 1996, 2001, 2011 and Community Survey 2007 ........................................................................................................................................................................................................................................................ 39 Figure 3.17: Percentage of households with a flush toilet by province: Census 1996, 2001, 2011 and Community Survey 2007 .................................................................... 40 Figure 3.18: Percentage of households with access to piped water inside the dwelling/yard by province: Census 1996, 2001, 2011 and Community Survey 2007 .............. 41 Figure 4.1: Unemployment rates for persons in the labour force aged 15–64: Census 1996, 2001, 2011 and Community Survey 2007 ......................................................... 42 Figure 5.1: Average household income (AHI) by province: Census 2001 and 2011 ......................................................................................................................................... 43
Statistics South Africa
Census 2011 Provinces at a glance
v
List of tables Table 1.1: Total population by province and sex: Census 1996, 2001, 2011 and Community Survey 2007 ..................................................................................................... 44 Table 1.2: Total population by age group and sex: Census 1996, 2001, 2011 and Community Survey 2007 (Western Cape) ........................................................................ 45 Table 1.3: Total population by age group and sex: Census 1996, 2001, 2011 and Community Survey 2007 (Eastern Cape) ......................................................................... 46 Table 1.4: Total population by age group and sex: Census 1996, 2001, 2011 and Community Survey 2007 (Northern Cape) ....................................................................... 47 Table 1.5: Total population by age group and sex: Census 1996, 2001, 2011 and Community Survey 2007 (Free State) .............................................................................. 48 Table 1.6: Total population by age group and sex: Census 1996, 2001, 2011 and Community Survey 2007 (KwaZulu-Natal) ....................................................................... 49 Table 1.7: Total population by age group and sex: Census 1996, 2001, 2011 and Community Survey 2007 (North West) ............................................................................. 50 Table 1.8: Total population by age group and sex: Census 1996, 2001, 2011 and Community Survey 2007 (Gauteng) ................................................................................. 51 Table 1.9: Total population by age group and sex: Census 1996, 2001, 2011 and Community Survey 2007 (Mpumalanga) .......................................................................... 52 Table 1.10: Total population by age group and sex: Census 1996, 2001, 2011 and Community Survey 2007 (Limpopo) ............................................................................... 53 Table 1.11: Total population by province, population group (Black African) and sex: Census 1996, 2001, 2011 and Community Survey 2007 ............................................. 54 Table 1.12: Total population by province, population group (Coloured) and sex: Census 1996, 2001, 2011 and Community Survey 2007 .................................................... 54 Table 1.13: Total population by province, population group (Asian/Indian) and sex: Census 1996, 2001, 2011 and Community Survey 2007 ............................................... 55 Table 1.14: Total population by province, population group (White) and sex: Census 1996, 2001, 2011 and Community Survey 2007 ......................................................... 55 Table 1.15: Total population by province, marital status (Married) and sex: Census 1996, 2001, 2011 and Community Survey 2007 ............................................................ 56 Table 1.16: Total population by province, marital status (Widowed) and sex: Census 1996, 2001, 2011 and Community Survey 2007 ......................................................... 56 Table 1.17: Total population by province, marital status (Divorced/separated) and sex: Census 1996, 2001, 2011 and Community Survey 2007 ......................................... 57 Table 1.18: Total population by province, marital status (Never Married) and sex: Census 1996, 2001, 2011 and Community Survey 2007 ................................................ 57 Table 1.19: Total population by province, marital status (Living together) and sex: Census 1996, 2001, 2011 and Community Survey 2007 ................................................ 58 Table 1.20: Net migration (province of enumeration by previous province of residence): Census 2001 ........................................................................................................... 59 Table 1.21: Net migration (province of enumeration by previous province of residence): Community Survey 2007 ......................................................................................... 59 Table 1.22: Net migration (province of enumeration by previous province of residence): Census 2011 ........................................................................................................... 60 Table 2.1: Level of education for those aged 20 years and older by sex: Census 1996, 2001, 2011 and Community Survey 2007 ................................................................ 61 Table 2.2: Level of education for those aged 20 years and older by sex: Census 1996, 2001, 2011 and Community Survey 2007 (Western Cape) ..................................... 61 Table 2.3: Level of education for those aged 20 years and older by sex: Census 1996, 2001, 2011 and Community Survey 2007 (Eastern Cape) ...................................... 62 Table 2.4: Level of education for those aged 20 years and older by sex: Census 1996, 2001, 2011 and Community Survey 2007 (Northern Cape) ..................................... 62 Table 2.5: Level of education for those aged 20 years and older by sex: Census 1996, 2001, 2011 and Community Survey 2007 (Free State) ............................................ 63 Table 2.6: Level of education for those aged 20 years and older by sex: Census 1996, 2001, 2011 and Community Survey 2007 (KwaZulu-Natal) ..................................... 63 Table 2.7: Level of education for those aged 20 years and older by sex: Census 1996, 2001, 2011 and Community Survey 2007 (North West) .......................................... 64 Table 2.8: Level of education for those aged 20 years and older by sex: Census 1996, 2001, 2011 and Community Survey 2007 (Gauteng) ............................................... 64 Table 2.9: Level of education for those aged 20 years and older by sex: Census 1996, 2001, 2011 and Community Survey 2007 (Mpumalanga) ........................................ 65 Table 2.10: Level of education for those aged 20 years and older by sex: Census 1996, 2001, 2011 and Community Survey 2007 (Limpopo) ............................................. 65 Table 3.1: Total Number of households in South Africa: Census 1996, 2001, 2011 and Community Survey 2007 .......................................................................................... 66 Table 3.2: Percentage of households living in formal, informal, traditional and other type of dwellings by province: Census 1996, 2001, 2011 and Community Survey 2007 ................................................................................................................................................................................................................................................................... 66 Table 3.3: Tenure status by province: Census 1996, 2001, 2011 and Community Survey 2007 ...................................................................................................................... 67 Table 3.4: Percentage of households owning specific household goods by province: Census 1996, 2001, 2011 and Community Survey 2007 ............................................ 67 Table 3.5: Number of households using electricity for heating, cooking and lighting: Census 1996, 2001, 2011 and Community Survey 2007 .............................................. 68 Table 3.6: Number of households with refuse removal by local authority: Census 1996, 2001, 2011 and Community Survey 2007 ............................................................... 69 Table 3.7: Number of households with access to flush or chemical toilet: Census 1996, 2001, 2011 and Community Survey 2007 ............................................................... 69
Statistics South Africa
Census 2011 Provinces at a glance
vi
Table 3.8: Number of households with access to piped water inside dwelling/yard: Census 1996, 2001, 2011 and Community Survey 2007 ................................................ 70 Table 4.1: South Africa’s labour market and unemployment rates: Census 1996, 2001, 2011 and Community Survey 2007 .......................................................................... 70 Table 4.2: Labour market and unemployment rates by province (Western Cape): Census 1996, 2001, 2011 and Community Survey 2007 .................................................. 71 Table 4.3: Labour market and unemployment rates by province (Eastern Cape): Census 1996, 2001, 2011 and Community Survey 2007 ................................................... 71 Table 4.4: Labour market and unemployment rates by province (Northern Cape): Census 1996, 2001, 2011 and Community Survey 2007 ................................................. 72 Table 4.5: Labour market and unemployment rates by province (Free State): Census 1996, 2001, 2011 and Community Survey 2007 ........................................................ 72 Table 4.6: Labour market and unemployment rates by province (KwaZulu-Natal): Census 1996, 2001, 2011 and Community Survey 2007 ................................................. 73 Table 4.7: Labour market and unemployment rates by province (North West): Census 1996, 2001, 2011 and Community Survey 2007 ....................................................... 73 Table 4.8: Labour market and unemployment rates by province (Gauteng): Census 1996, 2001, 2011 and Community Survey 2007 ........................................................... 74 Table 4.9: Labour market and unemployment rates by province (Mpumalanga): Census 1996, 2001, 2011 and Community Survey 2007 .................................................... 74 Table 4.10: Labour market and unemployment rates by province (Limpopo): Census 1996, 2001, 2011 and Community Survey 2007 ......................................................... 75 Table 5.1: Average household income (AHI) for households in South African Rands: Census 2001 and 2011 ............................................................................................... 75

Statistics South Africa
Census 2011 Provinces at a glance
1
Introduction
South Africa has had three censuses since the first general elections in 1994. The first census was conducted in 1996, the second one followed five years later (2001). However, a community survey, instead of a census, was conducted in 2007; whilst the recent census was conducted just over a year ago (2011). In this publication, data from the three censuses and the 2007 Community Survey are compared.
The following points are brought to the attention of the reader of this publication:
• Comparisons of the results of labour market indicators in the post-apartheid population censuses over time have been a cause for concern. Improvements to key questions over the years mean that the labour market outcomes based on the post-apartheid censuses and the 2007 Community Survey (CS) have to be analysed with caution. Such analysis, will be the subject of research published in a separate publication in 2013.The differences in the results over the years may be partly attributable to questionnaire changes rather than to actual developments in the labour market. The numbers published in this volume for the 1996, 2001, and 2011 censuses as well as the CS published in 2007, are therefore not comparable over time and differ from those published by Statistics South Africa in the surveys designed specifically for capturing labour market activity.
• For purposes of comparison over the period 1996–2011, certain categories of answers to questions in the censuses of 1996, 2001 and 2011, as well as the 2007 Community Survey have either been merged or separated.
• The tenure status questions for 1996 have been dropped since the question asked was totally unrelated to that asked thereafter. Comparisons for 2001, 2007 and 2011 do however remain.
• All household variables are controlled for housing units only and hence exclude all collective living arrangements as well as transient populations.
• Caution should be exercised when comparing either of the censuses to the 2007 Community Survey due to the inherent differences and sensitivities between a census and a survey.
Statistics South Africa
Census 2011 Provinces at a glance
2
1. Demographics
1.1 Population size
Table 1.1 (see Appendix) shows the population size for the three censuses and the 2007 Community Survey.
The census results show that the population of South Africa increased from 40,5 million in 1996, to 44,8 million in 2001 and to 48,5 million (2007 CS estimates). In 2011, the population has increased to an all time 51,7 million.
In 1996 and 2001, KwaZulu-Natal had the largest population size of 8,6 and 9,6 million respectively, followed by Gauteng at 7,6 and 9,2 million for the two censuses. Since 2007, Gauteng’s population has surpassed that of KZN by 0,8 per cent. Currently, Gauteng is the largest province by population size with 12,2 million people, followed by KZN at 10,3 million. The growth in Gauteng can be attributed to labour migration; people tend to leave their provinces of usual residences in search for work in the more industrialised provinces like Gauteng and the Western Cape. The least populated province is Northern Cape and has remained in the same position since 1996; 1,1 million people were counted in 2011, followed by Free State at 2,7 million people.

Statistics South Africa
Census 2011 Provinces at a glance
3
Figure 1.1: Percentage distribution of total population by province: Census 1996, 2001, 2011 and Community Survey 2007
Figure 1.1 shows gradual declines in the percentage share of the total population in Eastern Cape, Free State, KwaZulu-Natal, and Limpopo since 1996. However, Western Cape, North West and Gauteng have recorded increases since 1996; Gauteng shows the largest increase – 1,7 per cent, from 22,0% in 2007 to 23,7% in 2011. Northern Cape has remained constant at 2,2% since 2001, whereas Mpumalanga showed a decrease of 0,2 per cent between 1996 and 2001; however, it remained constant between 2001 and 2007 at 7,5%, an increase of 0,3 per cent is seen in 2011.

Statistics South Africa
Census 2011 Provinces at a glance
4
1.2 Age-Sex distribution
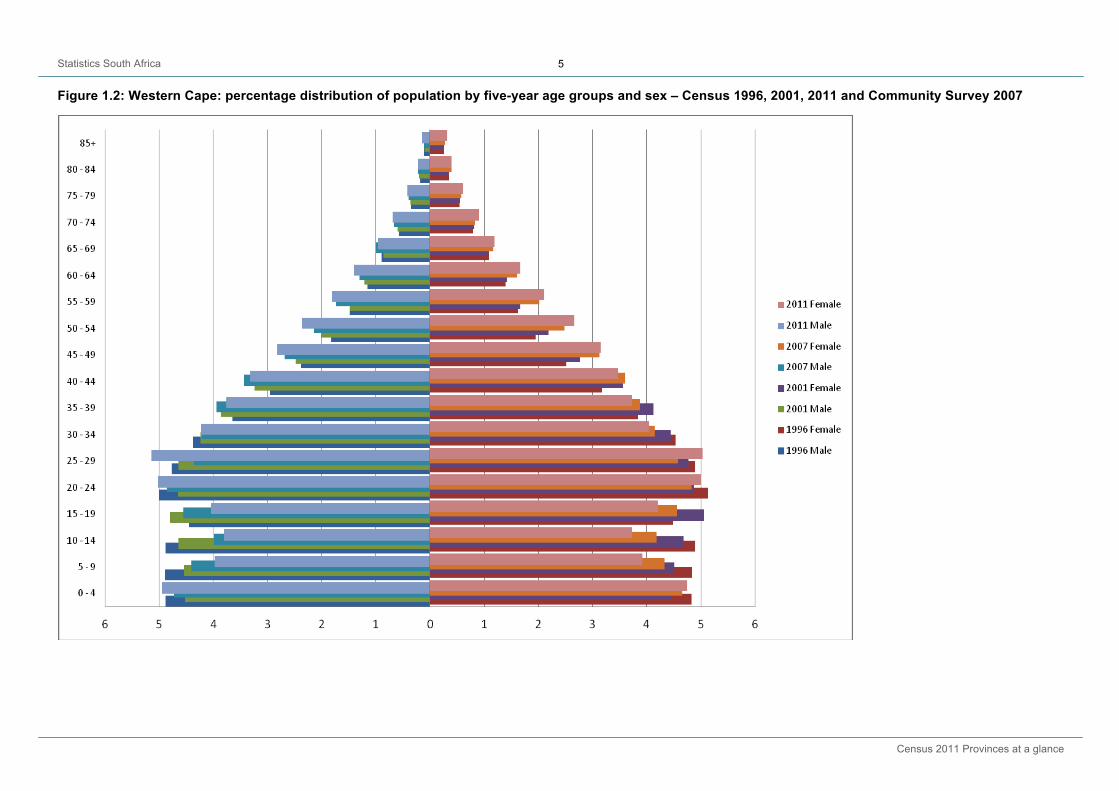
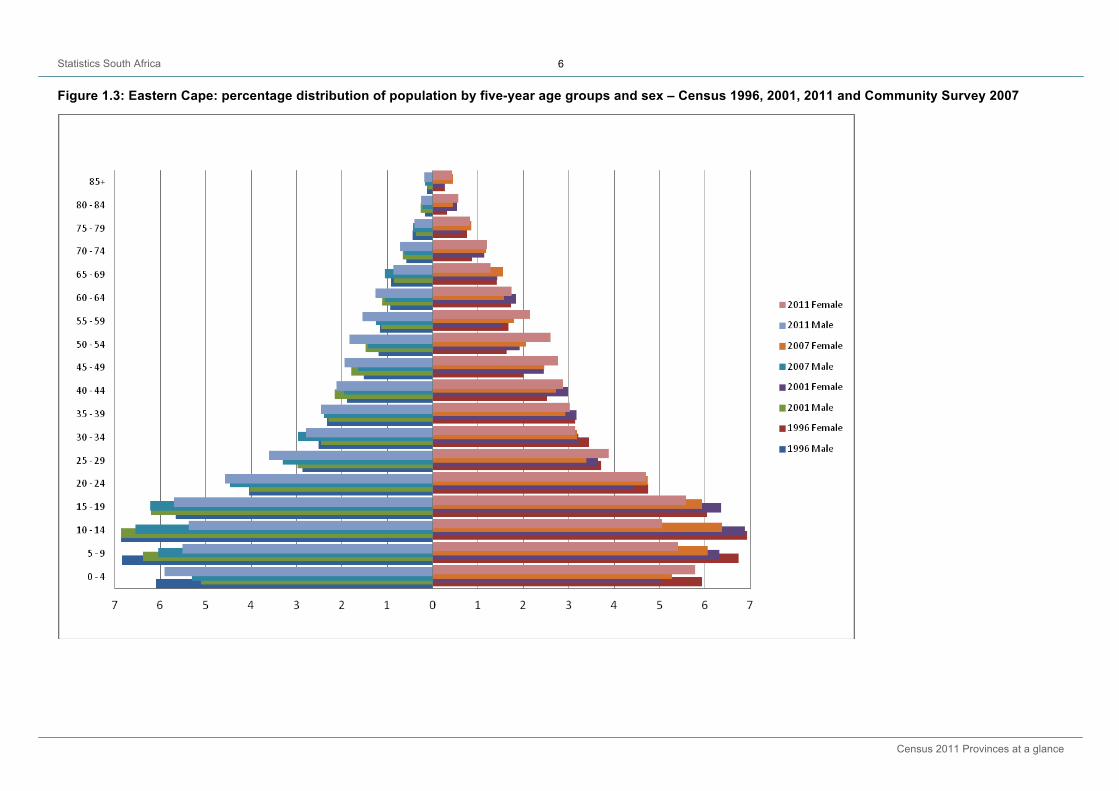
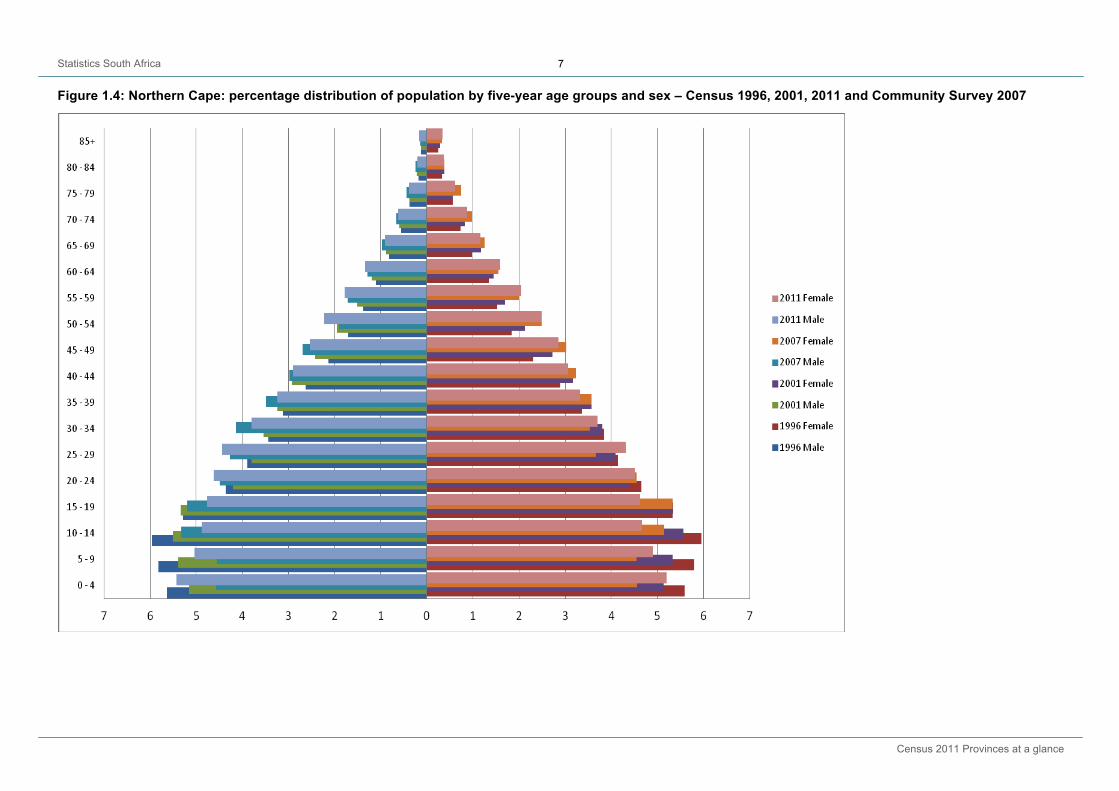
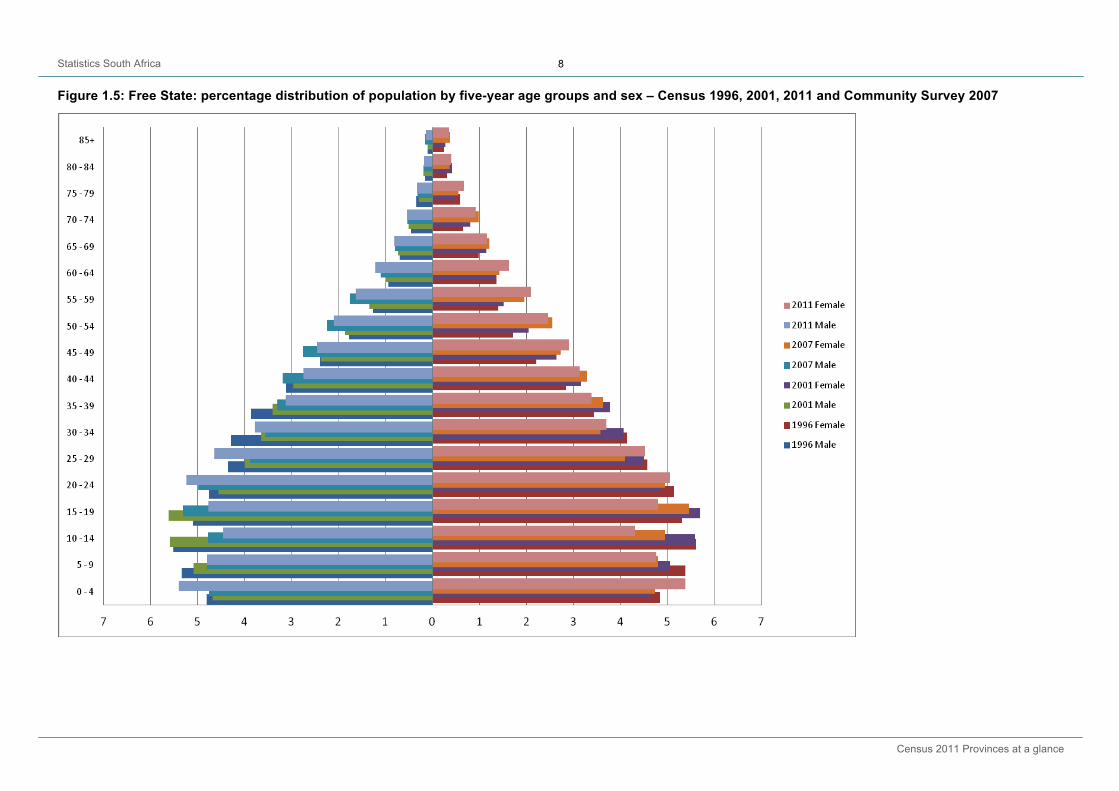
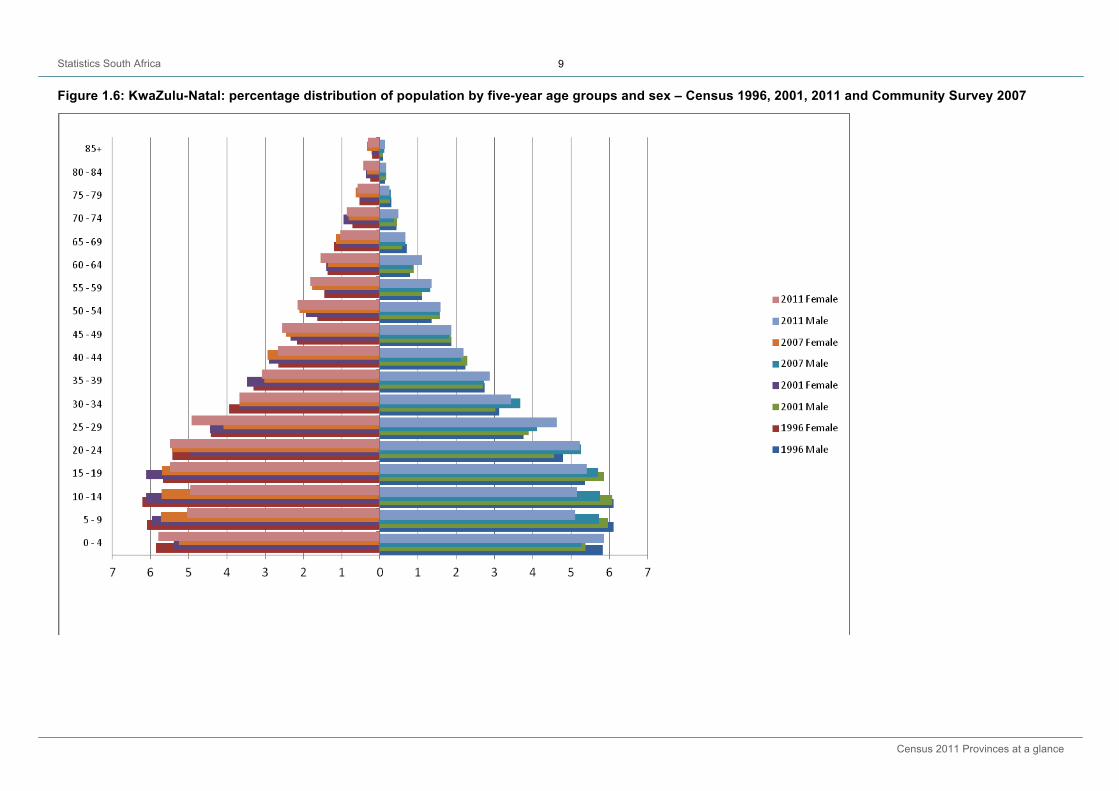
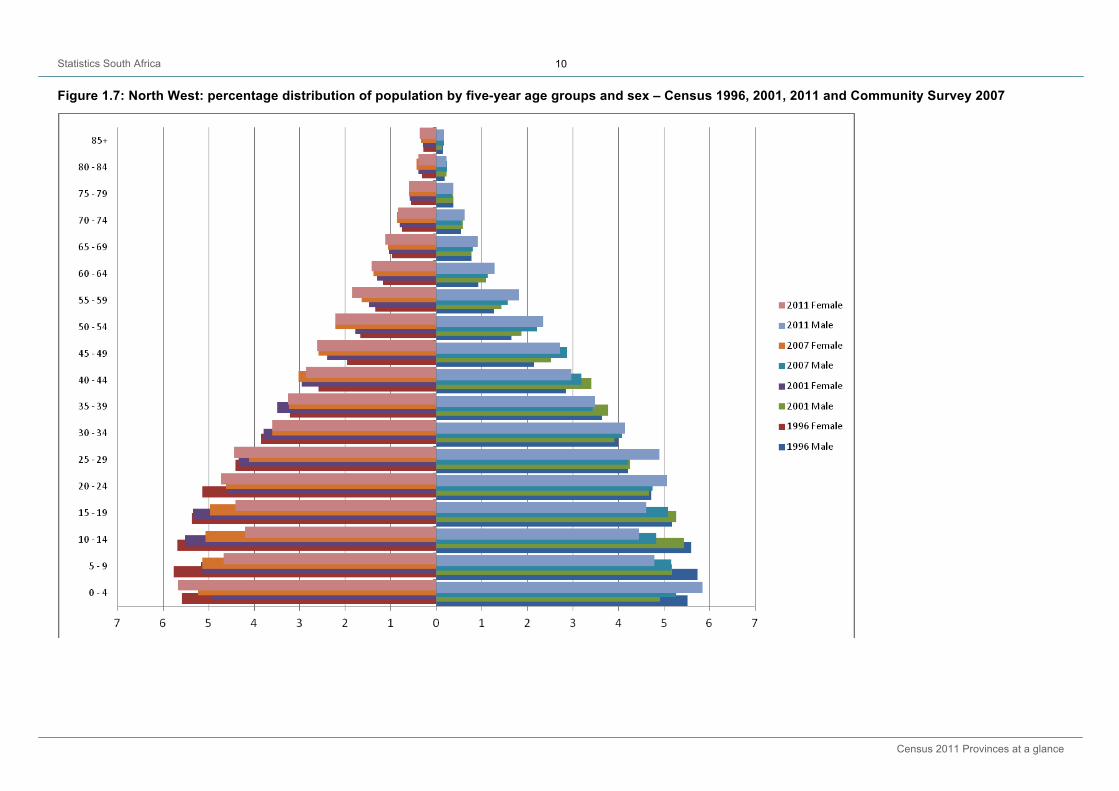
Figures 1.2–1.10 show the population pyramids for the three censuses and the 2007 Community Survey at provincial levels. Each census is represented by a different colour bar.
The pyramids show a minor increase in the age group 0–4 as compared to the two previous counts in all the provinces. A minor decrease, however, is observed when compared to all the previous counts for the age groups 5–9 to 15–19 for both males and females in almost all the provinces. An increase in the older ages is shown for all provinces, with an exception of males in the Free State, where the proportion seem to be slightly declining.
The shapes of the pyramids depict trends in fertility, mortality and migration. The composition of the population, therefore changes in fertility, mortality and migration. The pyramids of Eastern Cape, Northern Cape, KZN, North West, Mpumalanga and Limpopo, show a pattern of a young population and possibly a high mortality or migration among people aged 20 years and older. However, pyramids of Gauteng and Western Cape on the other hand, show higher proportions of people in the ages 20–34. This may be as a result of declining fertility and high in-migration.
Statistics South Africa
Census 2011 Provinces at a glance
5
Figure 1.2: Western Cape: percentage distribution of population by five-year age groups and sex – Census 1996, 2001, 2011 and Community Survey 2007
Statistics South Africa
Census 2011 Provinces at a glance
6
Figure 1.3: Eastern Cape: percentage distribution of population by five-year age groups and sex – Census 1996, 2001, 2011 and Community Survey 2007
Statistics South Africa
Census 2011 Provinces at a glance
7
Figure 1.4: Northern Cape: percentage distribution of population by five-year age groups and sex – Census 1996, 2001, 2011 and Community Survey 2007
Statistics South Africa
Census 2011 Provinces at a glance
8
Figure 1.5: Free State: percentage distribution of population by five-year age groups and sex – Census 1996, 2001, 2011 and Community Survey 2007
Statistics South Africa
Census 2011 Provinces at a glance
9
Figure 1.6: KwaZulu-Natal: percentage distribution of population by five-year age groups and sex – Census 1996, 2001, 2011 and Community Survey 2007
Statistics South Africa
Census 2011 Provinces at a glance
10
Figure 1.7: North West: percentage distribution of population by five-year age groups and sex – Census 1996, 2001, 2011 and Community Survey 2007

Statistics South Africa
Census 2011 Provinces at a glance
11
Figure 1.8: Gauteng: percentage distribution of population by five-year age groups and sex – Census 1996, 2001, 2011 and Community Survey 2007

Statistics South Africa
Census 2011 Provinces at a glance
12
Figure 1.9: Mpumalanga: percentage distribution of population by five-year age groups and sex – Census 1996, 2001, 2011 and Community Survey 2007

Statistics South Africa
Census 2011 Provinces at a glance
13
Figure 1.10: Limpopo: percentage distribution of population by five-year age groups and sex – Census 1996, 2001, 2011 and Community Survey 2007

Statistics South Africa
Census 2011 Provinces at a glance
14
1.3 Population group and sex distribution
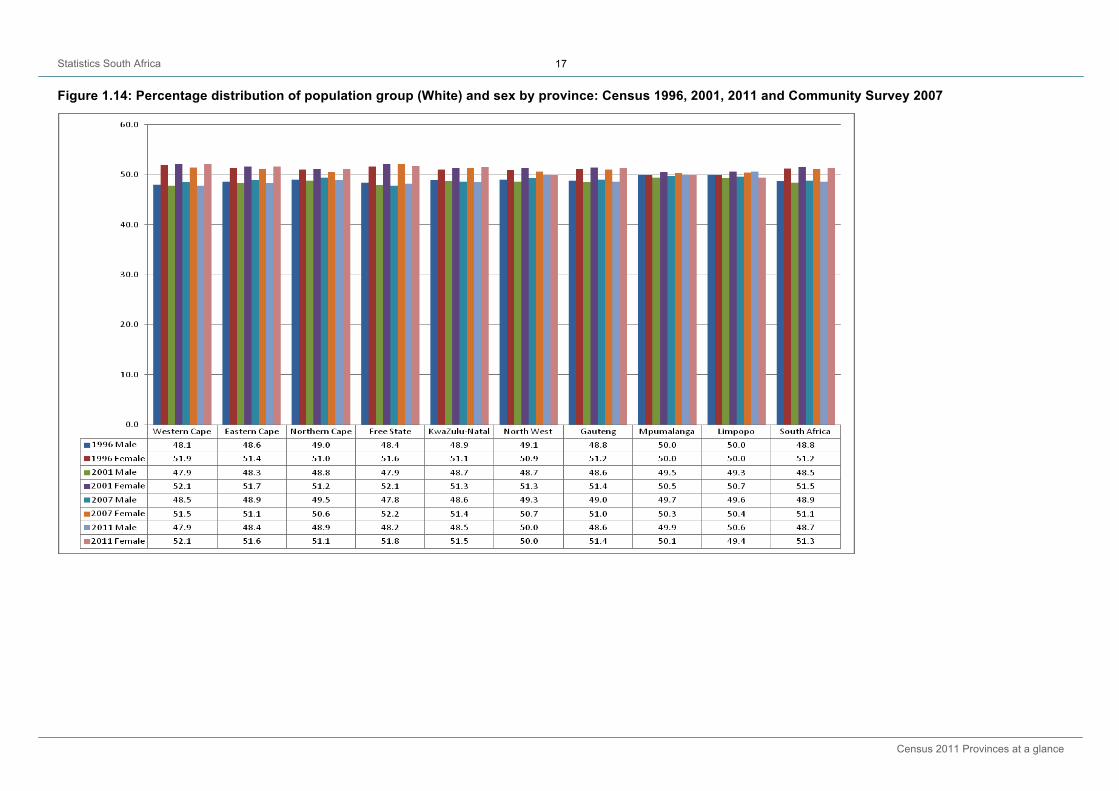
Figures 1.11–1.14 show the distribution of the four population groups by sex and province from 1996 to 2011. In all the provinces, there has been a constant average of 48% for males and 52% for females. This is true for all the population groups, except for the Indians/Asian (Figure 3.3) where some extremes were recorded. In Northern Cape, Free State, North West, Mpumalanga and Limpopo, there was an unusually higher proportion of males compared to females, especially since 2007; with the largest difference recorded in Free State at 65,8% of males compared to 34,2% of females.
Figure 1.11: Percentage distribution of population group (Black African) and sex by province: Census 1996, 2001, 2011 and Community Survey 2007

Statistics South Africa
Census 2011 Provinces at a glance
15
Figure 1.12: Percentage distribution of population group (Coloured) and sex by province: Census 1996, 2001, 2011 and Community Survey 2007

Statistics South Africa
Census 2011 Provinces at a glance
16
Figure 1.13: Percentage distribution of population group (Asian/Indian) and sex by province: Census 1996, 2001, 2011 and Community Survey 2007
Statistics South Africa
Census 2011 Provinces at a glance
17
Figure 1.14: Percentage distribution of population group (White) and sex by province: Census 1996, 2001, 2011 and Community Survey 2007
Statistics South Africa
Census 2011 Provinces at a glance
18
1.4 Marital status
1.4.1 Never Married
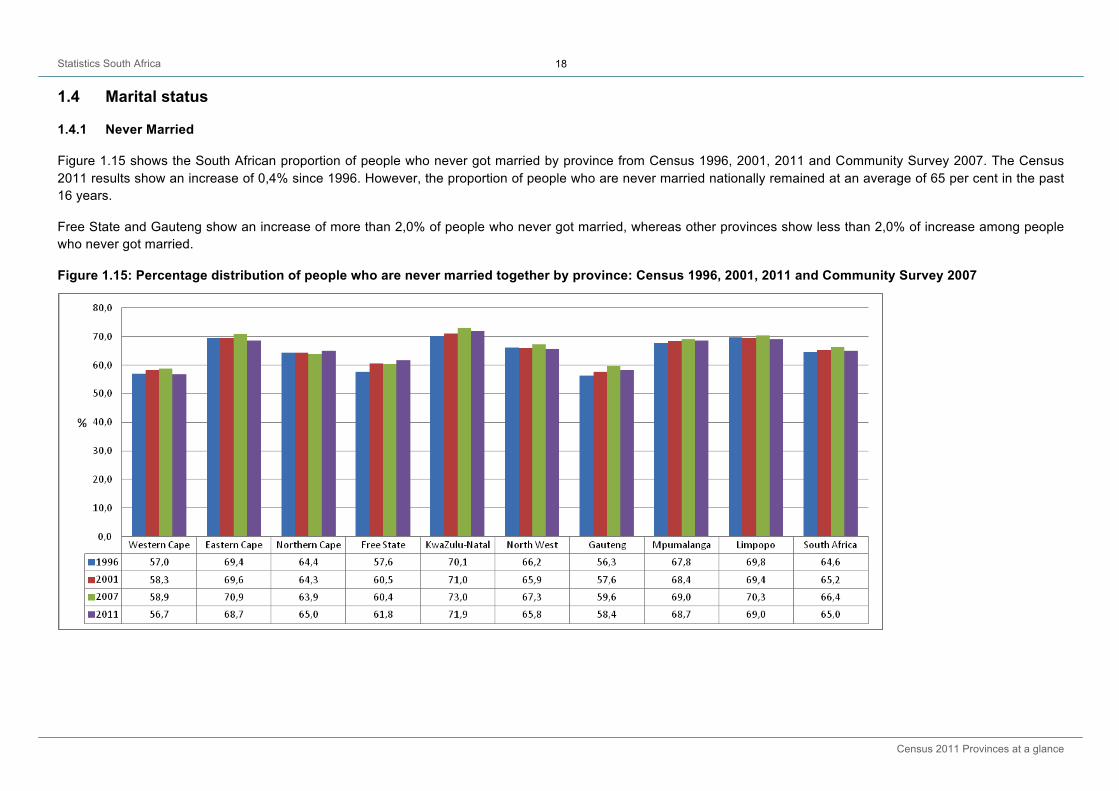
Figure 1.15 shows the South African proportion of people who never got married by province from Census 1996, 2001, 2011 and Community Survey 2007. The Census 2011 results show an increase of 0,4% since 1996. However, the proportion of people who are never married nationally remained at an average of 65 per cent in the past 16 years.
Free State and Gauteng show an increase of more than 2,0% of people who never got married, whereas other provinces show less than 2,0% of increase among people who never got married.
Figure 1.15: Percentage distribution of people who are never married together by province: Census 1996, 2001, 2011 and Community Survey 2007

Statistics South Africa
Census 2011 Provinces at a glance
19
Figure 1.16: Percentage distribution of people who are married/living together by province: Census 1996, 2001, 2011 and Community Survey 2007
1.4.2 Married/living together
Figure 1.16 shows the South African proportion of people who are either married or living together as married partners by province from Census 1996, 2001, 2011 and Community Survey 2007. The Census 2011 results show an increase of (29,7%) from Census 1996 (28,4%) among people who are either married or living together as married partners.
Western Cape shows a significant increase of 3,3% of people who are either married or living together as married people, whereas Free State shows a decrease of 2,6% compared to other provinces, where a less than 2,0% increase among people who are either married or living together as married people is observed.
Statistics South Africa
Census 2011 Provinces at a glance
20
1.5 Migration
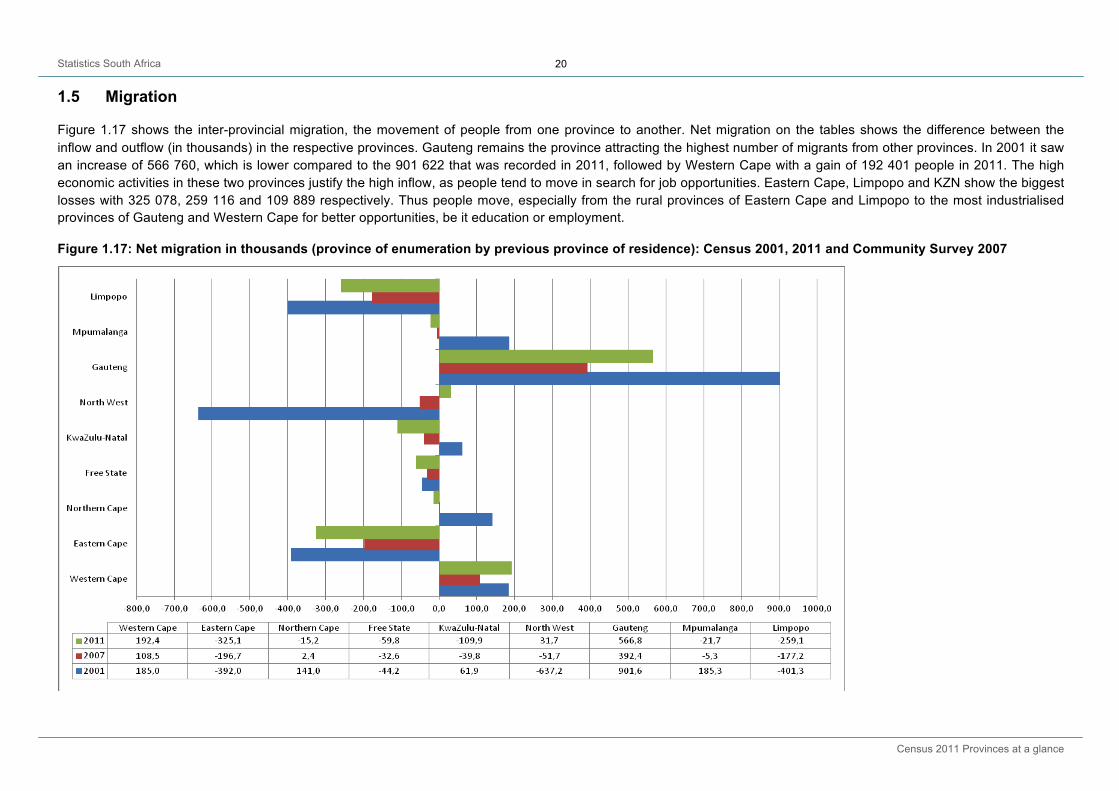
Figure 1.17 shows the inter-provincial migration, the movement of people from one province to another. Net migration on the tables shows the difference between the inflow and outflow (in thousands) in the respective provinces. Gauteng remains the province attracting the highest number of migrants from other provinces. In 2001 it saw an increase of 566 760, which is lower compared to the 901 622 that was recorded in 2011, followed by Western Cape with a gain of 192 401 people in 2011. The high economic activities in these two provinces justify the high inflow, as people tend to move in search for job opportunities. Eastern Cape, Limpopo and KZN show the biggest losses with 325 078, 259 116 and 109 889 respectively. Thus people move, especially from the rural provinces of Eastern Cape and Limpopo to the most industrialised provinces of Gauteng and Western Cape for better opportunities, be it education or employment.
Figure 1.17: Net migration in thousands (province of enumeration by previous province of residence): Census 2001, 2011 and Community Survey 2007
Statistics South Africa
Census 2011 Provinces at a glance
21
2. Education
Educational attainment amongst people aged 20 years and older is critical in addressing skills shortages in the South African economy. Increased educational attainment rates of those aged 20 years and older is an important indicator of employability, labour participation and development, especially in developing countries.
2.1 No schooling
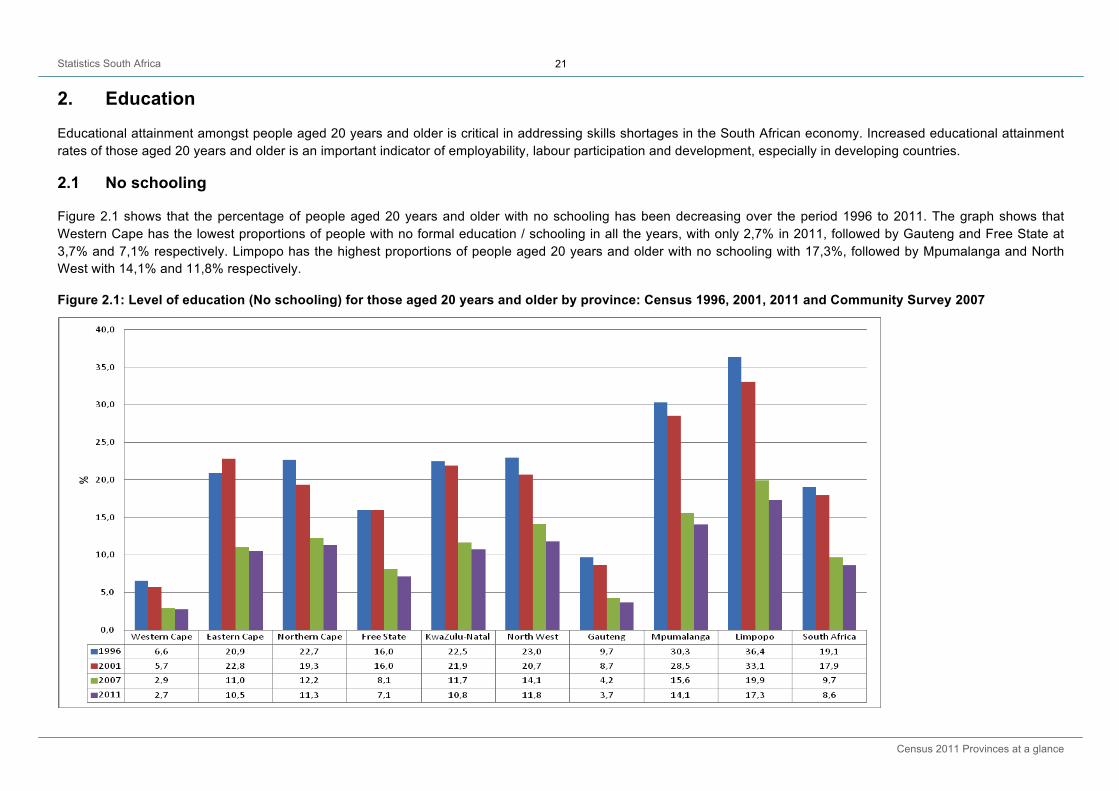
Figure 2.1 shows that the percentage of people aged 20 years and older with no schooling has been decreasing over the period 1996 to 2011. The graph shows that Western Cape has the lowest proportions of people with no formal education / schooling in all the years, with only 2,7% in 2011, followed by Gauteng and Free State at 3,7% and 7,1% respectively. Limpopo has the highest proportions of people aged 20 years and older with no schooling with 17,3%, followed by Mpumalanga and North West with 14,1% and 11,8% respectively.
Figure 2.1: Level of education (No schooling) for those aged 20 years and older by province: Census 1996, 2001, 2011 and Community Survey 2007
Statistics South Africa
Census 2011 Provinces at a glance
22
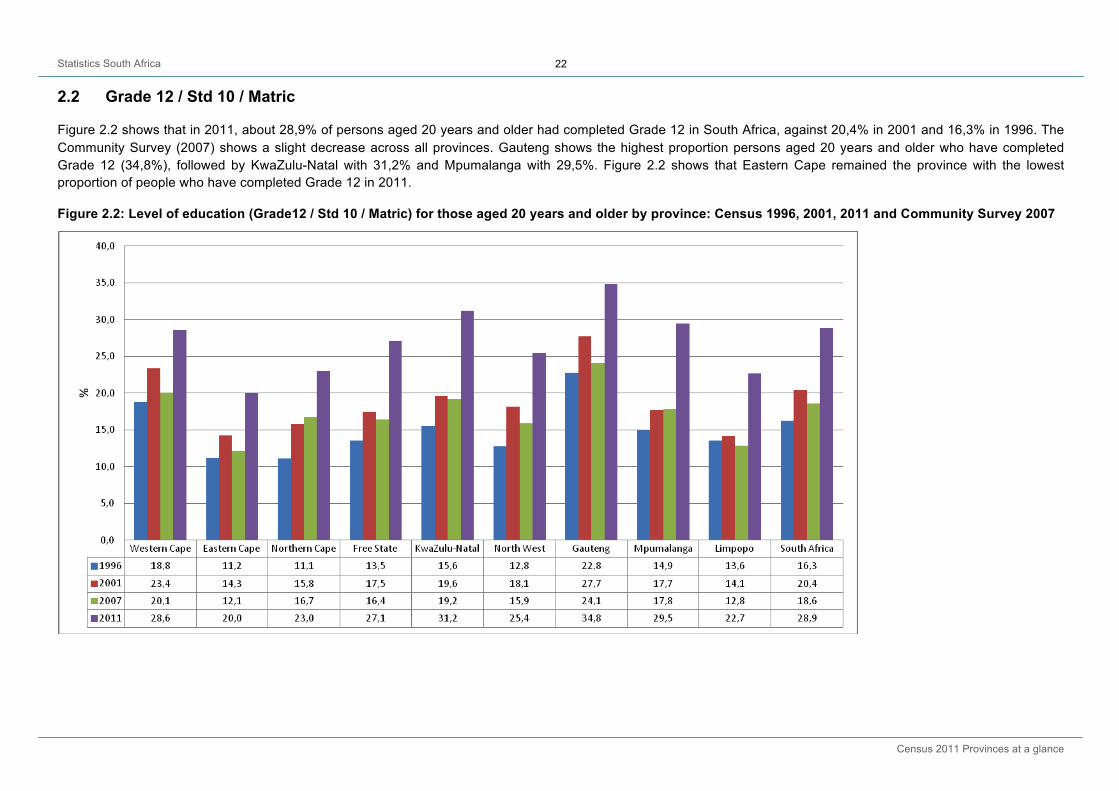
2.2 Grade 12 / Std 10 / Matric
Figure 2.2 shows that in 2011, about 28,9% of persons aged 20 years and older had completed Grade 12 in South Africa, against 20,4% in 2001 and 16,3% in 1996. The Community Survey (2007) shows a slight decrease across all provinces. Gauteng shows the highest proportion persons aged 20 years and older who have completed Grade 12 (34,8%), followed by KwaZulu-Natal with 31,2% and Mpumalanga with 29,5%. Figure 2.2 shows that Eastern Cape remained the province with the lowest proportion of people who have completed Grade 12 in 2011.
Figure 2.2: Level of education (Grade12 / Std 10 / Matric) for those aged 20 years and older by province: Census 1996, 2001, 2011 and Community Survey 2007
Statistics South Africa
Census 2011 Provinces at a glance
23
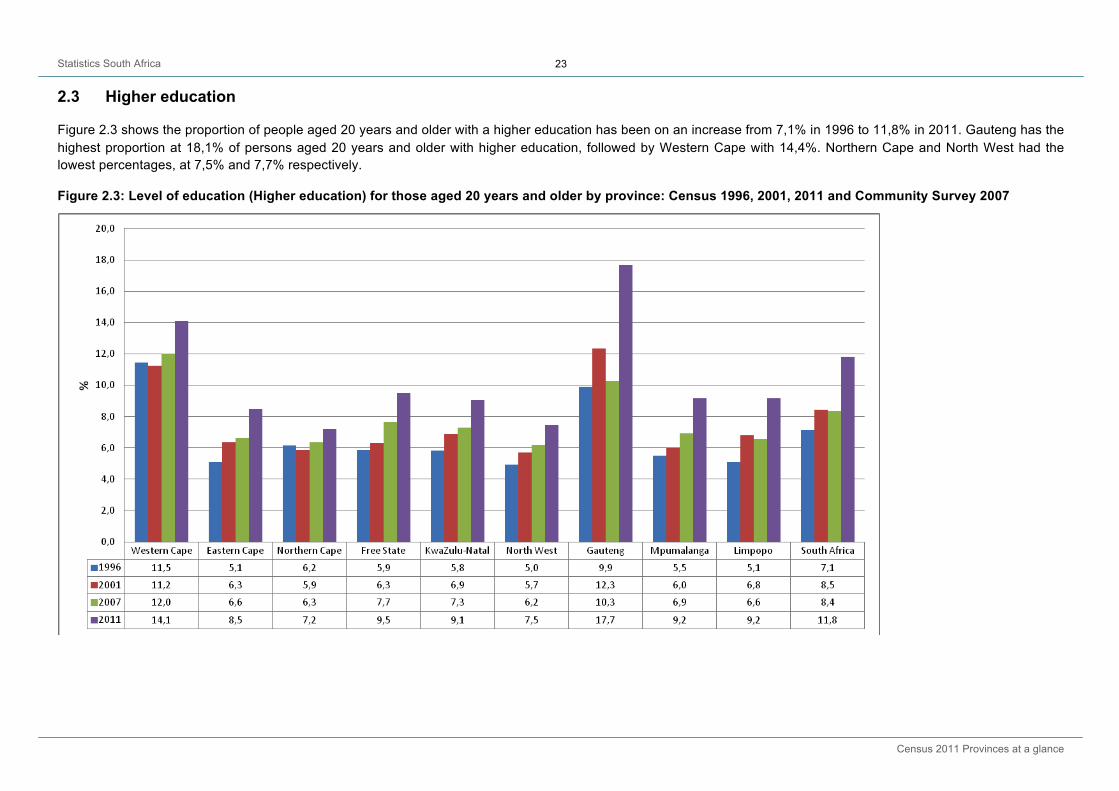
2.3 Higher education
Figure 2.3 shows the proportion of people aged 20 years and older with a higher education has been on an increase from 7,1% in 1996 to 11,8% in 2011. Gauteng has the highest proportion at 18,1% of persons aged 20 years and older with higher education, followed by Western Cape with 14,4%. Northern Cape and North West had the lowest percentages, at 7,5% and 7,7% respectively.
Figure 2.3: Level of education (Higher education) for those aged 20 years and older by province: Census 1996, 2001, 2011 and Community Survey 2007

Statistics South Africa
Census 2011 Provinces at a glance
24
3. Household goods and services
3.1 Households
The numbers of households have been steadily growing over the past 15 years. Population growth has been mostly responsible for that but also, the changing pattern of household formations can be attributed to such growth and diversity. Most households, as indicated in Figure 3.1, are in Gauteng and KZN, with the fewest in the Northern Cape and Free State.
Figure 3.1: Number of households in South Africa: Census 1996, 2001 and 2011 and Community Survey 2007
Statistics South Africa
Census 2011 Provinces at a glance
25
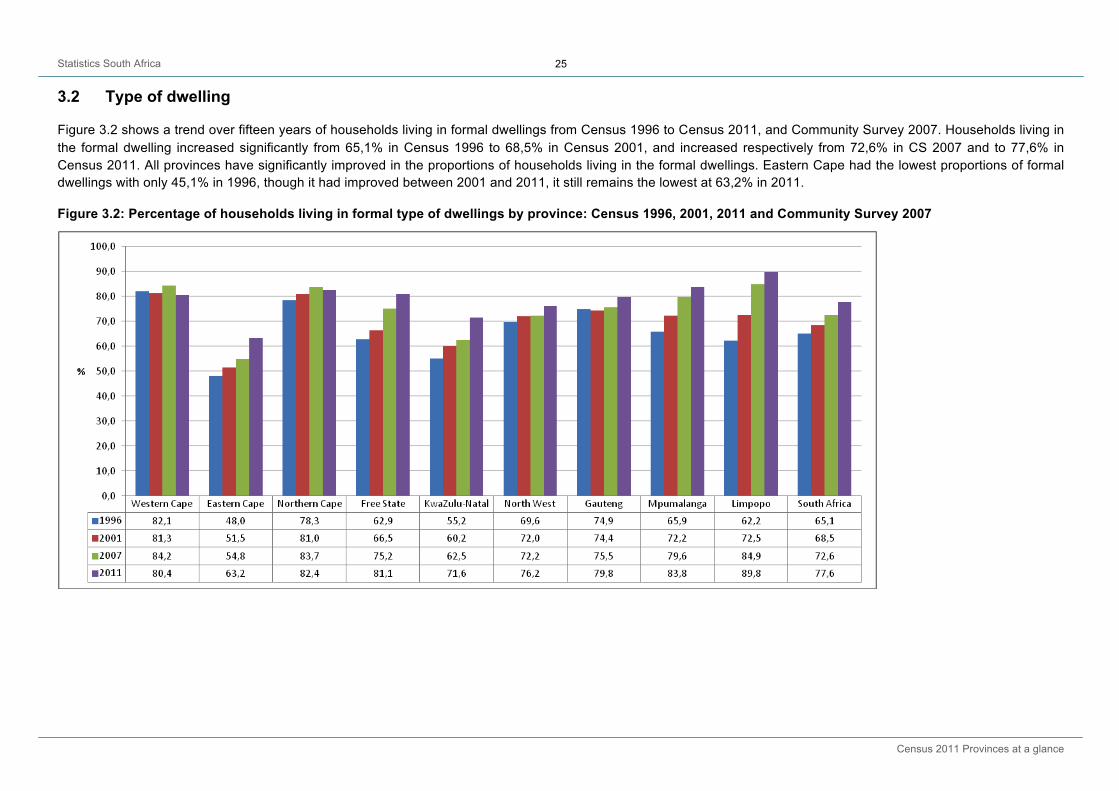
3.2 Type of dwelling
Figure 3.2 shows a trend over fifteen years of households living in formal dwellings from Census 1996 to Census 2011, and Community Survey 2007. Households living in the formal dwelling increased significantly from 65,1% in Census 1996 to 68,5% in Census 2001, and increased respectively from 72,6% in CS 2007 and to 77,6% in Census 2011. All provinces have significantly improved in the proportions of households living in the formal dwellings. Eastern Cape had the lowest proportions of formal dwellings with only 45,1% in 1996, though it had improved between 2001 and 2011, it still remains the lowest at 63,2% in 2011.
Figure 3.2: Percentage of households living in formal type of dwellings by province: Census 1996, 2001, 2011 and Community Survey 2007
Statistics South Africa
Census 2011 Provinces at a glance
26
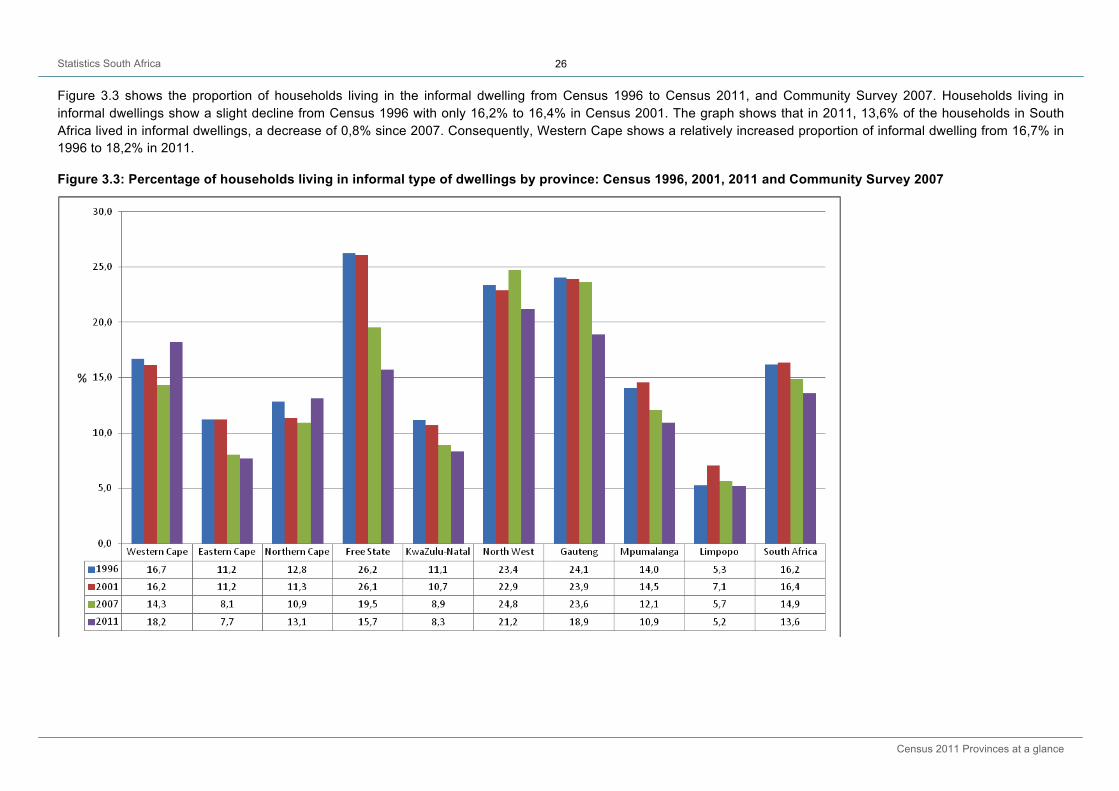
Figure 3.3 shows the proportion of households living in the informal dwelling from Census 1996 to Census 2011, and Community Survey 2007. Households living in informal dwellings show a slight decline from Census 1996 with only 16,2% to 16,4% in Census 2001. The graph shows that in 2011, 13,6% of the households in South Africa lived in informal dwellings, a decrease of 0,8% since 2007. Consequently, Western Cape shows a relatively increased proportion of informal dwelling from 16,7% in 1996 to 18,2% in 2011.
Figure 3.3: Percentage of households living in informal type of dwellings by province: Census 1996, 2001, 2011 and Community Survey 2007
Statistics South Africa
Census 2011 Provinces at a glance
27
3.3 Tenure status
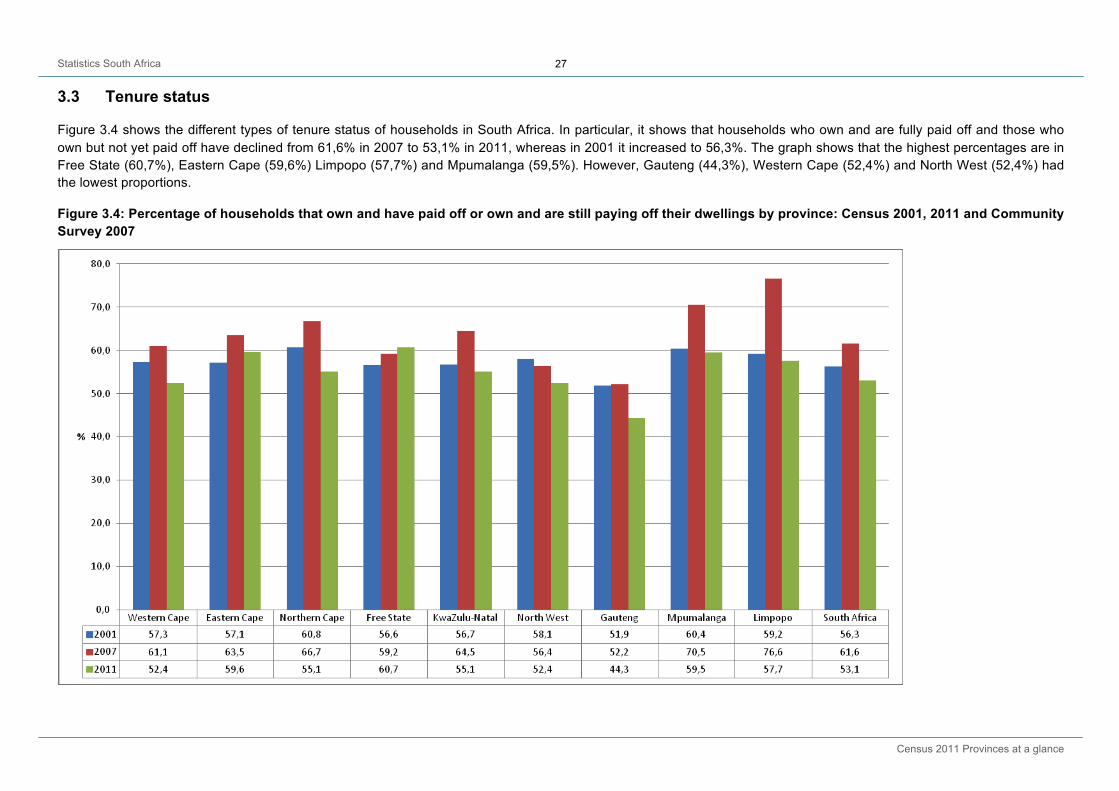
Figure 3.4 shows the different types of tenure status of households in South Africa. In particular, it shows that households who own and are fully paid off and those who own but not yet paid off have declined from 61,6% in 2007 to 53,1% in 2011, whereas in 2001 it increased to 56,3%. The graph shows that the highest percentages are in Free State (60,7%), Eastern Cape (59,6%) Limpopo (57,7%) and Mpumalanga (59,5%). However, Gauteng (44,3%), Western Cape (52,4%) and North West (52,4%) had the lowest proportions.
Figure 3.4: Percentage of households that own and have paid off or own and are still paying off their dwellings by province: Census 2001, 2011 and Community Survey 2007

Statistics South Africa
Census 2011 Provinces at a glance
28
Figure 3.5 shows that the proportion of households renting their dwellings increased from 18,7% in 2001, to 18,8% in 2007 and to 25,0% in 2011. The graph shows that Western Cape (28,9%), Gauteng (37,1%) and Mpumalanga (20,3%) are the provinces with the highest proportions of households renting their dwellings and there was a significant increase between 2001 and 2011. However, Eastern Cape and Limpopo have the lowest proportion of household renting their dwellings at 14,9% and 12,6% respectively.
Figure 3.5: Percentage of households that are renting their dwellings by province: Census 2001, 2011 and Community Survey 2007
Statistics South Africa
Census 2011 Provinces at a glance
29
3.4 Household goods
3.4.1 Cell phone
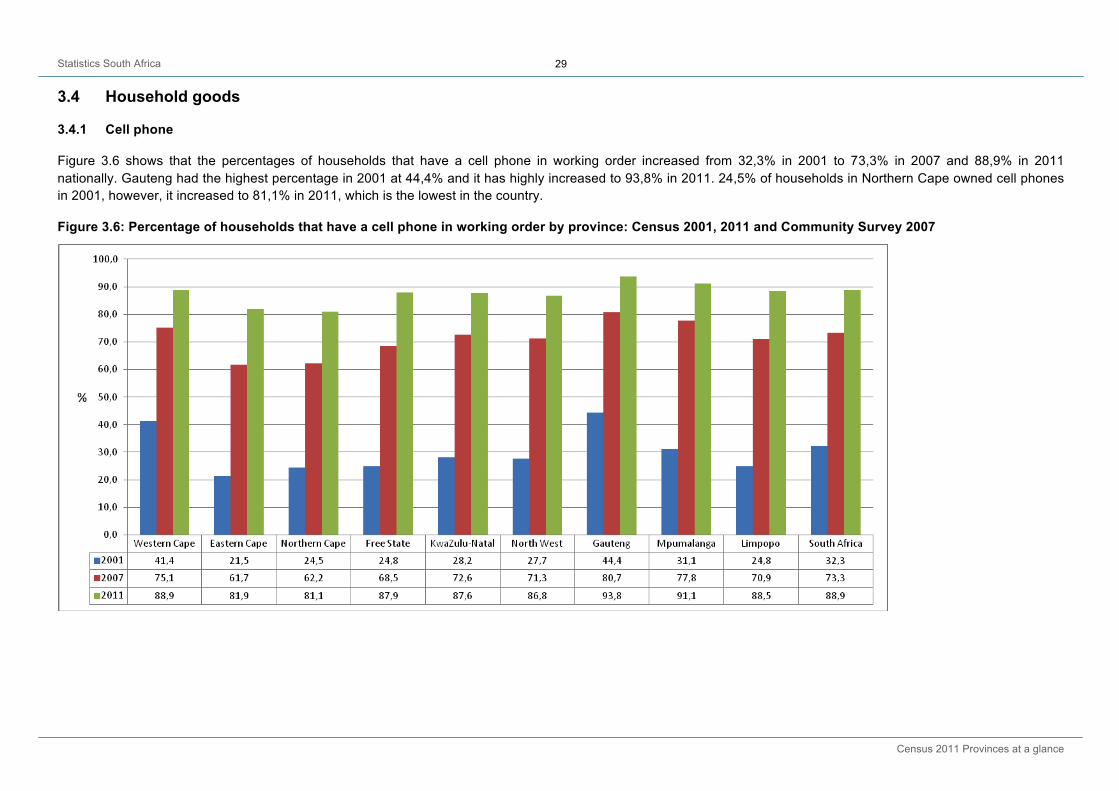
Figure 3.6 shows that the percentages of households that have a cell phone in working order increased from 32,3% in 2001 to 73,3% in 2007 and 88,9% in 2011 nationally. Gauteng had the highest percentage in 2001 at 44,4% and it has highly increased to 93,8% in 2011. 24,5% of households in Northern Cape owned cell phones in 2001, however, it increased to 81,1% in 2011, which is the lowest in the country.
Figure 3.6: Percentage of households that have a cell phone in working order by province: Census 2001, 2011 and Community Survey 2007
Statistics South Africa
Census 2011 Provinces at a glance
30
3.4.2 Computer
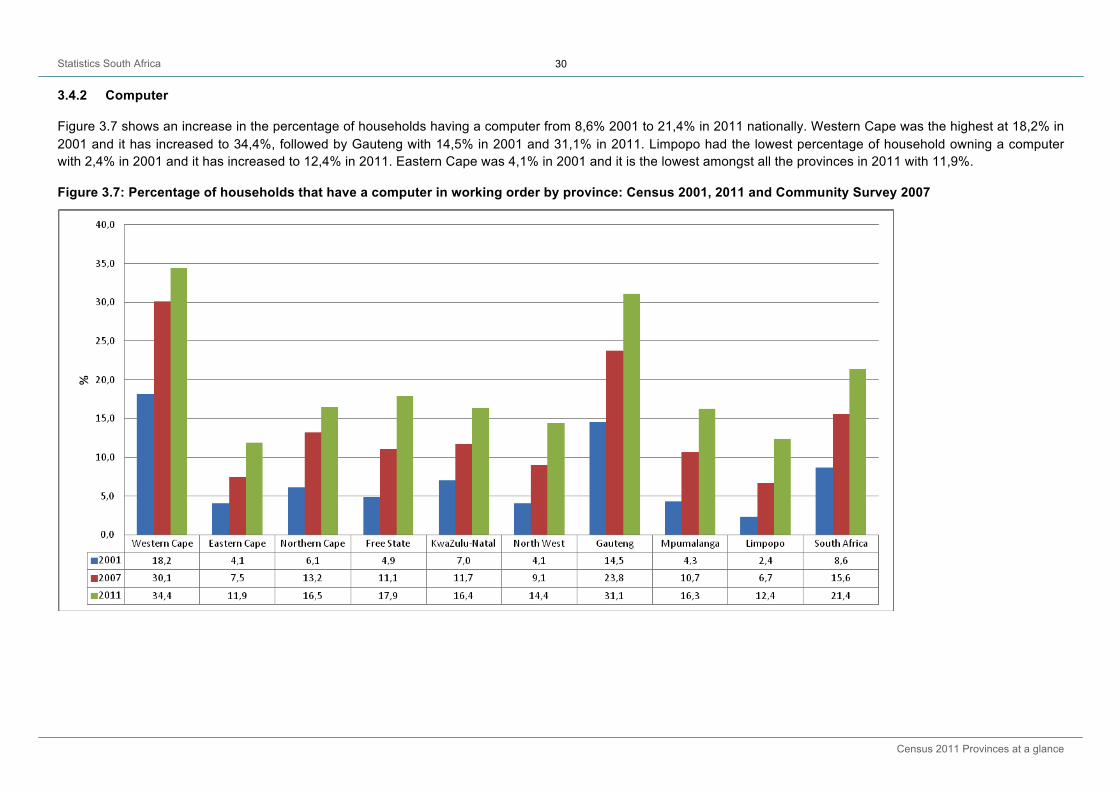
Figure 3.7 shows an increase in the percentage of households having a computer from 8,6% 2001 to 21,4% in 2011 nationally. Western Cape was the highest at 18,2% in 2001 and it has increased to 34,4%, followed by Gauteng with 14,5% in 2001 and 31,1% in 2011. Limpopo had the lowest percentage of household owning a computer with 2,4% in 2001 and it has increased to 12,4% in 2011. Eastern Cape was 4,1% in 2001 and it is the lowest amongst all the provinces in 2011 with 11,9%.
Figure 3.7: Percentage of households that have a computer in working order by province: Census 2001, 2011 and Community Survey 2007
Statistics South Africa
Census 2011 Provinces at a glance
31
3.4.3 Landline
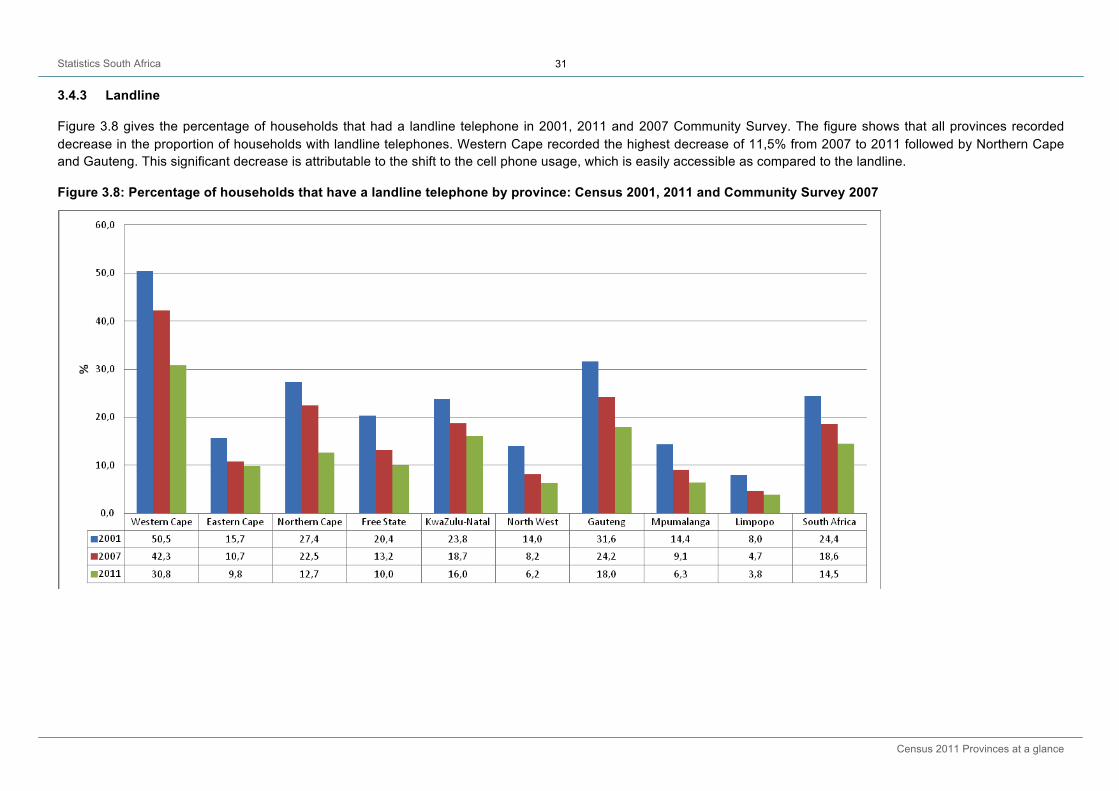
Figure 3.8 gives the percentage of households that had a landline telephone in 2001, 2011 and 2007 Community Survey. The figure shows that all provinces recorded decrease in the proportion of households with landline telephones. Western Cape recorded the highest decrease of 11,5% from 2007 to 2011 followed by Northern Cape and Gauteng. This significant decrease is attributable to the shift to the cell phone usage, which is easily accessible as compared to the landline.
Figure 3.8: Percentage of households that have a landline telephone by province: Census 2001, 2011 and Community Survey 2007
Statistics South Africa
Census 2011 Provinces at a glance
32
3.4.4 Radio
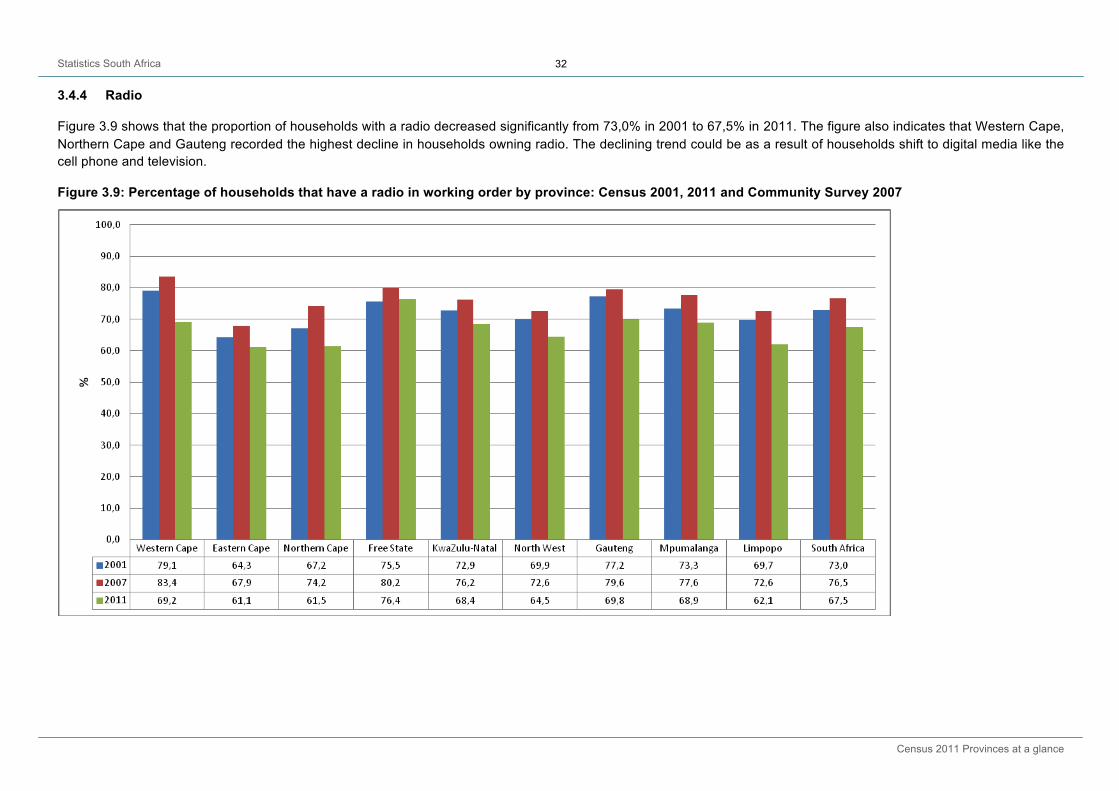
Figure 3.9 shows that the proportion of households with a radio decreased significantly from 73,0% in 2001 to 67,5% in 2011. The figure also indicates that Western Cape, Northern Cape and Gauteng recorded the highest decline in households owning radio. The declining trend could be as a result of households shift to digital media like the cell phone and television.
Figure 3.9: Percentage of households that have a radio in working order by province: Census 2001, 2011 and Community Survey 2007
Statistics South Africa
Census 2011 Provinces at a glance
33
3.4.5 Refrigerator
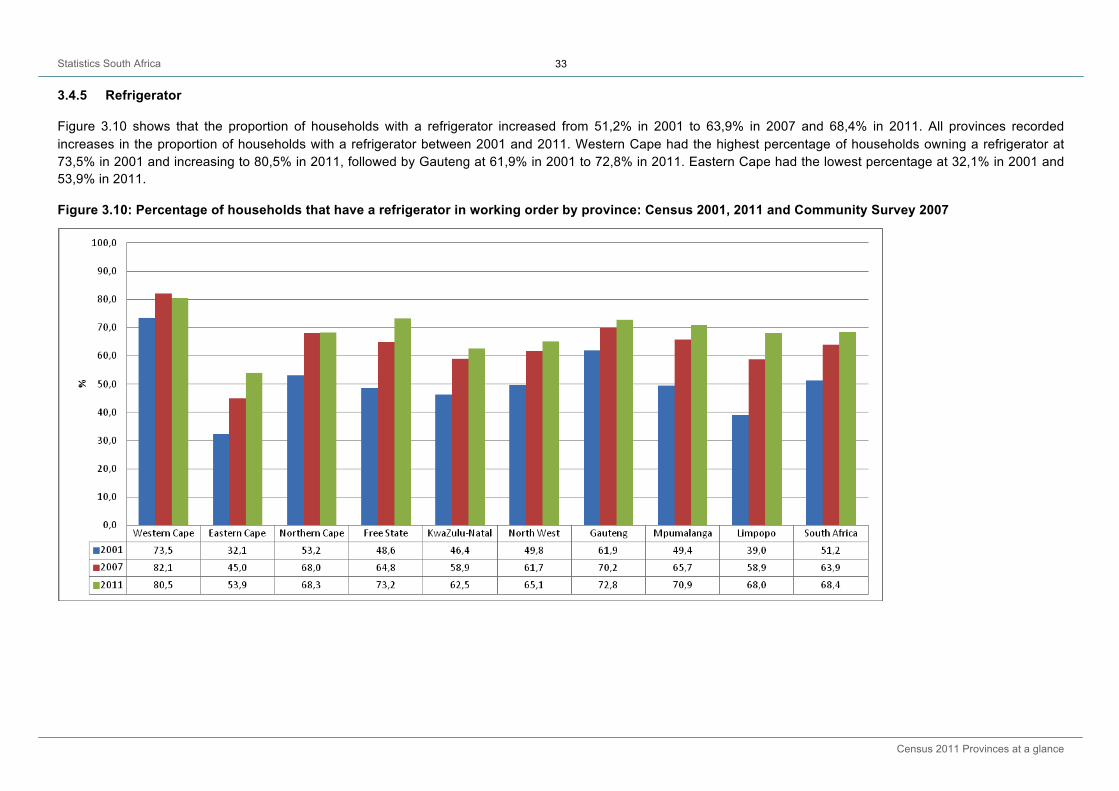
Figure 3.10 shows that the proportion of households with a refrigerator increased from 51,2% in 2001 to 63,9% in 2007 and 68,4% in 2011. All provinces recorded increases in the proportion of households with a refrigerator between 2001 and 2011. Western Cape had the highest percentage of households owning a refrigerator at 73,5% in 2001 and increasing to 80,5% in 2011, followed by Gauteng at 61,9% in 2001 to 72,8% in 2011. Eastern Cape had the lowest percentage at 32,1% in 2001 and 53,9% in 2011.
Figure 3.10: Percentage of households that have a refrigerator in working order by province: Census 2001, 2011 and Community Survey 2007
Statistics South Africa
Census 2011 Provinces at a glance
34
3.4.6 Television
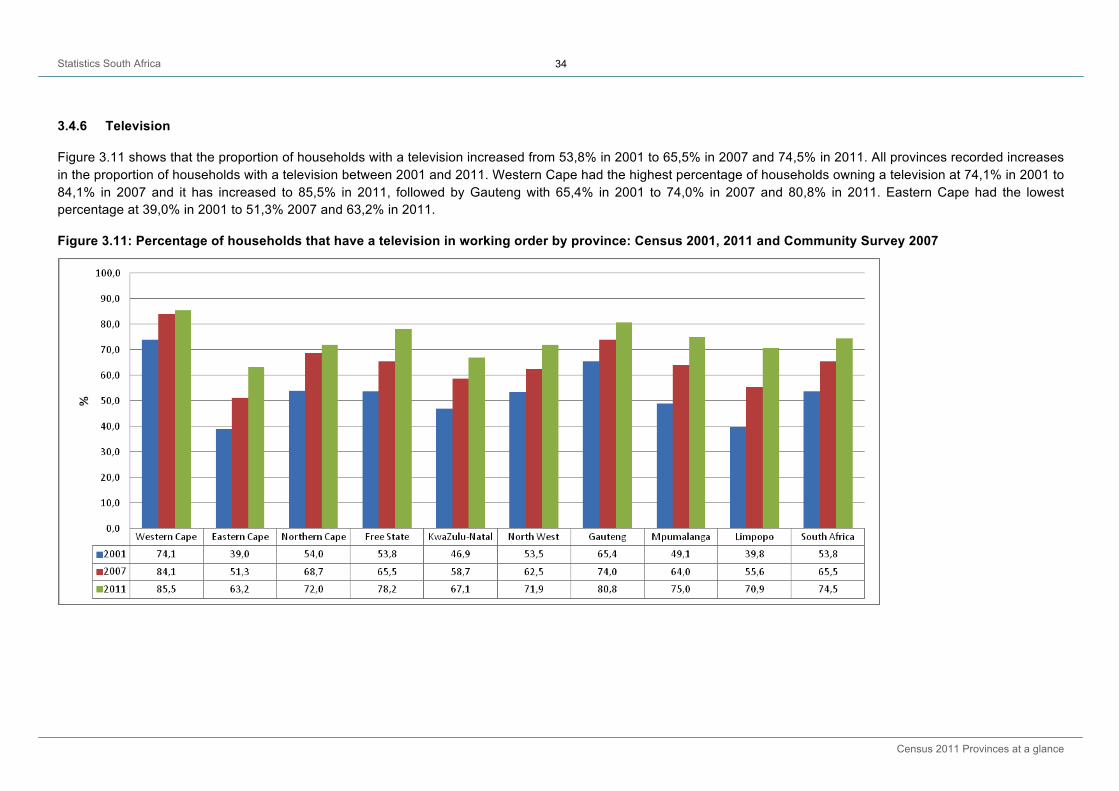
Figure 3.11 shows that the proportion of households with a television increased from 53,8% in 2001 to 65,5% in 2007 and 74,5% in 2011. All provinces recorded increases in the proportion of households with a television between 2001 and 2011. Western Cape had the highest percentage of households owning a television at 74,1% in 2001 to 84,1% in 2007 and it has increased to 85,5% in 2011, followed by Gauteng with 65,4% in 2001 to 74,0% in 2007 and 80,8% in 2011. Eastern Cape had the lowest percentage at 39,0% in 2001 to 51,3% 2007 and 63,2% in 2011.
Figure 3.11: Percentage of households that have a television in working order by province: Census 2001, 2011 and Community Survey 2007
Statistics South Africa
Census 2011 Provinces at a glance
35
3.4.7 Internet
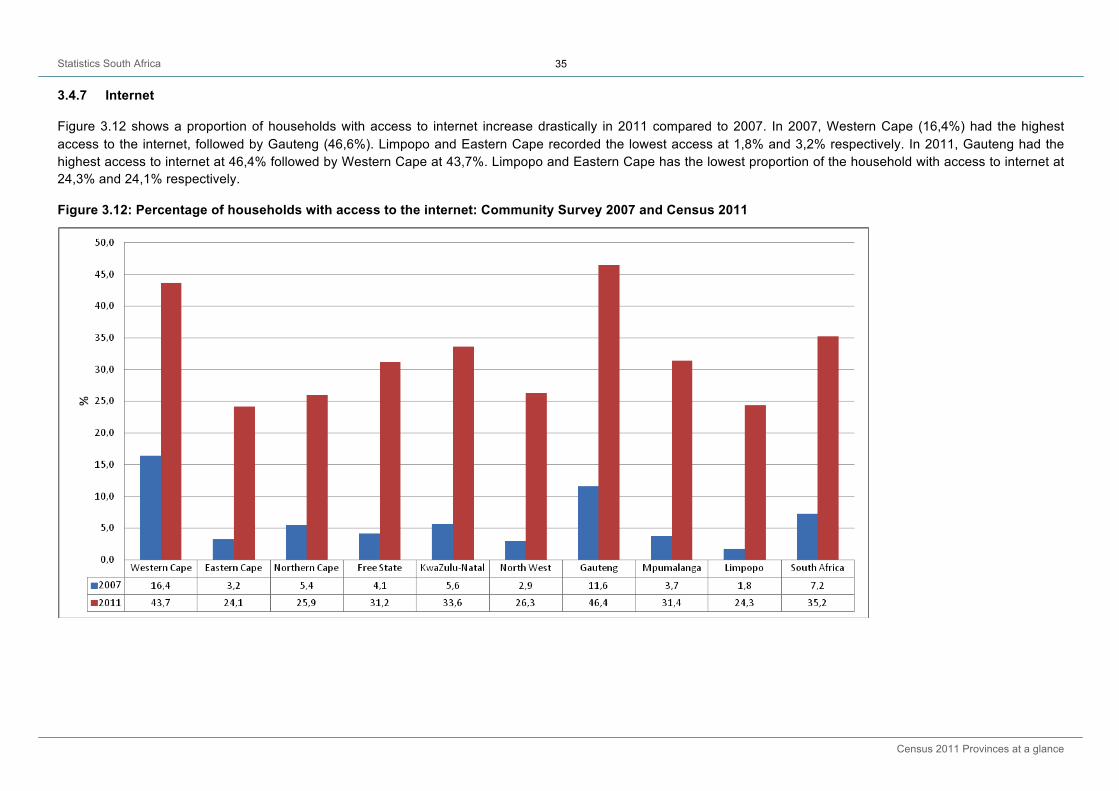
Figure 3.12 shows a proportion of households with access to internet increase drastically in 2011 compared to 2007. In 2007, Western Cape (16,4%) had the highest access to the internet, followed by Gauteng (46,6%). Limpopo and Eastern Cape recorded the lowest access at 1,8% and 3,2% respectively. In 2011, Gauteng had the highest access to internet at 46,4% followed by Western Cape at 43,7%. Limpopo and Eastern Cape has the lowest proportion of the household with access to internet at 24,3% and 24,1% respectively.
Figure 3.12: Percentage of households with access to the internet: Community Survey 2007 and Census 2011
Statistics South Africa
Census 2011 Provinces at a glance
36
3.5 Household services
3.5.1 Electricity for cooking, heating and lighting
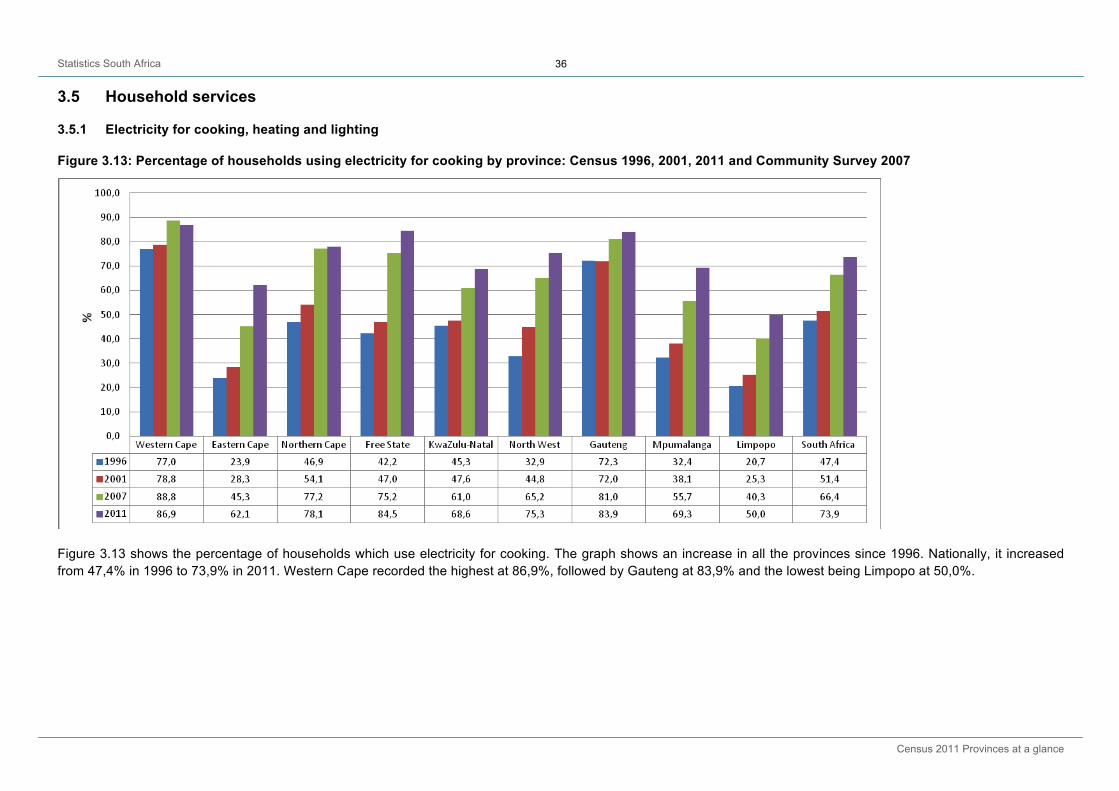
Figure 3.13: Percentage of households using electricity for cooking by province: Census 1996, 2001, 2011 and Community Survey 2007
Figure 3.13 shows the percentage of households which use electricity for cooking. The graph shows an increase in all the provinces since 1996. Nationally, it increased from 47,4% in 1996 to 73,9% in 2011. Western Cape recorded the highest at 86,9%, followed by Gauteng at 83,9% and the lowest being Limpopo at 50,0%.
Statistics South Africa
Census 2011 Provinces at a glance
37
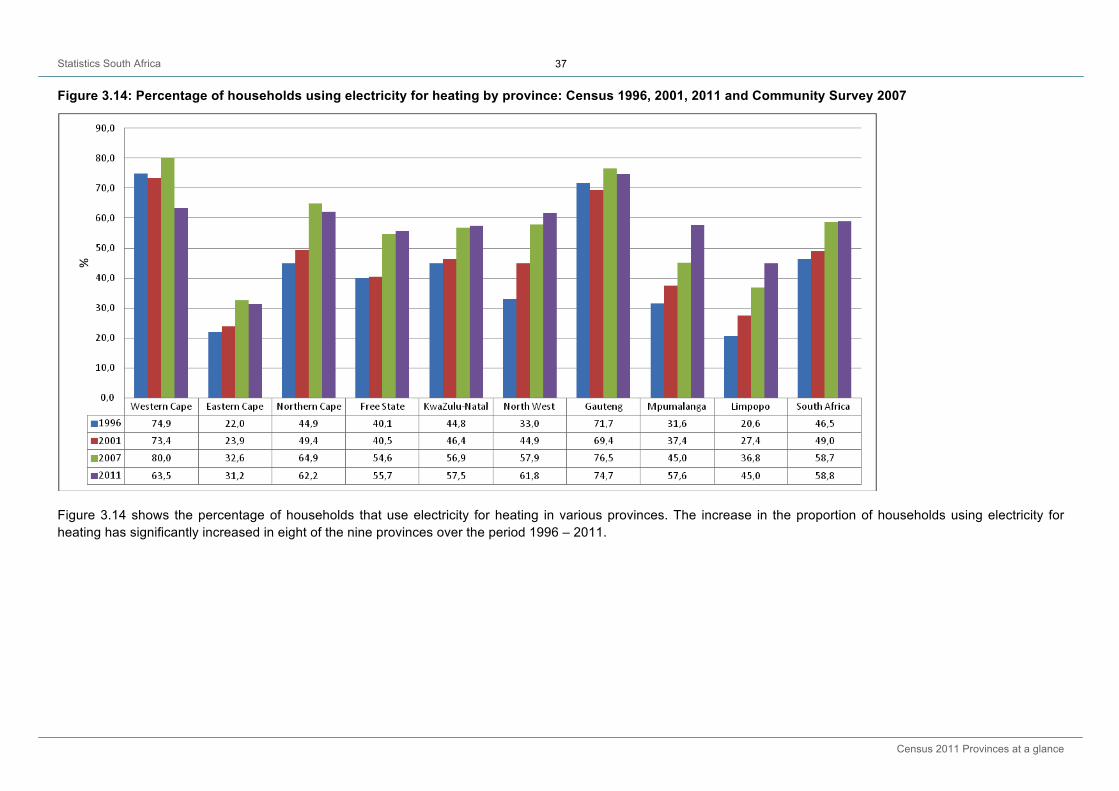
Figure 3.14: Percentage of households using electricity for heating by province: Census 1996, 2001, 2011 and Community Survey 2007
Figure 3.14 shows the percentage of households that use electricity for heating in various provinces. The increase in the proportion of households using electricity for heating has significantly increased in eight of the nine provinces over the period 1996 – 2011.
Statistics South Africa
Census 2011 Provinces at a glance
38
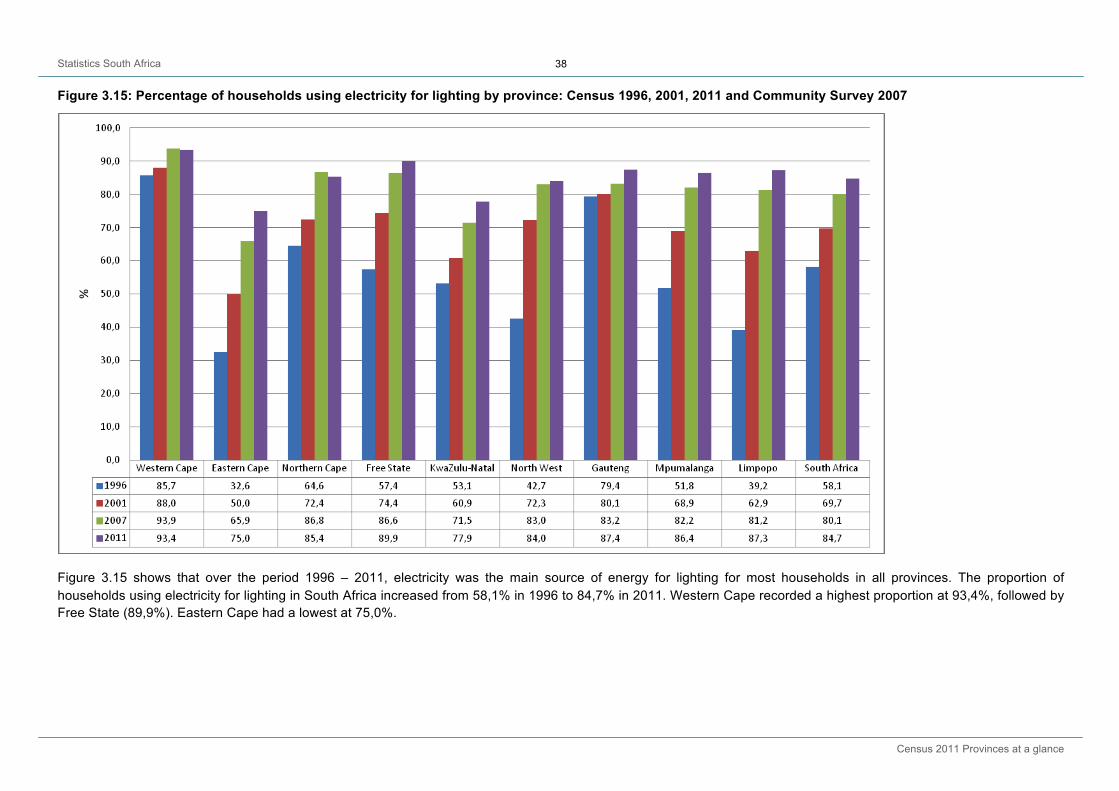
Figure 3.15: Percentage of households using electricity for lighting by province: Census 1996, 2001, 2011 and Community Survey 2007
Figure 3.15 shows that over the period 1996 – 2011, electricity was the main source of energy for lighting for most households in all provinces. The proportion of households using electricity for lighting in South Africa increased from 58,1% in 1996 to 84,7% in 2011. Western Cape recorded a highest proportion at 93,4%, followed by Free State (89,9%). Eastern Cape had a lowest at 75,0%.
Statistics South Africa
Census 2011 Provinces at a glance
39
3.5.2 Refuse removal
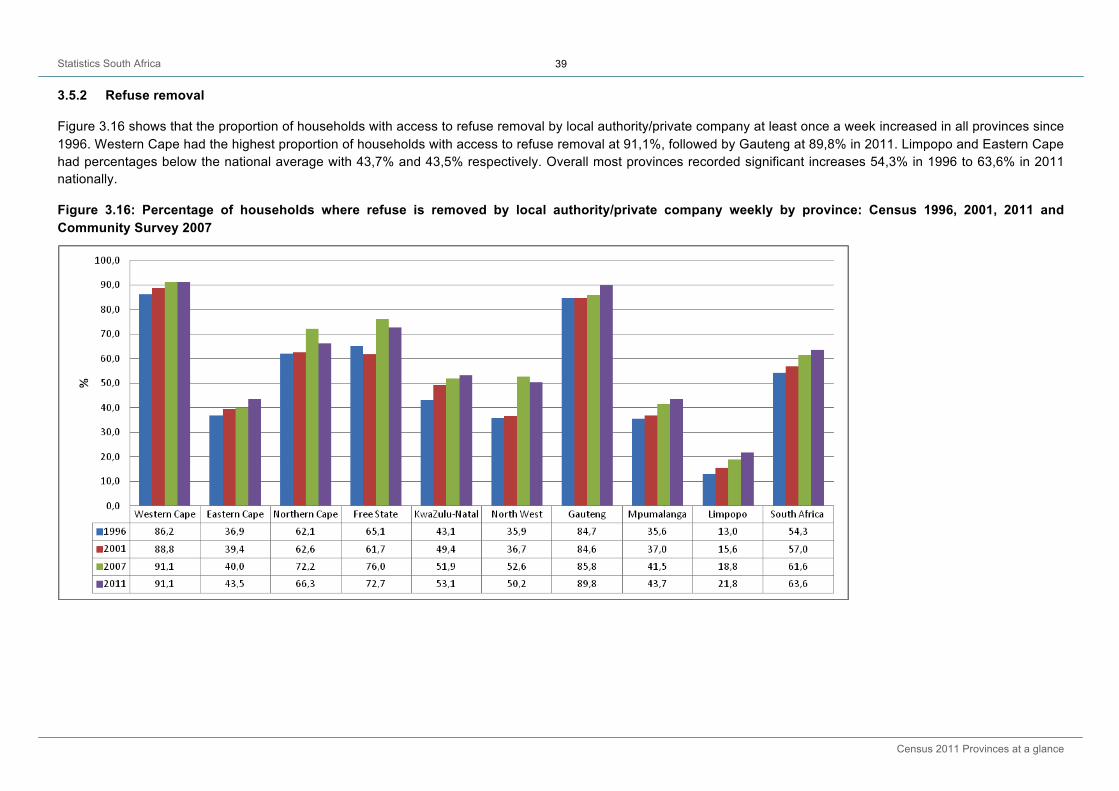
Figure 3.16 shows that the proportion of households with access to refuse removal by local authority/private company at least once a week increased in all provinces since 1996. Western Cape had the highest proportion of households with access to refuse removal at 91,1%, followed by Gauteng at 89,8% in 2011. Limpopo and Eastern Cape had percentages below the national average with 43,7% and 43,5% respectively. Overall most provinces recorded significant increases 54,3% in 1996 to 63,6% in 2011 nationally.
Figure 3.16: Percentage of households where refuse is removed by local authority/private company weekly by province: Census 1996, 2001, 2011 and Community Survey 2007
Statistics South Africa
Census 2011 Provinces at a glance
40
3.5.3 Toilet facilities
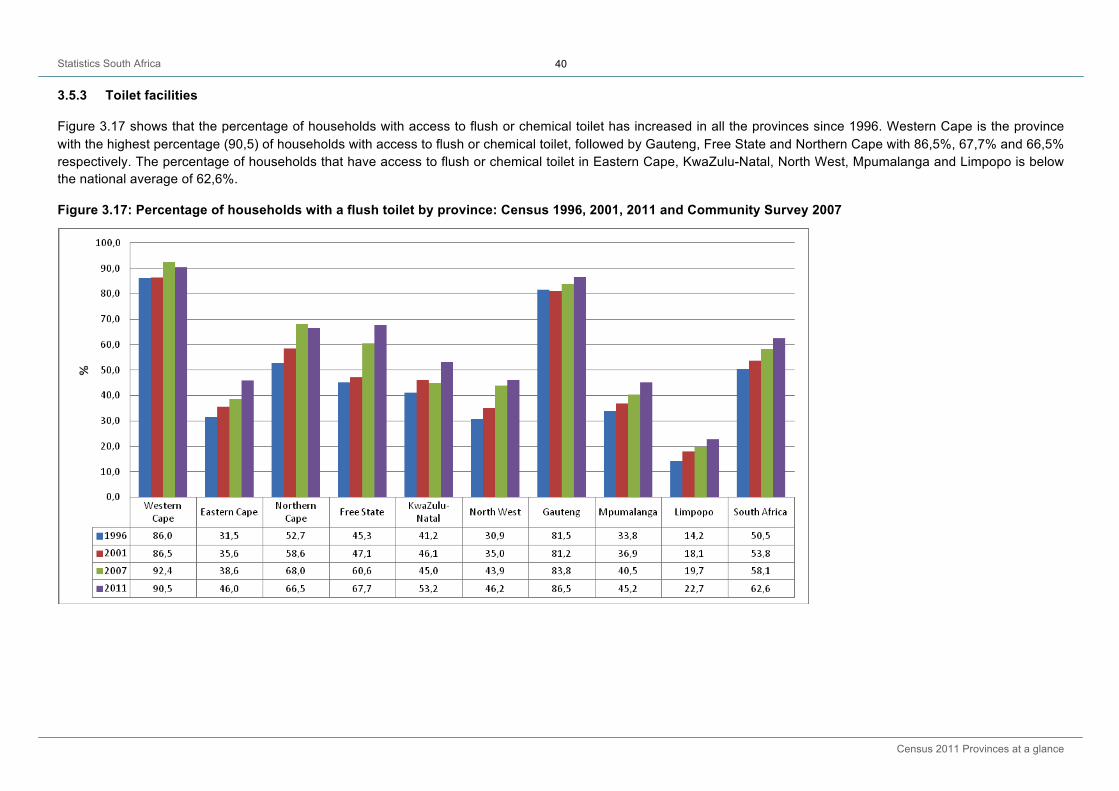
Figure 3.17 shows that the percentage of households with access to flush or chemical toilet has increased in all the provinces since 1996. Western Cape is the province with the highest percentage (90,5) of households with access to flush or chemical toilet, followed by Gauteng, Free State and Northern Cape with 86,5%, 67,7% and 66,5% respectively. The percentage of households that have access to flush or chemical toilet in Eastern Cape, KwaZulu-Natal, North West, Mpumalanga and Limpopo is below the national average of 62,6%.
Figure 3.17: Percentage of households with a flush toilet by province: Census 1996, 2001, 2011 and Community Survey 2007
Statistics South Africa
Census 2011 Provinces at a glance
41
3.5.4 Piped water
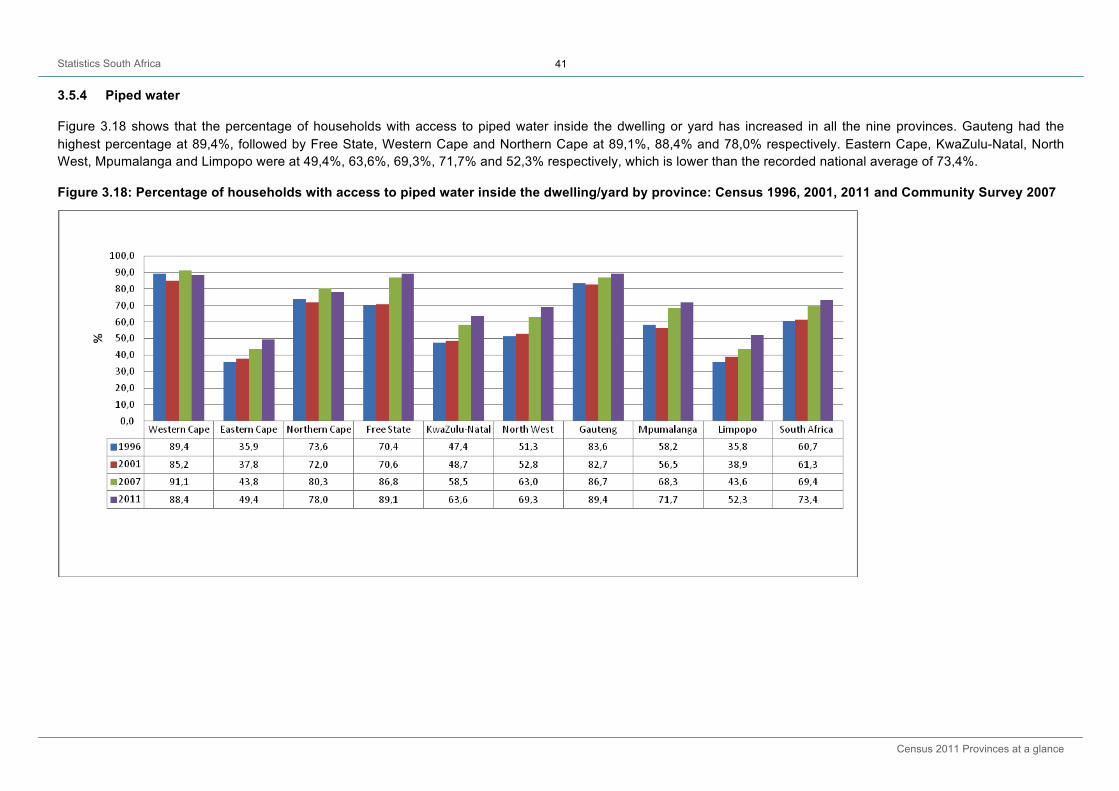
Figure 3.18 shows that the percentage of households with access to piped water inside the dwelling or yard has increased in all the nine provinces. Gauteng had the highest percentage at 89,4%, followed by Free State, Western Cape and Northern Cape at 89,1%, 88,4% and 78,0% respectively. Eastern Cape, KwaZulu-Natal, North West, Mpumalanga and Limpopo were at 49,4%, 63,6%, 69,3%, 71,7% and 52,3% respectively, which is lower than the recorded national average of 73,4%.
Figure 3.18: Percentage of households with access to piped water inside the dwelling/yard by province: Census 1996, 2001, 2011 and Community Survey 2007

Statistics South Africa
Census 2011 Provinces at a glance
42
4. Labour force
Figure 4.1 shows the unemployment rates in all provinces for Census 1996, 2001, 2011, and CS 2007. Between 1996 and 2001, there has been an increase in unemployment across all provinces, with an average of 33,9% to 41,6% in South Africa. However, between 2001, 2007 and 2011, there has been a notable drop in unemployment rates from all provinces. Western Cape sits at 21,6% and remains with the lowest levels of unemployment rate since 1996, followed by Gauteng at 26,3%. Limpopo and Eastern Cape show the highest levels of unemployment rates in 2011 with 38,9% and 37,4% respectively. Readers are requested to heed the disclaimer in the introduction to this publication.
Figure 4.1: Unemployment rates (official) for persons in the labour force aged 15–64: Census 1996, 2001, 2011 and Community Survey 2007
Statistics South Africa
Census 2011 Provinces at a glance
43
5. Household income
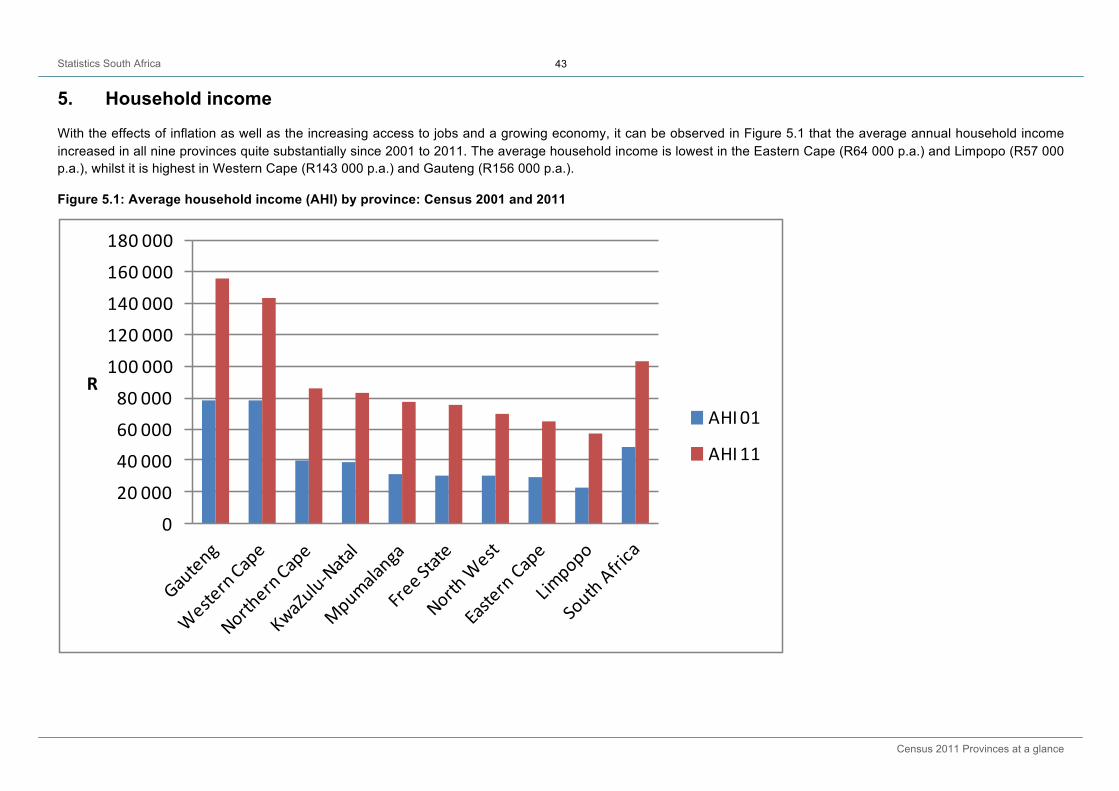
With the effects of inflation as well as the increasing access to jobs and a growing economy, it can be observed in Figure 5.1 that the average annual household income increased in all nine provinces quite substantially since 2001 to 2011. The average household income is lowest in the Eastern Cape (R64 000 p.a.) and Limpopo (R57 000 p.a.), whilst it is highest in Western Cape (R143 000 p.a.) and Gauteng (R156 000 p.a.).
Figure 5.1: Average household income (AHI) by province: Census 2001 and 2011
0
20 000
40 000
60 000
80 000
100 000
120 000
140 000
160 000
180 000
R
AHI 01
AHI 11
Statistics South Africa
Census 2011 Provinces at a glance
44
APPENDIX
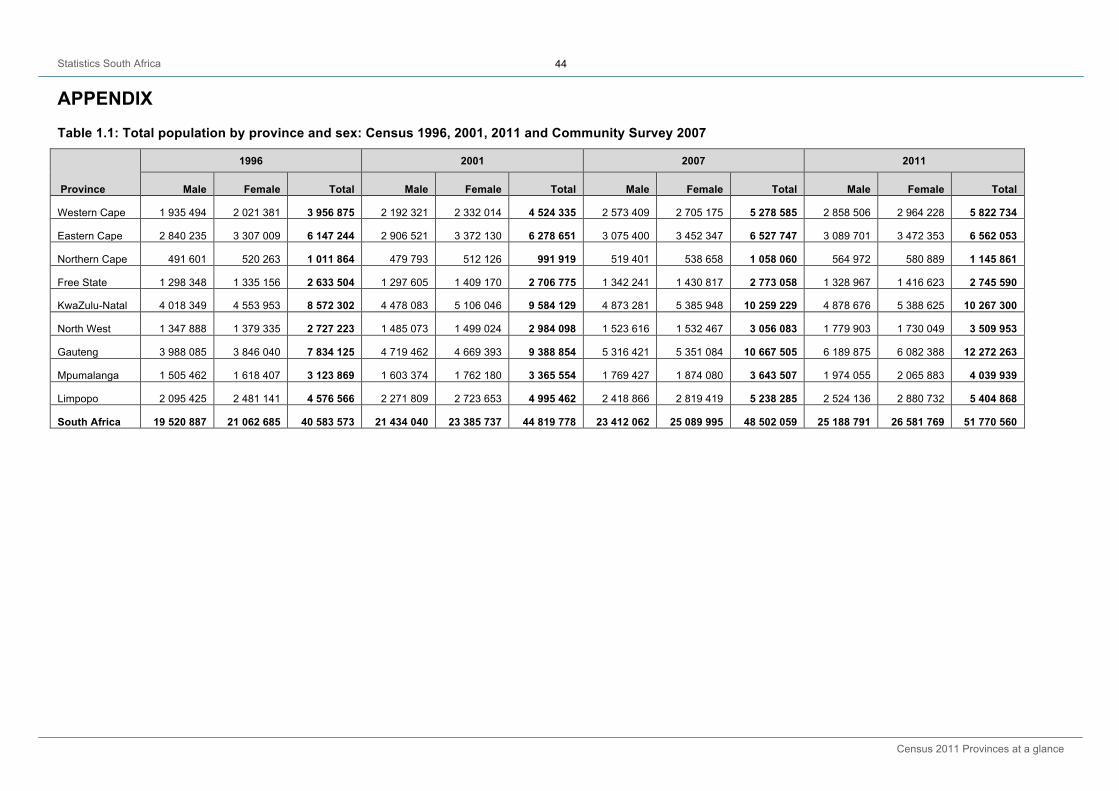
Table 1.1: Total population by province and sex: Census 1996, 2001, 2011 and Community Survey 2007
Province
1996 2001 2007 2011
Male Female Total Male Female Total Male Female Total Male Female Total
Western Cape 1 935 494 2 021 381 3 956 875 2 192 321 2 332 014 4 524 335 2 573 409 2 705 175 5 278 585 2 858 506 2 964 228 5 822 734
Eastern Cape 2 840 235 3 307 009 6 147 244 2 906 521 3 372 130 6 278 651 3 075 400 3 452 347 6 527 747 3 089 701 3 472 353 6 562 053
Northern Cape 491 601 520 263 1 011 864 479 793 512 126 991 919 519 401 538 658 1 058 060 564 972 580 889 1 145 861
Free State 1 298 348 1 335 156 2 633 504 1 297 605 1 409 170 2 706 775 1 342 241 1 430 817 2 773 058 1 328 967 1 416 623 2 745 590
KwaZulu-Natal 4 018 349 4 553 953 8 572 302 4 478 083 5 106 046 9 584 129 4 873 281 5 385 948 10 259 229 4 878 676 5 388 625 10 267 300
North West 1 347 888 1 379 335 2 727 223 1 485 073 1 499 024 2 984 098 1 523 616 1 532 467 3 056 083 1 779 903 1 730 049 3 509 953
Gauteng 3 988 085 3 846 040 7 834 125 4 719 462 4 669 393 9 388 854 5 316 421 5 351 084 10 667 505 6 189 875 6 082 388 12 272 263
Mpumalanga 1 505 462 1 618 407 3 123 869 1 603 374 1 762 180 3 365 554 1 769 427 1 874 080 3 643 507 1 974 055 2 065 883 4 039 939
Limpopo 2 095 425 2 481 141 4 576 566 2 271 809 2 723 653 4 995 462 2 418 866 2 819 419 5 238 285 2 524 136 2 880 732 5 404 868
South Africa 19 520 887 21 062 685 40 583 573 21 434 040 23 385 737 44 819 778 23 412 062 25 089 995 48 502 059 25 188 791 26 581 769 51 770 560

Statistics South Africa
Census 2011 Provinces at a glance
45
Table 1.2: Total population by age group and sex: Census 1996, 2001, 2011 and Community Survey 2007 (Western Cape)
Age groups
Western Cape 1996 Western Cape 2001 Western Cape 2007 Western Cape 2011
Male Female Total Male Female Total Male Female Total Male Female Total
0 – 4 191 148 188 876 380 024 204 553 200 989 405 542 249 361 245 992 495 353 288 052 276 748 564 800
5 – 9 191 798 189 621 381 419 205 336 203 870 409 207 232 520 228 664 461 184 231 828 228 333 460 161
10 – 14 191 164 191 841 383 006 210 029 211 923 421 952 210 771 220 492 431 263 221 782 217 061 438 843
15 – 19 174 325 175 894 350 219 217 575 228 671 446 245 240 113 240 721 480 834 235 421 244 701 480 122
20 – 24 196 033 201 220 397 253 210 504 220 328 430 833 256 819 255 038 511 856 292 007 291 543 583 551
25 – 29 186 602 191 627 378 229 209 971 215 830 425 802 229 983 241 641 471 624 299 476 293 072 592 548
30 – 34 171 115 177 443 348 558 191 773 201 055 392 828 222 577 218 930 441 507 245 789 235 812 481 600
35 – 39 142 999 150 405 293 403 174 944 186 539 361 483 208 150 204 447 412 597 219 196 217 442 436 638
40 – 44 115 549 124 346 239 895 146 544 160 856 307 400 181 065 190 565 371 630 193 282 201 755 395 037
45 – 49 93 176 98 546 191 723 112 348 125 208 237 556 141 573 164 869 306 442 164 540 183 326 347 866
50 – 54 71 303 76 564 147867 91 071 99 069 190 140 112 711 131 224 243 935 137 624 155 061 292 685
55 – 59 58 209 63 351 121 560 67 073 75 291 142 363 91 210 106 270 197 481 105 257 122 841 228 098
60 – 64 45 228 54 408 99 636 54 581 64 310 118 892 68 837 84 926 153 763 81 580 96 978 178 558
65 – 69 35 144 42 490 77 634 38 985 48 766 87 751 53 438 61 910 115 348 56 107 69 103 125 210
70 – 74 22 769 30 995 53 764 27 328 37 051 64 379 35 457 43 764 79 221 40 357 52 837 93 193
75 – 79 13 901 21 530 35 431 16 275 25 036 41 311 20 628 30 414 51 042 24 135 35 806 59 940
80 – 84 6 962 13 966 20 928 9 091 15 649 24 739 12 022 21 193 33 215 13 253 23 182 36 435
85+ 4 315 10 234 14 549 4 339 11 572 15 911 6 173 14 114 20 287 8 821 18 627 27 448
Total 1 911 739 2 003 359 3 915 098 2 192 321 2 332 014 4 524 335 2 573 409 2 705 175 5 278 585 2 858 506 2 964 228 5 822 734
Statistics South Africa
Census 2011 Provinces at a glance
46
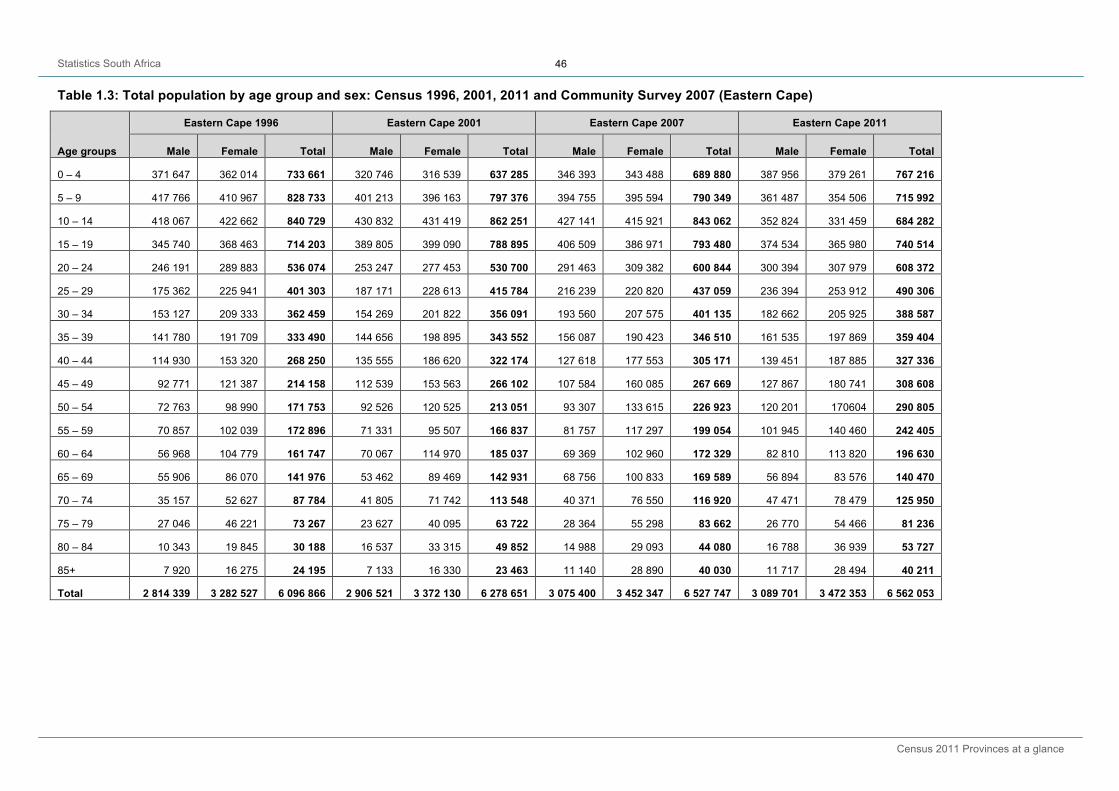
Table 1.3: Total population by age group and sex: Census 1996, 2001, 2011 and Community Survey 2007 (Eastern Cape)
Age groups
Eastern Cape 1996 Eastern Cape 2001 Eastern Cape 2007 Eastern Cape 2011
Male Female Total Male Female Total Male Female Total Male Female Total
0 – 4 371 647 362 014 733 661 320 746 316 539 637 285 346 393 343 488 689 880 387 956 379 261 767 216
5 – 9 417 766 410 967 828 733 401 213 396 163 797 376 394 755 395 594 790 349 361 487 354 506 715 992
10 – 14 418 067 422 662 840 729 430 832 431 419 862 251 427 141 415 921 843 062 352 824 331 459 684 282
15 – 19 345 740 368 463 714 203 389 805 399 090 788 895 406 509 386 971 793 480 374 534 365 980 740 514
20 – 24 246 191 289 883 536 074 253 247 277 453 530 700 291 463 309 382 600 844 300 394 307 979 608 372
25 – 29 175 362 225 941 401 303 187 171 228 613 415 784 216 239 220 820 437 059 236 394 253 912 490 306
30 – 34 153 127 209 333 362 459 154 269 201 822 356 091 193 560 207 575 401 135 182 662 205 925 388 587
35 – 39 141 780 191 709 333 490 144 656 198 895 343 552 156 087 190 423 346 510 161 535 197 869 359 404
40 – 44 114 930 153 320 268 250 135 555 186 620 322 174 127 618 177 553 305 171 139 451 187 885 327 336
45 – 49 92 771 121 387 214 158 112 539 153 563 266 102 107 584 160 085 267 669 127 867 180 741 308 608
50 – 54 72 763 98 990 171 753 92 526 120 525 213 051 93 307 133 615 226 923 120 201 170604 290 805
55 – 59 70 857 102 039 172 896 71 331 95 507 166 837 81 757 117 297 199 054 101 945 140 460 242 405
60 – 64 56 968 104 779 161 747 70 067 114 970 185 037 69 369 102 960 172 329 82 810 113 820 196 630
65 – 69 55 906 86 070 141 976 53 462 89 469 142 931 68 756 100 833 169 589 56 894 83 576 140 470
70 – 74 35 157 52 627 87 784 41 805 71 742 113 548 40 371 76 550 116 920 47 471 78 479 125 950
75 – 79 27 046 46 221 73 267 23 627 40 095 63 722 28 364 55 298 83 662 26 770 54 466 81 236
80 – 84 10 343 19 845 30 188 16 537 33 315 49 852 14 988 29 093 44 080 16 788 36 939 53 727
85+ 7 920 16 275 24 195 7 133 16 330 23 463 11 140 28 890 40 030 11 717 28 494 40 211
Total 2 814 339 3 282 527 6 096 866 2 906 521 3 372 130 6 278 651 3 075 400 3 452 347 6 527 747 3 089 701 3 472 353 6 562 053
Statistics South Africa
Census 2011 Provinces at a glance
47
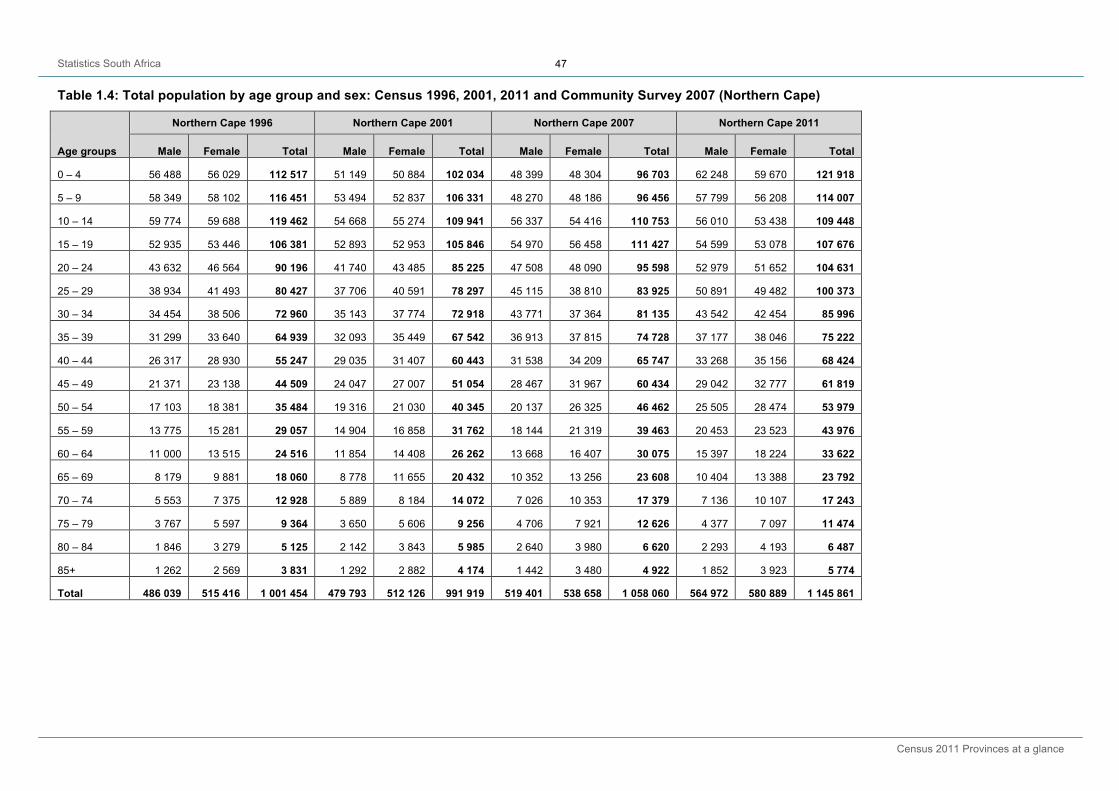
Table 1.4: Total population by age group and sex: Census 1996, 2001, 2011 and Community Survey 2007 (Northern Cape)
Age groups
Northern Cape 1996 Northern Cape 2001 Northern Cape 2007 Northern Cape 2011
Male Female Total Male Female Total Male Female Total Male Female Total
0 – 4 56 488 56 029 112 517 51 149 50 884 102 034 48 399 48 304 96 703 62 248 59 670 121 918
5 – 9 58 349 58 102 116 451 53 494 52 837 106 331 48 270 48 186 96 456 57 799 56 208 114 007
10 – 14 59 774 59 688 119 462 54 668 55 274 109 941 56 337 54 416 110 753 56 010 53 438 109 448
15 – 19 52 935 53 446 106 381 52 893 52 953 105 846 54 970 56 458 111 427 54 599 53 078 107 676
20 – 24 43 632 46 564 90 196 41 740 43 485 85 225 47 508 48 090 95 598 52 979 51 652 104 631
25 – 29 38 934 41 493 80 427 37 706 40 591 78 297 45 115 38 810 83 925 50 891 49 482 100 373
30 – 34 34 454 38 506 72 960 35 143 37 774 72 918 43 771 37 364 81 135 43 542 42 454 85 996
35 – 39 31 299 33 640 64 939 32 093 35 449 67 542 36 913 37 815 74 728 37 177 38 046 75 222
40 – 44 26 317 28 930 55 247 29 035 31 407 60 443 31 538 34 209 65 747 33 268 35 156 68 424
45 – 49 21 371 23 138 44 509 24 047 27 007 51 054 28 467 31 967 60 434 29 042 32 777 61 819
50 – 54 17 103 18 381 35 484 19 316 21 030 40 345 20 137 26 325 46 462 25 505 28 474 53 979
55 – 59 13 775 15 281 29 057 14 904 16 858 31 762 18 144 21 319 39 463 20 453 23 523 43 976
60 – 64 11 000 13 515 24 516 11 854 14 408 26 262 13 668 16 407 30 075 15 397 18 224 33 622
65 – 69 8 179 9 881 18 060 8 778 11 655 20 432 10 352 13 256 23 608 10 404 13 388 23 792
70 – 74 5 553 7 375 12 928 5 889 8 184 14 072 7 026 10 353 17 379 7 136 10 107 17 243
75 – 79 3 767 5 597 9 364 3 650 5 606 9 256 4 706 7 921 12 626 4 377 7 097 11 474
80 – 84 1 846 3 279 5 125 2 142 3 843 5 985 2 640 3 980 6 620 2 293 4 193 6 487
85+ 1 262 2 569 3 831 1 292 2 882 4 174 1 442 3 480 4 922 1 852 3 923 5 774
Total 486 039 515 416 1 001 454 479 793 512 126 991 919 519 401 538 658 1 058 060 564 972 580 889 1 145 861

Statistics South Africa
Census 2011 Provinces at a glance
48
Table 1.5: Total population by age group and sex: Census 1996, 2001, 2011 and Community Survey 2007 (Free State)
Age groups
Free State 1996 Free State 2001 Free State 2007 Free State 2011
Male Female Total Male Female Total Male Female Total Male Female Total
0 – 4 125 135 125 957 251 092 126 686 126 606 253 291 131 847 131 405 263 252 148 219 147 676 295 896
5 – 9 139 164 140 204 279 368 137 613 136 815 274 428 133 064 133 108 266 172 131 691 130 831 262 522
10 – 14 143 688 146 128 289 816 151 314 151 196 302 510 132 663 137 145 269 808 122 222 118 276 240 497
15 – 19 132 738 138 279 271 018 151 921 154 005 305 927 147 167 151 373 298 540 131 080 131 818 262 898
20 – 24 123 761 133 898 257 658 123 392 132 418 255 810 138 244 137 149 275 393 143 916 138 564 282 479
25 – 29 113 193 119 158 232 351 108 196 121 706 229 902 107 552 113 483 221 034 127 562 124 106 251 668
30 – 34 111 791 107 846 219 637 98 504 110 031 208 535 98 561 99 060 197 621 104 015 101 725 205 740
35 – 39 100 552 89 377 189 929 92 286 102 258 194 544 91 453 100 433 191 887 85 947 93 033 178 980
40 – 44 80 985 73 877 154 862 80 011 85 462 165 473 88 394 90 845 179 239 75 420 85 958 161 378
45 – 49 62 389 57 600 119 989 64 403 71 458 135 861 76 352 75 715 152 068 67 441 79 549 146 990
50 – 54 46 099 44 676 90 775 50 234 55 166 105 400 62 201 70 550 132 751 57 753 67 577 125 330
55 – 59 33 071 36 347 69 419 36 240 41 070 77 309 48 745 54 309 103 054 45 029 57 394 102 422
60 – 64 24 446 35 343 59 789 27 251 36 115 63 367 30 738 39 509 70 247 33 403 44 631 78 033
65 – 69 18 340 25 465 43 804 19 920 31 059 50 979 22 298 33 516 55 814 22 383 31 718 54 101
70 – 74 11 835 17 169 29 004 13 634 21 754 35 388 14 714 27 236 41 950 15 040 25 044 40 084
75 – 79 8 973 15 415 24 388 7 886 13 276 21 162 8 916 15 475 24 391 9 062 18 396 27 459
80 – 84 3 956 8 247 12 203 5 290 11 288 16 578 5 029 9 935 14 964 4 929 10 826 15 755
85+ 2 868 6 376 9 244 2 825 7 487 10 312 4 304 10 571 14 875 3 855 9 502 13 357
Total 1 282 986 1 321 360 2 604 346 1 297 605 1 409 170 2 706 775 1 342 241 1 430 817 2 773 058 1 328 967 1 416 623 2 745 590
Statistics South Africa
Census 2011 Provinces at a glance
49
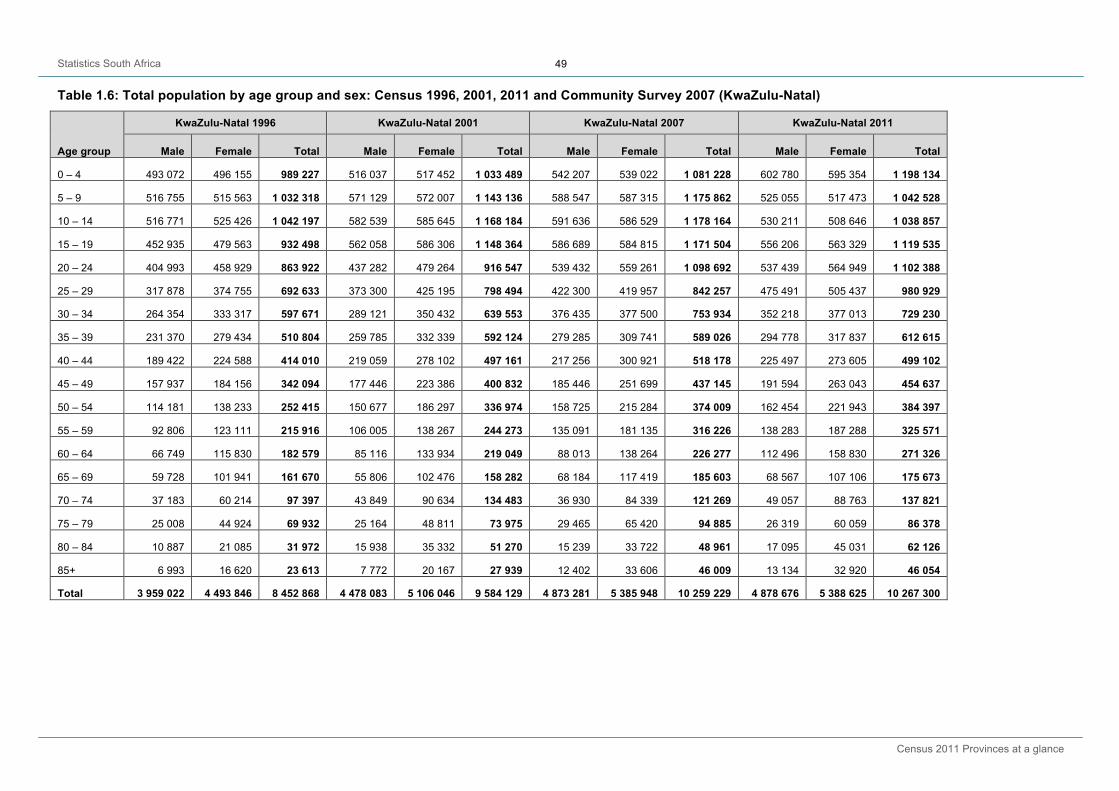
Table 1.6: Total population by age group and sex: Census 1996, 2001, 2011 and Community Survey 2007 (KwaZulu-Natal)
Age group
KwaZulu-Natal 1996 KwaZulu-Natal 2001 KwaZulu-Natal 2007 KwaZulu-Natal 2011
Male Female Total Male Female Total Male Female Total Male Female Total
0 – 4 493 072 496 155 989 227 516 037 517 452 1 033 489 542 207 539 022 1 081 228 602 780 595 354 1 198 134
5 – 9 516 755 515 563 1 032 318 571 129 572 007 1 143 136 588 547 587 315 1 175 862 525 055 517 473 1 042 528
10 – 14 516 771 525 426 1 042 197 582 539 585 645 1 168 184 591 636 586 529 1 178 164 530 211 508 646 1 038 857
15 – 19 452 935 479 563 932 498 562 058 586 306 1 148 364 586 689 584 815 1 171 504 556 206 563 329 1 119 535
20 – 24 404 993 458 929 863 922 437 282 479 264 916 547 539 432 559 261 1 098 692 537 439 564 949 1 102 388
25 – 29 317 878 374 755 692 633 373 300 425 195 798 494 422 300 419 957 842 257 475 491 505 437 980 929
30 – 34 264 354 333 317 597 671 289 121 350 432 639 553 376 435 377 500 753 934 352 218 377 013 729 230
35 – 39 231 370 279 434 510 804 259 785 332 339 592 124 279 285 309 741 589 026 294 778 317 837 612 615
40 – 44 189 422 224 588 414 010 219 059 278 102 497 161 217 256 300 921 518 178 225 497 273 605 499 102
45 – 49 157 937 184 156 342 094 177 446 223 386 400 832 185 446 251 699 437 145 191 594 263 043 454 637
50 – 54 114 181 138 233 252 415 150 677 186 297 336 974 158 725 215 284 374 009 162 454 221 943 384 397
55 – 59 92 806 123 111 215 916 106 005 138 267 244 273 135 091 181 135 316 226 138 283 187 288 325 571
60 – 64 66 749 115 830 182 579 85 116 133 934 219 049 88 013 138 264 226 277 112 496 158 830 271 326
65 – 69 59 728 101 941 161 670 55 806 102 476 158 282 68 184 117 419 185 603 68 567 107 106 175 673
70 – 74 37 183 60 214 97 397 43 849 90 634 134 483 36 930 84 339 121 269 49 057 88 763 137 821
75 – 79 25 008 44 924 69 932 25 164 48 811 73 975 29 465 65 420 94 885 26 319 60 059 86 378
80 – 84 10 887 21 085 31 972 15 938 35 332 51 270 15 239 33 722 48 961 17 095 45 031 62 126
85+ 6 993 16 620 23 613 7 772 20 167 27 939 12 402 33 606 46 009 13 134 32 920 46 054
Total 3 959 022 4 493 846 8 452 868 4 478 083 5 106 046 9 584 129 4 873 281 5 385 948 10 259 229 4 878 676 5 388 625 10 267 300
Statistics South Africa
Census 2011 Provinces at a glance
50
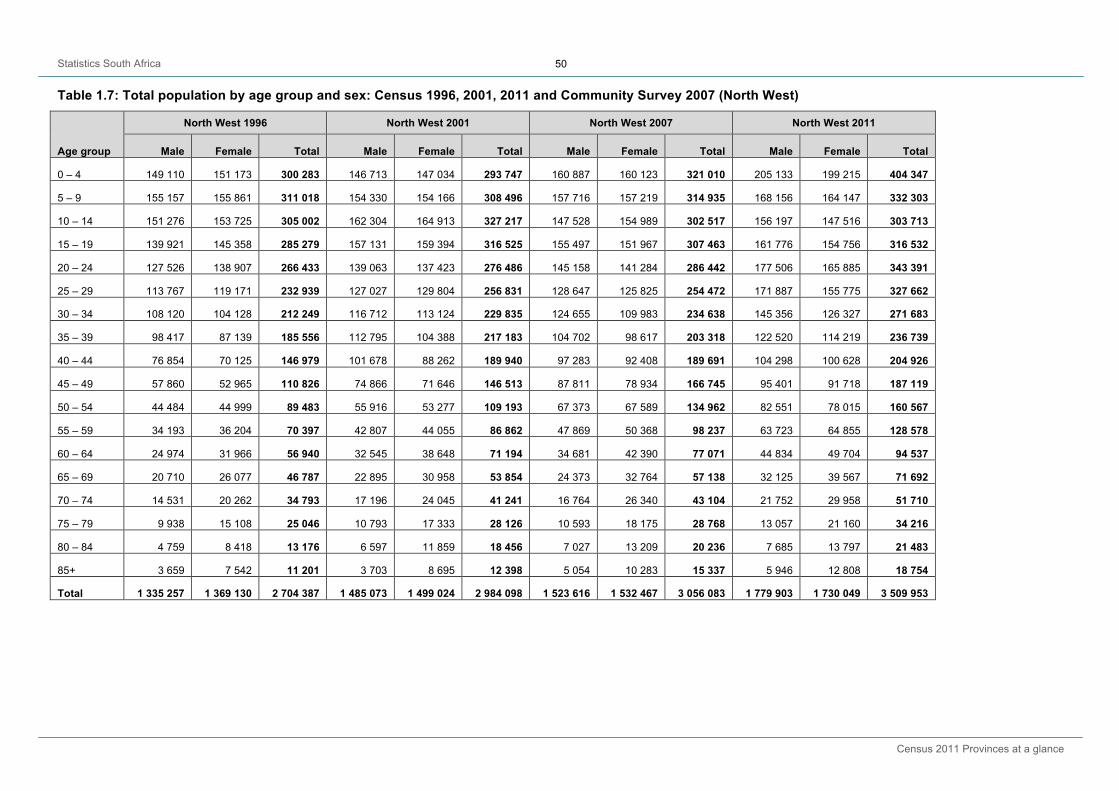
Table 1.7: Total population by age group and sex: Census 1996, 2001, 2011 and Community Survey 2007 (North West)
Age group
North West 1996 North West 2001 North West 2007 North West 2011
Male Female Total Male Female Total Male Female Total Male Female Total
0 – 4 149 110 151 173 300 283 146 713 147 034 293 747 160 887 160 123 321 010 205 133 199 215 404 347
5 – 9 155 157 155 861 311 018 154 330 154 166 308 496 157 716 157 219 314 935 168 156 164 147 332 303
10 – 14 151 276 153 725 305 002 162 304 164 913 327 217 147 528 154 989 302 517 156 197 147 516 303 713
15 – 19 139 921 145 358 285 279 157 131 159 394 316 525 155 497 151 967 307 463 161 776 154 756 316 532
20 – 24 127 526 138 907 266 433 139 063 137 423 276 486 145 158 141 284 286 442 177 506 165 885 343 391
25 – 29 113 767 119 171 232 939 127 027 129 804 256 831 128 647 125 825 254 472 171 887 155 775 327 662
30 – 34 108 120 104 128 212 249 116 712 113 124 229 835 124 655 109 983 234 638 145 356 126 327 271 683
35 – 39 98 417 87 139 185 556 112 795 104 388 217 183 104 702 98 617 203 318 122 520 114 219 236 739
40 – 44 76 854 70 125 146 979 101 678 88 262 189 940 97 283 92 408 189 691 104 298 100 628 204 926
45 – 49 57 860 52 965 110 826 74 866 71 646 146 513 87 811 78 934 166 745 95 401 91 718 187 119
50 – 54 44 484 44 999 89 483 55 916 53 277 109 193 67 373 67 589 134 962 82 551 78 015 160 567
55 – 59 34 193 36 204 70 397 42 807 44 055 86 862 47 869 50 368 98 237 63 723 64 855 128 578
60 – 64 24 974 31 966 56 940 32 545 38 648 71 194 34 681 42 390 77 071 44 834 49 704 94 537
65 – 69 20 710 26 077 46 787 22 895 30 958 53 854 24 373 32 764 57 138 32 125 39 567 71 692
70 – 74 14 531 20 262 34 793 17 196 24 045 41 241 16 764 26 340 43 104 21 752 29 958 51 710
75 – 79 9 938 15 108 25 046 10 793 17 333 28 126 10 593 18 175 28 768 13 057 21 160 34 216
80 – 84 4 759 8 418 13 176 6 597 11 859 18 456 7 027 13 209 20 236 7 685 13 797 21 483
85+ 3 659 7 542 11 201 3 703 8 695 12 398 5 054 10 283 15 337 5 946 12 808 18 754
Total 1 335 257 1 369 130 2 704 387 1 485 073 1 499 024 2 984 098 1 523 616 1 532 467 3 056 083 1 779 903 1 730 049 3 509 953

Statistics South Africa
Census 2011 Provinces at a glance
51
Table 1.8: Total population by age group and sex: Census 1996, 2001, 2011 and Community Survey 2007 (Gauteng)
Age group
Gauteng 1996 Gauteng 2001 Gauteng 2007 Gauteng 2011
Male Female Total Male Female Total Male Female Total Male Female Total
0 – 4 351 140 356 624 707 765 387 085 389 926 777 011 519 915 512 723 1 032 638 600 023 591 395 1 191 418
5 – 9 327 639 331 840 659 479 365 076 368 841 733 917 473 892 467 924 941 816 454 666 450 836 905 501
10 – 14 311 853 320 779 632 632 366 158 373 516 739 674 357 247 373 717 730 965 410 927 401 085 812 012
15 – 19 311 748 316 107 627 855 396 047 411 969 808 017 425 390 421 509 846 899 455 071 469 517 924 588
20 – 24 435 926 405 870 841 797 533 508 496 586 1 030 094 536 097 531 897 1 067 994 698 191 676 432 1 374 623
25 –29 465 748 411 669 877 417 579 975 520 159 1 100 134 573 649 527 365 1 101 014 774 154 706 693 1 480 847
30 – 34 408 694 367 881 776 575 484 805 440 146 924 951 536 411 494 878 1 031 289 656 232 568 539 1 224 772
35 – 39 355 694 315 348 671 042 419 851 397 394 817 245 451 205 442 518 893 724 535 571 476 450 1 012 021
40 – 44 280 244 252 090 532 335 350 555 336 498 687 053 382 393 381 620 764 013 421 125 398 728 819 854
45 – 49 213 705 188 512 402 217 261 486 264 052 525 538 320 686 325 683 646 369 335 440 347 652 683 092
50 – 54 152 321 143 793 296 115 197 963 194 293 392 256 246 277 261 589 507 867 273 421 289 430 562 852
55 – 59 111 550 111 015 222 566 134 381 141 079 275 460 184 719 191 516 376 235 210 817 227 584 438 401
60 – 64 73 514 88 682 162 196 94 751 111 651 206 402 116 937 130 211 247 149 145 613 164 061 309 674
65 – 69 54 546 68 840 123 386 58 384 79 244 137 628 79 634 103 459 183 093 90 748 110 880 201 628
70 – 74 35 205 48 116 83 321 40 974 60 001 100 975 50 892 74 985 125 877 60 255 82 654 142 909
75 – 79 24 053 36 066 60 119 24 854 39 135 63 989 30 728 52 224 82 952 34 074 55 282 89 355
80 – 84 10 991 20 536 31 526 15 822 27 298 43 120 17 282 31 400 48 682 19 443 36 017 55 460
85+ 7 147 14 795 21 942 7 789 17 603 25 392 13 065 25 865 38 930 14 104 29 151 43 255
Total 3 931 720 3 798 565 7 730 285 4 719 462 4 669 393 9 388 854 5 316 421 5 351 084 10 667 505 6 189 875 6 082 388 12 272 263

Statistics South Africa
Census 2011 Provinces at a glance
52
Table 1.9: Total population by age group and sex: Census 1996, 2001, 2011 and Community Survey 2007 (Mpumalanga)
Age group
Mpumalanga 1996 Mpumalanga 2001 Mpumalanga 2007 Mpumalanga 2011
Male Female Total Male Female Total Male Female Total Male Female Total
0 – 4 180 857 185 880 366 736 188 085 191 603 379 688 200 254 198 949 399 202 231 816 229 743 461 559
5 – 9 193 842 197 039 390 880 200 204 203 558 403 762 207 036 207 083 414 120 201 771 201 000 402 772
10 – 14 190 257 195 907 386 164 209 840 213 141 422 980 200 933 205 407 406 340 201 016 195 331 396 348
15 – 19 168 376 175 598 343 973 200 918 205 743 406 661 204 339 208 343 412 682 211 495 212 784 424 278
20 – 24 147 073 164 487 311 559 152 420 165 600 318 020 186 685 182 348 369 033 217 232 210 308 427 541
25 – 29 122 645 139 432 262 077 129 087 150 985 280 072 152 992 148 972 301 964 199 113 193 983 393 096
30 – 34 107 676 119 596 227 272 107 013 126 985 233 998 136 080 133 454 269 534 150 009 147 554 297 563
35 – 39 93 375 95 425 188 800 99 387 115 538 214 925 106 701 123 213 229 913 124 064 131 844 255 908
40 – 44 74 108 77 711 151 819 82 470 90 110 172 580 89 526 107 147 196 673 102 006 114 833 216 839
45 – 49 56 087 55 981 112 068 66 543 74 969 141 512 80 143 87 647 167 790 88 844 104 995 193 839
50 – 54 39 277 40 906 80 183 50 431 54 779 105 210 63 214 71 959 135 172 73 536 83 144 156 680
55 – 59 31 225 37 114 68 339 34 912 39 131 74 044 48 335 54 650 102 985 59 683 69 678 129 362
60 – 64 20 913 32 789 53 702 28 345 39 541 67 886 30 358 41 162 71 520 42 761 51 681 94 442
65 – 69 20 976 30 992 51 968 17 747 29 679 47 426 26 626 37 875 64 501 27 053 37 163 64 216
70 – 74 13 136 16 557 29 693 15 819 27 349 43 168 14 218 24 561 38 779 19 907 31 856 51 763
75 – 79 11 407 16 045 27 452 8 993 13 338 22 331 10 938 19 988 30 925 10 463 20 752 31 215
80 – 84 4 611 6 674 11 284 7 322 12 709 20 030 5 176 9 602 14 778 7 273 16 277 23 550
85+ 3 138 5 504 8 643 3 837 7 423 11 260 5 874 11 721 17 595 6 014 12 956 18 970
Total 1 478 977 1 593 637 3 072 614 1 603 374 1 762 180 3 365 554 1 769 427 1 874 080 3 643 507 1 974 055 2 065 883 4 039 939

Statistics South Africa
Census 2011 Provinces at a glance
53
Table 1.10: Total population by age group and sex: Census 1996, 2001, 2011 and Community Survey 2007 (Limpopo)
Age group
Limpopo 1996 Limpopo 2001 Limpopo 2007 Limpopo 2011
Male Female Total Male Female Total Male Female Total Male Female Total
0 – 4 298 166 304 150 602 316 282 677 285 051 567 728 303 773 302 137 605 909 341 358 338 805 680 163
5 – 9 333 093 335 963 669 057 337 409 339 493 676 902 328 475 327 446 655 921 292 728 291 236 583 964
10 – 14 325 908 329 184 655 093 351 274 355 933 707 207 332 247 341 884 674 130 293 085 277 799 570 885
15 – 19 271 495 277 794 549 289 324 731 330 511 655 242 339 326 330 982 670 308 318 392 308 942 627 334
20 – 24 192 784 224 676 417 461 208 137 242 672 450 809 230 361 255 594 485 955 274 981 272 584 547 565
25 – 29 128 934 169 417 298 351 146 691 202 931 349 623 166 003 185 439 351 442 207 713 234 175 441 889
30 – 34 104 167 152 652 256 819 117 146 165 044 282 190 152 819 174 876 327 694 156 382 187 457 343 839
35 – 39 89 468 126 324 215 793 105 710 157 464 263 173 118 572 157 355 275 927 128 559 171 681 300 239
40 – 44 72 188 103 041 175 229 88 726 128 515 217 241 95 807 149 149 244 956 107 979 147 744 255 723
45 – 49 58 519 81 423 139 942 73 925 108 488 182 413 81 805 121 815 203 620 95 571 140 743 236 314
50 – 54 42 945 61 875 104 820 61 365 84 085 145 450 67 742 97 563 165 304 78 302 112 691 190 994
55 – 59 37 991 61 795 99 786 44 670 61 686 106 356 55 285 78 134 133 419 66 759 91 836 158 595
60 – 64 28 262 61 169 89 431 39 999 67 206 107 205 41 415 67 840 109 255 53 471 75 476 128 946
65 – 69 30 485 63 117 93 602 28 786 59 858 88 644 41 413 66 088 107 501 37 267 63 755 101 022
70 – 74 19 750 33 729 53 479 26 054 58 161 84 215 25 513 55 084 80 597 32 523 55 135 87 658
75 – 79 17 752 34 677 52 429 15 194 28 471 43 665 18 780 52 054 70 834 17 028 42 965 59 993
80 – 84 7 718 14 781 22 499 12 098 28 818 40 916 8 281 23 980 32 260 11 935 35 959 47 895
85+ 5 929 14 137 20 066 7 218 19 265 26 484 11 250 32 002 43 252 10 100 31 748 41 848
Total 2 065 555 2 449 905 4 515 460 2 271 809 2 723 653 4 995 462 2 418 866 2 819 419 5 238 285 2 524 136 2 880 732 5 404 868
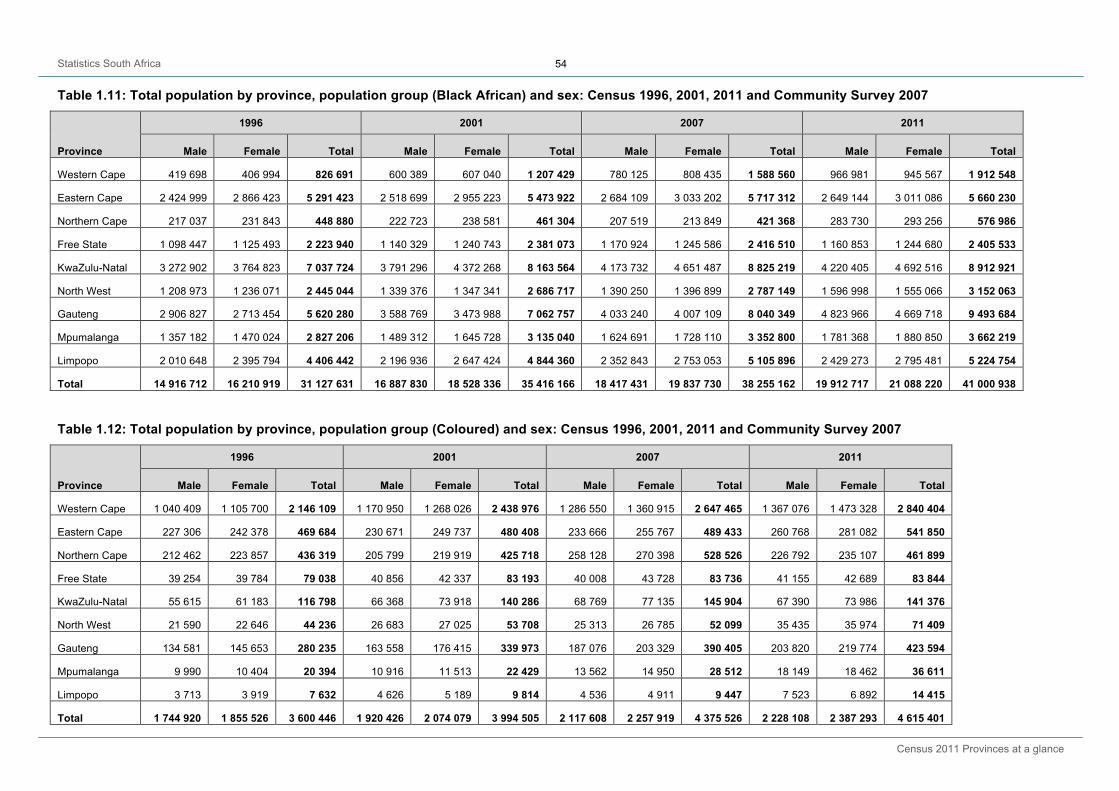
Statistics South Africa
Census 2011 Provinces at a glance
54
Table 1.11: Total population by province, population group (Black African) and sex: Census 1996, 2001, 2011 and Community Survey 2007
Province
1996 2001 2007 2011
Male Female Total Male Female Total Male Female Total Male Female Total
Western Cape 419 698 406 994 826 691 600 389 607 040 1 207 429 780 125 808 435 1 588 560 966 981 945 567 1 912 548
Eastern Cape 2 424 999 2 866 423 5 291 423 2 518 699 2 955 223 5 473 922 2 684 109 3 033 202 5 717 312 2 649 144 3 011 086 5 660 230
Northern Cape 217 037 231 843 448 880 222 723 238 581 461 304 207 519 213 849 421 368 283 730 293 256 576 986
Free State 1 098 447 1 125 493 2 223 940 1 140 329 1 240 743 2 381 073 1 170 924 1 245 586 2 416 510 1 160 853 1 244 680 2 405 533
KwaZulu-Natal 3 272 902 3 764 823 7 037 724 3 791 296 4 372 268 8 163 564 4 173 732 4 651 487 8 825 219 4 220 405 4 692 516 8 912 921
North West 1 208 973 1 236 071 2 445 044 1 339 376 1 347 341 2 686 717 1 390 250 1 396 899 2 787 149 1 596 998 1 555 066 3 152 063
Gauteng 2 906 827 2 713 454 5 620 280 3 588 769 3 473 988 7 062 757 4 033 240 4 007 109 8 040 349 4 823 966 4 669 718 9 493 684
Mpumalanga 1 357 182 1 470 024 2 827 206 1 489 312 1 645 728 3 135 040 1 624 691 1 728 110 3 352 800 1 781 368 1 880 850 3 662 219
Limpopo 2 010 648 2 395 794 4 406 442 2 196 936 2 647 424 4 844 360 2 352 843 2 753 053 5 105 896 2 429 273 2 795 481 5 224 754
Total 14 916 712 16 210 919 31 127 631 16 887 830 18 528 336 35 416 166 18 417 431 19 837 730 38 255 162 19 912 717 21 088 220 41 000 938
Table 1.12: Total population by province, population group (Coloured) and sex: Census 1996, 2001, 2011 and Community Survey 2007
Province
1996 2001 2007 2011
Male Female Total Male Female Total Male Female Total Male Female Total
Western Cape 1 040 409 1 105 700 2 146 109 1 170 950 1 268 026 2 438 976 1 286 550 1 360 915 2 647 465 1 367 076 1 473 328 2 840 404
Eastern Cape 227 306 242 378 469 684 230 671 249 737 480 408 233 666 255 767 489 433 260 768 281 082 541 850
Northern Cape 212 462 223 857 436 319 205 799 219 919 425 718 258 128 270 398 528 526 226 792 235 107 461 899
Free State 39 254 39 784 79 038 40 856 42 337 83 193 40 008 43 728 83 736 41 155 42 689 83 844
KwaZulu-Natal 55 615 61 183 116 798 66 368 73 918 140 286 68 769 77 135 145 904 67 390 73 986 141 376
North West 21 590 22 646 44 236 26 683 27 025 53 708 25 313 26 785 52 099 35 435 35 974 71 409
Gauteng 134 581 145 653 280 235 163 558 176 415 339 973 187 076 203 329 390 405 203 820 219 774 423 594
Mpumalanga 9 990 10 404 20 394 10 916 11 513 22 429 13 562 14 950 28 512 18 149 18 462 36 611
Limpopo 3 713 3 919 7 632 4 626 5 189 9 814 4 536 4 911 9 447 7 523 6 892 14 415
Total 1 744 920 1 855 526 3 600 446 1 920 426 2 074 079 3 994 505 2 117 608 2 257 919 4 375 526 2 228 108 2 387 293 4 615 401
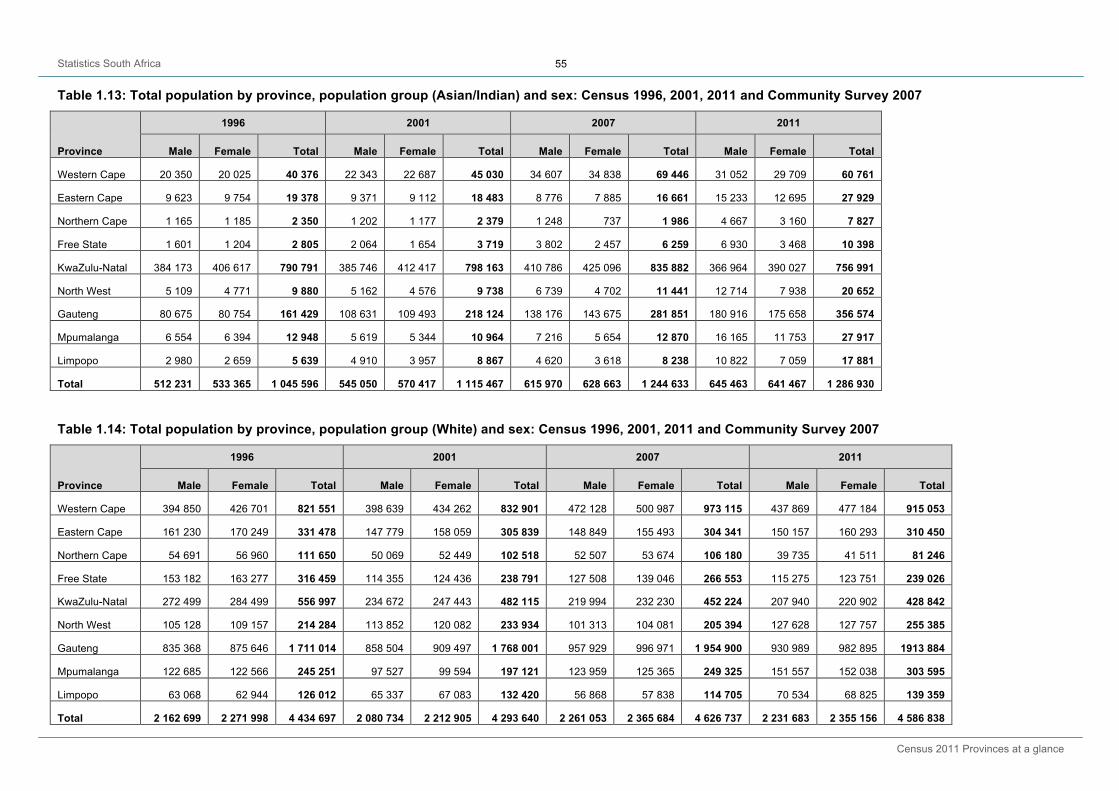
Statistics South Africa
Census 2011 Provinces at a glance
55
Table 1.13: Total population by province, population group (Asian/Indian) and sex: Census 1996, 2001, 2011 and Community Survey 2007
Province
1996 2001 2007 2011
Male Female Total Male Female Total Male Female Total Male Female Total
Western Cape 20 350 20 025 40 376 22 343 22 687 45 030 34 607 34 838 69 446 31 052 29 709 60 761
Eastern Cape 9 623 9 754 19 378 9 371 9 112 18 483 8 776 7 885 16 661 15 233 12 695 27 929
Northern Cape 1 165 1 185 2 350 1 202 1 177 2 379 1 248 737 1 986 4 667 3 160 7 827
Free State 1 601 1 204 2 805 2 064 1 654 3 719 3 802 2 457 6 259 6 930 3 468 10 398
KwaZulu-Natal 384 173 406 617 790 791 385 746 412 417 798 163 410 786 425 096 835 882 366 964 390 027 756 991
North West 5 109 4 771 9 880 5 162 4 576 9 738 6 739 4 702 11 441 12 714 7 938 20 652
Gauteng 80 675 80 754 161 429 108 631 109 493 218 124 138 176 143 675 281 851 180 916 175 658 356 574
Mpumalanga 6 554 6 394 12 948 5 619 5 344 10 964 7 216 5 654 12 870 16 165 11 753 27 917
Limpopo 2 980 2 659 5 639 4 910 3 957 8 867 4 620 3 618 8 238 10 822 7 059 17 881
Total 512 231 533 365 1 045 596 545 050 570 417 1 115 467 615 970 628 663 1 244 633 645 463 641 467 1 286 930
Table 1.14: Total population by province, population group (White) and sex: Census 1996, 2001, 2011 and Community Survey 2007
Province
1996 2001 2007 2011
Male Female Total Male Female Total Male Female Total Male Female Total
Western Cape 394 850 426 701 821 551 398 639 434 262 832 901 472 128 500 987 973 115 437 869 477 184 915 053
Eastern Cape 161 230 170 249 331 478 147 779 158 059 305 839 148 849 155 493 304 341 150 157 160 293 310 450
Northern Cape 54 691 56 960 111 650 50 069 52 449 102 518 52 507 53 674 106 180 39 735 41 511 81 246
Free State 153 182 163 277 316 459 114 355 124 436 238 791 127 508 139 046 266 553 115 275 123 751 239 026
KwaZulu-Natal 272 499 284 499 556 997 234 672 247 443 482 115 219 994 232 230 452 224 207 940 220 902 428 842
North West 105 128 109 157 214 284 113 852 120 082 233 934 101 313 104 081 205 394 127 628 127 757 255 385
Gauteng 835 368 875 646 1 711 014 858 504 909 497 1 768 001 957 929 996 971 1 954 900 930 989 982 895 1913 884
Mpumalanga 122 685 122 566 245 251 97 527 99 594 197 121 123 959 125 365 249 325 151 557 152 038 303 595
Limpopo 63 068 62 944 126 012 65 337 67 083 132 420 56 868 57 838 114 705 70 534 68 825 139 359
Total 2 162 699 2 271 998 4 434 697 2 080 734 2 212 905 4 293 640 2 261 053 2 365 684 4 626 737 2 231 683 2 355 156 4 586 838

Statistics South Africa
Census 2011 Provinces at a glance
56
Table 1.15: Total population by province, marital status (Married) and sex: Census 1996, 2001, 2011 and Community Survey 2007
Province
1996 2001 2007 2011
Male Female Total Male Female Total Male Female Total Male Female Total
Western Cape 604 384 600 665 1 205 049 686 807 682 035 1 368 842 790 306 771 107 1 561 413 890 991 876 239 1 767 230
Eastern Cape 111 072 119 784 230 856 109 087 114 210 223 297 119 352 119 772 239 124 629 059 765 020 1 394 078
Northern Cape 558 248 796 357 1 354 605 579 593 747 388 1 326 982 564 982 684 883 1 249 865 122 690 124 393 247 083
Free State 405 130 375 758 780 888 354 747 362 541 717 288 357 869 337 801 695 670 311 802 317 829 629 631
KwaZulu-Natal 792 295 985 941 1 778 235 351 999 324 136 676 134 780 838 903 690 1 684 528 893 019 1 032 908 1 925 927
North West 322 977 321 117 644 094 807 545 953 852 1 761 397 324 266 290 493 614 759 390 989 350 899 741 889
Gauteng 1280 299 1 125 685 2 405 984 1 420 321 1 270 567 2 690 888 1 515 631 1 385 437 2 901 068 1 689 709 1 565 260 3 254 970
Mpumalanga 341 722 383 932 725 654 325 042 361 902 686 944 347 428 358 365 705 793 376 743 388 226 764 968
Limpopo 409 982 613 901 1 023 882 457 604 618 114 1 075 718 473 464 599 174 1 072 638 475 393 582 654 1 058 047
South Africa 4 826 110 5 323 138 10 149 247 3 362 511 3 528 571 6 891 081 5 274 135 5 450 723 10 724 858 5 780 394 6 003 427 11 783 822
Table 1.16: Total population by province, marital status (Widowed) and sex: Census 1996, 2001, 2011 and Community Survey 2007
Province
1996 2001 2007 2011
Male Female Total Male Female Total Male Female Total Male Female Total
Western Cape 24 456 111 150 135 606 30 956 138 819 169 776 33 598 147 748 181 347 37 920 162 538 200 459
Eastern Cape 6 624 27 934 34 559 7 876 33 760 41 636 8 639 38 804 47 443 47 167 274 593 321 761
Northern Cape 30 104 192 645 222 749 40 505 271 753 312 258 50 687 305 793 356 480 9 013 34 631 43 644
Free State 18 311 85 235 103 545 23 095 106 786 129 882 32 670 127 518 160 188 26 536 110 661 137 197
KwaZulu-Natal 31 874 215 524 247 398 20 636 93 524 114 160 51 022 362 518 413 539 39 319 260 938 300 257
North West 14 187 67 336 81 523 42 753 332 571 375 323 24 578 96 901 121 479 24 580 95 275 119 855
Gauteng 39 671 202 266 241 938 51 282 263 195 314 478 63 284 280 677 343 960 63 572 282 142 345 714
Mpumalanga 13 577 69 305 82 883 16 438 100 186 116 624 22 583 117 899 140 482 20 337 103 624 123 961
Limpopo 13 611 134 575 148 186 19 606 209 440 229 046 25 411 230 345 255 756 25 561 208 606 234 167
South Africa 192 416 1 105 971 1 298 387 150 715 998 916 1 149 631 312 471 1 708 203 2 020 674 294 006 1 533 008 1 827 014
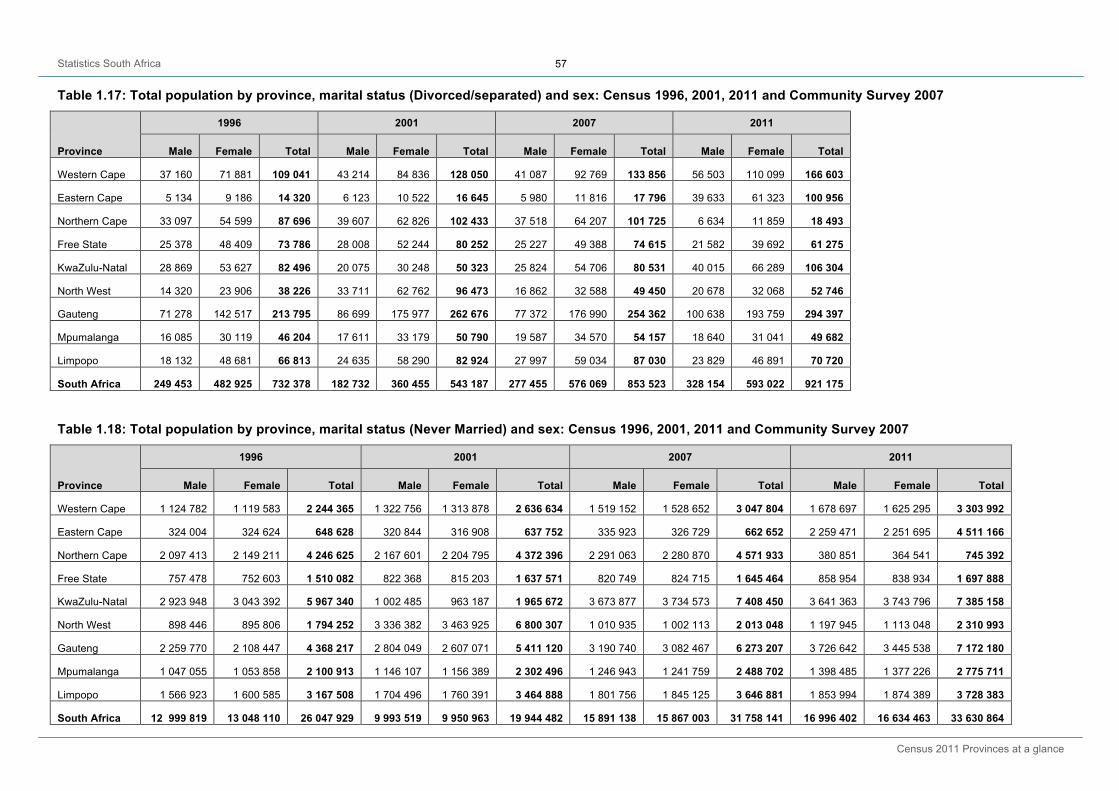
Statistics South Africa
Census 2011 Provinces at a glance
57
Table 1.17: Total population by province, marital status (Divorced/separated) and sex: Census 1996, 2001, 2011 and Community Survey 2007
Province
1996 2001 2007 2011
Male Female Total Male Female Total Male Female Total Male Female Total
Western Cape 37 160 71 881 109 041 43 214 84 836 128 050 41 087 92 769 133 856 56 503 110 099 166 603
Eastern Cape 5 134 9 186 14 320 6 123 10 522 16 645 5 980 11 816 17 796 39 633 61 323 100 956
Northern Cape 33 097 54 599 87 696 39 607 62 826 102 433 37 518 64 207 101 725 6 634 11 859 18 493
Free State 25 378 48 409 73 786 28 008 52 244 80 252 25 227 49 388 74 615 21 582 39 692 61 275
KwaZulu-Natal 28 869 53 627 82 496 20 075 30 248 50 323 25 824 54 706 80 531 40 015 66 289 106 304
North West 14 320 23 906 38 226 33 711 62 762 96 473 16 862 32 588 49 450 20 678 32 068 52 746
Gauteng 71 278 142 517 213 795 86 699 175 977 262 676 77 372 176 990 254 362 100 638 193 759 294 397
Mpumalanga 16 085 30 119 46 204 17 611 33 179 50 790 19 587 34 570 54 157 18 640 31 041 49 682
Limpopo 18 132 48 681 66 813 24 635 58 290 82 924 27 997 59 034 87 030 23 829 46 891 70 720
South Africa 249 453 482 925 732 378 182 732 360 455 543 187 277 455 576 069 853 523 328 154 593 022 921 175
Table 1.18: Total population by province, marital status (Never Married) and sex: Census 1996, 2001, 2011 and Community Survey 2007
Province
1996 2001 2007 2011
Male Female Total Male Female Total Male Female Total Male Female Total
Western Cape 1 124 782 1 119 583 2 244 365 1 322 756 1 313 878 2 636 634 1 519 152 1 528 652 3 047 804 1 678 697 1 625 295 3 303 992
Eastern Cape 324 004 324 624 648 628 320 844 316 908 637 752 335 923 326 729 662 652 2 259 471 2 251 695 4 511 166
Northern Cape 2 097 413 2 149 211 4 246 625 2 167 601 2 204 795 4 372 396 2 291 063 2 280 870 4 571 933 380 851 364 541 745 392
Free State 757 478 752 603 1 510 082 822 368 815 203 1 637 571 820 749 824 715 1 645 464 858 954 838 934 1 697 888
KwaZulu-Natal 2 923 948 3 043 392 5 967 340 1 002 485 963 187 1 965 672 3 673 877 3 734 573 7 408 450 3 641 363 3 743 796 7 385 158
North West 898 446 895 806 1 794 252 3 336 382 3 463 925 6 800 307 1 010 935 1 002 113 2 013 048 1 197 945 1 113 048 2 310 993
Gauteng 2 259 770 2 108 447 4 368 217 2 804 049 2 607 071 5 411 120 3 190 740 3 082 467 6 273 207 3 726 642 3 445 538 7 172 180
Mpumalanga 1 047 055 1 053 858 2 100 913 1 146 107 1 156 389 2 302 496 1 246 943 1 241 759 2 488 702 1 398 485 1 377 226 2 775 711
Limpopo 1 566 923 1 600 585 3 167 508 1 704 496 1 760 391 3 464 888 1 801 756 1 845 125 3 646 881 1 853 994 1 874 389 3 728 383
South Africa 12 999 819 13 048 110 26 047 929 9 993 519 9 950 963 19 944 482 15 891 138 15 867 003 31 758 141 16 996 402 16 634 463 33 630 864

Statistics South Africa
Census 2011 Provinces at a glance
58
Table 1.19: Total population by province, marital status (Living together) and sex: Census 1996, 2001, 2011 and Community Survey 2007
Province
1996 2001 2007 2011
Male Female Total Male Female Total Male Female Total Male Female Total
Western Cape 59 932 60 571 120 504 108 587 112 447 221 033 126 112 120 728 246 840 194 396 190 056 384 452
Eastern Cape 24 752 25 054 49 806 35 863 36 727 72 590 36 262 34 360 70 621 114 370 119 721 234 091
Northern Cape 49 240 52 846 102 086 79 214 85 369 164 583 86 247 81 609 167 856 45 783 45 465 91 248
Free State 48 516 47 510 96 026 69 387 72 396 141 783 75 081 74 422 149 503 110 093 109 506 219 599
KwaZulu-Natal 134 567 164 978 299 545 89 879 87 929 177 808 277 257 288 264 565 521 264 960 284 694 549 654
North West 46 797 48 692 95 489 257 692 292 937 550 629 97 906 96 441 194 347 145 710 138 760 284 469
Gauteng 176 422 176 403 352 825 357 109 352 583 709 692 380 030 371 376 751 406 609 314 595 688 1 205 002
Mpumalanga 53 424 58 420 111 844 98 176 110 524 208 700 109 607 110 315 219 922 159 851 165 766 325 617
Limpopo 27 524 32 850 60 375 65 468 77 418 142 886 61 854 65 222 127 076 145 359 168 192 313 551
South Africa 621 174 667 325 1 288 499 868 324 921 391 1 789 715 1 250 356 1 242 737 2 493 093 1 789 835 1 817 849 3 607 684
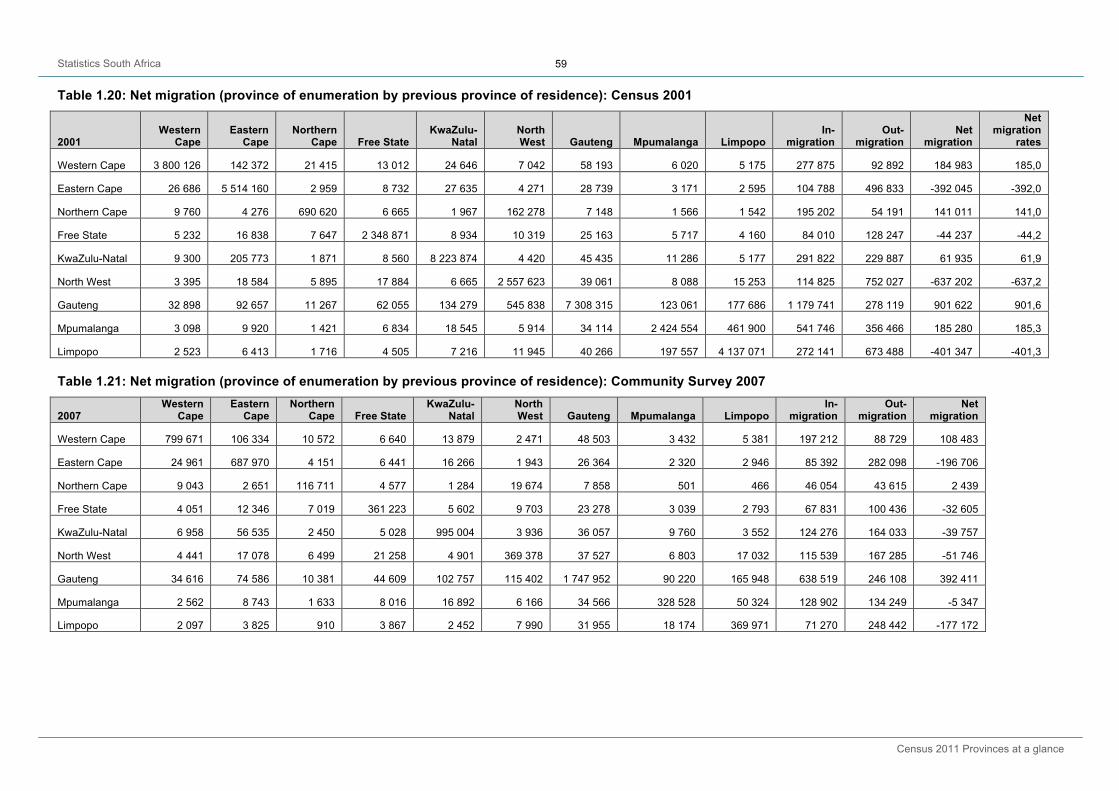
Statistics South Africa
Census 2011 Provinces at a glance
59
Table 1.20: Net migration (province of enumeration by previous province of residence): Census 2001
2001 Western
Cape Eastern
Cape Northern
Cape Free State KwaZulu-
Natal North West Gauteng Mpumalanga Limpopo
In- migration
Out- migration
Net migration
Net migration
rates
Western Cape 3 800 126 142 372 21 415 13 012 24 646 7 042 58 193 6 020 5 175 277 875 92 892 184 983 185,0
Eastern Cape 26 686 5 514 160 2 959 8 732 27 635 4 271 28 739 3 171 2 595 104 788 496 833 -392 045 -392,0
Northern Cape 9 760 4 276 690 620 6 665 1 967 162 278 7 148 1 566 1 542 195 202 54 191 141 011 141,0
Free State 5 232 16 838 7 647 2 348 871 8 934 10 319 25 163 5 717 4 160 84 010 128 247 -44 237 -44,2
KwaZulu-Natal 9 300 205 773 1 871 8 560 8 223 874 4 420 45 435 11 286 5 177 291 822 229 887 61 935 61,9
North West 3 395 18 584 5 895 17 884 6 665 2 557 623 39 061 8 088 15 253 114 825 752 027 -637 202 -637,2
Gauteng 32 898 92 657 11 267 62 055 134 279 545 838 7 308 315 123 061 177 686 1 179 741 278 119 901 622 901,6
Mpumalanga 3 098 9 920 1 421 6 834 18 545 5 914 34 114 2 424 554 461 900 541 746 356 466 185 280 185,3
Limpopo 2 523 6 413 1 716 4 505 7 216 11 945 40 266 197 557 4 137 071 272 141 673 488 -401 347 -401,3 Table 1.21: Net migration (province of enumeration by previous province of residence): Community Survey 2007
2007 Western
Cape Eastern
Cape Northern
Cape Free State KwaZulu-
Natal North West Gauteng Mpumalanga Limpopo
In- migration
Out- migration
Net migration
Western Cape 799 671 106 334 10 572 6 640 13 879 2 471 48 503 3 432 5 381 197 212 88 729 108 483
Eastern Cape 24 961 687 970 4 151 6 441 16 266 1 943 26 364 2 320 2 946 85 392 282 098 -196 706
Northern Cape 9 043 2 651 116 711 4 577 1 284 19 674 7 858 501 466 46 054 43 615 2 439
Free State 4 051 12 346 7 019 361 223 5 602 9 703 23 278 3 039 2 793 67 831 100 436 -32 605
KwaZulu-Natal 6 958 56 535 2 450 5 028 995 004 3 936 36 057 9 760 3 552 124 276 164 033 -39 757
North West 4 441 17 078 6 499 21 258 4 901 369 378 37 527 6 803 17 032 115 539 167 285 -51 746
Gauteng 34 616 74 586 10 381 44 609 102 757 115 402 1 747 952 90 220 165 948 638 519 246 108 392 411
Mpumalanga 2 562 8 743 1 633 8 016 16 892 6 166 34 566 328 528 50 324 128 902 134 249 -5 347
Limpopo 2 097 3 825 910 3 867 2 452 7 990 31 955 18 174 369 971 71 270 248 442 -177 172
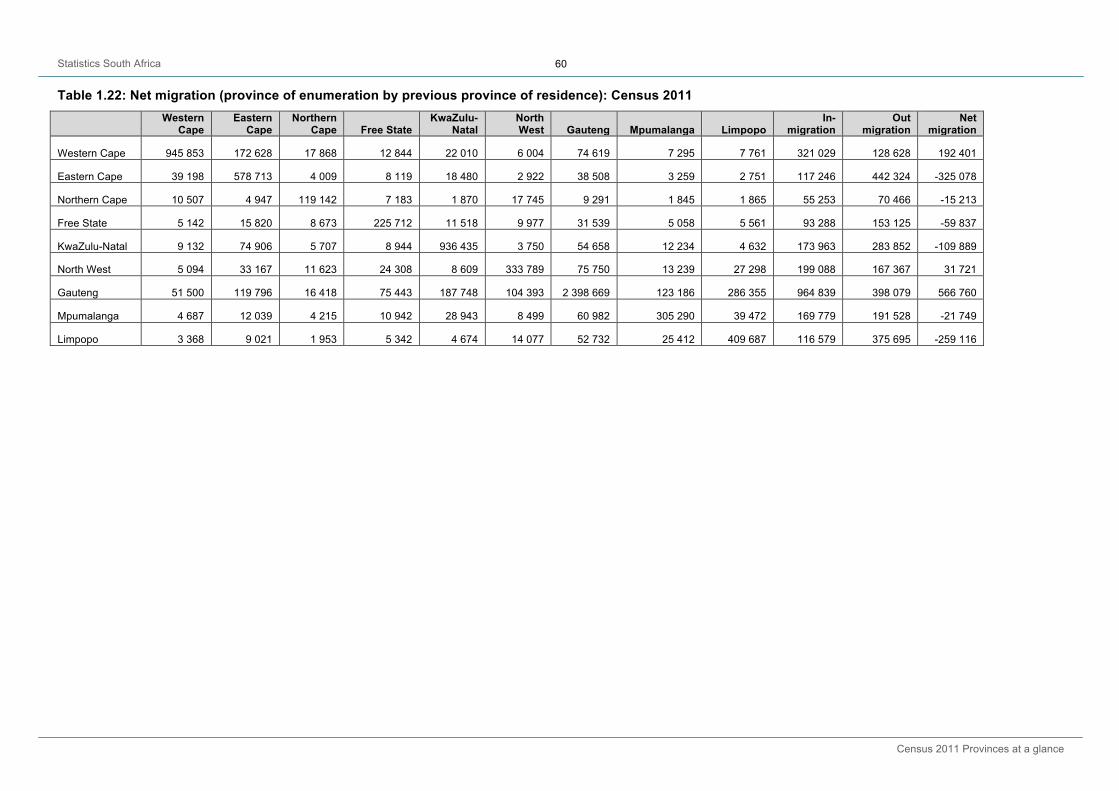
Statistics South Africa
Census 2011 Provinces at a glance
60
Table 1.22: Net migration (province of enumeration by previous province of residence): Census 2011
Western
Cape Eastern
Cape Northern
Cape Free State KwaZulu-
Natal North West Gauteng Mpumalanga Limpopo
In- migration
Out migration
Net migration
Western Cape 945 853 172 628 17 868 12 844 22 010 6 004 74 619 7 295 7 761 321 029 128 628 192 401
Eastern Cape 39 198 578 713 4 009 8 119 18 480 2 922 38 508 3 259 2 751 117 246 442 324 -325 078
Northern Cape 10 507 4 947 119 142 7 183 1 870 17 745 9 291 1 845 1 865 55 253 70 466 -15 213
Free State 5 142 15 820 8 673 225 712 11 518 9 977 31 539 5 058 5 561 93 288 153 125 -59 837
KwaZulu-Natal 9 132 74 906 5 707 8 944 936 435 3 750 54 658 12 234 4 632 173 963 283 852 -109 889
North West 5 094 33 167 11 623 24 308 8 609 333 789 75 750 13 239 27 298 199 088 167 367 31 721
Gauteng 51 500 119 796 16 418 75 443 187 748 104 393 2 398 669 123 186 286 355 964 839 398 079 566 760
Mpumalanga 4 687 12 039 4 215 10 942 28 943 8 499 60 982 305 290 39 472 169 779 191 528 -21 749
Limpopo 3 368 9 021 1 953 5 342 4 674 14 077 52 732 25 412 409 687 116 579 375 695 -259 116

Statistics South Africa
Census 2011 Provinces at a glance
61
Table 2.1: Level of education for those aged 20 years and older by sex: Census 1996, 2001, 2011 and Community Survey 2007
South Africa
1996 2001 2007 2011
Male Female Total Male Female Total Male Female Total Male Female Total
No schooling 1 683 975 2 371 671 4 055 646 1 830 254 2 737 244 4 567 498 1 002 535 1 670 011 2 672 546 1 051 871 1 614 003 2 665 874
Some primary 1 689 330 1 833 625 3 522 955 1 958 814 2 124 928 4 083 742 2 168 229 2 429 095 4 597 324 1 778 086 2 012 048 3 790 134
Completed primary 715 010 856 765 1 571 775 752 996 870 471 1 623 467 752 927 880 010 1 632 937 660 846 753 049 1 413 895
Some secondary 3 348 017 3 782 104 7 130 121 3 697 317 4 148 808 7 846 125 5 199 092 5 838 582 11 037 674 5 066 815 5 414 762 10 481 577
Grade 12 / Std 10 1 660 999 1 797 435 3 458 434 2 539 565 2 661 036 5 200 601 2 523 589 2 593 476 5 117 065 4 335 895 4 583 713 8 919 608
Higher 780 229 732 373 1 512 602 1 033 524 1 117 811 2 151 335 1 223 777 1 277 243 2 501 020 1 708 194 1 936 423 3 644 617
Total 9 877 560 11 373 973 21 251 533 11 812 470 13 660 298 25 472 768 12 870 149 14 688 417 27 558 566 14 601 707 16 313 998 30 915 705
Table 2.2: Level of education for those aged 20 years and older by sex: Census 1996, 2001, 2011 and Community Survey 2007 (Western Cape)
Western Cape
1996 2001 2007 2011
Male Female Total Male Female Total Male Female Total Male Female Total
No schooling 77 368 74 864 152 232 80 522 82 259 162 781 46 057 48 666 94 723 52 201 50 041 102 242
Some primary 183 568 179 594 363 162 217 116 214 582 431 698 231 043 225 730 456 773 201 337 200 025 401 362
Completed primary 92 159 112 252 204 411 102 503 122 025 224 528 99 059 122 194 221 253 98 149 110 649 208 798
Some secondary 421 441 479 755 901 196 483 928 554 182 1 038 110 680 818 775 516 1 456 334 692 658 738 251 1 430 909
Grade 12 / Std 10 202 738 232 882 435 620 314 048 351 093 665 141 313 879 344 585 658 464 506 754 561 915 1 068 669
Higher 137 490 128 873 266 363 156 710 162 419 319 129 199 208 194 480 393 688 253 978 272 622 526 600
Total 1 114 763 1 208 221 2 322 984 1 354 827 1 486 560 2 841 387 1 570 064 1 711 171 3 281 235 1 805 077 1 933 503 3 738 580
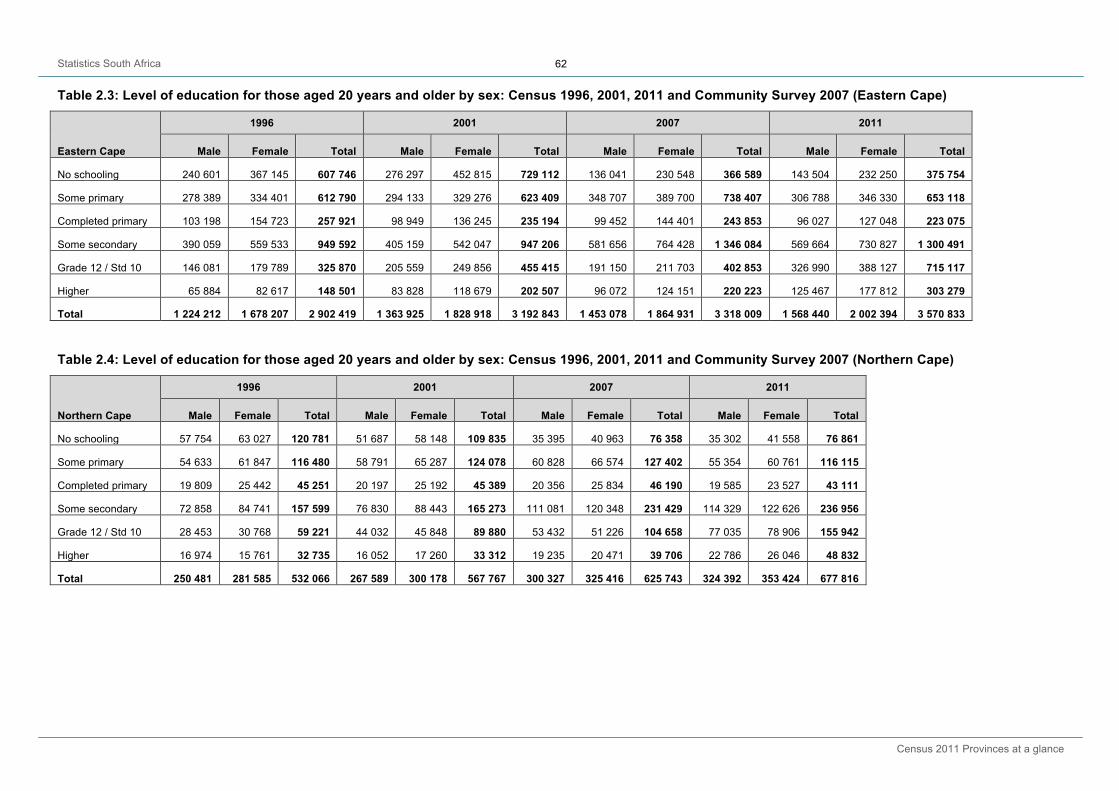
Statistics South Africa
Census 2011 Provinces at a glance
62
Table 2.3: Level of education for those aged 20 years and older by sex: Census 1996, 2001, 2011 and Community Survey 2007 (Eastern Cape)
Eastern Cape
1996 2001 2007 2011
Male Female Total Male Female Total Male Female Total Male Female Total
No schooling 240 601 367 145 607 746 276 297 452 815 729 112 136 041 230 548 366 589 143 504 232 250 375 754
Some primary 278 389 334 401 612 790 294 133 329 276 623 409 348 707 389 700 738 407 306 788 346 330 653 118
Completed primary 103 198 154 723 257 921 98 949 136 245 235 194 99 452 144 401 243 853 96 027 127 048 223 075
Some secondary 390 059 559 533 949 592 405 159 542 047 947 206 581 656 764 428 1 346 084 569 664 730 827 1 300 491
Grade 12 / Std 10 146 081 179 789 325 870 205 559 249 856 455 415 191 150 211 703 402 853 326 990 388 127 715 117
Higher 65 884 82 617 148 501 83 828 118 679 202 507 96 072 124 151 220 223 125 467 177 812 303 279
Total 1 224 212 1 678 207 2 902 419 1 363 925 1 828 918 3 192 843 1 453 078 1 864 931 3 318 009 1 568 440 2 002 394 3 570 833
Table 2.4: Level of education for those aged 20 years and older by sex: Census 1996, 2001, 2011 and Community Survey 2007 (Northern Cape)
Northern Cape
1996 2001 2007 2011
Male Female Total Male Female Total Male Female Total Male Female Total
No schooling 57 754 63 027 120 781 51 687 58 148 109 835 35 395 40 963 76 358 35 302 41 558 76 861
Some primary 54 633 61 847 116 480 58 791 65 287 124 078 60 828 66 574 127 402 55 354 60 761 116 115
Completed primary 19 809 25 442 45 251 20 197 25 192 45 389 20 356 25 834 46 190 19 585 23 527 43 111
Some secondary 72 858 84 741 157 599 76 830 88 443 165 273 111 081 120 348 231 429 114 329 122 626 236 956
Grade 12 / Std 10 28 453 30 768 59 221 44 032 45 848 89 880 53 432 51 226 104 658 77 035 78 906 155 942
Higher 16 974 15 761 32 735 16 052 17 260 33 312 19 235 20 471 39 706 22 786 26 046 48 832
Total 250 481 281 585 532 066 267 589 300 178 567 767 300 327 325 416 625 743 324 392 353 424 677 816
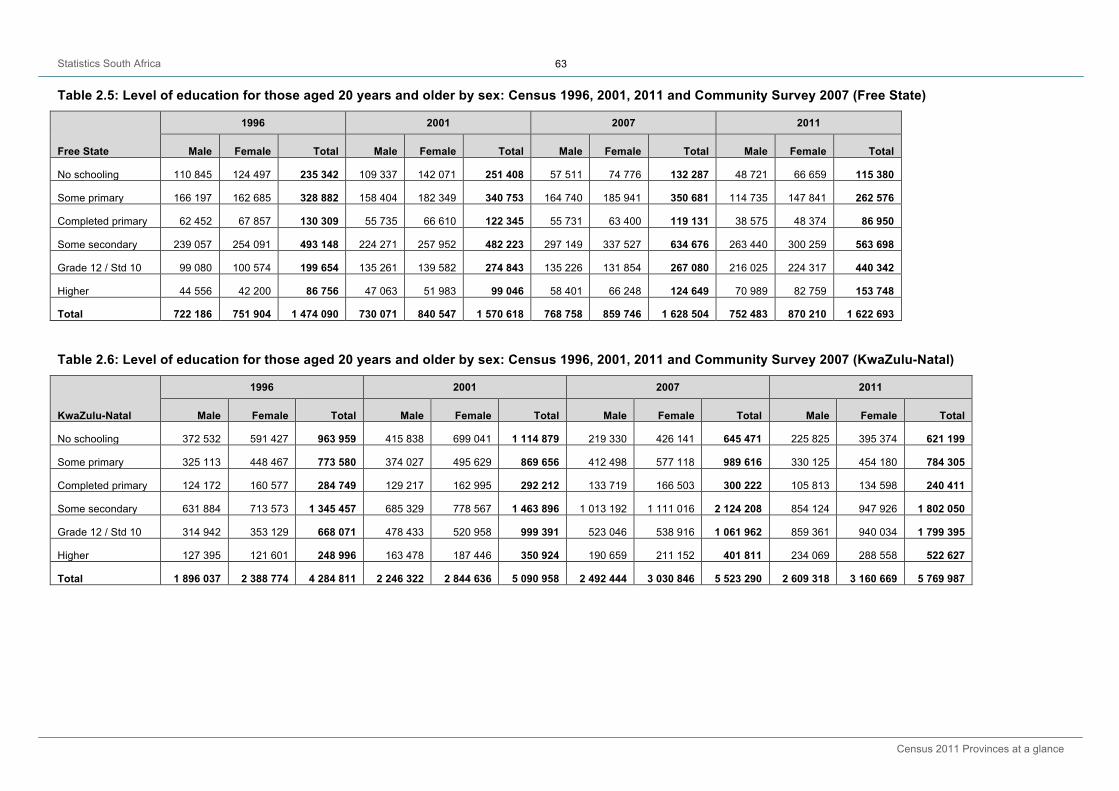
Statistics South Africa
Census 2011 Provinces at a glance
63
Table 2.5: Level of education for those aged 20 years and older by sex: Census 1996, 2001, 2011 and Community Survey 2007 (Free State)
Free State
1996 2001 2007 2011
Male Female Total Male Female Total Male Female Total Male Female Total
No schooling 110 845 124 497 235 342 109 337 142 071 251 408 57 511 74 776 132 287 48 721 66 659 115 380
Some primary 166 197 162 685 328 882 158 404 182 349 340 753 164 740 185 941 350 681 114 735 147 841 262 576
Completed primary 62 452 67 857 130 309 55 735 66 610 122 345 55 731 63 400 119 131 38 575 48 374 86 950
Some secondary 239 057 254 091 493 148 224 271 257 952 482 223 297 149 337 527 634 676 263 440 300 259 563 698
Grade 12 / Std 10 99 080 100 574 199 654 135 261 139 582 274 843 135 226 131 854 267 080 216 025 224 317 440 342
Higher 44 556 42 200 86 756 47 063 51 983 99 046 58 401 66 248 124 649 70 989 82 759 153 748
Total 722 186 751 904 1 474 090 730 071 840 547 1 570 618 768 758 859 746 1 628 504 752 483 870 210 1 622 693
Table 2.6: Level of education for those aged 20 years and older by sex: Census 1996, 2001, 2011 and Community Survey 2007 (KwaZulu-Natal)
KwaZulu-Natal
1996 2001 2007 2011
Male Female Total Male Female Total Male Female Total Male Female Total
No schooling 372 532 591 427 963 959 415 838 699 041 1 114 879 219 330 426 141 645 471 225 825 395 374 621 199
Some primary 325 113 448 467 773 580 374 027 495 629 869 656 412 498 577 118 989 616 330 125 454 180 784 305
Completed primary 124 172 160 577 284 749 129 217 162 995 292 212 133 719 166 503 300 222 105 813 134 598 240 411
Some secondary 631 884 713 573 1 345 457 685 329 778 567 1 463 896 1 013 192 1 111 016 2 124 208 854 124 947 926 1 802 050
Grade 12 / Std 10 314 942 353 129 668 071 478 433 520 958 999 391 523 046 538 916 1 061 962 859 361 940 034 1 799 395
Higher 127 395 121 601 248 996 163 478 187 446 350 924 190 659 211 152 401 811 234 069 288 558 522 627
Total 1 896 037 2 388 774 4 284 811 2 246 322 2 844 636 5 090 958 2 492 444 3 030 846 5 523 290 2 609 318 3 160 669 5 769 987

Statistics South Africa
Census 2011 Provinces at a glance
64
Table 2.7: Level of education for those aged 20 years and older by sex: Census 1996, 2001, 2011 and Community Survey 2007 (North West)
North West
1996 2001 2007 2011
Male Female Total Male Female Total Male Female Total Male Female Total
No schooling 165 381 170 911 336 292 174 175 185 203 359 378 115 857 130 240 246 097 121 818 126 698 248 516
Some primary 156 734 146 102 302 836 179 332 170 622 349 954 184 824 186 976 371 800 177 372 176 381 353 753
Completed primary 54 382 59 348 113 730 58 228 58 881 117 109 56 560 55 461 112 021 55 681 55 758 111 439
Some secondary 214 927 236 025 450 952 247 410 249 959 497 369 305 489 321 781 627 270 353 654 344 254 697 908
Grade 12 / Std 10 89 602 97 737 187 339 158 699 156 548 315 247 137 377 139 882 277 259 269 949 265 155 535 104
Higher 37 997 34 466 72 463 46 751 52 304 99 055 51 908 56 227 108 135 73 660 83 171 156 831
Total 719 023 744 589 1 463 612 864 595 873 517 1 738 112 852 015 890 567 1 742 582 1 052 135 1 051 418 2 103 552
Table 2.8: Level of education for those aged 20 years and older by sex: Census 1996, 2001, 2011 and Community Survey 2007 (Gauteng)
Gauteng
1996 2001 2007 2011
Male Female Total Male Female Total Male Female Total Male Female Total
No schooling 235 091 226 724 461 815 266 370 284 315 550 685 136 449 155 109 291 558 143 783 157 527 301 311
Some primary 306 648 254 757 561 405 387 963 341 830 729 793 410 210 393 897 804 107 314 879 298 112 612 990
Completed primary 159 934 156 573 316 507 178 898 172 995 351 893 170 426 164 402 334 828 143 171 134 358 277 528
Some secondary 928 976 949 361 1 878 337 1 075 391 1 089 188 2 164 579 1 407 632 1 487 787 2 895 419 1 387 064 1 327 887 2 714 950
Grade 12 / Std 10 548 109 540 457 1 088 566 900 991 852 032 1 753 023 834 612 828 183 1 662 795 1 450 195 1 418 269 2 868 464
Higher 252 758 220 546 473 304 395 483 384 781 780 264 458 247 449 277 907 524 707 884 748 421 1 456 305
Total 2 431 517 2 348 418 4 779 935 3 205 096 3 125 141 6 330 237 3 417 576 3 478 655 6 896 231 4 146 975 4 084 574 8 231 549
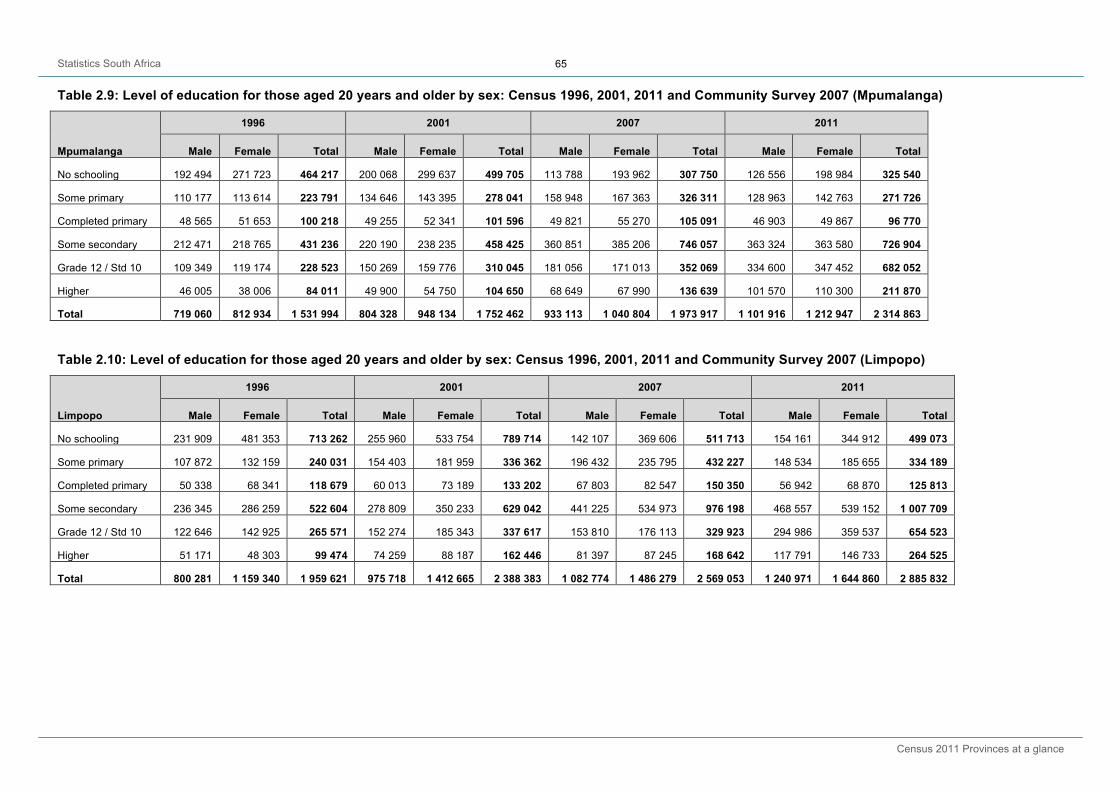
Statistics South Africa
Census 2011 Provinces at a glance
65
Table 2.9: Level of education for those aged 20 years and older by sex: Census 1996, 2001, 2011 and Community Survey 2007 (Mpumalanga)
Mpumalanga
1996 2001 2007 2011
Male Female Total Male Female Total Male Female Total Male Female Total
No schooling 192 494 271 723 464 217 200 068 299 637 499 705 113 788 193 962 307 750 126 556 198 984 325 540
Some primary 110 177 113 614 223 791 134 646 143 395 278 041 158 948 167 363 326 311 128 963 142 763 271 726
Completed primary 48 565 51 653 100 218 49 255 52 341 101 596 49 821 55 270 105 091 46 903 49 867 96 770
Some secondary 212 471 218 765 431 236 220 190 238 235 458 425 360 851 385 206 746 057 363 324 363 580 726 904
Grade 12 / Std 10 109 349 119 174 228 523 150 269 159 776 310 045 181 056 171 013 352 069 334 600 347 452 682 052
Higher 46 005 38 006 84 011 49 900 54 750 104 650 68 649 67 990 136 639 101 570 110 300 211 870
Total 719 060 812 934 1 531 994 804 328 948 134 1 752 462 933 113 1 040 804 1 973 917 1 101 916 1 212 947 2 314 863
Table 2.10: Level of education for those aged 20 years and older by sex: Census 1996, 2001, 2011 and Community Survey 2007 (Limpopo)
Limpopo
1996 2001 2007 2011
Male Female Total Male Female Total Male Female Total Male Female Total
No schooling 231 909 481 353 713 262 255 960 533 754 789 714 142 107 369 606 511 713 154 161 344 912 499 073
Some primary 107 872 132 159 240 031 154 403 181 959 336 362 196 432 235 795 432 227 148 534 185 655 334 189
Completed primary 50 338 68 341 118 679 60 013 73 189 133 202 67 803 82 547 150 350 56 942 68 870 125 813
Some secondary 236 345 286 259 522 604 278 809 350 233 629 042 441 225 534 973 976 198 468 557 539 152 1 007 709
Grade 12 / Std 10 122 646 142 925 265 571 152 274 185 343 337 617 153 810 176 113 329 923 294 986 359 537 654 523
Higher 51 171 48 303 99 474 74 259 88 187 162 446 81 397 87 245 168 642 117 791 146 733 264 525
Total 800 281 1 159 340 1 959 621 975 718 1 412 665 2 388 383 1 082 774 1 486 279 2 569 053 1 240 971 1 644 860 2 885 832

Statistics South Africa
Census 2011 Provinces at a glance
66
Table 3.1: Total Number of households in South Africa: Census 1996, 2001, 2011 and Community Survey 2007
Province 1996 2001 2007 2011
Eastern Cape 1 303 287 1 481 640 1 586 739 1 687 385
Free State 625 011 733 302 802 872 823 316
Gauteng 2 069 512 2 791 270 3 263 712 3 909 022
KwaZulu-Natal 1 689 995 2 117 274 2 234 129 2 539 429
Limpopo 909 371 1 117 818 1 215 935 1 418 102
Mpumalanga 669 801 785 424 940 425 1 075 488
North West 591 240 760 588 822 964 1 062 015
Northern Cape 218 339 245 086 264 653 301 405
Western Cape 983 015 1 173 304 1 369 180 1 634 000
South Africa 9 059 571 11 205 705 12 500 609 14 450 161
Table 3.2: Percentage of households living in formal, informal, traditional and other type of dwellings by province: Census 1996, 2001, 2011 and Community Survey 2007
Province
Formal Informal Traditional Other
1996 2001 2007 2011 1996 2001 2007 2011 1996 2001 2007 2011 1996 2001 2007 2011
Western Cape 799 285 954 104 1 141 228 1 313 818 162 873 189 545 194 408 297 017 8 627 25 768 10 522 7 774 3 359 3 886 23 022 15 533
Eastern Cape 620 970 762 575 868 325 1 065 897 145 038 166 423 127 535 130 414 522 647 549 204 581 880 476 333 4 905 3 438 8 999 14 816
Northern Cape 169 931 198 433 212 743 248 334 27 822 27 742 27 759 39 612 16 594 17 115 11 798 9 507 2 614 1 796 12 353 3 959
Free State 390 340 487 350 569 704 667 820 162 772 191 185 148 060 129 008 63 964 52 678 36 531 19 543 3 861 2 089 48 577 6 984
KwaZulu-Natal 922 171 1 274 936 1 351 834 1 818 654 186 052 226 174 192 252 211 597 557 024 608 529 611 062 483 391 6 911 7 636 78 981 25 940
North West 407 311 547 270 569 435 809 759 136 733 173 947 195 340 225 001 38 538 37 487 20 725 17 527 2 725 1 885 37 464 9 758
Gauteng 1529 150 2 077 659 2 370 224 3 121 588 491 279 668 064 741 569 739 901 16 640 36 901 11 715 13 725 6 000 8 646 140 204 33 931
Mpumalanga 436 414 567 408 723 923 901 755 92 947 114 184 109 817 116 825 130 444 101 796 66 191 48 288 2 573 2 035 40 494 8 645
Limpopo 559 246 810 686 1 012 098 1 273 065 47 499 78 967 67 691 73 721 289 911 225 309 108 954 63 976 2 342 2 856 27 193 7 372
South Africa 5 834 819 7 680 421 8 819 515 11 220 691 1 453 015 1 836 231 1 804 430 1 963 096 1 644 388 1 654 787 1 459 377 1 140 064 35 290 34 266 417 287 126 938
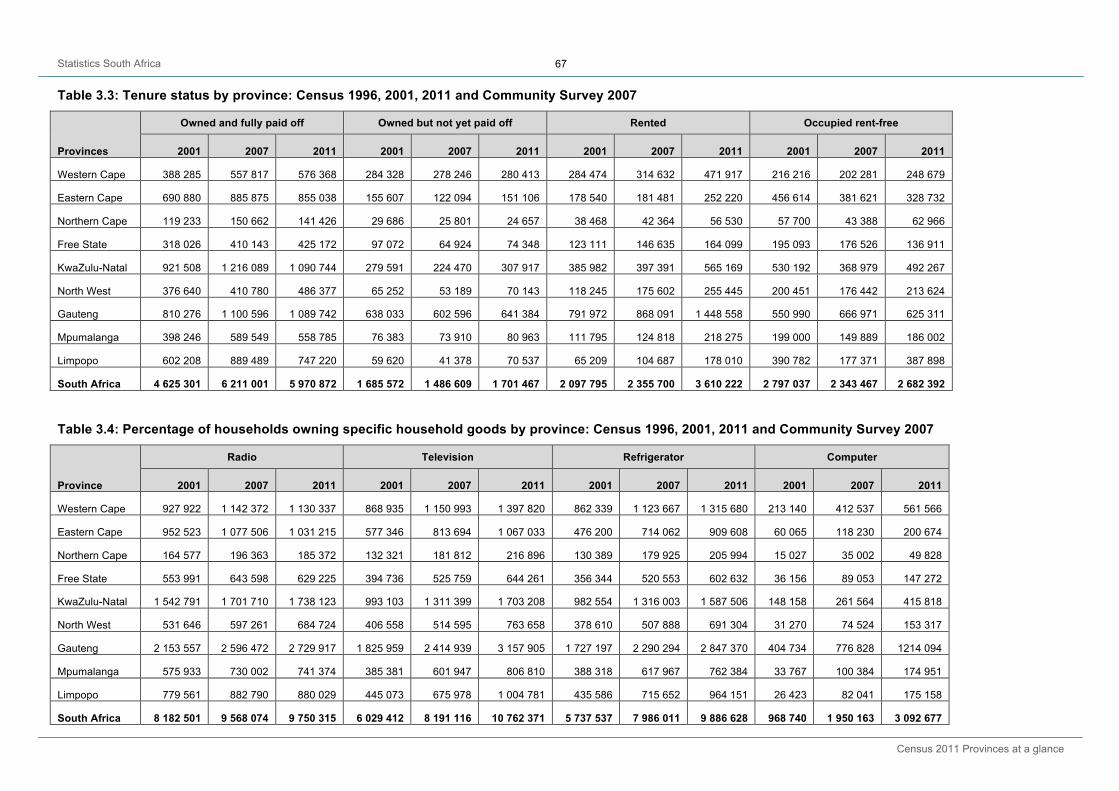
Statistics South Africa
Census 2011 Provinces at a glance
67
Table 3.3: Tenure status by province: Census 1996, 2001, 2011 and Community Survey 2007
Provinces
Owned and fully paid off Owned but not yet paid off Rented Occupied rent-free
2001 2007 2011 2001 2007 2011 2001 2007 2011 2001 2007 2011
Western Cape 388 285 557 817 576 368 284 328 278 246 280 413 284 474 314 632 471 917 216 216 202 281 248 679
Eastern Cape 690 880 885 875 855 038 155 607 122 094 151 106 178 540 181 481 252 220 456 614 381 621 328 732
Northern Cape 119 233 150 662 141 426 29 686 25 801 24 657 38 468 42 364 56 530 57 700 43 388 62 966
Free State 318 026 410 143 425 172 97 072 64 924 74 348 123 111 146 635 164 099 195 093 176 526 136 911
KwaZulu-Natal 921 508 1 216 089 1 090 744 279 591 224 470 307 917 385 982 397 391 565 169 530 192 368 979 492 267
North West 376 640 410 780 486 377 65 252 53 189 70 143 118 245 175 602 255 445 200 451 176 442 213 624
Gauteng 810 276 1 100 596 1 089 742 638 033 602 596 641 384 791 972 868 091 1 448 558 550 990 666 971 625 311
Mpumalanga 398 246 589 549 558 785 76 383 73 910 80 963 111 795 124 818 218 275 199 000 149 889 186 002
Limpopo 602 208 889 489 747 220 59 620 41 378 70 537 65 209 104 687 178 010 390 782 177 371 387 898
South Africa 4 625 301 6 211 001 5 970 872 1 685 572 1 486 609 1 701 467 2 097 795 2 355 700 3 610 222 2 797 037 2 343 467 2 682 392
Table 3.4: Percentage of households owning specific household goods by province: Census 1996, 2001, 2011 and Community Survey 2007
Province
Radio Television Refrigerator Computer
2001 2007 2011 2001 2007 2011 2001 2007 2011 2001 2007 2011
Western Cape 927 922 1 142 372 1 130 337 868 935 1 150 993 1 397 820 862 339 1 123 667 1 315 680 213 140 412 537 561 566
Eastern Cape 952 523 1 077 506 1 031 215 577 346 813 694 1 067 033 476 200 714 062 909 608 60 065 118 230 200 674
Northern Cape 164 577 196 363 185 372 132 321 181 812 216 896 130 389 179 925 205 994 15 027 35 002 49 828
Free State 553 991 643 598 629 225 394 736 525 759 644 261 356 344 520 553 602 632 36 156 89 053 147 272
KwaZulu-Natal 1 542 791 1 701 710 1 738 123 993 103 1 311 399 1 703 208 982 554 1 316 003 1 587 506 148 158 261 564 415 818
North West 531 646 597 261 684 724 406 558 514 595 763 658 378 610 507 888 691 304 31 270 74 524 153 317
Gauteng 2 153 557 2 596 472 2 729 917 1 825 959 2 414 939 3 157 905 1 727 197 2 290 294 2 847 370 404 734 776 828 1214 094
Mpumalanga 575 933 730 002 741 374 385 381 601 947 806 810 388 318 617 967 762 384 33 767 100 384 174 951
Limpopo 779 561 882 790 880 029 445 073 675 978 1 004 781 435 586 715 652 964 151 26 423 82 041 175 158
South Africa 8 182 501 9 568 074 9 750 315 6 029 412 8 191 116 10 762 371 5 737 537 7 986 011 9 886 628 968 740 1 950 163 3 092 677
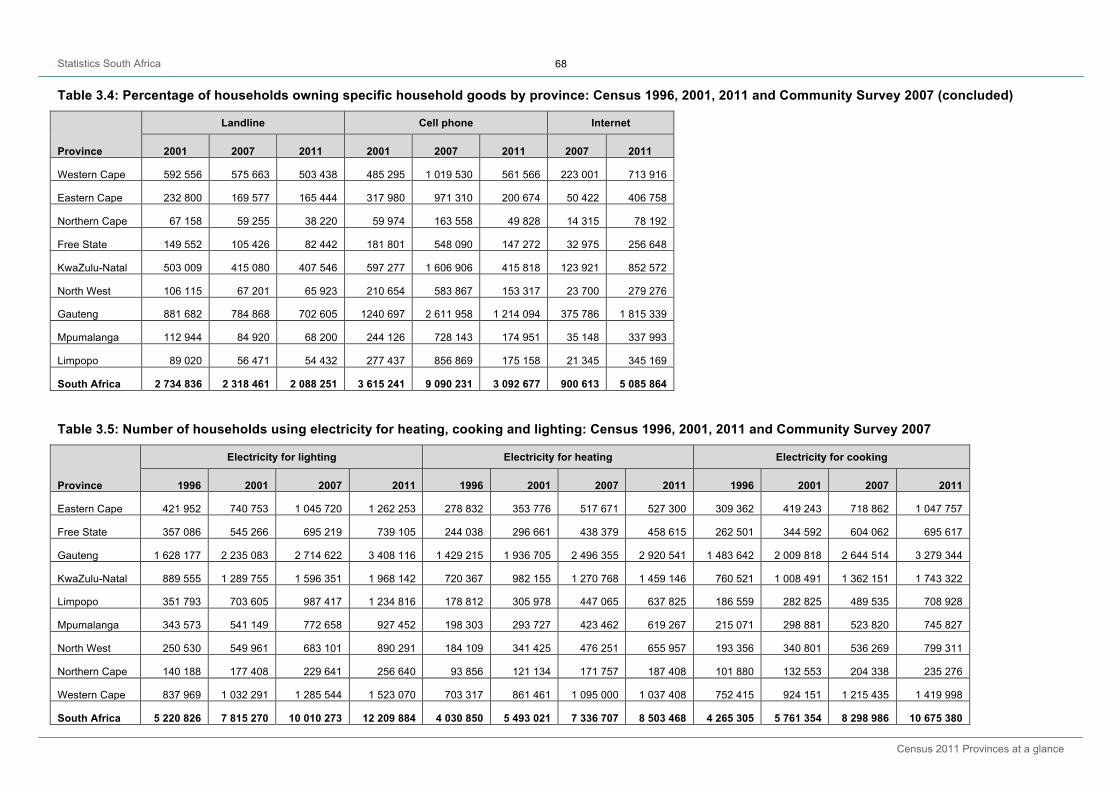
Statistics South Africa
Census 2011 Provinces at a glance
68
Table 3.4: Percentage of households owning specific household goods by province: Census 1996, 2001, 2011 and Community Survey 2007 (concluded)
Province
Landline Cell phone Internet
2001 2007 2011 2001 2007 2011 2007 2011
Western Cape 592 556 575 663 503 438 485 295 1 019 530 561 566 223 001 713 916
Eastern Cape 232 800 169 577 165 444 317 980 971 310 200 674 50 422 406 758
Northern Cape 67 158 59 255 38 220 59 974 163 558 49 828 14 315 78 192
Free State 149 552 105 426 82 442 181 801 548 090 147 272 32 975 256 648
KwaZulu-Natal 503 009 415 080 407 546 597 277 1 606 906 415 818 123 921 852 572
North West 106 115 67 201 65 923 210 654 583 867 153 317 23 700 279 276
Gauteng 881 682 784 868 702 605 1240 697 2 611 958 1 214 094 375 786 1 815 339
Mpumalanga 112 944 84 920 68 200 244 126 728 143 174 951 35 148 337 993
Limpopo 89 020 56 471 54 432 277 437 856 869 175 158 21 345 345 169
South Africa 2 734 836 2 318 461 2 088 251 3 615 241 9 090 231 3 092 677 900 613 5 085 864
Table 3.5: Number of households using electricity for heating, cooking and lighting: Census 1996, 2001, 2011 and Community Survey 2007
Province
Electricity for lighting Electricity for heating Electricity for cooking
1996 2001 2007 2011 1996 2001 2007 2011 1996 2001 2007 2011
Eastern Cape 421 952 740 753 1 045 720 1 262 253 278 832 353 776 517 671 527 300 309 362 419 243 718 862 1 047 757
Free State 357 086 545 266 695 219 739 105 244 038 296 661 438 379 458 615 262 501 344 592 604 062 695 617
Gauteng 1 628 177 2 235 083 2 714 622 3 408 116 1 429 215 1 936 705 2 496 355 2 920 541 1 483 642 2 009 818 2 644 514 3 279 344
KwaZulu-Natal 889 555 1 289 755 1 596 351 1 968 142 720 367 982 155 1 270 768 1 459 146 760 521 1 008 491 1 362 151 1 743 322
Limpopo 351 793 703 605 987 417 1 234 816 178 812 305 978 447 065 637 825 186 559 282 825 489 535 708 928
Mpumalanga 343 573 541 149 772 658 927 452 198 303 293 727 423 462 619 267 215 071 298 881 523 820 745 827
North West 250 530 549 961 683 101 890 291 184 109 341 425 476 251 655 957 193 356 340 801 536 269 799 311
Northern Cape 140 188 177 408 229 641 256 640 93 856 121 134 171 757 187 408 101 880 132 553 204 338 235 276
Western Cape 837 969 1 032 291 1 285 544 1 523 070 703 317 861 461 1 095 000 1 037 408 752 415 924 151 1 215 435 1 419 998
South Africa 5 220 826 7 815 270 10 010 273 12 209 884 4 030 850 5 493 021 7 336 707 8 503 468 4 265 305 5 761 354 8 298 986 10 675 380

Statistics South Africa
Census 2011 Provinces at a glance
69
Table 3.6: Number of households with refuse removal by local authority: Census 1996, 2001, 2011 and Community Survey 2007
Province
Refuse removed weekly or less regularly by local authority
1996 2001 2007 2011
Eastern Cape 473 775 583 307 635 444 733 511
Free State 403 066 452 809 610 572 598 518
Gauteng 1 722 284 2 362 324 2 800 851 3 509 785
KwaZulu-Natal 716 068 1 045 282 1 159 357 1 349 245
Limpopo 116 301 173 886 228 584 308 609
Mpumalanga 234 437 290 241 390 438 470 144
North West 209 309 279 198 433 217 533 612
Northern Cape 133 816 153 357 191 002 199 719
Western Cape 832 537 1 041 837 1 246 670 1 488 523
South Africa 4 841 592 6 382 242 7 696 134 9 191 666
Table 3.7: Number of households with access to flush or chemical toilet: Census 1996, 2001, 2011 and Community Survey 2007
Province
Flush or Chemical Toilets
1996 2001 2007 2011
Eastern Cape 408 138 527 935 698 681 776 261
Free State 282 116 345 588 497 530 557 470
Gauteng 1 677 688 2 265 166 2 781 361 3 382 776
KwaZulu-Natal 692 350 976 398 1 227 138 1 352 122
Limpopo 128 179 202 195 279 531 322 119
Mpumalanga 224 788 289 793 419 410 485 802
North West 181 655 266 197 370 296 491 140
Northern Cape 114 739 143 508 195 504 200 579
Western Cape 843 202 1 014 604 1 271 226 1 478 274
South Africa 4 552 855 6 031 384 7 740 677 9 046 543

Statistics South Africa
Census 2011 Provinces at a glance
70
Table 3.8: Number of households with access to piped water inside dwelling/yard: Census 1996, 2001, 2011 and Community Survey 2007
Province
Piped Water in Dwelling/Yard
1996 2001 2007 2011
Eastern Cape 465 042 560 233 694 620 833 429
Free State 438 269 517 410 696 934 733 345
Gauteng 1 719 530 2 307 173 2 831 012 3 494 362
KwaZulu-Natal 796 333 1 031 206 1 306 605 1 614 147
Limpopo 323 591 435 294 530 023 741 407
Mpumalanga 387 473 443 409 642 435 770 784
North West 301 739 401 224 518 223 736 061
Northern Cape 160 157 176 367 212 391 235 201
Western Cape 875 949 999 149 1 247 559 1 444 836
South Africa 5 468 083 6 871 464 8 679 803 10 603 573
Table 4.1: South Africa’s labour market and unemployment rates (official): Census 1996, 2001, 2011 and Community Survey 2007
South Africa
1996 2001 2007 2011
Male Female Total Male Female Total Male Female Total Male Female Total
Employed 5 467 020 3 626 013 9 093 033 5 572 977 3 991 327 9 564 304 7 017 482 5 310 963 12 328 446 7 412 285 5 767 793 13 180 077
Unemployed 2 035 951 2 629 397 4 665 348 3 116 538 3 702 508 6 819 046 2 666 192 3 380 189 6 046 381 2 548 873 3 045 182 5 594 055
Not economically active 3 769 904 6 292 521 10 062 425 4 765 545 7 090 384 11 855 929 4 589 473 6 770 060 11 359 533 5 784 656 7 510 599 13 295 256
Unemployment Rate 14,8 19,1 33,9 19,0 22,6 41,6 14,5 18,4 32,9 13,6 16,2 29,8
Total 11 272 875 12 547 931 23 820 806 13 455 060 14 784 219 28 239 279 14 273 147 15 461 212 29 734 359 15 745 814 16 323 574 32 069 388 Unemployment rate is expressed as a percentage of unemployed persons over the sum of employed and unemployed persons
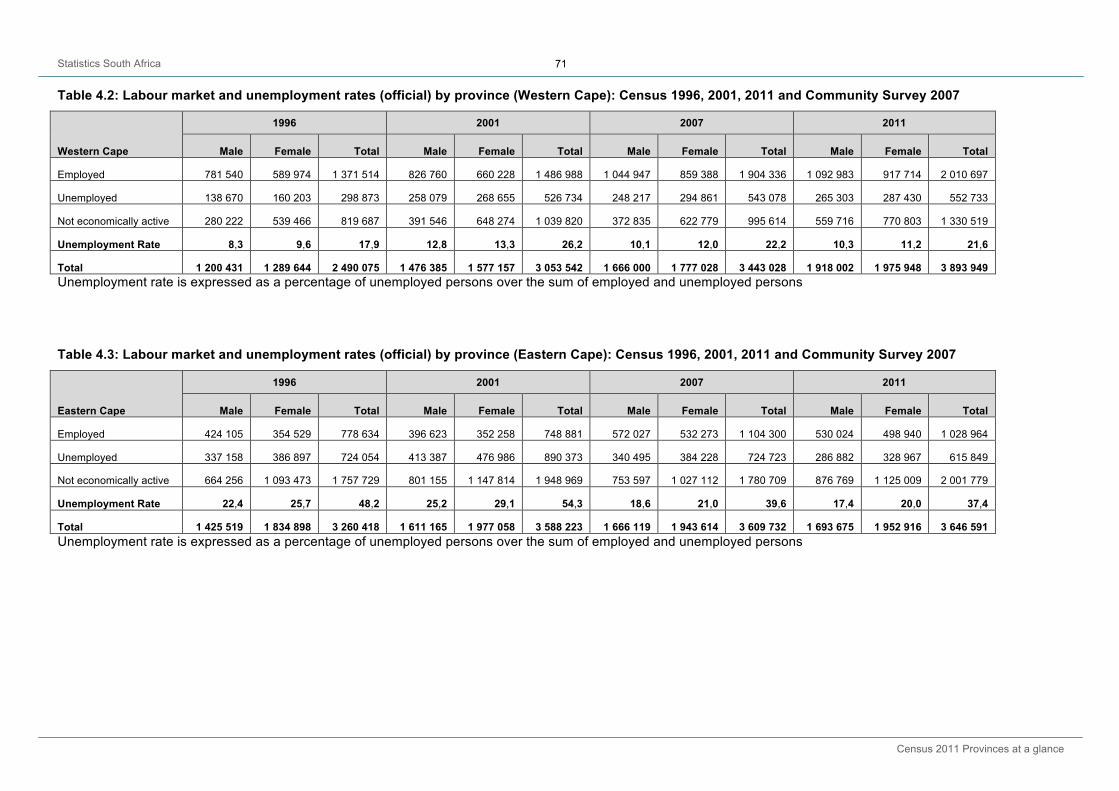
Statistics South Africa
Census 2011 Provinces at a glance
71
Table 4.2: Labour market and unemployment rates (official) by province (Western Cape): Census 1996, 2001, 2011 and Community Survey 2007
Western Cape
1996 2001 2007 2011
Male Female Total Male Female Total Male Female Total Male Female Total
Employed 781 540 589 974 1 371 514 826 760 660 228 1 486 988 1 044 947 859 388 1 904 336 1 092 983 917 714 2 010 697
Unemployed 138 670 160 203 298 873 258 079 268 655 526 734 248 217 294 861 543 078 265 303 287 430 552 733
Not economically active 280 222 539 466 819 687 391 546 648 274 1 039 820 372 835 622 779 995 614 559 716 770 803 1 330 519
Unemployment Rate 8,3 9,6 17,9 12,8 13,3 26,2 10,1 12,0 22,2 10,3 11,2 21,6
Total 1 200 431 1 289 644 2 490 075 1 476 385 1 577 157 3 053 542 1 666 000 1 777 028 3 443 028 1 918 002 1 975 948 3 893 949 Unemployment rate is expressed as a percentage of unemployed persons over the sum of employed and unemployed persons
Table 4.3: Labour market and unemployment rates (official) by province (Eastern Cape): Census 1996, 2001, 2011 and Community Survey 2007
Eastern Cape
1996 2001 2007 2011
Male Female Total Male Female Total Male Female Total Male Female Total
Employed 424 105 354 529 778 634 396 623 352 258 748 881 572 027 532 273 1 104 300 530 024 498 940 1 028 964
Unemployed 337 158 386 897 724 054 413 387 476 986 890 373 340 495 384 228 724 723 286 882 328 967 615 849
Not economically active 664 256 1 093 473 1 757 729 801 155 1 147 814 1 948 969 753 597 1 027 112 1 780 709 876 769 1 125 009 2 001 779
Unemployment Rate 22,4 25,7 48,2 25,2 29,1 54,3 18,6 21,0 39,6 17,4 20,0 37,4
Total 1 425 519 1 834 898 3 260 418 1 611 165 1 977 058 3 588 223 1 666 119 1 943 614 3 609 732 1 693 675 1 952 916 3 646 591 Unemployment rate is expressed as a percentage of unemployed persons over the sum of employed and unemployed persons

Statistics South Africa
Census 2011 Provinces at a glance
72
Table 4.4: Labour market and unemployment rates (official) by province (Northern Cape): Census 1996, 2001, 2011 and Community Survey 2007
Northern Cape
1996 2001 2007 2011
Male Female Total Male Female Total Male Female Total Male Female Total
Employed 143 478 86 514 229 992 134 465 87 451 221 916 160 511 107 790 268 301 166 663 116 128 282 791
Unemployed 48 339 62 053 110 392 58 001 65 010 123 011 56 586 64 194 120 780 49 550 57 174 106 723
Not economically active 85 839 158 074 243 913 106 266 168 500 274 766 106 073 167 685 273 758 130 396 175 895 306 291
Unemployment Rate 14,2 18,2 32,4 16,8 18,8 35,7 14,5 16,5 31,0 12,7 14,7 27,4
Total 277 657 306 641 584 297 298 732 320 961 619 693 323 170 339 669 662 839 346 609 349 196 695 805 Unemployment rate is expressed as a percentage of unemployed persons over the sum of employed and unemployed persons
Table 4.5: Labour market and unemployment rates (official) by province (Free State): Census 1996, 2001, 2011 and Community Survey 2007
Free State
1996 2001 2007 2011
Male Female Total Male Female Total Male Female Total Male Female Total
Employed 439 791 259 935 699 727 348 821 240 911 589 732 427 870 281 186 709 056 376 486 273 174 649 661
Unemployed 118 160 181 527 299 688 190 826 255 156 445 982 159 052 237 640 396 692 135 056 178 737 313 793
Not economically active 240 947 383 821 624 769 292 792 413 623 706 415 266 029 393 529 659 557 323 071 409 446 732 517
Unemployment Rate 11,8 18,2 30,0 18,4 24,6 43,1 14,4 21,5 35,9 14,0 18,6 32,6
Total 798 899 825 284 1 624 183 832 439 909 690 1 742 128 852 950 912 355 1 765 305 834 613 861 358 1 695 971 Unemployment rate is expressed as a percentage of unemployed persons over the sum of employed and unemployed persons
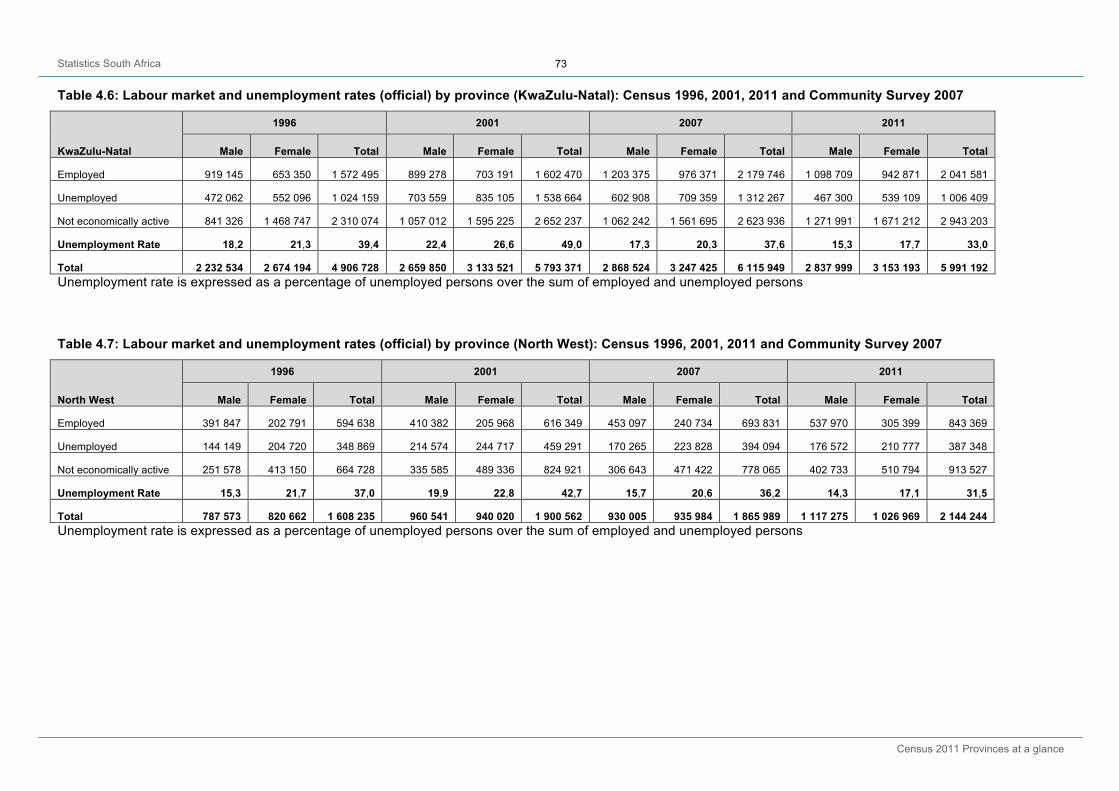
Statistics South Africa
Census 2011 Provinces at a glance
73
Table 4.6: Labour market and unemployment rates (official) by province (KwaZulu-Natal): Census 1996, 2001, 2011 and Community Survey 2007
KwaZulu-Natal
1996 2001 2007 2011
Male Female Total Male Female Total Male Female Total Male Female Total
Employed 919 145 653 350 1 572 495 899 278 703 191 1 602 470 1 203 375 976 371 2 179 746 1 098 709 942 871 2 041 581
Unemployed 472 062 552 096 1 024 159 703 559 835 105 1 538 664 602 908 709 359 1 312 267 467 300 539 109 1 006 409
Not economically active 841 326 1 468 747 2 310 074 1 057 012 1 595 225 2 652 237 1 062 242 1 561 695 2 623 936 1 271 991 1 671 212 2 943 203
Unemployment Rate 18,2 21,3 39,4 22,4 26,6 49,0 17,3 20,3 37,6 15,3 17,7 33,0
Total 2 232 534 2 674 194 4 906 728 2 659 850 3 133 521 5 793 371 2 868 524 3 247 425 6 115 949 2 837 999 3 153 193 5 991 192 Unemployment rate is expressed as a percentage of unemployed persons over the sum of employed and unemployed persons
Table 4.7: Labour market and unemployment rates (official) by province (North West): Census 1996, 2001, 2011 and Community Survey 2007
North West
1996 2001 2007 2011
Male Female Total Male Female Total Male Female Total Male Female Total
Employed 391 847 202 791 594 638 410 382 205 968 616 349 453 097 240 734 693 831 537 970 305 399 843 369
Unemployed 144 149 204 720 348 869 214 574 244 717 459 291 170 265 223 828 394 094 176 572 210 777 387 348
Not economically active 251 578 413 150 664 728 335 585 489 336 824 921 306 643 471 422 778 065 402 733 510 794 913 527
Unemployment Rate 15,3 21,7 37,0 19,9 22,8 42,7 15,7 20,6 36,2 14,3 17,1 31,5
Total 787 573 820 662 1 608 235 960 541 940 020 1 900 562 930 005 935 984 1 865 989 1 117 275 1 026 969 2 144 244 Unemployment rate is expressed as a percentage of unemployed persons over the sum of employed and unemployed persons
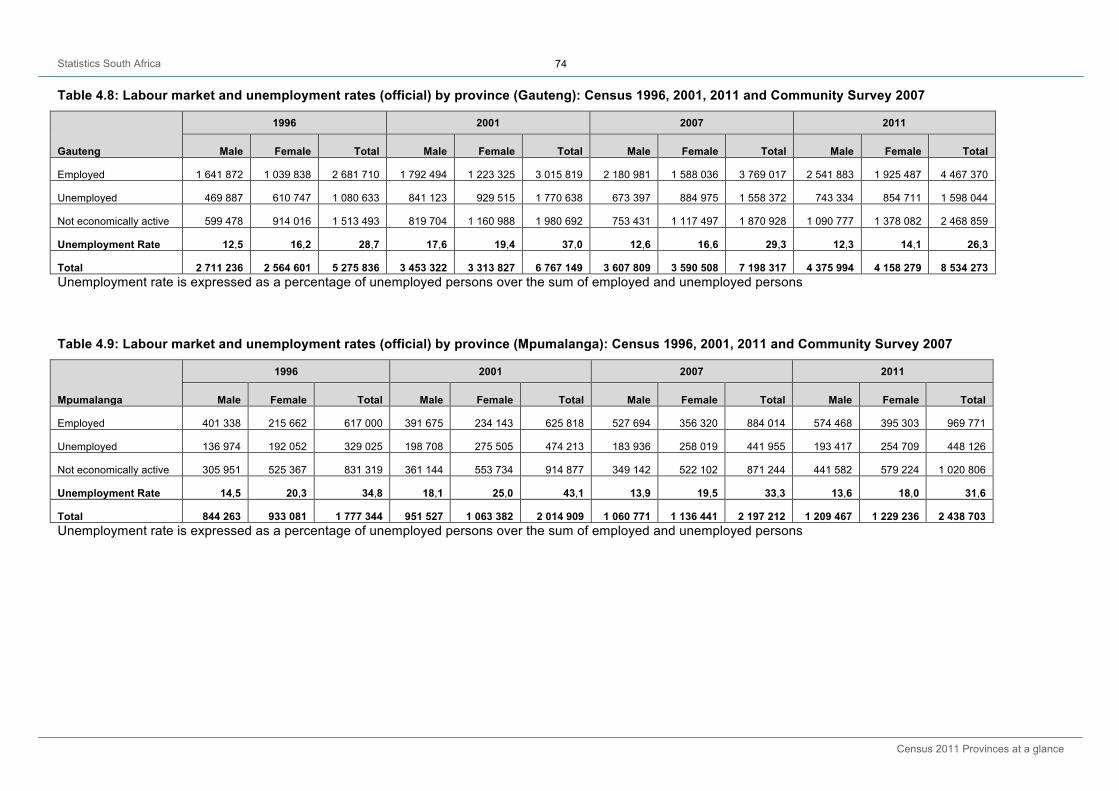
Statistics South Africa
Census 2011 Provinces at a glance
74
Table 4.8: Labour market and unemployment rates (official) by province (Gauteng): Census 1996, 2001, 2011 and Community Survey 2007
Gauteng
1996 2001 2007 2011
Male Female Total Male Female Total Male Female Total Male Female Total
Employed 1 641 872 1 039 838 2 681 710 1 792 494 1 223 325 3 015 819 2 180 981 1 588 036 3 769 017 2 541 883 1 925 487 4 467 370
Unemployed 469 887 610 747 1 080 633 841 123 929 515 1 770 638 673 397 884 975 1 558 372 743 334 854 711 1 598 044
Not economically active 599 478 914 016 1 513 493 819 704 1 160 988 1 980 692 753 431 1 117 497 1 870 928 1 090 777 1 378 082 2 468 859
Unemployment Rate 12,5 16,2 28,7 17,6 19,4 37,0 12,6 16,6 29,3 12,3 14,1 26,3
Total 2 711 236 2 564 601 5 275 836 3 453 322 3 313 827 6 767 149 3 607 809 3 590 508 7 198 317 4 375 994 4 158 279 8 534 273 Unemployment rate is expressed as a percentage of unemployed persons over the sum of employed and unemployed persons
Table 4.9: Labour market and unemployment rates (official) by province (Mpumalanga): Census 1996, 2001, 2011 and Community Survey 2007
Mpumalanga
1996 2001 2007 2011
Male Female Total Male Female Total Male Female Total Male Female Total
Employed 401 338 215 662 617 000 391 675 234 143 625 818 527 694 356 320 884 014 574 468 395 303 969 771
Unemployed 136 974 192 052 329 025 198 708 275 505 474 213 183 936 258 019 441 955 193 417 254 709 448 126
Not economically active 305 951 525 367 831 319 361 144 553 734 914 877 349 142 522 102 871 244 441 582 579 224 1 020 806
Unemployment Rate 14,5 20,3 34,8 18,1 25,0 43,1 13,9 19,5 33,3 13,6 18,0 31,6
Total 844 263 933 081 1 777 344 951 527 1 063 382 2 014 909 1 060 771 1 136 441 2 197 212 1 209 467 1 229 236 2 438 703 Unemployment rate is expressed as a percentage of unemployed persons over the sum of employed and unemployed persons
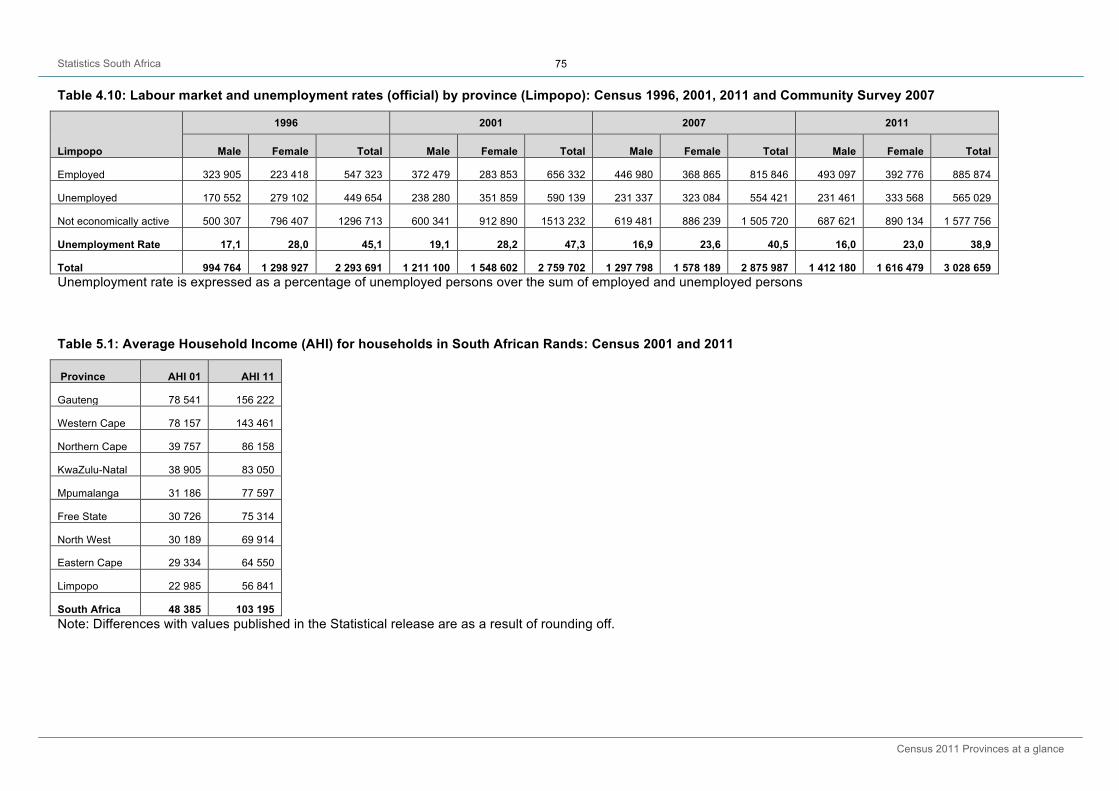
Statistics South Africa
Census 2011 Provinces at a glance
75
Table 4.10: Labour market and unemployment rates (official) by province (Limpopo): Census 1996, 2001, 2011 and Community Survey 2007
Limpopo
1996 2001 2007 2011
Male Female Total Male Female Total Male Female Total Male Female Total
Employed 323 905 223 418 547 323 372 479 283 853 656 332 446 980 368 865 815 846 493 097 392 776 885 874
Unemployed 170 552 279 102 449 654 238 280 351 859 590 139 231 337 323 084 554 421 231 461 333 568 565 029
Not economically active 500 307 796 407 1296 713 600 341 912 890 1513 232 619 481 886 239 1 505 720 687 621 890 134 1 577 756
Unemployment Rate 17,1 28,0 45,1 19,1 28,2 47,3 16,9 23,6 40,5 16,0 23,0 38,9
Total 994 764 1 298 927 2 293 691 1 211 100 1 548 602 2 759 702 1 297 798 1 578 189 2 875 987 1 412 180 1 616 479 3 028 659 Unemployment rate is expressed as a percentage of unemployed persons over the sum of employed and unemployed persons
Table 5.1: Average Household Income (AHI) for households in South African Rands: Census 2001 and 2011
Province AHI 01 AHI 11
Gauteng 78 541 156 222
Western Cape 78 157 143 461
Northern Cape 39 757 86 158
KwaZulu-Natal 38 905 83 050
Mpumalanga 31 186 77 597
Free State 30 726 75 314
North West 30 189 69 914
Eastern Cape 29 334 64 550
Limpopo 22 985 56 841
South Africa 48 385 103 195 Note: Differences with values published in the Statistical release are as a result of rounding off.