provincial achievement test multiyear reports - alberta … · standard of excellence 26 19.8 6678...
TRANSCRIPT

English Language Arts 6
School: 9648 Sir Wilfrid Laurier SchoolProvince: Alberta
Please read "Guidelines for Interpreting the Achievement Test Multiyear Reports."
a Includes all students registered in Grade 6 and ungraded students in year 6 of schooling. School Authority results do not include students in home education programs.
b Includes students who were absent for the entire test or part of the test, and those who wrote but whose results were withheld.
c Includes students who were absent, excused by the superintendent, or who wrote but whose results were withheld. It is possible that some students, under different circumstances, could have demonstrated standards on the test.
d The school authority/school results have been updated with any changes that were made to student scores subsequent to the posting of last year's school authority/school detailed report.
2012/2013 2013/2014 2014/2015 2015/2016 ᵈ* 2016/2017
Sch AB Sch AB Sch AB Sch AB Sch AB
N % N % N % N % N % N % N % N % N % N %
Participation
Enrolled ᵃ 131 100.0 44169 100.0 115 100.0 45796 100.0 95 100.0 47565 100.0 126 100.0 47606 100.0 116 100.0 49572 100.0
Writing 120 91.6 40095 90.8 107 93.0 41379 90.4 94 98.9 43098 90.6 126 100.0 43122 90.6 111 95.7 44730 90.2
Absent ᵇ 3 2.3 1876 4.2 3 2.6 2266 4.9 1 1.1 2343 4.9 0 0.0 2359 5.0 5 4.3 2579 5.2
Excused 8 6.1 2198 5.0 5 4.3 2151 4.7 0 0.0 2124 4.5 0 0.0 2125 4.5 0 0.0 2263 4.6
Results Based on Number Enrolled
Total Test
Standard of Acceptable 115 87.8 36447 82.5 99 86.1 37489 81.9 87 91.6 39364 82.8 124 98.4 39443 82.9 108 93.1 40906 82.5
Standard of Excellence 18 13.7 7207 16.3 23 20.0 8055 17.6 20 21.1 9273 19.5 41 32.5 9726 20.4 13 11.2 9345 18.9
Below Acceptable Standard 5 3.8 3648 8.3 8 7.0 3890 8.5 7 7.4 3734 7.9 2 1.6 3679 7.7 3 2.6 3824 7.7
Results Not Available ᶜ 11 8.4 4074 9.2 8 7.0 4417 9.6 1 1.1 4467 9.4 0 0.0 4484 9.4 5 4.3 4842 9.8
Results Based on Number Writing
Total Test
Acceptable Standard 115 95.8 36447 90.9 99 92.5 37489 90.6 87 92.6 39364 91.3 124 98.4 39443 91.5 108 97.3 40906 91.5
Standard of Excellence 18 15.0 7207 18.0 23 21.5 8055 19.5 20 21.3 9273 21.5 41 32.5 9726 22.6 13 11.7 9345 20.9
Below Acceptable Standard 5 4.2 3648 9.1 8 7.5 3890 9.4 7 7.4 3734 8.7 2 1.6 3679 8.5 3 2.7 3824 8.5
Reading
Acceptable Standard 112 93.3 35765 89.2 96 89.7 36956 89.3 85 90.4 38602 89.6 121 96.0 38805 90.0 107 96.4 40249 90.0
Standard of Excellence 43 35.8 15795 39.4 40 37.4 16685 40.3 39 41.5 17460 40.5 73 57.9 18854 43.7 45 40.5 19614 43.8
Writing
Acceptable Standard 112 93.3 35784 89.2 99 92.5 36475 88.1 91 96.8 38864 90.2 119 94.4 38615 89.5 104 93.7 40411 90.3
Standard of Excellence 15 12.5 4685 11.7 26 24.3 5604 13.5 19 20.2 6069 14.1 27 21.4 5914 13.7 6 5.4 5501 12.3
Mean (%) 120 67.2 40095 66.7 107 68.1 41379 67.0 94 68.0 43098 66.3 126 72.6 43122 66.9 111 67.0 44730 66.7
Standard Deviation 120 11.4 40095 13.1 107 13.2 41379 13.5 94 12.8 43098 13.8 126 11.0 43122 13.6 111 9.6 44730 13.3
* The 2015/2016 results do not include students who were exempted from writing the test because of the Fort McMurray wildfires.
Report Generated: Sep 20, 2017Current data with count less than 6 suppressed for Oct 2017
Report Version 1.0Data Current as of Aug 28, 2017
Provincial Achievement Test Multiyear Reports

Mathematics 6 - All Students Writing
School: 9648 Sir Wilfrid Laurier SchoolProvince: Alberta
Please read "Guidelines for Interpreting the Achievement Test Multiyear Reports."
a Includes all students registered in Grade 6 and ungraded students in year 6 of schooling. School Authority results do not include students in home education programs.
b Includes students who were absent for the entire test or part of the test, and those who wrote but whose results were withheld.
c Includes students who were absent, excused by the superintendent, or who wrote but whose results were withheld. It is possible that some students, under different circumstances, could have demonstrated standards on the test.
d The school authority/school results have been updated with any changes that were made to student scores subsequent to the posting of last year's school authority/school detailed report.
2012/2013 2013/2014 2014/2015 2015/2016 ᵈ* 2016/2017**Sch AB Sch AB Sch AB Sch AB Sch AB
N % N % N % N % N % N % N % N % N % N %
Participation
Enrolled ᵃ 131 100.0 44117 100.0 115 100.0 45709 100.0 95 100.0 47496 100.0 126 100.0 47512 100.0 116 100.0 49507 100.0
Writing 121 92.4 40104 90.9 108 93.9 41435 90.6 95 100.0 43103 90.8 126 100.0 43210 90.9 113 97.4 44792 90.5
Absent ᵇ 1 0.8 1573 3.6 2 1.7 2008 4.4 0 0.0 2105 4.4 0 0.0 2001 4.2 3 2.6 2202 4.4
Excused 9 6.9 2440 5.5 5 4.3 2266 5.0 0 0.0 2288 4.8 0 0.0 2301 4.8 0 0.0 2513 5.1
Results Based on Number Enrolled
Total Test
Standard of Acceptable 111 84.7 32221 73.0 94 81.7 33576 73.5 82 86.3 34788 73.2 125 99.2 34281 72.2 101 87.1 34336 69.4
Standard of Excellence 26 19.8 7250 16.4 16 13.9 7031 15.4 26 27.4 6685 14.1 36 28.6 6650 14.0 20 17.2 6248 12.6
Below Acceptable Standard 10 7.6 7883 17.9 14 12.2 7859 17.2 13 13.7 8315 17.5 1 0.8 8929 18.8 12 10.3 10456 21.1
Results Not Available ᶜ 10 7.6 4013 9.1 7 6.1 4274 9.4 0 0.0 4393 9.2 0 0.0 4302 9.1 3 2.6 4715 9.5
Results Based on Number Writing
Total Test
Acceptable Standard 111 91.7 32221 80.3 94 87.0 33576 81.0 82 86.3 34788 80.7 125 99.2 34281 79.3 101 89.4 34336 76.7
Standard of Excellence 26 21.5 7250 18.1 16 14.8 7031 17.0 26 27.4 6685 15.5 36 28.6 6650 15.4 20 17.7 6248 13.9
Below Acceptable Standard 10 8.3 7883 19.7 14 13.0 7859 19.0 13 13.7 8315 19.3 1 0.8 8929 20.7 12 10.6 10456 23.3
Part A
Acceptable Standard n/a n/a n/a n/a n/a n/a n/a n/a n/a n/a n/a n/a n/a n/a n/a n/a 85 75.2 29287 65.4
Standard of Excellence n/a n/a n/a n/a n/a n/a n/a n/a n/a n/a n/a n/a n/a n/a n/a n/a 30 26.5 13198 29.5
Part B
Acceptable Standard n/a n/a n/a n/a n/a n/a n/a n/a n/a n/a n/a n/a n/a n/a n/a n/a 104 92.0 35394 79.0
Standard of Excellence n/a n/a n/a n/a n/a n/a n/a n/a n/a n/a n/a n/a n/a n/a n/a n/a 21 18.6 6689 14.9
Mean (%) 121 62.6 40104 56.4 108 59.3 41435 57.1 95 67.7 43103 60.8 126 78.6 43210 64.1 113 67.5 44792 61.5
Standard Deviation 121 16.6 40104 20.0 108 19.6 41435 20.3 95 19.2 43103 20.2 126 12.3 43210 20.8 113 16.1 44792 19.8
* The 2015/2016 results do not include students who were exempted from writing the test because of the Fort McMurray wildfires.
** Part A, which requires students to complete number-operation questions without using calculators, was added in 2016/2017.
Report Generated: Sep 20, 2017Current data with count less than 6 suppressed for Oct 2017
Report Version 1.0Data Current as of Aug 28, 2017
Provincial Achievement Test Multiyear Reports

Mathematics 6 - Written in English
School: 9648 Sir Wilfrid Laurier SchoolProvince: Alberta
Please read "Guidelines for Interpreting the Achievement Test Multiyear Reports."
a Includes all students registered in Grade 6 and ungraded students in year 6 of schooling. School Authority results do not include students in home education programs.
b Includes students who were absent for the entire test or part of the test, and those who wrote but whose results were withheld.
c Includes students who were absent, excused by the superintendent, or who wrote but whose results were withheld. It is possible that some students, under different circumstances, could have demonstrated standards on the test.
d The school authority/school results have been updated with any changes that were made to student scores subsequent to the posting of last year's school authority/school detailed report.
2012/2013 2013/2014 2014/2015 2015/2016 ᵈ* 2016/2017**Sch AB Sch AB Sch AB Sch AB Sch AB
N % N % N % N % N % N % N % N % N % N %
Participation
Enrolled ᵃ 131 100.0 41030 100.0 115 100.0 42456 100.0 95 100.0 44064 100.0 126 100.0 44098 100.0 116 100.0 45836 100.0
Writing 121 92.4 37063 90.3 108 93.9 38235 90.1 95 100.0 39731 90.2 126 100.0 39855 90.4 113 97.4 41187 89.9
Absent ᵇ 1 0.8 1550 3.8 2 1.7 1976 4.7 0 0.0 2070 4.7 0 0.0 1965 4.5 3 2.6 2165 4.7
Excused 9 6.9 2417 5.9 5 4.3 2245 5.3 0 0.0 2263 5.1 0 0.0 2278 5.2 0 0.0 2484 5.4
Results Based on Number Enrolled
Total Test
Standard of Acceptable 111 84.7 29590 72.1 94 81.7 30846 72.7 82 86.3 31960 72.5 125 99.2 31480 71.4 101 87.1 31370 68.4
Standard of Excellence 26 19.8 6678 16.3 16 13.9 6489 15.3 26 27.4 6071 13.8 36 28.6 6075 13.8 20 17.2 5654 12.3
Below Acceptable Standard 10 7.6 7473 18.2 14 12.2 7389 17.4 13 13.7 7771 17.6 1 0.8 8375 19.0 12 10.3 9817 21.4
Results Not Available ᶜ 10 7.6 3967 9.7 7 6.1 4221 9.9 0 0.0 4333 9.8 0 0.0 4243 9.6 3 2.6 4649 10.1
Results Based on Number Writing
Total Test
Acceptable Standard 111 91.7 29590 79.8 94 87.0 30846 80.7 82 86.3 31960 80.4 125 99.2 31480 79.0 101 89.4 31370 76.2
Standard of Excellence 26 21.5 6678 18.0 16 14.8 6489 17.0 26 27.4 6071 15.3 36 28.6 6075 15.2 20 17.7 5654 13.7
Below Acceptable Standard 10 8.3 7473 20.2 14 13.0 7389 19.3 13 13.7 7771 19.6 1 0.8 8375 21.0 12 10.6 9817 23.8
Part A
Acceptable Standard n/a n/a n/a n/a n/a n/a n/a n/a n/a n/a n/a n/a n/a n/a n/a n/a 85 75.2 26833 65.1
Standard of Excellence n/a n/a n/a n/a n/a n/a n/a n/a n/a n/a n/a n/a n/a n/a n/a n/a 30 26.5 12183 29.6
Part B
Acceptable Standard n/a n/a n/a n/a n/a n/a n/a n/a n/a n/a n/a n/a n/a n/a n/a n/a 104 92.0 32335 78.5
Standard of Excellence n/a n/a n/a n/a n/a n/a n/a n/a n/a n/a n/a n/a n/a n/a n/a n/a 21 18.6 6022 14.6
Mean (%) 121 62.6 37063 56.2 108 59.3 38235 56.9 95 67.7 39731 60.7 126 78.6 39855 64.0 113 67.5 41187 61.4
Standard Deviation 121 16.6 37063 20.1 108 19.6 38235 20.5 95 19.2 39731 20.3 126 12.3 39855 21.0 113 16.1 41187 19.9
* The 2015/2016 results do not include students who were exempted from writing the test because of the Fort McMurray wildfires.
** Part A, which requires students to complete number-operation questions without using calculators, was added in 2016/2017.
Report Generated: Sep 20, 2017Current data with count less than 6 suppressed for Oct 2017
Report Version 1.0Data Current as of Aug 28, 2017
Provincial Achievement Test Multiyear Reports

Science 6 - All Students Writing
School: 9648 Sir Wilfrid Laurier SchoolProvince: Alberta
Please read "Guidelines for Interpreting the Achievement Test Multiyear Reports."
a Includes all students registered in Grade 6 and ungraded students in year 6 of schooling. School Authority results do not include students in home education programs.
b Includes students who were absent for the entire test or part of the test, and those who wrote but whose results were withheld.
c Includes students who were absent, excused by the superintendent, or who wrote but whose results were withheld. It is possible that some students, under different circumstances, could have demonstrated standards on the test.
d The school authority/school results have been updated with any changes that were made to student scores subsequent to the posting of last year's school authority/school detailed report.
2012/2013 2013/2014 2014/2015 2015/2016 ᵈ* 2016/2017
Sch AB Sch AB Sch AB Sch AB Sch AB
N % N % N % N % N % N % N % N % N % N %
Participation
Enrolled ᵃ 131 100.0 44166 100.0 115 100.0 45701 100.0 95 100.0 47497 100.0 126 100.0 47543 100.0 116 100.0 49501 100.0
Writing 120 91.6 40146 90.9 107 93.0 41209 90.2 94 98.9 42878 90.3 125 99.2 43090 90.6 113 97.4 44412 89.7
Absent ᵇ 2 1.5 1642 3.7 3 2.6 2121 4.6 1 1.1 2379 5.0 1 0.8 2254 4.7 3 2.6 2665 5.4
Excused 9 6.9 2378 5.4 5 4.3 2371 5.2 0 0.0 2240 4.7 0 0.0 2199 4.6 0 0.0 2425 4.9
Results Based on Number Enrolled
Total Test
Standard of Acceptable 104 79.4 34227 77.5 92 80.0 34681 75.9 88 92.6 36248 76.3 122 96.8 37084 78.0 106 91.4 38081 76.9
Standard of Excellence 17 13.0 11423 25.9 21 18.3 11365 24.9 33 34.7 12024 25.3 43 34.1 12880 27.1 42 36.2 14345 29.0
Below Acceptable Standard 16 12.2 5919 13.4 15 13.0 6528 14.3 6 6.3 6630 14.0 3 2.4 6006 12.6 7 6.0 6331 12.8
Results Not Available ᶜ 11 8.4 4020 9.1 8 7.0 4492 9.8 1 1.1 4619 9.7 1 0.8 4453 9.4 3 2.6 5089 10.3
Results Based on Number Writing
Total Test
Acceptable Standard 104 86.7 34227 85.3 92 86.0 34681 84.2 88 93.6 36248 84.5 122 97.6 37084 86.1 106 93.8 38081 85.7
Standard of Excellence 17 14.2 11423 28.5 21 19.6 11365 27.6 33 35.1 12024 28.0 43 34.4 12880 29.9 42 37.2 14345 32.3
Below Acceptable Standard 16 13.3 5919 14.7 15 14.0 6528 15.8 6 6.4 6630 15.5 3 2.4 6006 13.9 7 6.2 6331 14.3
Knowledge
Acceptable Standard 110 91.7 36231 90.2 96 89.7 36738 89.2 89 94.7 38002 88.6 125 100.0 39338 91.3 110 97.3 40209 90.5
Standard of Excellence 16 13.3 14052 35.0 24 22.4 13367 32.4 36 38.3 13630 31.8 66 52.8 17200 39.9 46 40.7 15628 35.2
Skills
Acceptable Standard 99 82.5 32320 80.5 89 83.2 33001 80.1 83 88.3 34326 80.1 119 95.2 34817 80.8 103 91.2 36575 82.4
Standard of Excellence 30 25.0 11424 28.5 27 25.2 11982 29.1 37 39.4 13229 30.9 42 33.6 12318 28.6 48 42.5 15998 36.0
Mean (%) 120 63.8 40146 66.0 107 63.9 41209 65.4 94 73.1 42878 67.5 125 75.9 43090 69.0 113 74.3 44412 69.6
Standard Deviation 120 14.9 40146 18.3 107 17.5 41209 18.6 94 15.9 42878 18.6 125 12.3 43090 18.1 113 14.4 44412 18.6
* The 2015/2016 results do not include students who were exempted from writing the test because of the Fort McMurray wildfires.
Report Generated: Sep 20, 2017Current data with count less than 6 suppressed for Oct 2017
Report Version 1.0Data Current as of Aug 28, 2017
Provincial Achievement Test Multiyear Reports

Science 6 - Written in English
School: 9648 Sir Wilfrid Laurier SchoolProvince: Alberta
Please read "Guidelines for Interpreting the Achievement Test Multiyear Reports."
a Includes all students registered in Grade 6 and ungraded students in year 6 of schooling. School Authority results do not include students in home education programs.
b Includes students who were absent for the entire test or part of the test, and those who wrote but whose results were withheld.
c Includes students who were absent, excused by the superintendent, or who wrote but whose results were withheld. It is possible that some students, under different circumstances, could have demonstrated standards on the test.
d The school authority/school results have been updated with any changes that were made to student scores subsequent to the posting of last year's school authority/school detailed report.
2012/2013 2013/2014 2014/2015 2015/2016 ᵈ* 2016/2017
Sch AB Sch AB Sch AB Sch AB Sch AB
N % N % N % N % N % N % N % N % N % N %
Participation
Enrolled ᵃ 131 100.0 41070 100.0 115 100.0 42442 100.0 95 100.0 44052 100.0 126 100.0 44142 100.0 116 100.0 45821 100.0
Writing 120 91.6 37099 90.3 107 93.0 38003 89.5 94 98.9 39496 89.7 125 99.2 39747 90.0 113 97.4 40811 89.1
Absent ᵇ 2 1.5 1613 3.9 3 2.6 2084 4.9 1 1.1 2338 5.3 1 0.8 2217 5.0 3 2.6 2606 5.7
Excused 9 6.9 2358 5.7 5 4.3 2355 5.5 0 0.0 2218 5.0 0 0.0 2178 4.9 0 0.0 2405 5.2
Results Based on Number Enrolled
Total Test
Standard of Acceptable 104 79.4 31670 77.1 92 80.0 31985 75.4 88 92.6 33482 76.0 122 96.8 34235 77.6 106 91.4 35082 76.6
Standard of Excellence 17 13.0 10772 26.2 21 18.3 10733 25.3 33 34.7 11390 25.9 43 34.1 12229 27.7 42 36.2 13540 29.5
Below Acceptable Standard 16 12.2 5429 13.2 15 13.0 6018 14.2 6 6.3 6014 13.7 3 2.4 5512 12.5 7 6.0 5729 12.5
Results Not Available ᶜ 11 8.4 3971 9.7 8 7.0 4439 10.5 1 1.1 4556 10.3 1 0.8 4395 10.0 3 2.6 5010 10.9
Results Based on Number Writing
Total Test
Acceptable Standard 104 86.7 31670 85.4 92 86.0 31985 84.2 88 93.6 33482 84.8 122 97.6 34235 86.1 106 93.8 35082 86.0
Standard of Excellence 17 14.2 10772 29.0 21 19.6 10733 28.2 33 35.1 11390 28.8 43 34.4 12229 30.8 42 37.2 13540 33.2
Below Acceptable Standard 16 13.3 5429 14.6 15 14.0 6018 15.8 6 6.4 6014 15.2 3 2.4 5512 13.9 7 6.2 5729 14.0
Knowledge
Acceptable Standard 110 91.7 33493 90.3 96 89.7 33899 89.2 89 94.7 35049 88.7 125 100.0 36397 91.6 110 97.3 37045 90.8
Standard of Excellence 16 13.3 13163 35.5 24 22.4 12499 32.9 36 38.3 12897 32.7 66 52.8 16157 40.6 46 40.7 14661 35.9
Skills
Acceptable Standard 99 82.5 29974 80.8 89 83.2 30448 80.1 83 88.3 31779 80.5 119 95.2 32081 80.7 103 91.2 33739 82.7
Standard of Excellence 30 25.0 10805 29.1 27 25.2 11364 29.9 37 39.4 12514 31.7 42 33.6 11691 29.4 48 42.5 15077 36.9
Mean (%) 120 63.8 37099 66.2 107 63.9 38003 65.7 94 73.1 39496 68.0 125 75.9 39747 69.1 113 74.3 40811 69.8
Standard Deviation 120 14.9 37099 18.3 107 17.5 38003 18.6 94 15.9 39496 18.6 125 12.3 39747 18.2 113 14.4 40811 18.7
* The 2015/2016 results do not include students who were exempted from writing the test because of the Fort McMurray wildfires.
Report Generated: Sep 20, 2017Current data with count less than 6 suppressed for Oct 2017
Report Version 1.0Data Current as of Aug 28, 2017
Provincial Achievement Test Multiyear Reports
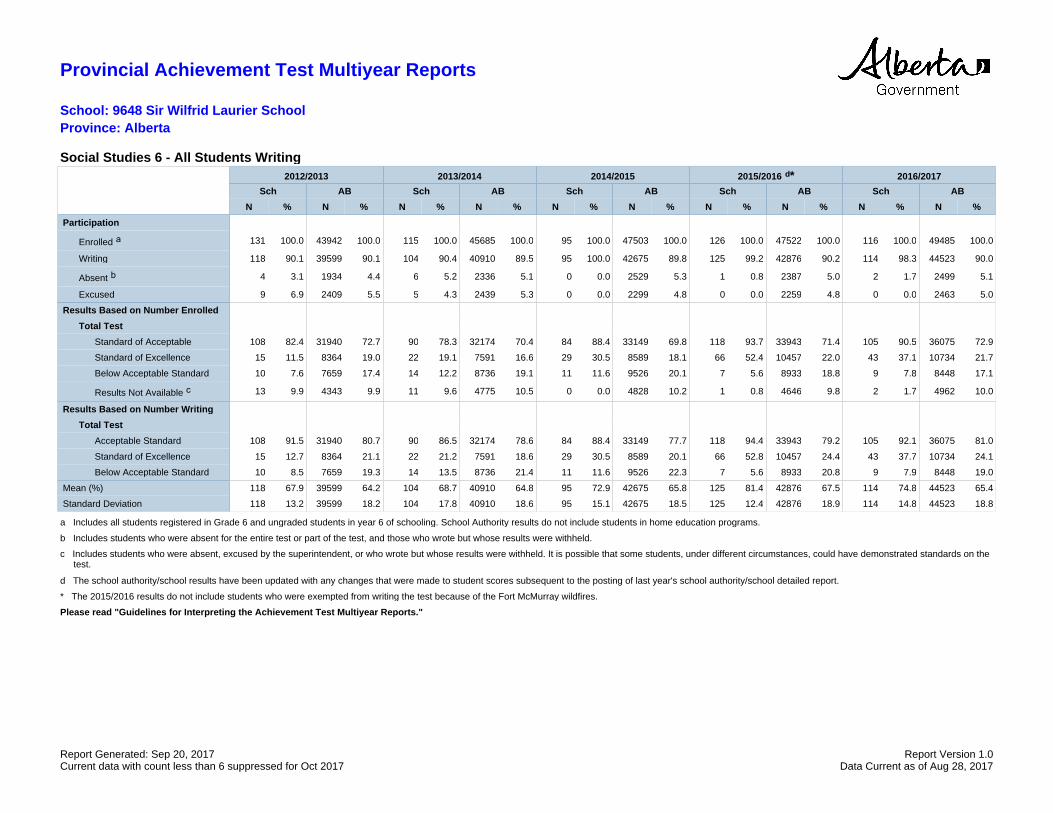
Social Studies 6 - All Students Writing
School: 9648 Sir Wilfrid Laurier SchoolProvince: Alberta
Please read "Guidelines for Interpreting the Achievement Test Multiyear Reports."
a Includes all students registered in Grade 6 and ungraded students in year 6 of schooling. School Authority results do not include students in home education programs.
b Includes students who were absent for the entire test or part of the test, and those who wrote but whose results were withheld.
c Includes students who were absent, excused by the superintendent, or who wrote but whose results were withheld. It is possible that some students, under different circumstances, could have demonstrated standards on the test.
d The school authority/school results have been updated with any changes that were made to student scores subsequent to the posting of last year's school authority/school detailed report.
2012/2013 2013/2014 2014/2015 2015/2016 ᵈ* 2016/2017
Sch AB Sch AB Sch AB Sch AB Sch AB
N % N % N % N % N % N % N % N % N % N %
Participation
Enrolled ᵃ 131 100.0 43942 100.0 115 100.0 45685 100.0 95 100.0 47503 100.0 126 100.0 47522 100.0 116 100.0 49485 100.0
Writing 118 90.1 39599 90.1 104 90.4 40910 89.5 95 100.0 42675 89.8 125 99.2 42876 90.2 114 98.3 44523 90.0
Absent ᵇ 4 3.1 1934 4.4 6 5.2 2336 5.1 0 0.0 2529 5.3 1 0.8 2387 5.0 2 1.7 2499 5.1
Excused 9 6.9 2409 5.5 5 4.3 2439 5.3 0 0.0 2299 4.8 0 0.0 2259 4.8 0 0.0 2463 5.0
Results Based on Number Enrolled
Total Test
Standard of Acceptable 108 82.4 31940 72.7 90 78.3 32174 70.4 84 88.4 33149 69.8 118 93.7 33943 71.4 105 90.5 36075 72.9
Standard of Excellence 15 11.5 8364 19.0 22 19.1 7591 16.6 29 30.5 8589 18.1 66 52.4 10457 22.0 43 37.1 10734 21.7
Below Acceptable Standard 10 7.6 7659 17.4 14 12.2 8736 19.1 11 11.6 9526 20.1 7 5.6 8933 18.8 9 7.8 8448 17.1
Results Not Available ᶜ 13 9.9 4343 9.9 11 9.6 4775 10.5 0 0.0 4828 10.2 1 0.8 4646 9.8 2 1.7 4962 10.0
Results Based on Number Writing
Total Test
Acceptable Standard 108 91.5 31940 80.7 90 86.5 32174 78.6 84 88.4 33149 77.7 118 94.4 33943 79.2 105 92.1 36075 81.0
Standard of Excellence 15 12.7 8364 21.1 22 21.2 7591 18.6 29 30.5 8589 20.1 66 52.8 10457 24.4 43 37.7 10734 24.1
Below Acceptable Standard 10 8.5 7659 19.3 14 13.5 8736 21.4 11 11.6 9526 22.3 7 5.6 8933 20.8 9 7.9 8448 19.0
Mean (%) 118 67.9 39599 64.2 104 68.7 40910 64.8 95 72.9 42675 65.8 125 81.4 42876 67.5 114 74.8 44523 65.4
Standard Deviation 118 13.2 39599 18.2 104 17.8 40910 18.6 95 15.1 42675 18.5 125 12.4 42876 18.9 114 14.8 44523 18.8
* The 2015/2016 results do not include students who were exempted from writing the test because of the Fort McMurray wildfires.
Report Generated: Sep 20, 2017Current data with count less than 6 suppressed for Oct 2017
Report Version 1.0Data Current as of Aug 28, 2017
Provincial Achievement Test Multiyear Reports

Social Studies 6 - Written in English
School: 9648 Sir Wilfrid Laurier SchoolProvince: Alberta
Please read "Guidelines for Interpreting the Achievement Test Multiyear Reports."
a Includes all students registered in Grade 6 and ungraded students in year 6 of schooling. School Authority results do not include students in home education programs.
b Includes students who were absent for the entire test or part of the test, and those who wrote but whose results were withheld.
c Includes students who were absent, excused by the superintendent, or who wrote but whose results were withheld. It is possible that some students, under different circumstances, could have demonstrated standards on the test.
d The school authority/school results have been updated with any changes that were made to student scores subsequent to the posting of last year's school authority/school detailed report.
2012/2013 2013/2014 2014/2015 2015/2016 ᵈ* 2016/2017
Sch AB Sch AB Sch AB Sch AB Sch AB
N % N % N % N % N % N % N % N % N % N %
Participation
Enrolled ᵃ 131 100.0 40946 100.0 115 100.0 42443 100.0 95 100.0 44105 100.0 126 100.0 44130 100.0 116 100.0 45842 100.0
Writing 118 90.1 36662 89.5 104 90.4 37724 88.9 95 100.0 39351 89.2 125 99.2 39554 89.6 114 98.3 40953 89.3
Absent ᵇ 4 3.1 1897 4.6 6 5.2 2299 5.4 0 0.0 2482 5.6 1 0.8 2339 5.3 2 1.7 2447 5.3
Excused 9 6.9 2387 5.8 5 4.3 2420 5.7 0 0.0 2272 5.2 0 0.0 2237 5.1 0 0.0 2442 5.3
Results Based on Number Enrolled
Total Test
Standard of Acceptable 108 82.4 29583 72.2 90 78.3 29781 70.2 84 88.4 30700 69.6 118 93.7 31397 71.1 105 90.5 33298 72.6
Standard of Excellence 15 11.5 7913 19.3 22 19.1 7238 17.1 29 30.5 8252 18.7 66 52.4 9992 22.6 43 37.1 10267 22.4
Below Acceptable Standard 10 7.6 7079 17.3 14 12.2 7943 18.7 11 11.6 8651 19.6 7 5.6 8157 18.5 9 7.8 7655 16.7
Results Not Available ᶜ 13 9.9 4284 10.5 11 9.6 4719 11.1 0 0.0 4754 10.8 1 0.8 4576 10.4 2 1.7 4889 10.7
Results Based on Number Writing
Total Test
Acceptable Standard 108 91.5 29583 80.7 90 86.5 29781 78.9 84 88.4 30700 78.0 118 94.4 31397 79.4 105 92.1 33298 81.3
Standard of Excellence 15 12.7 7913 21.6 22 21.2 7238 19.2 29 30.5 8252 21.0 66 52.8 9992 25.3 43 37.7 10267 25.1
Below Acceptable Standard 10 8.5 7079 19.3 14 13.5 7943 21.1 11 11.6 8651 22.0 7 5.6 8157 20.6 9 7.9 7655 18.7
Mean (%) 118 67.9 36662 64.4 104 68.7 37724 65.0 95 72.9 39351 66.3 125 81.4 39554 67.9 114 74.8 40953 65.7
Standard Deviation 118 13.2 36662 18.3 104 17.8 37724 18.7 95 15.1 39351 18.6 125 12.4 39554 18.9 114 14.8 40953 18.9
* The 2015/2016 results do not include students who were exempted from writing the test because of the Fort McMurray wildfires.
Report Generated: Sep 20, 2017Current data with count less than 6 suppressed for Oct 2017
Report Version 1.0Data Current as of Aug 28, 2017
Provincial Achievement Test Multiyear Reports

English Language Arts 9
School: 9648 Sir Wilfrid Laurier SchoolProvince: Alberta
Please read "Guidelines for Interpreting the Achievement Test Multiyear Reports."
* The 2012/2013 results do not include students who were exempted from the test because of the flooding in Calgary and southern Alberta.
a Includes all students registered in Grade 9 and ungraded students in year 9 of schooling. School Authority results do not include students in home education programs.
b Includes students who were absent for the entire test or part of the test, and those who wrote but whose results were withheld.
c Includes students who were absent, excused by the superintendent, or who wrote but whose results were withheld. It is possible that some students, under different circumstances, could have demonstrated standards on the test.
d The school authority/school results have been updated with any changes that were made to student scores subsequent to the posting of last year's school authority/school detailed report.
2012/2013* 2013/2014 2014/2015 2015/2016 ᵈ** 2016/2017
Sch AB Sch AB Sch AB Sch AB Sch AB
N % N % N % N % N % N % N % N % N % N %
Participation
Enrolled ᵃ n/a n/a 28002 100.0 44 100.0 43837 100.0 108 100.0 43622 100.0 126 100.0 43780 100.0 81 100.0 45487 100.0
Writing n/a n/a 24633 88.0 26 59.1 38718 88.3 99 91.7 38602 88.5 113 89.7 38859 88.8 72 88.9 40395 88.8
Absent ᵇ n/a n/a 2081 7.4 3 6.8 3163 7.2 5 4.6 3148 7.2 6 4.8 2821 6.4 9 11.1 2722 6.0
Excused n/a n/a 1288 4.6 15 34.1 1956 4.5 4 3.7 1872 4.3 7 5.6 2100 4.8 0 0.0 2369 5.2
Results Based on Number Enrolled
Total Test
Standard of Acceptable n/a n/a 21490 76.7 18 40.9 33451 76.3 80 74.1 32992 75.6 103 81.7 33709 77.0 63 77.8 34917 76.8
Standard of Excellence n/a n/a 4138 14.8 4 9.1 6597 15.0 14 13.0 6297 14.4 26 20.6 6653 15.2 11 13.6 6791 14.9
Below Acceptable Standard n/a n/a 3143 11.2 8 18.2 5267 12.0 19 17.6 5610 12.9 10 7.9 5150 11.8 9 11.1 5478 12.0
Results Not Available ᶜ n/a n/a 3369 12.0 18 40.9 5119 11.7 9 8.3 5020 11.5 13 10.3 4921 11.2 9 11.1 5092 11.2
Results Based on Number Writing
Total Test
Acceptable Standard n/a n/a 21490 87.2 18 69.2 33451 86.4 80 80.8 32992 85.5 103 91.2 33709 86.7 63 87.5 34917 86.4
Standard of Excellence n/a n/a 4138 16.8 4 15.4 6597 17.0 14 14.1 6297 16.3 26 23.0 6653 17.1 11 15.3 6791 16.8
Below Acceptable Standard n/a n/a 3143 12.8 8 30.8 5267 13.6 19 19.2 5610 14.5 10 8.8 5150 13.3 9 12.5 5478 13.6
Reading
Acceptable Standard n/a n/a 19611 79.6 15 57.7 30420 78.6 68 68.7 30709 79.6 100 88.5 31222 80.3 55 76.4 32208 79.7
Standard of Excellence n/a n/a 4879 19.8 3 11.5 8150 21.0 8 8.1 7173 18.6 25 22.1 7440 19.1 6 8.3 7824 19.4
Writing
Acceptable Standard n/a n/a 22892 92.9 24 92.3 35763 92.4 87 87.9 35222 91.2 108 95.6 35541 91.5 67 93.1 36458 90.3
Standard of Excellence n/a n/a 5376 21.8 7 26.9 8079 20.9 32 32.3 8269 21.4 36 31.9 8759 22.5 17 23.6 8711 21.6
Mean (%) n/a n/a 24633 65.8 26 61.6 38718 66.5 99 63.8 38602 67.1 113 69.4 38859 66.2 72 66.0 40395 65.9
Standard Deviation n/a n/a 24633 14.5 26 15.0 38718 14.0 99 17.3 38602 14.8 113 13.2 38859 14.3 72 12.7 40395 14.3
** The 2015/2016 results do not include students who were exempted from writing the test because of the Fort McMurray wildfires.
Report Generated: Sep 20, 2017Current data with count less than 6 suppressed for Oct 2017
Report Version 1.0Data Current as of Aug 28, 2017
Provincial Achievement Test Multiyear Reports

English Lang Arts 9 KAE
School: 9648 Sir Wilfrid Laurier SchoolProvince: Alberta
Please read "Guidelines for Interpreting the Achievement Test Multiyear Reports."
* The 2012/2013 results do not include students who were exempted from the test because of the flooding in Calgary and southern Alberta.
a Includes all students registered in Grade 9 and ungraded students in year 9 of schooling. School Authority results do not include students in home education programs.
b Includes students who were absent for the entire test or part of the test, and those who wrote but whose results were withheld.
c Includes students who were absent, excused by the superintendent, or who wrote but whose results were withheld. It is possible that some students, under different circumstances, could have demonstrated standards on the test.
d The school authority/school results have been updated with any changes that were made to student scores subsequent to the posting of last year's school authority/school detailed report.
2012/2013* 2013/2014 2014/2015 2015/2016 ᵈ** 2016/2017
Sch AB Sch AB Sch AB Sch AB Sch AB
N % N % N % N % N % N % N % N % N % N %
Participation
Enrolled ᵃ n/a n/a 1453 100.0 1 100.0 1528 100.0 3 100.0 1562 100.0 n/a n/a 1638 100.0 2 100.0 1428 100.0
Writing n/a n/a 1170 80.5 1 100.0 1225 80.2 1 33.3 1276 81.7 n/a n/a 1311 80.0 0 0.0 1138 79.7
Absent ᵇ n/a n/a 218 15.0 0 0.0 242 15.8 2 66.7 221 14.1 n/a n/a 254 15.5 2 100.0 215 15.1
Excused n/a n/a 65 4.5 0 0.0 61 4.0 0 0.0 65 4.2 n/a n/a 73 4.5 0 0.0 75 5.3
Results Based on Number Enrolled
Total Test
Standard of Acceptable n/a n/a 907 62.4 n/a n/a 960 62.8 n/a n/a 984 63.0 n/a n/a 979 59.8 n/a n/a 839 58.8
Standard of Excellence n/a n/a 63 4.3 n/a n/a 54 3.5 n/a n/a 71 4.5 n/a n/a 102 6.2 n/a n/a 84 5.9
Below Acceptable Standard n/a n/a 263 18.1 n/a n/a 265 17.3 n/a n/a 292 18.7 n/a n/a 332 20.3 n/a n/a 299 20.9
Results Not Available ᶜ n/a n/a 283 19.5 n/a n/a 303 19.8 n/a n/a 286 18.3 n/a n/a 327 20.0 n/a n/a 290 20.3
Results Based on Number Writing
Total Test
Acceptable Standard n/a n/a 907 77.5 n/a n/a 960 78.4 n/a n/a 984 77.1 n/a n/a 979 74.7 n/a n/a 839 73.7
Standard of Excellence n/a n/a 63 5.4 n/a n/a 54 4.4 n/a n/a 71 5.6 n/a n/a 102 7.8 n/a n/a 84 7.4
Below Acceptable Standard n/a n/a 263 22.5 n/a n/a 265 21.6 n/a n/a 292 22.9 n/a n/a 332 25.3 n/a n/a 299 26.3
Reading
Acceptable Standard n/a n/a 915 78.2 n/a n/a 964 78.7 n/a n/a 943 73.9 n/a n/a 986 75.2 n/a n/a 835 73.4
Standard of Excellence n/a n/a 228 19.5 n/a n/a 232 18.9 n/a n/a 223 17.5 n/a n/a 262 20.0 n/a n/a 236 20.7
Writing
Acceptable Standard n/a n/a 810 69.2 n/a n/a 891 72.7 n/a n/a 1004 78.7 n/a n/a 968 73.8 n/a n/a 839 73.7
Standard of Excellence n/a n/a 33 2.8 n/a n/a 24 2.0 n/a n/a 36 2.8 n/a n/a 90 6.9 n/a n/a 54 4.7
Mean (%) n/a n/a 1170 62.4 n/a n/a 1225 63.5 n/a n/a 1276 63.0 n/a n/a 1311 62.7 n/a n/a 1138 62.0
Standard Deviation n/a n/a 1170 13.0 n/a n/a 1225 13.0 n/a n/a 1276 13.7 n/a n/a 1311 14.1 n/a n/a 1138 14.6
** The 2015/2016 results do not include students who were exempted from writing the test because of the Fort McMurray wildfires.
Report Generated: Sep 20, 2017Current data with count less than 6 suppressed for Oct 2017
Report Version 1.0Data Current as of Aug 28, 2017
Provincial Achievement Test Multiyear Reports
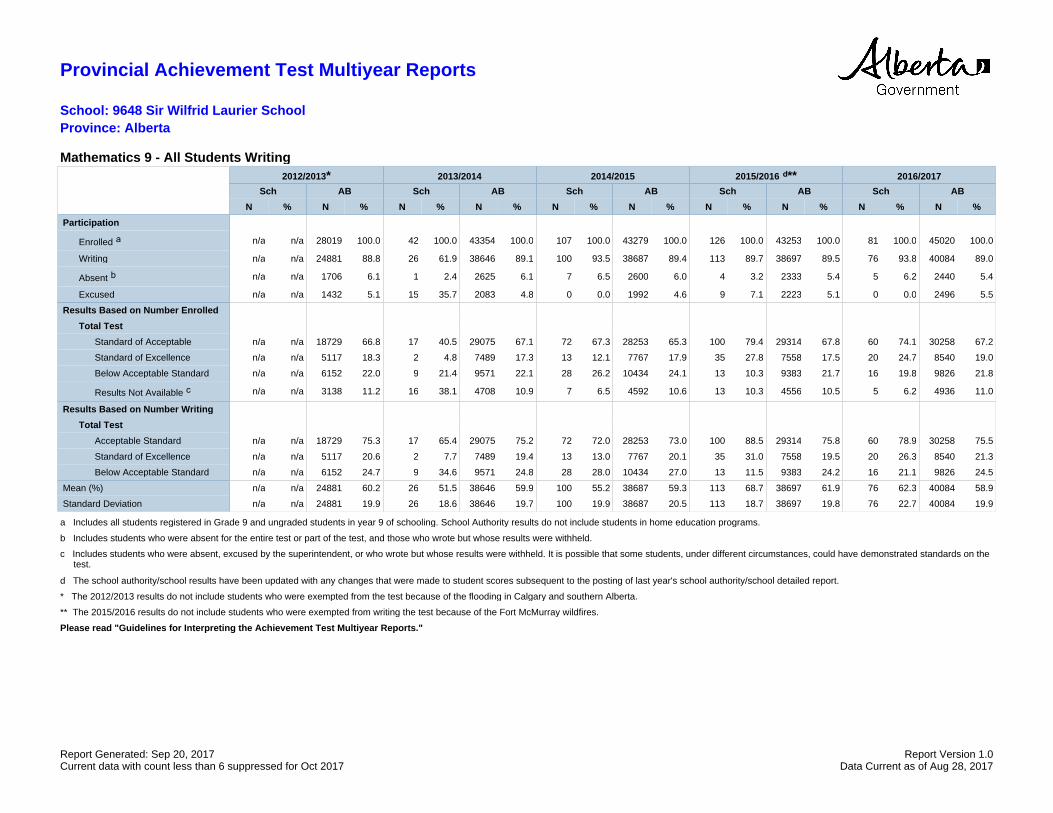
Mathematics 9 - All Students Writing
School: 9648 Sir Wilfrid Laurier SchoolProvince: Alberta
Please read "Guidelines for Interpreting the Achievement Test Multiyear Reports."
* The 2012/2013 results do not include students who were exempted from the test because of the flooding in Calgary and southern Alberta.
a Includes all students registered in Grade 9 and ungraded students in year 9 of schooling. School Authority results do not include students in home education programs.
b Includes students who were absent for the entire test or part of the test, and those who wrote but whose results were withheld.
c Includes students who were absent, excused by the superintendent, or who wrote but whose results were withheld. It is possible that some students, under different circumstances, could have demonstrated standards on the test.
d The school authority/school results have been updated with any changes that were made to student scores subsequent to the posting of last year's school authority/school detailed report.
2012/2013* 2013/2014 2014/2015 2015/2016 ᵈ** 2016/2017
Sch AB Sch AB Sch AB Sch AB Sch AB
N % N % N % N % N % N % N % N % N % N %
Participation
Enrolled ᵃ n/a n/a 28019 100.0 42 100.0 43354 100.0 107 100.0 43279 100.0 126 100.0 43253 100.0 81 100.0 45020 100.0
Writing n/a n/a 24881 88.8 26 61.9 38646 89.1 100 93.5 38687 89.4 113 89.7 38697 89.5 76 93.8 40084 89.0
Absent ᵇ n/a n/a 1706 6.1 1 2.4 2625 6.1 7 6.5 2600 6.0 4 3.2 2333 5.4 5 6.2 2440 5.4
Excused n/a n/a 1432 5.1 15 35.7 2083 4.8 0 0.0 1992 4.6 9 7.1 2223 5.1 0 0.0 2496 5.5
Results Based on Number Enrolled
Total Test
Standard of Acceptable n/a n/a 18729 66.8 17 40.5 29075 67.1 72 67.3 28253 65.3 100 79.4 29314 67.8 60 74.1 30258 67.2
Standard of Excellence n/a n/a 5117 18.3 2 4.8 7489 17.3 13 12.1 7767 17.9 35 27.8 7558 17.5 20 24.7 8540 19.0
Below Acceptable Standard n/a n/a 6152 22.0 9 21.4 9571 22.1 28 26.2 10434 24.1 13 10.3 9383 21.7 16 19.8 9826 21.8
Results Not Available ᶜ n/a n/a 3138 11.2 16 38.1 4708 10.9 7 6.5 4592 10.6 13 10.3 4556 10.5 5 6.2 4936 11.0
Results Based on Number Writing
Total Test
Acceptable Standard n/a n/a 18729 75.3 17 65.4 29075 75.2 72 72.0 28253 73.0 100 88.5 29314 75.8 60 78.9 30258 75.5
Standard of Excellence n/a n/a 5117 20.6 2 7.7 7489 19.4 13 13.0 7767 20.1 35 31.0 7558 19.5 20 26.3 8540 21.3
Below Acceptable Standard n/a n/a 6152 24.7 9 34.6 9571 24.8 28 28.0 10434 27.0 13 11.5 9383 24.2 16 21.1 9826 24.5
Mean (%) n/a n/a 24881 60.2 26 51.5 38646 59.9 100 55.2 38687 59.3 113 68.7 38697 61.9 76 62.3 40084 58.9
Standard Deviation n/a n/a 24881 19.9 26 18.6 38646 19.7 100 19.9 38687 20.5 113 18.7 38697 19.8 76 22.7 40084 19.9
** The 2015/2016 results do not include students who were exempted from writing the test because of the Fort McMurray wildfires.
Report Generated: Sep 20, 2017Current data with count less than 6 suppressed for Oct 2017
Report Version 1.0Data Current as of Aug 28, 2017
Provincial Achievement Test Multiyear Reports
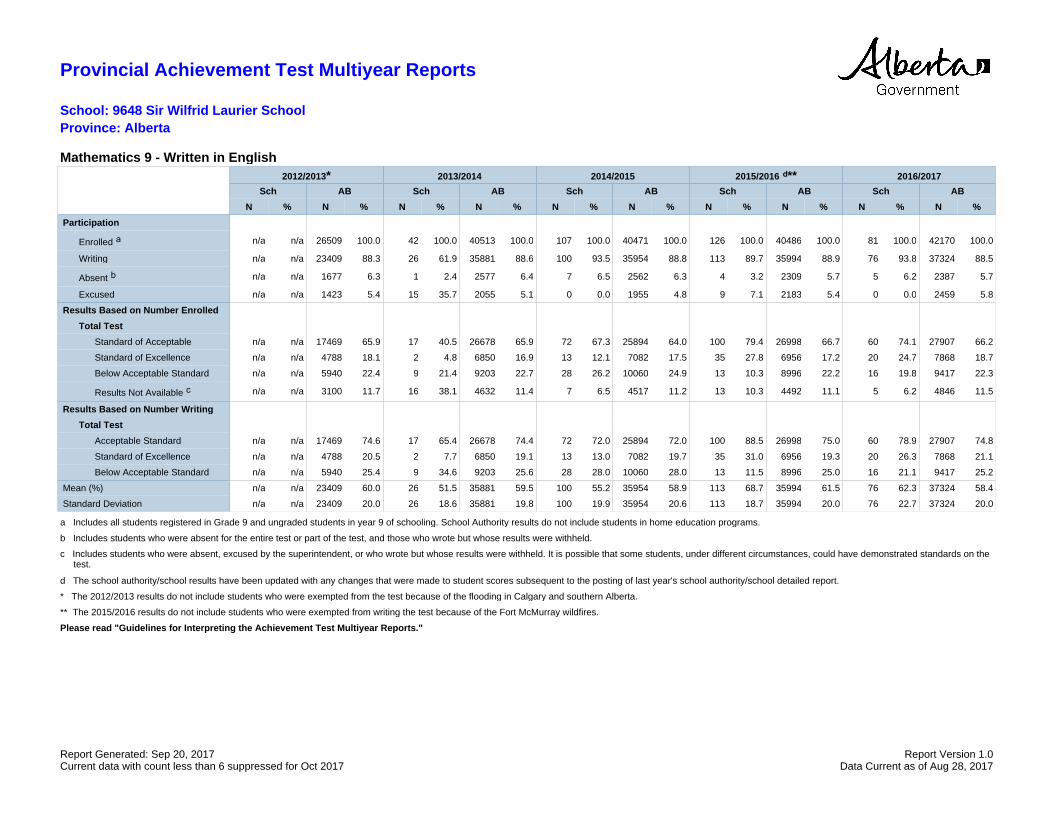
Mathematics 9 - Written in English
School: 9648 Sir Wilfrid Laurier SchoolProvince: Alberta
Please read "Guidelines for Interpreting the Achievement Test Multiyear Reports."
* The 2012/2013 results do not include students who were exempted from the test because of the flooding in Calgary and southern Alberta.
a Includes all students registered in Grade 9 and ungraded students in year 9 of schooling. School Authority results do not include students in home education programs.
b Includes students who were absent for the entire test or part of the test, and those who wrote but whose results were withheld.
c Includes students who were absent, excused by the superintendent, or who wrote but whose results were withheld. It is possible that some students, under different circumstances, could have demonstrated standards on the test.
d The school authority/school results have been updated with any changes that were made to student scores subsequent to the posting of last year's school authority/school detailed report.
2012/2013* 2013/2014 2014/2015 2015/2016 ᵈ** 2016/2017
Sch AB Sch AB Sch AB Sch AB Sch AB
N % N % N % N % N % N % N % N % N % N %
Participation
Enrolled ᵃ n/a n/a 26509 100.0 42 100.0 40513 100.0 107 100.0 40471 100.0 126 100.0 40486 100.0 81 100.0 42170 100.0
Writing n/a n/a 23409 88.3 26 61.9 35881 88.6 100 93.5 35954 88.8 113 89.7 35994 88.9 76 93.8 37324 88.5
Absent ᵇ n/a n/a 1677 6.3 1 2.4 2577 6.4 7 6.5 2562 6.3 4 3.2 2309 5.7 5 6.2 2387 5.7
Excused n/a n/a 1423 5.4 15 35.7 2055 5.1 0 0.0 1955 4.8 9 7.1 2183 5.4 0 0.0 2459 5.8
Results Based on Number Enrolled
Total Test
Standard of Acceptable n/a n/a 17469 65.9 17 40.5 26678 65.9 72 67.3 25894 64.0 100 79.4 26998 66.7 60 74.1 27907 66.2
Standard of Excellence n/a n/a 4788 18.1 2 4.8 6850 16.9 13 12.1 7082 17.5 35 27.8 6956 17.2 20 24.7 7868 18.7
Below Acceptable Standard n/a n/a 5940 22.4 9 21.4 9203 22.7 28 26.2 10060 24.9 13 10.3 8996 22.2 16 19.8 9417 22.3
Results Not Available ᶜ n/a n/a 3100 11.7 16 38.1 4632 11.4 7 6.5 4517 11.2 13 10.3 4492 11.1 5 6.2 4846 11.5
Results Based on Number Writing
Total Test
Acceptable Standard n/a n/a 17469 74.6 17 65.4 26678 74.4 72 72.0 25894 72.0 100 88.5 26998 75.0 60 78.9 27907 74.8
Standard of Excellence n/a n/a 4788 20.5 2 7.7 6850 19.1 13 13.0 7082 19.7 35 31.0 6956 19.3 20 26.3 7868 21.1
Below Acceptable Standard n/a n/a 5940 25.4 9 34.6 9203 25.6 28 28.0 10060 28.0 13 11.5 8996 25.0 16 21.1 9417 25.2
Mean (%) n/a n/a 23409 60.0 26 51.5 35881 59.5 100 55.2 35954 58.9 113 68.7 35994 61.5 76 62.3 37324 58.4
Standard Deviation n/a n/a 23409 20.0 26 18.6 35881 19.8 100 19.9 35954 20.6 113 18.7 35994 20.0 76 22.7 37324 20.0
** The 2015/2016 results do not include students who were exempted from writing the test because of the Fort McMurray wildfires.
Report Generated: Sep 20, 2017Current data with count less than 6 suppressed for Oct 2017
Report Version 1.0Data Current as of Aug 28, 2017
Provincial Achievement Test Multiyear Reports

Mathematics 9 KAE - All Students Writing
School: 9648 Sir Wilfrid Laurier SchoolProvince: Alberta
Please read "Guidelines for Interpreting the Achievement Test Multiyear Reports."
* The 2012/2013 results do not include students who were exempted from the test because of the flooding in Calgary and southern Alberta.
a Includes all students registered in Grade 9 and ungraded students in year 9 of schooling. School Authority results do not include students in home education programs.
b Includes students who were absent for the entire test or part of the test, and those who wrote but whose results were withheld.
c Includes students who were absent, excused by the superintendent, or who wrote but whose results were withheld. It is possible that some students, under different circumstances, could have demonstrated standards on the test.
d The school authority/school results have been updated with any changes that were made to student scores subsequent to the posting of last year's school authority/school detailed report.
2012/2013* 2013/2014 2014/2015 2015/2016 ᵈ** 2016/2017
Sch AB Sch AB Sch AB Sch AB Sch AB
N % N % N % N % N % N % N % N % N % N %
Participation
Enrolled ᵃ n/a n/a 1665 100.0 3 100.0 1977 100.0 4 100.0 1975 100.0 n/a n/a 2125 100.0 2 100.0 1848 100.0
Writing n/a n/a 1464 87.9 1 33.3 1704 86.2 3 75.0 1696 85.9 n/a n/a 1844 86.8 2 100.0 1572 85.1
Absent ᵇ n/a n/a 141 8.5 1 33.3 204 10.3 1 25.0 207 10.5 n/a n/a 201 9.5 0 0.0 186 10.1
Excused n/a n/a 60 3.6 1 33.3 69 3.5 0 0.0 72 3.6 n/a n/a 80 3.8 0 0.0 90 4.9
Results Based on Number Enrolled
Total Test
Standard of Acceptable n/a n/a 1096 65.8 n/a n/a 1254 63.4 n/a n/a 1202 60.9 n/a n/a 1301 61.2 n/a n/a 1062 57.5
Standard of Excellence n/a n/a 245 14.7 n/a n/a 287 14.5 n/a n/a 285 14.4 n/a n/a 277 13.0 n/a n/a 246 13.3
Below Acceptable Standard n/a n/a 368 22.1 n/a n/a 450 22.8 n/a n/a 494 25.0 n/a n/a 543 25.6 n/a n/a 510 27.6
Results Not Available ᶜ n/a n/a 201 12.1 n/a n/a 273 13.8 n/a n/a 279 14.1 n/a n/a 281 13.2 n/a n/a 276 14.9
Results Based on Number Writing
Total Test
Acceptable Standard n/a n/a 1096 74.9 n/a n/a 1254 73.6 n/a n/a 1202 70.9 n/a n/a 1301 70.6 n/a n/a 1062 67.6
Standard of Excellence n/a n/a 245 16.7 n/a n/a 287 16.8 n/a n/a 285 16.8 n/a n/a 277 15.0 n/a n/a 246 15.6
Below Acceptable Standard n/a n/a 368 25.1 n/a n/a 450 26.4 n/a n/a 494 29.1 n/a n/a 543 29.4 n/a n/a 510 32.4
Knowledge
Acceptable Standard n/a n/a 1003 68.5 n/a n/a 1213 71.2 n/a n/a 1196 70.5 n/a n/a 1221 66.2 n/a n/a 1109 70.5
Standard of Excellence n/a n/a 305 20.8 n/a n/a 425 24.9 n/a n/a 424 25.0 n/a n/a 406 22.0 n/a n/a 282 17.9
Skills
Acceptable Standard n/a n/a 1121 76.6 n/a n/a 1274 74.8 n/a n/a 1230 72.5 n/a n/a 1355 73.5 n/a n/a 1138 72.4
Standard of Excellence n/a n/a 303 20.7 n/a n/a 303 17.8 n/a n/a 319 18.8 n/a n/a 325 17.6 n/a n/a 310 19.7
Mean (%) n/a n/a 1464 64.1 n/a n/a 1704 62.8 n/a n/a 1696 63.3 n/a n/a 1844 62.6 n/a n/a 1572 61.5
Standard Deviation n/a n/a 1464 17.0 n/a n/a 1704 16.4 n/a n/a 1696 16.1 n/a n/a 1844 17.4 n/a n/a 1572 18.0
** The 2015/2016 results do not include students who were exempted from writing the test because of the Fort McMurray wildfires.
Report Generated: Sep 20, 2017Current data with count less than 6 suppressed for Oct 2017
Report Version 1.0Data Current as of Aug 28, 2017
Provincial Achievement Test Multiyear Reports

Mathematics 9 KAE - Written in English
School: 9648 Sir Wilfrid Laurier SchoolProvince: Alberta
Please read "Guidelines for Interpreting the Achievement Test Multiyear Reports."
* The 2012/2013 results do not include students who were exempted from the test because of the flooding in Calgary and southern Alberta.
a Includes all students registered in Grade 9 and ungraded students in year 9 of schooling. School Authority results do not include students in home education programs.
b Includes students who were absent for the entire test or part of the test, and those who wrote but whose results were withheld.
c Includes students who were absent, excused by the superintendent, or who wrote but whose results were withheld. It is possible that some students, under different circumstances, could have demonstrated standards on the test.
d The school authority/school results have been updated with any changes that were made to student scores subsequent to the posting of last year's school authority/school detailed report.
2012/2013* 2013/2014 2014/2015 2015/2016 ᵈ** 2016/2017
Sch AB Sch AB Sch AB Sch AB Sch AB
N % N % N % N % N % N % N % N % N % N %
Participation
Enrolled ᵃ n/a n/a 1655 100.0 3 100.0 1947 100.0 4 100.0 1946 100.0 n/a n/a 2076 100.0 2 100.0 1807 100.0
Writing n/a n/a 1454 87.9 1 33.3 1677 86.1 3 75.0 1668 85.7 n/a n/a 1799 86.7 2 100.0 1531 84.7
Absent ᵇ n/a n/a 141 8.5 1 33.3 203 10.4 1 25.0 206 10.6 n/a n/a 201 9.7 0 0.0 186 10.3
Excused n/a n/a 60 3.6 1 33.3 67 3.4 0 0.0 72 3.7 n/a n/a 76 3.7 0 0.0 90 5.0
Results Based on Number Enrolled
Total Test
Standard of Acceptable n/a n/a 1089 65.8 n/a n/a 1235 63.4 n/a n/a 1179 60.6 n/a n/a 1261 60.7 n/a n/a 1030 57.0
Standard of Excellence n/a n/a 243 14.7 n/a n/a 283 14.5 n/a n/a 280 14.4 n/a n/a 263 12.7 n/a n/a 240 13.3
Below Acceptable Standard n/a n/a 365 22.1 n/a n/a 442 22.7 n/a n/a 489 25.1 n/a n/a 538 25.9 n/a n/a 501 27.7
Results Not Available ᶜ n/a n/a 201 12.1 n/a n/a 270 13.9 n/a n/a 278 14.3 n/a n/a 277 13.3 n/a n/a 276 15.3
Results Based on Number Writing
Total Test
Acceptable Standard n/a n/a 1089 74.9 n/a n/a 1235 73.6 n/a n/a 1179 70.7 n/a n/a 1261 70.1 n/a n/a 1030 67.3
Standard of Excellence n/a n/a 243 16.7 n/a n/a 283 16.9 n/a n/a 280 16.8 n/a n/a 263 14.6 n/a n/a 240 15.7
Below Acceptable Standard n/a n/a 365 25.1 n/a n/a 442 26.4 n/a n/a 489 29.3 n/a n/a 538 29.9 n/a n/a 501 32.7
Knowledge
Acceptable Standard n/a n/a 996 68.5 n/a n/a 1196 71.3 n/a n/a 1176 70.5 n/a n/a 1184 65.8 n/a n/a 1074 70.2
Standard of Excellence n/a n/a 303 20.8 n/a n/a 418 24.9 n/a n/a 415 24.9 n/a n/a 389 21.6 n/a n/a 277 18.1
Skills
Acceptable Standard n/a n/a 1115 76.7 n/a n/a 1255 74.8 n/a n/a 1206 72.3 n/a n/a 1312 72.9 n/a n/a 1103 72.0
Standard of Excellence n/a n/a 301 20.7 n/a n/a 299 17.8 n/a n/a 317 19.0 n/a n/a 312 17.3 n/a n/a 302 19.7
Mean (%) n/a n/a 1454 64.1 n/a n/a 1677 62.8 n/a n/a 1668 63.3 n/a n/a 1799 62.4 n/a n/a 1531 61.4
Standard Deviation n/a n/a 1454 17.0 n/a n/a 1677 16.4 n/a n/a 1668 16.1 n/a n/a 1799 17.4 n/a n/a 1531 18.1
** The 2015/2016 results do not include students who were exempted from writing the test because of the Fort McMurray wildfires.
Report Generated: Sep 20, 2017Current data with count less than 6 suppressed for Oct 2017
Report Version 1.0Data Current as of Aug 28, 2017
Provincial Achievement Test Multiyear Reports

Science 9 - All Students Writing
School: 9648 Sir Wilfrid Laurier SchoolProvince: Alberta
Please read "Guidelines for Interpreting the Achievement Test Multiyear Reports."
* The 2012/2013 results do not include students who were exempted from the test because of the flooding in Calgary and southern Alberta.
a Includes all students registered in Grade 9 and ungraded students in year 9 of schooling. School Authority results do not include students in home education programs.
b Includes students who were absent for the entire test or part of the test, and those who wrote but whose results were withheld.
c Includes students who were absent, excused by the superintendent, or who wrote but whose results were withheld. It is possible that some students, under different circumstances, could have demonstrated standards on the test.
d The school authority/school results have been updated with any changes that were made to student scores subsequent to the posting of last year's school authority/school detailed report.
2012/2013* 2013/2014 2014/2015 2015/2016 ᵈ** 2016/2017
Sch AB Sch AB Sch AB Sch AB Sch AB
N % N % N % N % N % N % N % N % N % N %
Participation
Enrolled ᵃ n/a n/a 28690 100.0 41 100.0 43845 100.0 109 100.0 43744 100.0 126 100.0 43834 100.0 81 100.0 45445 100.0
Writing n/a n/a 25615 89.3 27 65.9 39268 89.6 103 94.5 39327 89.9 117 92.9 39395 89.9 79 97.5 40605 89.3
Absent ᵇ n/a n/a 1676 5.8 0 0.0 2582 5.9 6 5.5 2525 5.8 2 1.6 2352 5.4 2 2.5 2392 5.3
Excused n/a n/a 1399 4.9 14 34.1 1995 4.6 0 0.0 1892 4.3 7 5.6 2087 4.8 0 0.0 2448 5.4
Results Based on Number Enrolled
Total Test
Standard of Acceptable n/a n/a 20927 72.9 13 31.7 32101 73.2 79 72.5 32395 74.1 101 80.2 32546 74.2 60 74.1 33625 74.0
Standard of Excellence n/a n/a 5737 20.0 0 0.0 9676 22.1 13 11.9 9992 22.8 34 27.0 9825 22.4 20 24.7 9703 21.4
Below Acceptable Standard n/a n/a 4688 16.3 14 34.1 7167 16.3 24 22.0 6932 15.8 16 12.7 6849 15.6 19 23.5 6980 15.4
Results Not Available ᶜ n/a n/a 3075 10.7 14 34.1 4577 10.4 6 5.5 4417 10.1 9 7.1 4439 10.1 2 2.5 4840 10.7
Results Based on Number Writing
Total Test
Acceptable Standard n/a n/a 20927 81.7 13 48.1 32101 81.7 79 76.7 32395 82.4 101 86.3 32546 82.6 60 75.9 33625 82.8
Standard of Excellence n/a n/a 5737 22.4 0 0.0 9676 24.6 13 12.6 9992 25.4 34 29.1 9825 24.9 20 25.3 9703 23.9
Below Acceptable Standard n/a n/a 4688 18.3 14 51.9 7167 18.3 24 23.3 6932 17.6 16 13.7 6849 17.4 19 24.1 6980 17.2
Knowledge
Acceptable Standard n/a n/a 20705 80.8 11 40.7 31626 80.5 73 70.9 32317 82.2 97 82.9 32333 82.1 65 82.3 34190 84.2
Standard of Excellence n/a n/a 5041 19.7 0 0.0 10602 27.0 15 14.6 10894 27.7 22 18.8 9691 24.6 21 26.6 10538 26.0
Skills
Acceptable Standard n/a n/a 21127 82.5 14 51.9 32514 82.8 80 77.7 32513 82.7 103 88.0 32765 83.2 59 74.7 33302 82.0
Standard of Excellence n/a n/a 7418 29.0 2 7.4 10917 27.8 20 19.4 11350 28.9 48 41.0 11931 30.3 21 26.6 11105 27.3
Mean (%) n/a n/a 25615 64.8 27 47.7 39268 66.1 103 59.8 39327 65.9 117 69.4 39395 66.6 79 64.1 40605 66.5
Standard Deviation n/a n/a 25615 18.1 27 16.6 39268 18.2 103 18.4 39327 19.1 117 19.6 39395 19.5 79 20.5 40605 19.4
** The 2015/2016 results do not include students who were exempted from writing the test because of the Fort McMurray wildfires.
Report Generated: Sep 20, 2017Current data with count less than 6 suppressed for Oct 2017
Report Version 1.0Data Current as of Aug 28, 2017
Provincial Achievement Test Multiyear Reports

Science 9 - Written in English
School: 9648 Sir Wilfrid Laurier SchoolProvince: Alberta
Please read "Guidelines for Interpreting the Achievement Test Multiyear Reports."
* The 2012/2013 results do not include students who were exempted from the test because of the flooding in Calgary and southern Alberta.
a Includes all students registered in Grade 9 and ungraded students in year 9 of schooling. School Authority results do not include students in home education programs.
b Includes students who were absent for the entire test or part of the test, and those who wrote but whose results were withheld.
c Includes students who were absent, excused by the superintendent, or who wrote but whose results were withheld. It is possible that some students, under different circumstances, could have demonstrated standards on the test.
d The school authority/school results have been updated with any changes that were made to student scores subsequent to the posting of last year's school authority/school detailed report.
2012/2013* 2013/2014 2014/2015 2015/2016 ᵈ** 2016/2017
Sch AB Sch AB Sch AB Sch AB Sch AB
N % N % N % N % N % N % N % N % N % N %
Participation
Enrolled ᵃ n/a n/a 27162 100.0 41 100.0 40952 100.0 109 100.0 40942 100.0 126 100.0 41072 100.0 81 100.0 42587 100.0
Writing n/a n/a 24118 88.8 27 65.9 36443 89.0 103 94.5 36597 89.4 117 92.9 36695 89.3 79 97.5 37808 88.8
Absent ᵇ n/a n/a 1653 6.1 0 0.0 2540 6.2 6 5.5 2483 6.1 2 1.6 2316 5.6 2 2.5 2356 5.5
Excused n/a n/a 1391 5.1 14 34.1 1969 4.8 0 0.0 1862 4.5 7 5.6 2061 5.0 0 0.0 2423 5.7
Results Based on Number Enrolled
Total Test
Standard of Acceptable n/a n/a 19667 72.4 13 31.7 29705 72.5 79 72.5 30018 73.3 101 80.2 30187 73.5 60 74.1 31166 73.2
Standard of Excellence n/a n/a 5397 19.9 0 0.0 9008 22.0 13 11.9 9347 22.8 34 27.0 9242 22.5 20 24.7 9063 21.3
Below Acceptable Standard n/a n/a 4451 16.4 14 34.1 6738 16.5 24 22.0 6579 16.1 16 12.7 6508 15.8 19 23.5 6642 15.6
Results Not Available ᶜ n/a n/a 3044 11.2 14 34.1 4509 11.0 6 5.5 4345 10.6 9 7.1 4377 10.7 2 2.5 4779 11.2
Results Based on Number Writing
Total Test
Acceptable Standard n/a n/a 19667 81.5 13 48.1 29705 81.5 79 76.7 30018 82.0 101 86.3 30187 82.3 60 75.9 31166 82.4
Standard of Excellence n/a n/a 5397 22.4 0 0.0 9008 24.7 13 12.6 9347 25.5 34 29.1 9242 25.2 20 25.3 9063 24.0
Below Acceptable Standard n/a n/a 4451 18.5 14 51.9 6738 18.5 24 23.3 6579 18.0 16 13.7 6508 17.7 19 24.1 6642 17.6
Knowledge
Acceptable Standard n/a n/a 19452 80.7 11 40.7 29280 80.3 73 70.9 29961 81.9 97 82.9 29977 81.7 65 82.3 31733 83.9
Standard of Excellence n/a n/a 4737 19.6 0 0.0 9851 27.0 15 14.6 10281 28.1 22 18.8 9014 24.6 21 26.6 9833 26.0
Skills
Acceptable Standard n/a n/a 19862 82.4 14 51.9 30082 82.5 80 77.7 30114 82.3 103 88.0 30414 82.9 59 74.7 30845 81.6
Standard of Excellence n/a n/a 6974 28.9 2 7.4 10151 27.9 20 19.4 10516 28.7 48 41.0 11225 30.6 21 26.6 10354 27.4
Mean (%) n/a n/a 24118 64.8 27 47.7 36443 66.1 103 59.8 36597 65.8 117 69.4 36695 66.8 79 64.1 37808 66.4
Standard Deviation n/a n/a 24118 18.2 27 16.6 36443 18.3 103 18.4 36597 19.2 117 19.6 36695 19.7 79 20.5 37808 19.5
** The 2015/2016 results do not include students who were exempted from writing the test because of the Fort McMurray wildfires.
Report Generated: Sep 20, 2017Current data with count less than 6 suppressed for Oct 2017
Report Version 1.0Data Current as of Aug 28, 2017
Provincial Achievement Test Multiyear Reports

Science 9 KAE - All Students Writing
School: 9648 Sir Wilfrid Laurier SchoolProvince: Alberta
Please read "Guidelines for Interpreting the Achievement Test Multiyear Reports."
* The 2012/2013 results do not include students who were exempted from the test because of the flooding in Calgary and southern Alberta.
a Includes all students registered in Grade 9 and ungraded students in year 9 of schooling. School Authority results do not include students in home education programs.
b Includes students who were absent for the entire test or part of the test, and those who wrote but whose results were withheld.
c Includes students who were absent, excused by the superintendent, or who wrote but whose results were withheld. It is possible that some students, under different circumstances, could have demonstrated standards on the test.
d The school authority/school results have been updated with any changes that were made to student scores subsequent to the posting of last year's school authority/school detailed report.
2012/2013* 2013/2014 2014/2015 2015/2016 ᵈ** 2016/2017
Sch AB Sch AB Sch AB Sch AB Sch AB
N % N % N % N % N % N % N % N % N % N %
Participation
Enrolled ᵃ n/a n/a 1425 100.0 4 100.0 1517 100.0 2 100.0 1534 100.0 n/a n/a 1591 100.0 2 100.0 1440 100.0
Writing n/a n/a 1239 86.9 1 25.0 1299 85.6 2 100.0 1335 87.0 n/a n/a 1358 85.4 2 100.0 1204 83.6
Absent ᵇ n/a n/a 116 8.1 1 25.0 150 9.9 0 0.0 141 9.2 n/a n/a 157 9.9 0 0.0 162 11.3
Excused n/a n/a 70 4.9 2 50.0 68 4.5 0 0.0 58 3.8 n/a n/a 76 4.8 0 0.0 74 5.1
Results Based on Number Enrolled
Total Test
Standard of Acceptable n/a n/a 975 68.4 n/a n/a 972 64.1 n/a n/a 990 64.5 n/a n/a 1015 63.8 n/a n/a 920 63.9
Standard of Excellence n/a n/a 244 17.1 n/a n/a 226 14.9 n/a n/a 232 15.1 n/a n/a 228 14.3 n/a n/a 192 13.3
Below Acceptable Standard n/a n/a 264 18.5 n/a n/a 327 21.6 n/a n/a 345 22.5 n/a n/a 343 21.6 n/a n/a 284 19.7
Results Not Available ᶜ n/a n/a 186 13.1 n/a n/a 218 14.4 n/a n/a 199 13.0 n/a n/a 233 14.6 n/a n/a 236 16.4
Results Based on Number Writing
Total Test
Acceptable Standard n/a n/a 975 78.7 n/a n/a 972 74.8 n/a n/a 990 74.2 n/a n/a 1015 74.7 n/a n/a 920 76.4
Standard of Excellence n/a n/a 244 19.7 n/a n/a 226 17.4 n/a n/a 232 17.4 n/a n/a 228 16.8 n/a n/a 192 15.9
Below Acceptable Standard n/a n/a 264 21.3 n/a n/a 327 25.2 n/a n/a 345 25.8 n/a n/a 343 25.3 n/a n/a 284 23.6
Knowledge
Acceptable Standard n/a n/a 958 77.3 n/a n/a 1017 78.3 n/a n/a 1026 76.9 n/a n/a 1037 76.4 n/a n/a 932 77.4
Standard of Excellence n/a n/a 306 24.7 n/a n/a 263 20.2 n/a n/a 210 15.7 n/a n/a 219 16.1 n/a n/a 180 15.0
Skills
Acceptable Standard n/a n/a 1004 81.0 n/a n/a 1015 78.1 n/a n/a 977 73.2 n/a n/a 1003 73.9 n/a n/a 900 74.8
Standard of Excellence n/a n/a 207 16.7 n/a n/a 215 16.6 n/a n/a 259 19.4 n/a n/a 244 18.0 n/a n/a 191 15.9
Mean (%) n/a n/a 1239 65.4 n/a n/a 1299 63.6 n/a n/a 1335 64.4 n/a n/a 1358 63.0 n/a n/a 1204 62.4
Standard Deviation n/a n/a 1239 15.2 n/a n/a 1299 16.0 n/a n/a 1335 16.7 n/a n/a 1358 17.3 n/a n/a 1204 17.8
** The 2015/2016 results do not include students who were exempted from writing the test because of the Fort McMurray wildfires.
Report Generated: Sep 20, 2017Current data with count less than 6 suppressed for Oct 2017
Report Version 1.0Data Current as of Aug 28, 2017
Provincial Achievement Test Multiyear Reports

Science 9 KAE - Written in English
School: 9648 Sir Wilfrid Laurier SchoolProvince: Alberta
Please read "Guidelines for Interpreting the Achievement Test Multiyear Reports."
* The 2012/2013 results do not include students who were exempted from the test because of the flooding in Calgary and southern Alberta.
a Includes all students registered in Grade 9 and ungraded students in year 9 of schooling. School Authority results do not include students in home education programs.
b Includes students who were absent for the entire test or part of the test, and those who wrote but whose results were withheld.
c Includes students who were absent, excused by the superintendent, or who wrote but whose results were withheld. It is possible that some students, under different circumstances, could have demonstrated standards on the test.
d The school authority/school results have been updated with any changes that were made to student scores subsequent to the posting of last year's school authority/school detailed report.
2012/2013* 2013/2014 2014/2015 2015/2016 ᵈ** 2016/2017
Sch AB Sch AB Sch AB Sch AB Sch AB
N % N % N % N % N % N % N % N % N % N %
Participation
Enrolled ᵃ n/a n/a 1422 100.0 4 100.0 1500 100.0 2 100.0 1518 100.0 n/a n/a 1567 100.0 2 100.0 1421 100.0
Writing n/a n/a 1236 86.9 1 25.0 1283 85.5 2 100.0 1319 86.9 n/a n/a 1336 85.3 2 100.0 1185 83.4
Absent ᵇ n/a n/a 116 8.2 1 25.0 149 9.9 0 0.0 141 9.3 n/a n/a 157 10.0 0 0.0 162 11.4
Excused n/a n/a 70 4.9 2 50.0 68 4.5 0 0.0 58 3.8 n/a n/a 74 4.7 0 0.0 74 5.2
Results Based on Number Enrolled
Total Test
Standard of Acceptable n/a n/a 974 68.5 n/a n/a 969 64.6 n/a n/a 981 64.6 n/a n/a 996 63.6 n/a n/a 906 63.8
Standard of Excellence n/a n/a 243 17.1 n/a n/a 226 15.1 n/a n/a 232 15.3 n/a n/a 227 14.5 n/a n/a 191 13.4
Below Acceptable Standard n/a n/a 262 18.4 n/a n/a 314 20.9 n/a n/a 338 22.3 n/a n/a 340 21.7 n/a n/a 279 19.6
Results Not Available ᶜ n/a n/a 186 13.1 n/a n/a 217 14.5 n/a n/a 199 13.1 n/a n/a 231 14.7 n/a n/a 236 16.6
Results Based on Number Writing
Total Test
Acceptable Standard n/a n/a 974 78.8 n/a n/a 969 75.5 n/a n/a 981 74.4 n/a n/a 996 74.6 n/a n/a 906 76.5
Standard of Excellence n/a n/a 243 19.7 n/a n/a 226 17.6 n/a n/a 232 17.6 n/a n/a 227 17.0 n/a n/a 191 16.1
Below Acceptable Standard n/a n/a 262 21.2 n/a n/a 314 24.5 n/a n/a 338 25.6 n/a n/a 340 25.4 n/a n/a 279 23.5
Knowledge
Acceptable Standard n/a n/a 957 77.4 n/a n/a 1011 78.8 n/a n/a 1019 77.3 n/a n/a 1022 76.5 n/a n/a 917 77.4
Standard of Excellence n/a n/a 305 24.7 n/a n/a 263 20.5 n/a n/a 210 15.9 n/a n/a 218 16.3 n/a n/a 179 15.1
Skills
Acceptable Standard n/a n/a 1003 81.1 n/a n/a 1009 78.6 n/a n/a 968 73.4 n/a n/a 985 73.7 n/a n/a 885 74.7
Standard of Excellence n/a n/a 207 16.7 n/a n/a 215 16.8 n/a n/a 259 19.6 n/a n/a 243 18.2 n/a n/a 190 16.0
Mean (%) n/a n/a 1236 65.4 n/a n/a 1283 63.8 n/a n/a 1319 64.5 n/a n/a 1336 63.1 n/a n/a 1185 62.5
Standard Deviation n/a n/a 1236 15.2 n/a n/a 1283 15.9 n/a n/a 1319 16.7 n/a n/a 1336 17.3 n/a n/a 1185 17.8
** The 2015/2016 results do not include students who were exempted from writing the test because of the Fort McMurray wildfires.
Report Generated: Sep 20, 2017Current data with count less than 6 suppressed for Oct 2017
Report Version 1.0Data Current as of Aug 28, 2017
Provincial Achievement Test Multiyear Reports

Social Studies 9 - All Students Writing
School: 9648 Sir Wilfrid Laurier SchoolProvince: Alberta
Please read "Guidelines for Interpreting the Achievement Test Multiyear Reports."
* The 2012/2013 results do not include students who were exempted from the test because of the flooding in Calgary and southern Alberta.
a Includes all students registered in Grade 9 and ungraded students in year 9 of schooling. School Authority results do not include students in home education programs.
b Includes students who were absent for the entire test or part of the test, and those who wrote but whose results were withheld.
c Includes students who were absent, excused by the superintendent, or who wrote but whose results were withheld. It is possible that some students, under different circumstances, could have demonstrated standards on the test.
d The school authority/school results have been updated with any changes that were made to student scores subsequent to the posting of last year's school authority/school detailed report.
2012/2013* 2013/2014 2014/2015 2015/2016 ᵈ** 2016/2017
Sch AB Sch AB Sch AB Sch AB Sch AB
N % N % N % N % N % N % N % N % N % N %
Participation
Enrolled ᵃ n/a n/a 28887 100.0 44 100.0 43849 100.0 110 100.0 43541 100.0 126 100.0 43775 100.0 81 100.0 45484 100.0
Writing n/a n/a 25598 88.6 26 59.1 38902 88.7 102 92.7 38598 88.6 111 88.1 38990 89.1 77 95.1 40653 89.4
Absent ᵇ n/a n/a 1891 6.5 2 4.5 2884 6.6 8 7.3 3016 6.9 7 5.6 2622 6.0 4 4.9 2350 5.2
Excused n/a n/a 1398 4.8 16 36.4 2063 4.7 0 0.0 1927 4.4 8 6.3 2163 4.9 0 0.0 2481 5.5
Results Based on Number Enrolled
Total Test
Standard of Acceptable n/a n/a 18935 65.5 13 29.5 28736 65.5 67 60.9 28346 65.1 96 76.2 28327 64.7 54 66.7 30487 67.0
Standard of Excellence n/a n/a 5426 18.8 3 6.8 8716 19.9 13 11.8 8625 19.8 40 31.7 7901 18.0 18 22.2 9204 20.2
Below Acceptable Standard n/a n/a 6663 23.1 13 29.5 10166 23.2 35 31.8 10252 23.5 15 11.9 10663 24.4 23 28.4 10166 22.4
Results Not Available ᶜ n/a n/a 3289 11.4 18 40.9 4947 11.3 8 7.3 4943 11.4 15 11.9 4785 10.9 4 4.9 4831 10.6
Results Based on Number Writing
Total Test
Acceptable Standard n/a n/a 18935 74.0 13 50.0 28736 73.9 67 65.7 28346 73.4 96 86.5 28327 72.7 54 70.1 30487 75.0
Standard of Excellence n/a n/a 5426 21.2 3 11.5 8716 22.4 13 12.7 8625 22.3 40 36.0 7901 20.3 18 23.4 9204 22.6
Below Acceptable Standard n/a n/a 6663 26.0 13 50.0 10166 26.1 35 34.3 10252 26.6 15 13.5 10663 27.3 23 29.9 10166 25.0
Mean (%) n/a n/a 25598 65.7 26 55.0 38902 64.1 102 58.3 38598 64.0 111 73.1 38990 63.2 77 64.7 40653 65.6
Standard Deviation n/a n/a 25598 19.3 26 20.2 38902 19.3 102 19.4 38598 19.4 111 16.1 38990 19.1 77 21.2 40653 19.8
** The 2015/2016 results do not include students who were exempted from writing the test because of the Fort McMurray wildfires.
Report Generated: Sep 20, 2017Current data with count less than 6 suppressed for Oct 2017
Report Version 1.0Data Current as of Aug 28, 2017
Provincial Achievement Test Multiyear Reports

Social Studies 9 - Written in English
School: 9648 Sir Wilfrid Laurier SchoolProvince: Alberta
Please read "Guidelines for Interpreting the Achievement Test Multiyear Reports."
* The 2012/2013 results do not include students who were exempted from the test because of the flooding in Calgary and southern Alberta.
a Includes all students registered in Grade 9 and ungraded students in year 9 of schooling. School Authority results do not include students in home education programs.
b Includes students who were absent for the entire test or part of the test, and those who wrote but whose results were withheld.
c Includes students who were absent, excused by the superintendent, or who wrote but whose results were withheld. It is possible that some students, under different circumstances, could have demonstrated standards on the test.
d The school authority/school results have been updated with any changes that were made to student scores subsequent to the posting of last year's school authority/school detailed report.
2012/2013* 2013/2014 2014/2015 2015/2016 ᵈ** 2016/2017
Sch AB Sch AB Sch AB Sch AB Sch AB
N % N % N % N % N % N % N % N % N % N %
Participation
Enrolled ᵃ n/a n/a 27248 100.0 44 100.0 40816 100.0 110 100.0 40621 100.0 126 100.0 40817 100.0 81 100.0 42406 100.0
Writing n/a n/a 23988 88.0 26 59.1 35976 88.1 102 92.7 35795 88.1 111 88.1 36100 88.4 77 95.1 37644 88.8
Absent ᵇ n/a n/a 1869 6.9 2 4.5 2805 6.9 8 7.3 2937 7.2 7 5.6 2586 6.3 4 4.9 2311 5.4
Excused n/a n/a 1391 5.1 16 36.4 2035 5.0 0 0.0 1889 4.7 8 6.3 2131 5.2 0 0.0 2451 5.8
Results Based on Number Enrolled
Total Test
Standard of Acceptable n/a n/a 17662 64.8 13 29.5 26465 64.8 67 60.9 26167 64.4 96 76.2 26111 64.0 54 66.7 28110 66.3
Standard of Excellence n/a n/a 5196 19.1 3 6.8 8274 20.3 13 11.8 8112 20.0 40 31.7 7477 18.3 18 22.2 8561 20.2
Below Acceptable Standard n/a n/a 6326 23.2 13 29.5 9511 23.3 35 31.8 9628 23.7 15 11.9 9989 24.5 23 28.4 9534 22.5
Results Not Available ᶜ n/a n/a 3260 12.0 18 40.9 4840 11.9 8 7.3 4826 11.9 15 11.9 4717 11.6 4 4.9 4762 11.2
Results Based on Number Writing
Total Test
Acceptable Standard n/a n/a 17662 73.6 13 50.0 26465 73.6 67 65.7 26167 73.1 96 86.5 26111 72.3 54 70.1 28110 74.7
Standard of Excellence n/a n/a 5196 21.7 3 11.5 8274 23.0 13 12.7 8112 22.7 40 36.0 7477 20.7 18 23.4 8561 22.7
Below Acceptable Standard n/a n/a 6326 26.4 13 50.0 9511 26.4 35 34.3 9628 26.9 15 13.5 9989 27.7 23 29.9 9534 25.3
Mean (%) n/a n/a 23988 65.7 26 55.0 35976 64.2 102 58.3 35795 63.9 111 73.1 36100 63.1 77 64.7 37644 65.5
Standard Deviation n/a n/a 23988 19.4 26 20.2 35976 19.4 102 19.4 35795 19.5 111 16.1 36100 19.3 77 21.2 37644 19.9
** The 2015/2016 results do not include students who were exempted from writing the test because of the Fort McMurray wildfires.
Report Generated: Sep 20, 2017Current data with count less than 6 suppressed for Oct 2017
Report Version 1.0Data Current as of Aug 28, 2017
Provincial Achievement Test Multiyear Reports

Social Studies 9 KAE - All Students Writing
School: 9648 Sir Wilfrid Laurier SchoolProvince: Alberta
Please read "Guidelines for Interpreting the Achievement Test Multiyear Reports."
* The 2012/2013 results do not include students who were exempted from the test because of the flooding in Calgary and southern Alberta.
a Includes all students registered in Grade 9 and ungraded students in year 9 of schooling. School Authority results do not include students in home education programs.
b Includes students who were absent for the entire test or part of the test, and those who wrote but whose results were withheld.
c Includes students who were absent, excused by the superintendent, or who wrote but whose results were withheld. It is possible that some students, under different circumstances, could have demonstrated standards on the test.
d The school authority/school results have been updated with any changes that were made to student scores subsequent to the posting of last year's school authority/school detailed report.
2012/2013* 2013/2014 2014/2015 2015/2016 ᵈ** 2016/2017
Sch AB Sch AB Sch AB Sch AB Sch AB
N % N % N % N % N % N % N % N % N % N %
Participation
Enrolled ᵃ n/a n/a 1372 100.0 1 100.0 1514 100.0 1 100.0 1477 100.0 n/a n/a 1608 100.0 2 100.0 1393 100.0
Writing n/a n/a 1193 87.0 1 100.0 1279 84.5 1 100.0 1261 85.4 n/a n/a 1342 83.5 1 50.0 1161 83.3
Absent ᵇ n/a n/a 124 9.0 0 0.0 175 11.6 0 0.0 155 10.5 n/a n/a 178 11.1 1 50.0 160 11.5
Excused n/a n/a 55 4.0 0 0.0 60 4.0 0 0.0 61 4.1 n/a n/a 88 5.5 0 0.0 72 5.2
Results Based on Number Enrolled
Total Test
Standard of Acceptable n/a n/a 886 64.6 n/a n/a 935 61.8 n/a n/a 847 57.3 n/a n/a 932 58.0 n/a n/a 784 56.3
Standard of Excellence n/a n/a 179 13.0 n/a n/a 162 10.7 n/a n/a 165 11.2 n/a n/a 187 11.6 n/a n/a 177 12.7
Below Acceptable Standard n/a n/a 307 22.4 n/a n/a 344 22.7 n/a n/a 414 28.0 n/a n/a 410 25.5 n/a n/a 377 27.1
Results Not Available ᶜ n/a n/a 179 13.0 n/a n/a 235 15.5 n/a n/a 216 14.6 n/a n/a 266 16.5 n/a n/a 232 16.7
Results Based on Number Writing
Total Test
Acceptable Standard n/a n/a 886 74.3 n/a n/a 935 73.1 n/a n/a 847 67.2 n/a n/a 932 69.4 n/a n/a 784 67.5
Standard of Excellence n/a n/a 179 15.0 n/a n/a 162 12.7 n/a n/a 165 13.1 n/a n/a 187 13.9 n/a n/a 177 15.2
Below Acceptable Standard n/a n/a 307 25.7 n/a n/a 344 26.9 n/a n/a 414 32.8 n/a n/a 410 30.6 n/a n/a 377 32.5
Mean (%) n/a n/a 1193 64.5 n/a n/a 1279 65.5 n/a n/a 1261 62.0 n/a n/a 1342 61.6 n/a n/a 1161 61.7
Standard Deviation n/a n/a 1193 17.4 n/a n/a 1279 17.5 n/a n/a 1261 18.0 n/a n/a 1342 17.8 n/a n/a 1161 17.9
** The 2015/2016 results do not include students who were exempted from writing the test because of the Fort McMurray wildfires.
Report Generated: Sep 20, 2017Current data with count less than 6 suppressed for Oct 2017
Report Version 1.0Data Current as of Aug 28, 2017
Provincial Achievement Test Multiyear Reports

Social Studies 9 KAE - Written in English
School: 9648 Sir Wilfrid Laurier SchoolProvince: Alberta
Please read "Guidelines for Interpreting the Achievement Test Multiyear Reports."
* The 2012/2013 results do not include students who were exempted from the test because of the flooding in Calgary and southern Alberta.
a Includes all students registered in Grade 9 and ungraded students in year 9 of schooling. School Authority results do not include students in home education programs.
b Includes students who were absent for the entire test or part of the test, and those who wrote but whose results were withheld.
c Includes students who were absent, excused by the superintendent, or who wrote but whose results were withheld. It is possible that some students, under different circumstances, could have demonstrated standards on the test.
d The school authority/school results have been updated with any changes that were made to student scores subsequent to the posting of last year's school authority/school detailed report.
2012/2013* 2013/2014 2014/2015 2015/2016 ᵈ** 2016/2017
Sch AB Sch AB Sch AB Sch AB Sch AB
N % N % N % N % N % N % N % N % N % N %
Participation
Enrolled ᵃ n/a n/a 1369 100.0 1 100.0 1501 100.0 1 100.0 1460 100.0 n/a n/a 1588 100.0 2 100.0 1373 100.0
Writing n/a n/a 1190 86.9 1 100.0 1266 84.3 1 100.0 1244 85.2 n/a n/a 1323 83.3 1 50.0 1141 83.1
Absent ᵇ n/a n/a 124 9.1 0 0.0 175 11.7 0 0.0 155 10.6 n/a n/a 178 11.2 1 50.0 160 11.7
Excused n/a n/a 55 4.0 0 0.0 60 4.0 0 0.0 61 4.2 n/a n/a 87 5.5 0 0.0 72 5.2
Results Based on Number Enrolled
Total Test
Standard of Acceptable n/a n/a 885 64.6 n/a n/a 929 61.9 n/a n/a 837 57.3 n/a n/a 917 57.7 n/a n/a 773 56.3
Standard of Excellence n/a n/a 179 13.1 n/a n/a 162 10.8 n/a n/a 162 11.1 n/a n/a 187 11.8 n/a n/a 175 12.7
Below Acceptable Standard n/a n/a 305 22.3 n/a n/a 337 22.5 n/a n/a 407 27.9 n/a n/a 406 25.6 n/a n/a 368 26.8
Results Not Available ᶜ n/a n/a 179 13.1 n/a n/a 235 15.7 n/a n/a 216 14.8 n/a n/a 265 16.7 n/a n/a 232 16.9
Results Based on Number Writing
Total Test
Acceptable Standard n/a n/a 885 74.4 n/a n/a 929 73.4 n/a n/a 837 67.3 n/a n/a 917 69.3 n/a n/a 773 67.7
Standard of Excellence n/a n/a 179 15.0 n/a n/a 162 12.8 n/a n/a 162 13.0 n/a n/a 187 14.1 n/a n/a 175 15.3
Below Acceptable Standard n/a n/a 305 25.6 n/a n/a 337 26.6 n/a n/a 407 32.7 n/a n/a 406 30.7 n/a n/a 368 32.3
Mean (%) n/a n/a 1190 64.5 n/a n/a 1266 65.6 n/a n/a 1244 62.0 n/a n/a 1323 61.6 n/a n/a 1141 61.8
Standard Deviation n/a n/a 1190 17.4 n/a n/a 1266 17.5 n/a n/a 1244 18.0 n/a n/a 1323 17.9 n/a n/a 1141 17.9
** The 2015/2016 results do not include students who were exempted from writing the test because of the Fort McMurray wildfires.
Report Generated: Sep 20, 2017Current data with count less than 6 suppressed for Oct 2017
Report Version 1.0Data Current as of Aug 28, 2017
Provincial Achievement Test Multiyear Reports