provincial government western cape provincial treasury reports/provincial/2006/wc... · and with...
TRANSCRIPT

Provincial Government Western Cape Provincial Treasury
ANNUAL REPORT 2005/2006

PR: 88/2006 ISBN: 0‐621‐36639‐0 To obtain additional copies of this document, please contact: Western Cape Provincial Treasury Office of the Chief Financial Officer Private Bag X9165 4 Dorp Street CAPE TOWN 8000 Telephone (+27 21) 483‐3674 or 483‐4623 Fax: (+27 21) 483‐4558 E‐mail: [email protected] This publication is also available online at http://www.capegateway.gov.za/eng/pubs/annual reports/ Printed in the Republic of South Africa for the Government Printers Cape by Formeset Printers Cape

Provincial Treasury
ANNUAL REPORT Ms L Brown Minister of Finance and Tourism REPORT OF THE ACCOUNTING OFFICER OF THE PROVINCIAL TREASURY FOR THE PERIOD 1 APRIL 2005 TO 31 MARCH 2006 In accordance with section 40(1)(d) of the Public Finance Management Act, 1999, the Public Service Act, 1994 and Treasury Regulation 18, I hereby submit the Annual Report of the Provincial Treasury, Western Cape on financial statements, performance indicators and departmental activities for the period 1 April 2005 to 31 March 2006.
Dr JC Stegmann ACCOUNTING OFFICER DATE: 31 AUGUST 2006


Contents
Part 1: General Information 1
Introduction by the Accounting Officer 1
The Ministry 3
Vision and Mission Statement 4
Legislative and other mandates 5
Part 2: Programme Performance 9
1. Programme performance in summary 9
1.1 Voted funds 9
1.2 Aim of the vote 9
1.3 Summary of programmes 10
1.4 Key strategic objectives and achievements 10
1.5 Overview of the service delivery environment for 2005/06 16
1.6 Overview of the organisational environment for 2005/06 16
1.7 Strategic overview and key policy developments for the 2005/06 financial year
17
1.8 Departmental own receipts 18
1.9 Departmental payments 19
1.10 Transfer payments 20
1.11 Conditional grants and earmarked funds 20
1.12 Capital investment, maintenance and asset management plans 20
2. Programme performance in detail 21
2.1 Programme 1: Administration 22
2.2 Programme 2: Sustainable Resource Management 30
2.3 Programme 3: Asset and Liabilities Management 42
2.4 Programme 4: Financial Governance 55

ii
Part 3: Report of the Audit Committee 69
Report of the Audit Committee 69
Part 4: Annual Financial Statements 71
Report of the Accounting Officer 75
Report of the Auditor‐General 81
Accounting Policies 83
Appropriation Statement 88
Notes to the Appropriation Statement 93
Statement of Financial Performance 95
Statement of Financial Position 96
Cash Flow Statement 97
Notes to the Annual Financial Statements 98
Disclosures Notes to the Annual Financial Statements 106
Annexures to the Annual Financial Statements 109
Part 5: Human Resource Management 119
Oversight Report 119

iii
Abbreviations Abet: Adult Basic Education and Training AC: Audit Committee AG: Auditor‐General AO: Accounting Officer ASB: Accounting Standards Board BAS: Basic Accounting System BBBEE: Broad Based Black Economic Empowerment BER: Bureau for Economic Research BPO: Business Process Outsourcing CASIDRA: Cape Agency for Sustainable Development in Rural Areas CFO: Chief Financial Officer CG: Conditional grant CeI: Centre for E‐Innovation CIDB: Construction Industry Development Programme CPD: Corporation for Public Deposits DBC: Departmental Bid Committee DBSA: Development Bank of Southern Africa DORA: Division of Revenue Act DPSA: Department of Public Service and Administration EDU: Economic Development Unit EPS: Electronic Purchasing System EPWP: Expanded Public Works Programme FASSET: Financial and Accounting Services Sector Education and Training Authority FET: Further Education Training FETC: Further Education and Training Certificate FFC: Financial Fiscal Commission FMIP: Financial Management Improvement Programme FMS: Financial Management System GEPF: Government Employees Pension Fund GRAP: Generally Recognised Accounting Practice HOT: Head Official Treasury HRD: Human Resource Development HRDS: Human Resource Development Strategy HSRC: Human Sciences Research Council IA: Internal Audit ICS: Improvement in Conditions of Service ICT: Information Communication Technology IDIP: Infrastructure Delivery Improvement Programme IDP: Integrated Development Plans IFMS: Integrated Financial Management System IMLC: Institutional Management and Labour Committee IYM: In‐year monitoring

iv
LOGIS: Logistical Information System MEC: Member of Executive Council MFMA: Municipal Finance Management Act, 2003 MSP: Master Systems Plan MTBPS: Medium Term Budget Policy Statement 2005 ‐2008 MTEF: Medium Term Expenditure Framework NGO: Non‐governmental Organisation NTR: National Treasury Regulations PDC: Provincial Development Council PERSAL: Personnel and Salary Administration System PER&O: Provincial Economic Review and Outlook PES: Provincial Equitable share PFMA: Public Finance Management Act PGDS: Provincial Growth and Development Summit PGWC: Provincial Government Western Cape PMDS: Performance Management Development System PMU: Programme Management Unit PPP: Public Private Partnerships PPSC: Provincial Portfolio Steering Committee PTC: Provincial Treasury Committee REAL: Revenue, Expenditure, Assets, Liabilities SAMDI: South African Management Development Institute SARS: South African Revenue Services SASSA: South African Social Services Authority SCM: Supply Chain Management SCOA: Standard Chart of Accounts SCOF: Standing Committee on Finance SCOPA: Standing Committee on Public Accounts SDI: Service Delivery Improvement SER: Socioeconomic Review SETA: Sector Education and Training Authority SITA: State Information Technology Agency SMME: Small Medium and Micro Enterprise SMS: Senior Management Service SPMS: Staff Performance Management System SSA: Statistics South Africa TCF: Technical Committee on Finance TQM: Total Quality Management URS: User Requirement Statement WC‐MTBPS: Western Cape Medium Term Budget Policy Statement 2005 ‐ 2008 WCED: Western Cape Education Department WCGRB: Western Cape Gambling and Racing Board WCSD: Western Cape Supplier Database

Part 1: General Information 1
Part 1
General Information
Introduction by the Accounting Officer During this reporting year the Provincial Treasury stood up to the challenge in meeting its responsibilities as a change agent to achieve the desired levels of service delivery via socio‐economic variables using the available analytical instruments. It was a very challenging time as many vacant posts had to be filled in terms of phase Two of the restructuring process while the skills of existing staff were developed further in some instances. To stay on pace in an ever changing environment where your own stability can only be measured in terms of variables that keep changing made the challenges of 2005/06 even bigger. Some of these challenges are briefly listed below: • co‐ordinate and align activities within Programme 2: Resource Management to assist
the three components, namely: Budget Management, Resource Management and Public Finance to attain their goals collectively in such a manner that the gains for the Provincial Treasury were larger than each component’s individual goals;
• adhere and keep pace with the many policy changes in the broad field of asset
management; • provide guidance to all departments in the field of financial governance which entailed
Internal Audit, Accounting, Norms and Standards and Risk Management activities; • align Provincial Treasury policy with National Treasury policy and legislation while
assisting the dynamics of local government finances;
• understanding the Provincial Treasury’s role of financial and fiscal leadership and its relation to the goals of all thirteen departments;
• to assist in the process of ensuring that the Provincial Government keeps rendering high quality services in an environment where financial resources decline marginally each year in real terms; and

2
Annual Report 2005/06
• ensure that all components within the Provincial Treasury attain their goals individually and collectively and providing the necessary support functions for them.
Dr JC Stegmann
Accounting Officer Provincial Treasury
I can earnestly confirm that the team Provincial Treasury faced up to the challenges listed above and with the support of the Minister of Finance and Tourism set the tone for service delivery in the years to come. I am privileged and thankful to be supported by my team of dedicated people.
Dr JC Stegmann ACCOUNTING OFFICER: PROVINCIAL TREASURY DATE: 31 AUGUST 2006
Part 1: General Information 3
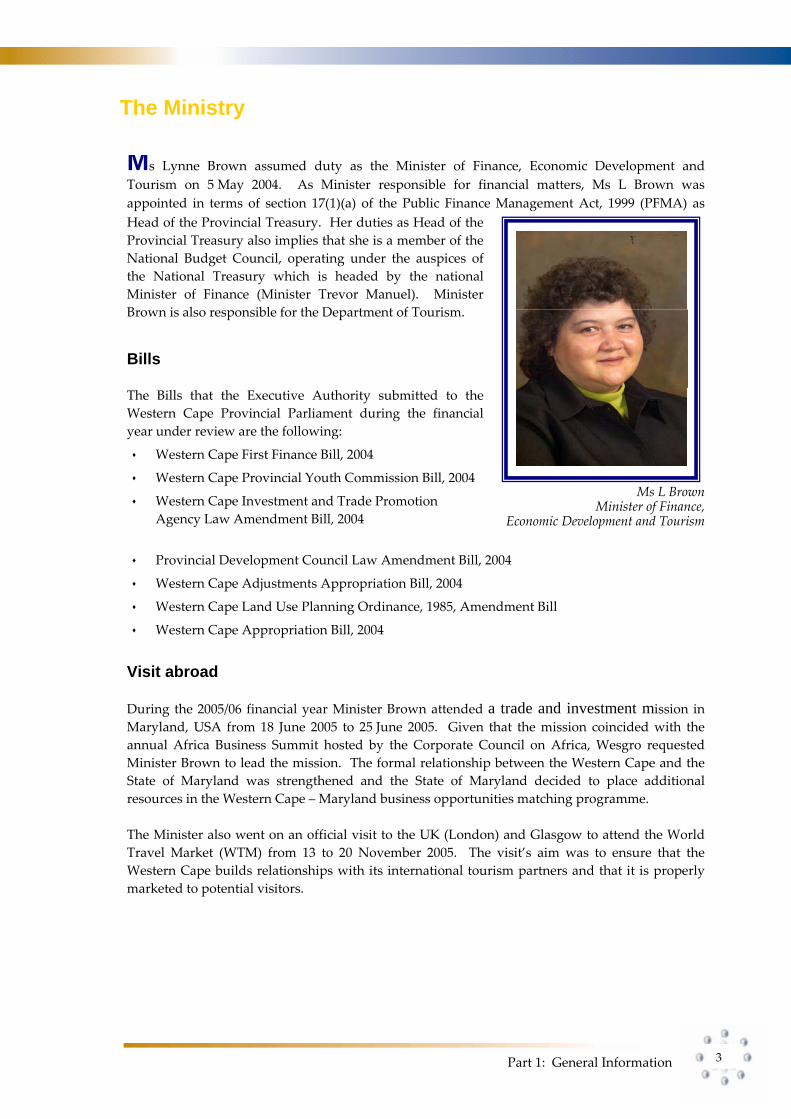
The Ministry Ms Lynne Brown assumed duty as the Minister of Finance, Economic Development and Tourism on 5 May 2004. As Minister responsible for financial matters, Ms L Brown was appointed in terms of section 17(1)(a) of the Public Finance Management Act, 1999 (PFMA) as Head of the Provincial Treasury. Her duties as Head of the Provincial Treasury also implies that she is a member of the National Budget Council, operating under the auspices of the National Treasury which is headed by the national Minister of Finance (Minister Trevor Manuel). Minister Brown is also responsible for the Department of Tourism.
Bills The Bills that the Executive Authority submitted to the Western Cape Provincial Parliament during the financial year under review are the following:
Western Cape First Finance Bill, 2004
Western Cape Provincial Youth Commission Bill, 2004
Western Cape Investment and Trade Promotion Agency Law Amendment Bill, 2004
Ms L Brown Minister of Finance,
Economic Development and Tourism
Provincial Development Council Law Amendment Bill, 2004
Western Cape Adjustments Appropriation Bill, 2004
Western Cape Land Use Planning Ordinance, 1985, Amendment Bill
Western Cape Appropriation Bill, 2004
Visit abroad During the 2005/06 financial year Minister Brown attended a trade and investment mission in Maryland, USA from 18 June 2005 to 25 June 2005. Given that the mission coincided with the annual Africa Business Summit hosted by the Corporate Council on Africa, Wesgro requested Minister Brown to lead the mission. The formal relationship between the Western Cape and the State of Maryland was strengthened and the State of Maryland decided to place additional resources in the Western Cape – Maryland business opportunities matching programme. The Minister also went on an official visit to the UK (London) and Glasgow to attend the World Travel Market (WTM) from 13 to 20 November 2005. The visit’s aim was to ensure that the Western Cape builds relationships with its international tourism partners and that it is properly marketed to potential visitors.

4
Annual Report 2005/06
As a change agent to achieve maximum well‐being To obtain financial and supportive means and utilise them to the optimum advantage of the
whole community.
• To give effect to the Public Service Code of Conduct;
• To be of service;
• To empower people;
• To be an employment equity employer; and
• To be aware of, and to cultivate respect for our country’s heterogeneity.
VISION
MISSION
DEPARTMENTAL ETHOS

Part 1: General Information 5
Legislative and other mandates The legislative mandate within which the Provincial Treasury operates, consist of the following mix of national and provincial legislation: • Annual Division of Revenue Act
To provide for the equitable division of revenue raised nationally, inclusive of conditional grants, amongst the three spheres of government and matters incidental thereto.
• Basic Conditions of Employment Act, 1997 (Act 75 of 1997) To provide regulatory prescripts, in addition to the Public Service Act, 1994 and the Public Service Regulations, 2001, regarding the conditions of employment of staff in the Treasury.
• Borrowing Powers of Provincial Government Act, 1996 (Act 48 of 1996) To provide norms and conditions which the Treasury must adhere to in negotiating loans for the Provincial Government.
• Employment Equity Act, 1998 (Act 55 of 1998) To regulate the processes and procedures of the Treasury in achieving a diverse and competent workforce broadly representative of the demographics of the Western Cape and eliminating unfair discrimination in employment towards implementing employment equity.
• Intergovernmental Fiscal Relations Act, 1997 (Act 97 of 1997) To define the role of the Minister of Finance and Economic Development and that of the Treasury as representatives of the Provincial Government, in promoting co‐operation between other spheres of government on fiscal, budgetary and financial matters; to provide insight into the prescribed processes for the determination of the equitable share and allocation of revenue raised nationally and for matters in connection therewith.
• Labour Relations Act, 1995 (Act 66 of 1995) To regulate and guide the Treasury in recognising and fulfilling its role in effecting labour harmony and the democratisation of the workplace.
• Local Government: Municipal Finance Management Act, 2003 (Act 56 of 2003) (MFMA) To regulate financial management in the local sphere of government; to require that all revenue, expenditure, assets and liabilities of municipalities and municipal entities are managed economically, efficiently and effectively; to determine the responsibilities of persons entrusted with municipal borrowing; to make provision for the handling of financial emergencies in municipalities; and to provide for matters connected therewith.
• Occupational Health and Safety Act, 1993 (Act 85 of 1993) To provide for the health and safety of persons at work and for the health and safety of persons in connection with the use of plant and machinery; the protection of persons other than persons at work against hazards to health and safety arising out of or in connection with the activities of person at work; to establish an advisory council for occupational health and safety; and to provide for matters connected therewith.
• Preferential Procurement Policy Framework Act, 2000 (Act 5 of 2000) To provide the Treasury with a regulatory framework enabling and assisting departments and potential historically disadvantaged individuals (HDIs) in the sustainable development and implementation of a preferential procurement system.

6
Annual Report 2005/06
• Promotion of Access to Information Act, 2000 (Act 2 of 2000) To give effect to the constitutional right of access to any information held by the State and any information that is held by another person and that is required for the exercise or protection of any rights; and to provide for matters connected therewith.
• Promotion of Administrative Justice Act, 2000 (Act 3 of 2000) To give effect to the right to administrative action that is lawful, reasonable and procedurally fair and to the right to request written reasons for administrative action as contemplated in section 33 of the Constitution of the Republic of South Africa, 1996; and to provide for matters incidental thereto.
• Provincial Tax Regulation Process Act, 2001 (Act 53 of 2001) To regulate the intergovernmental process that must be followed by provinces in the exercise of their power in terms of section 228 of the Constitution to impose taxes, levies and duties, and flat‐rate surcharges on the tax bases of any tax, levy or duty imposed by national legislation; and to provide for matters connected therewith.
• Public Finance Management Act, 1999 (Act 1 of 1999) (PFMA) To regulate financial management in the Treasury to ensure that all revenue, expenditure, assets and liabilities of the Treasury are managed efficiently and effectively; to provide for the responsibilities of persons entrusted with financial management in the Treasury and to provide for matters connected therewith. To fulfil all Treasury responsibilities with respect to other departments and public entities.
• Public Service Act, 1994 (Act 103 of 1994) To provide for the organisation and administration of the Treasury and for human resource management which includes the regulation of conditions of employment, terms of office, discipline, retirement and discharge of staff members of the Treasury and matters connected therewith.
• Skills Development Act, 1998 (Act 97 of 1998) To provide an institutional framework to devise and implement national, sector and workplace strategies to develop and improve the skills of the South African workforce; to integrate those strategies within the National Qualification Framework contemplated in the South African Qualification Authority Act, 1995; to provide for learnerships that lead to recognised occupational qualifications; to provide for the financing of skills development by means of a levy‐grant scheme and a National Skills Fund; to provide for and regulate employment services; and to provide for matters connected therewith.
• Skills Development Levy Act, 1999 (Act 9 of 1999) To provide for the imposition of a skills development levy; and for matters connected therewith.
• Western Cape Direct Charges Act, 2000 (Act 6 of 2000) To provide for the withdrawal of State moneys from the Western Cape Provincial Revenue Fund, as a direct charge, in accordance with the Constitution of the Republic of South Africa, 1999 (Act 108 of 1996), the Constitution of the Western Cape, 1997 (Act 1 of 1998) and the Public Finance Management Act, 1999 (Act 1 of 1999), and for matters incidental thereof.
• Western Cape Gambling and Racing Law, 1996 (Law 4 of 1996) To provide regulatory prescripts to support the responsible Minister in ensuring sound financial administration and management and matters incidental thereto by the Western Cape Gambling and Racing Board.
Part 1: General Information 7
• Western Cape Law on the Powers and Privileges of the Provincial Legislature Amendment Act, 1998 (Law 3 of 1998) To provide the Treasury with regulatory prescripts in assisting the Legislature when necessary, in meeting their financial responsibilities as set out in legislation.
• Western Cape Provincial Tender Board Law, 1994 (Law 8 of 1994) Although this Law has been revoked, a number of period contracts concluded under this Law and its regulations, are still valid and have to be administered in terms of this legislation.
The Provincial Treasury has under its control the following listed provincial public entity:
Western Cape Gambling and Racing Board The Board is established in terms of the Western Cape Gambling and Racing Law, 1996 (Law 4 of 1996). The mentioned Law provides regulatory prescripts to support the responsible Minister in ensuring sound financial administration and management and matters incidental thereto by the Western Cape Gambling and Racing Board. The main function of the Board is to control all gambling, racing and activities incidental thereto in the Province, subject to the Western Cape Gambling and Racing Law, 1996 and any policy determinations of the Provincial Cabinet relating to the size, nature and implementation of the industry. A more comprehensive and detailed list of its functions appear under section 12 of the Western Cape Gambling and Racing Law, 1996. Clearly defined lines of communication exist between the accounting officer, the two members of the executive authority and the management (including Board members) of the provincial public entity. Accountability on executive authority level is shared between the executive member responsible for the gambling portfolio and the executive member responsible for financial matters pertaining to gambling issues. The Western Cape Gambling and Racing Board itself acts as the accounting authority, but has delegated most of its powers to the Chief Executive Officer of the Board. In general, accountability arrangements for all the relevant functionaries are strictly in line with that prescribed by the Public Finance Management Act, 1999 (Act 1 of 1999).

Part 2: Programme Performance
9
Part 2
Programme Performance
1. Programme performance in summary 1.1 Voted funds
The following table depicts the under‐spending of the vote if the actual expenditure is compared with the adjusted appropriation amount: Table 1: Voted funds: Provincial Treasury
Main Appropriation Adjusted Appropriation
Actual Amount Spent
Over/(Under) Expenditure
R’000 R’000 R’000 R’000
125, 914 115, 409 114, 275 (1, 134)
Responsible Minister Minister of Finance and Tourism
Administering Department Provincial Treasury
Accounting Officer Head Official Provincial Treasury and Head of Department
1.2 Aim of the vote The main aim of the Provincial Treasury is to act as a change agent in achieving socio‐
economic objectives, including the introduction of new practices through fiscal policy, fostering the attainment of value for money spending and safeguarding and promoting the effective utilisation of provincial assets.

10
Annual Report 2005/06
1.3 Summary of programmes The Provincial Treasury consists of the following four programmes with a description of
each programme’s aim:
Programme 1: Administration To provide and maintain a high quality support service to the Minister and the Provincial Treasury pertaining to sound financial administration, supply chain management, auxiliary services, and corporate services.
Programme 2: Sustainable Resource Management
To provide professional advice and support on provincial and local government economic analysis, fiscal policy, public finance development. The programme also manages the annual provincial budget process, assists with and monitors local government budgets.
Programme 3: Asset and Liabilities Management
To provide policy direction, facilitating the effective and efficient management of physical and financial assets, Public Private Partnerships (PPPs) and liabilities.
Programme 4: Financial Governance To enhance performance‐orientated financial management.
1.4. Key strategic objectives and achievements
1.4.1 Key strategic objectives
The Provincial Treasury set itself the following key strategic objectives, which were published in its Five Year Strategic and Performance Plan 2005/06 – 2009/10 and were tabled in the Provincial Parliament at the end of March 2005. These strategic objectives were changed slightly in the second Annual Performance Plan 2006/07 – 2008/09. This was tabled in the Provincial Parliament at the end of March 2006. They are listed per programme below: Programme 1: Administration • To ensure the rendering of secretarial, administrative and office support services. • To act as linkage between the Treasury and the Department of Economic
Development and Tourism. • To enable the Minister to realise both treasury and economic development
responsibilities.

Part 2: Programme Performance
11
• To ensure a well‐functioning and co‐ordinated institution that delivers on its responsibilities.
• To create a diverse and transformed environment by building capacity and a high‐performing workforce through an embedded performance management system and an effective communication process, to ensure good governance and risk management.
• To manage the budget such that it remains within prescribed budget limits. • To ensure timely and accurate reflection of the status of Provincial Treasury’s ledger
accounts. • To ensure effective supply chain management services. • To ensure proper internal control measures and risk management in the Provincial
Treasury. • To determine and maintain good administrative standards. Programme 2: Sustainable Resource Management • To render an administrative support service to ensure the effective operational
management of the unit. • To build the capacity of, and train administrative support and line function staff. • To support and promote Broad‐Based Black Economic Empowerment initiatives
through administrative functions. • To describe the Western Cape economy by determining and analysing key provincial
and, where possible, district economic variables and their interrelationships. • To determine the sources, potential and constraints for enhanced growth and
development in the Western Cape, as framed within iKapa Elihlumayo. • To assess the impact of various budget (municipal and provincial) policy objectives on
selected economic variables, providing a link between the macro, meso and municipal spheres.
• To provide technical assistance and training in the application of macroeconomic analysis.
• To disseminate information to other government and key external stakeholders in the provincial economy and labour market to foster understanding of economic variables and promote steps to enhance economic growth and reduce inequalities.
• To administer a medium‐term revenue planning process. • To assess and optimise both the vertical and horizontal (equitable share and
conditional grants) from National Treasury. • To ensure effective and efficient management of debtors. • To ensure effective and efficient development of provincial own revenue, whether user
charges or provincial taxes, levies and duties. • To ensure effective and efficient development of the Western Cape’s borrowing
capacity. • To administer gambling and racing matters. • To assess revenue trends, as well as compile and submit revenue reports.
12
Annual Report 2005/06
• To determine an overall financing envelope for the Medium‐Term Expenditure Framework (MTEF).
• To assess the viability of municipal revenue budgets. • To promote and facilitate performance monitoring in provincial departments and
municipalities. This should be done in conjunction with similar processes undertaken by the Department of the Premier, Department of Local Government and Housing and the National Treasury.
• To provide policy advice, effective technical and strategic support and a to act as a change agent service to provincial departments and municipalities.
• To improve input‐output sequencing of information and the quality of the latter within the budget processes.
• To improve the effectiveness of in‐year expenditure monitoring systems through the monitoring of financial and non‐financial performance indicators.
• To strengthen the institutional capacity, focusing on the aspects of professionalism, skills, knowledge, motivation, attitudes, integration and values.
• To develop intra‐Provincial Treasury, intra‐provincial, inter‐provincial and government co‐ordinating structures and systems.
• Facilitate the optimal vesting of functions between the provincial and local spheres of government.
• To deepen the analysis of budget votes, i.e. in content and profile. Programme 3: Asset and Liabilities Management • To render administrative support services to ensure the effective and efficient
operational management of the programme • To build capacity of administrative support to fulfil line function responsibilities
through training • To support and promote BBBEE initiatives through administrative functions • To ensure effective control and management of the Provincial Revenue Fund. • To render effective technical, strategic support and training to provincial
departments and local government where applicable. • To ensure compliance with the Public Finance Management Act (PFMA), Municipal
Finance Management Act (MFMA), accounting policies, regulations and guidelines • To develop and implement provincial treasury instructions and guidelines to ensure
effective supply chain management of goods and services. • To provide strategic leadership and guidance in the supply chain management of
goods and services. • To strengthen and render effective, technical and strategic support to departments,
public entities, municipalities and municipal entities. • To monitor compliance with legislative frameworks • To establish Infrastructure Programme Units. • Strengthen and render effective, technical and strategic support to departments,
public entities, municipalities and municipal entities. • To provide strategic leadership and guidance in immovable assets.

Part 2: Programme Performance
13
• To address capacity and training needs.
• Monitor compliance within legislative framework • Develop and implement provincial treasury instructions and guidelines to ensure for
the effective and efficient management of immovable assets. • To build the necessary capacity in the Provincial Treasury to take over all PPP
assessment‐related responsibilities from the National Treasury. • To assess PPP projects in progress and monitor and enforce compliance with
legislation. • To facilitate and provide developmental technical assistance and support to
departments on all PPP projects in progress. • To identify new PPP opportunities. • To establish and ensure implementation of policies for effective management of
assets and liabilities. • To strengthen and provide technical and strategic support for the institutional
capacity of provincial and local government. • To monitor compliance with the PFMA, MFMA and regulations. • To establish the necessary structures to service loans and guarantees. • To provide for the management and implementation of existing financial systems
and the transition to the Integrated Financial Management System (IFMS), enhancing compliance with the PFMA and other relevant legislation.
• To monitor and report on the performance of financial management systems. • To render effective technical, strategic support and training to departments. • To monitor and verify monthly SITA costs relating to transversal financial systems,
ensuring optimal management of cost drivers
Programme 4: Financial Governance • To render administrative support services to ensure the effective operational
management of the unit. • To build capacity of administrative support and line function staff through training. • To support and promote BBBEE initiatives through administrative functions
14
Annual Report 2005/06
• To ensure the development of accounting practices that will promote effective and efficient capturing of Revenue, Expenditure, Assets and Liabilities movements and accountability.
• To ensure integrity of financial data. • To identify, develop and implement financial norms and standards and to monitor
and assist with nominal and substantive compliance. • To ensure the existence of an appropriate and dynamic financial legislative
framework. • To develop and facilitate the implementation of effective risk management and
governance capacity within the provincial government. • To facilitate residual risk assessments and the availability of a risk profile per
department. • To consolidate inherent risk assessments, build a risk profile for the Provincial
Government as a whole and ensure the development of response strategies to mitigate transversal risks.
• To render an effective risk based internal audit service. • To ensure effective audit committees. • To promote close co‐operation and co‐ordination between assurance providers to
prevent duplication of effort.
1.4.2 Programmes
The following achievements can be highlighted for each programme:
Programme One: (Administration)
For the first time in many years the Provincial Treasury attained the goal of spending within 1 per cent of its adjusted budget on 31 March 2006. This was achieved notwithstanding a high vacancy level and after surrendering R10.5 million to the Provincial Revenue Fund in the Adjustments Estimate. All these efforts were jointly achieved by the collective efforts of all the senior managers without compromising service delivery.
Programme Two: (Resource Management)
Great strides were made in familiarising local authorities with the new policy that was enacted in terms of the MFMA. While a great deal of focus was placed on local authorities, the 13 departments within the Provincial Government received the same level of attention as in previous years, in terms of the PFMA. Four new managers were appointed during the reporting period, namely a chief director in Public Finance and senior managers in the Budget Management, Fiscal Policy Provincial Government and Economic Analysis units.
Programme Three: (Asset Management)

Part 2: Programme Performance
15
During the 2005/06 financial year, greater emphasis was placed on interaction between the Provincial Treasury and larger departments regarding the management of their assets. Inter alia, this included the facilitation of PPP projects, assistance with the 2010 soccer bid process in the Western Cape and assistance with the control of moveable assets within departments. The management and control of Supporting and Interlinked Financial Systems were also improved in all departments. This led to reduced downtime and a higher level of customer satisfaction within departments.
Programme Four: (Financial Governance)
With the appointment of four new managers under this programme, several new projects commenced. There was closer co‐operation with the Sihluma Sonke Consortium that currently assists the Provincial Treasury with risk management and internal audit capacity building. A second set of consolidated Annual Financial Statements was also compiled for the Western Cape Province. The audit committees played a more prominent and leading role with their hearings, while normative governance became more evident in their interaction with all the departments.
1.4.3 Summary of Achievements
During 2005/06 the Provincial Treasury progressed with Phase Two of its restructuring process. Many posts were filled within the new organogram, with specific focus on attaining employment equity without compromising service delivery. The downside of the vigorous employment programme was, however, the high attrition rate of new applicants. This placed enormous pressure on management to attain set targets and in many cases these targets were not reached during the reporting period. On a more positive note, incentives were provided to staff to improve their educational levels and training was regarded. A bursary scheme was implemented for a second consecutive year to support this skills development drive. Greater focus was also placed on open communication processes within and between all components. Several documents were published, the two most prominent of which were the Medium‐Term Budget Policy Statement (MTBPS) 2006 – 2009 and the Provincial Economic Review & Outlook (PER&O) 2006. The MTBPS 2006 – 2009 presented a fiscal policy perspective for 2006 that emphasised accelerated and shared growth. This focused on sustained infrastructure investment, further allocations for the social and economic sectors and a boost for the expanded public works programme. An additional area of focus of MTBPS 2006 – 2009 was to enhance the capacity of government service delivery and reduce obstacles to high quality service The 2006 PER&O provided an overview of the South African and Western Cape outlook for 2006/07 – 2008/09, which focused on sectoral growth and employment prospects and also the socio‐economic profiling of the different provincial regions at a local level.

16
Annual Report 2005/06
1.5 Overview of the service delivery environment for 2005/06
The Provincial Treasury operates in a very dynamic environment which changes from year to year. Both the national and provincial governments are confronted with the need to effectively and efficiently spend their limited budget on improved services. The Western Cape is been committed to a service delivery environment imbued with the spirit of the Ikapa Elihlumayo eight lead strategies.
Despite the introduction of new fiscal arrangements since 1994, a great deal remains to be done to improve per capita income levels, economic disparities, fiscal management and a range of socio‐economic factors. The challenges of Provincial Growth and Development Strategies (PGDS) still remain, and new initiatives must be developed to effect significant improvements over the medium to long‐term.
As change agent in resource allocation, ensuring general fiscal discipline and efficient spending, treasuries deal with significant challenges to improve the general welfare within their respective provinces. This general challenge applies also to the Western Cape province.
The Provincial Treasury also focused on the implementation of the MFMA, 2003 (Act 56 of 2003) which identified new areas of focus for local government, to attain a seamless integration of the different spheres of government. Other highlights included:
• supply chain management service delivery in all departments
• enhanced financial systems
• a shift in focus from mere nominal compliance with financial legislation to normative and quantifiable service delivery aspects, and
• establishing risk management and internal control capacity in line with National Treasury’s new paradigm.
1.6 Overview of the organisational environment for 2005/06
The approved organisational structure that applied for the year under review catered for more comprehensive strategic goals and enabled the Provincial Treasury to better fulfil its Constitutional mandate to address the socio‐economic challenges of the Province in tandem with all other departments, municipalities and other stakeholders. In a pursuit of achieving the high level goals that were set for the Provincial Treasury, it is always important in appointing new staff of the right calibre who can make the necessary contributions that may be needed. As already indicated, unfortunately many new candidates that were appointed left the service of the Provincial Government for greener pastures in other sectors or the private sector. In these cases the whole process then had to be repeated and also did have a more severe impact when senior managers left service.

Part 2: Programme Performance
17
1.7 Strategic overview and key policy developments for the 2005/06 financial
year
Relevant policy developments are described under the following sub‐headings: Shift towards outcome based budget allocation During the reporting period the Provincial Treasury commenced with the assessment of provincial departments’ measurable information to ensure alignment of their strategic objectives with the desired outcomes of the Province. Qualitative impact of provincial service delivery As in the past the qualitative impact of provincial service delivery on provincial socio‐economic variables have not been assessed. However, during the year under review certain analytical instruments were designed to assist with such assessments. Extended asset management functions The procurement and provisioning functions have been integrated and as part of the restructuring of the Provincial Treasury, a Supply Chain Management component. This component will monitor, set standards and share best practice with regard to procurement, physical asset management, public private partnerships and related issues. Physical Asset Management and Public Private Partnerships (PPP’s) are still relatively new components within the Provincial Treasury environment and most work performed is still of a developmental nature to establish a basis from which to develop policies, standards and practices. As soon as the National Treasury Regulations have been amended, new powers and responsibilities regarding PPPs will be vested in provincial treasuries. Shift to substantive compliance and enhancing risk management and corporate governance. The Financial Governance component focused on enhancing corporate governance and risk management with the assistance of outside consultants. Cabinet approval of standardised risk management structures for the relevant departments promoted the further roll out of the risk management process within all thirteen departments by virtue of the approval. Performance‐oriented financial management is at the stage where inputs relating to norms and standards inputs are being evaluated.

18
Annual Report 2005/06
1.8 Departmental revenue This section deals with the Provincial Treasury’s performance in terms of the collection of
departmental revenue for the financial year under review. It will again be discussed on a per programme basis in Part 2. Table 2 below depicts the departmental own revenue collected by the Provincial Treasury for the period 2002/03 to 2005/06. The Provincial Treasury is the only provincial department to collect more own revenue than it requires in terms of departmental payments. This can be ascribed to the fact that functions are aligned to national policy instruments, while its expenditure is comparable to smaller departments.
Table 2: Departmental revenue collected for period 2002/03 – 2005/06
Receipts 2002/03 Actual
2003/04 Actual
2004/05 Actual
2005/06 Target
2005/06 Actual
Deviation from target
R’000 R’000 R’000 R’000 R’000 R’000 %
Tax receipts 132,424 145,644 173,621 182,281 221,972 39,691 21.8
Casino taxes 111,079 132,640 157,611 168,281 205,318 37,037 22.0
Horse racing taxes 21,345 13,004 16,010 14,000 16,654 2,654 19.0
Non‐tax receipts 256,783 243,290 211,575 103,260 240,884 137,624 133.3
Interest 250,133 240,621 211,333 103,244 233,361 130,117 126.0
Other receipts 6,650 2,669 242 16 7,523 7,507 46,918.8
Financial transactions (Recovery of loans and advances)
116 4,522 4,522
Total departmental receipts 389,207 388,934 385,312 285,541 467,378 181,837 63.7
In general, the substantial higher collection in own revenues resulted from the adoption of a very conservative approach in determining the revenue targets at the beginning of the period under review given future risks in national formula financing and fixed asset financing requirements. Only programmes 1, 2 and 3 collected own revenue, which is discussed in more detail below: Programme 1: Administration – Departmental own receipts registered against this programme, essentially insignificant, consist mainly of sales of miscellaneous goods such as scrap and waste paper and commission on insurance.

Part 2: Programme Performance
19
Programme 2: Sustainable Resource Management – Own revenue collected by this programme relates mainly to casino and horseracing taxes. The substantial variance by which the actual amounts exceed the targeted amounts at the tax receipts can be ascribed to higher than anticipated gambling and betting activity, which might be caused by the availability of greater disposable income due to lower interest rates. Included under the other receipts is an amount for fines and penalties which, due to its very nature, was not budgeted for. This adds to the substantial variance. Programme 3: Asset and Liabilities Management – This programme is responsible for managing interest earned on investments. The over collection in interest revenue can be ascribed to effective management of investments and nascent asset financing policies. This, combined with a slower than expected expenditure pattern of provincial departments, resulted in more cash on hand for investment purposes.
1.9 Departmental payments This section deals with Provincial Treasury’s performance in terms of departmental
payments for the financial year under review. Table 3 depicts departmental payments made by the Provincial Treasury and more specifically the variance between total voted funds and actual expenditure.
Table 3: Departmental payments
Programmes Voted for 2005/06
Roll‐overs and Adjust‐ments
Virement Total Voted
Actual Expendi‐ture
Variance
R’000 R’000 R’000 R’000 R’000 R’000
1. Administration 24,743 (848) 23,895 23,220 675
2. Sustainable resource management
18,303 (1,459) 16,844 16,513 331
3. Asset and liabilities management
45,892 805 46,697 46,699 (2)
4. Financial governance 26,471 1,502 27,973 27,843 130
Total 115,409 0 115,409 114,275 1,134
Programme 1: Administration (97,2% actual expenditure) The under spending (2,8%) on this programme can mainly be attributed to lower than anticipated spending on capital assets (computer hardware, office furniture and office equipment). Part of the under spending is also due to the non‐payment of Financial and Accounting Services SETA (FASSET). Special efforts were undertaken late in the financial year to utilise the surplus funds by improving the physical working environment for all officials within the Provincial Treasury. Two vehicles were also purchased to add to the motor car pool for the

20
Annual Report 2005/06
department as more MFMA appointments have been made and they are required to conduct municipal visits. Programme 2: Sustainable Resource Management (98% actual expenditure) The under spending (2%) on this programme was mainly due to lower than expected expenditure on consulting services and the late filling of vacant posts. Programme 3: Asset and Liabilities Management (100% actual expenditure) There are no material variances to report on. Programme 4: Financial Governance (99,5% actual expenditure) The under spending (0,5%) on this programme was mainly due to an over provision made for software licences related to risk management.
1.10 Transfer payments
During the year under review transfer payments were only made to the City of Cape Town in respect of the regional service council levies, a donation to the department of the Premier for the Mali Timbuktu library project, as well as to households as indicated in Table 4 below:
Table 4: Transfer payments
Name of Institution Amount Transferred Estimate Expenditure
R’000 R’000 City of Cape Town Department of the Premier
102 50
102 50
Households 196 196
1.11 Conditional grants and earmarked funds The Provincial Treasury did not receive any conditional grants or earmarked funds for
the financial year under review. 1.12 Capital investment, maintenance and asset management plans The investment in capital projects does not form part of the Provincial Treasury’s core
functions and no funds were appropriated for this purpose.
Maintenance This section is not applicable to the Provincial Treasury, as it does not have a property asset portfolio under its control for the period under review.

Part 2: Programme Performance
21
Asset Management The additions in computer equipment and related equipment as stated in Part 4, Annexure 3 and 4 could be justified as follows: • Additional computer equipment was purchased for new appointees. • ERA licenses in terms risk management were procured due to additional
requirements. With the appointment of new Senior Managers, new standard office furniture was procured. The increase in use of the current fleet of vehicles and the increase of the Provincial Treasury establishment necessitated the purchase of two additional permanent vehicles. The loss incurred due to two cases of cheque fraud and the theft of a cell phone and cash have been registered and written off. There was no disposal of assets occurred during the financial year under review. The asset register is automatically updated when new assets are acquired or when redundant assets are disposed off. An annual stock take has been completed, but will only be reconciled in the 2006/07 financial year. Approximately 90% of the Provincial Treasury’s assets are in a good state, while the remaining 10% is in a fair condition. No maintenance projects have been undertaken during the financial year under review and no projects are being carried forward from the financial year under review to the following financial year. No facility was closed down or downgraded during the period under review. Where the need arises to follow the route of bidding for projects, the Supply Chain Management process outlined in the Provincial Treasury’s Accounting Officer’s System acts as a guideline.
2. Programme performance in detail This section will deal with the performance of the respective programmes in more detail. It will be placed in perspective by focussing on the respective purposes or aims, measurable objectives, service delivery objectives and indicators and service delivery achievements of the different programmes/ sub‐programmes.
22
Annual Report 2005/06
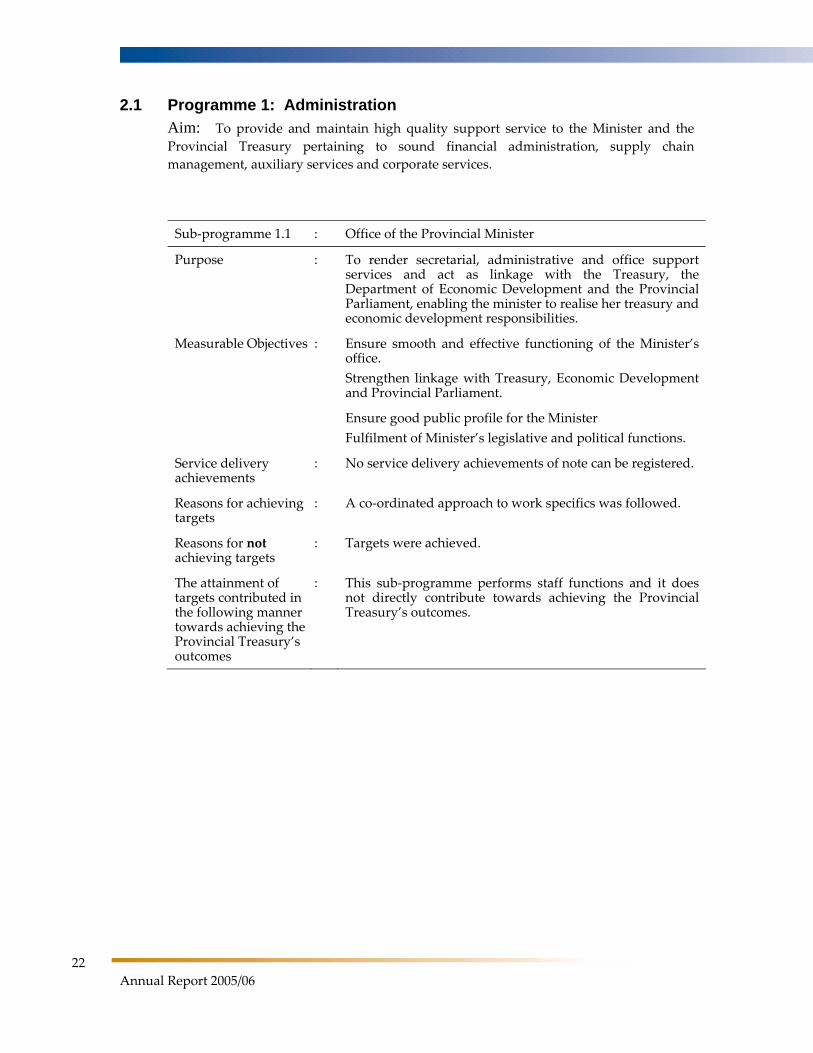
2.1 Programme 1: Administration Aim: To provide and maintain high quality support service to the Minister and the Provincial Treasury pertaining to sound financial administration, supply chain management, auxiliary services and corporate services.
Sub‐programme 1.1 : Office of the Provincial Minister
Purpose : To render secretarial, administrative and office support services and act as linkage with the Treasury, the Department of Economic Development and the Provincial Parliament, enabling the minister to realise her treasury and economic development responsibilities.
Measurable Objectives : Ensure smooth and effective functioning of the Minister’s office. Strengthen linkage with Treasury, Economic Development and Provincial Parliament.
Ensure good public profile for the Minister Fulfilment of Minister’s legislative and political functions.
Service delivery achievements
: No service delivery achievements of note can be registered.
Reasons for achieving targets
: A co‐ordinated approach to work specifics was followed.
Reasons for not achieving targets
: Targets were achieved.
The attainment of targets contributed in the following manner towards achieving the Provincial Treasury’s outcomes
: This sub‐programme performs staff functions and it does not directly contribute towards achieving the Provincial Treasury’s outcomes.

Part 2: Programme Performance
23
Programme 1: Administration
Actual performance against target Output
Output performance measures/service delivery
indicators Target Actual
Sub‐programme 1.1: Office of the Provincial Minister
Percentage satisfaction by the Minister.
90% 90% Ensure smooth and effective functioning of the Minister’s office.
Days turnaround time on documents submitted to the minister.
Six days Six days.
Strengthen linkages with Treasury, Economic Development and Provincial Parliament.
Establish a sound relationship and communication link.
72% 72%
Ensure good public profile for the Minister.
Improve public image. 85% 85%
Good integration with departmental function.
65% 65% Fulfilment of Minister’s legislative and political functions. Provincial affairs in good
shape. 75% 75%
Sub‐programme 1.2 : Management Services
Purpose : To render strategic support and conduct overall planning.
Measurable Objectives : Ensure good strategic support to the HoD and his management team. Conduct overall planning to ensure that remaining management functions are conducted on such level that Provincial Treasury delivers on its responsibilities.
Service delivery achievements
: No service delivery achievements of note can be registered.
Reasons for achieving targets
: A co‐ordinated approach to work specifics was followed.
Reasons for not achieving targets
:
The attainment of targets contributed towards achieving the Provincial Treasury’s outcomes in the following manner
: This sub‐programme performs staff functions and it does not directly contribute towards achieving the Provincial Treasury’s outcomes.

24
Annual Report 2005/06
Programme 1: Administration
Actual performance against target Output
Output performance measures/service delivery indicators Target Actual
Sub‐programme 1.2: Management Services
Ensure good strategic support to the HoD and his management team.
Percentage satisfaction. 50% 50%
Conduct overall planning to ensure that remaining management functions are conducted on such level that Provincial Treasury delivers on its responsibilities.
Percentage of planning mechanisms resulting in appropriate deliverables.
75% 75%
Sub‐programme 1.3 : Corporate Services
Purpose : To develop a diverse and high‐level performing organisation.
Measurable Objectives
: Ensure an optimal staff establishment. Establish a high level workforce. Promote good governance and a sound‐working environment. Promote embedded performance management. Ensure effective and sustainable corporate communication processes. Ensure an established, diverse and integrated workforce and environment. Deliver an effective and efficient operational function. Ensure good governance and risk management.
Service delivery achievements
: Vacancy level was reduced by 4%. Training took place throughout the year even though the list of accredited service providers was approved in December. The recruitment and selection policy was revised to include timeframes for the filling of vacant posts.

Part 2: Programme Performance
25
Sub‐programme 1.3 : Corporate Services
Reasons for achieving targets
: The organisational and functional structure was changed to ensure better supervision and flow of work, and specific responsibilities were allocated to all staff. Achievements were rewarded through the performance management system.
Reasons for not achieving targets
: Reduction of the vacancy level to 15% was not realistic in terms of the filling of the MFMA posts, which increased the vacancy level from 25% to 47% at the beginning of the financial year. There is no retention and scarce skills policy in place. It is difficult to compete with the private sector for obtaining economically/financially skilled labour. Officials in the Human Resource Management component were too involved in interview processes and could not always meet due dates, due to the huge drive to fill the vacancies. Improved controls over state guarantees of employees were not on standard.
The attainment of targets contributed towards achieving the Provincial Treasury’s outcomes in the following manner
: The Human Resource Management component, in its role as a key staff function, contributed positively towards the Provincial Treasury meeting its goals.
26
Annual Report 2005/06
Programme 1: Administration
Actual performance against target Output
Output performance measures/service delivery
indicators Target Actual
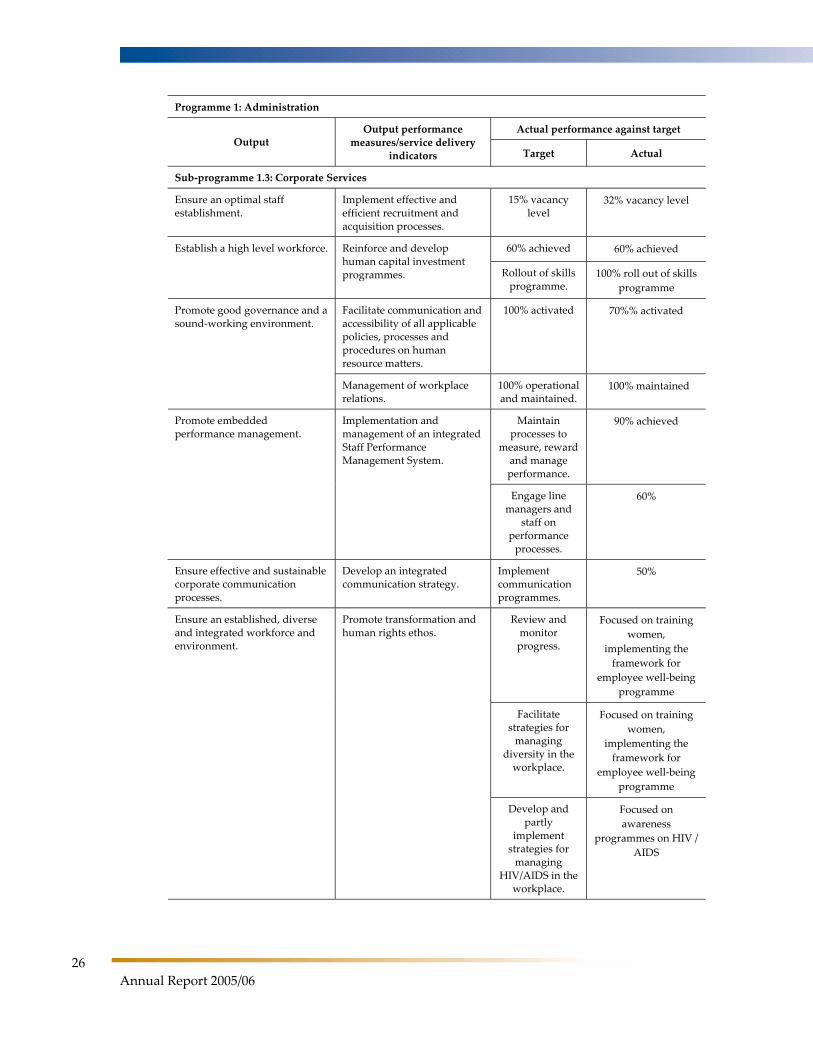
Sub‐programme 1.3: Corporate Services
Ensure an optimal staff establishment.
Implement effective and efficient recruitment and acquisition processes.
15% vacancy level
32% vacancy level
60% achieved 60% achieved Establish a high level workforce. Reinforce and develop human capital investment programmes. Rollout of skills
programme. 100% roll out of skills
programme
Facilitate communication and accessibility of all applicable policies, processes and procedures on human resource matters.
100% activated 70%% activated Promote good governance and a sound‐working environment.
Management of workplace relations.
100% operational and maintained.
100% maintained
Maintain processes to
measure, reward and manage performance.
90% achieved Promote embedded performance management.
Implementation and management of an integrated Staff Performance Management System.
Engage line managers and
staff on performance processes.
60%
Ensure effective and sustainable corporate communication processes.
Develop an integrated communication strategy.
Implement communication programmes.
50%
Review and monitor progress.
Focused on training women,
implementing the framework for
employee well‐being programme
Facilitate strategies for managing
diversity in the workplace.
Focused on training women,
implementing the framework for
employee well‐being programme
Ensure an established, diverse and integrated workforce and environment.
Promote transformation and human rights ethos.
Develop and partly
implement strategies for managing
HIV/AIDS in the workplace.
Focused on awareness
programmes on HIV / AIDS

Part 2: Programme Performance
27
Programme 1: Administration
Actual performance against target Output
Output performance measures/service delivery
indicators Target Actual
Sub‐programme 1.3: Corporate Services
Deliver an effective and efficient operational function.
Strengthen capacity in core HR functions and broaden competencies.
Implement programme.
80%
Ensure good governance and risk management.
Implement the internal audit recommendations of the identified areas of risk.
60% of risk areas addressed.
60% of risk areas addressed.
Sub‐programme 1.4 : Financial Management
Purpose : To deliver financial management (inclusive of risk management and internal control), supply chain management and specialised auxiliary services for the Treasury.
Measurable Objective : Efficient and effective planning and budget management. Effective application of resources in realising strategic goals. Ledger accounts that accurately reflect the financial position of the Provincial Treasury. Efficient and effective supply chain management services. Financial inspections to improve internal control. Communication of guidelines on compliance with prescripts.
Service delivery achievements
: The successful compilation of a comprehensive operational plan and four quarterly performance reports, with improved controls over the In‐Year Monitoring (IYM) process. The Provincial Treasury achieved a 0.98% under spending on the Adjustment Budget. Improvements in financial accounting, and in exercising control over timely payments and the reduction of debtors. The Supply Chain Management unit has become fully operational with a well‐established Bid Committee and departmental IT Committee (DITCOM). A consultant was appointed to help improve registry and document control functions. The library is functioning.
Reasons for achieving targets
: All targets as set out in the performance agreement of the Chief Financial Officer have been attained and concerted efforts were made to attain representivity in new appointments.

28
Annual Report 2005/06
Sub‐programme 1.4 : Financial Management
Reasons for not achieving targets
: Controls over LOGIS (Logistical Information Systems) reports, physical asset controls and expenditure payments left room for improvement.
The attainment of targets contributed towards achieving the Provincial Treasury’s outcomes in the following manner
: Service delivery to all components within the Treasury has improved with better IYM information and support to all the programmes in compiling their budgets and strategic plans. On the payments side, improvement has been made in the provision of goods and services. Several bids were approved or amended to ensure that the Provincial Treasury attain its goals with communication, risk assessments and socio‐economic research projects.
Programme 1: Administration
Actual performance against target Output
Output performance measures/service delivery indicators Target Actual
Sub‐programme 1.4: Financial Management
Efficient and effective planning and budget management.
Percentage variance between actual and approved budget.
10% 1%
Effective application of resources in realising strategic goals.
Percentage expenditure in line with detailed budget per sub‐programme.
95% 99%
Number of days for clearing of ledger control accounts.
60 days.
35 days.
Number of days to complete reconciliation after month close.
30 days. 30 days.
Ledger accounts that accurately reflect the financial position of the Provincial Treasury.
Number of management information tools to reflect the Provincial Treasury’s records.
12 5
Percentage of bids successfully administered to contract phase.
80% 90%
Compliance with conditions of contract.
90% 90%
Efficient and effective supply chain management services.
Assets accurately recorded on inventory in terms of accrual accounting.
70% 70%
Financial inspections to improve internal control.
Number of inspections successfully completed.
12 12

Part 2: Programme Performance
29
Programme 1: Administration
Actual performance against target Output
Output performance measures/service delivery indicators Target Actual
Sub‐programme 1.4: Financial Management
Percentage improvement in the quality of inspection reports.
70% 70%
Communication of guidelines on compliance with prescripts.
Review guidelines on compliance with prescripts.
Annually Three circulars distributed
Developmental level of risk profile.
50% 50% Improved Provincial Treasury’s risk profile.
Percentage checking of high risk per component.
30% 30%
Compliance with financial prescripts pertaining to management accounting.
Percentage compliance with regard to quality output and timeliness.
90% 95%
Days to follow‐up debtors.
30‐day cycles. 20‐day cycles. Efficient control over debtors and creditors.
Days to pay creditors. <30 days <70 days
Regular maintenance checks on Basic Accounting System (BAS).
Monthly Monthly Efficient system management (Syscon).
Regular maintenance checks on LOGIS.
Quarterly Quarterly
Establish measures for a vehicle fleet that will cater for the changing needs of the Provincial Treasury.
80% 80%
Good operative document control.
75% 60%
High quality delivery of auxiliary services.
Percentage of high quality and timely delivery of all other auxiliary services.
90% 80%
Number of staff members trained in customer care.
20 9 Good communication and co‐ordination within the sections of Financial Management and other components within Provincial Treasury.
Number of staff members trained in communication skills and group dynamics.
15 5
Ensure a full complement of competent staff.
Ensure low vacancy rate.
<5% 19%

30
Annual Report 2005/06
Programme 1: Administration
Actual performance against target Output
Output performance measures/service delivery indicators Target Actual
Sub‐programme 1.4: Financial Management
Review of identified staff suitably trained.
Quarterly Quarterly
Determine information needs at Directorate’s meeting.
Monthly Monthly Proper high level management information timeously.
Percentage of measures in place to have information available.
70% 68%
2.2 Programme 2: Sustainable Resource Management Aim: To provide professional advice and support on provincial and local government
economic analysis, fiscal policy and public finance development. The programme also manages the annual provincial budget process, assists with and monitors local government budgets.
Sub‐programme 2.1
: Programme Support
Purpose : To facilitate the efficient and co‐ordinated administration and management of the programme.
Measurable Objectives
:
Smooth and effective functioning of the component. Trained and capacitated administrative support and line function staff. Achievement of iKapa Elihlumayo (Dignity, Equity, Prosperity) goals.
Service delivery achievements
:
The unit is not yet operational.
Reasons for achieving targets
:
The unit is not yet operational.
Reasons for not achieving targets
:
The unit is not yet operational.
The attainment of targets contributed
:
The unit is not yet operational.

Part 2: Programme Performance
31
Sub‐programme 2.1
: Programme Support
towards achieving the Provincial Treasury’s outcomes in the following manner
Programme 2: Sustainable Resource Management
Actual performance against target Output
Output performance measures/service delivery indicators Target Actual
Sub‐programme 2.1: Programme Support
Percentage compliance with rules and regulations.
100% compliance. Not applicable
Percentage compliance to acceptable norms/standards of service delivery.
70% achieved. Not applicable
Smooth and effective functioning of the component.
Hours’ turnaround time for management of operational finances, human resources and logistical issues.
48 hours. Not applicable
Number of vacant posts filled.
50% achieved. Not applicable Trained and capacitated administrative support and line function staff.
Percentage of staff complement trained according to IDPs.
50% achieved. Not applicable
Percentage support and promotion of goals in work environment.
100% support achieved.
Not applicable Achievement of iKapa Elihlumayo goals.
Percentage procurement in terms of BBBEE.
40% Not applicable
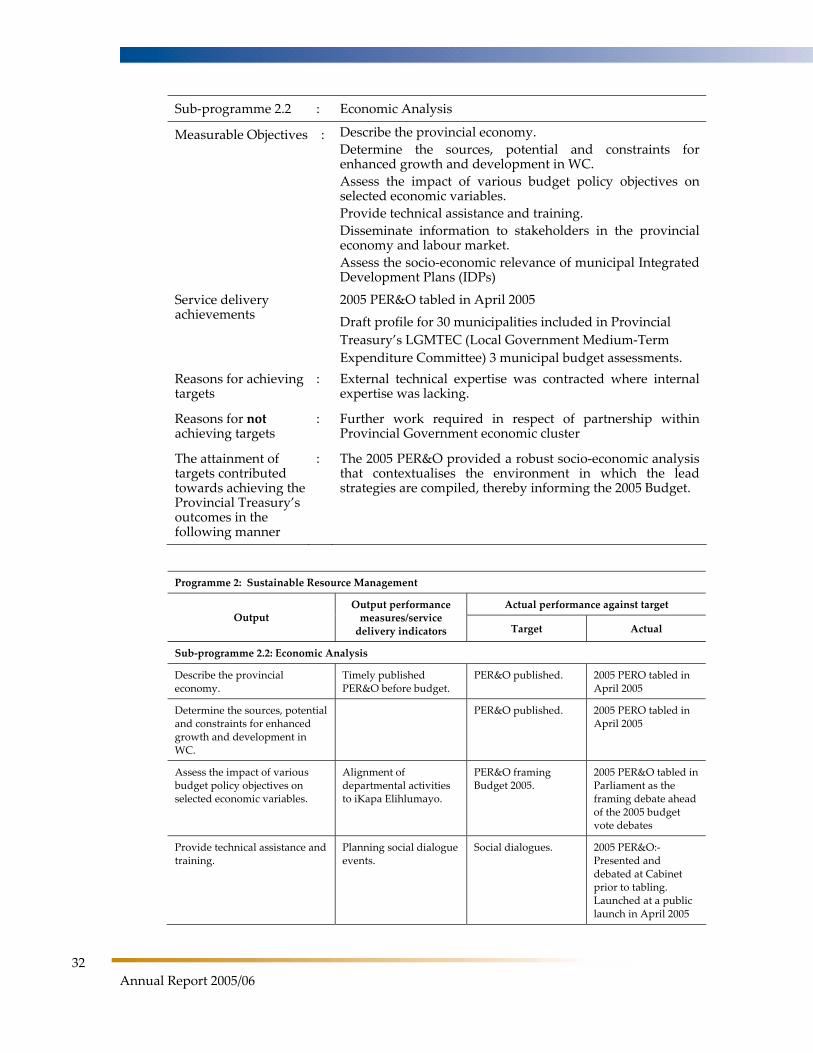
Sub‐programme 2.2 : Economic Analysis
Purpose : To conduct macroeconomic analysis and render policy advice, i.e.:
• to determine and analyse key economic variables and their interrelationships and relevance to the budget
• to advise on the potential for growth and development and the interaction with governmental and revenue patterns
• to investigate alternative budgeting and other revenue and expenditure scenarios on selected key economic growth and development indicators.
32
Annual Report 2005/06
Sub‐programme 2.2 : Economic Analysis
Measurable Objectives : Describe the provincial economy. Determine the sources, potential and constraints for enhanced growth and development in WC. Assess the impact of various budget policy objectives on selected economic variables. Provide technical assistance and training. Disseminate information to stakeholders in the provincial economy and labour market. Assess the socio‐economic relevance of municipal Integrated Development Plans (IDPs)
Service delivery achievements
2005 PER&O tabled in April 2005 Draft profile for 30 municipalities included in Provincial Treasury’s LGMTEC (Local Government Medium‐Term Expenditure Committee) 3 municipal budget assessments.
Reasons for achieving targets
: External technical expertise was contracted where internal expertise was lacking.
Reasons for not achieving targets
: Further work required in respect of partnership within Provincial Government economic cluster
The attainment of targets contributed towards achieving the Provincial Treasury’s outcomes in the following manner
: The 2005 PER&O provided a robust socio‐economic analysis that contextualises the environment in which the lead strategies are compiled, thereby informing the 2005 Budget.
Programme 2: Sustainable Resource Management
Actual performance against target Output
Output performance measures/service delivery indicators Target Actual
Sub‐programme 2.2: Economic Analysis
Describe the provincial economy.
Timely published PER&O before budget.
PER&O published. 2005 PERO tabled in April 2005
Determine the sources, potential and constraints for enhanced growth and development in WC.
PER&O published. 2005 PERO tabled in April 2005
Assess the impact of various budget policy objectives on selected economic variables.
Alignment of departmental activities to iKapa Elihlumayo.
PER&O framing Budget 2005.
2005 PER&O tabled in Parliament as the framing debate ahead of the 2005 budget vote debates
Provide technical assistance and training.
Planning social dialogue events.
Social dialogues. 2005 PER&O:‐ Presented and debated at Cabinet prior to tabling. Launched at a public launch in April 2005

Part 2: Programme Performance
33
Programme 2: Sustainable Resource Management
Actual performance against target Output
Output performance measures/service delivery indicators Target Actual
Sub‐programme 2.2: Economic Analysis
Publishing of PER&O. PER&O published. 2000 copies of 2005PER&O printed and distributed to wider national, provincial & Local Government audience
Engaging in social dialogues.
Social dialogues. 2000 copies of 2005PER&O printed and distributed to wider national, provincial & Local Government audience
Hosting of launch and media briefing.
Social dialogues. 2005 PER&O public launch in April 2005. Radio, TV & print media engagement.
Producing iKapa Elihlumayo quarterly bulletin.
Four publications. No progress yet
Disseminating information to other stakeholders in the provincial economy and labour market.
Developing iKapa Elihlumayo web page.
50% completed. No progress yet
Assessing socio‐economic relevance of municipal IDPs
IDPs that reflect the true socio‐economic needs in each municipality.
Profiles completed Draft profile for 30 municipalities included in PT’S LGMTEC 3 municipal budget assessments.
Sub‐programme 2.3 : Fiscal Policy
Purpose : To enable the provincial government to finance its service delivery obligations.
Measurable Objectives : To participate robustly in the Technical Committee on Finance, Provincial Equitable Share and Conditional Grant working groups. To produce an analytical position paper analysing PES and CG transfers. To produce a framework position paper with respect to the Fiscal Governance Model. To produce analytical provincial own revenue position papers. To analyse debtor reports. To produce quarterly IYM debtors’ reports. To initiate and complete revenue estimation model process. To present the fuel levy proposal to various stakeholders. To secure approval of the fuel levy by National Treasury and

34
Annual Report 2005/06
Sub‐programme 2.3 : Fiscal Policy Provincial Legislature.
To research the feasibility of the tourism levy. To cancel the present Tourism levy tender and initiate a new process. To explore new potential tax sources. To liase with the Western Cape Gambling and Racing Board including monthly engagements. To liase with Standing Committee on Finance, Head of Provincial Treasury, and MEC regarding the Western Cape Gambling and Racing Board. To produce monthly and quarterly IYM revenue reports. To produce liability statements (guarantees and loans). To assess the viability of municipal revenue budgets to ensure sustainability.
Service delivery achievements
: The fuel levy was approved by Minister of Finance and thelegislative process is underway. A second PPP will be formed in 2006 and the levy will be implemented on 1 April 2007. The previous Tourism levy tender was cancelled and a new contract signed. Research commenced on proposals for alternative taxation mechanisms for the gambling industry.
Reasons for achieving targets
: Effective liaison between the unit and other role players, including departments. Appointment of a senior manager and other key staff.
Reasons for not achieving targets
: Research into alternative Equitable Share allocation mechanism not completed.
The attainment of targets contributed towards achieving the Provincial Treasury’s outcomes in the following manner
: A thorough understanding of revenue sources allowed the unit to manage, optimise and expand revenue thereby ensuring that the Provincial Treasury was able to meet expenditure obligations.
Programme 2: Sustainable Resource Management
Actual performance against target Output
Output performance measures/service delivery indicators Target Actual
Sub‐programme 2.3: Fiscal Policy
Robust participation on the TCF, PES and CG working groups.
Position papers, policy briefs, reports and memos.
100% participation. 100% participation.

Part 2: Programme Performance
35
Programme 2: Sustainable Resource Management
Actual performance against target Output
Output performance measures/service delivery indicators Target Actual
Sub‐programme 2.3: Fiscal Policy
Analytical position paper analysing PES and CG transfers.
Timeous submission of informative and accurate reports to HoPT and MEC.
Quarterly reports. Memos.
Quarterly reports and memos completed. Commenced research into alternative Equitable Share allocation mechanism.
Framework position paper with respect to the Fiscal Governance Model.
Position papers, policy briefs, reports and memos.
Final report. Study in process
Analytical provincial own revenue position papers.
Final own revenue paper and quarterly reports timeously submitted.
Final own revenue paper (inclusive of reports and memos).
Fourth quarter final own revenue paper.
Analysis of debtor reports. Detailed analysis of debtors.
Continuous. Continuous.
Quarterly IYM debtors’ reports.
Quarterly reports. Continuous. Continuous.
Initiation and completion of revenue estimation model process.
Accurate own revenue forecasting.
Initiation of model and develop adaptation.
Model Initiated, service provider identified for the provision of training.
Presentation of fuel levy proposal to the various stakeholders.
Implementation of fuel levy 06/07.
Finalisation of fuel levy proposal.
Fuel levy approved by Minister of Finance Legislative process underway. Second PPP will take place in 2006 and the Levy will be implemented on 1 April 2007.
Approval of the fuel levy by National Treasury and provincial legislature.
Implementation of fuel levy 06/07.
Approval of fuel levy by NT.
Fuel levy approved by NT
Research into the feasibility of the tourism levy.
Implementation of tourism levy.
Continuation of tourism levy feasibility study.
Tourism levy contract for the feasibility study signed. Final tourism levy report due September 2006
Proceed to cancel the present Tourism levy tender and initiate a process.
Cancellation of present tourism levy tender.
Cancellation of present tourism levy tender.
Previous Tourism levy tender cancelled, and new contract signed.
Identification of viable revenue sources.
Start process of implementation.
Process of research commenced.
Exploring new potential tax sources.
Discussions with departments on viability.
No progress.

36
Annual Report 2005/06
Programme 2: Sustainable Resource Management
Actual performance against target Output
Output performance measures/service delivery indicators Target Actual
Sub‐programme 2.3: Fiscal Policy
Liaison with gambling board including monthly engagements.
Smooth and efficient running of the Western Cape Gambling and Racing Board.
Access measures to increase own revenue.
Research commenced on proposals for alternative taxation mechanisms for the gambling industry.
Liaison with SCOF, HOT, and MEC regarding the Western Cape Gambling and Racing Board.
Smooth and efficient running of the Western Cape Gambling and Racing Board.
Access measures to increase own revenue.
Continuous
Monthly and quarterly IYM revenue reports.
Advanced analysis of own revenue.
Continuous. Continuous.
Liability statements (guarantees and loans).
Contingent liability statement.
Not applicable. Not applicable.
Assess viability of municipal revenue budgets to ensure sustainability.
Effective lines of communications and unified actions.
60% acceptance by councils.
Acceptance by councils
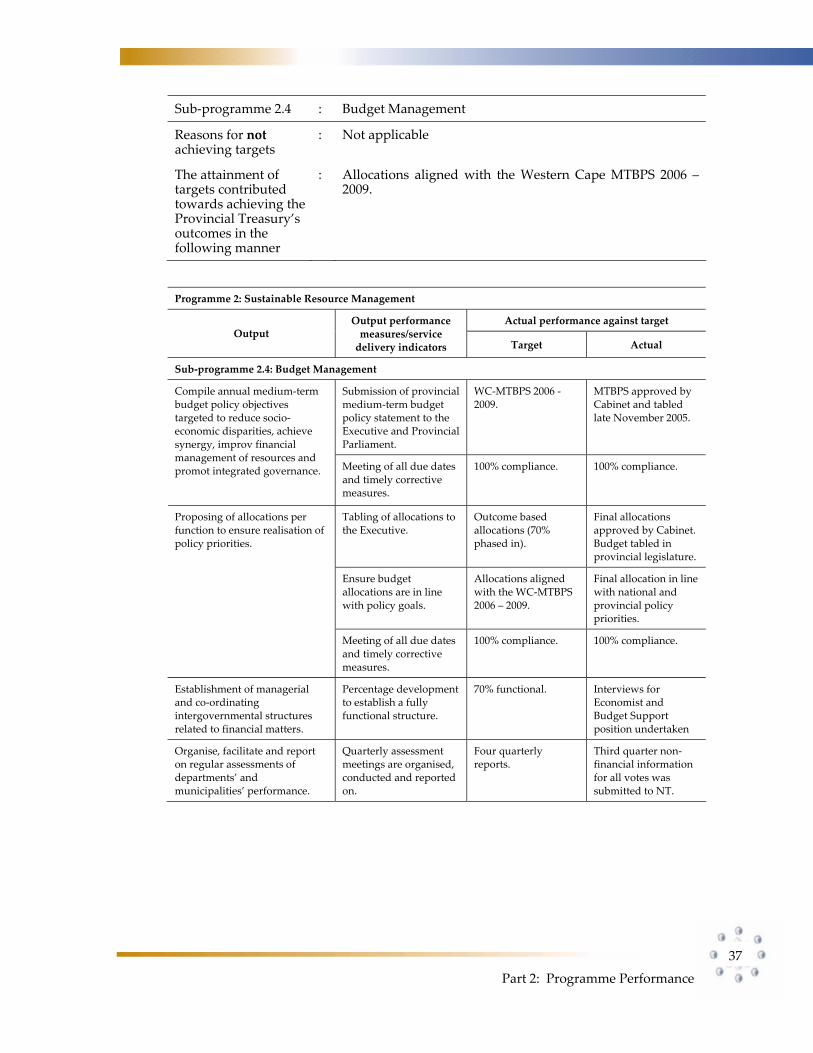
Sub‐programme 2.4 : Budget Management
Purpose : To promote effective financial resource allocation.
Measurable Objectives : To compile annual medium‐term budget policy objectives targeted at reducing socio‐economic disparities, achieving synergy, improving financial management of resources and promoting integrated governance To propose allocations per function to ensure realisation of policy priorities. To establish managerial and co‐ordinating intergovernmental structures related to financial matters. To organise, facilitate and report on regular assessments of departments’ and municipalities’ performance.
Service delivery achievements
: Medium‐Term Budget Policy Statement (MTBPS) approved by Cabinet and tabled late November 2005. Final allocations approved by Cabinet. Budget tabled in provincial legislature. Third quarter non‐financial information for all votes was submitted to National Treasury. Budget 2006 was published and Appropriations Bill tabled 17 February 2006. Final allocations were in the line with national and provincial policy priorities.
Reasons for achieving targets
: Vacant posts were filled with the appointment of a strong team of economists with appropriate levels of skill and expertise.
Part 2: Programme Performance
37
Sub‐programme 2.4 : Budget Management
Reasons for not achieving targets
: Not applicable
The attainment of targets contributed towards achieving the Provincial Treasury’s outcomes in the following manner
: Allocations aligned with the Western Cape MTBPS 2006 – 2009.
Programme 2: Sustainable Resource Management
Actual performance against target Output
Output performance measures/service delivery indicators Target Actual
Sub‐programme 2.4: Budget Management
Submission of provincial medium‐term budget policy statement to the Executive and Provincial Parliament.
WC‐MTBPS 2006 ‐ 2009.
MTBPS approved by Cabinet and tabled late November 2005.
Compile annual medium‐term budget policy objectives targeted to reduce socio‐economic disparities, achieve synergy, improv financial management of resources and promot integrated governance. Meeting of all due dates
and timely corrective measures.
100% compliance. 100% compliance.
Tabling of allocations to the Executive.
Outcome based allocations (70% phased in).
Final allocations approved by Cabinet. Budget tabled in provincial legislature.
Ensure budget allocations are in line with policy goals.
Allocations aligned with the WC‐MTBPS 2006 – 2009.
Final allocation in line with national and provincial policy priorities.
Proposing of allocations per function to ensure realisation of policy priorities.
Meeting of all due dates and timely corrective measures.
100% compliance. 100% compliance.
Establishment of managerial and co‐ordinating intergovernmental structures related to financial matters.
Percentage development to establish a fully functional structure.
70% functional. Interviews for Economist and Budget Support position undertaken
Organise, facilitate and report on regular assessments of departments’ and municipalities’ performance.
Quarterly assessment meetings are organised, conducted and reported on.
Four quarterly reports.
Third quarter non‐financial information for all votes was submitted to NT.

38
Annual Report 2005/06
Sub‐programme 2.5 : Public Finance
Purpose : To ensure efficient budget management.
Measurable Objectives : To produce a budget in line with national and provincial priority goals. To produce credible budgets. To table the annual budget. To table the adjustments budget. To ensure effective and quality IYM of expenditure. To implement the MFMA. To ensure functional intra‐ and inter‐governmental co‐ordinating structures and institutions that relate to planning and financial matters. To facilitate the vesting of functions between provincial and local government. To ensure effective monitoring of monthly outcomes of municipal budgets. To determine the extent to which municipal budgets are aligned with broad national and provincial priorities.
Service delivery achievements
: Provincial Benchmark meeting held 12 January 2006 Produced 13 analytical IYM reports. Completed the LGMETC2 and LGMETC3 engagements Provincial allocations to municipality and municipal budget assessments. LGMETC3 budget visit to all municipalities. Assisted with Councillor training. Nominal compliance by municipalities with section 71(IYM) of the MFMA.
Reasons for achieving targets
: Targets were achieved due to dedication and commitment of all staff.
Reasons for not achieving targets
: Further research to be done in 2006/07. Lack of suitably qualified and experienced staff. Different municipal capacity, financial systems and accounting standards.

Part 2: Programme Performance
39
Sub‐programme 2.5 : Public Finance
The attainment of targets contributed towards achieving the Provincial Treasury’s outcomes in the following manner
: The unit contributed towards achieving the Provincial Treasury’s outcomes by ensuring efficient budget management.
Programme 2: Sustainable Resource Management
Actual performance against target Output
Output performance measures/service delivery indicators Target Actual
Sub‐programme 2.5: Public Finance Provincial Government Finance
Provincial benchmark exercise.
One assessment. Provincial Benchmark meeting held 12 January 2006. National Treasury deemed Western Cape Budget credible.
Budget in line with national and provincial priority goals.
Bilateral medium term expenditure committee hearings.
Two assessments. Two assessments completed.
Bilateral medium term expenditure committee hearings.
13 reports. 13 reports. Credible budgets.
Expenditure Review. One review. Not achieved, deferred to 2006/07 as a chapter to the financial governance review and outlook.
Tabling of the annual budget. Submission of budget documentation in line with prescribed formats and timelines to the Provincial Parliament.
February 2006. Tabled annual budget on 17 February 2006.
Tabling of the adjustments budget
Submission of budget documentation in line with prescribed formats and timelines to the Provincial Parliament.
November. Tabled adjusted estimate 22 November 2005
Prescribed reporting i.t.o. sections 32 and 40 of PFMA.
13 reports x 4. 13 reports x 4.
13 analytical reports x 4.
13 analytical reports x 4.
Effective and quality IYM of expenditure.
Non‐prescribed reporting in development.
Pilot.13 Performance reports x 4.
Not applicable.

40
Annual Report 2005/06
Programme 2: Sustainable Resource Management
Actual performance against target Output
Output performance measures/service delivery indicators Target Actual
Sub‐programme 2.5: Public Finance Provincial Government Finance
Developed efficiency indicators/ratios.
Indicators/ratios for Education, Health, Social Services and Poverty Alleviation, Transport and Public Works.
Limited application
Maintenance of database with financial information.
Maintained database with financial information.
Functional database.
Develop database with non‐financial information. Phase 1.
Database developed and maintained with non‐financial information.
Programme 2: Sustainable Resource Management
Actual performance against target Output
Output performance measures/service delivery indicators Target Actual
Sub‐programme 2.5: Public Finance Local Government Finance
Readiness to perform the provincial treasury responsibilities.
Organisation structure approved by Cabinet, Recruitment process underway, Functional centralised unit, Operational Plan. Fulfil PT Role and responsibilities as from 1 July 2005. Filling of MFMA related post (level 5,9, 11 and 13). NT training and workshop as well as PT group training.
Filling of posts in line with approved structure. Scheduled training in terms individual development plans. Assisting with Councillor training 60% functional. Attended NT training and workshops on the MFMA.
Implementation of the MFMA.
Assist with monitoring nominal and substantive compliance in accordance with National Treasury guidelines.
24‐30 municipalities.
Continuous monitoring and advising municipalities on the MFMA and related regulations. Assisted NT with the submission and collation of quarterly reports.

Part 2: Programme Performance
41
Programme 2: Sustainable Resource Management
Actual performance against target Output
Output performance measures/service delivery indicators Target Actual
Sub‐programme 2.5: Public Finance Local Government Finance
70% functional Municipal budgeting and Technical forum.
Completed the LGMTEC1, LGMTEC2 and LGMTEC3 engagements, Provincial allocations to municipalities and municipal budget assessments. LGMETC3 budget visit to all municipalities.
Functional intra and intergovernmental co‐ordinating structures and institutions (forums) that relate to planning and financial matters.
Percentage development to establish fully functional structures.
20% functional Municipal CFO forum.
Functional and operational – 2 meetings in the 3rd and 4th quarters.
Facilitated vesting of functions between provincial and local government.
Appropriate authorisation.
28 functions w.r.t. Position statement.
Assisting with the development of a framework on the transfer of powers and functions. Sector completed a detailed report on the Powers and Functions. Report submitted to cabinet.
Effective monitoring of monthly outcome of municipal budgets.
Prescribed reporting. 24‐30 municipality reports X 9.
Although submission of IYM on a monthly basis by 24 municipalities, it is not being submitted on the legislated due dates. Normal compliance with section 71 of MFMA. Presentation on the IYM at municipal CFO Forum.
Analysis of municipal budgets.
24‐30 budgets. Completed the LGMTEC1, LGMTEC2 and LGMTEC3 engagement Provincial allocations to municipalities and municipal budget assessments.
Determine extent to which municipal budgets are aligned with broad national and provincial priorities.
Local Government Review.
1 review. Planning for the next cycle

42
Annual Report 2005/06
2.3 Programme 3: Asset and Liabilities Management Aim: To ensure the effective and efficient management of physical and financial assets.
Sub‐programme 3.1 : Programme Support
Purpose : To facilitate the efficient and co‐ordinated administration and management of the programme.
Measurable Objective : Smooth and effective functioning of the component. Trained and capacitated administrative support and line function staff. Achievement of iKapa Elihlumayo goals.
Service delivery achievements
: The unit is not yet operational.
Reasons for achieving targets
:
Reasons for not achieving targets
:
The attainment of targets contributed towards achieving the Provincial Treasury’s outcomes in the following manner
:
Programme 3: Asset And Liability Management
Actual performance against target Output
Output performance measures/service delivery indicators Target Actual
Sub‐programme 3.1: Programme Support
Percentage compliance with rules and regulations.
100% compliance. Not applicable
Percentage compliance to acceptable norms/standards of service delivery.
70% achieved. Not applicable
Smooth and effective functioning of the component.
Hours’ turnaround time for management of operational finances, human resources and logistical issues.
48 hours. Not applicable
Trained and capacitated administrative support
Number of vacant posts filled.
50% achieved. Not applicable

Part 2: Programme Performance
43
Programme 3: Asset And Liability Management
Actual performance against target Output
Output performance measures/service delivery indicators Target Actual
Sub‐programme 3.1: Programme Support
and line function staff. Percentage of staff complement trained according to IDPs.
50% achieved. Not applicable
Percentage support and promotion of goals in work environment.
100% support achieved.
Not applicable Achievement of iKapa Elihlumayo goals.
Percentage procurement in terms of BBBEE.
40% Not applicable
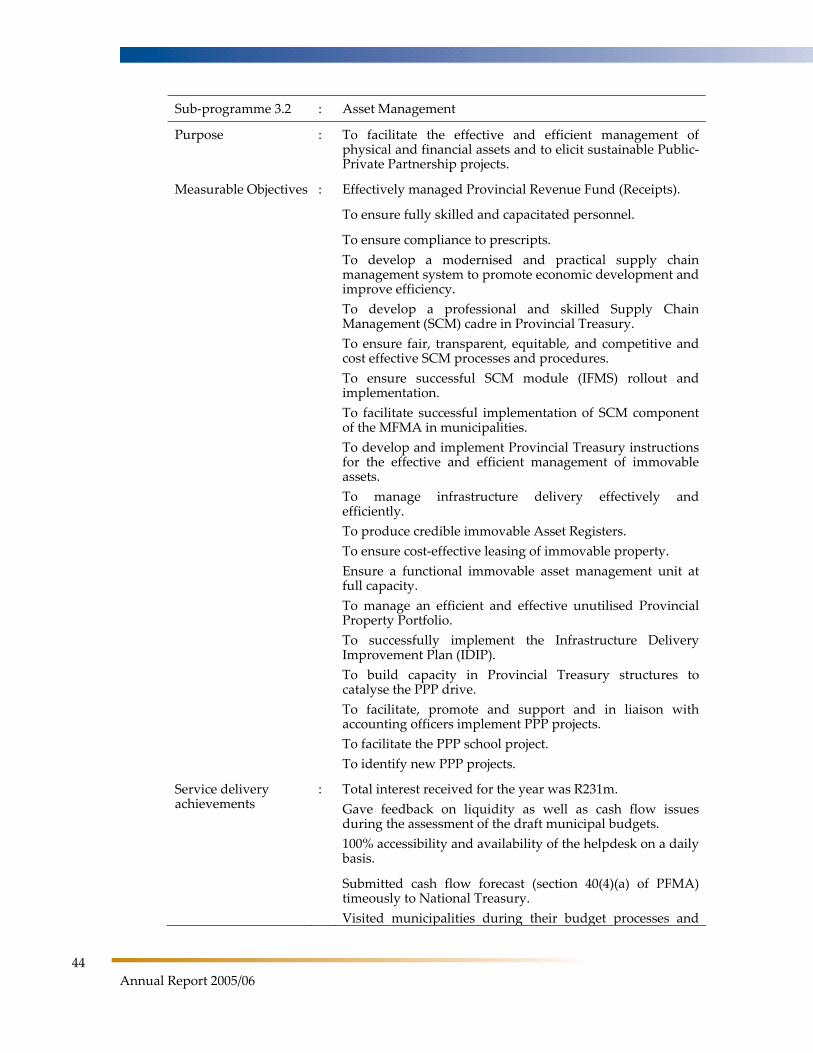
44
Annual Report 2005/06
Sub‐programme 3.2 : Asset Management
Purpose : To facilitate the effective and efficient management of physical and financial assets and to elicit sustainable Public‐Private Partnership projects.
Measurable Objectives : Effectively managed Provincial Revenue Fund (Receipts).
To ensure fully skilled and capacitated personnel.
To ensure compliance to prescripts. To develop a modernised and practical supply chain management system to promote economic development and improve efficiency. To develop a professional and skilled Supply Chain Management (SCM) cadre in Provincial Treasury. To ensure fair, transparent, equitable, and competitive and cost effective SCM processes and procedures. To ensure successful SCM module (IFMS) rollout and implementation. To facilitate successful implementation of SCM component of the MFMA in municipalities. To develop and implement Provincial Treasury instructions for the effective and efficient management of immovable assets. To manage infrastructure delivery effectively and efficiently. To produce credible immovable Asset Registers. To ensure cost‐effective leasing of immovable property. Ensure a functional immovable asset management unit at full capacity. To manage an efficient and effective unutilised Provincial Property Portfolio. To successfully implement the Infrastructure Delivery Improvement Plan (IDIP). To build capacity in Provincial Treasury structures to catalyse the PPP drive. To facilitate, promote and support and in liaison with accounting officers implement PPP projects. To facilitate the PPP school project. To identify new PPP projects.
Service delivery achievements
: Total interest received for the year was R231m. Gave feedback on liquidity as well as cash flow issues during the assessment of the draft municipal budgets. 100% accessibility and availability of the helpdesk on a daily basis.
Submitted cash flow forecast (section 40(4)(a) of PFMA) timeously to National Treasury. Visited municipalities during their budget processes and

Part 2: Programme Performance
45
Sub‐programme 3.2 : Asset Management gave inputs with regard to the overall assessment. Total Cost of Ownership (TCO) on 1‐commodity items within three departments.
12 departments assessed for compliance SCM implemented in 20 municipalities 47% of the target population received South African Management Development Institute (SAMDI) Training One discussion took place with role players in Branch Property Management. Discussions held with Public Works on unutilised assets.
Reasons for achieving targets
: Thorough planning, timeous action, commitment and co‐operation of all relevant role players contributed to the successful achievement of most of the set targets.
Reasons for not achieving targets
: Delays in approval of Government Immoveable Asset Management Act (GIAMA) High vacancy level due to high staff turnover and newly appointed officials.
The attainment of targets contributed towards achieving the Provincial Treasury’s outcomes in the following manner
: The component assisted in the drive to achieve proper asset management.
Programme 3: Asset and Liabilities Management
Actual performance against target Output
Output performance measures/service delivery
indicators Target Actual
Sub‐programme 3.2: Asset Management – Financial Asset Management
The daily monitoring of all banking accounts to ensure a deviation of less than 2% between transfers and actual expenditure.
100% achieved. 100% achieved. Effectively managed Provincial Revenue Fund (Receipts).
Scheduling of all payments by departments in terms of a payment schedule prescribed by the Provincial Treasury permitting payment in 30 days from the date of invoice where possible. BAS reports to verify that departments actually adhere to this policy are envisaged.
70% of target. 100% target was met.

46
Annual Report 2005/06
Programme 3: Asset and Liabilities Management
Actual performance against target Output
Output performance measures/service delivery
indicators Target Actual
Sub‐programme 3.2: Asset Management – Financial Asset Management
Investment of surplus funds at reputable financial institutions/Corporation for Public Deposits, ensuring a return of 5% above budgeted interest figure.
100% achieved. A total of R113m was received in respect of interest earned. Total interest received for the year was R231m.
Preparation, awarding and implementation of tender for the provision of commercial banking services to the province by 1 April 2007.
Not applicable. Not applicable
Training of 150 departmental officials to familiarise such personnel with current banking procedures/policies.
25% of target market. 100% of target was achieved
Determining skills gap to improve capacity and address shortcomings of existing staff in the Provincial Treasury.
25% Target achieved
Training relevant personnel of 30 municipalities to ensure enhancement of cash flow management.
10% Gave feedback on liquidity as well as cash flow issues during the assessment of the draft municipal budgets.
Fully skilled and capacitated personnel.
Fully operational helpdesk managed by skilled staff rendering service to 150 users.
100% accessibility and availability of the helpdesk on a daily
basis.
100% achieved.
Provincial Treasury to ensure accurate and timeous receipt of cash flow projections in terms of the PFMA.
100% timeous submission and not more than 10% deviation in projections vs. transfers.
Submitted cash flow forecast (section 40(4)(a) of PFMA) timeously to NT
ompliance to prescripts.
Monitor and supervise municipalities with regard to prescribed cash management requirements of the MFMA.
100% compliance. Visited municipalities during their budget processes and gave inputs with regard to the overall assessment.

Part 2: Programme Performance
47
Programme 3: Asset and Liabilities Management
Actual performance against target Output
Output performance measures/service delivery
indicators Target Actual
Sub‐programme 3.2: Asset Management – Physical Asset Management Movable Assets
Number of transversal contracts arranged.
Facilitation and management of 3 transversal contracts.
In process to facilitate with the three transversal contracts
Percentage of specific departments assessed.
30% on Education and Transport and Public Works.
12 departments assessed.
Number of commodities completed.
TCO on 1‐commodity items within 3 departments.
Target achieved: and was included in departmental assessment
Number of assessment reports on renewal of Electronic Purchasing System (EPS) and Western Cape Supplier Database (WCSD).
Assessment reports 100% complete. Service provider identified to do assessments. Due to commence in January 2006, before existing contract expires.
Assessment report completed
Number of officials knowledgeable in prescripts.
100% complete. Target achieved
A modernised and practical supply chain management system to promote economic development and improve efficiency.
Percentage of elements of Total Quality Management (TQM) implemented in three departments.
Not applicable. Not applicable.
Percentage of vacancies filled.
100% complete by June 05.
Not applicable.
Capacitated and restructured PT: SCM component to manage the following specific areas:
Not applicable. Not applicable.
Norms and Standards. 50% capacity. Target achieved
Helpdesk/Call Centre/ complaints mechanism.
100% capacity. 50% capacitated
Training. 50% capacity. Not achieved
Monitoring and compliance.
100% capacity. Target was not fully achieved
A professional and skilled SCM cadre in Provincial Treasury.
Build capacity/co‐ordinate training/re‐training of 300 officials.
30% capacity. ‐Target achieved

48
Annual Report 2005/06
Programme 3: Asset and Liabilities Management
Actual performance against target Output
Output performance measures/service delivery
indicators Target Actual
Sub‐programme 3.2: Asset Management – Physical Asset Management Movable Assets
Fair, transparent, equitable, competitive and cost‐effective SCM processes and procedures.
Percentage complaints mechanism in Province.
50% capacitated. Target achieved
Compliance to prescripts. Number of departments completed compliance testing.
Compliance testing at 5 departments completed.
Target surpassed 12 departments assessed
Prepare provincial departments for the implementation of IFMS.
Not applicable. Not applicable.
Develop norms and standards on IFMS.
Not applicable. Not applicable.
Successful SCM module (IFMS) rollout and implementation.
Implement/roll‐out of IFMS to provincial departments.
Not applicable. Not applicable.
Number/percentage of vacancies filled in Provincial Treasury.
3 posts filled. 2 posts filled
Number of SCM units in municipalities and municipal entities established with the percentage of set criteria.
15 units met 25% of criteria.
Target achieved. 15 units met 25% of criteria
Number of municipalities within which SCM have been implemented.
SCM implemented in 20 municipalities.
Target achieved. SCM implemented in 20 municipalities
Percentage of target population trained.
20% of target population trained.
47% of the Target population received SAMDI Training
Successful implementation and roll‐out of MFMA: SCM in municipalities
Number of municipalities having access to WCSD.
Implementation of WCSD in 1 municipality.
4 Municipalities have access to WCSD as at the last quarter.
Programme 3: Asset and Liabilities Management
Actual performance against target Output
Output performance measures/service delivery
indicators Target Actual
Sub‐programme 3.2: Asset Management – Physical Asset Management Immovable Assets
Develop and implement Provincial Treasury instructions for the effective and efficient management of immovable assets.
Completion of Provincial Treasury Instructions developed for immovable asset registers, acquisitions, disposals, transfers and donations.
100% completed. A draft version is compiled.

Part 2: Programme Performance
49
Programme 3: Asset and Liabilities Management
Actual performance against target Output
Output performance measures/service delivery
indicators Target Actual
Sub‐programme 3.2: Asset Management – Physical Asset Management Immovable Assets
Number of workshops conducted on PT instruction on immovable assets.
2 workshops conducted on PT instructions on immovable assets.
1 discussion took place with role players in Branch Property Management.
The percentage of project plans reviewed of R1 million and greater.
100% project plans reviewed.
100% of projects reviewed
Effective and efficient management of infrastructure delivery.
Number of infrastructure reports compiled and compliant to IDIP/ NT Guidelines.
10 infrastructure reports for the year.
100% achieved
Credible immovable Asset Registers.
Percentage of relevant information pertaining to acquisitions, disposals, transfers, donations verified and accounted for on asset register.
100% information verified with relevant documentation.
Information currently not accessible.
Percentage of non market‐related rentals identified and addressed with Public Works.
100% non‐market related rentals identified and addressed.
No non‐market related submissions received from Public Works
Cost‐effective leasing of immovable property.
Address outstanding debtors of 90 days and over with Public Works.
100% of outstanding debtors identified and corrective actions taken.
Outstanding debtors of 90 days and older was followed up with Public Works.
Percentage of vacancies filled.
50% vacancies filled. 100% vacancies were filled. Became vacant due to resignation of two specialists during December
Fully capacitated and functional immovable asset management unit.
Percentage of specialists trained.
50% staff adequately trained.
50% of staff were trained in Basic Property Management and Advanced Excel
Updated database of unutilised immovable assets.
100% achieved. Updated list from Public Works currently being reviewed
To manage an efficient and effective unutilised Provincial Property Portfolio.
Promotion of property developmental options identified in conjunction with Public Works and private sector.
Identification of one property for potential development.
Discussions were held with Public Works on unutilised assets.

50
Annual Report 2005/06
Programme 3: Asset and Liabilities Management
Actual performance against target Output
Output performance measures/service delivery
indicators Target Actual
Sub‐programme 3.2: Asset Management – Physical Asset Management Immovable Assets
Monitoring of Public Works’ disposal plan of obsolete/ redundant immovable assets.
50% initiate/ action according to Public Works disposal list.
Two disposals were monitored.
% IDIP implemented in participating departments.
50% implemented in Education department.
60% implemented in Education
Number of reports from technical assistants timeously reviewed and endorsed by Provincial Treasury:
100% of deliverables for Education endorsed by PT.
100% achieved
Inception report. Completed by: 31/10/05.
Not applicable
Capacitation plan. 31/01/05 Not applicable
Delivery management system report.
30/04/05 Not applicable
Infrastructure Plan. 31/05/05
Not applicable
Implementation Plan. 30/06/05 Not applicable
Contracting Arrangement Plan (SLA).
By 31/07/05 Service delivery agreement was signed between Education and Public Works.
Successful implementation of the Infrastructure Delivery Improvement Plan (IDIP).
Number of meetings held for the year.
10 meetings held for the year.
Six meetings held
Programme 3: Asset and Liabilities Management
Actual performance against target Output
Output performance measures/service delivery
indicators Target Actual
Sub‐programme 3.2: Asset Management – Physical Asset Management PPPs
Percentage of vacancies filled.
100% functional. Achieved unit 70% functional
Capacitated PT structures to catalyse the PPP drive.
Percentage of specialists trained.
60% training achieved.
60 % training achieved
Facilitate, promote and support and in liaison with accounting officers implement PPP projects.
Monitor the application of the PPP processes.
100% response to all PPP project requests received.
Achieved

Part 2: Programme Performance
51
Programme 3: Asset and Liabilities Management
Actual performance against target Output
Output performance measures/service delivery
indicators Target Actual
Sub‐programme 3.2: Asset Management – Physical Asset Management PPPs
Support or reject approval of feasibility proposals for affordability, value for money and risk transfer perspectives for Eerste River Hospital.
No feedback on Eerste River Hospital
Support/reject procurement process for proposals on Lentegeur, Swellendam and Hermanus Hospital PPP projects.
Lentegeur & Rehabilitation Centre bid closed. Swellendam and Hermanus Hospitals awaiting bids.
Financially and contractually viable PPP projects.
Support/reject TAIII application for PPP agreement on Lentegeur Hospital PPP and Western Cape Nature Conservation Board PPP projects.
TAIII approval for Lenteguer PPP due in August 2006 . Awaiting results on Conservation Board PPP
Develop pre‐feasibility guideline on school PPP project.
100% completion by 30 June 2005.
Not achieved
Project registration. Registered by 31 July 2005.
Not achieved
Facilitate PPP school project.
Completion of feasibility study.
Not applicable. Not achieved
New PPP projects identified. Identification of new PPP project from unutilised Provincial Property Portfolio.
1 new project identified.
Not achieved
Sub‐programme 3.3 : Liabilities Management
Purpose : To facilitate the effective and efficient management of liabilities.

52
Annual Report 2005/06
Sub‐programme 3.3 : Liabilities Management
Measurable Objectives : To effectively manage the Provincial Revenue Fund (loan book). To strengthen and provide technical and strategic support for the institutional capacity of provincial and local government with regard to liabilities management. To ensure compliance to prescripts. To establish the necessary structures to ensure accurate reporting and servicing capabilities in respect of liabilities.
Service delivery achievements
: Unit not yet operational.
Reasons for achieving targets
:
Reasons for not achieving targets
:
The attainment of targets contributed towards achieving the Provincial Treasury’s outcomes in the following manner
:
Programme 3: Asset and Liabilities Management
Actual performance against target Output
Output performance measures/service delivery
indicators Target Actual
Sub‐programme 3.3: Liabilities Management
Percentage achieved w.r.t provision for necessary funds to service loan agreements and/or guarantees.
Not applicable. Not applicable.
Percentage achieved w.r.t. meeting of all due dates for repayment of loans and/or guarantees.
Not applicable. Not applicable.
Effectively managed Provincial Revenue Fund (loan book).
Percentage achieved w.r.t. refinement of cash flow to include such loan and/or guarantee repayments.
Not applicable. Not applicable.
Percentage achieved w.r.t. appointment of suitably qualified personnel and build capacity amongst existing staff.
Not applicable. Not applicable. To strengthen and provide technical and strategic support for the institutional capacity of provincial and local government to ensure capacity with regard to liabilities management.
Percentage achieved w.r.t assistance and/or establishment of suitable monitoring mechanisms for loans and for guarantees.
Not applicable. Not applicable.

Part 2: Programme Performance
53
Sub‐programme 3.3 : Liabilities Management Percentage achieved i.t.o. all loans and/or guarantees that are administered and repaid strictly in terms of relevant legislation.
Not applicable. Not applicable. Compliance to prescripts.
Percentage accuracy of reporting in terms of annual financial statements of all loans and/or guarantees.
Not applicable. Not applicable.
Establish the necessary structures to ensure accurate reporting and servicing capabilities in respect of liabilities.
Percentage achieved i.t.o. creation and implementation of suitable mechanisms to facilitate accurate reporting, monitoring, administering and repayment of loans and/or guarantees.
Not applicable. Not applicable.
Sub‐programme 3.4 : Supporting and Interlinked Financial Systems.
Purpose : To provide for the oversight and management of existing financial systems and the transition to the Integrated Financial Management System, enhancing compliance with the PFMA and other relevant legislation.
Measurable Objectives : Ensure effectively, efficiently and economically implemented and managed financial systems. Manage the smooth and cost‐effective transition to the Integrated Financial Management Systems (IFMS). Ensure availability, stability and accessibility of existing financial systems. Ensure system functionalities comply with norms and standards. Develop fully skilled system users. Develop a cost‐effective system.
Service delivery achievements
: LOGIS fully implemented at additional five institutions. Availability and stability of existing financial systems to ensure an up time of at least 98,2%. 100% accessibility and availability of the helpdesk on a daily basis.

54
Annual Report 2005/06
Sub‐programme 3.4 : Supporting and Interlinked Financial Systems.
Reasons for achieving targets
: Fully operational helpdesk managed by skilled staff rendering service to 7000 users.
Reasons for not achieving targets
: On request of provincial departments, LOGIS implementation at the remaining sites held over to 2006/07
The attainment of targets contributed towards achieving the Provincial Treasury’s outcomes in the following manner
: It assisted in vesting proper asset management by further developing financial system management and by building capacity through training finance staff in the Province.
Programme 3: Asset and Liabilities Management
Actual performance against target Output
Output performance measures/service delivery
indicators Target Actual
Sub‐programme 3.4: Supporting and Interlinked Financial Systems
Daily monitoring of the existing systems to ensure that all exceptions, rejections and audit reports are cleared within 7 days.
100% compliance. 100% compliance.
Proper interfaces between sub‐systems and BAS achieved.
100% achieved. 100% achieved.
LOGIS) fully rolled out to the remaining nine institutions (five Departments and four Health Institutions) and integrated into the supply chain management system with fully capacitated personnel.
Nine institutions fully implemented.
Five institutions fully implemented. On request of Departments the remaining institutions to be implemented during 2006/07.
Effectively, efficiently and economically implemented and managed financial systems.
The rollout of Vulindlela (WEB application) to all departments, regions and institutions to ensure the availability of updated management information.
100 % implementation of the application in all 14 head office components of departments as well as in 40 regional/district offices.
100% completion.
Provincial Treasury to play an integral role in planning, development, testing and implementation phases.
On completion of phase 2 of the project, proceed with the planning, development and testing phases of the project.
Status report received from NT. Phase two of the project will commence during 2006/07
The smooth and cost‐effective transition to the Integrated Financial Management Systems (IFMS).
Data preparation and implementation of the various IFMS modules.
Not applicable. Not applicable.

Part 2: Programme Performance
55
Programme 3: Asset and Liabilities Management
Actual performance against target Output
Output performance measures/service delivery
indicators Target Actual
Sub‐programme 3.4: Supporting and Interlinked Financial Systems
Availability stability and accessibility of existing financial systems.
Availability and stability of existing financial systems to ensure an up time of at least 95%.
95% uptime. 98,2% uptime
System functionalities comply with norms and standards.
Needs assessment conducted and enhancements effected.
All user requirements submitted to National Treasury and rolled out within 2 weeks after release.
100% achieved
Fully operational helpdesk managed by skilled staff rendering service to 7000 users.
100% accessibility and availability of the helpdesk on a daily basis.
100% achieved Fully skilled and capacitated system users.
Percentage of 7000 targeted officials appropriately trained on the various financial systems.
70% of target market. Target exceeded by 5%.
A cost effective system. Percentage deviation between actual expenditure and approved budget pertaining to SITA accounts.
No more than 2% deviation between actual expenditure and approved budget.
Target achieved.
2.4 Programme 4: Financial Governance Aim: To enhance performance orientated financial management.
Sub‐programme 4.1 : Programme Support
Purpose : To facilitate the efficient and co‐ordinated administration and management of the programme.
Measurable Objectives : To ensure smooth and effective functioning of the component To train administrative support and line function staff to full capacity. To achieve iKapa Elihlumayo goals.
Service delivery achievements
: No service delivery achievements of note can be registered.
Reasons for achieving targets
: A coordinated approach to work specifics was followed and the unit is at full capacity.
Reasons for not achieving targets
: Not applicable.

56
Annual Report 2005/06
Sub‐programme 4.1 : Programme Support The attainment of targets contributed towards achieving the Provincial Treasury’s outcomes in the following manner
: This sub‐programme plays a supportive role and it does not directly contribute towards achieving the Provincial Treasury’s outcomes.
Programme 4: Financial Governance
Actual performance against target Output
Output performance measures/service delivery
indicators Target Actual
Sub‐programme 4.1: Programme Support
Percentage compliance with rules and regulations.
100% compliance. 100% compliance.
Percentage compliance to acceptable norms/standards of service delivery.
70% achieved 70% achieved
Smooth and effective functioning of the component.
Hours’ turnaround time for management of operational finances, human resources and logistical issues.
48 hours. 48 hours.
Trained and capacitated administrative support and line function staff.
Percentage of vacant posts filled.
50% achieved. 50% achieved.
Percentage of staff complement trained according to IDPs.
50% achieved. 50% achieved.
Percentage support and promotion of goals in work environment.
100% support achieved.
100% support achieved.
Achievement of iKapa Elihlumayo goals.
Percentage procurement in terms of BBBEE.
40% 40%
Sub‐programme 2.2 : Accounting Services
Purpose : To ensure that financial reporting is a full and true reflection of the financial position of the Province.
Measurable Objectives : To record all transactions and financial statements in line with formats and guidelines. To analyse and interpret financial data.
Service delivery achievements
: Audit Reports analysed and corrective steps taken . Accounting procedures established and included in the Western Cape Housing Development Amendment Act 2 of 2005. 30% of debts cleared.

Part 2: Programme Performance
57
Sub‐programme 2.2 : Accounting Services
Reasons for achieving targets
: A successful drive to build full capacity in the sub‐programme. Efforts were concentrated on successfully dealing with high‐priority tasks.
Reasons for not achieving targets
: Under‐estimation of the scope of implementing Standard Chart of Accounts (SCOA) in public entities. Training of CFOs on the interpretation of annual financial statements was delayed; will be based on the extended scope of the Financial Governance Review and Outlook 2005.
The attainment of targets contributed towards achieving the Provincial Treasury’s outcomes in the following manner
: Analysis and interpretation of annual financial statements were enhanced. Improved compliance with Generally Recognised Accounting Practice (GRAP) (100%).
Programme 4: Financial Governance
Actual performance against target Output
Output performance measures/service delivery indicators Target Actual
Sub‐programme 4.2: Accounting Services
Compliance with statutory due dates and timely corrective measures.
100% compliance. 100% compliance.
Percentage qualified Auditor‐General reports.
Analyse reports of Auditor‐General and take corrective steps.
Audit Reports analysed and corrective steps taken
Percentage compliance with Generally Recognised Accounting Practice requirements.
100% compliance. 100% compliance.
Accounting procedures to be established to close down the Western Cape Housing Development Fund and Provincial Capital Fund Ordinance, 1962 (Ordinance 3 of 1962).
Accounting procedures to be established.
Accounting procedures established and included in the Western Cape Housing Development Amendment Act 2 of 2005.
All transactions recorded and Financial Statements in line with formats and guidelines.
Rollout Standard Chart of Accounts to public entities.
Monitor. Plan developed and being implemented.

58
Annual Report 2005/06
Programme 4: Financial Governance
Actual performance against target Output
Output performance measures/service delivery indicators Target Actual
Sub‐programme 4.2: Accounting Services
Clear old balances inherited from previous government dispensations.
Accounts on Provincial Treasury (Department U7) followed up.
30% of debts cleared
Percentage compliance with and an 18‐day turn around time for Provincial Treasury’s interpretive narrative responses on departmental IYM reports.
Target achieved. Target achieved.
Produce an Accounting Review within deadline.
Publish November. Not applicable
Provide training on the interpretation of annual financial statements to CFOs.
Target achieved. Delayed
Improve the disclosure of the values of PPP BEE and infrastructure transactions in terms of REAL.
Disclosure notes developed.
Delayed until IFMS is in place
Financial data analysed and interpreted.
Percentage compliance with statutory due dates and timely corrective measures.
100% 100%
Sub‐programme 4.3 : Norms and Standards
Purpose : To develop and implement financial norms and standards and to ensure effective communication and information management.
Measurable Objective : To determine and implement financial management norms and standards to facilitate excellence in service delivery. To ensure the existence of an appropriate and dynamic financial legislative framework. To phase in the Provincial Treasury’s normative responsibilities of the MFMA. To manage effective internal and external communication systems and strategies. To ensure effective information management.

Part 2: Programme Performance
59
Sub‐programme 4.3 : Norms and Standards
Service delivery achievements
: Analysed Departments’ questionnaires and sent letters to departments informing them of corrective measures to be taken. An analysis of feedback received from all departments for the year indicated a 96% nominal compliance success rate. 50% substantive compliance achieved. MEC delegations in terms of the PFMA, Treasury Regulations and the MFMA were updated and issued. Issued Provincial Treasury instructions regarding SCM in line with the latest Treasury Regulations.
Reasons for achieving targets
: Posts were filled during the last quarter of the financial year.
Reasons for not achieving targets
: Late filling of MFMA posts.
The attainment of targets contributed towards achieving the Provincial Treasury’s outcomes in the following manner
: Ensured that norms and standards within the legislative framework were developed and maintained.

60
Annual Report 2005/06
Programme 4: Financial Government
Actual performance against target Output
Output performance measures/service delivery
indicators Target Actual
Sub‐programme 4.3: Norms and Standards
The assessment of both nominal and substantive compliance in departments, public entities and municipalities.
100% nominal compliance and 45% substantive compliance with set benchmarks.
12 Questionnaires received from Departments. Analysed all 12 Departments’ questionnaires and sent letters to departments informing them of corrective measures to be taken. An analysis of feedback received from all departments for the year indicated a 96% nominal compliance success rate 50% substantive compliance achieved.
Percentage compliance with National Treasury guidelines on annual reports.
100% compliance. 100% compliance.
Determination and implementation of financial management norms and standards to facilitate excellence in service delivery.
Compilation and issuing of generic norms and standards to address deficiencies identified in internal audit reports.
25% Audit reports in respect of the 05/06 financial years will only be available for analysis in the first quarter of the year 2006/07 financial year.
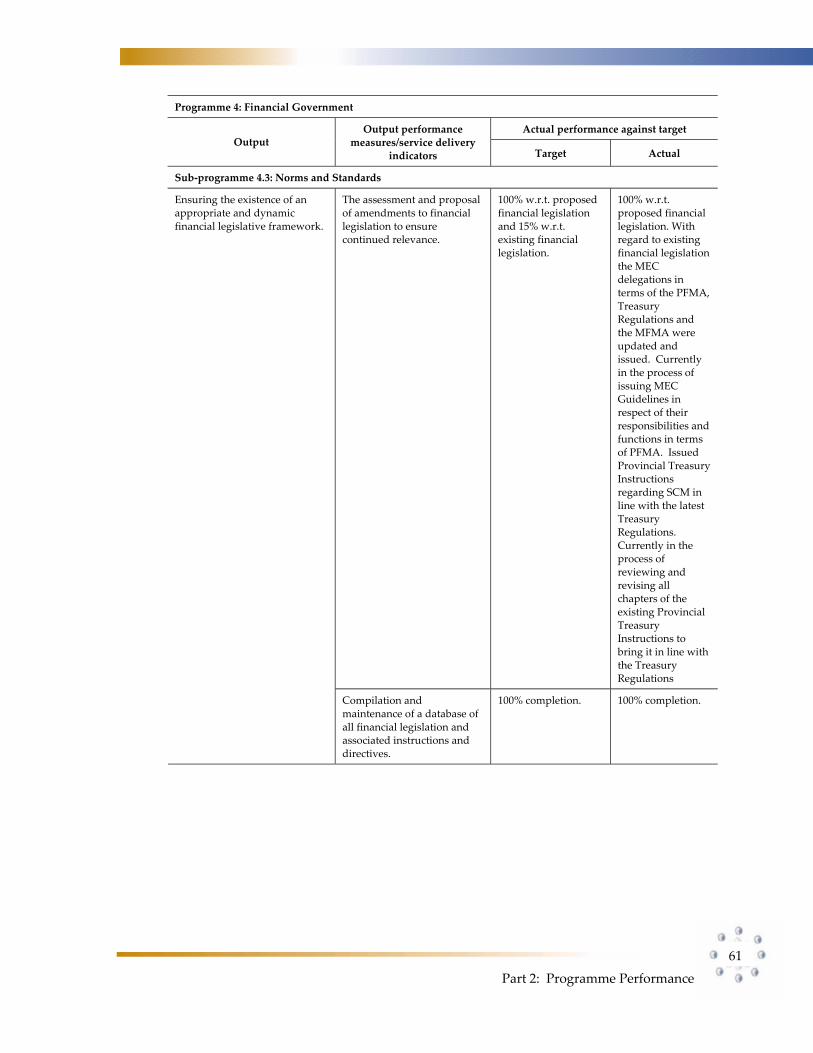
Part 2: Programme Performance
61
Programme 4: Financial Government
Actual performance against target Output
Output performance measures/service delivery
indicators Target Actual
Sub‐programme 4.3: Norms and Standards
The assessment and proposal of amendments to financial legislation to ensure continued relevance.
100% w.r.t. proposed financial legislation and 15% w.r.t. existing financial legislation.
100% w.r.t. proposed financial legislation. With regard to existing financial legislation the MEC delegations in terms of the PFMA, Treasury Regulations and the MFMA were updated and issued. Currently in the process of issuing MEC Guidelines in respect of their responsibilities and functions in terms of PFMA. Issued Provincial Treasury Instructions regarding SCM in line with the latest Treasury Regulations. Currently in the process of reviewing and revising all chapters of the existing Provincial Treasury Instructions to bring it in line with the Treasury Regulations
Ensuring the existence of an appropriate and dynamic financial legislative framework.
Compilation and maintenance of a database of all financial legislation and associated instructions and directives.
100% completion. 100% completion.

62
Annual Report 2005/06
Programme 4: Financial Government
Actual performance against target Output
Output performance measures/service delivery
indicators Target Actual
Sub‐programme 4.3: Norms and Standards
Percentage nominal and substantive compliance by municipalities.
40% nominal compliance.
A draft monitoring tools was developed and inputs were requested from the SMS of the various components in Provincial Treasury regarding their area of MFMA responsibility. Inputs received were considered and taken into account where relevant. The document will also be circulated to other roleplayer in municipalities for comment, where after the document will be finalised and implemented. A survey was conducted to determine whether the municipality’s delegations in terms of the MFMA were in place. Municipalities were requested to submit copies thereof to Provincial Treasury
Phasing in the Provincial Treasury’s normative responsibilities of the MFMA.
Percentage nominal and substantive compliance by provincial departments.
Not applicable Not applicable
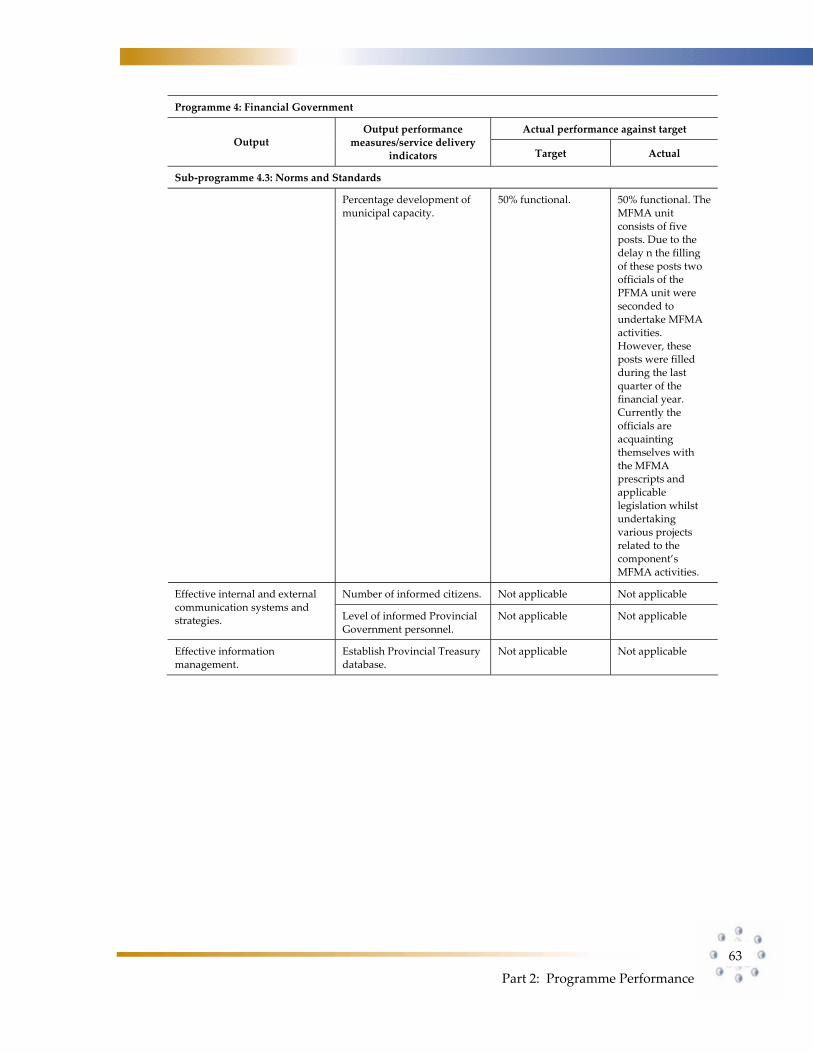
Part 2: Programme Performance
63
Programme 4: Financial Government
Actual performance against target Output
Output performance measures/service delivery
indicators Target Actual
Sub‐programme 4.3: Norms and Standards
Percentage development of municipal capacity.
50% functional. 50% functional. The MFMA unit consists of five posts. Due to the delay n the filling of these posts two officials of the PFMA unit were seconded to undertake MFMA activities. However, these posts were filled during the last quarter of the financial year. Currently the officials are acquainting themselves with the MFMA prescripts and applicable legislation whilst undertaking various projects related to the component’s MFMA activities.
Number of informed citizens. Not applicable Not applicable Effective internal and external communication systems and strategies. Level of informed Provincial
Government personnel. Not applicable Not applicable
Effective information management.
Establish Provincial Treasury database.
Not applicable Not applicable

64
Annual Report 2005/06
Sub‐programme 4.4 : Risk Management
Purpose : To facilitate the establishment of risk management capacity and financial governance systems in the Provincial Government.
Measurable Objectives : To develop and implement risk management and government governance capacity within the provincial government. To facilitate residual risk assessments and the availability of a risk profile per department. To provide of a consolidated risk profile for the provincial government as a whole as well as ensuring risk response strategies to mitigate transversal risks.
Service delivery achievements
: All departments have approved structures. Process and control maps completed at 80% of departments. 70% internal control staff trained in all aspects
Reasons for achieving targets
: Targets were achieved through prioritisation of work and committed staff.
Reasons for not achieving targets
: Non‐filling of vacant posts.
The attainment of targets contributed towards achieving the Provincial Treasury’s outcomes in the following manner
: Departments have approved risk management structures to help minimise risks in the Province. Process and control maps completed per department to focus management on risk areas and help with audits. Existence of a consolidated risk profile for PGWC.
Programme 4: Financial Governance
Actual performance against target Output
Output performance measures/service delivery indicators Target Actual
Sub‐programme 4.4: Risk Management
Departments have approved risk management structures.
All departments with approved structures.
All departments with approved structures.
Percentage departmental risk management staff trained in risk management framework and all existing tools.
70% trained in all aspects.
70% internal control staff trained in all aspects
Percentage nominal compliance by all departments with the risk management framework.
50% nominal compliance.
No staff to comply, recruitment process underway.
Developed and implemented risk management and government governance capacity within the provincial government.
Percentage nominal compliance by all departments with the government governance framework.
70% nominal compliance.
Workshops held with 90% of target audience

Part 2: Programme Performance
65
Programme 4: Financial Governance
Actual performance against target Output
Output performance measures/service delivery indicators Target Actual
Sub‐programme 4.4: Risk Management
Percentage risk assessments reviewed within departments.
100% 75%
Percentage process and control maps completed per department.
80% of processes mapped.
80% of departments
Facilitation of residual risk assessments and the availability of a risk profile per department.
Percentage Accounting Officers supplied with updated risk profiles.
100% of departments. 75% of departments
Existence of a consolidated risk profile for PGWC.
100% of departments included in consolidation.
100% of departments included in consolidation.
The provision of a consolidated risk profile for the provincial government as a whole and the ensuring of risk response strategies to mitigate transversal risks.
Transversal risks identified and allocated to transversal risk owners.
50% transversal risks allocated.
Nil risks identified
Sub‐programme 4.5 : Provincial Internal Audit
Purpose : To perform internal audit services on a risk‐analysis basis.
Measurable Objectives : To perform risk‐based internal audit services. To build internal capacity to take over Internal Audit activities from the current service provider and re‐engineer the internal audit organisational fit. To ensure fully functional, competent and independent Audit Committees under whose guidance and control Internal Audit resorts. To facilitate close co operation and co‐ordination between all assurance providers to prevent duplication of effort.
Service delivery achievements
: Audit Committee approved 100% of audit work performed. Number of audit plans approved and audit committee reports issued. The development the new organisational structure was finalized during the last quarter. In instances where final reports were issued, management has accepted Internal Audit’s finding and have agreed to specific action to be taken within the agreed time frames.
Reasons for achieving targets
: The appointment of skilled staff helped the unit to achieve its targets. Co‐sourcing with the Sihluma Sonke Consortium has provided additional human resource capacity and skills required to implement the internal audit service in the Province.
Reasons for not : The new organisational fit has not yet been approved.

66
Annual Report 2005/06
Sub‐programme 4.5 : Provincial Internal Audit achieving targets The Internal Audit budget of R15 million is inadequate to
ensure audit coverage for all the top risk areas. The attainment of targets contributed towards achieving the Provincial Treasury’s outcomes in the following manner
: The sub‐programme contributed by facilitating improvements and change within provincial departments.

Part 2: Programme Performance
67
Programme 4: Financial Governance
Actual performance against target Output
Output performance measures/service delivery indicators Target Actual
Sub‐programme 4.5: Provincial Internal Audit
Performance of internal audit work as approved by the relevant Audit Committee.
100% of audit work performed as approved by Audit Committee.
100% of audit work performed as approved by Audit Committee. Audit fieldwork has been completed. Draft reports have been issued and in some departments are now awaiting management comments. Final audit report have been issued to departments where management comments have been received. In instances where final reports were issued, management has accepted Internal Audit’s Finding and have agreed to specific action to be taken within the agreed time frames.
Percentage of audit findings accepted by management.
90% of audit findings accepted by management.
Audit fieldwork has been completed. Draft reports have been issued and in some departments are now awaiting management comments. Final audit reports have been issued to departments where final reports were issued, management has accepted Internal Audit’s findings and have agreed to be taken within the agreed time frames.
Risk‐based internal audit services.
Fully compliant external Quality Assurance Review report of the Provincial Internal Audit Function by the IIA (SA).
Nil Nil

68
Annual Report 2005/06
Programme 4: Financial Governance
Actual performance against target Output
Output performance measures/service delivery indicators Target Actual
Sub‐programme 4.5: Provincial Internal Audit
Building internal capacity to take over activities of the Internal Audit work from the current service provider and re‐engineering the internal audit organisational fit.
Percentage of posts filled.
50% of posts filled (Based on new organisational fit).
The development of the new organisational structure was finalized during the year. Approval of the structure will be sought in the new financial year.
Fully functional, competent and independent Audit Committees under whose guidance and control Internal Audit resorts.
Number of audit plans approved and audit committee reports issued.
All departments. All departments.
Close cooperation and co‐ordination between all assurance providers to prevent duplication of effort.
Number of meetings and quarterly progress reports to audit committees.
10 liaison and co‐ordination meetings per year.
10 liaison and co‐ordination meetings.

Part 3: Report of the Audit Committee
69
Part 3
Report of the Provincial Government Western Cape Shared Audit Committee on the Provincial Treasury (Vote 3) for the financial year ending 31 March 2006 We are pleased to present our report for the above‐mentioned financial year.
Appointment of the Shared Audit Committee Provincial Treasury (Vote 3) is served by a Shared Audit Committee appointed under Cabinet Resolution 75/2003 of 23 June 2003 for the 2 year period to 31 March 2005, which was extended by Resolution 95/2005 for 2 more years to 31 March 2007. Audit Committee Members and Attendance:
The Committee consists of the independent members listed hereunder, is required to meet at least 4 times per annum as per its approved Terms of Reference. During the current year 11 meetings were held: Member Number of Meetings Attended Mr J.A. Jarvis (Chairperson) 11 Mr J. January 9 Mr P. Jones 11 Mr R. Warley 7 Mr V.W. Sikobi (resigned May 2005) Audit Committee Responsibility The Committee has complied with its responsibilities arising from section 38(1) (a) of the PFMA and Treasury Regulation 3.1.13 and 27(1) (10). The Committee has also regulated its affairs and discharged it’s responsibilities in terms of the Audit Committee Charter. Effectiveness of Internal Control During the year under review the Risk Assessment and Control Mapping exercises and the 1‐year Operational Internal Audit Plan, were completed. The 1‐year Operational Internal Audit Plan which was approved by the Committee in April 2005 identified 7 high risk areas. However, due to budgetary constraints, the Plan was amended in September 2005, to cover only 4 audit areas.

70
Annual Report 2005/06
The Committee reviewed Internal Audit Reports which highlighted a few critical and significant control weaknesses in respect of: Asset Management, Financial Management, and Public Finance and Accounting. The Committee noted that management undertook to implement the recommended corrective actions. Internal audits were conducted on the transversal IT systems of the Province. The Committee acknowledges that e‐Innovation provides the IT service to this department. The Committee wishes to emphasize the importance of the Department ensuring that a service level agreement is concluded with e‐Innovation to address future technology and training requirements. The Committee further acknowledges that the responsibility for addressing control weaknesses identified by the Internal audit vests with e‐Innovation. The Committee will follow‐up on the implementation of corrective action in the 2006/07 financial year. The quality of in-year management and monthly / quarterly reports submitted in terms of the PFMA and the Division of Revenue Act. The Committee has not reviewed the quality of in‐year management and monthly/ quarterly reports submitted in terms of the PFMA and the Division of Revenue Act, but has relied on the feedback of the Auditor General who has not reported adversely in this regard. Evaluation of Financial Statements The Committee has,
• Reviewed and discussed the audited annual financial statements included in the annual report with the Auditor General and the Accounting Officer
• Reviewed the Auditor General’s management letter and management’s response thereto;
• Reviewed the Auditor General’s report. The Committee concurs and accepts the Auditor General’s conclusions on the annual financial statements and is of the opinion that the audited annual financial statements be accepted and read together with the report of the Auditor General. Appreciation The Committee wishes to express its appreciation to the Officials of the Department, the Auditor General and the Sihluma Sonke Consortium for their assistance and co‐operation in compiling this report. J.A. JARVIS Chairperson of the Shared Audit Committee Date: 10 August 2006


72
Annual Report 2005/06

Part 4: Annual Financial Statements
71
Part 4
Annual Financial Statements for the year ended 31 March 2006


Part 4: Annual Financial Statements
73
Contents Report of the Accounting Officer 75 Report of the Auditor‐General 81 Accounting Policies 83 Appropriation Statement 88 Notes to the Appropriation Statement 96 Statement of Financial Performance 98 Statement of Financial Position 99 Cash Flow Statement 100 Notes to the Annual Financial Statements 101 Disclosures Notes to the Annual Financial Statements 108 Annexures to the Annual Financial Statements 110


WESTERN CAPE PROVINCE PROVINCIAL TREASURY
VOTE 3
REPORT OF THE ACCOUNTING OFFICER for the year ended 31 MARCH 2006
Part 4: Annual Financial Statements
75
Report by the Accounting Officer to the Executive Authority and the Provincial Parliament of the Western Cape Province.
1. General review of the state of financial affairs
• The Western Cape Provincial Treasury is committed to make its contributions to the Accelerated and Shared Growth Initiative of South Africa, to enhance the competitive edge of the Province to enable it to capitalise on the opportunities that globalisation presents, to assist the emerging Provincial Growth and Development Strategy (iKapa Elihlumayo), to reduce income disparities and to increase access to the means of production and development opportunities. With appropriate resource allocations and efficacy in its application, this combination of initiatives should systematically over time improve living standards and access to quality services by all the people in the Western Cape.
• The following external and internal challenges remain:
− Increasing the accumulation of knowledge as identified in the PER&O1 in order to close the remaining gap between skill requirements and current competency levels.
− Reducing high levels of unemployment and poverty.
− Recruitment and retention of appropriately skilled personnel with an eye on MFMA2 implementation.
− Empower the poor to participate in economic activity as agents of growth through their own production.
− Improving cohesion and synergy between provincial departments and all spheres of government.
• In response to the above challenges, Treasury achieved the following:
− Succeeded in a drive to recruit appropriately qualified individuals and to provide financial support for further education and training.
− Engagements with all municipalities to practically foster the rollout of the requirements of the MFMA legislation and to bridge gaps between local and provincial government spheres.
− Assisted in the promotion of Public Private Partnerships (PPP’s).
1 Provincial Economic Review and Outlook, 2006 2 Municipal Finance Management Act, 2003 (Act 56 of 2003)
WESTERN CAPE PROVINCE PROVINCIAL TREASURY
VOTE 3
REPORT OF THE ACCOUNTING OFFICER for the year ended 31 MARCH 2006
76
Annual Report 2005/06
− Intensive interaction with departments to improve targeting of resource allocations in response to socio‐economic analyses and national priorities.
− Contributed to the further development of the iKapa Elihlumayo strategic objectives and associated priorities as reflected in the MTBPS3 and in an early version of the emerging Provincial Growth and Development strategy.
− Establishment of a broad framework for an external internship programme for the Provincial Treasury.
• The following projects were undertaken during the year:
− Consolidating the eight iKapa Elihlumayo strategies into four priority delivery areas to better address the socio‐economic challenges of the Western Cape Province.
− Setting up and testing formalised structures, methodologies and framework to guide the interaction between the Provincial Treasury, other provincial departments and the municipalities in the Western Cape.
− A revised MTBPS and associated PER&O were compiled to give direction to the 2006 Budget, building on gains made in the previous financial year.
− General ratcheting up of the Provincial Treasury’s ability to fulfil on all its responsibilities post its earlier restructuring process.
− Organisational structures for the establishment of Risk Management units within all provincial departments were developed to promote the management of risk assessment and reduction in the province.
− The Internal Audit and Risk Management organisational structures within the Provincial Treasury were redesigned to create the capacity to begin to take over responsibilities from the external service provider.
• Spending trends.
− The department’s actual expenditure for the 2005/06 financial year was R114,275 million compared to the total adjusted budget of R115,409 million. This resulted in an underspending of R1,134 million or one per cent of the adjusted budget of which the balance will be surrendered to the Provincial Revenue Fund.
− Underspending of R651 000 arose as a result of the lower than calculated spending on machinery and equipment (capital assets). R103 000 was realised on software and other intangible (capital) assets mainly due to an overestimation of software licensing costs. R118 000 can be attributed to non‐ filling of vacant posts and the balance of R262 000 pertains to lesser spending on goods and services than originally expected.
3 Western Cape Medium Term Budget Policy Statement, 2006 - 2009

WESTERN CAPE PROVINCE PROVINCIAL TREASURY
VOTE 3
REPORT OF THE ACCOUNTING OFFICER for the year ended 31 MARCH 2006
Part 4: Annual Financial Statements
77
2. Services rendered by Provincial Treasury 2.1 Under the powers vested in the Minister of Finance and Tourism as Head of the Provincial
Treasury, she is mainly responsible for the execution of the functions and powers as prescribed in Chapter 3 of the PFMA4. However, a range of other legislative provisions in different national and provincial acts and laws, including the MFMA, add further responsibilities.
2.2 Tariff policy
• Betting and Gambling
Betting and gambling revenue consists mainly of taxes, limited gambling machine taxes, bookmakers’ taxes, totalisator taxes, annual licence fees from casinos, limited gambling machines, bookmakers and the totalisator. These fees and taxes are all raised and adjusted periodically as determined by the Western Cape Gambling and Racing Law, 1994 (Law 4 of 1996).
• Functional Financial Training
The Provincial Treasury annually approves tariffs payable for functional financial training rendered to officials from national government departments. These tariffs are calculated as direct expenditure plus 40% to cater for overhead costs.
2.3 Free services
All services rendered by the Provincial Treasury, except those in paragraph 2.2, are rendered to other departments mainly in terms of the PFMA, or to municipalities as per the MFMA, as alluded to in paragraph 2.1 above. Per definition no free services were rendered by the Provincial Treasury.
2.4 Inventories
Two types of inventory are generated by LOGIS. The one consists of an inventory of store items (RR26 LOGIS report), the other inventory of furniture and equipment (RR025 LOGIS report). Stationery to the value of ±R122 000 (as at 31 March 2006) was issued on a first in first out (FIFO) basis.
3. Capacity constraints A key priority is a concerted effort to build capacity and align functions within Corporate Services with the rest of the Provincial Treasury for integrated and enhanced service delivery. Transformation processes within the Provincial Treasury to improve efficiency and to provide for the additional MFMA and other responsibilities have resulted in a large number of vacancies, increasing the vacancy rate from 29 % on a year‐on‐year basis to 32 %. Dealing with this has been made more difficult by high staff turnover rates as a result of a highly competitive labour market. For the financial year ending 2005/06, fifty appointments and
4 Public Finance Management Act, 1999 (Act 1 of 1999) as amended

WESTERN CAPE PROVINCE PROVINCIAL TREASURY
VOTE 3
REPORT OF THE ACCOUNTING OFFICER for the year ended 31 MARCH 2006
78
Annual Report 2005/06
seventeen resignations were recorded. This emerging trend will require close attention in order to retain and enhance skills within the Treasury environment.
The Moveable Asset Management Directorate within the Provincial Treasury, due to a high vacancy rate and loss of skills during 2005/06, will have to undergo capacity strengthening to ensure proper guidance to and oversight over SCM5 units within departments and municipalities. Furthermore, it must ensure that transversal acquisition requirements are dealt with much more efficiently.
With so many new recruits into Treasury, synergy and co‐ordination within and between all components require attention so as to build an effective so called “spider web” management and liaison system to strengthen Treasury’s service delivery.
4. Utilisation of donor funds The Provincial Treasury did not receive any donor funding.
5. Trading entities and public entities The single public entity operating under the auspices of the Provincial Treasury is the Western Cape Gambling and Racing Board. Its function is to regulate all gambling, racing and other related activities.
The fiduciary responsibilities of the Board are dealt with by the PFMA and the Western Cape Gambling and Racing Law, 1996 (Law 4 of 1996) as amended. For the second successive financial year no transfer payments were made to the Board as they have built up sufficient financing resources.
6. Organisations to whom transfer payments have been made
Transfers were only made to the City of Cape Town in respect of Regional Service Council levies.
7. Public private partnership (PPPs)
The Provincial Government is currently engaged in a number of partnerships, which vary in scope, nature and level of private sector participation. These projects are primarily eco‐tourism and health sector initiatives. The Provincial Treasury’s role is to facilitate the projects in terms of the National Treasury regulations.
8. Corporate governance arrangements
The consolidated risk profile that was completed in November 2004 is currently being used as a departure point to manage and control risks facing the Provincial Treasury.
5 Supply Chain Management

WESTERN CAPE PROVINCE PROVINCIAL TREASURY
VOTE 3
REPORT OF THE ACCOUNTING OFFICER for the year ended 31 MARCH 2006
Part 4: Annual Financial Statements
79
A Fraud Prevention Plan compiled for the Provincial Treasury during March 2001 is to be revised early in 2006/07. The Human Resource Management component continued to do verification audits of educational qualifications submitted by new recruits.
Internal Audit continues to function as a shared unit for all twelve departments as well as for the Provincial Parliament. Much development work has gone into its further evolvement over the next three years. If all goes according to plan, this should allow for detached services to the three/four larger departments and for purposes of efficiency, a shared service to all the other accounting officers and executive authorities. Cabinet recently also approved an organisational structure for the establishment of risk management units at all departments, without which Internal Audit will not attain the desired levels of effectiveness.
During 2005 the Health and Safety Committee of the Provincial Treasury performed a safety audit to identify certain health and environmental issues that will have to be addressed in the new year.
9. Discontinued activities
No specific activities were discontinued during the 2005/06 financial year. 10. Progress with financial management improvement
Specific key responsibilities that were improved during 2005/06 were better budget, revenue and infrastructure management, progressively strengthened monthly and quarterly non‐financial reporting, financial accounting and supply chain management.
Challenges for 2006/07 will be the provision of adequate office accommodation conducive to a productive and safe working environment, the further evolvement of library services, improvement in document control services and the efficiency and standard of risk assessment by the Internal Control Section.
11. New activities
Due to the closure of FMS6 Department 70 by the National Treasury, the balances of the latter had to be transferred into the books of the Provincial Treasury during the 2004/05 financial year. This was to allow for proper accounting of the remaining balances until such time as these can be satisfactorily resolved. This clearing account contains unauthorised expenditure from the previous Cape Provincial Administration, Eastern and Western Cape Provinces, debts from the Eastern Cape and thefts and losses that have not been resolved over the last ten to twelve years. The Chief Financial Officer (CFO) with the assistance of the Provincial Accountant General is currently busy with clearing a number of the balances. However, the lion’s share of the latter can only be cleared by passing legislation within the National and the respective Provincial Parliaments. The two Provincial and National Treasuries are busy with this protracted process. The Provincial Treasury has already written off several small amounts relating to thefts and losses under the delegated powers vested within the post of the CFO.
6 Financial Management System

WESTERN CAPE PROVINCE PROVINCIAL TREASURY
VOTE 3
REPORT OF THE ACCOUNTING OFFICER for the year ended 31 MARCH 2006
80
Annual Report 2005/06
12. Asset management The Supply Chain Management unit within the office of the CFO is currently in the process of reconciling the Provincial Treasury’s assets with unique asset numbers for verification and location purposes. Stores have been reorganised in such a manner and recorded on the LOGIS system to facilitate speedy disposal of redundant and obsolete items.
13. Standing Committee on Public Accounts (SCOPA) resolutions Although there were no specific resolutions in respect of the Provincial Treasury the following transversal resolution was taken by SCOPA:
TRANSVERSAL RESOLUTION RECOMMENDATION FINDINGS
Asset registers were not always finalised or available or did not contain all the required information.
All asset registers are updated with all relevant and required information.
The Provincial Treasury is in a final stage of reconciliation.
Approval The annual financial statements set out on pages 75 ‐ 118 have been approved by myself as Accounting Officer.
(DR) JC STEGMANN ACCOUNTING OFFICER
DATE: 31 MAY 2006

Part 4: Annual Financial Statements
81
Report of the Auditor-General to the Provincial Parliament of the Western Cape on the Financial Statements of the Provincial Treasury (Vote 3) for the year ended 31 March 2006 1. AUDIT ASSIGNMENT
The financial statements as set out on pages 7 to 42 for the year ended 31 March 2006, have been audited in terms of section 188 of the Constitution of the Republic of South Africa, 1996 (Act No. 108 of 1996), read with sections 4 and 20 of the Public Audit Act, 2004 (Act No. 25 of 2004). The fixed asset opening balances have not been audited because of the timing of guidance from National Treasury to the departments relating to the treatment, valuation and disclosure of fixed assets. These financial statements are the responsibility of the accounting officer. My responsibility is to express an opinion on these financial statements, based on the audit.
2. SCOPE
The audit was conducted in accordance with the International Standards on Auditing read with General Notice 544 of 2006, issued in Government Gazette no. 28723 of 10 April 2006 and General Notice 808 of 2006, issued in Government Gazette no. 28954 of 23 June 2006. Those standards require that I plan and perform the audit to obtain reasonable assurance that the financial statements are free of material misstatement.
An audit includes:
examining, on a test basis, evidence supporting the amounts and disclosures in the
financial statements, assessing the accounting principles used and significant estimates made by
management, and evaluating the overall financial statement presentation.
I believe that the audit provides a reasonable basis for my opinion.
3. BASIS OF ACCOUNTING
The department’s policy is to prepare financial statements on the modified cash basis of accounting determined by the National Treasury, as described in note 1.1 to the financial statements.

82
Annual Report 2005/06
4. AUDIT OPINION In my opinion, the financial statements present fairly, in all material respects, the financial position of the Provincial Treasury at 31 March 2006 and the results of its operations and its cash flows for the year then ended, in accordance with the modified cash basis of accounting determined by the National Treasury of South Africa, as described in note 1.1 to the financial statements, and in the manner required by the Public Finance Management Act, 1999 (Act No. 1 of 1999).
5. APPRECIATION
The assistance rendered by the staff of the Provincial Treasury during the audit is sincerely appreciated.
I JEEWA for Auditor-General Cape Town 31 July 2006
WESTERN CAPE PROVINCE PROVINCIAL TREASURY
VOTE 3
ACCOUNTING POLICIES for the year ended 31 March 2006
Part 4: Annual Financial Statements
83
The Financial Statements have been prepared in accordance with the following policies, which have been applied consistently in all material aspects, unless otherwise indicated. However, where appropriate and meaningful, additional information has been disclosed to enhance the usefulness of the Financial Statements and to comply with the statutory requirements of the Public Finance Management Act, Act 1 of 1999 (as amended by Act 29 of 1999), and the Treasury Regulations issued in terms of the Act and the Division of Revenue Act, Act 1 of 2005.
1. Presentation of the Annual Financial Statements 1.1 Basis of preparation
The Financial Statements have been prepared on a modified cash basis of accounting, except where stated otherwise. The modified cash basis constitutes the cash basis of accounting supplemented with additional disclosure items. Under the cash basis of accounting transactions and other events are recognised when cash is received or paid or when the final authorisation for payment is effected on the system (by no later than 31 March of each year).
1.2 Presentation currency
All amounts have been presented in the currency of the South African Rand (R) which is also the functional currency of the department.
1.3 Rounding
Unless otherwise stated all financial figures have been rounded to the nearest one thousand Rand (R’000).
1.4 Comparative figures
Prior period comparative information has been presented in the current year’s financial statements. Where necessary figures included in the prior period, financial statements have been reclassified to ensure that the format in which the information is presented is consistent with the format of the current year’s financial statements.
A comparison between actual and budgeted amounts per major classification of expenditure is included in the appropriation statement.
2. Revenue 2.1 Appropriated funds
Appropriated funds are recognised in the financial records on the date the appropriation becomes effective. Adjustments to the appropriated funds made in terms of the adjustments budget process are recognised in the financial records on the date the adjustments become effective.
Total appropriated funds are presented in the statement of financial performance.
Unexpended appropriated funds are surrendered to the Provincial Revenue Fund, unless approval has been given by the Provincial Treasury to rollover the funds to the subsequent financial year. These rollover funds form part of retained funds in the annual financial

WESTERN CAPE PROVINCE PROVINCIAL TREASURY
VOTE 3
ACCOUNTING POLICIES for the year ended 31 March 2006
84
Annual Report 2005/06
statements. Amounts owing to the Provincial Revenue Fund at the end of the financial year are recognised in the statement of financial position.
2.2 Departmental revenue
All departmental revenue is paid into the Provincial Revenue Fund when received, unless otherwise stated. Amounts owing to the Provincial Revenue Fund at the end of the financial year are recognised in the statement of financial position.
2.2.1 Tax revenue
Tax revenue consists of all compulsory unrequited amounts collected by the department in accordance with laws and or regulations (excluding fines, penalties & forfeits).
Tax receipts are recognised in the statement of financial performance when received.
2.2.2 Sales of goods and services other than capital assets
The proceeds received from the sale of goods and/or the provision of services are recognised in the statement of financial performance when the cash is received.
2.2.3 Fines, penalties and forfeits
Fines, penalties and forfeits are compulsory unrequited amounts, which were imposed by a court or quasi – judicial body and elected by the department. Revenue arising from fines, penalties and forfeits is recognized in the statement of financial performance when the cash is received.
2.2.4 Interest, dividends and rent on land
Interest, dividends and rent on land is recognised in the statement of financial performance when the cash is received.
2.2.5 Sale of capital assets
The proceeds received on sale of capital assets are recognised in the statement of financial performance when the cash is received.
2.2.6 Financial transactions in assets and liabilities
Repayments of loans and advances previously extended to employees and public corporations for policy purposes are recognised as revenue in the statement of financial performance on receipt of the funds. Amounts receivable at the reporting date are disclosed in the disclosure notes to the annual financial statements.
3. Expenditure 3.1 Compensation of employees
Salaries and wages comprise payments to employees. Salaries and wages are recognised as an expense in the statement of financial performance when the final authorisation for payment is effected on the system (by no later than 31 March of each year).
All other payments are classified as current expense.

WESTERN CAPE PROVINCE PROVINCIAL TREASURY
VOTE 3
ACCOUNTING POLICIES for the year ended 31 March 2006
Part 4: Annual Financial Statements
85
Social contributions include the entitiesʹ contribution to social insurance schemes paid on behalf of the employee. Social contributions are recognised as an expense in the statement of financial performance when the final authorisation for payment is effected on the system.
3.1.1 Short term employee benefits
Short term employee benefits comprise leave entitlements, thirteenth cheques, performance bonuses and capped leave. These benefits are disclosed in the disclosure notes to the financial statements.
Short‐term employee benefits that give rise to a present legal or constructive obligation are disclosed in the notes to the financial statements. These amounts are not recognised in the statement of financial performance.
3.2 Goods and services
Payments made for goods and/or services are recognised as an expense in the statement of financial performance when the final authorisation for payment is effected on the system (by no later than 31 March of each year). The expense is classified as capital if the goods and services were used on a capital project.
3.3 Financial transactions in assets and liabilities
Debts are written off when identified as irrecoverable. Debts written‐off are limited to the amount of savings and/or underspending of appropriated funds. The write off occurs at year‐end or when funds are available. No provision is made for irrecoverable amounts but amounts are disclosed as a note.
All other losses are recognised when authorisation has been granted for the recognition thereof.
3.4 Transfers and subsidies
Transfers and subsidies are recognised as an expense when the final authorisation for payment is effected on the system by no later than 31 March of each year.
3.5 Expenditure for capital assets
Payments made for capital assets are recognised as an expense in the statement of financial performance when the final authorisation for payment is effected on the system (by no later than 31 March of each year).
4. Assets 4.1 Cash and cash equivalents
Cash and cash equivalents are carried in the statement of financial position at cost. For the purposes of the cash flow statement, cash and cash equivalents comprise cash on hand, deposits held, other sort‐term highly liquid investments and bank overdrafts.
4.2 Prepayments and advances
Amounts prepaid or advanced are recognised in the statement of financial position when the payments are made.

WESTERN CAPE PROVINCE PROVINCIAL TREASURY
VOTE 3
ACCOUNTING POLICIES for the year ended 31 March 2006
86
Annual Report 2005/06
4.3 Receivables
Receivables included in the statement of financial position arise from cash payments made that are recoverable from another party.
Revenue receivable not yet collected is included in the notes.
5. Liabilities 5.1 Payables
Recognised payables mainly comprise of amounts owing to other governmental entities. These payables are recognised at historical cost in the statement of financial position.
5.2 Lease commitments
Lease commitments represent amounts owing from the reporting date to the end of the lease contract. These commitments are not recognised in the statement of financial position as a liability or as expenditure in the statement of financial performance but are included in the disclosure notes.
Operating lease commitments are expensed when the payments are made.
5.3 Accruals
Accruals represent goods/services and invoices that have been received at the reporting date, but final authorisation for payment has been affected on the system.
Accruals are not recognised in the statement of financial position as a liability or as expenditure in the statement of financial performance but are included in the disclosure notes.
5.4 Contingent liabilities
A contingent liability is a possible obligation that arises from past events and whose existence will be confirmed only by the occurrence or non‐occurrence of one or more uncertain future events not wholly within the control of the department; or
A contingent liability is a present obligation that arises from past events but is not recognised because:
• It is not probable that an outflow of resources embodying economic benefits or service potential will be required to settle the obligation; or
• The amount of the obligation cannot be measured with sufficient reliability.
Contingent liabilities are included in the disclosure notes.
5.5 Commitments
Commitments represent goods/services that have been approved and/or contracted, but where no delivery has taken place at the reporting date.
Commitments are not recognised in the statement of financial position as a liability or as expenditure in the statement of financial performance but are included in the disclosure notes.

WESTERN CAPE PROVINCE PROVINCIAL TREASURY
VOTE 3
ACCOUNTING POLICIES for the year ended 31 March 2006
Part 4: Annual Financial Statements
87
6. Net Assets 6.1 Recoverable revenue
Amounts are recognised as recoverable revenue when a payment made and recognised in a previous financial year becomes recoverable from a debtor.
7. Key management personnel Key management personnel are those persons having the authority and responsibility for planning, directing and controlling the activities of the department.
Compensation paid to key management personnel including their family members where relevant, is included in the disclosure notes.
8. Asset Registers Assets are recorded in an asset register, at cost, on receipt of the item. Cost of an asset is defined as the total cost of acquisition. Assets procured in previous financial periods, may be stated at fair value, where determinable, or R1, in instances where the original cost of acquisition or fair value cannot be established.
Annexure 3 and 4 of the disclosure notes, reflect the total movement in the asset register of assets with a cost equal to and exceeding R5000 (therefore capital assets only) for the current financial year. The movement is reflected at the cost as recorded in the asset register and not the carrying value, as depreciation is not recognised in the financial statements under the modified cash basis of accounting. The opening balance reflected on Annexure 3 and 4 will include items procured in prior accounting periods and the closing balance will represent the total cost of the register for capital assets on hand.

WESTERN CAPE PROVINCE PROVINCIAL TREASURY
VOTE 3
APPROPRIATION STATEMENT for the year ended 31 March 2006
Part 4: Annual Financial Statements
88
A d ju s te dA p p ro p r ia t io n
S h if t in g o f F u n d s
V ir em e n tF in a l
A p p ro p r ia t io nA c tu a l
E x p e n d i tu reV a r ia n c e
E x p e n d i tu re a s % o f f in a l a p p ro p r ia t io n
F in a lA p p ro p r ia t io n
A c tu a lE x p e n d i tu re
R ʹ0 0 0 R ʹ0 0 0 R ʹ0 0 0 R ʹ0 0 0 R ʹ0 0 0 R ʹ0 0 0 % R ʹ0 0 0 R ʹ0 0 0
1 . A d m in is t r a tio n
C u rre n t p a ym en t 2 3 ,4 0 1 ‐ (8 5 0 ) 2 2 ,5 5 1 2 2 ,5 4 1 1 0 1 0 0 .0 2 0 ,7 6 3 2 0 ,1 3 3 T ra n s fe r s a n d su b s id ie s 2 3 0 ‐ ‐ 2 3 0 1 9 1 3 9 8 3 .0 3 0 9 1 8 5 P a ym en t fo r c a p i ta l a s s e t s 1 ,1 1 2 ‐ ‐ 1 ,1 1 2 4 8 8 6 2 4 4 3 .9 1 ,0 2 1 1 ,0 0 0
2 . S u s ta in a b le R e s o u r c e M an a g em e n tC u rre n t p a ym en t 1 8 ,2 1 2 ‐ (1 ,7 9 0 ) 1 6 ,4 2 2 1 6 ,1 0 0 3 2 2 9 8 .0 1 1 ,5 0 2 1 0 ,5 6 5 T ra n s fe r s a n d su b s id ie s 3 1 ‐ ‐ 3 1 2 2 9 7 1 .0 5 0 7 5 0 2 P a ym en t fo r c a p i ta l a s s e t s 6 0 ‐ 3 3 1 3 9 1 3 9 1 ‐ 1 0 0 .0 ‐ ‐
3 . A s s e t a n d L ia b il i t ie s M an a g em e n tC u rre n t p a ym en t 4 5 ,8 3 9 ‐ 7 8 8 4 6 ,6 2 7 4 6 ,6 3 1 (4 ) 1 0 0 .0 4 2 ,6 9 1 4 2 ,6 9 1 T ra n s fe r s a n d su b s id ie s 3 3 ‐ ‐ 3 3 2 9 4 8 7 .9 2 2 2 1 P a ym en t fo r c a p i ta l a s s e t s 2 0 ‐ 1 9 3 9 3 9 ‐ 1 0 0 .0 4 ,6 8 9 3 9 6
4 . F in a n c ia l G o v e rn a n c eC u rre n t p a ym en t 2 5 ,8 0 2 ‐ 1 ,4 1 7 2 7 ,2 1 9 2 7 ,2 2 3 (4 ) 1 0 0 .0 2 6 ,7 4 9 2 6 ,2 2 5 T ra n s fe r s a n d su b s id ie s 2 5 ‐ 8 5 1 1 0 1 0 6 4 9 6 .4 1 7 1 5 P a ym en t fo r c a p i ta l a s s e t s 6 4 4 ‐ ‐ 6 4 4 5 1 4 1 3 0 7 9 .8 7 1 0 6 0 0
T o ta l 1 1 5 ,4 0 9 ‐ ‐ 1 1 5 ,4 0 9 1 1 4 ,2 7 5 1 ,1 3 4 9 9 .0 1 0 8 ,9 8 0 1 0 2 ,3 3 3
1 8 1 ,8 3 7 2 1 4 ,7 5 4
2 9 7 ,2 4 6 3 2 3 ,7 3 4
A c tu a l am o u n ts p e r S ta tem e n t o f F in a n c ia l P e r fo rm a n c e � E x p e n d i tu re 1 1 4 ,2 7 5 1 0 2 ,3 3 3
A p p ro p r ia t io n p e r P ro g r am m e2 0 0 5 /0 6 2 0 0 4 /0 5
R e c o n c i l ia t io n w ith S ta tem e n t o f F in a n c ia l P e r fo rm a n c eD ep a r tm e n ta l r e c e ip t s
A c tu a l am o u n ts p e r S ta tem e n t o f F in a n c ia l P e r fo rm a n c e (T o ta l R e v e n u e )
A d ju s te dA p p ro p r ia t io n
S h if t in g o f F u n d s
V irem e n tF in a l
A p p ro p r ia t io nA c tu a l
E x p e n d itu reV a r ia n c e
E x p e n d itu r e a s % o f f in a l a p p ro p r ia t io n
F in a lA p p ro p r ia t io n
A c tu a lE x p e n d itu r e
R ʹ0 0 0 R ʹ0 0 0 R ʹ0 0 0 R ʹ0 0 0 R ʹ0 0 0 R ʹ0 0 0 % R ʹ0 0 0 R ʹ0 0 0
C u rr e n t p a ym e n ts
C om p en sa t io n o f em p lo y e e s 4 5 ,6 4 4 ‐ (3 ,5 8 4 ) 4 2 ,0 6 0 4 1 ,9 4 1 1 1 9 9 9 .7 3 4 ,0 9 7 3 3 ,5 9 0
G ood s a n d s e rv ic e s 6 7 ,6 1 0 ‐ 2 ,9 7 6 7 0 ,5 8 6 7 0 ,3 8 1 2 0 5 9 9 .7 6 7 ,5 1 4 6 5 ,9 3 0
F in a n c ia l t ra n sa c t io n s in a s s e ts a n d l ia b i l i t ie s ‐ ‐ 1 7 3 1 7 3 1 7 3 ‐ 1 0 0 .0 9 4 9 4
T ra n s f e r s & s u b s id ie s
P ro v in c e s & m un ic ip a l i t ie s 1 7 3 ‐ ‐ 1 7 3 1 5 2 2 1 8 7 .9 1 4 1 1 3 1
D ep a r tm en ta l a g e n c ie s & a c c o u n ts 3 5 ‐ ‐ 3 5 ‐ 3 5 ‐ 1 5 0 2 7
H ou se h o ld s 1 1 1 ‐ 8 5 1 9 6 1 9 6 ‐ 1 0 0 .0 5 6 4 5 6 5
P a ym e n t f o r c a p ita l a s s e ts
M a ch in e ry & e q u ipm en t 1 ,3 2 8 ‐ 3 5 2 1 ,6 8 0 1 ,0 2 9 6 5 1 6 1 .3 5 ,7 0 5 1 ,3 9 1
S o ftw a re & o th e r in ta n g ib le a s s e ts 5 0 8 ‐ (2 ) 5 0 6 4 0 3 1 0 3 7 9 .6 7 1 5 6 0 5
T o ta l 1 1 5 ,4 0 9 ‐ ‐ 1 1 5 ,4 0 9 1 1 4 ,2 7 5 1 ,1 3 4 9 9 .0 1 0 8 ,9 8 0 1 0 2 ,3 3 3
2 0 0 5 /0 6 2 0 0 4 /0 5
A p p ro p r ia t io n p e r E c o n om ic c la s s i f i c a t io n

WESTERN CAPE PROVINCE PROVINCIAL TREASURY
VOTE 3
APPROPRIATION STATEMENT for the year ended 31 March 2006
Part 4: Annual Financial Statements
89
Detail per programme 1 ‐ Administration
for the year ended 31 March 2006
AdjustedAppropriation
Shifting of Funds
VirementFinal
AppropriationActual
ExpenditureVariance
Expenditure as % of final appropriation
FinalAppropriation
ActualExpenditure
Rʹ000 Rʹ000 Rʹ000 Rʹ000 Rʹ000 Rʹ000 % R ʹ000 R ʹ000
1.1 Office of the Minister
Current payment 3,243 ‐ 131 3,374 3,375 (1) 100.0 3,065 2,863
Transfers and subsidies 164 ‐ ‐ 164 163 1 99.4 56 56
Payment for capital assets 21 ‐ ‐ 21 21 ‐ 100.0 ‐ ‐
1.2 Management Services
Current payment 1,752 ‐ (2) 1,750 1,743 7 99.6 ‐ ‐
Transfers and subsidies 4 ‐ ‐ 4 4 ‐ 100.0 ‐ ‐
1.3 Corporate ServicesCurrent payment 7,462 ‐ (469) 6,993 6,990 3 100.0 5,731 5,439
Transfers and subsidies 46 ‐ ‐ 46 9 37 19.6 158 35
Payment for capital assets 18 ‐ ‐ 18 ‐ 18 ‐ ‐ ‐
1.4 Financial Management
Current payment 10,944 ‐ (510) 10,434 10,433 1 100.0 11,967 11,831
Transfers and subsidies 16 ‐ ‐ 16 15 1 93.8 95 94
Payment for capital assets 1,073 ‐ ‐ 1,073 467 606 43.5 1,021 1,000
Total 24,743 ‐ (850) 23,893 23,220 673 97.2 22,093 21,318
2005/06 2004/05
Programme per subprogramme
AdjustedAppropriation
Shifting of Funds
VirementFinal
AppropriationActual
ExpenditureVariance
Expenditure as % of final appropriation
FinalAppropriation
ActualExpenditure
Rʹ000 R ʹ000 R ʹ000 Rʹ000 Rʹ000 Rʹ000 % Rʹ000 Rʹ000
Current payments
Compensation of employees 12,625 ‐ (514) 12,111 12,111 ‐ 100.0 11,575 11,397
Goods and services 10,776 ‐ (509) 10,267 10,257 10 99.9 9,094 8,642
Financial transactions in assets and liabilities ‐ ‐ 173 173 173 ‐ 100.0 94 94
Transfers & subsidiesProvinces & municipalities 84 ‐ ‐ 84 80 4 95.2 79 78
Departmental agencies & accounts 35 ‐ ‐ 35 ‐ 35 ‐ 150 27
Households 111 ‐ ‐ 111 111 ‐ 100.0 80 80
Payment for capital assetsMachinery & equipment 1,112 ‐ (13) 1,099 475 624 43.2 1,016 995
Software & other intangible assets ‐ ‐ 13 13 13 ‐ 100.0 5 5
Total 24,743 ‐ (850) 23,893 23,220 673 97.2 22,093 21,318
2005/06 2004/05
Economic classification

WESTERN CAPE PROVINCE PROVINCIAL TREASURY
VOTE 3
APPROPRIATION STATEMENT for the year ended 31 March 2006
90
Annual Report 2005/06
Detail per programme 2 ‐ Sustainable Resource Management for the year ended 31 March 2006
AdjustedAppropriation
Shifting of Funds
VirementFinal
AppropriationActual
ExpenditureVariance
Expenditure as % of final
appropriation
FinalAppropriation
ActualExpenditure
Rʹ000 Rʹ000 Rʹ000 Rʹ000 Rʹ000 Rʹ000 % Rʹ000 Rʹ000 2.1 Programme Support
Current payment 1,261 ‐ (12) 1,249 1,140 109 91.2 ‐ ‐
Transfers and subsidies 3 ‐ ‐ 3 2 1 66.7 ‐ ‐
Payment for capital assets 6 ‐ (6) ‐ ‐ ‐ ‐ ‐ ‐
2.2 Economic AnalysisCurrent payment 2,685 ‐ (161) 2,524 2,419 105 95.8 1,531 1,126
Transfers and subsidies 4 ‐ ‐ 4 3 1 75.0 4 1
Payment for capital assets 15 ‐ ‐ 15 15 ‐ 100.0 ‐ ‐
2.3 Fiscal PolicyCurrent payment 3,213 ‐ (817) 2,396 2,291 105 95.6 2,703 2,698
Transfers and subsidies 6 ‐ ‐ 6 4 2 66.7 4 3
Payment for capital assets ‐ ‐ 235 235 235 ‐ 100.0 ‐ ‐
2.4 Budget ManagementCurrent payment 6,390 ‐ (242) 6,148 6,146 2 100.0 2,700 2,174
Transfers and subsidies 7 ‐ ‐ 7 5 2 71.4 4 3
2.5 Public FinanceCurrent payment 4,663 ‐ (558) 4,105 4,104 1 100.0 4,568 4,567
Transfers and subsidies 11 ‐ ‐ 11 8 3 80.0 495 495
Payment for capital assets 39 ‐ 102 141 141 ‐ 100.0 ‐ ‐
Total 18,303 ‐ (1,459) 16,844 16,513 331 98.0 12,009 11,067
2005/06 2004/05
Programme per subprogramme
AdjustedAppropriation
Shifting of Funds
VirementFinal
AppropriationActual
ExpenditureVariance
Expenditure as % of final appropriation
FinalAppropriation
ActualExpenditure
Rʹ000 Rʹ000 Rʹ000 Rʹ000 Rʹ000 Rʹ000 % Rʹ000 Rʹ000
Current paymentsCompensation of employees 11,240 ‐ (1,790) 9,450 9,332 118 98.8 7,678 7,352
Goods and services 6,972 ‐ ‐ 6,972 6,768 204 97.1 3,825 3,213
Transfers & subsidies
Provinces & municipalities 31 ‐ ‐ 31 22 9 73.3 22 17
Households ‐ ‐ ‐ ‐ ‐ ‐ ‐ 484 485
Payment for capital assetsMachinery & equipment 45 ‐ 346 391 391 ‐ 100.0 ‐ ‐
Software & other intangible assets 15 ‐ (15) ‐ ‐ ‐ ‐ ‐ ‐
Total 18,303 ‐ (1,459) 16,844 16,513 331 98.0 12,009 11,067
2005/06 2004/05
Economic classification

WESTERN CAPE PROVINCE PROVINCIAL TREASURY
VOTE 3
APPROPRIATION STATEMENT for the year ended 31 March 2006
Part 4: Annual Financial Statements
91
Detail per programme 3 ‐ Asset and Liabilities Managementfor the year ended 31 March 2006
AdjustedAppropriation
Shifting of Funds
VirementFinal
AppropriationActual
ExpenditureVariance
Expenditure as % of final
appropriation
FinalAppropriation
ActualExpenditure
Rʹ000 Rʹ000 Rʹ000 Rʹ000 Rʹ000 Rʹ000 % Rʹ000 Rʹ000 3.1 Programme Support
Current payment 811 ‐ (114) 697 697 ‐ 100.0 ‐ ‐
Transfers and subsidies 2 ‐ ‐ 2 2 ‐ 100.0 ‐ ‐
3.2 Asset ManagementCurrent payment 7,592 ‐ (632) 6,960 6,960 ‐ 100.0 5,418 5,418
Transfers and subsidies 14 ‐ ‐ 14 12 2 85.7 10 9
Payment for capital assets 20 ‐ 12 32 32 ‐ 100.0 ‐ ‐
3.3 Liabilities ManagementCurrent payment 1 ‐ (1) ‐ ‐ ‐ ‐ ‐ ‐
3.4 Supporting and Interelinked Current payment 37,435 ‐ 1,535 38,970 38,974 (4) 100.0 37,273 37,273
Transfers and subsidies 17 ‐ ‐ 17 15 2 93.8 12 12
Payment for capital assets ‐ ‐ 7 7 7 ‐ 100.0 4,689 396
Total 45,892 ‐ 807 46,699 46,699 ‐ 100.0 47,402 43,108
2005/06 2004/05
Programme per subprogramme
AdjustedAppropriation
Shifting of Funds
VirementFinal
AppropriationActual
ExpenditureVariance
Expenditure as % of final appropriation
FinalAppropriation
ActualExpenditure
Rʹ000 Rʹ000 Rʹ000 Rʹ000 Rʹ000 Rʹ000 % Rʹ000 Rʹ000
Current payments
Compensation of employees 12,256 ‐ (530) 11,726 11,725 1 100.0 8,499 8,498
Goods and services 33,583 ‐ 1,318 34,901 34,906 (5) 100.0 34,192 34,193
Transfers & subsidies
Provinces & municipalities 33 ‐ ‐ 33 29 4 90.6 22 21
Payment for capital assets
Machinery & equipment 20 ‐ 19 39 39 ‐ 100.0 4,689 396
Total 45,892 ‐ 807 46,699 46,699 ‐ 100.0 47,402 43,108
2005/06 2004/05
Economic classification

WESTERN CAPE PROVINCE PROVINCIAL TREASURY
VOTE 3
APPROPRIATION STATEMENT for the year ended 31 March 2006
Part 4: Annual Financial Statements
92
Detail per programme 4 ‐ Financial Governancefor the year ended 31 March 2006
AdjustedAppropriation
Shifting of Funds
VirementFinal
AppropriationActual
ExpenditureVariance
Expenditure as % of final
appropriation
FinalAppropriation
ActualExpenditure
Rʹ000 Rʹ000 Rʹ000 Rʹ000 Rʹ000 Rʹ000 % Rʹ000 Rʹ000 4.1 Programme Support
Current payment 1,135 ‐ (105) 1,030 1,030 ‐ 100.0 ‐ ‐
Transfers and subsidies 3 ‐ ‐ 3 2 1 66.7 ‐ ‐
Payment for capital assets 18 ‐ ‐ 18 7 11 38.9 ‐ ‐
4.2 Accounting ServicesCurrent payment 2,802 ‐ (192) 2,610 2,610 ‐ 100.0 2,001 2,001
Transfers and subsidies 7 ‐ 85 92 91 1 98.9 4 4
Payment for capital assets 12 ‐ 8 20 20 ‐ 100.0 ‐ ‐
4.3 Norms and StandardsCurrent payment 2,635 ‐ (266) 2,369 2,370 (1) 100.0 5,907 5,711
Transfers and subsidies 6 ‐ ‐ 6 5 1 83.3 6 6
4.4 Risk ManagementCurrent payment 1,413 ‐ (102) 1,311 1,312 (1) 100.1 ‐ ‐
Transfers and subsidies 2 ‐ ‐ 2 2 ‐ 66.7 ‐ ‐
Payment for capital assets 493 ‐ ‐ 493 390 103 79.1 ‐ ‐
4.5 Provincial Internal AuditCurrent payment 17,817 ‐ 2,082 19,899 19,901 (2) 100.0 18,841 18,513
Transfers and subsidies 7 ‐ ‐ 7 6 1 85.7 7 5
Payment for capital assets 121 ‐ (8) 113 97 16 85.8 710 600
Total 26,471 ‐ 1,502 27,973 27,843 130 99.5 27,476 26,840
2005/06 2004/05
Programme per subprogramme
AdjustedAppropriation
Shifting of Funds
VirementFinal
AppropriationActual
ExpenditureVariance
Expenditure as % of final appropriation
FinalAppropriation
ActualExpenditure
R ʹ000 R ʹ000 R ʹ000 R ʹ000 R ʹ000 R ʹ000 % R ʹ000 R ʹ000
Current paymentsCompensation of employees 9,523 ‐ (750) 8,773 8,773 ‐ 100.0 6,345 6,343
Goods and services 16,279 ‐ 2,167 18,446 18,450 (4) 100.0 20,403 19,882
Transfers & subsidies
Provinces & municipalities 25 ‐ ‐ 25 21 4 84.0 18 15
Households ‐ ‐ 85 85 85 ‐ 100.0 ‐ ‐
Payment for capital assets
Machinery & equipment 151 ‐ ‐ 151 124 27 82.1 ‐ ‐
Software & other intangible assets 493 ‐ ‐ 493 390 103 79.1 710 600
Total 26,471 ‐ 1,502 27,973 27,843 130 99.5 27,476 26,840
2005/06 2004/05
Economic classification

WESTERN CAPE PROVINCE PROVINCIAL TREASURY
VOTE 3
NOTES TO THE APPROPRIATION STATEMENT for the year ended 31 March 2006
Part 4: Annual Financial Statements
93
1. Detail of transfers and subsidies as per Appropriation Act (after Virement):
Detail of these transactions can be viewed in note 6 (Transfers and subsidies) and Annexure 1 (A‐D) to the annual financial statements.
2. Detail of specifically and exclusively appropriated amounts voted (after Virement): Detail of these transactions can be viewed in note 1 (Annual Appropriation) to the Annual Financial Statements.
3. Detail on financial transactions in assets and liabilities: Detail of these transactions per programme can be viewed in note 5 (Details of special functions (theft and losses)) to the Annual Financial Statements.
4. Explanations of material variances from Amounts Voted (after Virement):
Programmes Voted
Funds after virement
Actual Payment
Variance
Actual payment as % of final
appropriation Rʹ000 Rʹ000 Rʹ000 %
Programme 1: Administration 23,893 23,220 673 97.2 Programme 2: Sustainable Resource Management 16,844 16,513 331 98.0 Programme 3: Asset and Liabilities Management 46,699 46,699 ‐ 100.0 Programme 4: Financial Governance 27,973 27,843 130 99.5 Total 115,409 114,275 1,134 99.0
4.1 Programme 1: Administration The under spending on this programme can mainly be attributed to lower than expected spending on machinery and equipment (capital assets) and lower than anticipated resettlement costs. Under transfers, a saving was realised because FASSET did not submit a claim to the department as expected. Programme 2: Sustainable Resource Management The under spending on this programme was mainly due to lower than expected expenditure on consulting services and late filling of vacant posts. Programme 3: Asset and Liabilities Management There are no material variances to report on.

WESTERN CAPE PROVINCE PROVINCIAL TREASURY
VOTE 3
NOTES TO THE APPROPRIATION STATEMENT for the year ended 31 March 2006
94
Annual Report 2005/06
Programme 4: Financial Governance The under spending resulted from an over provision made for software licences related to risk management.
4.2 Per Economic classification
Current payments: Compensation to employees The minor saving was due to lower spending on service bonuses as most of the new appointees only received pro rata bonuses as well as late filling of vacant posts.
Goods and services The under spending can mainly be attributed to lower than expected spending on consulting services and resettlement costs.
Transfers and subsidies: Non‐profit institutions The saving was realised due to no transfer payment made to the respective SETA7 as anticipated.
Payments for capital assets: Machinery and equipment The under spending is due to planned spending on computer equipment related to new staff that did not realise before the close of the financial year.
Software and other intangible assets The saving is due to a lower than expected payment for software licences related to risk management.
EXPENDITURE PER ECONOMIC CLASSIFICATION
Final Appropriation
Actual Expenditure
Variance Actual Expenditure as
% of final appropriation
R’000 R’000 R’000 % Current expenditure
Compensation of employees 42,060 41,941 119 99.7
Goods and services 70,586 70,381 205 99.7
Financial transactions in assets and liabilities 173 173 ‐ 100.0 Transfers and subsidies Provinces and municipalities 173 152 21 87.9
Departmental agencies and accounts 35 35 ‐
Households 196 196 ‐ 100.0
Gifts and donations ‐ ‐ ‐ ‐ Payments for capital assets Machinery and equipment 1,680 1,029 651 61.3
Software and other intangible assets 506 403 103 79.6
TOTAL 115,409 114,275 1,134 99.0
7 Sector Education and Training Authority

Part 4: Annual Financial Statements
95
WESTERN CAPE PROVINCE PROVINCIAL TREASURY
VOTE 3
STATEMENT OF FINANCIAL PERFORMANCE for the year ended 31 March 2006
Note 2005/06 2004/05Rʹ000 Rʹ000
REVENUE
Annual appropriation 1. 115,409 108,980 Departmental revenue 2. 181,837 214,754 TOTAL REVENUE 297,246 323,734
EXPENDITURE
Current expenditureCompensation of employees 3. 41,941 33,590 Goods and services 4. 70,381 65,930 Financial transactions in assets and liabilities 5. 173 94 Total current expenditure 112,495 99,614
Transfers and subsidies 6. 348 723
Expenditure for capital assetsMachinery and Equipment 7. 1,029 1,391 Software and other intangible assets 7. 403 605 Total expenditure for capital assets 1,432 1,996
TOTAL EXPENDITURE 114,275 102,333
SURPLUS 182,971 221,401
SURPLUS FOR THE YEAR 182,971 221,401
Reconciliation of Net Surplus for the year Voted Funds 11. 1,134 6,647 Departmental revenue 2. 181,837 214,754
SURPLUS FOR THE YEAR 182,971 221,401

96
Annual Report 2005/06
WESTERN CAPE PROVINCE PROVINCIAL TREASURY
VOTE 3
STATEMENT OF FINANCIAL POSITION as at 31 March 2006
Note 2005/06 2004/05 Rʹ000 Rʹ000
ASSETS
Current assets 2,157 7,113 Cash and cash equivalents 8. 1,930 6,945 Prepayments and advances 9. 5 42 Receivables 10. 222 126
TOTAL ASSETS 2,157 7,113
LIABILITIES
Current liabilities 2,157 7,113 Voted funds to be surrendered to the Revenue Fund 11. 1,134 6,647 Departmental revenue to be surrendered to the Revenue Fund 12. 224 307 Payables 13. 799 159
TOTAL LIABILITIES 2,157 7,113

Part 4: Annual Financial Statements
97
WESTERN CAPE PROVINCE PROVINCIAL TREASURY
VOTE 3
CASH FLOW STATEMENT for the year ended 31 March 2006
Note 2005/06 2004/05 Rʹ000 Rʹ000
CASH FLOWS FROM OPERATING ACTIVITIES Receipts 582,787 494,292 Annual appropriated funds received 1 115,409 108,980 Departmental revenue received 467,378 385,312
Net (increase)/ decrease in working capital 581 (4,660) Surrendered to Revenue Fund (474,108) (423,146) Current payments (112,495) (99,614) Transfers and subsidies paid (348) (723) Net cash flow available from operating activities 14. (3,583) (33,851)
CASH FLOWS FROM INVESTING ACTIVITIES Payments for capital assets (1,432) (1,996) Net cash flows from investing activities (1,432) (1,996)
CASH FLOWS FROM FINANCING ACTIVITIES
Net increase/ (decrease) in cash and cash equivalents (5,015) (35,847)
Cash and cash equivalents at beginning of period 6,945 42,792
Cash and cash equivalents at end of period 15. 1,930 6,945

WESTERN CAPE PROVINCE PROVINCIAL TREASURY
VOTE 3
NOTES TO THE ANNUAL FINANCIAL STATEMENTS for the year ended 31 March 2006
Part 4: Annual Financial Statements
98
1. Annual Appropriation
Included are funds appropriated in terms of the Appropriation Act for Provincial DepartmentsFunds not
Final Actual Funds requested/ Appropriation Appropriation
2005/06Received2005/06
not received2005/06
Received2004/05
Programmes Rʹ000 Rʹ000 Rʹ000 Rʹ000Administration 23,893 23,893 ‐ 22,093 Sustainable Resource Management 16,844 16,844 ‐ 12,009 Asset and Liabilities Management 46,699 46,699 ‐ 47,402 Financial Governance 27,973 27,973 ‐ 27,476 Total 115,409 115,409 ‐ 108,980
Note 2005/06 2004/05Rʹ000 Rʹ000
2. Departmental revenue to be surrendered to Revenue Fund
221,972 173,621 2.1 7,233 7
Fines, penalties and forfeits 290 231 Interest, dividends and rent on land 2.2 233,361 211,333 Financial transactions in assets and liabilities 2.3 4,522 116 Transfers received 2.4 ‐ 4 Total revenue collected 467,378 385,312 Less: Departmental revenue budgeted 12. 285,541 170,558
181,837 214,754
Sales of goods and services other than capital assets
Total
Tax revenue
2.1 7,229 ‐
Administrative fees 7,220 ‐ Other sales 9 ‐
Sales of scrap, waste and other used current goods 4 7 Total 7,233 7
2.2 Interest, dividends and rent on land Interest 233,361 211,333 Total 233,361 211,333
Sales of goods and services produced Sales of goods and services other than capital assets

WESTERN CAPE PROVINCE PROVINCIAL TREASURY
VOTE 3
NOTES TO THE ANNUAL FINANCIAL STATEMENTS for the year ended 31 March 2006
Part 4: Annual Financial Statements
99
Note 2005/06 2004/05
Rʹ000 Rʹ000
2.3 Financial transactions in assets and liabilities Other receipts including recoverable revenue 4,522 116 Total 4,522 116
2.4 Transfers received
Other governmental units ‐ 4 Total ‐ 4
3. Compensation of employees
3.1 Salaries and wages
Basic salary 29,522 23,923 Performance award 784 581 Service Based 147 1,733 Compensative/circumstantial 773 387 Periodic payments 89 487 Other non‐pensionable allowances 5,423 1,990 Total 36,738 29,101
3.2 Social contributions
Employer contributions Pension 3,612 3,203 Medical 1,585 1,282 Bargaining council 6 4 Total 5,203 4,489
Total compensation of employees 41,941 33,590
Average number of employees 188 147

WESTERN CAPE PROVINCE
PROVINCIAL TREASURY VOTE 3
NOTES TO THE ANNUAL FINANCIAL STATEMENTS
for the year ended 31 March 2005
100
Annual Report 2005/06
Note 2005/06 2004/05
Rʹ000 Rʹ000 4. Goods and services
Advertising 3,503 4,677 Bank charges and card fees 90 87 Bursaries (employees) 277 170 Communication 1,230 820 Computer services 26,430 25,223 Consultants, contractors and special services 28,473 26,250 Courier and delivery services 48 29 Entertainment 442 308 External audit fees 4.1 2,433 2,944 Equipment less than R5 000 643 1,114 Inventory 4.2 1,969 853 Legal fees 39 2 Maintenance, repair and running costs 11 32 Operating leases 436 271 Personnel agency fees ‐ 1 Plant flowers and other decorations 4 ‐ Printing and publications ‐ 308 Professional bodies and membership fees 30 15 Resettlement costs 658 133 Subscriptions 13 23 Owned and leasehold property expenditure 1 ‐ Translations and transcriptions 124 32 Travel and subsistence 4.3 2,962 2,481 Venues and facilities 216 14 Protective, special clothing & uniforms 3 17 Training & staff development 346 126 Total 70,381 65,930
4.1 External audit fees Regulatory audits 2,394 2,944 Other audits 39 ‐ Total external audit fees 2,433 2,944

WESTERN CAPE PROVINCE PROVINCIAL TREASURY
VOTE 3
NOTES TO THE ANNUAL FINANCIAL STATEMENTS for the year ended 31 March 2006
Part 4: Annual Financial Statements
101
Note 2005/06 2004/05
Rʹ000 Rʹ000
4.2 Inventory Domestic Consumables 22 8 Food and Food supplies 23 26 Sport and recreation 12 ‐ Stationery and Printing 1,866 706 Restoration and fittings 46 113 Total Inventory 1,969 853
4.3 Travel and subsistence Local 2,594 2,313 Foreign 368 168 Total travel and subsistence 2,962 2,481
5. Financial transactions in assets and liabilities
Other material losses written off 5.1 139 ‐ Debts written off 5.2 6 6 Theft 5.3 28 88 Total 173 94
5.1 Other material losses Nature of losses Department 70 cases (old claims, ledger accounts etc) 139 ‐ Total 139 ‐
5.2 Debts written off Nature of debts written off Telephone debt ‐ 4 Other minor amounts 6 2 Total 6 6

WESTERN CAPE PROVINCE
PROVINCIAL TREASURY VOTE 3
NOTES TO THE ANNUAL FINANCIAL STATEMENTS
for the year ended 31 March 2005
102
Annual Report 2005/06
Note 2005/06 2004/05
Rʹ000 Rʹ000
5.3 Details of theft Computer Equipment (4x Laptops) ‐ 88 Department 70 cases (2 cases of cheque fraud) 24 ‐ Theft of cell phone and cash 4 ‐ Total 28 88
6. Transfers and subsidies
Provinces and municipalities ANNEXURE 1A
AND 1B 152 131 Departmental agencies and accounts ANNEXURE 1C ‐ 27 Households ANNEXURE 1D 196 565 Total 348 723
7. Expenditure on capital assets
Machinery and equipment ANNEXURE 3 1,029 1,391 Software and other intangible assets ANNEXURE 4 403 605 Total 1,432 1,996
8. Cash and cash equivalents
Consolidated Paymaster General Account 202 (789) Disbursements 10 ‐ Cash with commercial banks 1,718 7,734 Total 1,930 6,945
9. Prepayments and advances Description
Travel and subsistence 5 42 Total 5 42

WESTERN CAPE PROVINCE PROVINCIAL TREASURY
VOTE 3
NOTES TO THE ANNUAL FINANCIAL STATEMENTS for the year ended 31 March 2006
Part 4: Annual Financial Statements
103
Note 2005/06 2004/05
Rʹ000 Rʹ000
10. Receivables
Less thanone year
One to three years
Older than three years
Total Total
Rʹ000 Rʹ000 Rʹ000 Rʹ000 Rʹ000 Staff debtors 10.1 14 7 ‐ 21 51 Other debtors 10.2 4 ‐ 3 7 2 Claims recoverable Annexure 5 194 ‐ ‐ 194 73 Total 212 7 3 222 126
10.1 Staff debtors Unclaimed staff debt 91 56 Private Telephone calls ‐ 7 Debt Recovered (84) (12) Tax debt 14 ‐ Total 21 51
10.2 Other Debtors Ex Employees 7 2 Total 7 2
11. Voted funds to be surrendered to the Revenue Fund
Opening balance 6,647 38,016 Transfer from Statement of Financial Performance 1,134 6,647 Paid during the year (6,647) (38,016) Closing balance 1,134 6,647

WESTERN CAPE PROVINCE
PROVINCIAL TREASURY VOTE 3
NOTES TO THE ANNUAL FINANCIAL STATEMENTS
for the year ended 31 March 2005
104
Annual Report 2005/06
Note 2005/06 2004/05
Rʹ000 Rʹ000
12.
Opening balance 307 125 Transfer from Statement of Financial Performance 181,837 214,754 Departmental revenue budgeted 2. 285,541 170,558 Paid during the year (467,461) (385,130) Closing balance 224 307
Departmental revenue to be surrendered to the Revenue Fund
13. Payables – current
Description 2005/06 2004/05 30 Days 30+ Days Total Total Rʹ000 Rʹ000 Rʹ000 Rʹ000
Clearing accounts 13.1 ‐ 767 767 156 Other payables 13.2 24 8 32 3 Total 24 775 799 159
13.1 Clearing accounts
Department 70 Control Account Debits 961,950 967,886 Department 70 Control Account Credits (962,717) (968,042) Total (767) (156)
Note: The clearing account of R767 000 (nett) comprises 51 debitbalances totalling R961,950 million and 39 credit balances totallingR962,717 million which have not been cleared over the past fifteenyears. The intervention and guidance of both the National andProvincial Treasuries is needed before Department 70 control accountswill be cleared.

WESTERN CAPE PROVINCE PROVINCIAL TREASURY
VOTE 3
NOTES TO THE ANNUAL FINANCIAL STATEMENTS for the year ended 31 March 2006
Part 4: Annual Financial Statements
105
Note 2005/06 2004/05
Rʹ000 Rʹ000
13.2 Other payables Supplementary Tax to be paid to SARS 24 1 Pension Fund ‐ 2 Private Telephone Account 8 ‐ Total 32 3
Note: Private telephone accounts are paid before the debits are raised, hence account is in credit.
14. Net cash flow available from operating activities
182,971 221,401 Increase in receivables – current (96) (11) (Increase)/decrease in prepayments and advances 37 (42) Increase/(decrease) in payables – current 640 (4,607) Surrenders to revenue fund (474,108) (423,146) Expenditure on capital assets 1,432 1,996 Other non cash items 285,541 170,558 Net cash flow generated by operating activities (3,583) (33,851)
Net surplus as per Statement of Financial Performance
15.
Consolidated Paymaster General Account 202 (789) Disbursements 10 ‐ Cash with commercial banks 1,718 7,734 Total 1,930 6,945
Reconciliation of cash and cash equivalents for cash flow purposes

WESTERN CAPE PROVINCE PROVINCIAL TREASURY
VOTE 3
DISCLOSURE NOTES TO THE ANNUAL FINANCIAL STATEMENTS for the year ended 31 March 2006
Part 4: Annual Financial Statements
106
These amounts are not recognised in the Annual Financial Statements and are disclosed to enhance the usefulness of the Annual Financial Statements.
Note 2005/06 2004/05
Rʹ000 Rʹ000 16. Contingent liabilities
Liable to Nature
Motor vehicle guarantees Employees ANNEXURE 2 ‐ 72 Housing loan guarantees Employees ANNEXURE 2 161 279 Other departments (interdepartmental unconfirmed balances) ANNEXURE 6 23 ‐ Total 184 351
17. CommitmentsCurrent expenditureApproved and contracted 827 457
827 457 Capital expenditureApproved and contracted 104 8
104 8 Total Commitments 931 465

WESTERN CAPE PROVINCE PROVINCIAL TREASURY
VOTE 3
DISCLOSURE NOTES TO THE ANNUAL FINANCIAL STATEMENTS for the year ended 31 March 2006
Part 4: Annual Financial Statements
107
Note 2005/06 2004/05
Rʹ000 Rʹ000
18. Accruals30 Days 30+ Days Total Total
By economic classification Rʹ000 Rʹ000 Rʹ000 Rʹ000Goods and services 2,730 500 3,230 561 Machinery and Equipment 198 30 228 376 Total 3,458 937
Listed by programme levelAdministration 1,165 768 Sustainable Resource Management 159 14 Assets and Liabilities Management 1,786 151 Financial Governance 348 4 Total 3,458 937
Confirmed balances with other departments ANNEXURE 6 165 187
Total 165 187
Note: Comparatives per programme level have been restated.
19. Employee benefit provisions
Leave entitlement 769 580 Thirteenth cheque 1,144 951 Performance awards 772 683 Capped leave commitments 4,218 3,850 Total 6,903 6,064
Note: Performance awards are paid after the reporting date for the year under review. Comparative figures for all employee benefits have been regrouped.
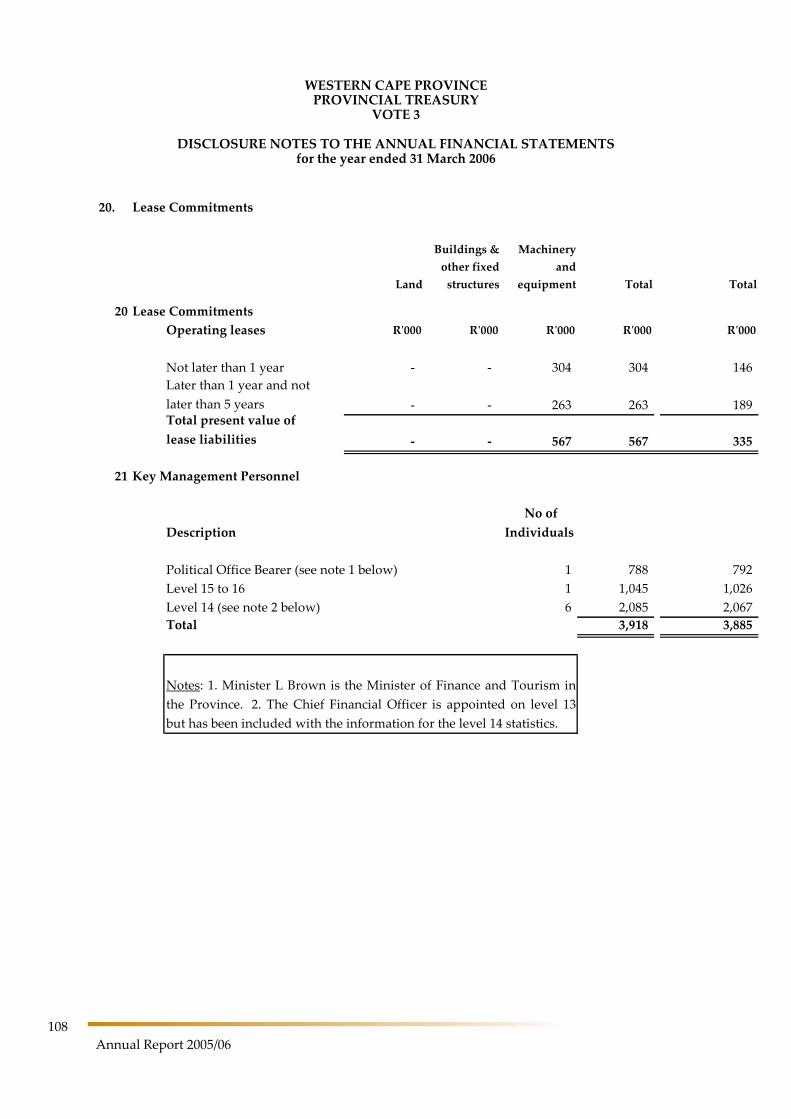
WESTERN CAPE PROVINCE PROVINCIAL TREASURY
VOTE 3
DISCLOSURE NOTES TO THE ANNUAL FINANCIAL STATEMENTS for the year ended 31 March 2006
108
Annual Report 2005/06
20. Lease Commitments
Land
Buildings & other fixed structures
Machinery and
equipment Total Total
20 Lease CommitmentsOperating leases Rʹ000 Rʹ000 Rʹ000 Rʹ000 Rʹ000
Not later than 1 year ‐ ‐ 304 304 146 Later than 1 year and not later than 5 years ‐ ‐ 263 263 189 Total present value of lease liabilities ‐ ‐ 567 567 335
21 Key Management Personnel
Description
Political Office Bearer (see note 1 below) 1 788 792 Level 15 to 16 1 1,045 1,026 Level 14 (see note 2 below) 6 2,085 2,067 Total 3,918 3,885
No of Individuals
Notes: 1. Minister L Brown is the Minister of Finance and Tourism inthe Province. 2. The Chief Financial Officer is appointed on level 13but has been included with the information for the level 14 statistics.
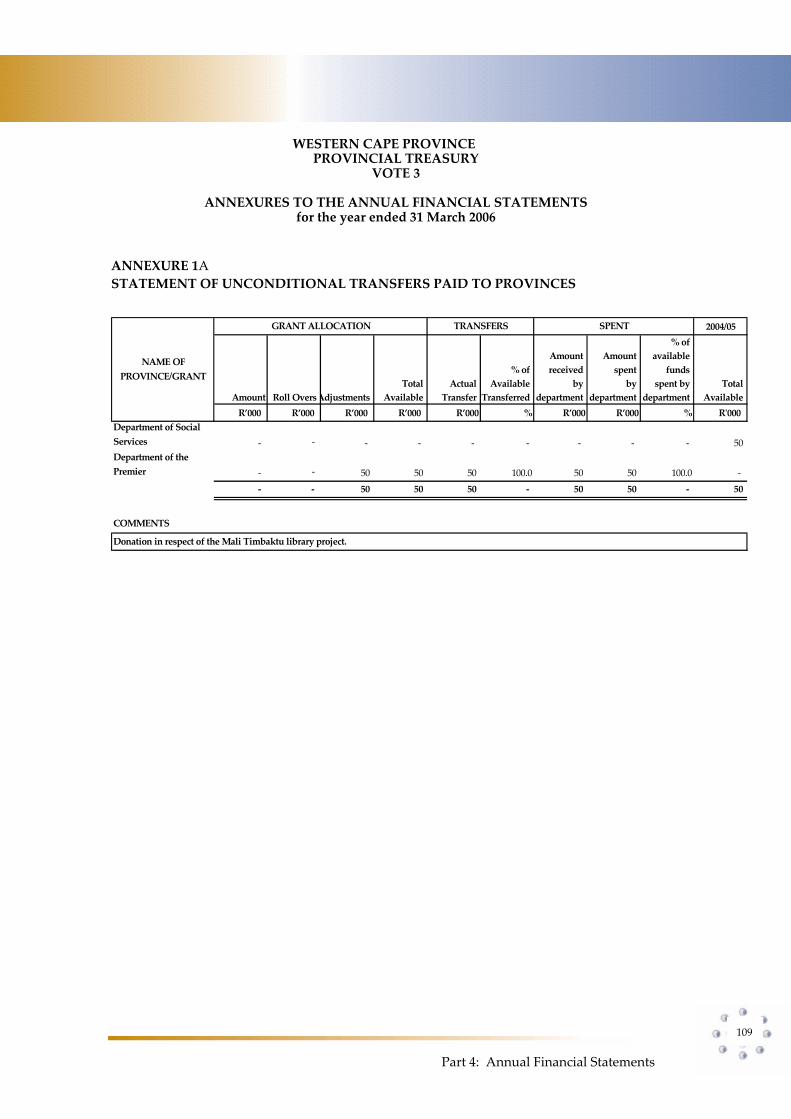
WESTERN CAPE PROVINCE
PROVINCIAL TREASURY VOTE 3
ANNEXURES TO THE ANNUAL FINANCIAL STATEMENTS
for the year ended 31 March 2006
Part 4: Annual Financial Statements
109
ANNEXURE 1A STATEMENT OF UNCONDITIONAL TRANSFERS PAID TO PROVINCES
2004/05% of
Amount Amount available % of received spent funds
Total Actual Available by by spent by Total Amount Roll Overs Adjustments Available Transfer Transferred department department department Available R’000 R’000 R’000 R’000 R’000 % R’000 R’000 % Rʹ000
Department of Social Services ‐ ‐ ‐ ‐ ‐ ‐ ‐ ‐ ‐ 50 Department of the Premier ‐ ‐ 50 50 50 100.0 50 50 100.0 ‐
‐ ‐ 50 50 50 ‐ 50 50 ‐ 50
COMMENTS
Donation in respect of the Mali Timbaktu library project.
NAME OF PROVINCE/GRANT
GRANT ALLOCATION TRANSFERS SPENT

WESTERN CAPE PROVINCE
PROVINCIAL TREASURY VOTE 3
ANNEXURES TO THE ANNUAL FINANCIAL STATEMENTS
for the year ended 31 March 2006
110
Annual Report 2005/06
ANNEXURE 1B STATEMENT OF UNCONDITIONAL GRANTS AND TRANSFERS TO MUNICIPALITIES
2004/05% of
% of Amount Amount available Available received spent funds
Total Actual Funds by by spent by Total Amount Roll Overs Adjustments Available Transfer Transferred municipality municipality municipality Available R’000 R’000 R’000 R’000 R’000 % R’000 R’000 % Rʹ000
City of Cape Town 126 ‐ (4) 122 102 83.6 102 102 100.0 81
126 ‐ (4) 122 102 ‐ 102 102 ‐ 81
RCS Levies
NAME OF MUNICIPALITY
GRANT ALLOCATION TRANSFER SPENT

WESTERN CAPE PROVINCE
PROVINCIAL TREASURY VOTE 3
ANNEXURES TO THE ANNUAL FINANCIAL STATEMENTS
for the year ended 31 March 2006
Part 4: Annual Financial Statements
111
ANNEXURE 1C STATEMENT OF TRANSFERS TO DEPARTMENTAL AGENCIES AND ACCOUNTS
2004/05
% of Adjusted Available Final
Appropriation Total Actual Funds Appropriation Act Roll Overs Adjustments Available Transfer Transferred Act
R’000 R’000 R’000 R’000 R’000 % R’000 SETA ‐ ‐ ‐ ‐ ‐ ‐ 27
‐ ‐ ‐ ‐ ‐ ‐ 27
DEPARTMENTS/AGENCY/ACCOUNT
TRANSFER ALLOCATION TRANSFER

WESTERN CAPE PROVINCE
PROVINCIAL TREASURY VOTE 3
ANNEXURES TO THE ANNUAL FINANCIAL STATEMENTS
for the year ended 31 March 2006
112
Annual Report 2005/06
ANNEXURE 1D STATEMENT OF TRANSFERS/SUBSIDIES TO HOUSEHOLDS
2004/05Adjusted % of Final
Appropriation Total Actual Available ApropriationAct Roll Overs Adjustments Available Transfer Transferred Act
Rʹ000 Rʹ000 Rʹ000 Rʹ000 Rʹ000 % Rʹ000Claims against State Households 111 ‐ 85 196 196 100.0 565
Total 111 ‐ 85 196 196 ‐ 565
TRANSFER ALLOCATION EXPENDITURE
HOUSEHOLDS
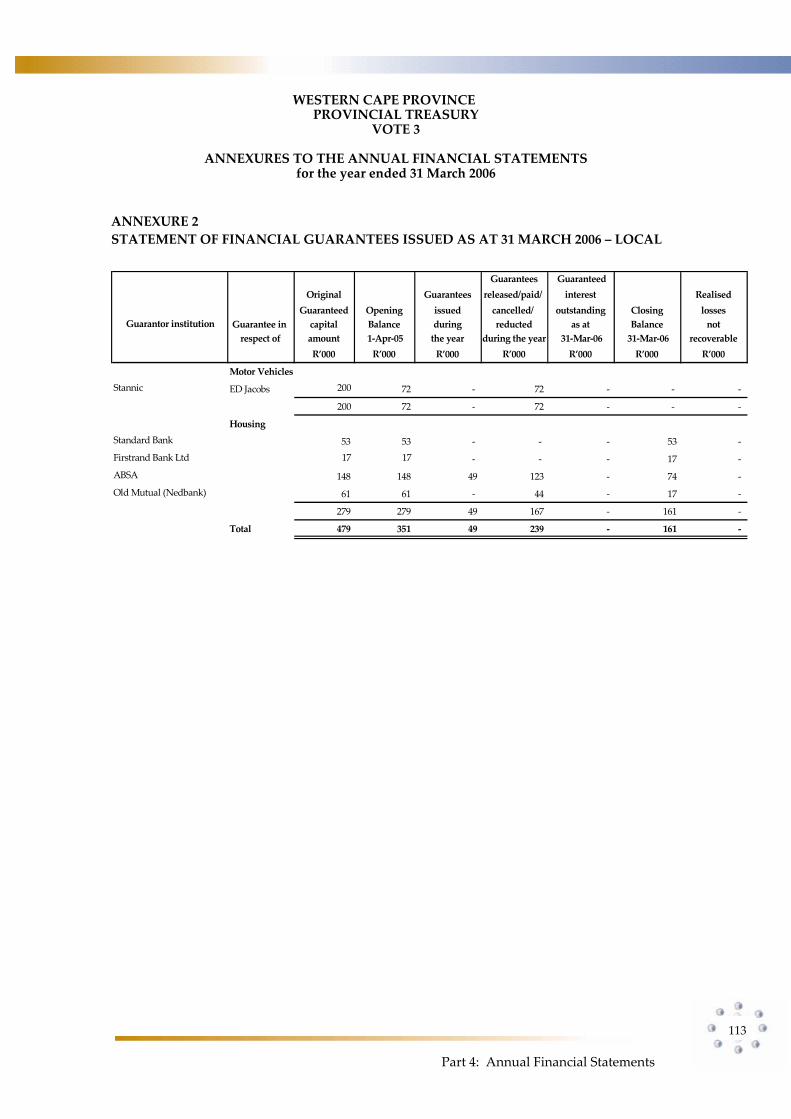
WESTERN CAPE PROVINCE
PROVINCIAL TREASURY VOTE 3
ANNEXURES TO THE ANNUAL FINANCIAL STATEMENTS
for the year ended 31 March 2006
Part 4: Annual Financial Statements
113
ANNEXURE 2 STATEMENT OF FINANCIAL GUARANTEES ISSUED AS AT 31 MARCH 2006 – LOCAL
Guarantees GuaranteedOriginal Guarantees released/paid/ interest Realised Guaranteed Opening issued cancelled/ outstanding Closing losses
Guarantee in capital Balance during reducted as at Balance not respect of amount 1‐Apr‐05 the year during the year 31‐Mar‐06 31‐Mar‐06 recoverable
R’000 R’000 R’000 R’000 R’000 R’000 R’000
Motor VehiclesStannic ED Jacobs 200 72 ‐ 72 ‐ ‐ ‐
200 72 ‐ 72 ‐ ‐ ‐
HousingStandard Bank 53 53 ‐ ‐ ‐ 53 ‐ Firstrand Bank Ltd 17 17 ‐ ‐ ‐ 17 ‐ ABSA 148 148 49 123 ‐ 74 ‐ Old Mutual (Nedbank) 61 61 ‐ 44 ‐ 17 ‐
279 279 49 167 ‐ 161 ‐
Total 479 351 49 239 ‐ 161 ‐
Guarantor institution

WESTERN CAPE PROVINCE
PROVINCIAL TREASURY VOTE 3
ANNEXURES TO THE ANNUAL FINANCIAL STATEMENTS
for the year ended 31 March 2006
114
Annual Report 2005/06
ANNEXURE 3 CAPITAL TANGIBLE ASSET MOVEMENT SCHEDULE FOR THE YEAR ENDED 31 MARCH 2006
Opening Closing balance Additions Disposals balance
R’000 R’000 R’000 R’000
MACHINERY AND EQUIPMENT 5,250 1,029 ‐ 6,279
Transport assets ‐ 108 ‐ 108
Computer equipment 4,439 306 ‐ 4,745
Furniture and Office equipment 144 248 ‐ 392
Other machinery and equipment 667 367 ‐ 1,034
TOTAL CAPITAL ASSETS 5,250 1,029 ‐ 6,279
ANNEXURE 3.1 ADDITIONS MOVEMENT SCHEDULE FOR THE YEAR ENDED 31 MARCH 2006
Cash In‐Kind Total
R’000 R’000 R’000
MACHINERY AND EQUIPMENT 1,029 ‐ 1,029
Transport assets 108 ‐ 108
Computer equipment 306 ‐ 306
Furniture and Office equipment 248 ‐ 248
Other machinery and equipment 367 ‐ 367
TOTAL CAPITAL ASSETS 1,029 ‐ 1,029
ANNEXURE 3.2 CAPITAL TANGIBLE ASSET MOVEMENT SCHEDULE FOR THE YEAR ENDED 31 MARCH 2005

WESTERN CAPE PROVINCE
PROVINCIAL TREASURY VOTE 3
ANNEXURES TO THE ANNUAL FINANCIAL STATEMENTS
for the year ended 31 March 2006
Part 4: Annual Financial Statements
115
TotalAdditions Disposals Movement
R’000 R’000 R’000
MACHINERY AND EQUIPMENT 1,391 ‐ 1,391
Computer equipment 1,075 ‐ 1,075
Furniture and Office equipment 264 ‐ 264
Other machinery and equipment 52 ‐ 52
TOTAL CAPITAL ASSETS 1,391 ‐ 1,391

WESTERN CAPE PROVINCE
PROVINCIAL TREASURY VOTE 3
ANNEXURES TO THE ANNUAL FINANCIAL STATEMENTS
for the year ended 31 March 2006
116
Annual Report 2005/06
ANNEXURE 4 CAPITAL INTANGIBLE ASSET COST MOVEMENT SCHEDULE FOR THE YEAR ENDED 31 MARCH 2006
Opening Closing
balance Additions Disposals balance
R’000 R’000 R’000 R’000
Computer Software 605 403 ‐ 1,008
TOTAL 605 403 ‐ 1,008
ANNEXURE 4.1 ADDITIONS MOVEMENT SCHEDULE FOR THE YEAR ENDED 31 MARCH 2006
Cash In‐Kind Total
R’000 R’000 R’000
Computer Software 403 ‐ 403
TOTAL 403 ‐ 403
ANNEXURE 4.2 CAPITAL INTANGIBLE ASSET MOVEMENT SCHEDULE FOR THE YEAR ENDED 31 MARCH 2005
Total
Additions Disposals Movement
R’000 R’000 R’000
Computer Software 605 ‐ 605
TOTAL 605 ‐ 605

WESTERN CAPE PROVINCE
PROVINCIAL TREASURY VOTE 3
ANNEXURES TO THE ANNUAL FINANCIAL STATEMENTS
for the year ended 31 March 2006
Part 4: Annual Financial Statements
117
ANNEXURE 5 INTER–GOVERNMENTAL RECEIVABLES
31/03/2006 31/03/2005 31/03/2006 31/03/2005 31/03/2006 31/03/2005
R’000 R’000 R’000 R’000 R’000 R’000Department
National Treasury ‐ ‐ ‐ 39 ‐ 39 Transport and Public Works (Western Cape) ‐ 3 ‐ ‐ ‐ 3 Environmental Affairs and Tourism (Pretoria) ‐ 31 ‐ ‐ ‐ 31 Department of Health (Western Cape) ‐ ‐ 178 ‐ 178 ‐ Department of the Premier (Western Cape) 16 ‐ ‐ ‐ 16 ‐
TOTAL 16 34 178 39 194 73
Confirmed balance Unconfirmed balance Total
Government Entity

WESTERN CAPE PROVINCE
PROVINCIAL TREASURY VOTE 3
ANNEXURES TO THE ANNUAL FINANCIAL STATEMENTS
for the year ended 31 March 2006
118
Annual Report 2005/06
ANNEXURE 6 INTER–DEPARTMENTAL PAYABLES – CURRENT
31/03/2006 31/03/2005 31/03/2006 31/03/2005 31/03/2006 31/03/2005
R’000 R’000 R’000 R’000 R’000 R’000 DEPARTMENTSDepartment of Transport and Public Works (Western Cape) 104 174 ‐ ‐ 104 174 Department of the Premier (Western Cape) ‐ 1 22 ‐ 22 1 South African Police Service ‐ 12 ‐ ‐ ‐ 12
Government Motor Transport (Western Cape) 13 ‐ ‐ ‐ 13 ‐ Dept. of Cultural Affairs and Sport (Western Cape) 25 ‐ ‐ ‐ 25 ‐ Dept. of Local Govt. and Housing (Western Cape) 23 ‐ ‐ ‐ 23 ‐ Department of Justice ‐ ‐ 1 ‐ 1 ‐
Total 165 187 23 ‐ 188 187
Confirmed balance Unconfirmed balance TOTAL
GOVERNMENT ENTITY

Part 5: Human Resource Management
119
Part 5
Human Resource Management
Oversight Report
The statistics and information published in this part of the annual report are required in terms of Chapter 1, Part III J.3 of the Public Service Regulations, 2001 and have been prescribed by the Minister for the Public Service and Administration for all departments within the Public Service. The statistical tables provide high‐level information on key human resource issues. The information aims to empower legislatures, the media, the public and other key stakeholders to monitor whether departments: • Are exercising the powers granted under Public Service and Public Finance legislation in
a responsible manner, and • Are achieving national transformation priorities established by the Cabinet, for example,
affirmative action. Annual reports produced at the end of each financial year are aimed at strengthening the accountability of departments to key stakeholders. The tables in this report are revised on a regular basis by the Department of Public Service and Administration (DPSA). 1. Service Delivery All departments are required to develop a Service Delivery Improvement (SDI) Plan. The following tables reflect the components of the SDI plan as well as progress made in the implementation of the plan. Services provided per programme are discussed in Part 2 of this statement.

120
Annual Report 2005/06
Table 1.1: Main services provided and standards
Main services Actual customers Potential customers
Standard of service
Actual achievement against standards
PROGRAMME 1: ADMINISTRATION
Sub‐programme 1.1: Office of the Provincial Minister
Smooth and effective functioning of the Minister’s Office.
Minister
Office of the Premier
Three tiers of Government: National, Provincial, Local
National Ministers
Other Provinces Ministeries
Other National Ministries
National departments
Provincial departments.
Adherence to benchmarked service standards.
Partial delivery of administrative, communication and other support services to the standards set by the Minister.
Provincial Ministers
Director‐General
Department Heads
Tourism Organisations
Gambling Board
Diplomats
Politicians
Public
Public Sector
Private Sector
NGOs
Cabinet Secretariat
International Organisations
Sub‐programme 1.2: Management Services
Sub‐programme 1.3: Corporate Services
Excellence in personnel and performance management services.
Provincial Treasury
Directorates
SETA
Provincial departments
DPSA
20% Vacancy rate At start of financial year a 25% vacancy rate was achieved which escalated to a 44% vacancy rate due to the creation

Part 5: Human Resource Management
121
Main services Actual customers Potential customers
Standard of service
Actual achievement against standards
of 66 posts added to the establishment. It has since been worked down to 32%.
Ensuring cordial labour relations.
Provincial Treasury
Directorates
SETA
Provincial departments
DPSA
No labour disputes. Collective Agreements were concluded on the following:
(a) Recruitment and Selection Policy,
(b) Implementation of SPMS incentive payouts,
(c ) Terms of reference for IMLC.
Four cases of misconduct concerning:
(a) One case of dishonesty which was instituted with a written warning,
(b) Three cases of absence from work without permission that was sanctioned by final written warnings.
Three grievances were lodged of which only 1 case was resolved.
Facilitating appropriate human resource development.
Provincial Treasury
Directorates
SETA
Provincial departments
DPSA
Skilling in line with strategic goals.
62 % attained
68 Bursaries
11 Learnerships
3 Abet
132 Training Inter‐ventions
12 interns

122
Annual Report 2005/06
Main services Actual customers Potential customers
Standard of service
Actual achievement against standards
Ensuring organisational transformation.
Provincial Treasury
Directorates
SETA
Provincial departments
DPSA
Ability to deliver on Treasury’s goals.
Current filling of vacancies focused on achieving a diversified workforce.
The percentage change in the diversity of the workforce was as follows:
African Male 10%
African Female 13%
Coloured Male 7%
Coloured Female 9%
Indian Male 1%
Indian Female 1%
White Male 0%
White Female 0%.
Gender Equality in employment target was achieved.
HIV & Aids work‐place programme was 80% completed.
Cultural Assessments completed with a view of implementing/ guiding Transformation programmes.
Sub‐programme 1.4: Financial Management
Efficient and effective planning and budget management.
Provincial Treasury
Directorates
Provincial departments
Ensure no greater than 2% variance between actual and approved budget.
An under expenditure of 1% was achieved for the period.
Ensuring proper financial accounting and risk management.
Provincial Treasury
Directorates
Provincial departments
Unqualified Auditor‐general report.
Financial accounting is on par with Treasury’s normative standards.

Part 5: Human Resource Management
123
Main services Actual customers Potential customers
Standard of service
Actual achievement against standards
Risk Management is still in the early stage of development.
The Auditor‐General’s report has not been issued yet.
Supply chain management in line with treasury criteria.
Provincial Treasury
Directorates
Provincial departments
Full compliance to efficiency criteria developed by the Treasury.
80% compliance was achieved.
A new Asset register was compiled from Provincial Treasury.
Excellent specialised auxiliary services.
Provincial Treasury
Directorates
Provincial departments
Services delivered at a standard acceptable to other line functionaries.
Normal support services were on par with expectations. Document management services were rated and provided at 60%. A new document control system is being developed.
PROGRAMME 2: SUSTAINABLE RESOURCE MANAGEMENT
Sub‐programme 2.1: Programme Support
Note: Support structures not yet approved hence no comments.
Sub‐programme 2.2: Economic Analysis
Determine the potential and constraints for economic growth and development, and their interaction with current government spending and revenue patterns.
Provincial departments
CFOs
Provincial Treasuries and National Treasury
SCOF
Local Government
Academia
PTC
SSA
FFC
Private Sector
Positive feedback from stakeholders.
Chapter 1 contribution to the 2005 MTBPS 2006 Provincial Economic Review and Outlook approved by the Cabinet, tabled in the house, launched to stakeholders and debated by SCOF.
Preparation of input into the budget process. Adjustment Estimate and selected impact assessments.
Provincial departments
CFOs
Provincial Treasury and National Treasury
SCOF
PTC
SSA
FFC
Refinement of input into the budget process as well as the impact assessment on request.
Timely socio‐economic inputs made to the budget process.

124
Annual Report 2005/06
Main services Actual customers Potential customers
Standard of service
Actual achievement against standards
Sub‐programme 2.3: Fiscal Policy
Administer the medium‐term revenue planning process.
Provincial and National departments
CFOs
Provincial and National Treasury
PTC
Statistics SA
SCOF
FFC
Timeous and accurate estimates of all sources of Provincial Revenue disseminated to Provincial Treasury.
Timeous and accurate estimates of all sources of Provincial Revenue disseminated to Provincial Treasury.
Assess and optimise division of national revenues (equitable shares and conditional grants).
Provincial departments
CFOs
Provincial and National Treasury
Other Provincial Treasuries
PTC
Statistics SA
SCOF
Annual real growth of at least 1% above GDP inflation after discounting of personnel and social security.
7,6% real Equitable Share growth between 2005/06 and 2006/07, forming 72,9% of provincial revenue.
NCOP FFC 0,8% real Conditional Grant growth between 2005/06 and 2006/07 forming 16% of provincial revenue.
Assess and optimise the Western Cape’s present own revenue base.
Provincial and National departments
CFOs
Provincial and National Treasury
Other Provincial Treasuries
PTC
Statistics SA
SCOF
FFC
Tertiary institutions
Annual real growth in excess of 5% over current MTEF projections.
Own revenue increased at a real growth rate of 13,6% between 2004/05 and 2005/06. Own revenue decreases over the MTEF as a result of policy decisions (the establishment of the Asset Financing Fund).
Ensure effective and efficient management of debtors.
Provincial departments
CFOs
Provincial and National Treasury
Other Provincial Treasury’s
Statistics SA
Collect information on reported and unreported provincial debt.
Systematic reduction in level of debt owing to provincial departments.
Identification of all outstanding debt.
5,85% reduction in level debt owing to provincial departments.
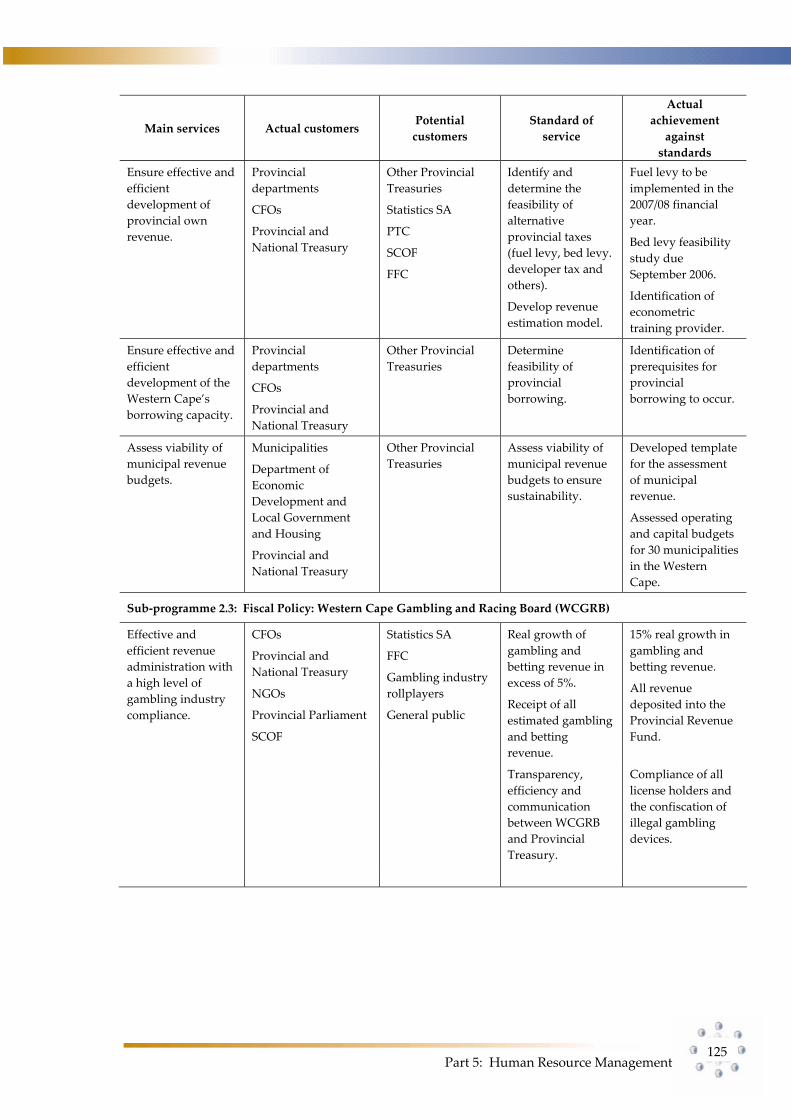
Part 5: Human Resource Management
125
Main services Actual customers Potential customers
Standard of service
Actual achievement against standards
Ensure effective and efficient development of provincial own revenue.
Provincial departments
CFOs
Provincial and National Treasury
Other Provincial Treasuries
Statistics SA
PTC
SCOF
FFC
Identify and determine the feasibility of alternative provincial taxes (fuel levy, bed levy. developer tax and others).
Develop revenue estimation model.
Fuel levy to be implemented in the 2007/08 financial year.
Bed levy feasibility study due September 2006.
Identification of econometric training provider.
Ensure effective and efficient development of the Western Cape’s borrowing capacity.
Provincial departments
CFOs
Provincial and National Treasury
Other Provincial Treasuries
Determine feasibility of provincial borrowing.
Identification of prerequisites for provincial borrowing to occur.
Assess viability of municipal revenue budgets.
Municipalities
Department of Economic Development and Local Government and Housing
Provincial and National Treasury
Other Provincial Treasuries
Assess viability of municipal revenue budgets to ensure sustainability.
Developed template for the assessment of municipal revenue.
Assessed operating and capital budgets for 30 municipalities in the Western Cape.
Sub‐programme 2.3: Fiscal Policy: Western Cape Gambling and Racing Board (WCGRB)
Effective and efficient revenue administration with a high level of gambling industry compliance.
CFOs
Provincial and National Treasury
NGOs
Provincial Parliament
SCOF
Statistics SA
FFC
Gambling industry rollplayers
General public
Real growth of gambling and betting revenue in excess of 5%.
Receipt of all estimated gambling and betting revenue.
15% real growth in gambling and betting revenue.
All revenue deposited into the Provincial Revenue Fund.
Transparency, efficiency and communication between WCGRB and Provincial Treasury.
Compliance of all license holders and the confiscation of illegal gambling devices.
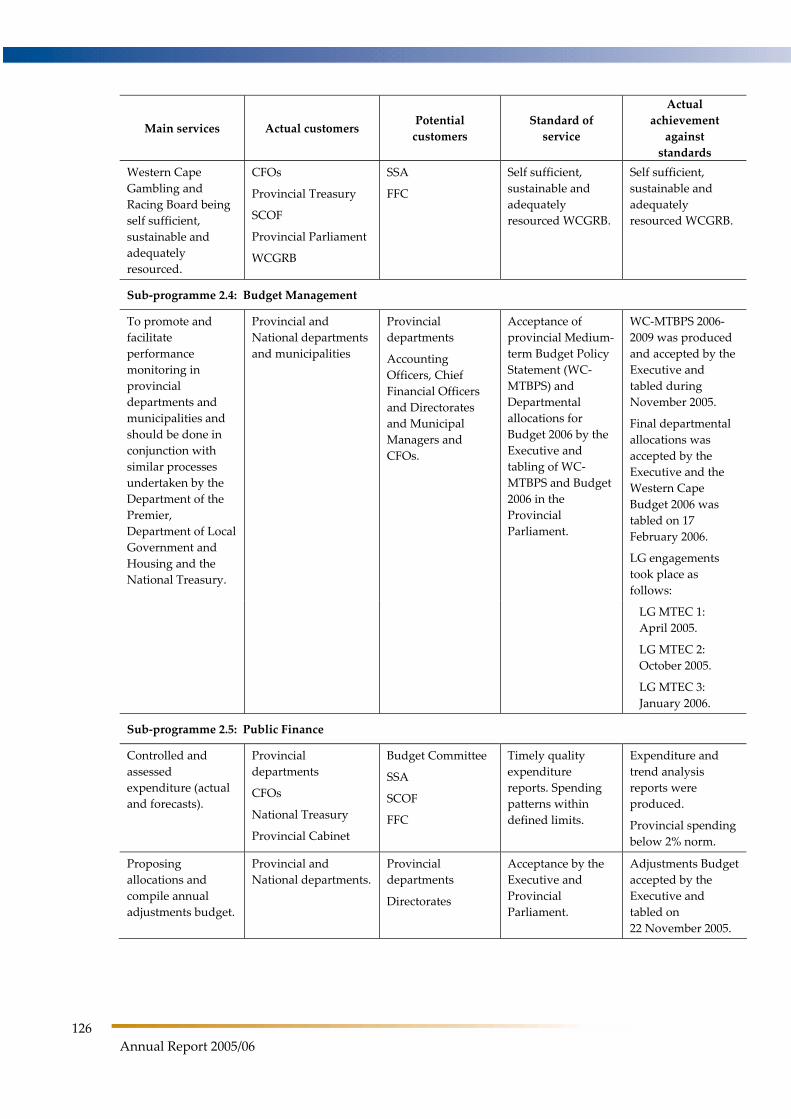
126
Annual Report 2005/06
Main services Actual customers Potential customers
Standard of service
Actual achievement against standards
Western Cape Gambling and Racing Board being self sufficient, sustainable and adequately resourced.
CFOs
Provincial Treasury
SCOF
Provincial Parliament
WCGRB
SSA
FFC
Self sufficient, sustainable and adequately resourced WCGRB.
Self sufficient, sustainable and adequately resourced WCGRB.
Sub‐programme 2.4: Budget Management
To promote and facilitate performance monitoring in provincial departments and municipalities and should be done in conjunction with similar processes undertaken by the Department of the Premier, Department of Local Government and Housing and the National Treasury.
Provincial and National departments and municipalities
Provincial departments
Accounting Officers, Chief Financial Officers and Directorates and Municipal Managers and CFOs.
Acceptance of provincial Medium‐term Budget Policy Statement (WC‐MTBPS) and Departmental allocations for Budget 2006 by the Executive and tabling of WC‐MTBPS and Budget 2006 in the Provincial Parliament.
WC‐MTBPS 2006‐2009 was produced and accepted by the Executive and tabled during November 2005.
Final departmental allocations was accepted by the Executive and the Western Cape Budget 2006 was tabled on 17 February 2006.
LG engagements took place as follows:
LG MTEC 1: April 2005.
LG MTEC 2: October 2005.
LG MTEC 3: January 2006.
Sub‐programme 2.5: Public Finance
Controlled and assessed expenditure (actual and forecasts).
Provincial departments
CFOs
National Treasury
Provincial Cabinet
Budget Committee
SSA
SCOF
FFC
Timely quality expenditure reports. Spending patterns within defined limits.
Expenditure and trend analysis reports were produced.
Provincial spending below 2% norm.
Proposing allocations and compile annual adjustments budget.
Provincial and National departments.
Provincial departments
Directorates
Acceptance by the Executive and Provincial Parliament.
Adjustments Budget accepted by the Executive and tabled on 22 November 2005.

Part 5: Human Resource Management
127
Main services Actual customers Potential customers
Standard of service
Actual achievement against standards
Fulfillment of the Provincial Treasury responsibilities of the Local Government Municipal Finance Management Act, 2003 (Act No 56 of 2003).
National and Provincial Ministers of Finance
Provincial departments
Directorates within Provincial Treasury
National Treasury
Budget Forum
FFC
Other Provinces
Comply with National Treasury requirements.
An appropriate number of posts have been filled to give effect to the National Treasury requirements.
Municipalities
SCOF
Provincial Parliament
Auditor‐General
Develop frameworks for transfer of functions between local and provincial spheres of government.
Provincial departments
Municipalities
SALGA
National Treasury
SCOF
SCOPA
Provincial Cabinet
Budget Forum
FFC
Other Provinces
Alignment and optimal placement of functions between the spheres of government.
Situation paper on each affected function and a report to Cabinet with a five‐phase methodology.
Commenced with the development of a framework.
Publication and managing of allocations from provincial departments to municipalities.
Provincial departments
Municipalities
National Treasury
Provincial Cabinet
SCOF
SCOPA
Budget Forum
FFC
Other Provinces
Ensure the publication of allocations by provincial departments to municipalities by 1 April 2006 in main budget.
LGMTEC 2 engagement with municipalities.
Publication of allocations included in the 2006/07 WCPG Budget.
National and Provincial Ministers of Finance
Ad hoc gazetting of additional allocations from provincial departments to municipalities.
Successful gazetting of allocations to municipalities.
Facilitating and managing of managerial and co‐ordinating intergovernmental structures.
Provincial departments
Municipalities
National Treasury
Budget Forum
FFC
Other Provinces
Establishing coordinating structures to ensure the smooth implementation of the MFMA.
Municipal Chief Financial Officer’s Forum is operational.
A fully functioning MFMA Implementation Unit.
Advise on local government financial issues.
Provincial Minister of Finance
Municipalities
SCOF Provision of sound advice on ad hoc municipal financial matters.
Timeous response to issues as it arises.

128
Annual Report 2005/06
Main services Actual customers Potential customers
Standard of service
Actual achievement against standards
PROGRAMME 3: ASSET AND LIABILITIES MANAGEMENT
Sub‐programme 3.1: Programme Support
Note: Support structures not yet approved hence no comments.
Sub‐programme 3.2: Financial Asset Management
Effective cash flow management of all departmental bank accounts.
Provincial departments
CFOs
Local Government 100% achieved. 100% achieved
Optimising available cash.
Provincial departments
CFOs
Local Government 70% of target market.
100% achieved
Interest amount achieved as appropriated in the budget.
Provincial departments
CFOs
Financial institutions
Liaison commitees 100% achieved. Interest target exceeded
Successful implementation of banking arrangements for the province.
Provincial departments
CFOs
Financial institutions
Liaison commitees Not applicable. Not applicable
Provide functional training according to an approved training schedule.
Provincial departments
CFOs
Local Government 25% of target market.
One‐on‐one training on an ongoing basis.
Nominating staff according to an agreed IDP (Individual development plan).
Directorate’s staff Directorate’s staff 25% 25% of officials attended a learnership course.
Provide functional training according to an approved training programme.
Local Government Local Government 10% Visits to municipalities to ascertain shortcomings.
Effective user support.
Provincial departments
Local Government 100% accessibility and availability of the helpdesk on a daily basis.
100% accessibility.
Credible cash flow projections.
Provincial departments
CFOs
National Treasury
Local Government 100% timeous submission and not more than 10% deviation in projections vs. transfers.
100% achieved

Part 5: Human Resource Management
129
Main services Actual customers Potential customers
Standard of service
Actual achievement against standards
Effective cash flow management at municipalities.
Local Government Provincial departments
CFOs
100% compliance Assessment of draft budgets before tabling.
Sub‐programme 3.2: Movable Assets
Develop and implement Provincial Treasury instructions and guidelines to ensure effective supply chain management of goods and services.
Provincial departments
Businesses
Local Government
Liaison
Committees
Forums
NGOs
A modernised and practical supply chain management system to promote economic development and improve efficiency.
Facilitation and management of 3 transversal contracts.
Percentage of departments assessed: 30% on Education and Transport and Public Works.
Reports on renewal of EPS and WCSD.
Number of officials knowledgeable in prescripts:
Provincial departments
Local Government
Liaison
Committees
Forums
NGOs
Capacitate/co‐ordinate training/re‐training of officials.
100 % of target achieved for financial year.
Monitor compliance with legislative framework.
Provincial departments
Provincial Departments
Compliance to prescripts.
Compliance testing at 5 departments completed.
Local Government Liaison
Committees
Forums
NGOs
Successful implementation of MFMA roll‐out of SCM in municipalities.
Number of vacancies filled: 3 posts filled.
Number of SCM units in municipalities and municipal entities established with the percentage of set criteria: 15 units met 25% of criteria.
SCM implemented in 20 municipalities.
Percentage of target population trained: 20% of target population trained.

130
Annual Report 2005/06
Main services Actual customers Potential customers
Standard of service
Actual achievement against standards
Number of municipalities having access to WCSD:
Implementation of WCSD in 5 municipalities.
Sub‐programme 3.2: Immovable Assets
Facilitate, promote and in liaison with accounting officers implement public private partnership initiatives.
Provincial departments
Private sector
Public entities
Liaison Committees Appropriate risk transfer to private sector.
Established PPP unit in the Provincial Treasury.
Sub‐programme 3.3: Liabilities Management
Note: The liabilities unit was not functional during 2005/06.
Sub‐programme 3.4: Supporting and Interlinked Financial Systems
Acceptance by the Executive and the National Treasury of a policy framework dealing with the evolvement and deployment of financial systems utilization of LOGIS in all provincial departments.
Provincial departments
CFOs
National Treasury
Local Government 100% compliance Phase 2 of the project successfully completed.
The availability of up to date management information.
Provincial departments
CFOs
Local Government 100% completion of the application to all 14 Head Office components of departments as well as 40 Regional/ District offices.
85% completion of the application to all 14 Head Office components of departments as well as 40 Regional/ District offices.
All Western Cape user requirements accommodated and tested prior to implementation.
Provincial departments
CFOs
National Treasury
Local Government On completion of phase 2 of the project, proceed with the planning, development and testing phases of the project.
Not applicable.

Part 5: Human Resource Management
131
Main services Actual customers Potential customers
Standard of service
Actual achievement against standards
Successful and smooth migration from the current to the new IFMS.
Provincial departments
CFOs
National Treasury
Local Government Not applicable. Not applicable.
Ensure availability of the systems and information.
Provincial departments
CFOs
National Treasury
SITA
Local Government 95% uptime. 98% uptime.
User requirements timeously addressed.
Provincial departments
CFOs
National Treasury
Local Government All user requirements submitted to National Treasury and rolled out within 2 weeks after release.
100% achieved.
Ensure effective user support to all users.
Provincial departments
CFOs
National Treasury
Local Government 100% accessibility and availability of the helpdesk on a daily basis.
100% achieved.
Provide functional financial training according to an approved training programme and in the case of BAS, PERSAL, Vulindlela and LOGIS according to the project plans.
Provincial departments
CFOs
National Treasury
Local Government 70% of target market.
70% of target market achieved.
Optimal management of cost drivers of all State Information Technology Agency (SITA) accounts to stay within budget.
Provincial departments
CFOs
National Treasury
SITA
Local Government No more than 2% deviation between actual expenditure and approved budget.
Deviation of less than 2% achieved.
PROGRAMME 4: FINANCIAL GOVERNANCE
Sub‐programme 4.1: Programme Support
Rendering administrative support services to ensure the effective operational management of the unit.
Provincial Treasury
All other customers indicated by the various directorates within Financial Governance.
Provincial Treasury
All other customers indicated by the various directorates within Financial Governance.
Smooth and effective functioning of the component.
100% compliance.
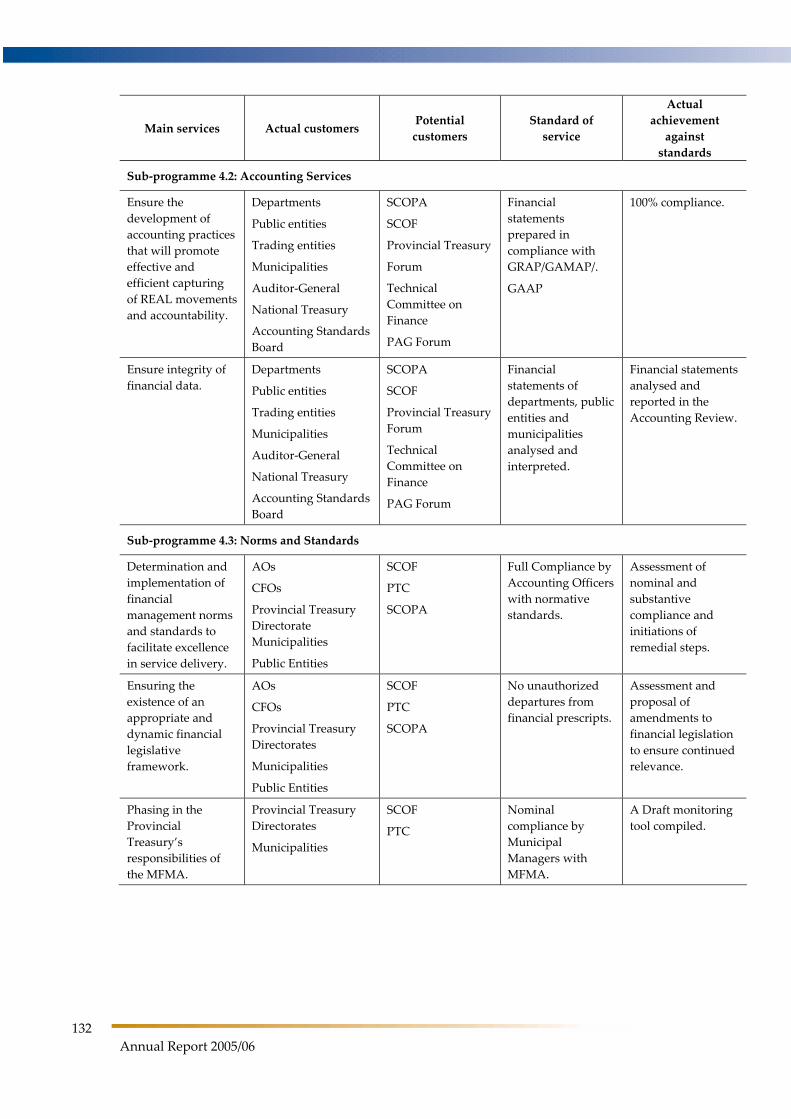
132
Annual Report 2005/06
Main services Actual customers Potential customers
Standard of service
Actual achievement against standards
Sub‐programme 4.2: Accounting Services
Ensure the development of accounting practices that will promote effective and efficient capturing of REAL movements and accountability.
Departments
Public entities
Trading entities
Municipalities
Auditor‐General
National Treasury
Accounting Standards Board
SCOPA
SCOF
Provincial Treasury
Forum
Technical Committee on Finance
PAG Forum
Financial statements prepared in compliance with GRAP/GAMAP/.
GAAP
100% compliance.
Ensure integrity of financial data.
Departments
Public entities
Trading entities
Municipalities
Auditor‐General
National Treasury
Accounting Standards Board
SCOPA
SCOF
Provincial Treasury Forum
Technical Committee on Finance
PAG Forum
Financial statements of departments, public entities and municipalities analysed and interpreted.
Financial statements analysed and reported in the Accounting Review.
Sub‐programme 4.3: Norms and Standards
Determination and implementation of financial management norms and standards to facilitate excellence in service delivery.
AOs
CFOs
Provincial Treasury Directorate Municipalities
Public Entities
SCOF
PTC
SCOPA
Full Compliance by Accounting Officers with normative standards.
Assessment of nominal and substantive compliance and initiations of remedial steps.
Ensuring the existence of an appropriate and dynamic financial legislative framework.
AOs
CFOs
Provincial Treasury Directorates
Municipalities
Public Entities
SCOF
PTC
SCOPA
No unauthorized departures from financial prescripts.
Assessment and proposal of amendments to financial legislation to ensure continued relevance.
Phasing in the Provincial Treasury’s responsibilities of the MFMA.
Provincial Treasury Directorates
Municipalities
SCOF
PTC
Nominal compliance by Municipal Managers with MFMA.
A Draft monitoring tool compiled.

Part 5: Human Resource Management
133
Main services Actual customers Potential customers
Standard of service
Actual achievement against standards
Sub‐programme 4.4: Risk Management
To develop and facilitate the implementation of effective risk management (RM) and governance capacity within Provincial Government.
Provincial Treasury
Departments
National departments
SCOF
To facilitate the establishment of risk management capacity and financial governance systems in the Provincial Government.
All departments with approved structures.
Sub‐programme 4.5: Provincial Internal Audit
To deliver an effective internal audit service to all Provincial Departments.
AOs, CFOs, Auditor General, Forensic Investigative Unit, Audit Committees
National departments, SCOF, SCOPA
To deliver and effective internal audit service to all Provincial Departments.
A central co‐sourced Internal Audit unit is operational. An internal audit service was provided to all Provincial Departments.
Table 1.2: Consultation arrangements with customers
Type of arrangement Actual customers Potential customers Actual achievements
Technical Committee on Finance.
National Treasury Other provinces Re‐structured committee that also focuses on accounting issues.
Provincial Accountant General’s Forum.
National Treasury Other provinces Transversal accounting issues raised and resolved.
Auditor‐General Forum. Provincial Auditor Provincial departments Accounting and financial reporting issues raised and resolved. Limiting duplication audit effort.
Chief Financial Officer’s
Forum (PFMA and MFMA)
Departments and Municipalities Public and Municipal entities.
Financial Management and audit issues raised and resolved.
Financial Accountant’s Forum. Departments Public Entities Financial accounting issues raised and resolved.
Provincial Treasury Forum. All Provincial Treasury departments
All Provincial Treasury Departments
Improve Financial Management.

134
Annual Report 2005/06
Type of arrangement Actual customers Potential customers Actual achievements
Risk Management Forum National Treasury All other provinces Transversal risk management issues raised and resolved.
MFMA Sub‐Committee Auditor‐General, Internal Audit and Risk Management
MFMA implementation and related matters.
Auditor‐General Forum Provincial Auditor Provincial departments Limiting duplication audit effort.
Departmental Project Team Meeting
Provincial departments Provincial departments Maintain relationship and progress reports to audit clients.
Chief Audit Executives Forum National Treasury Other provinces Transversal audit issues raised and resolved.
Audit Committee Meetings Audit Committees Audit Committees Progress in execution of audit plans and reporting audit issues to the committee.
CFO Forum meetings Provincial departments Municipalities
Forums utilized effectively.
Formal and informal meetings Provincial departments Municipalities
Effective consultation regarding spending issues.
Quarterly Cabinet reports Cabinet Complied
MFMA implementation unit Municipalities National Treasury Provincial departments SCOF
Cabinet
Other provinces
Established and operational.
Movable Assets Management ‐ SCM Office (PT)
National Treasury Provincial departments
SCOF Local Government
Cabinet Other provinces
Established and operational.
Table 1.3: Service delivery access strategy
Access strategy Actual achievements
Helpdesk function: Compilation of financial statements Timeous submission of financial statements by departments and public entities.
Helpdesk function: Standard Chart of Accounts All requests for new items finalized.
Supplier database Population of database with verified suppliers (9766).
Non‐compliance mechanism Implementation of corrective measures.

Part 5: Human Resource Management
135
Table 1.4: Service delivery access strategy
Types of information tool Actual achievements
PT Website Updated regularly.
Provincial and municipal In‐year Monitoring (IYM) reports Monthly and quarterly.
Database of spending trends Updated regularly.
Municipal quarterly return forms Quarterly.
Electronic Purchasing System 65 535 quotations were obtained.
Western Cape Supplier Database 9 766 suppliers were registered.

136
Annual Report 2005/06
Table 1.5: Complaints mechanism
The following flow‐chart indicates 4 possible ways through which the Public could direct their complaints regarding tender procedures and practises within the Western Cape Provincial Government.
1 2 3
4
TELEPHONIC COMPLAINTS
APPLICABLE OR DEPARTMENTS
ASK TO PUT COMPLAINT IN WRITING (DO
WE NEED COMMENTS
FROM DEPARTMENTS)
INVESTIGATE COMPLAINT
COMPILE A SUITABLE REPLY
SUBMIT REFERENCE TO
COMPLAINER
REFER COMPLAINTS TO DEPARTMENTS
REQUEST COMMENTS
FROM DEPARTMENT
DIRECT COMPLAINT FROM PUBLIC
(APPLICABLE ON DEPARTMENTS)
COMPLAINT VIA MINISTERS
OFFICE (APPLICABLE
ON DEPARTMENTS)
INVESTIGATE COMPLAINT
DRAFT A REPLY UPON RECEIPT OF COMMENTS
COMPILE DRAFT FOR MINISTER'S
SIGNATURE
SUBMIT TO COMPLAINER
REFER TO MINISTER'S OFFICE FOR DISPATCH
COMPLAINER COMES TO OFFICE TO DISCUSS
COMPLAINT (DO WE NEED TO
INVESTIGATE)
SOLVE COMPLAINT
PROPERLY AT MEETING
MAKE CONTACT
WITH RELEVANT
ROLEPLAYERS
OBTAIN INPUT
COMPILE RESPONSE OR
SET UP MEETING TO DISCUSS OR
PROVIDE FURTHER CLARITY
SOLVE COMPLAINT/
PROBLEM
YES
NO
NO NO
YE
S
YE
S
YES
NO
NO
YES
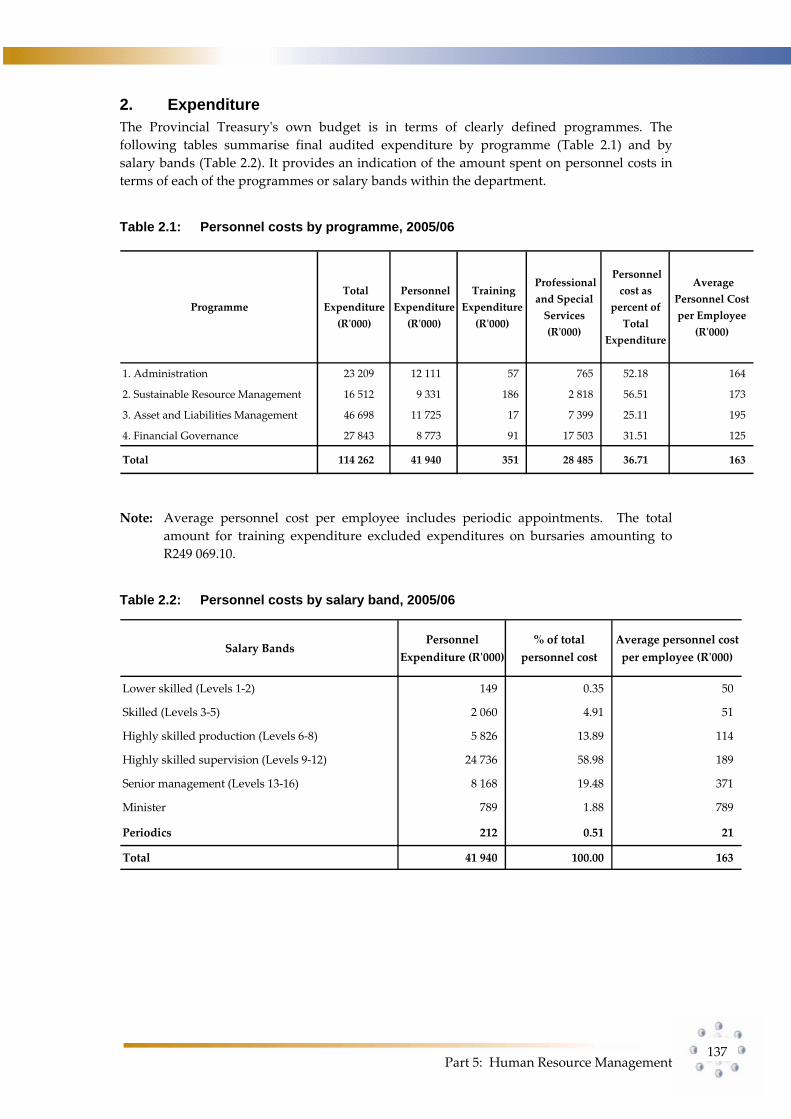
Part 5: Human Resource Management
137
2. Expenditure The Provincial Treasuryʹs own budget is in terms of clearly defined programmes. The following tables summarise final audited expenditure by programme (Table 2.1) and by salary bands (Table 2.2). It provides an indication of the amount spent on personnel costs in terms of each of the programmes or salary bands within the department.
Table 2.1: Personnel costs by programme, 2005/06
Programme Total
Expenditure (Rʹ000)
Personnel Expenditure (Rʹ000)
Training Expenditure (Rʹ000)
Professional and Special Services (Rʹ000)
Personnel cost as
percent of Total
Expenditure
Average Personnel Cost per Employee
(Rʹ000)
1. Administration 23 209 12 111 57 765 52.18 164
2. Sustainable Resource Management 16 512 9 331 186 2 818 56.51 173
3. Asset and Liabilities Management 46 698 11 725 17 7 399 25.11 195
4. Financial Governance 27 843 8 773 91 17 503 31.51 125
Total 114 262 41 940 351 28 485 36.71 163
Note: Average personnel cost per employee includes periodic appointments. The total amount for training expenditure excluded expenditures on bursaries amounting to R249 069.10.
Table 2.2: Personnel costs by salary band, 2005/06
Salary BandsPersonnel
Expenditure (Rʹ000)% of total
personnel costAverage personnel cost per employee (Rʹ000)
Lower skilled (Levels 1‐2) 149 0.35 50
Skilled (Levels 3‐5) 2 060 4.91 51
Highly skilled production (Levels 6‐8) 5 826 13.89 114
Highly skilled supervision (Levels 9‐12) 24 736 58.98 189
Senior management (Levels 13‐16) 8 168 19.48 371
Minister 789 1.88 789
Periodics 212 0.51 21
Total 41 940 100.00 163

138
Annual Report 2005/06
Note: The following tables provide a summary per programme (Table 2.3) and salary bands (Table 2.4), of expenditure incurred as a result of salaries, overtime, home owners allowance and medical assistance. In each case, the table provides an indication of the percentage of the personnel budget that was used for these items.
Table 2.3: Salaries, Overtime, Home Owners Allowance and Medical Assistance by
programme, 2005/06
Amount (Rʹ000)
Salaries as a % of
personnel cost
Amount (Rʹ000)
Overtime as a % of personnel cost
Amount (Rʹ000)
HOA as a % of
personnel cost
Amount (Rʹ000)
Medical Assistance as a % of personnel cost
1. Administration 8 044 698 66.42 111 202 0.92 89 100 0.74 418 398 3.45
2. Sustainable Resource Management 6 579 235 70.51 176 368 1.89 76 052 0.82 336 630 3.61
3. Asset and Liabilities Management 8 629 928 73.60 ‐ ‐ 109 995 0.94 502 473 4.29
4. Financial Governance 6 095 188 69.48 12 786 0.15 65 344 0.74 344 624 3.93
Total 29 349 049 69.98 300 356 0.72 340 491 0.81 1 602 125 3.82
Medical Assistance
Programme
Salaries OvertimeHome Owners
Allowance (HOA)
Note: Brief motivations in respect of overtime in excess of R60 000.
Programme 1: The main reason for the overtime was to compile the Annual Financial Statements, the Annual Report and Adjustments Estimates and Budget for Treasury itself.
Programme 2: The reason for the overtime is that the Directorate had to meet the due dates set for the effective and efficient completion of the budgetary process, achieving associated goals, related matters and ad hoc instructions. Further the overtime within this programme is cyclic of nature and is mostly concentrated in January/February (when finalising the main budget), November (when finalising the adjustment budget) or due to specific processes (e.g. preparing for the Local Government cooperative summit).

Part 5: Human Resource Management
139
Table 2.4: Salaries, Overtime, Home Owners Allowance and Medical Assistance by salary band, 2005/06
Amount (Rʹ000)
Salaries as a % of personnel
cost
Amount (Rʹ000)
Overtime as a % of
personnel cost
Amount (Rʹ000)
HOA as a % of
personnel cost
Amount (Rʹ000)
Medical Assistance as
a % of personnel cost
Lower skilled (Levels 1‐2)
115 031 77.28 ‐ ‐ 5 614 3.77 ‐ 0.00
Skilled (Levels 3‐5)
1 519 860 73.79 25 059 1.22 31 984 1.55 78 182 3.80
Highly skilled production (Levels 6‐8)
4 241 694 72.81 74 198 1.27 79 748 1.37 306 487 5.26
Highly skilled supervision (Levels 9‐12)
18 262 529 73.83 201 099 0.81 222 771 0.90 929 308 3.76
Senior management (Levels 13‐16)
4 665 812 57.12 ‐ 0.00 374 0.00 272 910 3.34
Minister 544 123 68.93 ‐ 0.00 ‐ 0.00 15 237 1.93
Total 29 349 049 69.98 300 356 0.72 340 491 0.81 1 602 125 3.82
Medical Assistance
Salary band
Salaries OvertimeHome Owners
Allowance (HOA)
3. Employment and Vacancies The following tables summarise the number of posts on the establishment, the number of employees, the vacancy rate, and whether there are any staff that are additional to the establishment. This information is presented in terms of three key variables:‐ programme (Table 3.1), salary band (Table 3.2) and critical occupations (Table 3.3). Table 3.3 provides the establishment and vacancy information for the key critical occupations of the Provincial Treasury that require monitoring. The vacancy rate reflects the percentage of posts that are not filled.
Table 3.1: Employment and vacancies by programme, 31 March 2006
Programme Number of postsNumber of posts
filledVacancy Rate %
Number of posts filled additional to the establishment
1. Administration 64 54 16 ‐
2. Sustainable Resource Management 79 61 23 ‐
3. Asset and Liabilities Management 93 46 51 ‐
4. Financial Governance 74 50 32 ‐
Total 310 211 32 ‐

140
Annual Report 2005/06
Table 3.2: Employment and vacancies by salary bands, 31 March 2006
Salary band Number of postsNumber of posts
filledVacancy Rate
%
Number of posts filled additional to the establishment
Lower skilled (Levels 1‐2) 3 3 ‐ ‐
Skilled (Levels 3‐5) 41 32 22 ‐
Highly skilled production (Levels 6‐8)
55 45 18 ‐
Highly skilled supervision (Levels 9‐12)
189 112 41 ‐
Senior management (Levels 13‐16)
21 18 14 ‐
Minister 1 1 ‐ ‐ Total 310 211 32 ‐
Table 3.3: Employment and vacancies by critical occupation, 31 March 2006
Critical Occupation Number of postsNumber of posts
filledVacancy Rate
%
Number of posts filled additional to the establishment
Economist 22 9 59 ‐
Expenditure Analyst 8 6 25 ‐
Financial Analyst 11 10 9 ‐
Procurement Specialist 8 6 25 ‐
State Accountant Senior 1 1 ‐ ‐
System Controller 31 20 35 ‐
Total 81 52 36 ‐
The information in each case reflects the situation as at 31 March 2006. For an indication of changes in staffing patterns over the year under review, please refer to Table 5 of the Oversight Report.
4. Job Evaluation The Public Service Regulations, 1999 introduced job evaluation as a way of ensuring that work of equal value is remunerated equally. Within a nationally determined framework, executing authorities may evaluate or re‐evaluate any job in his or her organisation. In terms of the Regulations all vacancies on salary levels 9 and higher must be evaluated before they are filled. This was complemented by a decision by the Minister for the Public Service and Administration that all SMS jobs must be evaluated before 31 December 2002.

Part 5: Human Resource Management
141
Table 4.1: Job Evaluation, 1 April 2005 to 31 March 2006
Number% of posts evaluated
Number % of posts evaluated
Lower skilled (Levels 1‐2) 3 ‐ ‐ ‐ ‐ ‐ ‐
Skilled (Levels 3‐5) 41 3 7 2 66.70 ‐ ‐
Highly skilled production (Levels 6‐8)
55 8 15 1 12.50 ‐ ‐
Highly skilled supervision (Levels 9‐12)
189 9 5 1 11.10 ‐ ‐
Senior Management Service Band A
16 1 6 ‐ ‐ ‐ ‐
Senior Management Service Band B
4 ‐ ‐ ‐ ‐ ‐ ‐
Senior Management Service Band C
‐ ‐ ‐ ‐ ‐ ‐ ‐
Senior Management Service Band D
1 ‐ ‐ ‐ ‐ ‐ ‐
Premier 1 ‐ ‐ ‐ ‐ ‐ ‐
Total 310 21 7 4 19.00 ‐ ‐
Posts upgraded Posts downgradedSalary band
Number of posts
Number of Jobs
evaluated
% of posts evaluated by salary bands
Table 4.2: Profile of employees whose salary positions were upgraded due to their
posts being upgraded, 1 April 2005 to 31 March 2006
Beneficiaries African Asian Coloured White Total
Female 1 ‐ 1 1 3
Male ‐ ‐ 1 ‐ 1
Total 1 ‐ 2 1 4
Employees with a disability ‐ ‐ ‐ ‐ ‐

142
Annual Report 2005/06
The following table summarises the number of cases where remuneration levels exceeded the grade determined by job evaluation. Reasons for the deviation are provided in each case. Table 4.3: Employees whose salary level exceeded the grade determined by job
evaluation, 1 April 2005 to 31 March 2006 (in terms of PSR 1.V.C.3)
OccupationNumber of employees
Job evaluation level
Remuneration level
Reason for deviation
‐ ‐ ‐ ‐ ‐
‐
Percentage of total employment ‐
Total Number of Employees whose salaries exceed the level determined by job evaluation in 2005/06
Table 4.4: Profile of employees whose salary level exceed the grade determined by job evaluation, 1 April 2005 to 31 March 2006 (in terms of PSR 1.V.C.3)
Beneficiaries African Asian Coloured White Total
Female ‐ ‐ ‐ ‐ ‐
Male ‐ ‐ ‐ ‐ ‐
Total ‐ ‐ ‐ ‐ ‐
Employees with a disability ‐ ‐ ‐ ‐ ‐
‐ Total Number of Employees whose salaries exceed the grades determined by job evaluation in 2005/06

Part 5: Human Resource Management
143
5. Employment Changes This section provides information on changes in employment over the financial year.
Turnover rates provide an indication of trends in the employment profile of the Provincial Treasury. The following tables provide a summary of turnover rates by salary band (Table 5.1) critical occupations (Table 5.2), reasons for leaving the department (Table 5.3), promotion by critical occupation (Table 5.4) and promotion by salary band (Table 5.5).
Table 5.1: Annual turnover rates by salary band for the period 1 April 2005 to 31 March
2006
Salary bandNumber of employees per band as on 1 April
2005
Appointments and transfers into the Department
Terminations and transfers out of the
departmentTurnover Rate %
Lower skilled (Levels 1‐2), Permanent
4 6 6 150
Skilled (Levels 3‐5), Permanent
34 31 20 59
Highly skilled production (Levels 6‐8), Permanent
37 25 8 22
Highly skilled supervision (Levels 9‐12), Permanent
94 36 17 18
Senior Management Service Band A, Permanent
6 9 2 33
Senior Management Service Band B, Permanent
3 2 1 33
Senior Management Service Band C, Permanent
1 ‐ ‐ ‐
Senior Management Service Band B, Permanent
1 ‐ ‐ ‐
Minister 1 ‐ ‐ ‐
Total 181 109 54 30
Note: Officials are appointed on contract for a fixed period and this is registered on Persal (Electronic Salary System). Once a contract expires, Persal registers a termination. Should the contract be renewed, Persal would register a new appointment. This means that although one person was contracted with regular renewals to his/her contract, Persal will register a termination and a new appointment, with each renewal. Thus the discrepancy between the number of employees per band and the number or employees appointed and the number of appointments terminated.

144
Annual Report 2005/06
Table 5.2: Annual turnover rates by critical occupation for the period 1 April 2005 to 31 March 2006
OccupationNumber of employees per occupation as on
1 April 2005
Appointments and transfers into the department
Terminations and transfers out of the
department
Turnover rate %
Economist 9 4 5 55.56
Expenditure Analyst 6 1 ‐ ‐
Financial Analyst 10 5 ‐ ‐
Procurement Specialist 6 3 1 16.67
State Accountant Senior 1 3 ‐ ‐
System Controller 20 5 1 5.00
Total 52 21 7 13.46
Table 5.3: Reasons why staff are leaving Treasury
Termination Type Number % of total
Transfer to other PS Dept 14 25.93
Resignating of Position 15 27.78
SEC 16(6)(A) PUBLIC SERVICE 1 1.85
Contract Expiry 24 44.44
Total 54 100.00
29.83 Total number of employees who left as a % of the total employment

Part 5: Human Resource Management
145
Table 5.4: Promotions by critical occupation
OccupationEmployees as at 1 April 2005
Promotions to another salary level
Salary level promotions as
a % of employees by occupation
Progressions to another notch within a salary
level
Notch progressions as a % of employees by occupation
Economist 10 2 20.00 3 30.00
Expenditure Analyst 8 1 12.50 5 62.50
Financial Analyst 7 1 14.29 3 42.86
Procurement Specialist 6 ‐ ‐ 4 66.67
State Accountant Senior 2 ‐ ‐ ‐ ‐
System Controller 21 ‐ ‐ 2 9.52
Total 54 4 7.41 17 31.48
Table 5.5: Promotions by salary band
Salary bandEmployees as at
1 April 2005
Promotions to another salary
level
Salary bands promotions as a % of employees by salary level
Progressions to another notch within a salary
level
Notch progressions as a % of employees by salary band
Lower skilled (level 1‐2) 4 ‐ ‐ 3 75.00
Skilled (level 3‐5) 34 ‐ ‐ 15 44.10
Highly Skilled production (level 6‐8)
37 5 13.51 14 37.84
Highly Skilled supervision (level 9‐12)
94 20 21.28 39 41.49
Senior Management (level 13‐16)
11 2 18.18 3 27.27
Minister 1 ‐ ‐ ‐ ‐
Total 181 27 14.92 74 40.88

146
Annual Report 2005/06
6. Employment Equity The tables in this section are based on the formats prescribed by the Employment Equity Act, 55 of 1998. Table 6.1: Total number of employees in each of the following occupational
categories as on 31 March 2006
African Coloured Indian White African Coloured Indian White
Legislators, senior officials and managers
1 4 3 4 2 1 ‐ 1 16
Professionals 20 21 1 25 15 24 2 10 118
Technicians and Associate Professionals
4 5 ‐ 3 2 3 ‐ 1 18
Clerks 4 11 ‐ 1 9 17 ‐ 12 54
Plant and machine operators and assemblers
‐ 2 ‐ ‐ ‐ ‐ ‐ ‐ 2
Labourers and Related Workers
‐ 1 ‐ ‐ ‐ 2 ‐ ‐ 3
Total 29 44 4 33 28 47 2 24 211
Employees with disabilities
‐ ‐ ‐ 1 ‐ ‐ ‐ ‐ 1
Occupational Categories (SASCO)
Male FemaleTotal

Part 5: Human Resource Management
147
Table 6.2: Total number of employees (including employees with disabilities) in each of the following occupational bands as on 31 March 2006
African Coloured Indian White African Coloured Indian White
Top Management (includes MEC)
‐ ‐ ‐ 1 ‐ 1 ‐ ‐ 2
Senior Management 1 5 3 3 2 2 ‐ 1 17
Professionally qualified and experienced specialists and mid‐management
17 22 1 26 13 22 2 9 112
Skilled technical and academically qualified workers, junior management, supervisors, foremen
9 9 ‐ 3 6 7 ‐ 11 45
Semi‐skilled and discretionary decision making
2 7 ‐ ‐ 7 13 ‐ 3 32
Unskilled and defined decision making
‐ 1 ‐ ‐ ‐ 2 ‐ ‐ 3
Total 29 44 4 33 28 47 2 24 211
Employees with disabilities
‐ ‐ ‐ 1 ‐ ‐ ‐ ‐ 1
Occupational BandsMale Female
Total

148
Annual Report 2005/06
Table 6.3: Recruitment for the period 1 April 2005 to 31 March 2006
African Coloured Indian White African Coloured Indian White
Top Management ‐ ‐ ‐ ‐ ‐ ‐ ‐ ‐ ‐
Senior Management 1 1 1 ‐ 2 1 ‐ ‐ 6
Professionally qualified and experienced specialists and mid‐management
8 3 ‐ ‐ 7 5 1 ‐ 24
Skilled technical and academically qualified workers, junior management, supervisors, foremen
6 2 ‐ ‐ 4 1 ‐ ‐ 13
Semi‐skilled and discretionary decision making
2 6 ‐ ‐ 9 8 ‐ ‐ 25
Unskilled and defined decision making
2 1 ‐ ‐ 2 1 ‐ ‐ 6
Total 19 13 1 ‐ 24 16 1 ‐ 74
Employees with disabilities
‐ ‐ ‐ 1 ‐ ‐ ‐ ‐ 1
Occupational BandsMale Female
Total
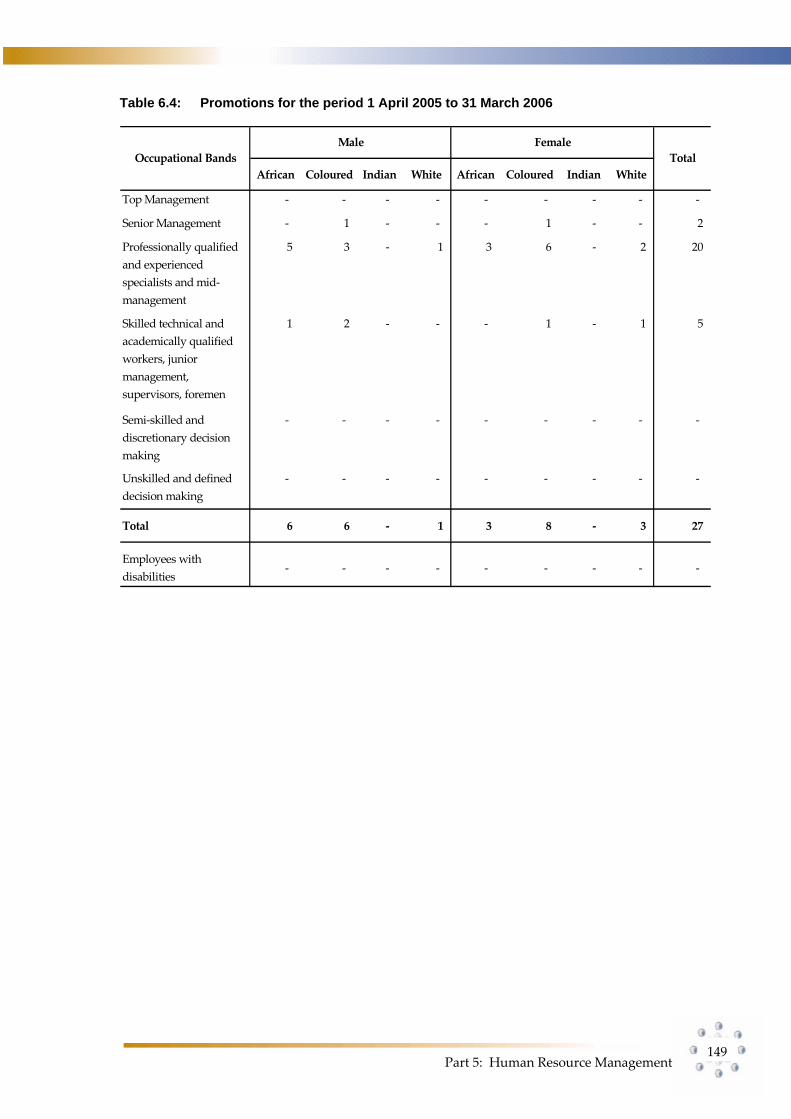
Part 5: Human Resource Management
149
Table 6.4: Promotions for the period 1 April 2005 to 31 March 2006
African Coloured Indian White African Coloured Indian White
Top Management ‐ ‐ ‐ ‐ ‐ ‐ ‐ ‐ ‐
Senior Management ‐ 1 ‐ ‐ ‐ 1 ‐ ‐ 2
Professionally qualified and experienced specialists and mid‐management
5 3 ‐ 1 3 6 ‐ 2 20
Skilled technical and academically qualified workers, junior management, supervisors, foremen
1 2 ‐ ‐ ‐ 1 ‐ 1 5
Semi‐skilled and discretionary decision making
‐ ‐ ‐ ‐ ‐ ‐ ‐ ‐ ‐
Unskilled and defined decision making
‐ ‐ ‐ ‐ ‐ ‐ ‐ ‐ ‐
Total 6 6 ‐ 1 3 8 ‐ 3 27
Employees with disabilities
‐ ‐ ‐ ‐ ‐ ‐ ‐ ‐ ‐
Occupational BandsMale Female
Total
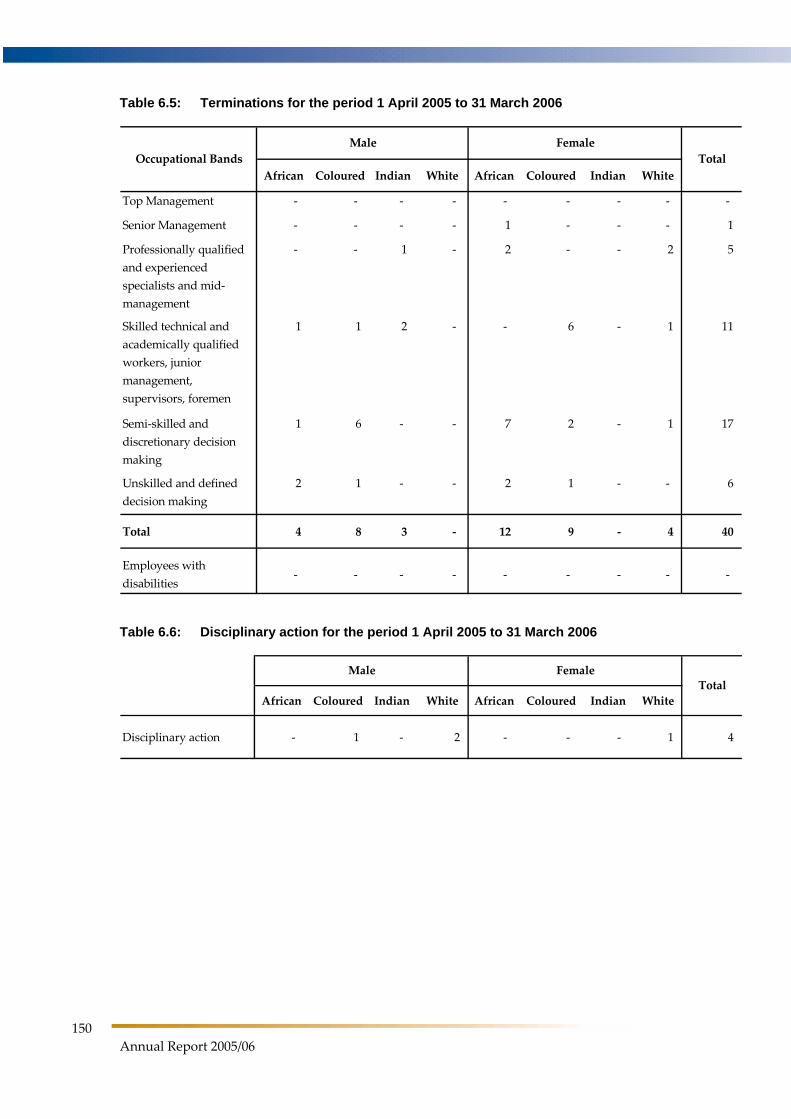
150
Annual Report 2005/06
Table 6.5: Terminations for the period 1 April 2005 to 31 March 2006
African Coloured Indian White African Coloured Indian White
Top Management ‐ ‐ ‐ ‐ ‐ ‐ ‐ ‐ ‐
Senior Management ‐ ‐ ‐ ‐ 1 ‐ ‐ ‐ 1
Professionally qualified and experienced specialists and mid‐management
‐ ‐ 1 ‐ 2 ‐ ‐ 2 5
Skilled technical and academically qualified workers, junior management, supervisors, foremen
1 1 2 ‐ ‐ 6 ‐ 1 11
Semi‐skilled and discretionary decision making
1 6 ‐ ‐ 7 2 ‐ 1 17
Unskilled and defined decision making
2 1 ‐ ‐ 2 1 ‐ ‐ 6
Total 4 8 3 ‐ 12 9 ‐ 4 40
Employees with disabilities
‐ ‐ ‐ ‐ ‐ ‐ ‐ ‐ ‐
Occupational BandsMale Female
Total
Table 6.6: Disciplinary action for the period 1 April 2005 to 31 March 2006
African Coloured Indian White African Coloured Indian White
Disciplinary action ‐ 1 ‐ 2 ‐ ‐ ‐ 1 4
Male FemaleTotal
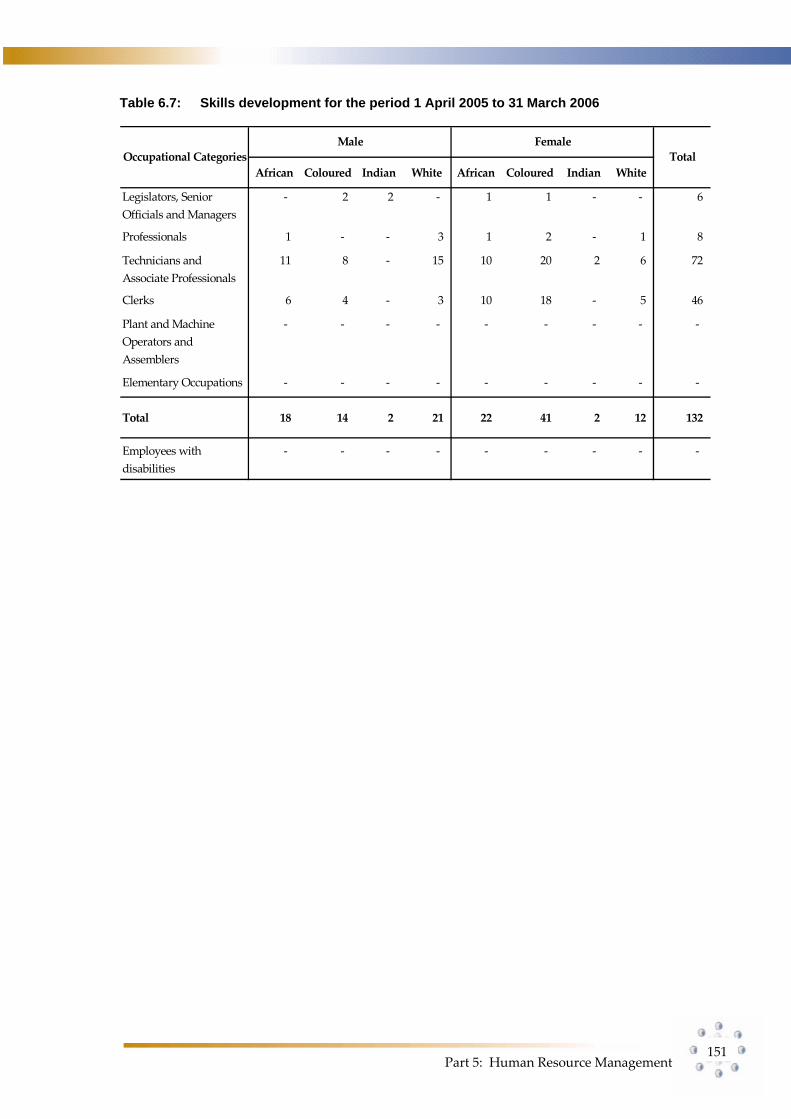
Part 5: Human Resource Management
151
Table 6.7: Skills development for the period 1 April 2005 to 31 March 2006
African Coloured Indian White African Coloured Indian White
Legislators, Senior Officials and Managers
‐ 2 2 ‐ 1 1 ‐ ‐ 6
Professionals 1 ‐ ‐ 3 1 2 ‐ 1 8
Technicians and Associate Professionals
11 8 ‐ 15 10 20 2 6 72
Clerks 6 4 ‐ 3 10 18 ‐ 5 46
Plant and Machine Operators and Assemblers
‐ ‐ ‐ ‐ ‐ ‐ ‐ ‐ ‐
Elementary Occupations ‐ ‐ ‐ ‐ ‐ ‐ ‐ ‐ ‐
Total 18 14 2 21 22 41 2 12 132
Employees with disabilities
‐ ‐ ‐ ‐ ‐ ‐ ‐ ‐ ‐
Occupational CategoriesMale Female
Total

152
Annual Report 2005/06
7. Performance Rewards To encourage good performance, the department has granted the following performance rewards during the year under review. The information is presented in terms of race, gender, and disability (Table 7.1), salary bands (table 7.2) and critical occupations (Table 7.3). Table 7.1: Performance Rewards by race, gender and disability, 1 April 2005 to
31 March 2006
Number of beneficiaries
Total number of employees in group as at 31 March 2006
% of total within group
Cost(Rʹ000)
Average cost per employee(Rʹ000)
African 7 57 12.28 37 5.37
Male 1 29 3.45 4 4.15
Female 6 28 21.43 33 5.57
Asian 1 6 16.67 14 13.80
Male 1 4 25.00 14 13.80
Female ‐ 2 ‐ ‐ ‐
Coloured 36 91 39.56 275 7.63
Male 21 44 47.73 159 7.56
Female 15 47 31.91 116 7.73
White 37 57 64.91 384 10.38
Male 23 33 69.70 287 12.48
Female 14 24 58.33 97 6.92
Total 81 211 38.39 710 8.77
Beneficiary Profile Cost
Race, gender and disability
Table 7.2: Performance Rewards by salary bands for personnel below Senior
Management Service, 1 April 2005 to 31 March 2006
Number of Beneficiaries
Number of employees
% of total within salary
bands
Total Cost(Rʹ000)
Average cost per
employee(Rʹ000)
Total cost as a % of the total personnel expenditure
Lower skilled (Levels 1‐2) 2 3 66.70 3 1 1.73
Skilled (Levels 3‐5) 14 32 43.80 47 3 2.31
Highly skilled production (Levels 6‐8) 19 45 42.20 107 6 1.85
Highly skilled supervision (Levels 9‐12) 39 112 34.80 422 11 1.71
Total 74 192 38.50 579 8 1.38
Salary Bands
Beneficiay Profile Cost

Part 5: Human Resource Management
153
Table 7.3: Performance Rewards by critical occupations, 1 April 2005 to 31 March 2006
Number of beneficiaries
Number of employees
% of total within occupation
Total Cost(Rʹ000)
Average cost per employee(Rʹ000)
Economist 2 9 22.20 14 7.24
Expenditure Analyst 3 6 50.00 30 9.91
Financial Analyst 2 10 20.00 27 13.35
Procurement Specialist 2 6 6.00 20 10.21
State Accountant Senior ‐ 1 ‐ ‐ ‐
System Controller 7 20 35.00 60 8.53
Total 16 52 30.80 151 9.44
Critical Occupations
Beneficiay Profile Cost
Table 7.4: Performance related rewards (cash bonus), by salary band, for Senior
Management Service
Number of beneficiaries
Number of employees
% of total within salary
bands
Band A 6 13 46.15 86 14 0.16
Band B ‐ 4 ‐ ‐ ‐ ‐
Band C ‐ ‐ ‐ ‐ ‐ ‐
Band D 1 1 100.00 45 45 4.25
Minister ‐ 1 ‐ ‐ ‐ ‐
Total 7 19 36.80 131 19 0.22
Total cost as a % of the total personnel expenditure
Salary Bands
Beneficiary ProfileTotal Cost(Rʹ000)
Average cost per
employee
8. Foreign Workers Table 8.1: Foreign Workers, 1 April 2005 to 31 March 2006, by salary band
Number % of total Number % of total Number % of change
Highly skilled supervision (Levels 9‐12)
2 100.00 1 100.00 1 50.00
Total 2 100.00 1 100.00 1 50.00
Salary Band01 April 2005 31 March 2006 Change

154
Annual Report 2005/06
Table 8.2: Foreign Workers, 1 April 2005 to 31 March 2006, by major occupation
Number % of total Number % of total Number % of change
Financial and Economic Related
1 50.00 1 100.00 ‐ ‐
Financial and Related Professionals
1 50.00 ‐ ‐ 1 100.00
Total 2 100.00 1 100.00 1 100.00
01 April 2005 31 March 2006 ChangeMajor Occupation
9. Leave utilisation for the period 1 January 2005 to 31 December 2005
The Public Service Commission identified the need for careful monitoring of sick leave within the public service. The following tables provide an indication of the use of sick leave (Table 9.1) and disability leave (Table 9.2). In both cases, the estimated cost of the leave is also provided.
Table 9.1: Sick leave, 1 January 2005 to 31 December 2005
Salary Bands Total days% days with medical
certification
Number of employees
using sick leave
% of total employees
using sick leave
Average days per employee
Estimated Cost (Rʹ000)
Lower skilled (Levels 1‐2) 21 71.43 3 100.00 7 3
Skilled (Levels 3‐5) 197 72.59 23 71.88 9 46
Highly skilled production(Levels 6‐8)
350 78.57 39 86.67 9 134
Highly skilled supervision (Levels 9‐12)
572 75.70 91 81.25 6 243
Senior management (Levels 13‐16)
46 86.96 6 33.33 8 4
Total 1 186 76.39 162 76.78 7 430
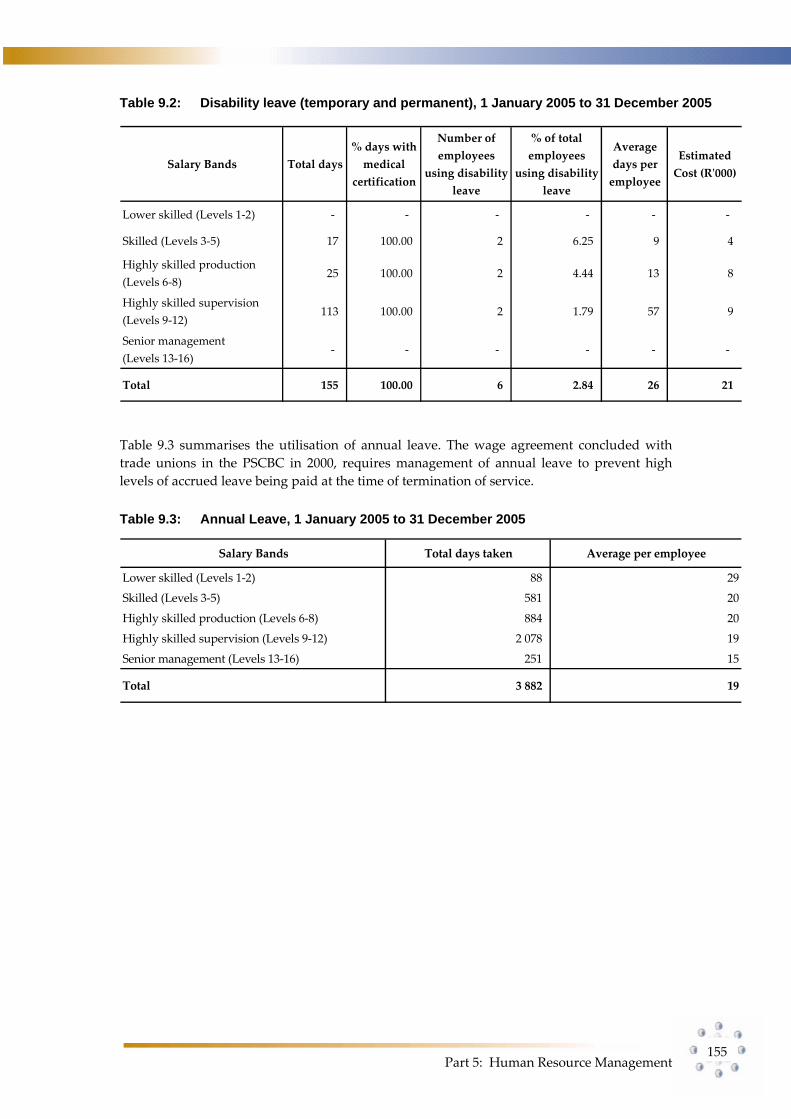
Part 5: Human Resource Management
155
Table 9.2: Disability leave (temporary and permanent), 1 January 2005 to 31 December 2005
Salary Bands Total days% days with medical
certification
Number of employees
using disability leave
% of total employees
using disability leave
Average days per employee
Estimated Cost (Rʹ000)
Lower skilled (Levels 1‐2) ‐ ‐ ‐ ‐ ‐ ‐
Skilled (Levels 3‐5) 17 100.00 2 6.25 9 4
Highly skilled production(Levels 6‐8)
25 100.00 2 4.44 13 8
Highly skilled supervision(Levels 9‐12)
113 100.00 2 1.79 57 9
Senior management(Levels 13‐16)
‐ ‐ ‐ ‐ ‐ ‐
Total 155 100.00 6 2.84 26 21
Table 9.3 summarises the utilisation of annual leave. The wage agreement concluded with trade unions in the PSCBC in 2000, requires management of annual leave to prevent high levels of accrued leave being paid at the time of termination of service. Table 9.3: Annual Leave, 1 January 2005 to 31 December 2005
Salary Bands Total days taken Average per employee
Lower skilled (Levels 1‐2) 88 29
Skilled (Levels 3‐5) 581 20
Highly skilled production (Levels 6‐8) 884 20
Highly skilled supervision (Levels 9‐12) 2 078 19
Senior management (Levels 13‐16) 251 15
Total 3 882 19

156
Annual Report 2005/06
Table 9.4: Capped leave, 1 January 2005 to 31 December 2005
Salary BandsTotal days of capped
leave taken
Average number of days taken per employee
Average capped leave per employee as at31 December 2005
Lower skilled (Levels 1‐2) 1 0.33 42
Skilled (Levels 3‐5) 6 0.21 24
Highly skilled production (Levels 6‐8) 22 0.50 24
Highly skilled supervision (Levels 9‐12)
41 0.38 32
Senior management(Levels 13‐16)
8 0.47 53
Total 78 0.39 31
The following table summarises payments as a result of leave that was not taken. Table 9.5: Leave payouts for the period 1 April 2005 to 31 March 2006
ReasonTotal Amount
(Rʹ000)Number of Employees
Average payment per employee
Leave payout for 2005/2006 due to non‐ utilisaton of leave for the previous year
140 916 18 7 829
Current leave payouts on termination of service for 2005/2006
85 022 1 85 022
Total 225 938 19 11 891
10. HIV/Aids & Health Promotion Programmes Table 10.1: Steps taken to reduce the risk of occupational exposure
Units/categories of employees identified to be at high risk of contracting HIV & related diseases (if any) Key steps taken to reduce the risk
The environment in the Provincial Treasury is for the most part administrative and does not place employees at risk of contracting HIV and related diseases.
Employees are regularly informed about universal precautions as precautionary measure to occupational injuries that may result in blood spillage.

Part 5: Human Resource Management
157
Table 10.2: Details of Health Promotion and HIV/Aids Programmes (tick the applicable boxes and provide the required information)
Question Yes No Details, if yes
1. Has the department designated a member of the SMS to implement the provisions contained in Part VI E of Chapter 1 of the Public Service Regulations, 2001? If so, provide her/his name and position.
√ The Senior Manager responsible for the management of HIV and AIDS is the officer in the capacity of Director: Human Resource Management.
2. Does the department have a dedicated unit or has it designated specific staff members to promote the health and well being of your employees? If so, indicate the number of employees who are involved in this task and the annual budget that is available for this purpose.
√ The Institutional Management and Labour Committee (IMLC) has been appointed to promote, amongst others, all human rights issues in the Department. The IMLC comprises of union members elected by staff to represent them and departmental management members.
3. Has the department introduced an Employee Assistance or Health Promotion Programme for your employees? If so, indicate the key elements/services of this Programme.
√ The contract with the Department’s existing EAP has expired and a new EAP is in the process of being commissioned. The key elements of the EAP were and will be:
• Counseling Services • Life Management Services • Management referral
4. Has the department established (a) committee(s) as contemplated in Part VI E.5 (e) of Chapter 1 of the Public Service Regulations, 2001? If so, please provide the names of the members of the committee and the stakeholder(s) that they represent.
√ Question 2 above refers.
5. Has the department reviewed its employment policies and practices to ensure that these do not unfairly discriminate against employees on the basis of their HIV status? If so, list the employment policies/practices so reviewed.
√ Policies regarding employment have been reviewed on a transversal basis, submitted to the Bargaining Council and adopted in the Department. In addition, the Department has also adopted the Transversal Framework Workplace Policy and Programme for the management of HIV and AIDS.
6. Has the department introduced measures to protect HIV‐positive employees or those perceived to be HIV‐positive from discrimination? If so, list the key elements of these measures.
√ Workshops and other interventions were embarked upon to minimize stigmatization and discrimination in the workplace.
7. Does the department encourage its employees to undergo voluntary counseling and testing? If so, list the results that you have achieved.
√ 24% of all employees have participated in the VCT campaign.
8. Has the department developed measures/indicators to monitor & evaluate the impact of its health promotion programme? If so, list these measures/ indicators.
√ • The frequent replenishing of condom dispensers.
• KAB survey o Knowledge o Attitude o Behaviour

158
Annual Report 2005/06
11. Labour Relations Table 11.1: Collective agreements, 1 April 2005 to 31 March 2006
Subject Matter Date
1. Recruitment and Selection Policy 2005/12/14
2. Implementation of SPMS incentives payouts 2005/07/01
3. Terms of reference for IMLC 2005/10/26
Table 11.2 summarises the outcome of disciplinary hearings conducted within the department for the year under review. Table 11.2: Misconduct and disciplinary hearings finalised, 1 April 2005 to 31 March 2006
Outcomes of disciplinary hearings Number % of total
Correctional counselling ‐ ‐
Verbal warning ‐ ‐
Written warning 1 25.00
Final written warning 3 75.00
Suspended without payment ‐ ‐
Fine ‐ ‐
Demotion ‐ ‐
Dismissal ‐ ‐
Not guilty ‐ ‐
Case withdrawn ‐ ‐
Total 4 100.00
Table 11.3: Types of misconduct addressed at disciplinary hearings
Type of misconduct Number % of total
Dishonesty 1 25.00
Absent from work without reason or permission 3 75.00
Refuse to obey security regulations ‐ ‐
Conduct oneself in inproper/unacceptable manner ‐ ‐
Disrespect/abuse or insolent behaviour ‐ ‐
Possesses or wrongfully uses property of the state ‐ ‐
Fails to comply with or contravene an Act. ‐ ‐
Total 4 100.00

Part 5: Human Resource Management
159
Table 11.4: Grievances lodged for the period 1 April 2005 to 31 March 2006
Number of grievances addressed Number % of total
Resolved 1 33.30
Not resolved 2 66.70
Total 3 100.00
Table 11.5: Disputes lodged with Councils for the period 1 April 2005 to 31 March 2006
Number of disputes addressed Number % of total
Upheld ‐ ‐
Dismissed ‐ ‐
Lodged (Pending) ‐ ‐
Total ‐ ‐
Table 11.6: Strike actions for the period 1 April 2005 to 31 March 2006
Strike Actions Number % of total
Total number of person working days lost 1.00 ‐
Total cost of working days lost 385.44 ‐
Amount recovered as a result of no work no pay 385.44 ‐
Table 11.7: Precautionary suspensions for the period 1 April 2005 to 31 March 2006
Number of people suspended Number % of total
Number of people suspended None ‐
Number of people whose suspension exceeded 30 days None ‐
Average number of days suspended None ‐
Cost (Rʹ000) of suspensions None ‐

160
Annual Report 2005/06
12. Skills Development This section highlights the efforts of the department with regard to skills development. Table 12.1: Training needs identified 1 April 2005 to 31 March 2006
Learner‐ships
ABET
Skills Programmes & other short courses
Other forms of training
Total
Female 4 ‐ ‐ 2 ‐ 2 Male 12 ‐ ‐ 4 ‐ 4 Female 51 ‐ ‐ 4 ‐ 4 Male 67 3 ‐ 4 ‐ 7 Female 6 1 ‐ 38 ‐ 39 Male 12 4 ‐ 34 ‐ 38 Female 38 2 ‐ 33 ‐ 35 Male 16 1 ‐ 13 ‐ 14 Female 2 ‐ 1 ‐ ‐ 1 Male 1 ‐ 1 ‐ ‐ 1 Female ‐ ‐ ‐ ‐ ‐ ‐ Male 2 ‐ 1 ‐ ‐ 1 Female 101 3 1 77 ‐ 81 Male 110 8 2 55 ‐ 65
Total 211 11 3 132 ‐ 146
Training needs identified at start of reporting period
Occupational Categories Gender
Number of employees as at
31 March 2006
Legislators, senior officials and managers
Professionals
Technicians and associate professionals
Clerks
Elementary occupations
Plant and machine operators and assemblers
Sub‐total
Table 12.2: Training provided 1 April 2005 to 31 March 2006
Learner‐ships
ABET
Skills Programmes & other short courses
Other forms of training
Total
Female 4 ‐ ‐ 2 ‐ 2 Male 12 ‐ ‐ 4 ‐ 4 Female 51 ‐ ‐ 4 ‐ 4 Male 67 3 ‐ 4 ‐ 7 Female 6 1 ‐ 38 ‐ 39 Male 12 4 ‐ 34 ‐ 38 Female 38 2 ‐ 33 ‐ 35 Male 16 1 ‐ 13 ‐ 14 Female 2 ‐ 1 ‐ ‐ 1 Male 1 ‐ 1 ‐ ‐ 1 Female ‐ ‐ ‐ ‐ ‐ ‐ Male 2 ‐ 1 ‐ ‐ 1 Female 101 3 1 77 ‐ 81 Male 110 8 2 55 ‐ 65
Total 211 11 3 132 ‐ 146
Occupational Categories Gender
Number of employees as
at 31 March 2006
Training needs identified at start of reporting period
Legislators, senior officials and managers
Professionals
Technicians and associate professionals
Sub‐total
Plant and machine operators and assemblers
Elementary occupations
Clerks

Part 5: Human Resource Management
161
13. Injury on duty The following table provides basic information on injury on duty.
Table 13.1: Injury on duty, 1 April 2005 to 31 March 2006
Nature of injury on duty Number % of total
Motor‐ vehicle accident with neck and shoulder injuries 1 100.00
Total 1 100.00
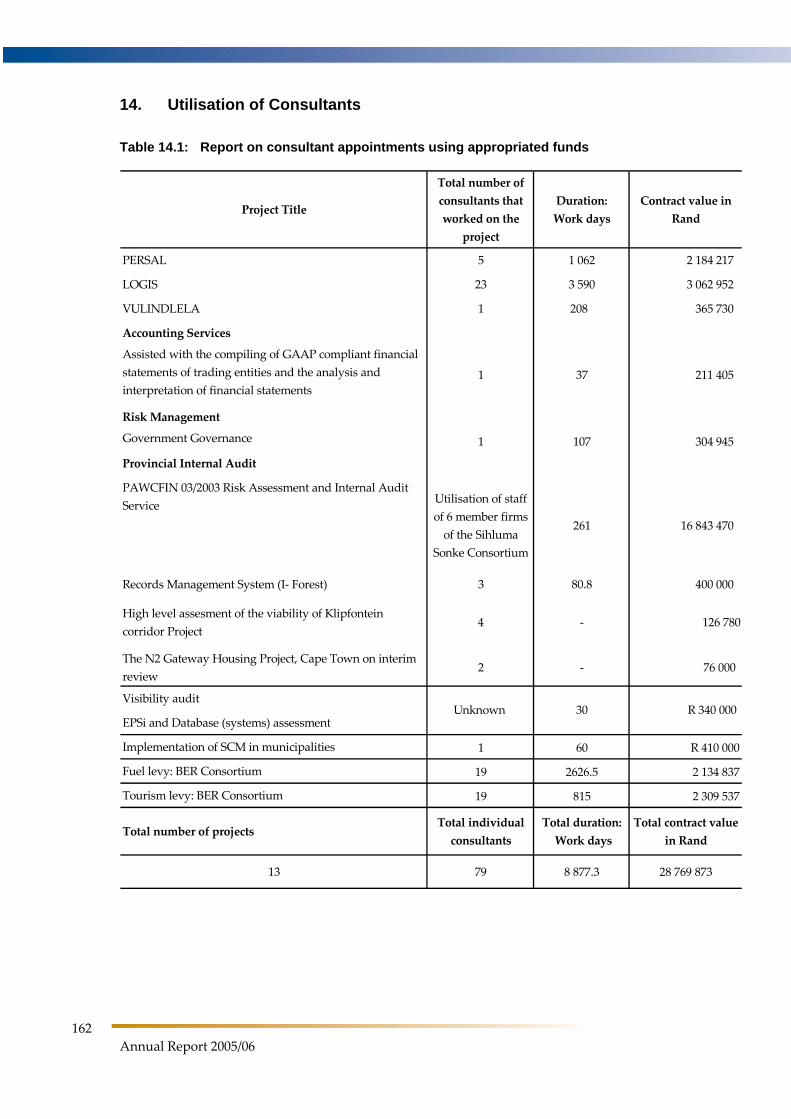
162
Annual Report 2005/06
14. Utilisation of Consultants Table 14.1: Report on consultant appointments using appropriated funds
Project Title
Total number of consultants that worked on the
project
Duration: Work days
Contract value in Rand
PERSAL 5 1 062 2 184 217
LOGIS 23 3 590 3 062 952
VULINDLELA 1 208 365 730
Accounting Services
Assisted with the compiling of GAAP compliant financial statements of trading entities and the analysis and interpretation of financial statements
1 37 211 405
Risk Management
Government Governance 1 107 304 945
Provincial Internal Audit
PAWCFIN 03/2003 Risk Assessment and Internal Audit Service Utilisation of staff
of 6 member firms of the Sihluma
Sonke Consortium
261 16 843 470
Records Management System (I‐ Forest) 3 80.8 400 000
High level assesment of the viability of Klipfontein corridor Project
4 ‐ 126 780
The N2 Gateway Housing Project, Cape Town on interim review
2 ‐ 76 000
Visibility audit
EPSi and Database (systems) assessment
Implementation of SCM in municipalities 1 60 R 410 000
Fuel levy: BER Consortium 19 2626.5 2 134 837
Tourism levy: BER Consortium 19 815 2 309 537
Total number of projectsTotal individual consultants
Total duration: Work days
Total contract value in Rand
13 79 8 877.3 28 769 873
Unknown 30 R 340 000

Part 5: Human Resource Management
163
Table 14.2: Analysis of consultant appointments using appropriated funds, in terms of Historically Disadvantaged Individuals (HDIs)
Project TitlePercentage
ownership by HDI groups
Percentage management by HDI groups
Number of Consultants form HDI groups that work on the project
PERSAL 25% 28% ‐
LOGIS 25% 100% 15
VULINDLELA 100% 100% 1
Accounting Services
Assisted with the compiling of GAAP compliant financial statements of trading entities and the analysis and interpretation of financial statements
‐ ‐ ‐
Risk Management
Government Governance Nil Nil Nil
Provincial Internal Audit
PAWCFIN 03/2003 Risk Assessment and Internal Audit Service
• Afripeak Management (Pty) Ltd 100 81 9
• Barends Knight 100 100 7
• Gcabashe Inc. 100 100 10
• SAB&T Inc. 85 75 29
• Ernst & Young 20 48 13
• Pricewaterhouse Coopers 15 34 7
Records Management System 25 25 1
High level assesment of the viability of Klipfontein corridor Project
‐ ‐ ‐
The N2 Gateway Housing Project, Cape Town on interim review
2 ‐ ‐
Table 14.3: Report on consultant appointments using Donor funds
Project TitleTotal number of
consultants that worked on the project
Duration: Work days
Donor and Contract value in Rand
None ‐ ‐ ‐

164
Annual Report 2005/06
Table 14.4: Analysis of consultant appointments using Donor funds, in terms of Historically Disadvantaged Individuals (HDIs)
Project TitlePercentage ownership by
HDI groups
Percentage management by HDI
groups
Number of Consultants from HDI groups that work on the project
None ‐ ‐ ‐