provincial report: kwazulu-natal - unicef - unicef home
TRANSCRIPT

Eva l uat io n o f t h e S c ho o l N u t r i t io n
P r o g r a m m e
Provincial Report: KwaZulu-Natal
May 2008
EducationDepartment:
REPUBLIC OF SOUTH AFRICA
education

© 2008 UNICEF
This research was commissioned by UNICEF South Africa in collaboration with the Department of Education, and produced by KPMG International.
This report is intended solely and exclusively for the benefit, information and use by UNICEF and the Department of Education. No party, other than UNICEF and the Department of Education, may rely on the contents of this report, either in whole or in part. KPMG Services (Pty) Ltd (hereinafter referred to as “KPMG”), its directors or employees or agents or any body or entity controlled by or owned by or associated with KPMG, accepts no liability or responsibility whatsoever, resulting directly or indirectly from the disclosure of this report to any third party and/or reliance of any third party on the contents of this report, whether in whole or in part.
EnquiriesNokuthula PrusentUNICEF, PO Box 4884, Pretoria, 0001, South AfricaTel: +27 12 3548201Email: [email protected]
Design and Production: Handmade Communications

Eva l uat io n o f t h e S c ho o l N u t r i t io n
P r o g r a m m e
Provincial Report: KwaZulu-Natal
May 2008
Department of Education – UNICEF
1 Introduction ............................................................................................................................ 11.1 Purpose of the report ..................................................................................................................1
2 Background ............................................................................................................................. 2
3 Methodology ........................................................................................................................... 33.1 Limitations ..............................................................................................................................5
4 Objectives ............................................................................................................................... 64.1 Findings ...................................................................................................................................64.2 Conclusion.................................................................................................................................7
5 Outputs .................................................................................................................................. 85.1 Findings ...................................................................................................................................85.2 Conclusion...............................................................................................................................10
6 Outcomes ...............................................................................................................................116.1 Findings .................................................................................................................................116.1 Conclusion...............................................................................................................................14
7 Systems ..................................................................................................................................157.1 Financial management ............................................................................................................157.2 Supply chain management ........................................................................................................197.3 Administrative systems .............................................................................................................21
8 Conclusion ............................................................................................................................ 28
Contents
List of tabLesTable 1: Distribution of sample schools per province ...............................................................................3Table 2: District and school visits per province ......................................................................................4Table 3: Percentage of schools with active food gardens ...........................................................................8Table 4: Percentage of schools with economic activity ..............................................................................9Table 5: Percentage of schools with active nutrition education ................................................................9Table 6: Percentage of schools where there is community participation .....................................................9Table 7: Percentage of targeted learners fed ..........................................................................................11Table 8: Percentage of schools complying with required number of feeding days .......................................11Table 9: Percentage of schools that complete feeding by 10h00 ...............................................................12Table 10: Percentage of schools complying with prescribed menus...........................................................13Table 11: Examples of portion size variation amongst schools visited ....................................................14

1
1 introduCtion
This report presents the findings of an evaluation conducted in the province of KwaZulu-Natal (KZN), in November 2007, of the National School Nutrition Programme (NSNP), housed in the KwaZulu Department of Education since 2004. The evaluation of the NSNP was carried out in each of the nine provinces.
There is a high level of poverty and unemployment in the region, as is the case in the rest of the country. This poverty and unemployment happens in “pockets” in the midst of tremendous growth and development and is more concentrated in rural areas. Urban areas are also not immune to the plague of poverty as most families migrate to urban and peri-urban informal settlements to seek employment and a better future. Further compounding the poverty situation is the HIV and AIDS pandemic, which is adding another dimension to the sustainability of the family unit. KZN has a large number of children from child- or grandparent-headed households with no income or insufficient income, that are well below the poverty datum line.
KZN province is divided into 12 education districts with a total of 3,760 schools, 44 of which are schools with special needs. A total of 1,467,412 learners in the province participate in the NSNP at an allocated budget of R255,843,362 for this current year. In KZN, a total of 1,595 schools with 628,704 learners are located in nodal areas and are in districts identified as the poorest and are the President’s special focus schools.
School feeding takes place in these schools under the management of the school principal who is assisted by other educators, members of the community and the school governing body. Service providers for the programme are either individuals or one of the 689 cooperatives from the local area that are operating to supply raw or cooked food for learners. Where uncooked food is supplied, members of the community, who are usually parents to some of the learners at the school, participate in preparing and or serving the food.
1.1 Purposeofthereport
The primary purpose of the report is to present findings of the evaluation on how well the NSNP is meeting its objectives as well as on the effectiveness and efficiency of systems developed to implement the programme.
This report serves to:• Highlight programme reach, delivery and control models in the province.• Determine what works and what does not in the province, various districts and the schools in those
districts.• Provide recommendations that may serve to strengthen the programme and improve on weak
areas.

2
2 baCkground
What is now known as the National School Nutrition Programme (NSNP) was initially established in September 1994, in the Department of Health, and was then named the Primary School Feeding Scheme (PSFS). It was one of the Presidential Lead Projects of the RDP (Reconstruction and Development Programme). It was developed as an intervention programme to reduce short-term hun-ger and alleviate long-term effects of malnutrition on development of children of school-going age.
The aim of the PSFS was to contribute to the improvement of education quality and the general health of primary school learners, by enhancing learning capacity, improving school attendance and punctuality and alleviating hunger.
At conception, the Nutrition Programme was jointly managed by the National Departments of Education and Health. The former was responsible for the school and educational aspects, while the latter managed the nutritional and health aspects. In the Department of Health, it was named the Primary School Nutrition Programme and it formed part of the Integrated Nutrition Programme (INP).
The programme was transferred to be the sole responsibility of Department of Education in April 2004, while the Department of Health continues to manage the rest of the INP activities.
It was renamed the National School Nutrition Programme on April 1 2005.
The programme is guided by the National School Nutrition Programme Implementation, Monitoring and Reporting Manual of the Department of Education and is operated in all provinces of South Africa. Operational and delivery models among the provinces do differ sometimes, based on special circumstances or challenges that are unique to that province. These challenges are explored in the provincial business plans on which funding allocation is based.
Each province therefore develops its own operational guidelines that are reviewed from time to time. Areas of difference amongst provincial policies usually cited pertain to:• Meal cost per learner per day.• Menu selections according to season, availability and food costs.• Supply of eating utensils.
3
3 MethodoLogy
The evaluation was made up of three main components and included both qualitative and quantitative elements. First, key stakeholder interviews were carried out at provincial, district and school levels. Second, a school survey was carried out in a nationally representative sample of 271 schools. Third, 30 school visits were made across nine provinces. These components are discussed in more detail below.
key stakeholder interviews: Semi-structured interviews were carried out at provincial level with the programme manager, at district level with the nutrition coordinators and liaison officers and at school level with principals and/or nutrition coordinators in schools. The main aim of these interviews was to get a sense of programme achievements and challenges.
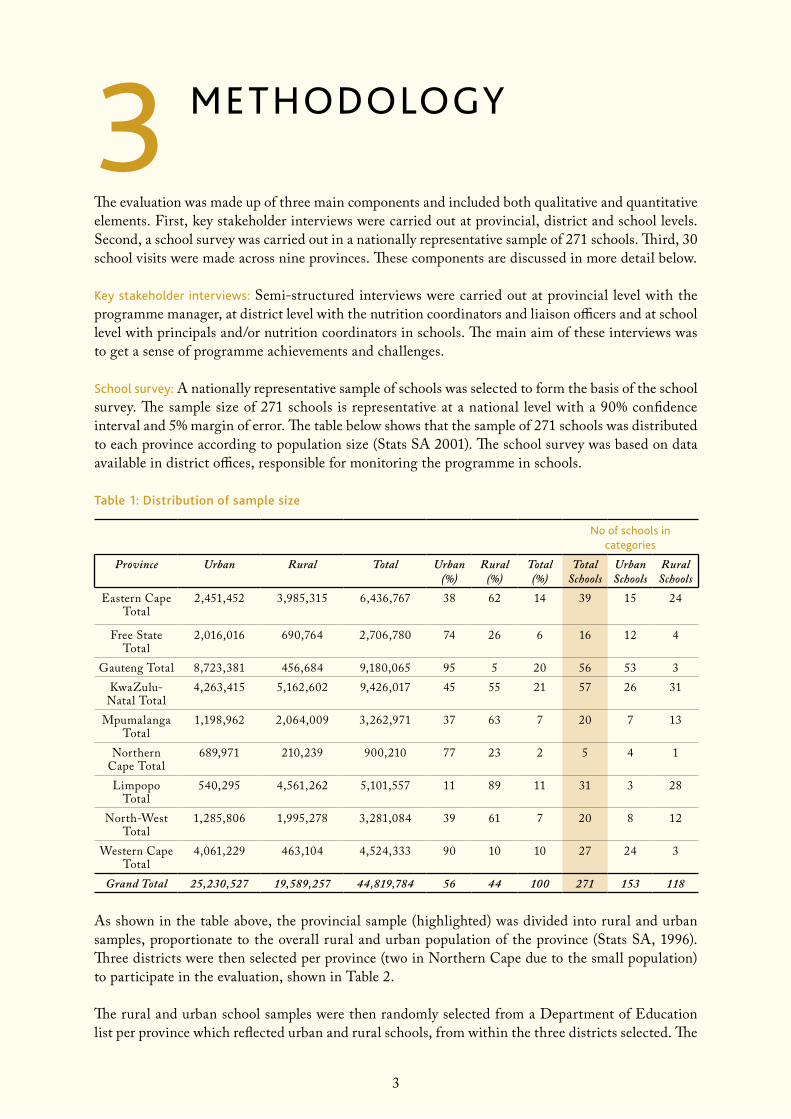
school survey: A nationally representative sample of schools was selected to form the basis of the school survey. The sample size of 271 schools is representative at a national level with a 90% confidence interval and 5% margin of error. The table below shows that the sample of 271 schools was distributed to each province according to population size (Stats SA 2001). The school survey was based on data available in district offices, responsible for monitoring the programme in schools.
Table 1: Distribution of sample size
no of schools in categories
Province Urban Rural Total Urban (%)
Rural (%)
Total (%)
Total Schools
Urban Schools
Rural Schools
Eastern Cape Total
2,451,452 3,985,315 6,436,767 38 62 14 39 15 24
Free State Total
2,016,016 690,764 2,706,780 74 26 6 16 12 4
Gauteng Total 8,723,381 456,684 9,180,065 95 5 20 56 53 3KwaZulu-
Natal Total4,263,415 5,162,602 9,426,017 45 55 21 57 26 31
Mpumalanga Total
1,198,962 2,064,009 3,262,971 37 63 7 20 7 13
Northern Cape Total
689,971 210,239 900,210 77 23 2 5 4 1
Limpopo Total
540,295 4,561,262 5,101,557 11 89 11 31 3 28
North-West Total
1,285,806 1,995,278 3,281,084 39 61 7 20 8 12
Western Cape Total
4,061,229 463,104 4,524,333 90 10 10 27 24 3
Grand Total 25,230,527 19,589,257 44,819,784 56 44 100 271 153 118
As shown in the table above, the provincial sample (highlighted) was divided into rural and urban samples, proportionate to the overall rural and urban population of the province (Stats SA, 1996). Three districts were then selected per province (two in Northern Cape due to the small population) to participate in the evaluation, shown in Table 2.
The rural and urban school samples were then randomly selected from a Department of Education list per province which reflected urban and rural schools, from within the three districts selected. The
4
selection of districts was carried out with consideration given to rural/urban divide as well as time and cost constraints associated with school visits discussed below. Project deadlines and budget allowed a one week period for data collection per province which meant that travelling could not exceed one day per school visit. School lists provided by the Department of Education were used to randomly select the sample of schools from the three districts identified.
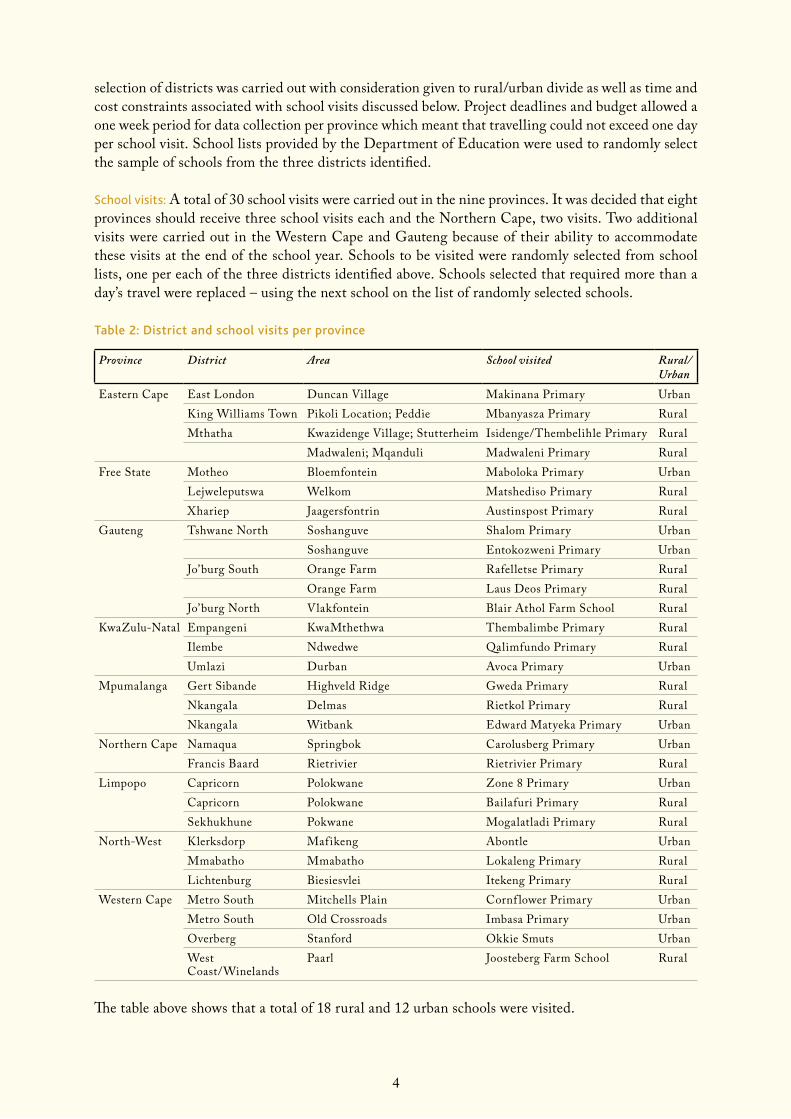
school visits: A total of 30 school visits were carried out in the nine provinces. It was decided that eight provinces should receive three school visits each and the Northern Cape, two visits. Two additional visits were carried out in the Western Cape and Gauteng because of their ability to accommodate these visits at the end of the school year. Schools to be visited were randomly selected from school lists, one per each of the three districts identified above. Schools selected that required more than a day’s travel were replaced – using the next school on the list of randomly selected schools.
Table 2: District and school visits per province
Province District Area School visited Rural/Urban
Eastern Cape East London Duncan Village Makinana Primary UrbanKing Williams Town Pikoli Location; Peddie Mbanyasza Primary RuralMthatha Kwazidenge Village; Stutterheim Isidenge/Thembelihle Primary Rural
Madwaleni; Mqanduli Madwaleni Primary RuralFree State Motheo Bloemfontein Maboloka Primary Urban
Lejweleputswa Welkom Matshediso Primary RuralXhariep Jaagersfontrin Austinspost Primary Rural
Gauteng Tshwane North Soshanguve Shalom Primary UrbanSoshanguve Entokozweni Primary Urban
Jo’burg South Orange Farm Rafelletse Primary RuralOrange Farm Laus Deos Primary Rural
Jo’burg North Vlakfontein Blair Athol Farm School RuralKwaZulu-Natal Empangeni KwaMthethwa Thembalimbe Primary Rural
Ilembe Ndwedwe Qalimfundo Primary RuralUmlazi Durban Avoca Primary Urban
Mpumalanga Gert Sibande Highveld Ridge Gweda Primary RuralNkangala Delmas Rietkol Primary RuralNkangala Witbank Edward Matyeka Primary Urban
Northern Cape Namaqua Springbok Carolusberg Primary UrbanFrancis Baard Rietrivier Rietrivier Primary Rural
Limpopo Capricorn Polokwane Zone 8 Primary UrbanCapricorn Polokwane Bailafuri Primary RuralSekhukhune Pokwane Mogalatladi Primary Rural
North-West Klerksdorp Mafikeng Abontle UrbanMmabatho Mmabatho Lokaleng Primary RuralLichtenburg Biesiesvlei Itekeng Primary Rural
Western Cape Metro South Mitchells Plain Cornf lower Primary UrbanMetro South Old Crossroads Imbasa Primary UrbanOverberg Stanford Okkie Smuts UrbanWest Coast/Winelands
Paarl Joosteberg Farm School Rural
The table above shows that a total of 18 rural and 12 urban schools were visited.
5
3.1 Limitations
The school survey used data available in district offices. Record keeping, particularly for 2004, was generally found to be poor. Many district offices across the country do not keep files on each school in their jurisdiction that is on the Nutrition Programme. This meant that in certain instances district programme staff who were familiar with a school had to be interviewed in order to answer the questionnaire. In some instances, schools were contacted directly for information, or submitted their records to the district office, in order for the school survey to be completed. Records kept by food and beverage interns responsible for monitoring schools in certain areas were used in Gauteng.
The randomness of sampling was constrained by time deadlines and budget. As highlighted above, three districts were selected per province first, based on the travel time anticipated to reach district offices. To ensure completion of fieldwork within one week per province, this needed to be within one day. The sample of schools was then randomly selected from within the three districts. Furthermore, schools identified for visits were also randomly selected – but within the three districts identified.
6
4 objeCtives
The objectives highlight what the NSNP intends to do for children of school-going age. The programme objectives, as defined by the evaluation terms of reference are:• To contribute to enhanced learning capacity through school feeding.• To generate food production and economic activities in school communities in order to improve
household food security.• To strengthen nutrition education for the school community.
4.1 Findings
4.1.1 Understanding and alignment with national objectivesProvincial, district and school level interviewees, to a large extent, do understand the objectives of the programme. All interviewees answered the objectives section of the questionnaires without having to refer to the manual or guidelines and they added their own words and interpretation or sometimes gave the outcome. Examples of variations of national objectives are as follows:• “To help children get boosted and have stamina.”• “To encourage school attendance”• “Nutrition education is not a primary objective of the NSNP as it is part of the curriculum of OBE
(outcomes based education).”• “To give food service to all learners and nutrition education.”
The objectives broadly align with those of the province and of the National Education Department. Some of the interviewees at school or district level added their own interpretation or dimension when they put it in their own words. Examples are:• “Children starve, some are living with grannies, so this helps children learn, promote health,
improve performance and coping in class.”• “To prevent kwashiorkor and malnutrition as most parents are unemployed.”
4.1.2 Programme meeting objectivesAll interviewees believed that the objectives were adequately met, as feeding did take place on almost all feeding days according to the school feeding calendar and pupil enrolment; concentration in class is high and absenteeism is low; and children are happy and motivated. Interviewees reported that if no food is provided, learners tend to be more sleepy or irritable, stay away from school or leave at break and do not come back. Younger children cry a lot. Educators sometimes have to buy them cool drink and biscuits. Interviewees report that:• The blanket year allocation of R1 per learner per day is inadequate to meet the objectives of the
programme and does not cover transport and food distribution costs.• Variation of meal costs is an issue and can vary from district to district and from school to school
within the province.• Food, fuel and transport costs rose twice in the current year, but there was no revision of the
amount allocated per child during the evaluation period. Rice that cost R20 per 10kg in 2006 now costs R40 and beans were R20 for 5kg but now cost R45. The allocation per child was only increased from 95c to R1 in 2007.
• Offices of one district, Ilembe, are located in Durban and this is far from any of the schools man-aged by this district office. This makes transport and distribution costs for documents, monitoring and evaluation more expensive and inefficient as distances are longer.

7
• The pupils, food handlers and educator focus groups all indicated that the programme is a good one and that it should not be discontinued.
• The urban school pupil focus group in Umlazi district, however, did feel that the objective of the Nutrition Programme would be better met if there were menu improvements that included meat, not just soya beans and dried beans, as protein. Meal participation in this group was lowest on the day of the visit, with some respondents complaining about menu fatigue, lack of taste and mistrust in the safety of the food as they had previously experienced tummy aches after the meals. Some said that their parents had advised them not to eat food provided by the school. In a class of 20 grade R learners, only eight ate the meal provided. The rest ate the sandwiches from a community donor. Some learners from this school brought food from home and others bought from school vendors. At the same school, donated food packs were also delivered from the neighbouring community and were given to the lower grades; the learners appeared to like the food and prefer this option. These alternative foods compete effectively with the feeding scheme meals and seem to be liked, but they are not necessarily better or adequate nutritionally. On the day of the visit, donated food packs were two-slice sandwiches made with white bread with potato curry as filling; bought sandwiches were brown or white bread with polony as filling; bought food varied between ice lollies, potato crisps, fruit, sweets or “fat cakes”.
• The rest of the respondents, especially rural school focus groups, teachers, food handlers, principals, district and provincial officials responded positively to the question of objectives being met. Cited limitations were poor menu variation since there are only four menu options used, with beans sometimes featuring three times a week. Another school menu included canned fish for variety, which does not feature in the four menu option list, but the school felt it is convenient as it needs less preparation time and fuel.
• The objective of food production and increasing food security has been affected by external en-vironmental factors, hindrances or hiccups. Water scarcity, even for human consumption, poor fencing, lack of care when schools are closed for the holidays, the season, gardening or arable land availability or/and community motivation, seemed to be significant factors limiting the success of this goal. At all the sites visited there was no evidence of any commercial activity from food gardens, though some of the schools reported using gardens to produce food to give to the needy learners to use at home or to include in the school menu.
• All interviewees felt that the objective of nutrition education was fairly addressed in the coursework of life skills as covered by the curriculum.
4.2 Conclusion
Interviewees’ understanding of both the provincial and national objectives is fair. At each level, the interviewees had their own, fairly accurate, interpretation of the objectives.
Implementation of the primary objective of contributing to enhanced learning through feeding of learners is considered to be good. Feeding of target learners, compliance with required feeding days and menu compliance are all good, although improvement on feeding time is still required in a large number of schools in the province.
Nutrition education to learners is being met through regular curricular activities, as stated in the NSNP objectives. This is indeed happening and is considered to be good. Nutrition education, is however, given to food handlers and covers topics such as food safety and hygiene, cooking and preparation methods etc. All training given is reported on in the monitoring and evaluation (M&E) report.
Performance of the programme on the food production objective does, however, have shortcomings. Analysis on this objective is included in the Outputs section and probes what percentage of schools have food gardens and related economic activity.

8
5 outputs
Outputs in this programme relate to what was achieved by the programme in meeting secondary objectives that are not directly related to learning as such. Outputs of the programme were identified as:• The presence of active food gardens in school.• Economic activity related to food gardens.• Community participation in the running of the programme in the school.
An assessment of all of these achievements was included in the school survey, the findings of which are presented below along with other sources of information.
The following are the results of the school survey, conducted in KZN province, using records kept at provincial district offices.
5.1 Findings
5.1.1 Active food gardensThe table below presents findings on the percentage of schools with active food gardens.
Table 3: Percentage of schools with active food gardens
Calendar year Complies No record Does not comply2004 50.9% 8.8% 40.4%2005 57.9% 0.0% 42.1%2006 52.6% 1.8% 45.6%
According to these results presented above, it is clear that at least 50% of schools complied with the objective of enhancing food production at schools. Reasons for low compliance picked up from informant interviews during school visits included:• Poor fencing leading to theft or goats eating produce.• Timing of visit near the end of the school year where there is no active gardening when all produce
has been harvested.• Lack of cooperation from communities.• Insufficient arable land.• Insufficient or expensive water supply.• Puts additional demand on teacher time to supervise meal service, cooking, hygiene and
gardening.
5.1.2 Economic activityTable 4 presents findings on the percentage of schools with economic activity related to the Nutrition Programme, such as selling of vegetables from gardens.

9
Table 4: Percentage of schools with economic activity
Calendar year Complies No record Does not comply2004 38.6% 8.8% 52.6%2005 45.6% 0.0% 54.4%2006 57.9% 1.8% 40.4%
As the data above indicates, there has been some growth in terms of economic activity in schools in KZN from 39% in 2004 to 58% in 2006. Record keeping on this particular aspect of the programme has not, however, been good. Most economic activities at schools are associated with viable food gardens. This indicates that there may be gradual buy-in to the potential of income generation from food gardens. As there is a strong correlation between the two, it is expected that as gardening activity increases, so will economic activity. One school visited had started planting trees, including fruit trees in the courtyard, so it will take time before they bear some fruit!
5.1.3 Nutrition educationNutrition education is one of the long-term objectives of the Nutrition Programme and is essential to ensure sustainability of good nutritional practices, beyond school-going age. Compliance in this regard is very good, as indicated by the table below with 91% of schools having included nutrition education in the curriculum. In addition, all interviewees responded that there was good compliance in this regard since all learners are exposed to nutrition education as part of the life skills subject in the curriculum. Skills transfer by district fieldworkers to service providers was also considered as nutrition education and seen as very empowering e.g. tips on saving on fuel and reducing cooking time by pre-soaking samp, beans and soya mince the day before.
Table 5: Percentage of schools with active nutrition education
Calendar year Complies No record Does not comply2004 89.5% 8.8% 1.8%2005 93.0% 0.0% 7.0%2006 91.2% 1.8% 7.0%
5.1.4 Community participationThe table below shows the percentage of schools with community participation. For purposes of the survey community participation included any form of involvement by parents, family and the broader community in the preparation and serving of food, food gardens or other NSNP activities.
Table 6: Percentage of schools where there is community participation
Calendar year Complies No record Does not comply2004 75.4% 8.8% 15.8%2005 86.0% 0.0% 14.0%2006 52.6% 45.6% 1.8%
As reflected in the above table all schools in the KZN survey sample experienced a fair amount of participation from the communities. The drop in envisaged participation from 86% in 2005 to 53% in 2006 is explained chiefly by lack of specific records on community participation in the standard evalu-ation form in 2006. Interviews did, however, indicate that most schools have community members assisting with food preparation in 2006. Growth in the percentage of schools serviced by cooperatives, viewed more as business people than members of the community, could be another factor.
Schools visited all reported 100% participation from the community. Participation was viewed as:

10
• Availability to cook and serve food while receiving a small honororia of R300.• Availability to serve on the school governing body.• Service provider being a member of the community.• Members of the community who supplied free food packs to the school to augment the feeding
scheme.
At the urban school visited, there were no food handlers from the community. Most children did not live in the area. The learners were themselves daily commuters from neighbouring new settlements. Catering at the school was provided by a cooperative. A driver delivered the cooked food from an off-site kitchen and serving was done by the older children, supervised by the teachers.
5.2 Conclusion
The outputs as cited above, particularly those of food production and nutrition education, are second-ary to the feeding component of the programme, and form part of the longer term objectives of the NSNP. Results on these objectives may therefore take time to be realised. There are still a number of external environmental hindrances around food security.
On the issue of community participation, most interviewees felt that the honoraria were too little at R300 per month. For some, this is their only source of income as they are sole breadwinners.
Meal preparation and meal service is a crucial part of delivery of the programme to be left solely in the hands of volunteers and an educator who has other routine and primary tasks to perform, like teaching. If the food handler is absent or ill, meals will not be served, as schooling starts at about 08h00 whereas cooking starts at 05h00 in some places, in order to feed before 10h00.
Terms and conditions of employment and disciplinary procedures cannot be applied to volunteers and this is an area of weakness.
The contract or agreement is between the supplier and the school governing body and neither of these are the employers of the food handler. The only saving grace is that most food handlers have children at the school and are unemployed persons who might be in dire need as they have no other source of income.

11
6 outCoMes
Outcomes in this programme relate to achievement of the primary objectives that impact directly on learning, namely:• Percentage of targeted learners fed.• Percentage of schools feeding on required days.• Compliance to feeding before 10h00.• Compliance to prescribed menus.
The findings of the survey along with other sources of information on these indicators are reported below.
6.1 Findings
6.1.1 Compliance with number of children fedThe table below shows the percentage of targeted learners fed during the evaluation period. It is significant that there was an increase from 42% of schools with 100% compliance in 2004 to 95% of schools complying 100%, in 2006. The substantial increase may, largely, be explained by the increased availability of records in 2006. Interviews with managers at schools and district level indicated that most target learners were, in fact, being reached by the programme from as early as 2004. Poor record keeping practices during the early developmental stages of the programme (2004 and 2005) is likely to have impacted on the finding. Interviewees did, however, indicate as the programme strengthened, more target learners were reached by it. The increase, due to poor record keeping, cannot however be accurately quantified.
Table 7: Percentage of targeted learners fed
Calendar year 100% and above 90% to 100% 80% to 90% Less than 80% No record2004 42.1% 0.0% 0.0% 1.8% 54.4%2005 52.6% 0.0% 0.0% 0.0% 45.6%2006 94.7% 1.8% 0.0% 0.0% 1.8%
6.1.2 Compliance with required number of feeding daysThe table below shows the percentage of schools that complied with required feeding days.
Table 8: Percentage of schools complying with required number of feeding days
Calendar year 100% and above 90% to 100% 80% to 90% Less than 80% No record2004 82.5% 1.8% 1.8% 1.8% 10.5%2005 87.7% 0.0% 3.5% 7.0% 0.0%2006 93.0% 0.0% 1.8% 1.8% 1.8%
It is evident from the table above that there was a progressive increase over the period 2004 to 2006, from 82.5% to 93% of schools feeding 100% or more of the required days. Good compliance with minimum feeding days was also confirmed in interviews at provincial, school and district levels. In addition, all three schools visited confirmed compliance with the provincially prescribed number of feeding days, during the period of the evaluation.
Certain schools reported extending the number of feeding days beyond the school-feeding calendar

12
as learners come to expect feeding on all days. It is not clear how stocks could be extended to feed beyond expected feeding days.
6.1.3 Completing feeding by 10h00This is considered a very important indicator in the programme as it has great impact on concentration during classes early on in the day, as well as punctuality of learners. Of note is the fact that some learners reported in focus groups that they leave home without having breakfast because of:• Insufficient food supply at home due to poverty.• The learners or their parents leave home very early and have no time to prepare breakfast.• Breakfast eaten may be insufficient or too early to sustain them until lunchtime.• Some learners have to walk long distances to get to school. By the time they get to school they are
exhausted and hungry, even if they did eat breakfast at home.
The table below shows the percentage of schools that complete feeding by 10h00.
Table 9: Percentage of schools that complete feeding by 10h00
Calendar year Complies No record Does not comply2004 71.9% 8.8% 19.3%2005 82.5% 0.0% 17.5%2006 80.7% 0.0% 19.3%
The table shows that at least 70% of the schools had records of feeding by 10h00. There was a gradual improvement up to 82.5% in 2005. These results, however, conflict with what was observed during site visits. Most schools started feeding by 10h00 but had not completed feeding by that time. Reasons cited were:• Break only starts at 10h00 or 10h30.• During exams, learners may not be interrupted for feeding.• “Food has not been delivered yet” as was the case at the urban school where cooked meals are
delivered by the co-op.• Insufficient human resource capacity during serving time.• Queues may be long. At one school 400 learners had to queue single-file, for meals served by the
two food handlers, starting with the lower grades. At another school serving was quick as plating was done by class monitors, in classrooms that have 30 learners each.
6.1.1 Compliance with prescribed menusThe schools visited did comply with the prescribed menu as far as menu options were concerned. There was a major shortcoming however, regarding inclusion of fruit and vegetables as prescribed in the provincial menu. Deviation in portion sizes was also evident.
Of the learners interviewed during school visits, most reported having had breakfast in the form of soft porridge with or without milk and sugar; bread with jam and tea; pap with tea or left-overs from supper. Still, most respondents welcomed the meal and ate it with relish, except for some respondents in the urban group who preferred meat instead of vegetable proteins.
As Table 10 indicates, there has been a regular increase in compliance to prescribed menus in KZN, over the years. Reasons for non-compliance may be explained from school visit responses like:• “When the project started, we were unfamiliar with how to cook soya and we could not time cook-
ing of beans or samp, and these would always be undercooked or not ready by break time. Now we have been trained to soak the day before and we start cooking at 05h00.”
• “We now only order Thekwini (a brand of soya), as it is well flavoured and children like it.”

13
• Underestimation of cooking time required.• Lack of cooking skills and equipment for large quantity catering.
Table 10: Percentage of schools complying with prescribed menus
Calendar year Complies No record Does not comply2004 87.7% 8.8% 3.5%2005 98.2% 0.0% 1.8%2006 96.5% 1.8% 1.8%
The initial problems seem to have been resolved as compliance to the prescribed menu has now improved, reaching 98.2% and 96.5% in 2005 and 2006 respectively. This may be due to the fact that some schools have rationalised menu choices and dropped menu option four, which includes bread, as deliveries of bread are erratic or late, especially in far-flung areas.
Compliance to serving vegetables and fruit or any other perishables may improve once storage facilities including refrigeration and freezing are in place. A small amount of mixed vegetables were observed in the soup at an urban school, but the premises of this service provider were not visited, and they could have the advantage of proximity to major suppliers and better storage facilities.
It was observed during school visits that compliance to portion control of the served menu was poor. Prescribed ration scales of cooked meals did not correspond with ingredients used and purchased, according to the purchase and delivery notes.
Also difficult to ascertain was the weight of delivered food items as no facilities for weighing were available at any of the schools. Thus 10kg of cabbage could well be any weight, yet the receiving clerk will mark it as a correct amount delivered. Verification is better with packaged and labelled foods like mielie meal or rice, as weight is clearly marked.
The two-slice sandwich donated to the school by a community group weighed 95g together with a potato filling, compared with the recommended ration of fortified brown bread that weighs 100g for two slices with no filling.
The table below shows quantity variation of food served in the schools visited. Sample plates were chosen at random.
Table 11: Examples of portion size variation amongst schools visited
School Menu served Portion sizeA Rice 250g
Bean soup 225gVegetable 0g
B Rice 195gSoya 80gVegetable 0g
C Samp 134gBean Soup 134gVegetable 0g

14
6.1 Conclusion
Overall, the above analysis indicates that the programme has performed well on most of the indicators of the extent to which the programme is contributing to enhanced learning. Nearly all schools with records available were feeding all target learners and on all required feeding days. Compliance with menu requirements that fresh produce is provided by suppliers, as well as portion size, needs improve-ment and closer monitoring. Compliance with the 10h00 feeding time also needs more emphasis.
Most respondents, including focus groups, did report that concentration was better in class both before and after break and that absenteeism was minimal. If it did occur en masse, it was usually after exams, when feeding had stopped for the year, or at the beginning of the year before the feeding started. This absenteeism is usually explained by the fact that learners were waiting for money to buy books or school uniform or waiting to register. It was not necessarily attributed by the learners as due to the absence of feeding on those days. In essence, the full enrolment for the year is never ascertained on day one, week one or during the first month of the school calendar as new learners might still be applying for space at the beginning of the school year. This has a bearing on the approved budget that is based on enrolment for the current financial year.
Unless these schools receive funding or food donations from other sources, they could be diluting daily rations per child in order to feed for extra days.
Food donations from communities are welcome but need to comply with or be an improvement on menu specifications and ration scales.

15
7 systeMs
7.1 Financialmanagement
7.1.1 Findings
Current systems
Financial management system
At the beginning of the year, each school receives an approval letter from the province, highlighting the budget for the year, broken down into monthly, expected expenditure. The approval letter provides the year’s nutrition calendar, stating the number of feeding days per month. The total allocated is based on the school enrolment and the number of feeding days for each month. Currently the allocation is R1 per learner per feeding day. An extra R300 per month is allowed as honoraria for food handlers. There was a difference in reporting as far as the amount allocated for gas or wood, with some schools reporting that R200 was allocated while others reported R300 was assigned. The amounts, according to the policy and procurement document, have been revised and are now R300 for honoraria and R300 for fuel per month.
Transfer of funds
A change in the process of transferring funds to schools was implemented from 2006. The 2006 provincial operational guidelines for KZN stipulate that money or payments should not be depos-ited to the school account as was previously done. Schools do not account for the School Nutrition Programme directly in their financial statements as these funds do not go through the school bank account. Funds are transferred directly from the provincial Nutritional Directorates to the suppliers’ respective accounts. The school and district only keep records of claims processed for a minimum of seven years.
The schools do not have a problem with this new system except that they never know when there are delays in payments to the supplier. They usually get to know that there are difficulties in payments when the supplier informs them or refuses to supply and learners are not fed.
Respondents at district level also expressed dissatisfaction with the system as they always have to refer all supplier queries to the provincial office as there is no system for them to check how far in the pipeline submitted claims are. All district offices felt that if the Basic Accounting System (BAS) was introduced to their offices, they could be more helpful instead of channelling all suppliers with queries to the provincial office.
The district NSNP office does have access to financial reports if they request them, but going through the electronic data is a cumbersome process as the data does not highlight the specific district required.
Provincial office finance staff also felt overwhelmed with supplier queries which interfere with their routine work. They felt that BAS should be introduced to district offices, even as a read-only facility, to take care of minor supplier queries.
Service delivery by supplier
Two distinct variants of supplier are operating in KZN. One type is an independent supplier, usually from the same local community, who could be a sole proprietor or a close corporation. Such a supplier

16
usually delivers raw materials to the school and the school is helped by one or two of the parents, referred here as food handlers, to prepare and serve the food to the learners.
The second type could be a cooperative formed by a group of say 10 local persons, usually from differ-ent wards. According to the Cooperatives Act of 2005, “a cooperative is an autonomous association of persons united voluntarily to meet their common economic, social needs and aspirations through a jointly owned and democratically controlled enterprise”. Cooperatives prepare food off the school site and use their own facilities. They usually supply ready to eat food daily to more than one school and often service about 5,000 learners each.
According to interviews with school nutrition coordinators, service delivery is satisfactory with either model. Now and then problems of late delivery do occur due to traffic delays or when payment from province is not timely and where the schools do not receive the supply or services. Schools then feel “helpless” as they cannot even say where the payments are held up once they have submitted the relevant claims. This may result in underspending as allocated funds are not fully utilised for the stipulated period. The supplier withholds the service of food supply until after payment is effected by province. A good example of this was in Avoca, where, according to the principal, for the month of September, no feeding took place as the cooperative was not paid and R3,162 was forfeited.
The question of poor financial management and proper planning or budgeting by a supplier can also have a negative impact on service delivery, as was evident in a case where a newly selected co-op did not budget sufficiently for food preparation space rental. Food preparation space rental alone was R7,000 and the co-op earnings for the month were R4,200.
Sometimes one cook has to cater for 800 learners, where the school has no extra school funds to employ a second or third cook. Similarly, the allocation for fuel is uniform, irrespective of numbers served.
No school reported a transfer of funds to a Section 21 company as all suppliers were either an inde-pendent supplier, a close corporation or a cooperative.
Under-budgeting
Allocation of funds according to the annual feeding calendar does not correspond to the number of school days. For the 2007/2008 financial year, there are 196 school days, yet there are 162 feeding days. This defeats the short-term objective of feeding to alleviate hunger amongst primary school children, as feeding only takes place for 82% of the school calendar year; they are not fed for 34 days. If in addition there is 80% compliance to allocated feeding days, as was the case in 1.8% of schools in 2006, it means children are not fed for another 32 days.
Under-budgeting often occurs when the learners are not all enrolled by the time applications for funds and business plans are submitted to head office. This problem of late registration is common at public schools.
Food ration quantities per learner per meal do not correspond with what is actually ordered and supplied and this shortfall is for most ingredients. The allocated raw quantity per learner varied in various districts. The specified amount of samp, rice or maize meal is 90g per meal; however, only 48g is ordered and delivered in one case. In another case, although the specified amount of soya mince is 30 grams, only 19 grams per learner per meal was actually supplied. This has serious implications, falling short of what the province prescribes as sufficient to meet daily nutritional requirements. At times, this might mean that the budget is being stretched to cater for double the number of learners and nutritional adequacy is compromised.
17
Due to budgetary constraints, daily rations for vegetables, for example, are way below recommenda-tions. Where provincially required vegetable rations are 130g per person per meal, 9.6g is ordered and delivered, based on purchase orders and delivery notes. In addition, fruit and vegetables were usually not included with the foods supplied, or only in very small quantities, or not included in the recipes. At one site, there were five carrots in the school storeroom. Food handlers reported having forgotten to include these when preparing the soup, but even if they had remembered, five carrots would have made very little difference to the vegetable ration for 400 learners. The lack of fruit and vegetables in the school storerooms were apparent on all the school visits in the province.
These are serious shortcomings and they need further verification with an in depth study.
Payment turn around time
The stipulated turn around time at the KZN Department of Education and Culture for processing a claim is seven days. It may sometimes take two to three months before a payment is finalised, particularly where there are queries or submission of claims was delayed.
The process followed is:1. The approved supplier delivers the food based on the approved budget for the month. Suppliers
deliver monthly, weekly or quarterly. The frequency of delivery is determined by the availability of storage space or facilities available and the perishability of the foods. Vegetables and fruit are expected to be delivered more regularly, usually on a weekly basis.
2. Irrespective of delivery schedules, payment to the supplier for deliveries claimed for the previous month is made monthly via electronic transfer.
3. A number of documents are generated monthly in order to process a claim and for the supplier to be paid. These documents are signed, countersigned and double checked and dated by several different people at school, district and provincial levels. These include a claim form, a tax invoice, a confirmation of service delivery, a confirmation of number of learners by grade, a purchase order form and a delivery note detailing menu options, ingredients and quantities delivered per month.
4. The school fills in a claim form that is signed by five people after checking that the deliveries were made and were in order. The signatories include the principal, the school governing body chairper-son, one other member of the school governing body, with the nutrition coordinator at the school or the deputy principal, or the head of department and one other school governing body member as a witness. The supplier also signs to confirm receipt of payment for the previous month.
5. The claim form then gets a school stamp and is sent to the district office, together with another form to confirm that the service was indeed rendered. This confirmation is signed and dated by the school administration clerk, countersigned by the administration officer and approved by the assistant director at district level.
6. At district level, the claim form is in turn signed by three persons, namely, the administration clerk, administration officer and the chief education specialist (CES).
7. The claim form is then sent to the provincial office and signed by three persons, namely, the administration clerk, administration officer and the deputy chief education specialist (DCES). If one of the signatories is on leave, he/she comes into the office once a week to sign the claim forms for further processing.
8. The claim form is then sent to BAS for final processing and payment is made directly to the supplier.
9. The supplier signs a payment-received form for the previous month. This is attached to and sent in with the current month’s claim.
Budgeting
At all schools, the budgeted number of meals at the allocated amount of R1 per child corresponds with actual meals served. Portion control, however, was not standard in all grades, with the main criterion being the age of the children. Some children, who requested it, were given second helpings

18
after all the other children were served. This implies that a degree of cross-subsidisation is happening, with some learners not utilising their full R1 allocation, while others use more than their allocated amount.
The R1 per pupil per meal is set for the year and it does not get adjusted for fuel price and food cost variation during the course of the year.
Underspending does occur, often in conjunction with undersupply, when suppliers are not paid on time due to delays in payment for claims of the previous period. Once that period has passed without feeding taking place on the allocated days, then that allocation is forfeited. No underspending was observed during the current period, despite the fact that fruit and vegetables were undersupplied.
Systems for financial reporting/ accountability
At school level, the principal is accountable for all financial reports and together with the chairperson of the school governing body, checks and signs all claims before sending them to district office. If forms are not appropriately signed and countersigned, the claim is not processed further and will be returned or queried at any stage, be it at school, district or provincial level. This system is effective as it is transparent and verified at several points. It is however cumbersome and may cause delays in payment, especially if one of the co-signatories is unavailable for some reason.
The claim payment system is centralised and happens at head office. This has its advantages as all payments and fund transfers are effected in one office and can be verified. The system, however, makes district offices a mere conduit for claims and their role is minimised to monitoring and training, as mistakes or queries are still picked up at provincial level.
The other disadvantage is that when there are delays in payment, the school or district is unable to handle the supplier query, except to refer them to the provincial office. This becomes an additional burden to provincial officers who have to handle district and school supplier matters for the whole province over and above their own routine work. Also, the provincial office does not give feedback on how far the claim is in the pipeline or who has been paid so far.
The feeling at provincial level was that the processing of claims was a very lengthy process requiring three signatories who might not always be available to check all claims meticulously and sign them. In Umlazi district alone, there are 160 schools and claims of these are processed monthly. Delays are always experienced when one of the signatories is away on or busy with other duties or on leave or if claims are submitted late from districts or schools.
There was also an opinion that having only two people at provincial office was insufficient to deal with claims for all the schools in all districts, especially as they have other duties to perform as well.
With regards to skills, not all signatories at school or district level have a financial background; as a result, there might still be queries at provincial level, which further delays processing of some claims.
7.1.2 ConclusionThere exist healthy, although cumbersome, financial reporting and accountability systems at all levels. Each claim must pass through and be signed by nine people before payment is made. Systems can be improved by delegating some of the duties to district level to ease time and skills constraints at provincial level.
19
7.2 Supplychainmanagement
7.2.1 Findings
Procurement model
The procurement model is a provincial tender model, based on the provincial procurement guidelines of 2006. The school and local community participate in choosing or nominating a service provider. District offices do not play a major role in the selection process except to ensure that procedure is followed in nomination.
Roles in selecting suppliers
The role of the school is to accept supply proposals from local suppliers and nominate one supplier from at least three proposals. The school then sends the nominee to district to forward to province.
The province appoints the supplier, who will provide food supplies for a period of one year and then allocates a budget based on enrolment figures.
The school governing body then enters into an agreement with the supplier. The supplier receives an official approval letter that authorises him/her to commence feeding.
Main selection criteriaThe main rationale for selection of suppliers is community and women empowerment.
Depending on the number of learners at the school and proximity of the schools to one another, more than one supplier may be chosen or one supplier may provide service to more than one school in the area. This is usually true if the supplier is a cooperative. These usually have 10 members each and earnings from one contract may not make provision of the service worthwhile or cost effective if the co-op serves only one school. One co-op in Umlazi district, Sibuyile Co-op, was supplying the school visited as well as eight others in the neighbourhood, giving them a total pupil complement of 4,890 meals per day. This is compared with Guzela Business Enterprises which had 10,000 meals to serve per day, distributed among 22 schools. At R1 per meal and 162 meals per year, this translates to R1.62m per year.
Roles in service deliveryOperational guidelines obtained from districts specify clear roles for the provincial and district offices but do not at all times clarify who at the school is responsible for which role.
The role of the provincial office is to:• Process NSNP claims and effect payment.• Monitor the entire NSNP budget for the province.• Approve all NSNP allocations.• Account to the National Department of Education for NSNP.
The role of the district office is to:• Check invoices received from schools against the allocated budget.• Forward the checked claims to NSNP provincial office to process payment.
The role of the school governing body is:• Overall governance of every public school.• Together with the principal, identify the school supplier.• Regularly monitor food service delivery and sign claim forms.• Regularly check that records are well maintained and inspected.
20
• Encourage community and parent involvement.• Deal with supplier and general problems and resolve conflicts regarding NSNP.
The principal’s role is to:• Ensure that all records including copies of all claims and proof of payment are kept on the system
for seven years.
The selected supplier is commissioned for that period to:• Supply food to the school according to the feeding calendar and according to specified quantity and
quality specifications.• Pay food handlers’ honoraria and allocated amount for fuel.
Despite all the necessary policies and measures taken to ensure smooth delivery of programme objec-tives, problems do arise due to conflict of interest, collusion, political interference, intimidation and general crime. At one rural school the husband of a principal was the supplier and was related to the local chief. Monitoring was difficult for district officials and the school governing body as they felt ob-structed in carrying out their functions. The situation was resolved and the principal was removed.
Some schools are located in known “hot spots” for crime, both in rural or urban areas, and in one instance, a female fieldworker’s car was hijacked. Safety becomes an issue for fieldworkers, suppliers and teachers alike.
Some schools are inaccessible, especially during rainy conditions, where streams turn into rivers and low bridges are washed away.
7.2.2 ConclusionInternal measures to ensure smooth operation and delivery of services are in place. Issues of self interest and external forces, however, need more effort from provincial and district offices to minimise hindrances to meeting the objectives of the NSNP in KZN.
Strengths and weaknesses
• Use of local suppliers is convenient and empowers the community, though they tend to only limit their scope of procurement to the local area with regard to availability of supplies like fruit and vegetables.
• Introduction of co-ops has helped provide uniformity of services and has streamlined supplier pay-ments as the province now deals with fewer individuals. Though some co-ops are still paying back the loan they had with Ithala Bank, there are those who have paid up the loan and have broken even.
• Formation of co-ops. In an attempt to get full ward representivity, members are identified from all wards. Usually they are not familiar with one another and selection is not based on business acumen or good interpersonal relationships. Conflicts often arise, this can threaten service delivery and require resolution by district and provincial staff of the NSNP.
• Community food handlers are conveniently located, as they live within the vicinity of the schools. This is useful as it means they have no or minimal transport costs and they sometimes have to start cooking as early as 05h00 to meet the 10h00 target feeding time.
• The issue of the honoraria allocation as a form of reimbursement is sensitive, especially for an unemployed person as the honoraria falls way below the poverty datum line of $1 per person per day. In one focus group at a school, one of the food handlers ended up in tears when probed on the matter.
• The noticed decrease in community participation, from 85% in 2005 to 53% in 2006 in the KZN survey, is of concern and needs further attention.
• Poor cooking and storage facilities at schools are limiting menu choices and increase transport costs for suppliers if they have to deliver more regularly.

21
7.3 Administrativesystems
7.3.1 Human resources
FindingsAt the provincial office the NSNP is housed in the Subdirectorate of School Nutrition Programmes that reports to the Chief Directorate, Auxiliary Services. The NSNP Subdirectorate is manned by one director and two administration officers who work with 10 to 12 clerks to process 3,760 claims each month.
Each assistant director at provincial level deals with 1,200 claims per month. The constraint is that an assistant director at district level deals with 350 claims per month, whereas an assistant director at head office deals with 1,200 claims and has greater responsibility, but both are at the same salary level. This serves as a performance disincentive and the salary issues need to be reviewed.
At district level the NSNP is housed together with seven other divisions, in the Subdirectorate of Specialised Support Services (SDSSS) that reports directly to the deputy chief education specialist (DCES).
The DCES oversees the whole district office and signs all NSNP claims before they proceed to the provincial office.
All the other divisions, except NSNP, operate under assistant directors who are deputy education specialists. Currently, administration officers handle the jobs and they coordinate the work of admin-istration clerks and fieldworkers.
The post of assistant director in school nutrition is pending, to be filled soon.
The shortcoming with the NSNP is that it does not have an assistant director, like the other units e.g. HIV, Library, Curriculum and Psychological Services, that fall under the SDSSS.
The maximum of three fieldworkers per district might put a strain on those fieldworkers who some-times handle 160 schools with limited transport resources (one car available and a second pool car shared amongst the other units in the Subdirectorate). Some of the schools might not be visited quarterly as required, and may not even be visited at all for the whole year.
At school level, the NSNP is handled by the principal, with the assistance of one or two educators who coordinate the programme. The principal supervises all activities of the programme; checks and signs all claims; keeps records safe and orderly; communicates with suppliers regarding food quality; and attends NSNP workshops.
At all the schools, feeding takes place under the management of the school principal who is assisted by other educators, members of the community and the school governing body. Service providers for the programme are either individuals or one of the 689 cooperatives operating from the local area.
Usually one or two food handlers are responsible for cooking and serving the food, sometimes helped by class teachers. At a school where the co-op was the supplier, there was no food handler so teachers and older learners helped with serving food.
As educators and the principal have other regular academic as well as extra-mural obligations, the Nutrition Programme might be viewed as an additional task for the educators involved. The educators interviewed did not complain about this, probably because they viewed the programme as beneficial

22
to the learners and were willing to overstretch themselves to see it done. Willing as they are to see the programme succeed, they cannot be in class and give proper or sufficient supervision during meal preparation at the same time. This was observed where not all ingredients were included in the menu. Another shortcoming of this arrangement is when the food handler has not turned up and educators have to stand in and prepare the food, leaving their classes unattended for the best part of the morning.
Honororia given were another sore point as illustrated when one of the food handlers just cried during a focus group session when asked about the type and nature of remuneration.
ConclusionProblems of lack of staff dedicated to NSNP at all levels may lead to certain functions not being per-formed optimally, unequal distribution of work and poor service delivery. At school level this pertains to poor supervision during meal preparation and poor performance with regard to school gardens. At district level, absence of an assistant director to focus on NSNP aspects of Auxiliary Services demands more of the DCSS’s as well as of the administration officers’ time and effort. At the provincial office, invoices for the whole province are once more checked and supplier queries addressed by only three senior staff members at the NSNP office.
7.3.2 Planning
FindingsThe NSNP is funded through a provisional grant that is handled by the National Treasury Department. The Treasury then disburses the grant funds to the various provinces and monitors performance and expenditure of the funds with quarterly reviews. The funds are disbursed according to a payment schedule and are based on the provincial business plans.
Provincial business plans highlight outputs and budget for the following year, and are submitted an-nually to the director general for approval. Thereafter funds are released to the provinces. The figures that inform these business plans are based on pupil enrolment figures.
Quarterly reviews are done to determine progress according to norms and standards as set out in the Division of Revenue Act of 2004, which specifies conditions for grant allocation, particularly Schedule 5, which includes NSNP.
The feeding calendar for the year is prescribed by the province. No problems are experienced in more affluent schools if feeding does not take place, as community members donate food or children bring or buy lunch packs. This is not the case at rural and poorer schools, as most children just go hungry on those days, do not concentrate or stay away from school. Teachers sometimes have to buy food for the children or stretch the food supply by feeding lower quantities on prescribed days to accommodate non-feeding days. Some children buy from food vendors and there is no control over the quality of food served.
ConclusionThe current situation, where the amount allocated per learner per day is rigidly set the year before, can contribute to poor delivery of services. Price increases for food, fuel and transport per year occur three or four times and are currently not planned for or accommodated, reviewed or adjusted dur-ing quarterly reviews. Also, although the enrolment figures fluctuate throughout the year, numbers registered on the programme can only be adjusted annually.

23
7.3.3 Monitoring and evaluation
FindingsMonitoring and evaluation at schools is performed by fieldworkers for the NSNP, using a standard form. This form includes key performance indicators of menu compliance, compliance to feeding by 10h00, number of children fed, food quality and quantity, frequency of supply and storage of perishable and non-perishable foods, hygiene standards, community participation in terms of meal preparation, supply of fresh food, as well as proposed action plans.
One district, Ilembe, has adapted the standard evaluation form to include probing whether menus together with quantities are displayed; enjoyment of the menu by learners; who supervises dishing out of food; availability of electricity at the school; availability of a functional fruit or vegetable garden; participation of all learners and all grades in the garden project and the school’s needs for further training.
District visits by provincial officials are reported to be concentrated at the level of the chief education specialist (CES) or deputy chief education specialist (DCES) and not to the rest of the staff of the NSPS.
The school checks the quality and quantity of food delivered and is authorized to reject unsuitable and unsatisfactory deliveries.
District officials do quarterly checks, but these visits are not likely to unveil issues such as collusion between the supplier and the educator who receives the supplies. In areas where political power overshadows the school governing body or school district official, it might take longer for the situation to be detected and corrected for fear of victimisation. An example of this was where a principal was related to the local chief and her husband was the supplier. Supplies were delivered to the principal’s home and brought to the school premises daily with regular hiccups, insufficient accountability and no transparency. District office monitoring was viewed with great suspicion or as interference and was discouraged by intimidation. A change of the status quo was frustrated by regular burglaries of the school strong room, cable thefts and hijacking of the district vehicle.
Provincial visits were viewed as insufficient and at district nutrition level, communication was mainly through memos. However, the section head of SDSSS reported regular meetings with the Nutrition Unit.
School visits
In all three schools visited, food was served under good hygienic conditions, despite the poor infra-structure for serving meals.
In the case of the supplier being a cooperative, there was insufficient observation, as access to their off site premises had not been pre-arranged and one attempt to observe the premises was declined. At the one urban school visit, not all learners took part in the meals provided by the co-op. Various reasons for non-participation were given:• Food not tasty.• Menu fatigue.• Preference for food from food vendors or home packs or free donated sandwiches.• Lack of meat or animal protein.• Having previously suffered from stomach ache after consumption of the meals.
Hygiene was reasonable under the prevailing circumstances. All observed food preparation and service points were fairly clean though refuse disposal in rural schools was done in an open refuse dump in

24
the school yard, foraged by goats and there were insufficient hand washing and dishwashing facilities. Washing was done using a bucket of water outside every classroom or block and although methods to limit cross-contamination had been taught, they were not always followed.
District staff do monitor hygiene levels although they used different yardsticks to those used in the evaluation. For example, proximity of toilets to the food preparation area was not standard as this was an infrastructural issue and not easy to modify. There was also no infrastructure for garbage collection in rural areas; food temperature control is difficult where serving is decentralised to each classroom or where queues during feeding time are as long as 400 learners and where a cooperative supplier delivers cooked meals to various schools in the area. Food poisoning may occur if only one vehicle is used as it might take time to reach the various destinations.
Sufficiency of mealsThe meals were insufficient to meet one third of the recommended daily allowances required by the province. The amounts purchased and ordered were less than the stipulated rations. The recommended ration of soya mince is 30 grams per portion, yet only 16 grams per ration were ordered and delivered. The delivered vegetables were only 3.2 to 9.6 grams per portion, in contrast to the recommended 130 grams.
Effectiveness and efficiency of evaluationsAlthough the system of monitoring and evaluation is relatively effective and efficient, it has its short-comings. If the district visitor prearranges the inspection, they will find everything organised. But unannounced visits were more likely to uncover a lack of records and absent staff members.
Problems related to the geographical location, the vastness of the area, the availability of suitable and sufficient transport and staff numbers are interdependent and all combine to impact on the delivera-bles. In Ilembe district there are three fieldworkers. Two fieldworkers do site visits for one fieldworker per cycle while one stays behind to do office work for that week. This is because there is only one vehicle available for the Nutrition Unit and it must be shared by the three fieldworkers.
In one particular rural school, none of the inspectorates had visited it by year-end and the fieldworker responsible for the school had not been to the school before. Both the principal and the clerk were absent and all records were in the locked office.
Remote rural areas tend to be under serviced, while some urban areas get more than their fair share of attention.
Schools where feeding problems have frequently occurred seem to get most of the attention, often at the expense of routine monitoring of the other “problem-free” schools, and sometimes of office work.
Where new forms of service delivery are introduced, e.g. with the introduction of cooperatives, much more business training, mentoring and conflict management is necessary, taking away time for routine work.
ConclusionIt is concluded from the above analysis that there are insufficient resources to do monitoring fieldwork effectively. This is in terms of both human and transport resources. Sometimes three fieldworkers, using one car allocated to the Nutrition Subdirectorate plus another car shared by all Subdirectorates in the district (Special Services, ABET and LTSS) must cover 160 schools. Some schools are in remote areas and are far apart, so fieldworkers who need to use the pool car during specific working hours i.e. between 07h00 and 16h00 experience difficulties in reaching all the allocated sites within the given time frames. Accessibility to schools is also affected by poor infrastructure, such as the state
25
of the roads, availability of adequate bridges, especially during the rainy season, as well as safety and security issues. In one area visited we had to leave all valuables behind and use a pool car as the area was a serious hijacking zone.
New service providers and cooperatives are unfamiliar with the processes and policies and require training. A supply contract for one year is expensive for both the programme and the supplier as investment in training and equipment is wasted. New co-ops need more monitoring, taking up evalu-ation time for other schools. At one site weekly visits were made for two months to resolve conflicts between the school and the co-op or amongst members of the co-op.
7.3.4 Targeting
FindingsAccording to national guidelines, primary school learners from grade R to grade 7 are targeted by the programme. In KZN province, schools are classified under a quintile system, according to the economic level of the area in which the school is located – with quintile 1 being the poorest. All quintile 1 and 2 learners are supposed to be fed. The programme also includes schools on a higher quintile rating, which might be located in an area of a higher economic rating, but were part of the feeding scheme when the Nutrition Programme was under the Department of Health. This was one location where actual meals served were far below the budgeted number of meals and there was far more dissatisfaction with the menu and quality of food. In one classroom, only eight out of a class of 20 learners took meals, but they eagerly accepted a two-slice white bread sandwich with potato curry as a filling.
Some deserving schools that need nutritional support are excluded from the programme because they are located in urban or semi urban areas. These areas may be considered as having a higher economic grading or living standards measure (LSM).
According to the interviewees, the quintile system of allocation of deserving schools is sometimes contested by the schools as it is based on whether the road to the school is tarred, the surrounding area is electrified or cement blocks are used for the buildings.
Some families are headed by a child, or have impoverished parents or grandparents and deserve to be part of the programme, even if not all the children are at primary school. A child who finishes primary school is no longer provided for by the programme and is expected to fend for himself.
In the findings of the school survey, there is no variation between the number of required against ac-tual numbers fed. This means that all schools are feeding targeted children, but not that the approach to targeting is effective in consistently and accurately identifying needy children. These results make targeting appear effective, yet from interviews it does appear that there are shortcomings.
Very needy children may be given extra support by providing take home food to use for other meals and to share with other siblings that are not targeted in this programme. Care is taken to avoid stigmatisa-tion in these instances, by giving hand-outs even to those learners that are not in such dire need.
Some children, including those on ARVs, collapse if not fed on non-feeding days. Though teachers are from the community and tend to know children in greater need, HIV status is not always dis-closed and it is difficult to start interventions in all vulnerable groups. A change in family economic circumstances is also not communicated by the parents or learners, making it difficult to identify vulnerable learners.
As far as targeting goes, there are plans to extend the School Nutrition Programme in the case of middle schools, to include secondary school learners.

26
ConclusionAt present the targeting system does reach the poorest children who are at school, provided that they are in a primary school that has an EMIS number and that the school is located in an area that is classified as poor i.e. the school is classified as a low quintile school. If it is not a low quintile school, then it must have been receiving the Nutrition Programme prior to 2004 when the programme was handled by Department of Health. The targeting system thus does reach some but not all of the poorest children, as there might be pockets of poverty even amongst so called affluent communities.
7.3.5 Institutional Arrangements
FindingsAt district level the School Nutrition Programme is housed under the Subdirectorate of Special Services chief education specialist (CES) who reports directly to the district director. Specialised Support Services houses other programmes apart from the School Nutrition Programme. These are HIV and AIDS and Life Skills Services, Remedial and Psychological Services, Co-curricular Services, Education Libraries, and Information and Technology Services. Except for the Nutrition Programme, each of these services has an assistant director. Plans to employ nutrition assistant direc-tors for each district are at an advanced stage.
At least three officers are involved with Nutrition at district level. These are the administration officer, the administration clerk and the fieldworker. In most cases, there are two to three fieldworkers per district.
At school level, there is an educator assigned with the responsibility of coordinating nutrition and she/he reports to the principal. The job descriptions of all officials relevant to the Nutrition Programme are well defined.
On a broader scale, there needs to be closer collaboration of the Education, Social Services, Health and Agriculture Departments as there are many synergies and overlaps in services rendered. The lack of sufficient vehicles for fieldwork may be dealt with if fieldworkers from different programmes coordinate their visits and share transport.
At district level, various departments fall under the same CESS cluster as the Nutrition Programme. Though this streamlines reporting , the disadvantage is that it could be overburdening the DSSS who might not be able to give individualised attention to any of the units.
Proposed changes include employment of a nutrition assistant director, who can take up some of the duties from the DDSSS. Umlazi district officials, in particular, have noted an improvement now that the NSNP reports to the SDSS and chief education specialist (CES) who were previously inspectors, compared to when they reported to a corporate manager who was more an administration person focused on transport and who did not fully understand auxiliary services.
ConclusionThe programme is well located in the Subdirectorate of Special Services at district level.
7.3.6 Communications
Findings• There does not seem to be enough collaboration between various departments at district or provin-
cial level. Questions on pupil performance, failure rates and degree of absenteeism were not well answered. The answer always given by interviewees was “examination section will answer that”.
• Each unit does their own monitoring and evaluation, meaning that the same school may be visited
27
by two or three different fieldworkers from the same Special Support Services unit but differ-ent Subdirectorates within the same week, or may be completely overlooked by all because of its location.
• At a school serviced by a co-op, school interviewees felt that they were not sufficiently consulted as far as employment of the cooperative as a supplier was concerned. They felt it was more a top-down communication system as the province decided, even when the school had proposed other suppliers. According to the province, this happens where a co-op already operates in the area but does not have a sufficient quota of learners to make it economically viable for the co-op to operate and meet its expenses.
• There is often no or very little communication between the school and the co-ops as they seldom even come to the school and communication is via the phone only. One of the schools serviced by a co-op felt that co-ops were forced upon them and were introduced as a pilot for one year and then kept going beyond the agreed contract time.
• Communication between co-op members themselves is reportedly sometimes very poor, often needing intervention from district or provincial offices. The main cause of conflicts is poor un-derstanding of business operations, unfair distribution or delegation of work or poor matching of personalities and work ethics.
• Some district officials felt that communication with provincial officials via memoranda was insuf-ficient. Poor communication was reported even for good news like extension of feeding days from 17 days to 22 days in November 2006.
• Sometimes national directives received at school or district levels have to be acted upon urgently within days of receiving them, irrespective of other work schedules.
• Schools reported very good communication with district offices and felt listened to when they had problems.
ConclusionGood communication is crucial in meeting programme objectives and in dealing with decentralised delivery at various levels, be it to channel compliments or complaints. Current communication seems to be mostly one way and regular, where supplier claims and monitoring and evaluation forms are submitted, but there is no feedback as to which claims have been paid and why the outstanding claims have not been paid.

28
8 ConCLusion
Overall the NSNP is considered to be a very good programme and one that should be strengthened. The educators particularly mention a notable positive change in learner class participation and school attendance on feeding days. In essence, most schools that are targeted do feed the majority of target learners and on all of the prescribed days.
There are however challenges in the programme that need further addressing. Amongst these are:• Supplier payments and follow up systems, as centralising these functions at provincial office seems
to overload the workforce at that office.• Food production and a change of eating habits through nutrition education that involve whole
communities, as these impact on long term sustainability of the programme.• Current targeting methods are not always effective in ensuring that all deserving learners are fed,
and sometimes lead to wastage where not all targeted learners partake of meals provided, as hap-pened in a school inherited from the previous targeting system of the Department of Health.
• Effective and regular communication.

29
9 reCoMMendations
Objectives
Longer term food security and sustainable food supply objectives could be further strengthened with more collaboration with extension officers from the Department of Agriculture. This objective might need to be driven from a higher level, i.e. national and not necessarily provincial offices. Currently there are isolated efforts to grow vegetables and fruit at certain schools. This objective needs allocation of human and financial resources.
It is evident that most of the budget allocation concentrates on the feeding scheme rather than the programme as a whole. This hampers implementation and realisation of the two other objectives, as the whole allocation of R1 per learner per day, as well as R300 each for fuel and food handler honorarium per month only pertains to the feeding scheme.
The objective of nutrition education to learners is also funded from a separate source and is driven as part of Outcomes Based Education Life Skills. The NSNP continues to include this as its objective, but neither funds it, nor monitors or evaluates it sufficiently.
Targeting
Targeting of learners to be fed in rural schools according to quintile 1 and 2 seems to work well, as all learners are fed. Targeting in urban schools, as well as schools classified as quintile 3 and above, that were part of the intervention prior to 2004, have the following challenges:• Vulnerable learners might be missed if they happen to be in a non-feeding school.• Over-budgeting and food wastage may occur in feeding schools where not all learners take meals.
A review of targeting without victimisation or stigmatisation is needed. A system of voluntary ap-plication to partake of meals, by learner or parent/guardian may help at schools classified as quintile 3 and above.
Communication
Improve communication so that policy changes are well informed and made after sufficient delibera-tions with stakeholders. Improved communications with suppliers are also needed to understand their constraints as well as to get suggestions for menu options based on local and seasonal availability of supplies.
Provincial visits were viewed as not sufficient at district level with communication being mainly through memos. However, the section head of SDSSS did report regular meetings with the Nutrition Unit.
The current procurement model is viewed by respondents as participatory and transparent and is not a top-down model where the province alone decides who will be a supplier without involvement of the school and the community as represented by the school governing bodies.
Selection of independent suppliers is satisfactory as community members feel they are consulted in the selection process. In order to avoid rebellious behaviour by communities and schools, extra efforts are recommended to avoid top-down communication regarding nomination of cooperatives as service providers.
30
Though chiefly a Department of Education programme, the programme is implemented in collabora-tion with service providers, school governing and/or community bodies at school level. School level interviewees feel they do not have as much say in selecting cooperatives as they have for independent service providers. Provincial interviewees explained that for the contract to make economic sense for cooperatives, they sometimes need to allocate up to 10 schools per cooperative. This might happen despite the presence of other potential local suppliers who previously rendered a satisfactory service. Rebellious behaviour may emanate from this so-viewed “top-down” communication.
On a broader scale, there needs to be closer collaboration between the Education, Social Services, Health and Agriculture Departments as there are many synergies and overlaps in some of the services rendered. The lack of sufficient vehicles to do fieldwork could be dealt with if fieldworkers from dif-ferent programmes coordinate their visits and share transport.
Monitoring and Evaluation
• Nutrition education for learners is being met through regular curricular activities and is not suf-ficiently measured by this programme. Nutrition education is, however, given to food handlers and covers topics such as food safety and hygiene, cooking and preparation methods etc. All training given is reported on the M&E report. It is recommended that such training is extended to food vendors and the parents of learners. It costs the same to train one or two people as it does to train 14 to 20 people.
• The inclusion of a section in the M&E report that probes what percentage of the garden produce is used in food preparation or sold and who is involved in the school gardening project, may help in assessing as well as encouraging participation in this regard.
Financial Management Systems
• Improve financial management skills at district level.• Decentralise payment systems to various districts or introduce BAS to districts as a read-only
facility for supplier enquiries initially, while systems for decentralised payment are put in place.• Speed up supply of servers at district offices.• If BAS was introduced at district level, the processing of claims may be speeded up and communi-
cation about the status of the claim would be improved. At this level, there are fewer suppliers, so most of their queries would be more efficiently addressed.
• Ease the workload and improve monitoring facilities at the provincial office to enable spot checks at the press of a button and to keep track of and coordinate all systems of NSNP. The district office could keep all paperwork for seven years and capture all data on claims. M&E and training could be provided on the computer for the provincial office to use as a tool for coordinating all functions, refine processes and plan for further developments.
• In the meantime, upgrade BAS at provincial level to consolidate all necessary information per service provider per school to speed up check backs and to enable it to operate at high speed. At the moment, it is slow because of the number of users on it.
Institutional Arrangements
• Consider locating the Ilembe district offices in closer proximity to the schools that they service to speed up document transfer and claim processing. The current location of this office is in the Durban central business district, whilst most of the schools it serves are concentrated around Stanger. This makes regular contact difficult and inefficient. It also means that only one school may be visited per day as most are two hours away, an impossible task when a pool car is used that has to be checked out at 08h00 and returned by 16h00.
• Capacity for monitoring can be improved if the transport issues are resolved by increasing the number of vehicles allocated or coordinating school visits with other units in the Specialised Support Services Subdirectorates, especially for far, inaccessible areas.

31
Human Resources
• More staff are needed at school level in order to supervise NSNP activities better, from delivery of supplies through to preparation and service, as well as to coordinate gardening and extramural nutrition education.
• At district level, employment of an assistant director for NSNP is overdue.• Revision of the salary scales of assistant director at the provincial office is necessary to be in line
with the level of responsibility and work-load, especially considering that the decentralisation of most tasks is not going to occur soon.
• Further skills transfer is needed for district staff to deal with challenges like project management, presentations, workshop facilitation, negotiation and conflict resolution.
• Additional staff resources to handle new business like cooperatives and other new supplier training, as this takes the fieldworker away from regular functions and interrupts monitoring and evaluation activities. The programme might benefit from more fieldworkers to better cater for the development or identification of new suppliers and co-ops who may join the programme later.
• Ways of improving budget allocation for honoraria for food handlers need to be sought. These may include linkages with other departments like Social Services for child grants and Agriculture for food gardens, in order for them to improve their earnings. Most food handlers are unemployed and they depend solely on what the school provides for a living. An amount based on the minimum salary requirement for domestic workers may be a good start.
Planning
• The allocation of feeding days needs to be reviewed to correspond with the number of school days for the programme to run smoothly and not interrupt schooling as school attendance, punctuality and concentration in class are affected by provision of food.
• Improvement is needed on the school targeting system to provide feeding to schools that really need the service. When not very needy learners are provided with food, there is a great deal of wastage as they don’t eat the food.
• The allowance of R1 per learner per day is insufficient to meet the one-third minimum requirement of the recommended dietary allowance. Budgetary allocations need to take note of increases in current food, fuel and transport costs in one financial year. Revision of allocated funds needs to occur regularly, in line with inflation.
