provincial waste characterization framework · provincial waste characterization framework the...
TRANSCRIPT
Provincial Waste Characterization Framework
A Joint Project of Alberta Environment,
Government of Canada, Action Plan 2000 on Climate Change (Enhanced Recycling Program)
and the Recycling Council of Alberta
Final Project Report
October, 2005
Provincial Waste Characterization Framework
Provincial Waste Characterization Framework
A Joint Project of Alberta Environment, Government of Canada, Action Plan 2000 on Climate Change (Enhanced
Recycling Program)1 and the Recycling Council of Alberta
Final Project Report October, 2005
Acknowledgements The Government of Canada Action Plan 2000 on Climate Change Minerals and Metals Program is working towards reducing Canada's greenhouse gas (GHG) emissions from the minerals and metals sector (MMS). By matching funds with other partners and collaborators, the Minerals and Metals Program supports initiatives that enhance mineral and metal recycling practices, and assess alternate production processes with focus in those industrial sectors with high GHG-emitting activities. The Minerals and Metals Program is managed by the Minerals and Metals Sector of Natural Resources Canada.
1 Natural Resources Canada chairs the Enhanced Recycling Program Advisory Committee.
Page 2
Provincial Waste Characterization Framework
Table of Contents
1 Background................................................................................................................ 4 1.1 Project Goal .................................................................................................... 4
2 Review of Existing Protocols...................................................................................... 4
3 Design Compatibility with Other Waste Characterization Studies.............................. 5 3.1 Standard definitions of waste sectors.............................................................. 5
3.1.1 Industrial Waste............................................................................................................ 6 3.1.2 Commercial Waste ....................................................................................................... 6 3.1.3 Consumer Waste.......................................................................................................... 6 3.1.4 Other Wastes................................................................................................................ 6
3.2 Standard definitions of materials in the waste stream ..................................... 6 3.3 Standardized recording and presentation of data............................................ 6
4 Procedures for Selecting Disposal Facilities, Generators, Loads and Waste Samples.......................................................................................................... 7 4.1 Disposal Facility Selection............................................................................... 7 4.2 Disposal Facility Load Selection...................................................................... 8 4.3 Disposal Facility Waste Sample Selection ...................................................... 9 4.4 Generator Selection ...................................................................................... 10 4.5 Generator Waste Sample Selection .............................................................. 11 4.6 Number of Samples and Random Sampling ................................................. 12
5 Rural Waste Characterization .................................................................................. 14 5.1 Rural Waste Characterization Methodology .................................................. 14
5.1.1 Selection and Recruiting of Businesses ..................................................................... 15 5.1.2 Site Visits .................................................................................................................... 16 5.1.3 Generation Period ...................................................................................................... 17
6 Budgeting Waste Characterization Research .......................................................... 18 6.1 Scenario #1: One landfill (regardless of what size population it serves) ....... 18 6.2 Scenario #2: Three landfills (findings at the municipality level) ..................... 19 6.3 Scenario #3: Three landfills (findings at the landfill level, a more detailed
study than Scenario #2 that provides information sufficient to describe waste composition at the level of individual landfills) .................................... 19
7 Existing Waste Composition Data............................................................................ 20
8 Overall Waste Composition Results......................................................................... 21
9 Waste Modeling ....................................................................................................... 24
10 References .............................................................................................................. 29
Appendices ................................................................................................................... 32
Page 3

Provincial Waste Characterization Framework
1 Background Comprehensive and accurate measurement of waste generation and disposal continues to be an issue at both provincial and national levels. Considerable efforts and progress are being made towards improving and streamlining the measurement of waste disposal across Canada. At the same time, additional detail and perspective can be obtained through closer examination of the composition of waste generated from various sources. A number of communities and organizations have conducted waste composition analyses for their internal use. However, there is currently no mechanism to coordinate this research, or to compile results on a provincial level. 1.1 Project Goal This project was initiated to develop a provincial waste characterization framework that will provide a suggested protocol for conducting waste characterization studies, as well as a process for coordinating and aggregating waste characterization data on a provincial level. 2 Review of Existing Protocols Phase 1 of the project involved researching existing protocols for conducting waste characterization analyses. This research is summarized in Appendix A. As shown in the table, a number of primary features that were assessed as important to the research have been outlined. These include the organization initiating the development of the protocol, date of publication, waste streams and sectors addressed, time period suggested for study, sampling method or study area, collection method or source, health and safety considerations, number of sorting categories, data analysis summary, and worksheets provided. Five primary Canadian protocols were identified, while an additional five protocols were reviewed from US sources. One regulatory protocol was also included from the European community. Sampling methodologies utilized within each protocol were also researched in more detail, and are summarized in Appendix B. Protocols were then reviewed with respect to the features identified. A comparison based on this review is summarized in Appendix C. As can be seen, various protocols have different advantages and disadvantages. For example, the BC Environment protocol does not specifically address IC&I2 or CRD3 sectors, while the Ontario Ministry protocol does not specifically deal with CRD waste. The Stewardship Ontario protocols are also limited, in that they are geared to residential waste, although they provide a high level of comprehensiveness for this waste stream.
2 Industrial, commercial and institutional is also referred to as ICI in some provinces. 3 Construction, renovation and demolition is also referred to as C&D, CR&D or DLC (demolition and landclearing) in some provinces.
Page 4

Provincial Waste Characterization Framework
The Canadian Council of Ministers of the Environment (CCME) methodology is of particular interest in that it was a previous initiative to integrate the best components from existing protocols, combining features of the BC Environment, Ontario Ministry of the Environment and California Integrated Waste Management Board protocols/guidelines to create a waste characterization methodology. This approach resulted in a good overall protocol, lacking only specific reference to CRD waste, as well as providing less detail on waste sampling methodology than some other protocols. Looking outside Canada, the Washington State Department of Ecology offers the most current (2003) and comprehensive waste characterization protocol that was identified. This protocol addresses residential, IC&I and CRD sectors, and offers considerable detail on sampling methodology, including a detailed waste category list. The comprehensiveness of this protocol is perhaps also its only drawback, in that it may be too onerous for small communities. Other international protocols are instructive in specific ways. For example, the American Society for Testing and Materials (ASTM) Standard Test Method provides a highly technical standard. The European Community (EC) regulation, on the other hand, offers a regulatory foundation for waste characterization, and includes a very comprehensive waste category listing. The reference tables provide information that will assist governments and other decision-makers to choose the best waste characterization protocol for specific research needs. In general, the CCME protocol offers a good overall guideline for undertaking generic waste composition research, while those researchers requiring an increased level of comprehensiveness may consider the Washington State protocol.
3 Design Compatibility with Other Waste Characterization Studies Waste characterization studies are typically conducted to answer questions related to the feasibility of recovering or diverting specific materials from the disposal waste stream. However, each study also has the potential to contribute to a larger body of knowledge at the provincial or national level. If research is to provide this additional value, it is important for waste characterization studies to be designed to answer immediate questions as required locally, while also considering how the results can also be utilized at the aggregate level. The latter can be facilitated by conforming to certain conventions, such as the following: 3.1 Standard definitions of waste sectors Standard definitions for waste stream sectors (e.g., industrial, construction / demolition and residential waste) can ensure that waste is assigned in the same way in each study. For instance, Guidelines for Waste Characterization Studies in the State of Washington (Cascadia Consulting Group Inc., 2003a) gives a detailed description of waste sectors:
Page 5
Provincial Waste Characterization Framework
3.1.1 Industrial Waste Originates from businesses that are engaged in agriculture, resource extraction, or manufacturing. Businesses that have North American Industry Classification System (NAICS) codes ranging from 11 to 33 (at the 2-digit level of detail) are classified as industrial. 3.1.2 Commercial Waste Originates from businesses, government agencies, and institutions engaged in any activity other than those associated with industry as defined above. Examples include, waste originating from retail and wholesale businesses, medical facilities, schools, government agencies, and park and street maintenance. Commercial entities have NAICS codes ranging from 42 to 92 (at the 2-digit level of detail). 3.1.3 Consumer Waste Originates from households as a function of the “living” activities in those households. In the strict definition, it does not include waste generated by business activity conducted at households, although for practical purposes it can be difficult to distinguish home-business waste from consumer waste in a characterization study. Consumer waste also does not include waste generated by construction, remodeling, or landscaping activities that are conducted by hired companies at a residential location. 3.1.4 Other Wastes Typically are tracked and counted separately by waste disposal facilities. Examples include sludge from sewage treatment plants, petroleum-contaminated soils, asbestos, and other special wastes. 3.2 Standard definitions of materials in the waste stream Material definitions (e.g., newspaper, PET bottles, food waste, painted wood, concrete, aluminum foil) are also required to guide waste characterization studies. A list of material definitions that cover numerous types of studies can be developed. This compatibility in material lists can facilitate comparisons in disposal behaviour, recycling levels and overall program performance. The California Statewide Waste Characterization Study – Results and Final Report, which includes the Draft Regulations Governing Disposal Characterization Studies (Cascadia Consulting Group Inc. et al, 1999) and the Guidelines for Waste Characterization Studies in the State of Washington (Cascadia Consulting Group Inc., 2003a), both have material definition lists. Additionally, the CCME methodology provides a basic list of waste categories for sampling purposes (see Appendix G). 3.3 Standardized recording and presentation of data Selecting specific databases or models for information storage can assist with analysis and data sharing among communities. The following waste characterization databases and model are available for communities utilizing data as required.
Page 6
Provincial Waste Characterization Framework
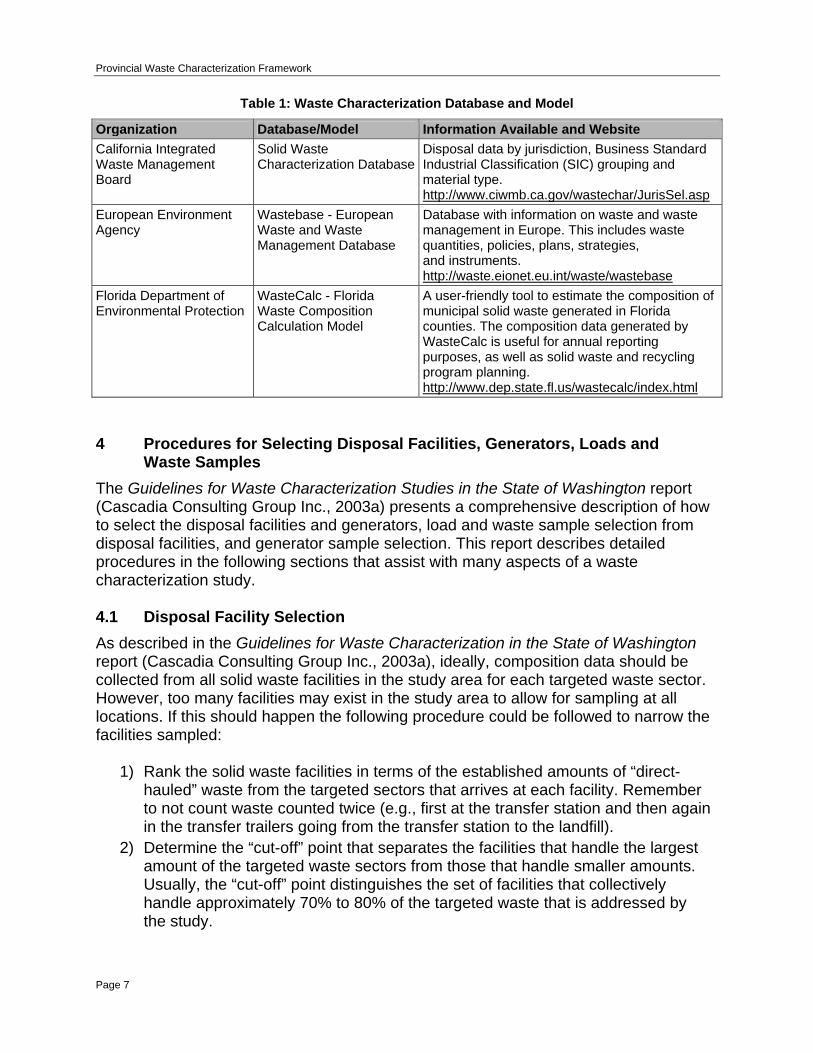
Table 1: Waste Characterization Database and Model
Organization Database/Model Information Available and Website California Integrated Waste Management Board
Solid Waste Characterization Database
Disposal data by jurisdiction, Business Standard Industrial Classification (SIC) grouping and material type. http://www.ciwmb.ca.gov/wastechar/JurisSel.asp
European Environment Agency
Wastebase - European Waste and Waste Management Database
Database with information on waste and waste management in Europe. This includes waste quantities, policies, plans, strategies, and instruments. http://waste.eionet.eu.int/waste/wastebase
Florida Department of Environmental Protection
WasteCalc - Florida Waste Composition Calculation Model
A user-friendly tool to estimate the composition of municipal solid waste generated in Florida counties. The composition data generated by WasteCalc is useful for annual reporting purposes, as well as solid waste and recycling program planning. http://www.dep.state.fl.us/wastecalc/index.html
4 Procedures for Selecting Disposal Facilities, Generators, Loads and
Waste Samples The Guidelines for Waste Characterization Studies in the State of Washington report (Cascadia Consulting Group Inc., 2003a) presents a comprehensive description of how to select the disposal facilities and generators, load and waste sample selection from disposal facilities, and generator sample selection. This report describes detailed procedures in the following sections that assist with many aspects of a waste characterization study. 4.1 Disposal Facility Selection As described in the Guidelines for Waste Characterization in the State of Washington report (Cascadia Consulting Group Inc., 2003a), ideally, composition data should be collected from all solid waste facilities in the study area for each targeted waste sector. However, too many facilities may exist in the study area to allow for sampling at all locations. If this should happen the following procedure could be followed to narrow the facilities sampled:
1) Rank the solid waste facilities in terms of the established amounts of “direct-hauled” waste from the targeted sectors that arrives at each facility. Remember to not count waste counted twice (e.g., first at the transfer station and then again in the transfer trailers going from the transfer station to the landfill).
2) Determine the “cut-off” point that separates the facilities that handle the largest amount of the targeted waste sectors from those that handle smaller amounts. Usually, the “cut-off” point distinguishes the set of facilities that collectively handle approximately 70% to 80% of the targeted waste that is addressed by the study.
Page 7
Provincial Waste Characterization Framework
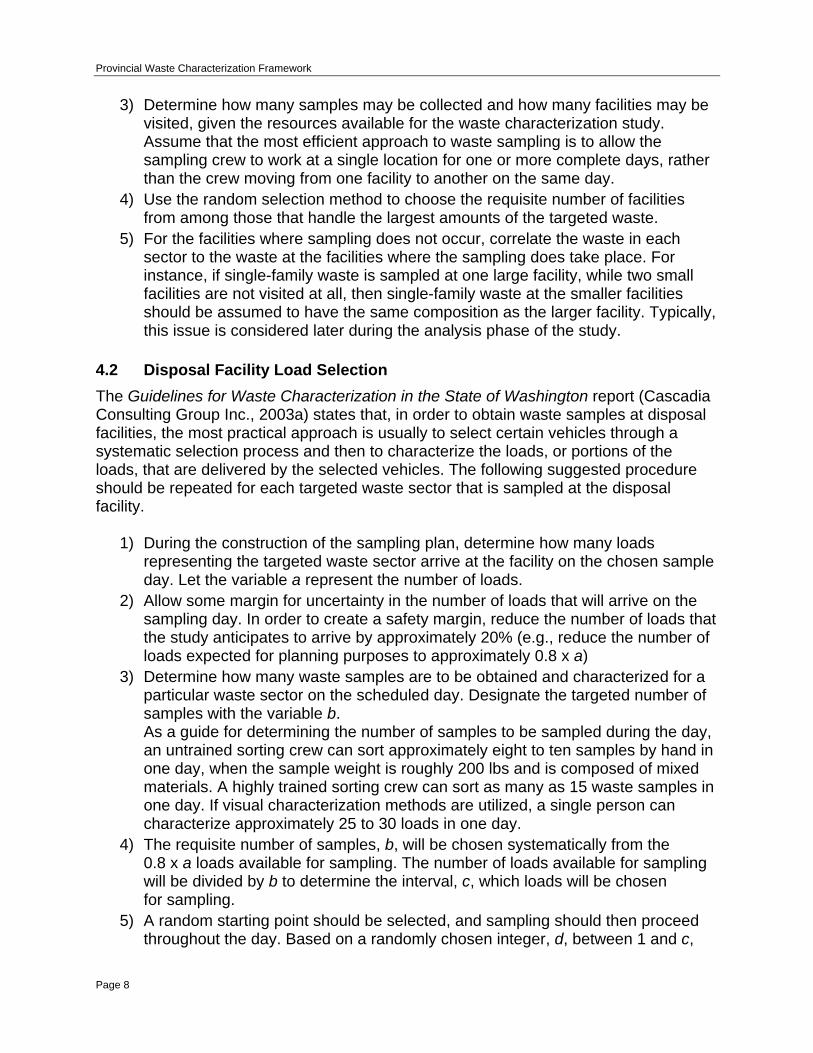
3) Determine how many samples may be collected and how many facilities may be visited, given the resources available for the waste characterization study. Assume that the most efficient approach to waste sampling is to allow the sampling crew to work at a single location for one or more complete days, rather than the crew moving from one facility to another on the same day.
4) Use the random selection method to choose the requisite number of facilities from among those that handle the largest amounts of the targeted waste.
5) For the facilities where sampling does not occur, correlate the waste in each sector to the waste at the facilities where the sampling does take place. For instance, if single-family waste is sampled at one large facility, while two small facilities are not visited at all, then single-family waste at the smaller facilities should be assumed to have the same composition as the larger facility. Typically, this issue is considered later during the analysis phase of the study.
4.2 Disposal Facility Load Selection The Guidelines for Waste Characterization in the State of Washington report (Cascadia Consulting Group Inc., 2003a) states that, in order to obtain waste samples at disposal facilities, the most practical approach is usually to select certain vehicles through a systematic selection process and then to characterize the loads, or portions of the loads, that are delivered by the selected vehicles. The following suggested procedure should be repeated for each targeted waste sector that is sampled at the disposal facility.
1) During the construction of the sampling plan, determine how many loads representing the targeted waste sector arrive at the facility on the chosen sample day. Let the variable a represent the number of loads.
2) Allow some margin for uncertainty in the number of loads that will arrive on the sampling day. In order to create a safety margin, reduce the number of loads that the study anticipates to arrive by approximately 20% (e.g., reduce the number of loads expected for planning purposes to approximately 0.8 x a)
3) Determine how many waste samples are to be obtained and characterized for a particular waste sector on the scheduled day. Designate the targeted number of samples with the variable b. As a guide for determining the number of samples to be sampled during the day, an untrained sorting crew can sort approximately eight to ten samples by hand in one day, when the sample weight is roughly 200 lbs and is composed of mixed materials. A highly trained sorting crew can sort as many as 15 waste samples in one day. If visual characterization methods are utilized, a single person can characterize approximately 25 to 30 loads in one day.
4) The requisite number of samples, b, will be chosen systematically from the 0.8 x a loads available for sampling. The number of loads available for sampling will be divided by b to determine the interval, c, which loads will be chosen for sampling.
5) A random starting point should be selected, and sampling should then proceed throughout the day. Based on a randomly chosen integer, d, between 1 and c,
Page 8

Provincial Waste Characterization Framework
the sampling crew should obtain the first sample of the day from the dth load of the targeted waste sector that arrives on the sampling day. Every cth load thereafter should be sampled, until the quota of samples is met for the day.
a – expected number of loads for the day b – targeted number of samples c – interval at which loads will be selected for sampling d –number corresponding to the first sampled load
4.3 Disposal Facility Waste Sample Selection The appropriate procedure for selecting the waste from a load, as presented in the Guidelines for Waste Characterization in the State of Washington report (Cascadia Consulting Group Inc., 2003a), is to be characterized depending on the method of characterization. If visual composition estimates are being used, then the entire load should be characterized. If hand sorting is being done, then a manageable portion of the load should be selected through the random selection.
1) Tip the load onto the facility floor or on to the ground, such that it forms a symmetrical elongated pile.
2) Envision that a grid divides the load into multiple sections. The appropriate number of sections depends on the size of the load. For loads tipped from packer trucks or other large vehicles, divide the load in a grid with 16 sections (Figure 1). For smaller loads, envision the load being divided into eight sections.
Figure 1: Imaginary Grid on Elongated Pile
(Cascadia Consulting Group Inc., 2003a)
3) Choose one cell through the random selection process. Extract the waste material dedicated to the selected cell and move it to the sorting area. Examples of recommended numbers and sample sizes include can be viewed in Table 2.
Page 9
Provincial Waste Characterization Framework
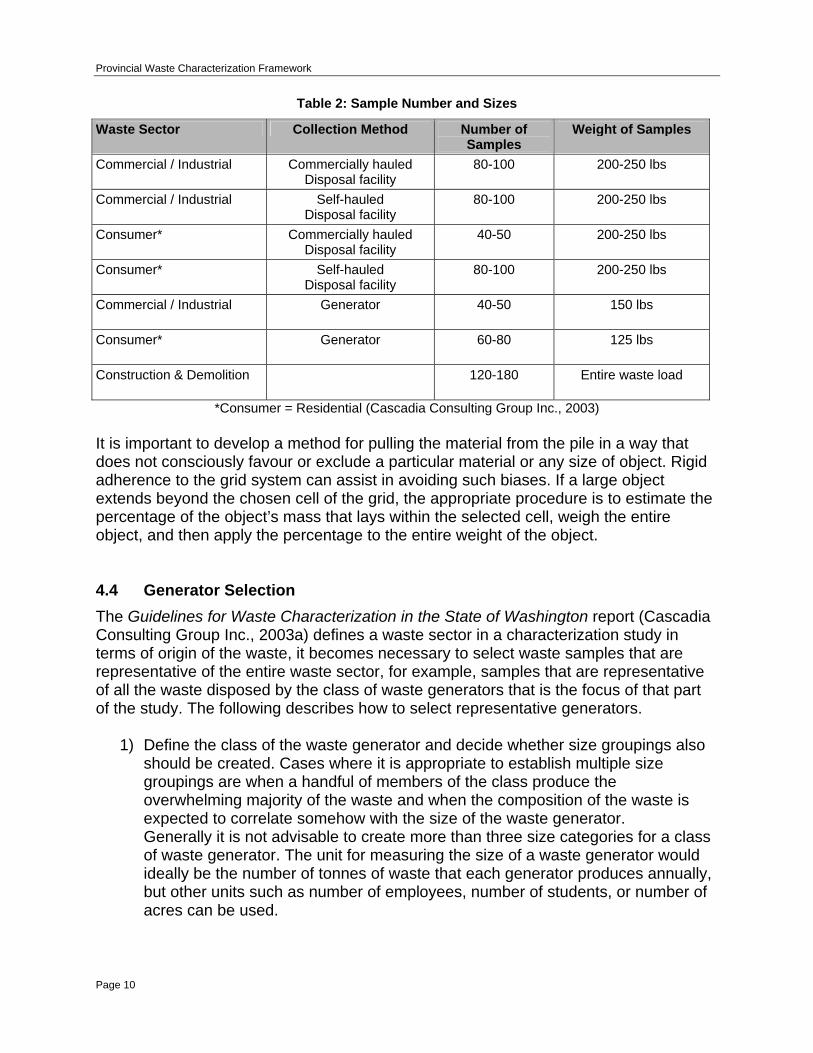
Table 2: Sample Number and Sizes
Waste Sector Collection Method Number of Samples
Weight of Samples
Commercial / Industrial Commercially hauled Disposal facility
80-100 200-250 lbs
Commercial / Industrial Self-hauled Disposal facility
80-100 200-250 lbs
Consumer* Commercially hauled Disposal facility
40-50 200-250 lbs
Consumer* Self-hauled Disposal facility
80-100 200-250 lbs
Commercial / Industrial Generator
40-50 150 lbs
Consumer* Generator
60-80 125 lbs
Construction & Demolition
120-180 Entire waste load
*Consumer = Residential (Cascadia Consulting Group Inc., 2003) It is important to develop a method for pulling the material from the pile in a way that does not consciously favour or exclude a particular material or any size of object. Rigid adherence to the grid system can assist in avoiding such biases. If a large object extends beyond the chosen cell of the grid, the appropriate procedure is to estimate the percentage of the object’s mass that lays within the selected cell, weigh the entire object, and then apply the percentage to the entire weight of the object. 4.4 Generator Selection The Guidelines for Waste Characterization in the State of Washington report (Cascadia Consulting Group Inc., 2003a) defines a waste sector in a characterization study in terms of origin of the waste, it becomes necessary to select waste samples that are representative of the entire waste sector, for example, samples that are representative of all the waste disposed by the class of waste generators that is the focus of that part of the study. The following describes how to select representative generators.
1) Define the class of the waste generator and decide whether size groupings also should be created. Cases where it is appropriate to establish multiple size groupings are when a handful of members of the class produce the overwhelming majority of the waste and when the composition of the waste is expected to correlate somehow with the size of the waste generator. Generally it is not advisable to create more than three size categories for a class of waste generator. The unit for measuring the size of a waste generator would ideally be the number of tonnes of waste that each generator produces annually, but other units such as number of employees, number of students, or number of acres can be used.
Page 10

Provincial Waste Characterization Framework
2) Devise a method of random selection for choosing representative businesses, agencies, buildings, and homes that belong to the class of generator. Usually this is completed by establishing a comprehensive list of all members of the class. The list may be compiled by someone with local knowledge of the generator class, or it may be taken from an existing source such as the phone book or from various companies that are in the business of producing lists for marketing purposes (e.g., Dun and Bradstreet). Select members at random from the list and contact them to ensure that they meet the criteria for being included in the desired class and/or size group of generators.
4.5 Generator Waste Sample Selection A process that can be followed to obtain samples from a randomly selected generator, as presented in the Guidelines for Waste Characterization in the State of Washington report (Cascadia Consulting Group Inc., 2003a), includes:
1) Identify and distinguish the waste streams produced by the generator. It is important to be cognizant of the waste sectors that are being considered in the larger waste characterization study. For instance, a selected generator produces waste that is sent to the landfill and some that is recycled, but the study focuses only on landfill waste, resulting in the data collected describing only the landfill waste. However, even when the destination sectors of waste are properly distinguished, it is still possible for the generator to have multiple waste streams within each waste destination sector.
2) When the waste streams have been identified for a given waste destination sector at a generator, each waste stream should be characterized separately. In cases where a waste stream consists of a pure material (e.g., dirt, food scraps), it usually is not necessary to characterize the waste stream by sorting an actual sample. Rather, it is sufficient to quantify the waste stream and note that it is composed entirely of one material. In cases where the waste stream is not homogenous, then hand-sorted or visual characterization methods should be applied to the waste sample.
3) If a sample is to be hand-sorted, then a method should be devised for selecting a sample at random from the available waste. If the waste is contained in a dumpster, then a vertical cross-section of waste weighing approximately 150 pounds should be extracted from the dumpster and placed in a container for transport to a location where it can be sorted. If there are multiple dumpsters, then one should be chosen at random to provide the sample. Note that multiple dumpsters may be an indication that there are actually multiple waste streams at the location. This possibility should be investigated before a waste sample is taken.
Page 11
Provincial Waste Characterization Framework
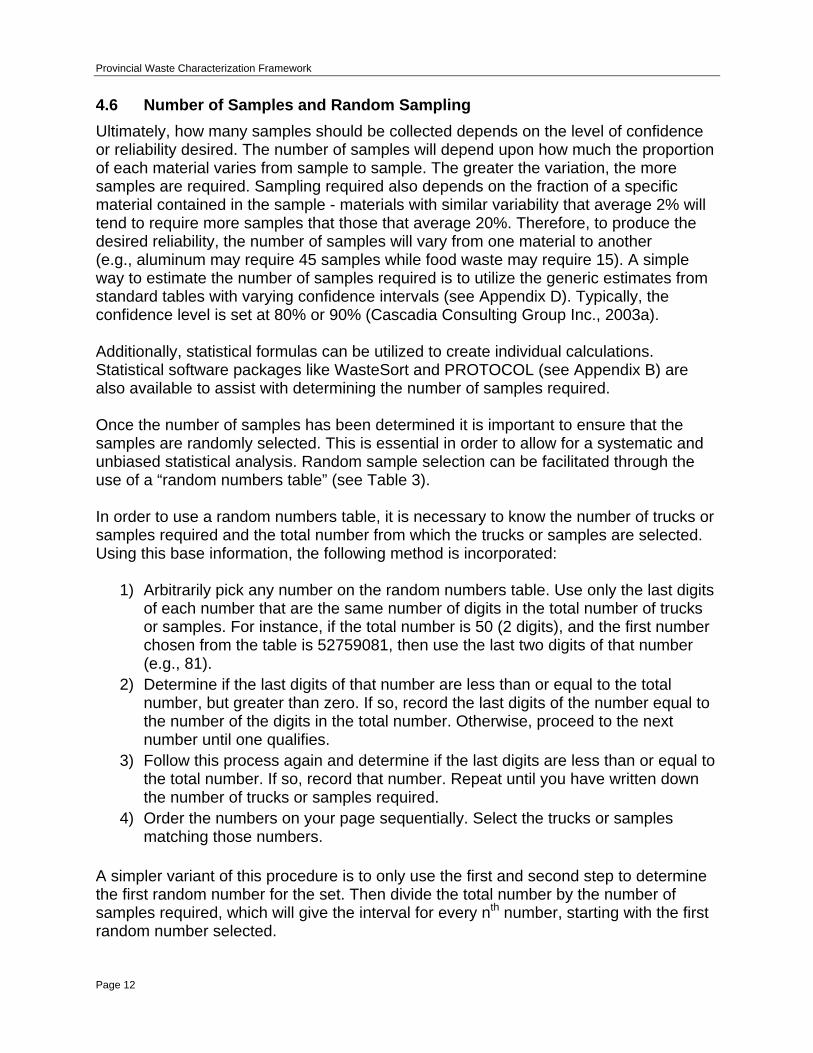
4.6 Number of Samples and Random Sampling Ultimately, how many samples should be collected depends on the level of confidence or reliability desired. The number of samples will depend upon how much the proportion of each material varies from sample to sample. The greater the variation, the more samples are required. Sampling required also depends on the fraction of a specific material contained in the sample - materials with similar variability that average 2% will tend to require more samples that those that average 20%. Therefore, to produce the desired reliability, the number of samples will vary from one material to another (e.g., aluminum may require 45 samples while food waste may require 15). A simple way to estimate the number of samples required is to utilize the generic estimates from standard tables with varying confidence intervals (see Appendix D). Typically, the confidence level is set at 80% or 90% (Cascadia Consulting Group Inc., 2003a). Additionally, statistical formulas can be utilized to create individual calculations. Statistical software packages like WasteSort and PROTOCOL (see Appendix B) are also available to assist with determining the number of samples required. Once the number of samples has been determined it is important to ensure that the samples are randomly selected. This is essential in order to allow for a systematic and unbiased statistical analysis. Random sample selection can be facilitated through the use of a “random numbers table” (see Table 3). In order to use a random numbers table, it is necessary to know the number of trucks or samples required and the total number from which the trucks or samples are selected. Using this base information, the following method is incorporated:
1) Arbitrarily pick any number on the random numbers table. Use only the last digits of each number that are the same number of digits in the total number of trucks or samples. For instance, if the total number is 50 (2 digits), and the first number chosen from the table is 52759081, then use the last two digits of that number (e.g., 81).
2) Determine if the last digits of that number are less than or equal to the total number, but greater than zero. If so, record the last digits of the number equal to the number of the digits in the total number. Otherwise, proceed to the next number until one qualifies.
3) Follow this process again and determine if the last digits are less than or equal to the total number. If so, record that number. Repeat until you have written down the number of trucks or samples required.
4) Order the numbers on your page sequentially. Select the trucks or samples matching those numbers.
A simpler variant of this procedure is to only use the first and second step to determine the first random number for the set. Then divide the total number by the number of samples required, which will give the interval for every nth number, starting with the first random number selected.
Page 12

Provincial Waste Characterization Framework
Table 3: Random Numbers Table
(RecycleWorlds Consulting Corp., 1994)
Page 13
Provincial Waste Characterization Framework
5 Rural Waste Characterization After conducting significant research into the area of waste characterization methodologies, little information was found dedicated to rural areas. The following waste characterization studies were examined:
2000 Solid Waste Characterization Study - Alameda County, California (R.W. Beck, 2001)
•
•
•
•
•
•
•
•
2002 Oregon Solid Waste Characterization and Composition (Sky Valley Associates, 2004) California Statewide Waste Characterization Study (Cascadia Consulting Group Inc., 2004a) King County Waste Monitoring Program – 2002/2003 Comprehensive Waste Stream Characterization and Transfer Station Customer Surveys – Final Report (Cascadia Consulting Group Inc, 2004b) Iowa Solid Waste Characterization (R.W. Beck, 1998) Minnesota Statewide MSW Composition Study (R.W. Beck, 2000) Pennsylvania Statewide Waste Composition Study (R.W. Beck, 2003) Wisconsin Statewide Waste Characterization Study (Cascadia Consulting Group Inc., 2003b)
In most cases, a standard methodology for disposal facility and generator sampling utilized for municipalities, including physical sorting and visual surveying, is adapted to rural areas. 5.1 Rural Waste Characterization Methodology The most comprehensive report found on rural waste characterization is the Rural Waste Characterization Report (Cascadia Consulting Group Inc., and Green Solutions Inc., 2003) for the Washington State Department of Ecology. The general approach followed for the generator-based portion of the study included developing estimates for the quantity and composition of all solid waste produced by selected industries and types of agriculture that are typical to the study area. The basic steps involved in developing the estimates, as described in this report (Cascadia Consulting Group Inc., and Green Solutions Inc., 2003) incorporate the following:
1) Defining target industry groups, deciding how many waste samples or waste characterization “observations” to conduct to represent the waste disposed by each industry group, and how many samples to obtain from the study area.
2) Using a random selection and recruitment method to identify industrial and agricultural businesses to participate in the study.
Page 14
Provincial Waste Characterization Framework
3) Contacting and visiting the recruited businesses to conduct measurements of waste generation and to characterize each waste stream produced by each business.
4) Combining the composition and quantity data from each site to form a broader picture of all waste produced by each industrial/agricultural group.
5) “Scaling up” the quantity estimates for each industrial or agricultural group in the study area to reflect waste generated by that group state-wide.
Key principles included the following:
1) Representative businesses from each industrial and agricultural group were selected at random from available lists.
2) Study endeavored to classify and quantify all segments of the entire solid waste stream generated by each business, including solid waste that is taken to landfills, recycled, reused, or disposed of through other methods.
3) Study utilized a protocol for sampling and characterization through either hand-sorting, visual estimation of contents, or identification of pure streams, to each type of waste encountered at each business that participated in the study.
5.1.1 Selection and Recruiting of Businesses The Rural Waste Characterization Report (Cascadia Consulting Group Inc., and Green Solutions Inc., 2003) suggests that the following procedure be followed for recruiting businesses:
1) Obtain a list of businesses located in the study area. Utilize SIC codes to differentiate businesses into targets industry groups and input the businesses randomly into a database.
2) Make contact with randomly selected business. Explain the purpose of the study, and ask to speak to the person who is knowledgeable about the types and quantities of wastes the business generates. The name, phone number, and other contact information for the person that is best able to provide information should be recorded.
3) Gather industry group and size information. Confirm what the business does as its primary activity and that it fits with its assigned industry group. The number of employees at the work site is determined, or if the business is agricultural-based, how many acres or animals it manages is determined.
4) Arrange a visit. A site visit is requested to obtain waste quantity measurements and waste composition data.
5) Classify waste streams. Interviews are utilized to determine material generation at each site as by-products of the main business activity. Information that could quantify each type of waste is requested, or plans are made to conduct direct measurements during the scheduled visit. The nature and disposition of each waste stream is noted.
Page 15

Provincial Waste Characterization Framework
5.1.2 Site Visits As presented in the Rural Waste Characterization Report (Cascadia Consulting Group Inc., and Green Solutions Inc., 2003), site visits must be arranged with each business. Each visit can begin with an interview to verify information obtained previously and to discover whether any waste types had been overlooked during the initial conversation. Once this is completed, determining which waste can be sampled and sorted and which waste can be quantified and characterized by observation or examination of records is important. The way the waste is disposed may determine how it is sampled. Waste can be separated into three categories: landfilled, other disposal or beneficial use. 5.1.2.1 Landfilled Waste Landfilled waste is generally the easiest type to quantify. If the business self-hauls the waste, they typically know the number of trips they make to the landfill each week, month or year and they know approximately how much waste they haul each trip. If the waste is collected by a commercial hauler, the size of the dumpster and the frequency of the pick-up can be determined. If there is currently waste in the dumpster, that waste can be manually sorted and weighed, if possible. Otherwise, it cam be characterized visually. Finally, if there is no waste to be sampled at that time, a representative of the business can be interviewed to describe the type of waste generated. The annual amount of waste is determined based on the interview, and a composition profile from other similar sites can be applied to estimate the amount. 5.1.2.2 Other Disposal In many cases, businesses use other disposal to handle infrequent wastes. Examples of other disposal include stockpiling, burning or burying waste. Stockpiled material, such as old tires can be easily measured. 5.1.2.3 Beneficial Use The types and amounts of waste being used beneficially tend to be specific to the industry. For instance, field crops, orchards and vegetable industry groups typically have some sort of crop residues that can be returned to the field. In most cases one should be able to obtain a measurement of the amount of material being sent for beneficial use. For example, if a crop has been recently harvested, then a sample of the crop residue can be collected and weighed. If it is not possible to obtain an accurate measurement of the amount of waste disposed through beneficial use, then an estimate can be constructed based on information obtained in the interview with the business representative. For instance, a business may have records of the amount of waste used beneficially if the waste is transferred to another company for processing.
Page 16
Provincial Waste Characterization Framework
5.1.3 Generation Period Each sample is associated with a generation time period and the method to determine the generation time depends on the type of disposal.
As described in the Rural Waste Characterization Report (Cascadia Consulting Group Inc., and Green Solutions Inc., 2003), for landfilled wastes, if they are commercially collected, the time since the last pick-up is used to estimate generation time, and the amount of waste observed in the waste container can be taken to be the amount of waste that accumulated during that generation period. For example, if waste is collected on Monday morning and the site is visited on Wednesday morning, the observed quantity is associated with two days of waste generation. This quantity can then be extrapolated to a year. For other landfilled samples, such as self-hauled waste, representatives of participating businesses are interviewed to determine the frequency with which they transport waste to the landfill. Other disposal may include stockpiled materials. For these samples, the business representative is asked to estimate the accumulation time associated with the material if the material accumulated at a regular rate for the whole time. For instance, a pile of tires might have taken two years to accumulate. This quantity would then be divided by two to calculate an annual estimate. If the material did not accumulate at a steady rate, but, instead, was generated as the result of one event, the interviewer is asked how often this amount of waste was generated. For example, a pile of trees at an orchard can be estimated by the orchard representative to result from tree removals that occur once every ten years. For this reason, the measured quantity is divided by ten to obtain an annual estimate. Creating annual estimates for beneficially used waste requires a more varied approach than for landfilled or other disposal samples. For instance, for the industrial group field crops, a type of beneficially used waste common to all generators is crop residues. For crops that have been recently harvested, residues are measured by raking up remaining residues within a 625 square foot area. This quantity is first extrapolated to an acre, then to the total farm. The resulting quantity represents the quantity of crop residues associated with that crop for that farm. All businesses in the industry group livestock dispose of manure. If it is left in a field, it is considered to be stockpiling. When manure is collected for composting, this material is considered to be beneficially used. Similar to stockpiled materials, if the manure is gathered in one area for composting, the interviewer can ask the length of time it took for the livestock to generate that quantity of manure. This quantity can be scaled up to a year based on the estimated generation for that sample. Disposal facility samples can also be sorted utilizing the same procedure described in 4.2 Disposal Facility Load Selection and 4.3 Disposal Facility Waste Sample Selection sections in this report.
Page 17

Provincial Waste Characterization Framework
6 Budgeting Waste Characterization Research Budgetary considerations are often a critical factor when determining waste characterization approaches. Generalizing costs for a waste characterization study can be very difficult as there are numerous types of waste characterization study options. A waste characterization study can range greatly in price, from $3,000 to $500,000, depending on its size and comprehensiveness. For instance, a disposal facility waste characterization involving 80 samples of residential waste, 120 samples of commercial waste, and 120 samples of self-haul waste might be expected to cost between $80,000 and $120,000 USD (Cascadia Consulting Group Inc., 2003a). A study of generator waste is relatively more expensive on a per-sample basis as site visits are required. Cost estimates for three types of waste characterization studies conducted by consultants are described below (Hulse, K., 2005). All cost estimates are in Canadian dollars and rely on the following assumptions:
• •
No training is necessary for members of the sorting crew Tonnage data for each waste sector (e.g., single-family, multifamily, each type of IC&I) is readily available
6.1 Scenario #1: One landfill (regardless of what size population it serves) Task Cost Residential Obtain and sort 60 residential waste samples (30 single-family, 30 multi-family) $25,500
Develop sampling plan, analyze data and prepare report $23,000
Subtotal $48,500 Industrial, Commercial and Institutional Obtain and sort 120 IC&I waste samples (random selection of incoming loads) $51,000
Develop sampling plan, analyze data and prepare report $23,000
Subtotal $74,000 Construction and Demolition Visually characterize 160 construction and demolition loads $6,000
Develop sampling plan, analyze data and prepare report $12,000
Subtotal $18,000 TOTAL $140,500
Page 18
Provincial Waste Characterization Framework
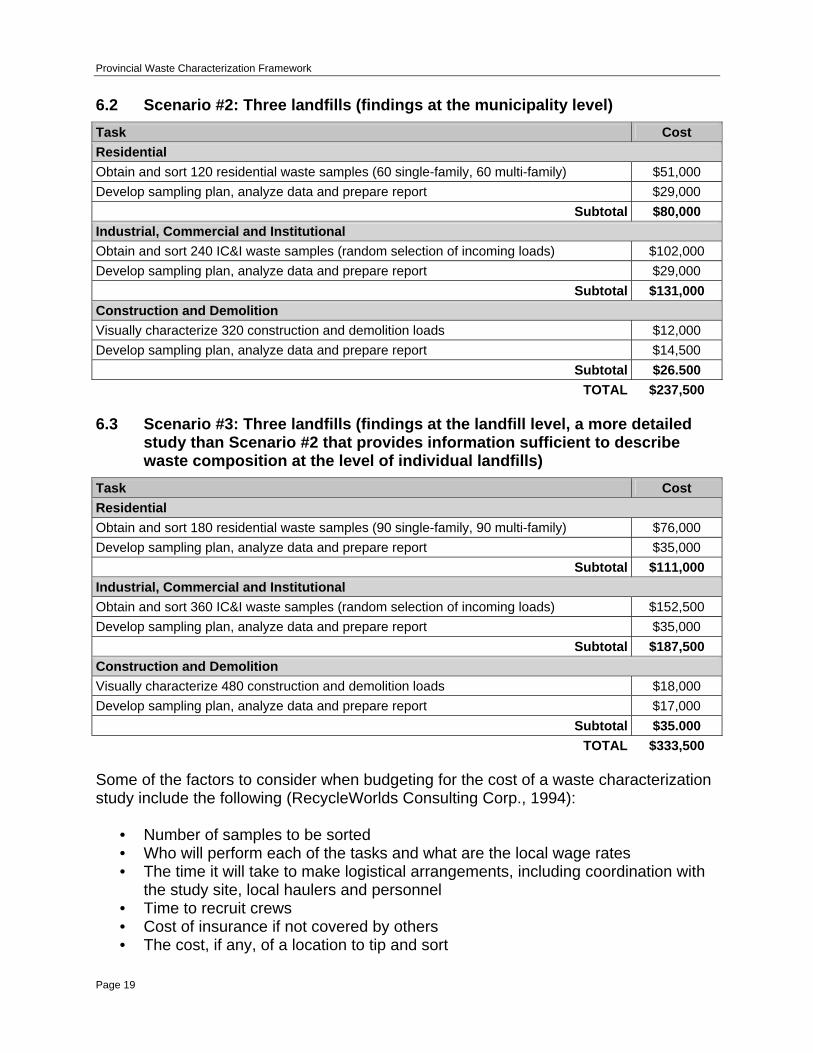
6.2 Scenario #2: Three landfills (findings at the municipality level) Task Cost Residential Obtain and sort 120 residential waste samples (60 single-family, 60 multi-family) $51,000
Develop sampling plan, analyze data and prepare report $29,000
Subtotal $80,000 Industrial, Commercial and Institutional Obtain and sort 240 IC&I waste samples (random selection of incoming loads) $102,000
Develop sampling plan, analyze data and prepare report $29,000
Subtotal $131,000 Construction and Demolition Visually characterize 320 construction and demolition loads $12,000
Develop sampling plan, analyze data and prepare report $14,500
Subtotal $26.500 TOTAL $237,500
6.3 Scenario #3: Three landfills (findings at the landfill level, a more detailed
study than Scenario #2 that provides information sufficient to describe waste composition at the level of individual landfills)
Task Cost Residential Obtain and sort 180 residential waste samples (90 single-family, 90 multi-family) $76,000
Develop sampling plan, analyze data and prepare report $35,000
Subtotal $111,000 Industrial, Commercial and Institutional Obtain and sort 360 IC&I waste samples (random selection of incoming loads) $152,500
Develop sampling plan, analyze data and prepare report $35,000
Subtotal $187,500 Construction and Demolition Visually characterize 480 construction and demolition loads $18,000
Develop sampling plan, analyze data and prepare report $17,000
Subtotal $35.000 TOTAL $333,500
Some of the factors to consider when budgeting for the cost of a waste characterization study include the following (RecycleWorlds Consulting Corp., 1994):
• • •
• • •
Number of samples to be sorted Who will perform each of the tasks and what are the local wage rates The time it will take to make logistical arrangements, including coordination with the study site, local haulers and personnel Time to recruit crews Cost of insurance if not covered by others The cost, if any, of a location to tip and sort
Page 19
Provincial Waste Characterization Framework
•
• • • •
• •
The cost of renting or borrowing an end loader and operator to move loads tipped from trucks selected for sampling The cost of sorting equipment for the crews such as scale, gloves etc. The time and cost to sort each sample The cost of transporting supervisors and crews The costs of longer sorting times if there is inclement weather, or rescheduling in the event that weather conditions prevent the originally planned sort time The time and cost of analyzing the data and preparing a report A contingency for overruns
One way to minimize costs is to hire a consultant to assist with the waste characterization design, logistics and training. Internal staff can then be utilized to conduct the waste characterization study. If internal time and knowledge is available to analyze the data, keeping this in-house can also reduce costs. However, if internal expertise does not exist, consultants can also be used to complete the data analysis and develop a report, if required. For municipalities, another way to minimize cost is to provide the sorting location and to utilize municipal employees and machinery to transport materials to and from the disposal site to the sorting location. 7 Existing Waste Composition Data Phase 2 of the project researched available Alberta waste characterization data for communities of various sizes, considering residential, IC&I and CRD sectors. Existing and planned studies, as well as supplemental data, are outlined in Appendix E. As shown, the majority of data is focused in Calgary and Edmonton, with both cities having completed research into residential waste composition. In addition, Calgary has also conducted research into IC&I waste composition, with additional research planned, although they are the only municipality identified as having undertaken IC&I studies. Therefore, insight into waste composition in this sector remains minimal. The study conducted by the Calgary and Region Waste Reduction Partnership, as well as research planned by the City of Grande Prairie and Lesser Slave Lake Region may help to provide additional information on waste composition outside the two major cities. However, the nature of waste in small towns and rural communities remains a significant gap in waste composition research. Even expanding the scope of research outside Alberta did not assist in identifying comprehensive studies for non-urban areas.
Page 20

Provincial Waste Characterization Framework
8 Overall Waste Composition Results Waste composition data that was obtained was compiled to present overall estimates of various waste streams in Alberta. These results are represented in the figures below:
Concrete10%
Drywall13%
Metal6%
Other26%
Roofing 10%
Wood33%
Asphalt1%
Brick/Stone1%
Figure 2: Alberta Construction and Demolition Waste
Source: Audit - Calgary (Shepard, Ecco Waste Systems), Edmonton (Northlands Sand and Gravel), Grande Prairie (City of Grande Prairie), Lethbridge (Lethbridge Regional), Lundbreck (Crowsnest/Pincher
Creek), Wainwright (Wainwright Regional) Alberta Construction, Renovation and Demolition (CRD) Waste Characterization Study
CH2M Gore and Storrie Limited, December 2000
Page 21
Provincial Waste Characterization Framework
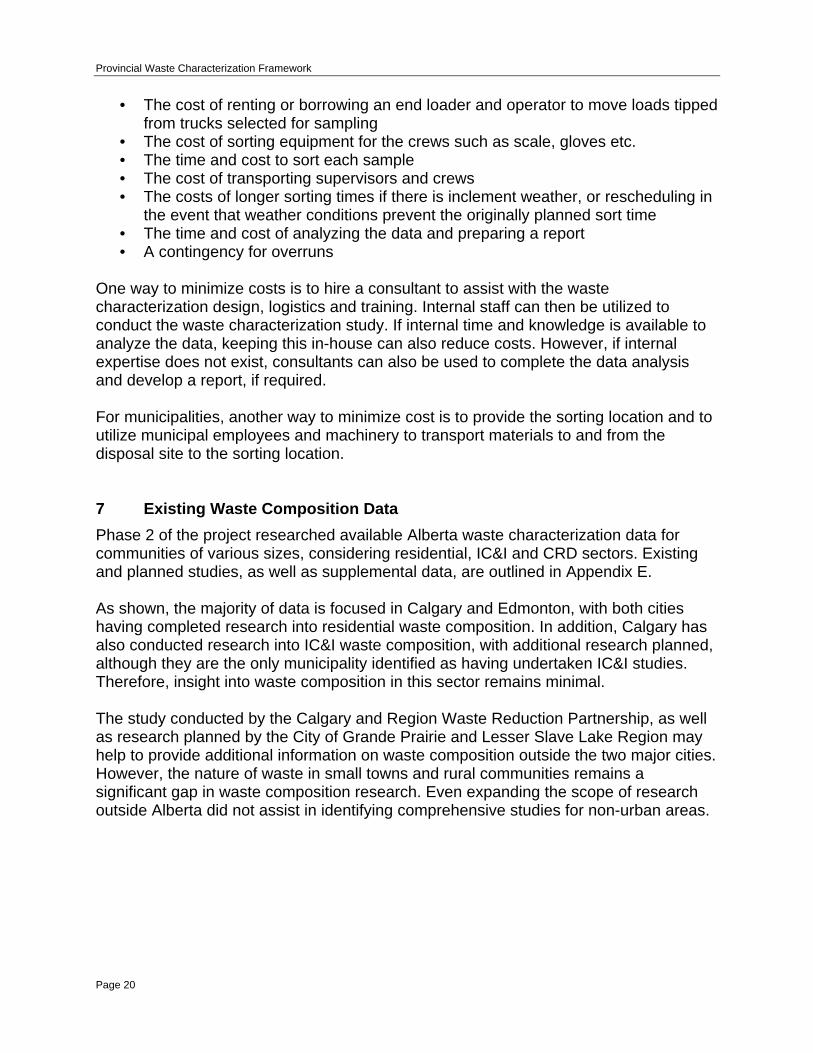
Organics25%
Paper and Cardboard
33%
Other Waste10%
Plastics10%
Wood and Soil12%
Industrial Waste1%
Glass2%
Construction and Demolition
3%
Metal 4%
Figure 3: Large City IC&I Waste
Source: City of Calgary IC&I/CRD Waste Composition Study - UMA Engineering Ltd. in association with EBA Engineering Consultants Ltd., January 2001
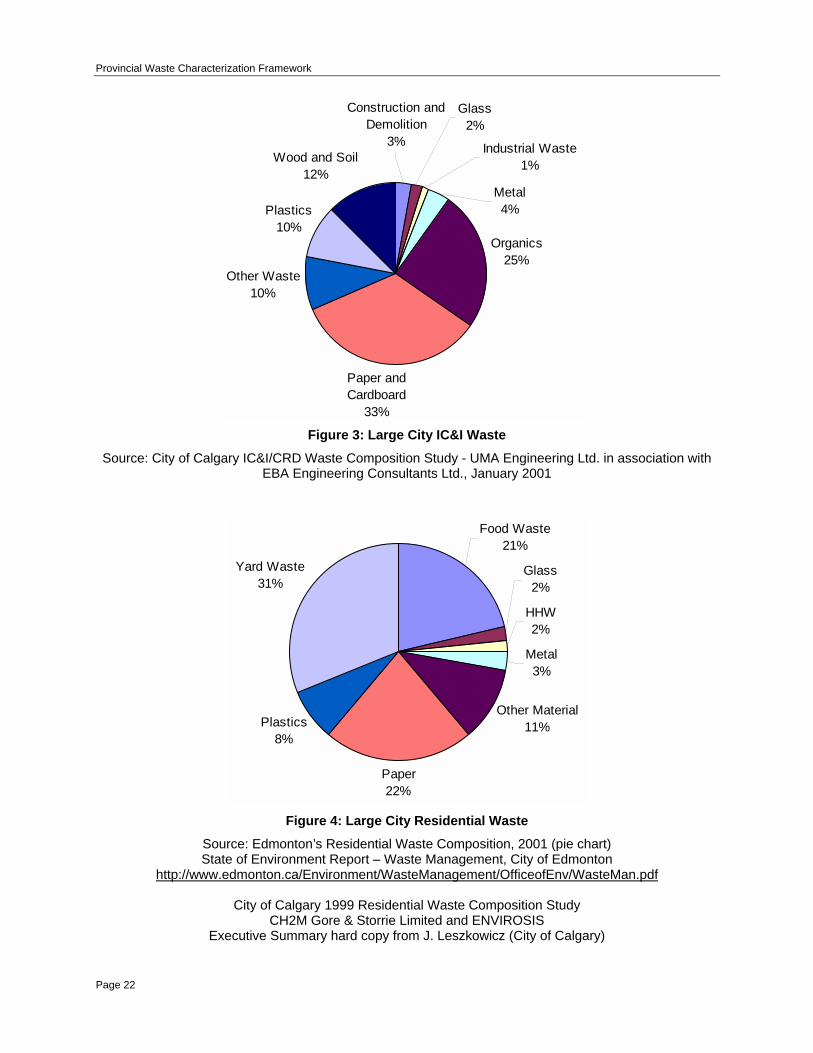
Food Waste21%
Glass2%
HHW2%
Metal3%
Other Material11%
Paper22%
Plastics8%
Yard Waste31%
Figure 4: Large City Residential Waste
Source: Edmonton’s Residential Waste Composition, 2001 (pie chart) State of Environment Report – Waste Management, City of Edmonton
http://www.edmonton.ca/Environment/WasteManagement/OfficeofEnv/WasteMan.pdf
City of Calgary 1999 Residential Waste Composition Study CH2M Gore & Storrie Limited and ENVIROSIS
Executive Summary hard copy from J. Leszkowicz (City of Calgary)
Page 22

Provincial Waste Characterization Framework
Construction & Demolition
14%
Glass2%
Metal4%
Mixed Residuals6%
Other Organic23%
Other Waste3%
Paper21%
Plastic8%
Wood & Soil19%
Figure 5: Small Town / Village Waste
Source: Regional Solid Waste Management Study Calgary Region EBA Engineering Consultants Ltd., February 2003
Hard copy from Town of Cochrane (Joanne Walroth)
It is important to note that these results represent only the data that was successfully obtained during the research. Where this data is limited, as in the case of IC&I and small towns, the validity of the results when applied to the province as a whole cannot be verified. However, at the same time, these results provide a starting point on which to build as additional waste composition results become available.
Page 23

Provincial Waste Characterization Framework
9 Waste Modeling An interesting alternate approach to waste characterization was identified during this project. This approach involves using a modeling method to develop waste stream estimates. Waste modeling can provide a very useful tool in planning future waste management approaches, as well as defining highly variable waste streams such as IC&I and C&D. The IC&I waste stream is the most diverse waste stream generated in a City. Where the residential and C&D waste streams tend to have common individual sources, volumes and characteristics, the IC&I stream is representative of the businesses activity within the City. Because the IC&I waste stream is intimately related to the business mix it is not appropriate to take statistics from other cities and apply them directly. Each analysis must consider the unique nature of each jurisdiction’s businesses and use data about the business mix to generate appropriate information. Independent researchers, including EBA Engineering Consultants Ltd., have developed waste generation models which can provide information about the waste generation of municipalities. The IC&I portion of the EBA model works in the following manner: First, the model uses business statistics to characterize the business community, based on commercially available databases. The data used comprises:
• • •
Company name and address, NAICS code at the 6 digit level, and Total Employees.
This data is entered in to the model and used to identify business location patterns and numbers and size of specific businesses. The model also contains the results of a large number of waste audits that have been collated from the literature and from audits conducted by several firms. All of these audits are related to business type (through NAICS) and number of employees: The business type, in general, determines the composition of the waste which may be expected: The number of employees is a measure of the size of a business, and determines the volume of waste which may be expected. Summed up, this provides a good first-order "snapshot" of the IC&I waste stream in the City. Future IC&I waste volumes can be predicted through applying the model and weigh scale data, and by comparing this data to historical and projected City development and planning data. It is also possible to migrate the data into a GIS system, which can then provide information about concentrations of various businesses. By linking the data and the waste composition model to a georeferenced and coded street network, the business
Page 24
Provincial Waste Characterization Framework
mix and correlating waste composition mix can be determined. This GIS database can provide a planning tool for management of the IC&I waste stream in the City. Businesses tend to group within Cities according to their business types (hotels, restaurants, light industry, etc) in certain planning zones. As such, the composition of IC&I waste may be expected to vary within various sectors of the City. With this planning tool, specific materials may be targeted within the various sectors and collection vehicle routing for recycling programs may be more appropriately planned according to the business mix. Based on the projected development and planning within the City, the composition of the IC&I waste stream for a specific area of the City or for the City as a whole can then be developed using the model. The MK IC&I Model is a similar planning tool which allows municipalities and provincial governments to carry out preliminary planning of IC&I diversion strategies, using best available waste composition information. The output of the model is customized to best reflect local circumstances and the local business mix, using employment by business sector as the indicator of the likely composition of the IC&I waste in a particular region. The input to the model has been constantly updated with most recently available IC&I waste composition data from waste audits and waste composition studies carried out by jurisdictions throughout North America since 1989 and before. The model was first developed in 1989 to estimate the composition of IC&I waste generated in the Province of Ontario as input to an econometric model which estimated the impacts of the 50% diversion objective on Ontario business. The first version of the model had 25 business categories and 10 waste stream categories. The GVRD (Greater Vancouver Regional District) used an updated version of the model in 1991 for planning the 50% diversion strategy for year 2000. The MK IC&I model identified the composition of IC&I waste generated in the Region. A separate study estimated the amount of IC&I waste diverted, therefore the combination of the two approaches estimated the composition of the IC&I waste disposed. The GVRD version of the model was expanded to estimate the amount of IC&I waste generated by material and business sector in 21 different area municipalities which formed the GVRD. The model was updated again in 1993 and 1994 to estimate the amount and composition of the waste generated by IC&I businesses in the Greater Toronto Area, in support of the Interim Waste Authority landfill sizing study. The model identified the materials and business sectors which should be targeted for aggressive diversion efforts. It was subsequently used in waste planning studies for the City of Toronto and the Province of Manitoba, and most recently has been used in a study of private sector waste in the Province of Ontario for the Ontario Waste Management Association (December, 2004).
Page 25
Provincial Waste Characterization Framework
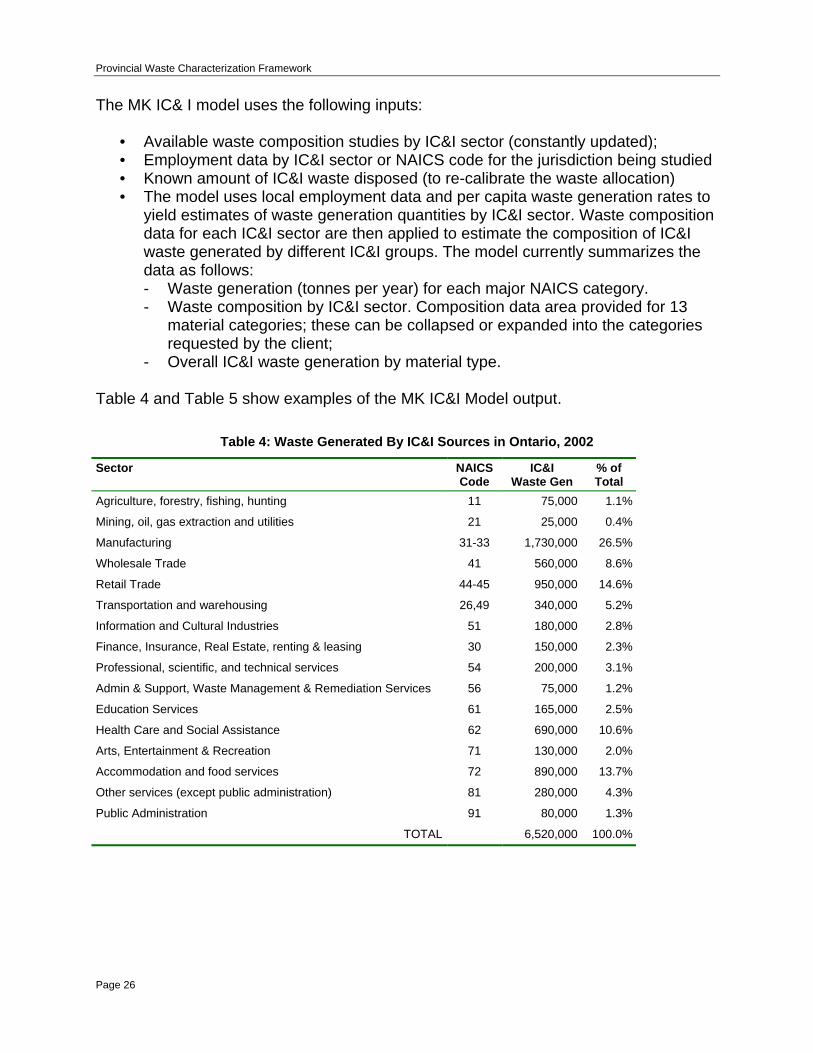
The MK IC& I model uses the following inputs:
• • • •
Available waste composition studies by IC&I sector (constantly updated); Employment data by IC&I sector or NAICS code for the jurisdiction being studied Known amount of IC&I waste disposed (to re-calibrate the waste allocation) The model uses local employment data and per capita waste generation rates to yield estimates of waste generation quantities by IC&I sector. Waste composition data for each IC&I sector are then applied to estimate the composition of IC&I waste generated by different IC&I groups. The model currently summarizes the data as follows: - Waste generation (tonnes per year) for each major NAICS category. - Waste composition by IC&I sector. Composition data area provided for 13
material categories; these can be collapsed or expanded into the categories requested by the client;
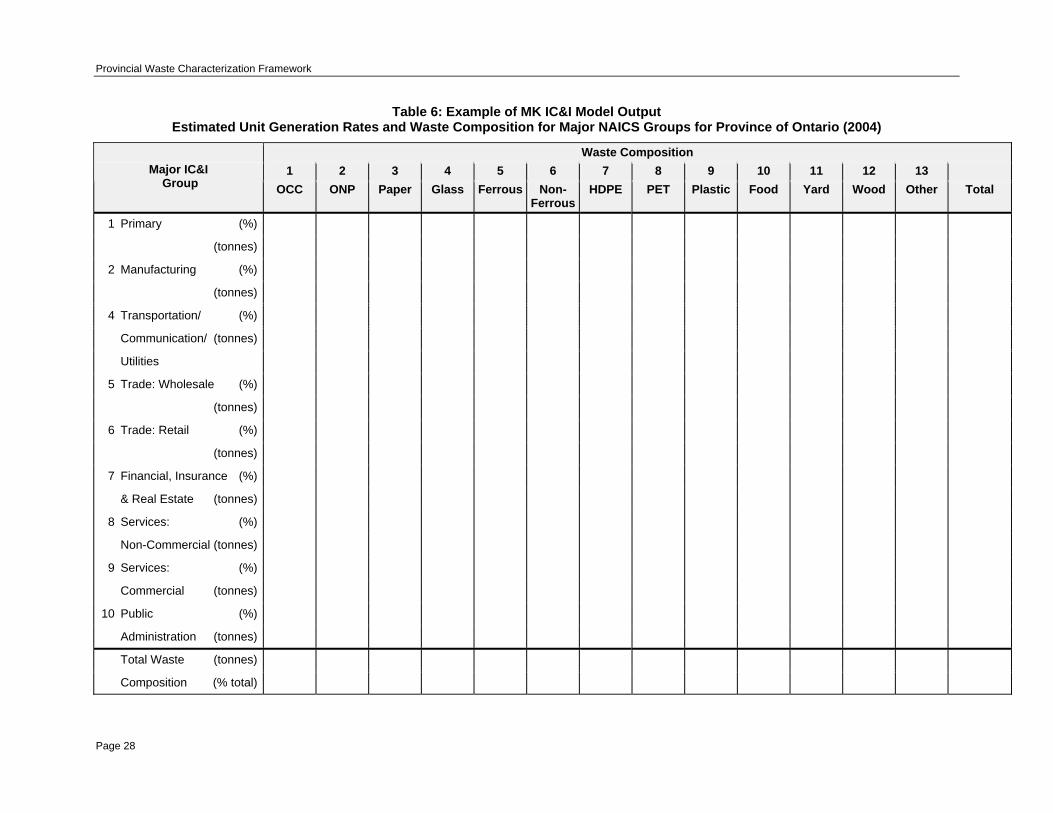
- Overall IC&I waste generation by material type. Table 4 and Table 5 show examples of the MK IC&I Model output.
Table 4: Waste Generated By IC&I Sources in Ontario, 2002
Sector NAICS Code
IC&I Waste Gen
% of Total
Agriculture, forestry, fishing, hunting 11 75,000 1.1%
Mining, oil, gas extraction and utilities 21 25,000 0.4%
Manufacturing 31-33 1,730,000 26.5%
Wholesale Trade 41 560,000 8.6%
Retail Trade 44-45 950,000 14.6%
Transportation and warehousing 26,49 340,000 5.2%
Information and Cultural Industries 51 180,000 2.8%
Finance, Insurance, Real Estate, renting & leasing 30 150,000 2.3%
Professional, scientific, and technical services 54 200,000 3.1%
Admin & Support, Waste Management & Remediation Services 56 75,000 1.2%
Education Services 61 165,000 2.5%
Health Care and Social Assistance 62 690,000 10.6%
Arts, Entertainment & Recreation 71 130,000 2.0%
Accommodation and food services 72 890,000 13.7%
Other services (except public administration) 81 280,000 4.3%
Public Administration 91 80,000 1.3%
TOTAL 6,520,000 100.0%
Page 26

Provincial Waste Characterization Framework
Table 5: Ontario IC&I Waste Composition, 2002
Material Estimated Amount Generated
Estimated Composition Generated
OCC 990,000 15.1%
ONP 290,000 4.4%
Paper 1,655,000 25.4%
Glass 275,000 4.2%
Ferrous 470,000 7.2%
Non-ferrous 300,000 4.6%
HDPE 120,000 1.9%
PET 15,000 0.2%
Plastic 535,000 8.2%
Food 740,000 11.4%
Yard 105,000 1.6%
Wood 505,000 7.8%
Other 520,000 8.0%
Total 6,530,0004 100.0%
4 May not add because of rounding error
Page 27
Provincial Waste Characterization Framework
Table 6: Example of MK IC&I Model Output Estimated Unit Generation Rates and Waste Composition for Major NAICS Groups for Province of Ontario (2004)
Waste Composition 1 2 3 4 5 6 7 8 9 10 11 12 13 Major IC&I
Group OCC ONP Paper Glass Ferrous Non-Ferrous
HDPE PET Plastic Food Yard Wood Other Total
1 Primary (%)
(tonnes)
2 Manufacturing (%)
(tonnes)
4 Transportation/ (%)
Communication/ (tonnes)
Utilities
5 Trade: Wholesale (%)
(tonnes)
6 Trade: Retail (%)
(tonnes)
7 Financial, Insurance (%)
& Real Estate (tonnes)
8 Services: (%)
Non-Commercial (tonnes)
9 Services: (%)
Commercial (tonnes)
10 Public (%)
Administration (tonnes)
Total Waste (tonnes)
Composition (% total)
Page 28

Provincial Waste Characterization Framework
10 References Alberta Environment, 2005. Alberta Waste Composition (pie charts) http://www3.gov.ab.ca/env/waste/wastenot/less.html American Society for Testing and Materials (ASTM) International, 2003. Standard Test Method for Determination of the Composition of Unprocessed Municipal Solid Waste -D5231-92(2003). 6p. http://www.astm.org/cgi-bin/SoftCart.exe/STORE/filtrexx40.cgi?U+mystore+wefn3429+-L+WASTE:COMPOSITION+/usr6/htdocs/astm.org/DATABASE.CART/REDLINE_PAGES/D5231.htm California Integrated Waste Management Board Database by Jurisdiction http://www.ciwmb.ca.gov/wastechar/JurisSel.asp Cascadia Consulting Group, Inc., 2004a. California Statewide Waste Characterization Study. Prepared for the Integrated Waste Management Board. 124p. http://www.ciwmb.ca.gov/publications/LocalAsst/34004005.pdf Cascadia Consulting Group Inc., 2004b. King County Waste Monitoring Program – 2002/2003 Comprehensive Waste Stream Characterization and Transfer Station Customer Surveys – Final Report. Prepared for the King County Department of Natural Resources and Parks Solid Waste Division. 144p. http://www.metrokc.gov/dnrp/swd/about/waste_documents.asp Cascadia Consulting Group Inc., 2003a. Guidelines for Waste Characterization Studies in the State of Washington. Prepared for the Washington State Department of Ecology. 67p. Cascadia Consulting Group Inc., 2003b. Wisconsin Statewide Waste Characterization Study Final Report. Prepared for the Wisconsin Department of Natural Resources. 114p. http://www.dnr.state.wi.us/org/aw/wm/publications/recycle/wrws-finalrpt.pdf Cascadia Consulting Group Inc. and Green Solutions Inc., 2003. Rural Waste Characterization Report. Prepared for the Washington State Department of Ecology. 82p. Cascadia Consulting Group, Sky Valley Associates, Sheri Eiker-Wiles Associates, Pacific Waste Consulting Group, Veterans Assistance Network, E. Tseng and Associates, and E. Ashley Steel, 1999. California Statewide Waste Characterization Study – Results and Final Report. In cooperation with the California Integrated Waste Management Board. 192p. http://www.ciwmb.ca.gov/publications/LocalAsst/34000009.doc CH2M Gore and Storrie Limited, 2000. Alberta Construction, Renovation and Demolition (CRD) Waste Characterization Study. Prepared for Alberta Environment and the Construction, Renovation, and Demolition Waste Reduction Advisory Committee. 131p. http://www3.gov.ab.ca/env/waste/aow/crd/publications/CRD_Report_All.pdf CH2M Gore and Storrie Limited, 1999. City of Calgary 1999 Residential Waste Study. Prepared for the City of Calgary. City of Edmonton, 2001. Edmonton’s Residential Waste Composition. State of Environment Report – Waste Management http://www.edmonton.ca/Environment/WasteManagement/OfficeofEnv/WasteMan.pdf
Page 29
Provincial Waste Characterization Framework
DeWolfe, K., 2004. Waste Audit Study: at the Bonnybrook Waterwater Treatment Plant. Prepared for the City of Calgary. 26p. Downie, W. A., D. M. McCartney and J. A. Tamm, 1998. “A Case Study of an Institutional Solid Waste Environmental Management System.” Journal of Environmental Management. (1998) 53, pp 137-146. EBA Engineering Consultants Ltd., 2003. Regional Solid Waste Management Study Calgary Region. Prepared for the City of Calgary and the Calgary Regional Partnership. 52p. European Parliament and the European Union, 2002. Regulation (EC) No. 2150/2002 of the European Parliament and of the Council of the European Union – Waste Statistics. 45p. http://europa.eu.int/eur-lex/lex/LexUriServ/site/en/consleg/2002/R/02002R2150-20040416-en.pdf Gartner Lee Ltd., 2004. Aquatera Landfill Solid Waste Composition Study. Prepared for Aquatera Utilities Ltd. 33 p. Gartner Lee Ltd., 1991. British Columbia Procedural Manual for Municipal Solid Waste Composition Analysis. Prepared for the British Columbia Ministry of Environment, Lands and Parks. 58p. Gore and Storrie Limited, 1991. Procedures for the Assessment of Soils Waste Residential and Commercial, Volume III of the Ontario Waste Composition Study. Prepared for Ontario Environment. 248p. Head, M. and L. Wytrykush, 1999. Waste Audit – Robert H. Smith Elementary School. Prepared for the University of Manitoba. 74p. Hulse, K., 2005. E-mail Communication. Cascadia Consulting Group. March 10, 2005. McCartney, D.M., 2003. “Auditing Non-hazardous Wastes from Golf Course Operations: Moving From a Waste to a Sustainability Framework.” Resources Conservation and Recycling. 37 (2003), pp 283-300. RecycleWorlds Consulting Corp., 1994. Everything You Want to Know About Waste Sorts But Were Afraid to Ask. 133p. Tel: (608) 231-1100. Reinhart, Debra R. and Pamela McCauley-Bell, 1996. Methodology for Conducting Composition Study for Discarded Solid Waste. Prepared for the Florida Center for Solid and Hazardous Waste Management. 82p. http://www.floridacenter.org/publications/discarded_waste_composition_96-1.pdf R.W. Beck, 2003. Pennsylvania Statewide Waste Composition Study Final Report. Prepared for the Pennsylvania Department of Environmental Protection. 176p. http://www.dep.state.pa.us/dep/deputate/airwaste/wm/recycle/waste_comp/study.htm
Page 30
Provincial Waste Characterization Framework
R.W. Beck, 2001. 2000 Waste Characterization Study – Alameda County, California. Prepared for the Alameda County Waste Management Authority and Source Reduction Recycling Board. 98p. http://stopwaste.org/wcs2000.html R.W. Beck, 2000. Minnesota Statewide MSW Composition Study. Prepared for the Solid Waste Management Coordinating Board. 98p. http://www.moea.state.mn.us/publications/wastesort2000.pdf R.W. Beck, 1998. Iowa Solid Waste Characterization. Prepared for the Department of Natural Resources. 138p. http://www.iowadnr.com/waste/sw/files/charstudy.pdf SENES Consultants Limited, 1999. Recommended Waste Characterization Methodology for Direct Waste Analysis Studies in Canada. Prepared for Canadian Council of Ministers of the Environment Waste Characterization Sub-Committee. 58p. http://www.ccme.ca/assets/pdf/waste_e.pdf Sky Valley Associates, 2004. Oregon 2002 Solid Waste Characterization and Composition. Prepared for the State of Oregon Department of Environmental Quality. 102p. http://www.deq.state.or.us/wmc/solwaste/wcrep/ReportWC02Full.pdf Stewardship Ontario, 2005. Blue Box Waste Audit Program 2005: Multi-Family Audits. 27p. http://www.stewardshipontario.ca/wdocs/MultiResWasteAudits_RFQ.doc Stewardship Ontario, 2005. Guide for Single-Family Waste Audits. 14p. http://www.stewardshipontario.ca/pdf/eefund/waste_audit_guide2005_sf.pdf UMA Engineering Ltd. and EBA Engineering Consultants Ltd., 2001. City of Calgary IC&I/CRD Waste Composition Study. Prepared for the City of Calgary. Wastebase – European Waste and Waste Management Database http://waste.eionet.eu.int/waste/wastebase WasteCalc – Florida Waste Calculation Model Florida Department of Environmental Protection http://www.dep.state.fl.us/wastecalc/index.html
Page 31
Provincial Waste Characterization Framework
Appendices Appendix A: Review of Existing Waste Characterization Protocols and Guidelines
Appendix B: Review of Existing Waste Characterization Protocols and Guidelines - Sampling Options
Appendix C: Advantages and Disadvantages of Existing Waste Characterization Protocols and Guidelines
Appendix D: Estimated Number of Samples to Achieve Different Confidence Intervals at 90% Confidence Level
Appendix E: Existing Data
Appendix F: Guidelines for Waste Characterization Studies in the State of Washington
Appendix G: CCME Recommended Waste Characterization Methodology – Waste Categories
Page 32

Provincial Waste Characterization Framework
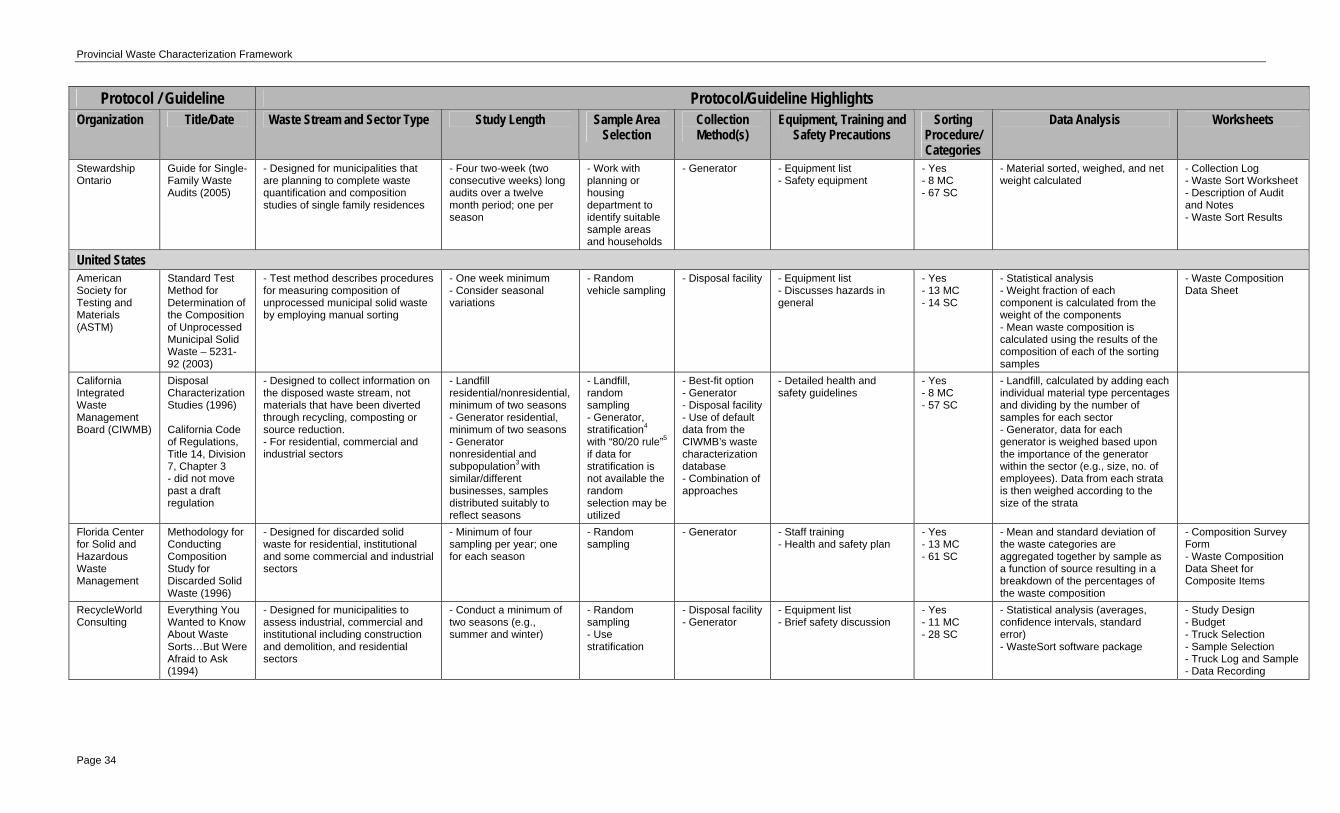
Appendix A: Review of Existing Waste Characterization Protocols and Guidelines
Protocol / Guideline Protocol/Guideline Highlights Organization Title/Date Waste Stream and Sector Type Study Length Sample Area
Selection Collection Method(s)
Equipment, Training and Safety Precautions
Sorting Procedure/ Categories
Data Analysis Worksheets
Canada BC Environment
Procedural Manual for Municipal Solid Waste Composition Analysis (1991)
- Divided into two, waste collected by waste collection vehicles and waste hauled in self-haul vehicles then divided by residential, commercial and institutional where appropriate - Does not cover industrial or biomedical waste
- Seven day surveys throughout the year to cover seasonal differences
- Random sampling, nth vehicle is selected so there is no bias to morning and afternoon or large and small loads
- Disposal facility
- Detailed equipment list - Safety equipment - Staff training and requirements
- Yes - 15 MC - 58 SC
- Input wet weight data and calculate percent composition - Using moisture content values convert wet weights into dry weights - Calculate percent composition by dry weight
- Weigh Scale Form - Sample Information - Large Objects: Weights and Descriptions - Waste Sorting
Canadian Council of Ministers of the Environment (CCME)
Recommended Waste Characterization Methodology (1999)
- Discusses general components of a study design and provides guidance for studies that can be developed based on simplified statistical design for industrial, commercial and institutional, and residential waste streams
- Minimum of two study periods; summer and late fall recommended
- Landfill, random sampling of trucks for each sector from a list of trucks or routes - Generator, selected from specifies categories
- Disposal facility - Generator
- Detailed equipment list from BC Environment (1991) - Health and safety procedure - Staff training
- Yes - 10 MC - 58 SC
- Sector and seasonal data summarized to provide measures of the average (mean) values and variability - Calculate annual mean from seasonal and sector averages
Ontario Ministry of the Environment
Procedures for the Assessment of Solid Waste Residential and Commercial, Volume III of the Ontario Waste Composition Study (1991)
- Outlines the procedures for conducting residential and commercial waste composition studies in Ontario municipalities - Includes waste and recyclables - Does not include bulky items
- Residential, study area selected by enumeration area 1 using an income/housing matrix; random household samples
- Generator - Detailed equipment list - Safety equipment - Staff training and requirements
- Yes - 14 MC - 47 SC
- Residential, estimation of waste component generation rate based on percent `composition and per capita waste generation rate - Commercial, estimate total commercial waste generation by adding together individual groups
- Waste Composition Data Collection Sheet
Stewardship Ontario
Blue Box Waste Audit Program 2005: Multi-Residential Audits (2005) DRAFT2
- Designed for municipalities that are planning to complete waste quantification and composition studies for multi-residential housing
-Four two-week (two consecutive weeks) long audits over a twelve month period; one per season
- Random multi-residential complexes - Work with planning or housing department
- Generator - Equipment list - Safety equipment
- Yes - 8 MC - 67 SC
-Material sorted, weighed, and net weight calculated
- Collection Log - Waste Sort Worksheet - Description of Audit and Notes
Page 33
Provincial Waste Characterization Framework
Protocol / Guideline Protocol/Guideline Highlights Organization Title/Date Waste Stream and Sector Type Study Length Sample Area
Selection Collection Method(s)
Equipment, Training and Safety Precautions
Sorting Procedure/ Categories
Data Analysis Worksheets
Stewardship Ontario
Guide for Single-Family Waste Audits (2005)
- Designed for municipalities that are planning to complete waste quantification and composition studies of single family residences
- Four two-week (two consecutive weeks) long audits over a twelve month period; one per season
- Work with planning or housing department to identify suitable sample areas and households
- Generator - Equipment list - Safety equipment
- Yes - 8 MC - 67 SC
- Material sorted, weighed, and net weight calculated
- Collection Log - Waste Sort Worksheet - Description of Audit and Notes - Waste Sort Results
United States American Society for Testing and Materials (ASTM)
Standard Test Method for Determination of the Composition of Unprocessed Municipal Solid Waste – 5231-92 (2003)
- Test method describes procedures for measuring composition of unprocessed municipal solid waste by employing manual sorting
- One week minimum - Consider seasonal variations
- Random vehicle sampling
- Disposal facility - Equipment list - Discusses hazards in general
- Yes - 13 MC - 14 SC
- Statistical analysis - Weight fraction of each component is calculated from the weight of the components - Mean waste composition is calculated using the results of the composition of each of the sorting samples
- Waste Composition Data Sheet
California Integrated Waste Management Board (CIWMB)
Disposal Characterization Studies (1996) California Code of Regulations, Title 14, Division 7, Chapter 3 - did not move past a draft regulation
- Designed to collect information on the disposed waste stream, not materials that have been diverted through recycling, composting or source reduction. - For residential, commercial and industrial sectors
- Landfill residential/nonresidential, minimum of two seasons - Generator residential, minimum of two seasons - Generator nonresidential and subpopulation3 with similar/different businesses, samples distributed suitably to reflect seasons
- Landfill, random sampling - Generator, stratification4 with “80/20 rule”5 if data for stratification is not available the random selection may be utilized
- Best-fit option - Generator - Disposal facility - Use of default data from the CIWMB’s waste characterization database - Combination of approaches
- Detailed health and safety guidelines
- Yes - 8 MC - 57 SC
- Landfill, calculated by adding each individual material type percentages and dividing by the number of samples for each sector - Generator, data for each generator is weighed based upon the importance of the generator within the sector (e.g., size, no. of employees). Data from each strata is then weighed according to the size of the strata
Florida Center for Solid and Hazardous Waste Management
Methodology for Conducting Composition Study for Discarded Solid Waste (1996)
- Designed for discarded solid waste for residential, institutional and some commercial and industrial sectors
- Minimum of four sampling per year; one for each season
- Random sampling
- Generator - Staff training - Health and safety plan
- Yes - 13 MC - 61 SC
- Mean and standard deviation of the waste categories are aggregated together by sample as a function of source resulting in a breakdown of the percentages of the waste composition
- Composition Survey Form - Waste Composition Data Sheet for Composite Items
RecycleWorld Consulting
Everything You Wanted to Know About Waste Sorts…But Were Afraid to Ask (1994)
- Designed for municipalities to assess industrial, commercial and institutional including construction and demolition, and residential sectors
- Conduct a minimum of two seasons (e.g., summer and winter)
- Random sampling - Use stratification
- Disposal facility - Generator
- Equipment list - Brief safety discussion
- Yes - 11 MC - 28 SC
- Statistical analysis (averages, confidence intervals, standard error) - WasteSort software package
- Study Design - Budget - Truck Selection - Sample Selection - Truck Log and Sample - Data Recording
Page 34
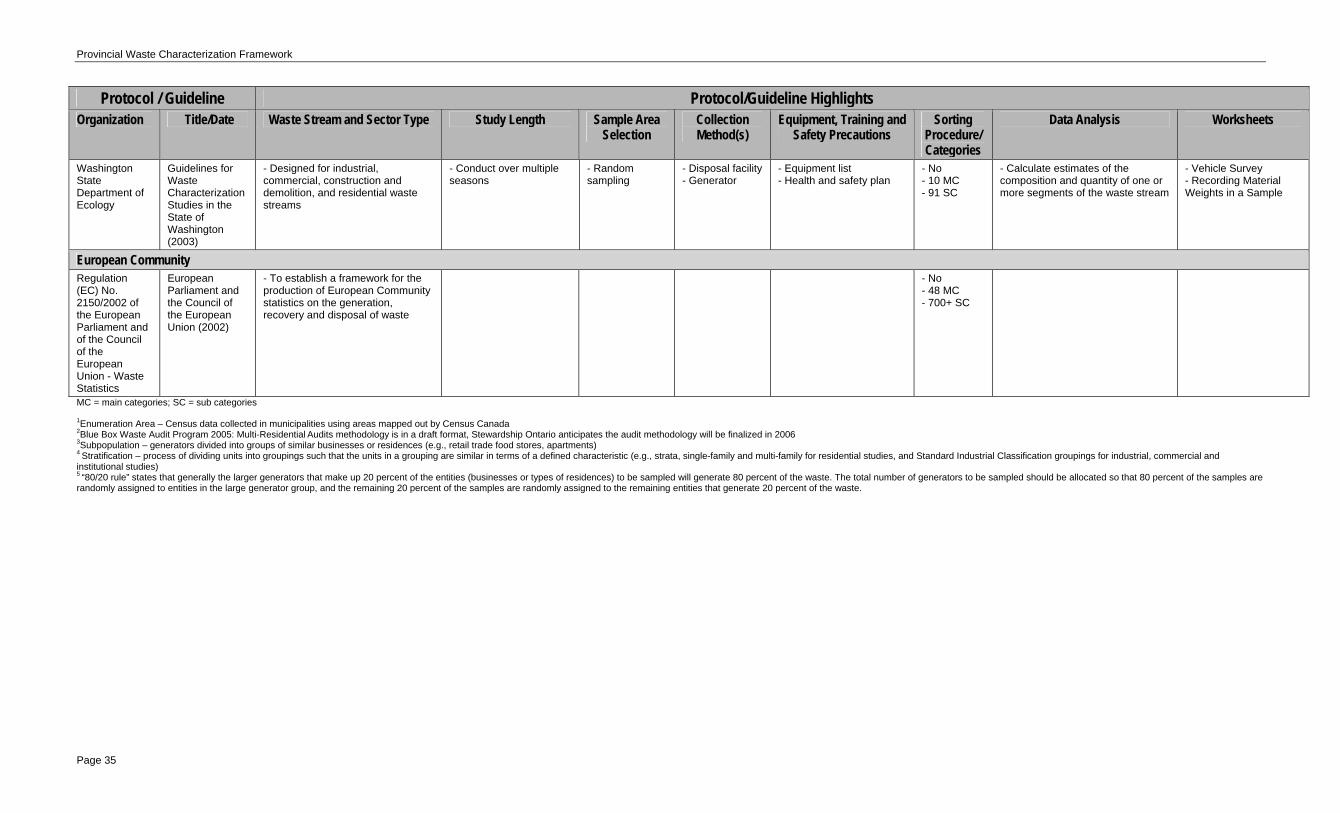
Provincial Waste Characterization Framework
Protocol / Guideline Protocol/Guideline Highlights Organization Title/Date Waste Stream and Sector Type Study Length Sample Area
Selection Collection Method(s)
Equipment, Training and Safety Precautions
Sorting Procedure/ Categories
Data Analysis Worksheets
Washington State Department of Ecology
Guidelines for Waste Characterization Studies in the State of Washington (2003)
- Designed for industrial, commercial, construction and demolition, and residential waste streams
- Conduct over multiple seasons
- Random sampling
- Disposal facility - Generator
- Equipment list - Health and safety plan
- No - 10 MC - 91 SC
- Calculate estimates of the composition and quantity of one or more segments of the waste stream
- Vehicle Survey - Recording Material Weights in a Sample
European Community Regulation (EC) No. 2150/2002 of the European Parliament and of the Council of the European Union - Waste Statistics
European Parliament and the Council of the European Union (2002)
- To establish a framework for the production of European Community statistics on the generation, recovery and disposal of waste
- No - 48 MC - 700+ SC
MC = main categories; SC = sub categories 1Enumeration Area – Census data collected in municipalities using areas mapped out by Census Canada 2Blue Box Waste Audit Program 2005: Multi-Residential Audits methodology is in a draft format, Stewardship Ontario anticipates the audit methodology will be finalized in 2006
3Subpopulation – generators divided into groups of similar businesses or residences (e.g., retail trade food stores, apartments) 4 Stratification – process of dividing units into groupings such that the units in a grouping are similar in terms of a defined characteristic (e.g., strata, single-family and multi-family for residential studies, and Standard Industrial Classification groupings for industrial, commercial and institutional studies) 5 “80/20 rule” states that generally the larger generators that make up 20 percent of the entities (businesses or types of residences) to be sampled will generate 80 percent of the waste. The total number of generators to be sampled should be allocated so that 80 percent of the samples are randomly assigned to entities in the large generator group, and the remaining 20 percent of the samples are randomly assigned to the remaining entities that generate 20 percent of the waste.
Page 35
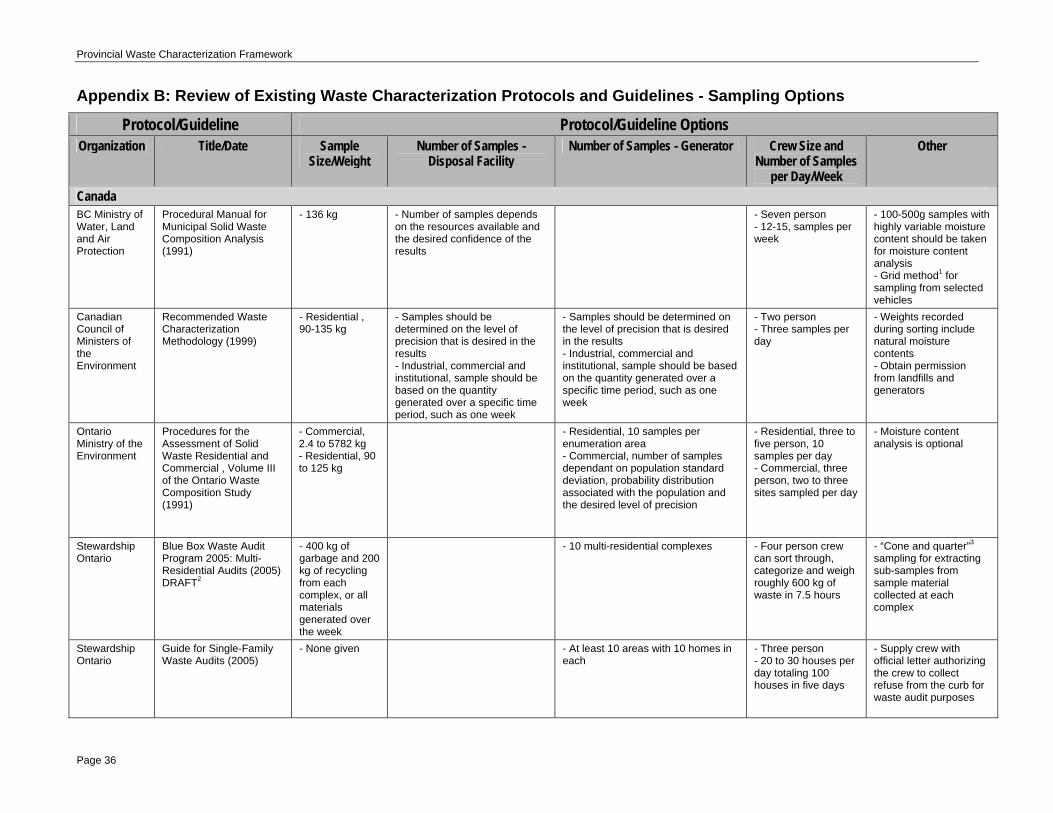
Provincial Waste Characterization Framework
Appendix B: Review of Existing Waste Characterization Protocols and Guidelines - Sampling Options
Protocol/Guideline Protocol/Guideline Options Organization Title/Date Sample
Size/Weight Number of Samples -
Disposal Facility Number of Samples - Generator Crew Size and
Number of Samples per Day/Week
Other
Canada BC Ministry of Water, Land and Air Protection
Procedural Manual for Municipal Solid Waste Composition Analysis (1991)
- 136 kg - Number of samples depends on the resources available and the desired confidence of the results
- Seven person - 12-15, samples per week
- 100-500g samples with highly variable moisture content should be taken for moisture content analysis - Grid method1 for sampling from selected vehicles
Canadian Council of Ministers of the Environment
Recommended Waste Characterization Methodology (1999)
- Residential , 90-135 kg
- Samples should be determined on the level of precision that is desired in the results - Industrial, commercial and institutional, sample should be based on the quantity generated over a specific time period, such as one week
- Samples should be determined on the level of precision that is desired in the results - Industrial, commercial and institutional, sample should be based on the quantity generated over a specific time period, such as one week
- Two person - Three samples per day
- Weights recorded during sorting include natural moisture contents - Obtain permission from landfills and generators
Ontario Ministry of the Environment
Procedures for the Assessment of Solid Waste Residential and Commercial , Volume III of the Ontario Waste Composition Study (1991)
- Commercial, 2.4 to 5782 kg - Residential, 90 to 125 kg
- Residential, 10 samples per enumeration area - Commercial, number of samples dependant on population standard deviation, probability distribution associated with the population and the desired level of precision
- Residential, three to five person, 10 samples per day - Commercial, three person, two to three sites sampled per day
- Moisture content analysis is optional
Stewardship Ontario
Blue Box Waste Audit Program 2005: Multi-Residential Audits (2005) DRAFT2
- 400 kg of garbage and 200 kg of recycling from each complex, or all materials generated over the week
- 10 multi-residential complexes - Four person crew can sort through, categorize and weigh roughly 600 kg of waste in 7.5 hours
- “Cone and quarter”3 sampling for extracting sub-samples from sample material collected at each complex
Stewardship Ontario
Guide for Single-Family Waste Audits (2005)
- None given - At least 10 areas with 10 homes in each
- Three person - 20 to 30 houses per day totaling 100 houses in five days
- Supply crew with official letter authorizing the crew to collect refuse from the curb for waste audit purposes
Page 36
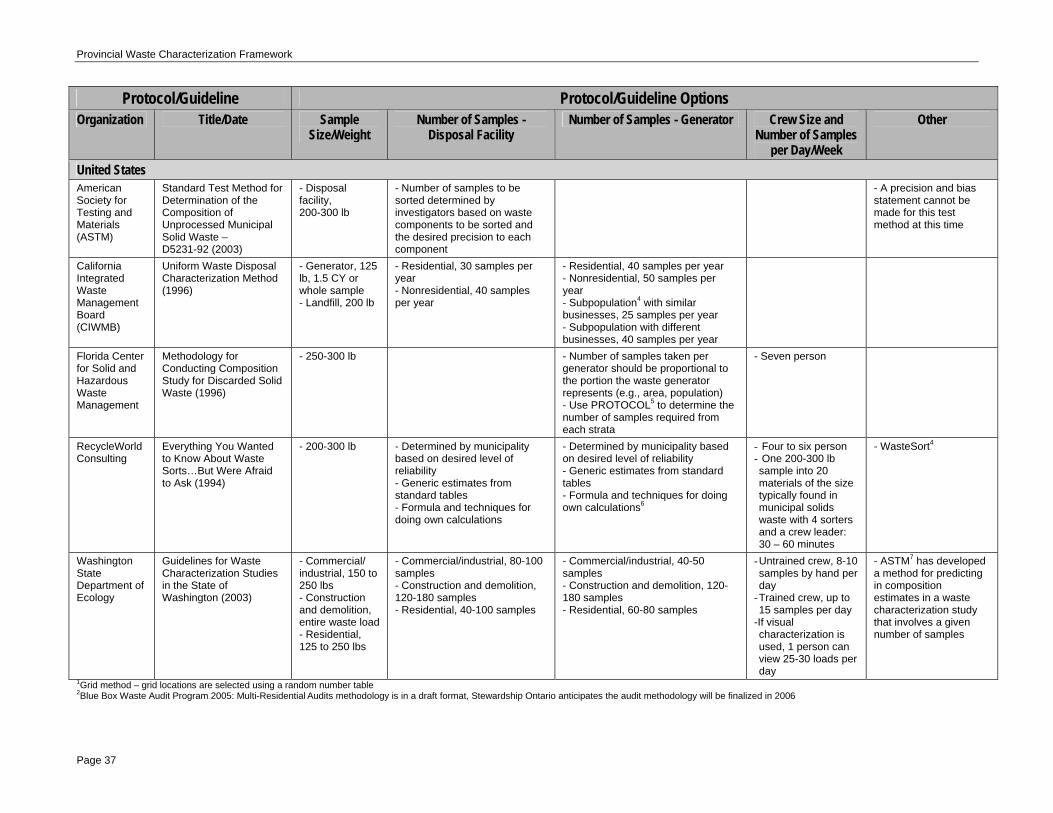
Provincial Waste Characterization Framework
Protocol/Guideline Protocol/Guideline Options
Organization Title/Date Sample Size/Weight
Number of Samples - Disposal Facility
Number of Samples - Generator Crew Size and Number of Samples
per Day/Week
Other
United States
American Society for Testing and Materials (ASTM)
Standard Test Method for Determination of the Composition of Unprocessed Municipal Solid Waste –D5231-92 (2003)
- Disposal facility, 200-300 lb
- Number of samples to be sorted determined by investigators based on waste components to be sorted and the desired precision to each component
- A precision and bias statement cannot be made for this test method at this time
California Integrated Waste Management Board (CIWMB)
Uniform Waste Disposal Characterization Method (1996)
- Generator, 125 lb, 1.5 CY or whole sample - Landfill, 200 lb
- Residential, 30 samples per year - Nonresidential, 40 samples per year
- Residential, 40 samples per year - Nonresidential, 50 samples per year - Subpopulation4 with similar businesses, 25 samples per year - Subpopulation with different businesses, 40 samples per year
Florida Center for Solid and Hazardous Waste Management
Methodology for Conducting Composition Study for Discarded Solid Waste (1996)
- 250-300 lb - Number of samples taken per generator should be proportional to the portion the waste generator represents (e.g., area, population) - Use PROTOCOL5 to determine the number of samples required from each strata
- Seven person
RecycleWorld Consulting
Everything You Wanted to Know About Waste Sorts…But Were Afraid to Ask (1994)
- 200-300 lb - Determined by municipality based on desired level of reliability - Generic estimates from standard tables - Formula and techniques for doing own calculations
- Determined by municipality based on desired level of reliability - Generic estimates from standard tables - Formula and techniques for doing own calculations6
- Four to six person - One 200-300 lb sample into 20 materials of the size typically found in municipal solids waste with 4 sorters and a crew leader: 30 – 60 minutes
- WasteSort4
Washington State Department of Ecology
Guidelines for Waste Characterization Studies in the State of Washington (2003)
- Commercial/ industrial, 150 to 250 lbs - Construction and demolition, entire waste load - Residential, 125 to 250 lbs
- Commercial/industrial, 80-100 samples - Construction and demolition, 120-180 samples - Residential, 40-100 samples
- Commercial/industrial, 40-50 samples - Construction and demolition, 120-180 samples - Residential, 60-80 samples
- Untrained crew, 8-10 samples by hand per day
- Trained crew, up to 15 samples per day
-If visual characterization is used, 1 person can view 25-30 loads per day
- ASTM7 has developed a method for predicting in composition estimates in a waste characterization study that involves a given number of samples
1Grid method – grid locations are selected using a random number table
2Blue Box Waste Audit Program 2005: Multi-Residential Audits methodology is in a draft format, Stewardship Ontario anticipates the audit methodology will be finalized in 2006
Page 37

Provincial Waste Characterization Framework
3”Cone and quarter” – 1) Sample unloaded from complex onto the tip floor at the waste management facility; 2) Bulky items are separated from the load, categorized and weighed; 3) Remaining material is mixed by mechanical shovel, or by hand using rakes or shovels, into a uniform, homogeneous pile approximately 0.8 m high; 4) Pile is divided into two by a straight line through the centre of the pile; 5) Pile is further divided by a second line roughly perpendicular to the first; 6) Either pair of opposite quarters is removed, leaving half the original sample; 7) Steps 3 through 5 are repeated until the required amount of sample material remains 4Subpopulation – generators made into groups of similar businesses or residences (e.g., retail trade food stores, apartments) 5 PROTOCOL – a computerized technique to aid in selection of the number of samples required for a waste composition study (National Technical Information Service, 1-800-553-6847. Order #PB91-201699, $130USD) 6 WasteSort statistical software package ($395USD, RecycleWorld Consulting, 1-800-449-1010) 7American Society for Testing and Materials, “Standard Test Method for Determination of the Composition of Unprocessed Municipal Solid Waste D5231-92(2003)”, www.astm.org, $33USD
Page 38

Provincial Waste Characterization Framework
Appendix C: Advantages and Disadvantages of Existing Waste Characterization Protocols and Guidelines
Protocol/Guideline Organization Title and Date
Advantages Disadvantages
Canada BC Environment Procedural Manual for Municipal
Solid Waste Composition Analysis (1991)
- Detailed waste category list - Does not cover industrial and construction and demolition sectors specifically - Does not include generator sampling
Canadian Council of Ministers of the Environment
Recommended Waste Characterization Methodology (1999)
- Selected “best” components from BC Environment, Ontario Ministry of the Environment and the California Integrated Waste Management Board protocols/guidelines to create a waste characterization methodology - Disposal facility and generator based sampling - Detailed waste category list
- Does not look at construction and demolition sector specifically - Other protocols/guidelines give more details on the waste sampling methodology - No worksheets
Ontario Ministry of the Environment
Procedures for the Assessment of Solid Waste Residential and Commercial , Volume III of the Ontario Waste Composition Study (1991)
- Discusses residential apartment building waste sample collection - Good detail on sampling strategy
- Does not include construction and demolition sector specifically - Does not include disposal facility sampling
Stewardship Ontario Blue Box Waste Audit Program 2005: Multi-Residential Audits (2005) DRAFT1
- Detailed waste category list - Detailed information on sample weight requirements
- Does not include disposal facility sampling - Only looks at residential sector
Stewardship Ontario Guide for Single-Family Waste Audits (2005)
- Detailed waste category list - Easy to read, straight forward easy-to-follow audit procedures
- Does not include disposal facility sampling - Only looks at residential sector
United States American Society for Testing and Materials (ASTM)
Standard Test Method for Determination of the Composition of Unprocessed Municipal Solid Waste – D5231-92 (2003)
- International organization for voluntary standards
- Does not include generator sampling - Not give as detailed information on sampling like other protocols/guidelines - Not as easy to read for audience, more technical
California Integrated Waste Management Board (CIWMB)
Disposal Characterization Studies (1996) Protocol California Code of Regulations, Title 14, Division 7, Chapter 3 - did not move past a draft regulation
- For commercial, industrial and residential sectors - Generator and disposal facility based sampling - Several options for data collection options - Detailed waste category list
- Legal context - No worksheets
Florida Center for Solid and Hazardous Waste Management
Methodology for Conducting Composition Study for Discarded Solid Waste (1996)
- Detailed waste category list - Standard generator categories can include single-family and multi-family residential (urban and rural)
- Does not include disposal facility sampling - Does not include construction and demolition sector specifically
RecycleWorld Consulting
Everything You Wanted to Know About Waste Sorts…But Were Afraid to Ask (1994)
- Covers C&D, IC&I and residential waste streams - Generator and disposal facility based sampling - Detailed sampling selection and procedure
- Perhaps too detailed for smaller studies
Page 39

Provincial Waste Characterization Framework
Protocol/Guideline Organization Title and Date
Advantages Disadvantages
Washington State Department of Ecology
Guidelines for Waste Characterization Studies in the State of Washington (2003)
- Covers C&D, IC&I and residential waste streams - Disposal facility and generator based sampling - Good detail on sampling strategy - Detailed waste category list - Utilizes ASTM International statistical method for predicting the number of samples required to yield desired precision
- Perhaps too detailed for smaller studies
European Community Regulation (EC) No. 2150/2002 of the European Parliament and of the Council of the European Union - Waste Statistics
European Parliament and the Council of the European Union (2002)
- Extremely detailed waste category list - No other information regarding waste characterization surveys
1Blue Box Waste Audit Program 2005: Multi-Residential Audits methodology is in a draft format, Stewardship Ontario anticipates the audit methodology will be finalized in 2006
Page 40
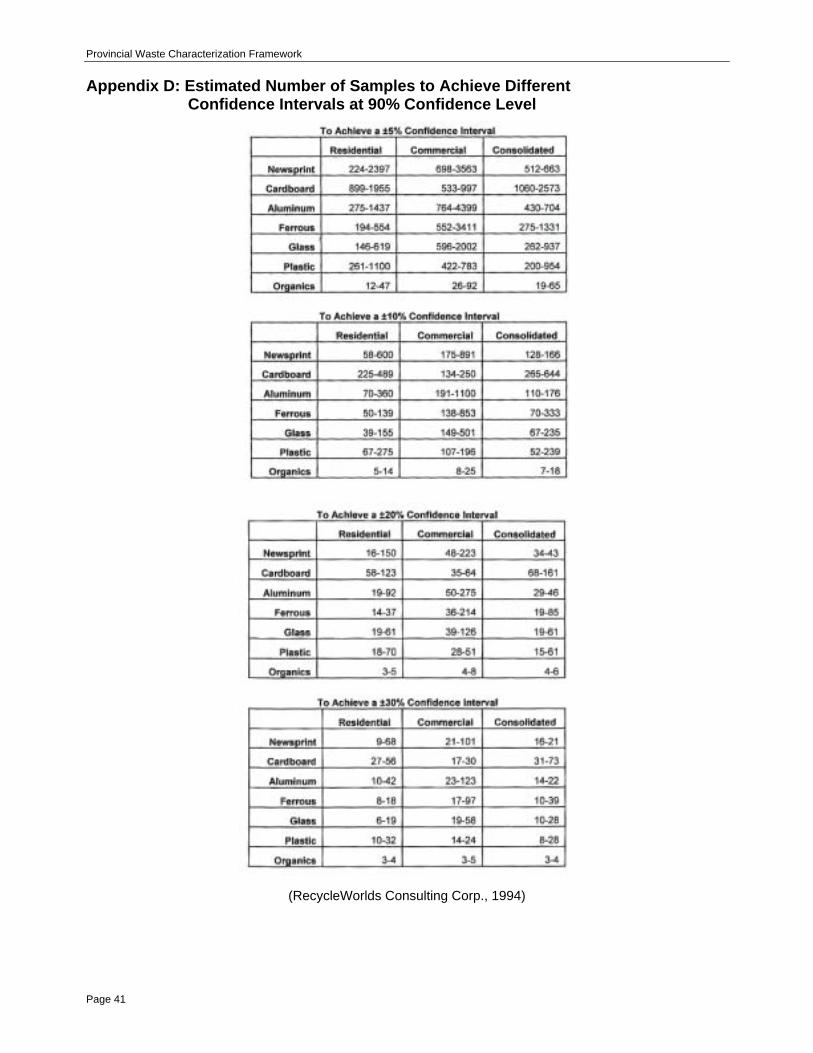
Provincial Waste Characterization Framework
Appendix D: Estimated Number of Samples to Achieve Different Confidence Intervals at 90% Confidence Level
(RecycleWorlds Consulting Corp., 1994)
Page 41

Provincial Waste Characterization Framework
Appendix E: Existing Data Existing Alberta Waste Characterization Data Waste Sector Organization Completed Projects Current Project Future Project
Alberta Environment Alberta Construction, Renovation and Demolition (CRD) Waste Characterization Study1 (December 2000)
Aquatera Utilities Inc. Aquatera Landfill Solid Waste Composition (2004)
Calgary & Region Waste Reduction Partnership
Regional Solid Waste Management Study2 (2003)
Construction and Demolition
City of Calgary IC&I/CRD Waste Study (2000)
IC&I/CRD Waste Study (anticipated completion, December 2005)
Aquatera Utilities Inc. Aquatera Landfill Solid Waste Composition (2004)
Calgary & Region Waste Reduction Partnership
Regional Solid Waste Management Study2 (2003)
City of Calgary Bonnybrook Wastewater Treatment Plant Waste Audit (2004)
Industrial, Commercial and Institutional
City of Calgary IC&I/CRD Waste Study (2000)
IC&I/CRD Waste Study (anticipated completion, December 2005)
Aquatera Utilities Inc. Aquatera Landfill Solid Waste Composition (2004)
Calgary & Region Waste Reduction Partnership
Regional Solid Waste Management Study2 (2003)
City of Calgary Residential Waste Study (1999) Residential Waste Study (anticipated completion, Spring 2005)
City of Edmonton Edmonton’s Residential Waste Composition (2001)
Residential
Calgary & Region Waste Reduction Partnership
Regional Solid Waste Management Study2 (2003)
Alberta Environment Alberta Waste Composition by Sector Alberta Waste Composition by Material
City of Grande Prairie Waste Composition Study (anticipated completion Spring 2005)
Waste Composition (Overall)
Lesser Slave Lake Regional Management Facility
Waste Composition Study (anticipated completion April 2005)
1Alberta Construction, Renovation and Demolition (CRD) Waste Characterization Study site audits include Calgary, Edmonton, Grande Prairie, Lethbridge, Lundbreck and Wainwright; survey participants include 39 rural and 13 urban sites 2Regional Solid Waste Management Study participants include County/Municipal Districts (Kananaskis County, Kneehill County, MD Bighorn, MD of Rocky View, Mountain View County, and Wheatland County) and Cities/Towns/Villages/Hamlets (Acme, Airdrie, Banff, Beiseker, Black Diamond, Calgary, Canmore, Carbon, Carstairs, Cochrane, Cremona, Crossfield, Didsbury, Drumheller, Gleichen, High River, Irricana, Linden, Morrin, Nanton, Okotoks, Olds, Redwood Meadows, Rockyford, Strathmore, Sundre, Three Hill, Trochu, and Turner Valley)
Page 42

Provincial Waste Characterization Framework
Other Waste Characterization Data Waste Sector Organization Completed Projects Current Project Future Project
Recycling & Environmental Action Planning Society (Prince George, BC)
Conducted 108 wasteaudits with IC&I businesses (anticipated completion April 2005)
University of Alberta
Auditing Non-hazardous Wastes from Golf Course Operations (2002) Institutional Solid Waste Environmental Management System (1998)
Large Education Institution (anticipated completion May 2005)
Industrial, Commercial and Institutional
University of Manitoba Waste Audit Report: Robert H. Smith Elementary School (1999)
City of Winnipeg Waste Composition Study (2000) Waste Composition (Overall)
City of Yellowknife Waste Audit (anticipated completion December 2005)
Page 43
Provincial Waste Characterization Framework
Appendix F: Guidelines for Waste Characterization Studies in the State of Washington
State of Washington Waste Characterization Protocol.pdf WA Rural_Report.pdf WA Rural_Appendices.pdf
Page 44

Provincial Waste Characterization Framework
Page 45
Appendix G: CCME Recommended Waste Characterization Methodology – Waste Categories
Paper & Paperboard Newspapers (including flyers) Magazines (including catalogues) Corrugated cardboard (including kraft paper and bags) Boxboard (including cereal boxes, shoe boxes, protective paper packaging for dry foods) Telephone books/directories Fine paper (including envelopes, computer paper, office paper) Tissue paper Wallpaper Polycoat (gable top & aseptic) Other paper
Glass Clear Food & Beverage (Food, alcoholic, non-alcoholic) Coloured Food & Beverage (Food, alcoholic, non-alcoholic) Other Glass (Non-containers, window glass, drinking glasses, light bulbs, dinnerware, other ceramics)
Ferrous Food & Beverage Aerosol (empty containers) Paint Cans and Lids (empty containers) Other Ferrous (coat hangers, nails & screws) Composites (mostly ferrous with other materials, small appliances)
Aluminum Food & Beverage Aerosol (empty containers) Foil (flexible and semi-flexible) Other aluminum Composites (mostly aluminum with other materials,)
Plastic PET Soda Bottles 2L PET Soda Bottles <2L Custom PET Bottles (including household detergent bottles, liquor bottles) HDPE Milk Jugs Other HDPE Bottles Tubs & Lids (HDPE, PP, LDPE, PS, LDPE) Empty PE Retail Carry Out Sacks & Other Clean PE Bags & Wrap (including dry cleaning bags, bread bags, milk pouches, PE overwrap for various consumer products) Polystyrene (foam)

Washington State Department of Ecology
Guidelines for Waste Characterization Studies in the State of Washington
prepared by Cascadia Consulting Group, Inc. June 2003
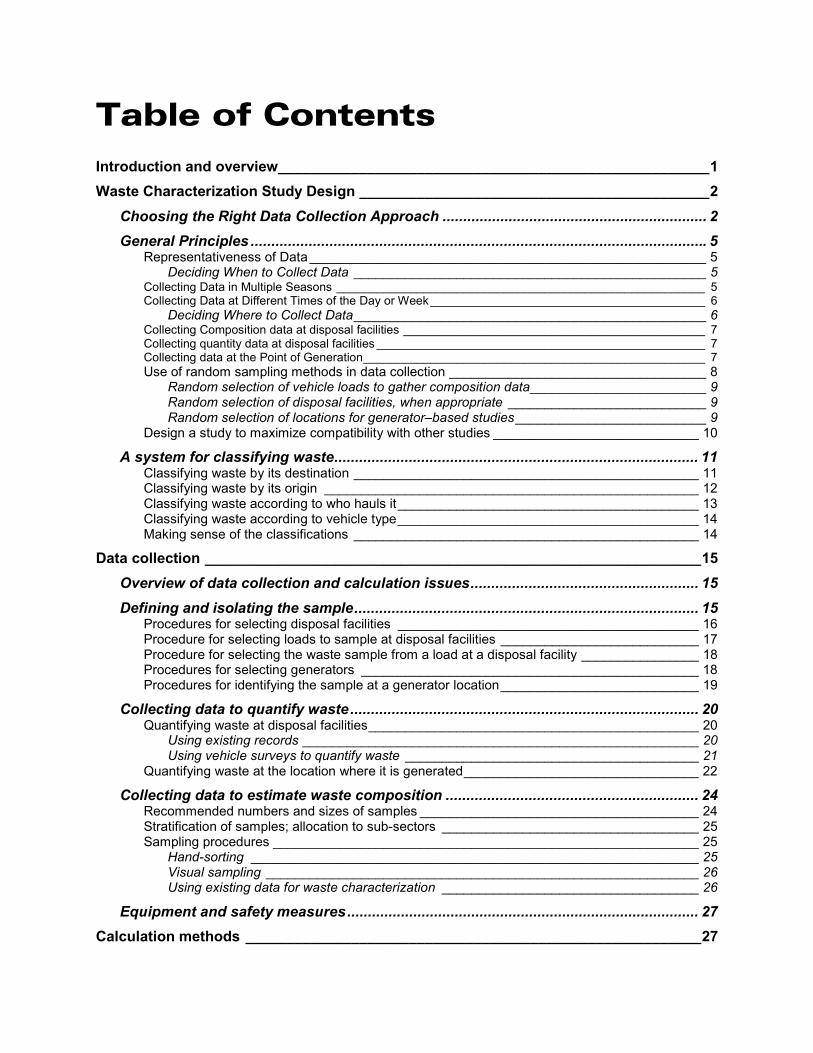
Table of Contents
Introduction and overview_____________________________________________________1 Waste Characterization Study Design ___________________________________________2
Choosing the Right Data Collection Approach ................................................................ 2 General Principles .............................................................................................................. 5
Representativeness of Data ______________________________________________________ 5 Deciding When to Collect Data ________________________________________________ 5
Collecting Data in Multiple Seasons _______________________________________________________ 5 Collecting Data at Different Times of the Day or Week _________________________________________ 6
Deciding Where to Collect Data________________________________________________ 6 Collecting Composition data at disposal facilities _____________________________________________ 7 Collecting quantity data at disposal facilities _________________________________________________ 7 Collecting data at the Point of Generation___________________________________________________ 7 Use of random sampling methods in data collection ___________________________________ 8
Random selection of vehicle loads to gather composition data________________________ 9 Random selection of disposal facilities, when appropriate ___________________________ 9 Random selection of locations for generator–based studies__________________________ 9
Design a study to maximize compatibility with other studies ____________________________ 10 A system for classifying waste........................................................................................ 11
Classifying waste by its destination _______________________________________________ 11 Classifying waste by its origin ___________________________________________________ 12 Classifying waste according to who hauls it_________________________________________ 13 Classifying waste according to vehicle type_________________________________________ 14 Making sense of the classifications _______________________________________________ 14
Data collection _____________________________________________________________15 Overview of data collection and calculation issues....................................................... 15 Defining and isolating the sample................................................................................... 15
Procedures for selecting disposal facilities _________________________________________ 16 Procedure for selecting loads to sample at disposal facilities ___________________________ 17 Procedure for selecting the waste sample from a load at a disposal facility ________________ 18 Procedures for selecting generators ______________________________________________ 18 Procedures for identifying the sample at a generator location___________________________ 19
Collecting data to quantify waste.................................................................................... 20 Quantifying waste at disposal facilities_____________________________________________ 20
Using existing records ______________________________________________________ 20 Using vehicle surveys to quantify waste ________________________________________ 21
Quantifying waste at the location where it is generated________________________________ 22 Collecting data to estimate waste composition ............................................................. 24
Recommended numbers and sizes of samples ______________________________________ 24 Stratification of samples; allocation to sub-sectors ___________________________________ 25 Sampling procedures __________________________________________________________ 25
Hand-sorting _____________________________________________________________ 25 Visual sampling ___________________________________________________________ 26 Using existing data for waste characterization ___________________________________ 26
Equipment and safety measures..................................................................................... 27 Calculation methods ________________________________________________________27

Introduction ...................................................................................................................... 27 Quantity calculations ....................................................................................................... 28
Quantifying a waste sector based on vehicle surveys _________________________________ 28 Quantifying a waste sector based on measurements at the point of generation _____________ 29
Composition calculations ................................................................................................ 30 Calculating the mean estimate ___________________________________________________ 30 Calculating the error range______________________________________________________ 31
Combination of estimates (weighted combinations) ..................................................... 31 Calculating the weighting factors when combining waste sectors ________________________ 31 Calculating the mean estimate for combined sectors _________________________________ 32 Calculating variance and confidence intervals for combined sectors _____________________ 32
Products of waste characterization studies _____________________________________33 Information and estimates to be reported ...................................................................... 33 Data to be recorded.......................................................................................................... 34
Recording data from vehicle surveys ______________________________________________ 34 Recording waste quantity data from the point of generation ____________________________ 35 Recording waste composition data _______________________________________________ 36
Glossary __________________________________________________________________37
Appendix A: Recommended Material List and Definitions Appendix B: Volume-to-Weight Conversion Factors Appendix C: Equipment Lists Appendix D: Health and Safety Measures Appendix E: Example of Waste Composition Field Form Appendix F: Values of the t-statistic Appendix G: Recommended grouping of industry types for waste generator studies
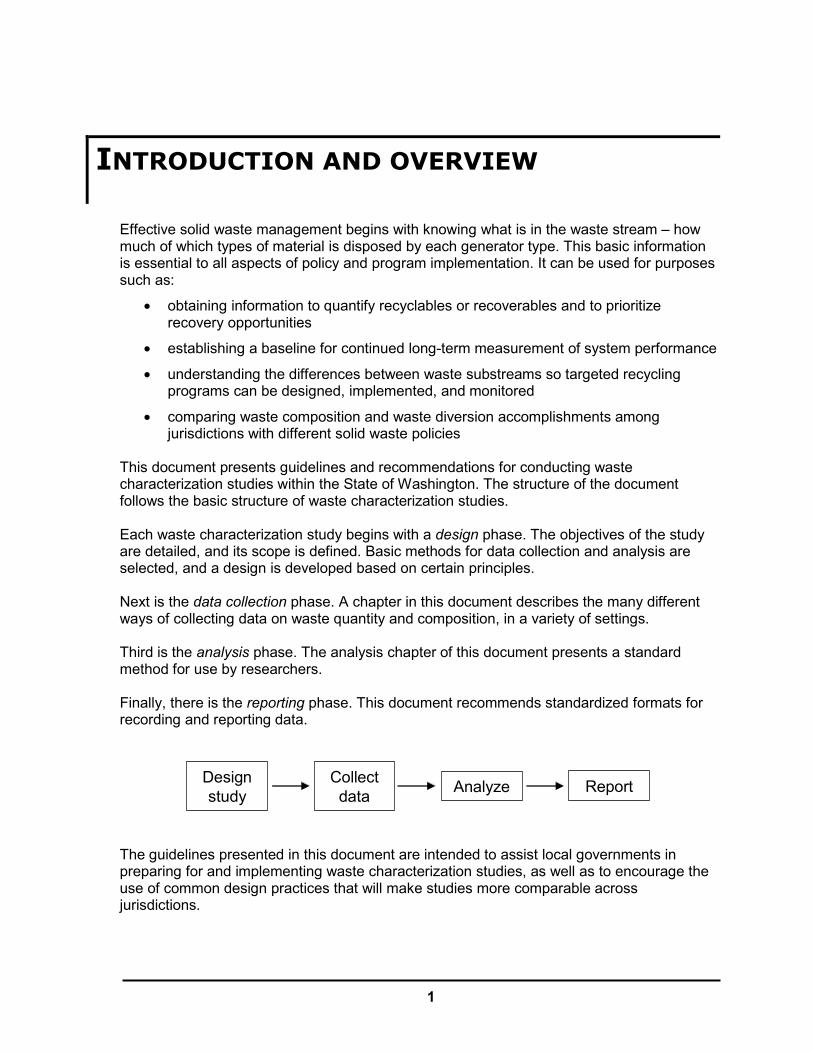
1
INTRODUCTION AND OVERVIEW
Effective solid waste management begins with knowing what is in the waste stream – how much of which types of material is disposed by each generator type. This basic information is essential to all aspects of policy and program implementation. It can be used for purposes such as:
• obtaining information to quantify recyclables or recoverables and to prioritize recovery opportunities
• establishing a baseline for continued long-term measurement of system performance
• understanding the differences between waste substreams so targeted recycling programs can be designed, implemented, and monitored
• comparing waste composition and waste diversion accomplishments among jurisdictions with different solid waste policies
This document presents guidelines and recommendations for conducting waste characterization studies within the State of Washington. The structure of the document follows the basic structure of waste characterization studies. Each waste characterization study begins with a design phase. The objectives of the study are detailed, and its scope is defined. Basic methods for data collection and analysis are selected, and a design is developed based on certain principles. Next is the data collection phase. A chapter in this document describes the many different ways of collecting data on waste quantity and composition, in a variety of settings. Third is the analysis phase. The analysis chapter of this document presents a standard method for use by researchers. Finally, there is the reporting phase. This document recommends standardized formats for recording and reporting data.
Designstudy
Collectdata Analyze Report
The guidelines presented in this document are intended to assist local governments in preparing for and implementing waste characterization studies, as well as to encourage the use of common design practices that will make studies more comparable across jurisdictions.
2
WASTE CHARACTERIZATION STUDY DESIGN
A waste characterization study typically involves development of two kinds of estimates: (1) an estimate of the composition of the waste with respect to a list of clearly defined materials and (2) an estimate of the quantity of waste. In most cases, both parts are equally important. An estimate of waste composition is usually expressed in terms of the estimated percent by weight that each material contributes to the waste stream. The estimated percents are often shown with associated “error ranges” derived through statistical analysis. Weight is the standard used in most studies. The composition estimate is obtained by characterizing samples of actual waste, either by hand-sorting the samples or by characterizing them visually. An estimate of the quantity of waste may be developed through a variety of methods that are described later in this document. The quantity of waste is usually expressed in terms of the tons disposed during a certain time period (e.g., tons per year). Combining the composition estimate and the quantity estimate permits the calculation of the amount, generally measured in tons, of each individual material that is disposed during the given time period. The entire disposed waste stream is usually too complicated to address with a single approach to data collection, because disposed waste is generated by a variety of sources (e.g., residences, businesses, industry, agriculture, etc.), and because it is transported to disposal facilities through a variety of means. Indeed, some waste (such as crop residue or manure left on fields) is not transported to a permitted disposal facility at all, but rather is disposed at the location where it was generated. Therefore, it is helpful to envision the entire waste stream as being composed of several sectors of waste, and it is important to consider which sectors should be examined in any study that is planned. (A diagram of the waste sectors that comprise the entire waste stream appears on page 12.) One of the functions of this document is to provide standard definitions of waste sectors that can be used, when appropriate, in waste characterization studies conducted in the State of Washington. In every waste characterization study, the precision of a composition estimate depends on the number of waste samples that are characterized, the inherent variability of the waste in a particular sector, and the quality of the data collection work. Characterizing more samples almost always improves the precision of the composition estimate, but there also is a point of diminishing returns with respect to the additional accuracy obtained with each additional sample. Waste from the commercial, construction/demolition, and self-haul sectors is usually more variable in terms of composition than waste from the commercially-hauled residential sector.
CCCCHOOSING THE HOOSING THE HOOSING THE HOOSING THE RRRRIGHT IGHT IGHT IGHT DDDDATA ATA ATA ATA CCCCOLLECTION OLLECTION OLLECTION OLLECTION AAAAPPROACHPPROACHPPROACHPPROACH
A waste characterization study is never a simple undertaking, but its complexity depends on the nature of the waste stream being studied and the level of detail required in the study’s findings. The general approach that is chosen for a waste characterization study should

3
provide data at a sufficient level of detail to inform waste management decisions. A waste characterization study also must be designed to fit within budgetary constraints.1 The paragraphs below provide a brief overview of eight general approaches to collecting data about solid waste. Depending on the type of information that is expected from the waste characterization study, the approaches described below may be used singly or in combinations. (1) Hand-sorting of Waste Samples Obtained from Vehicles at the Disposal Facility –
This method produces the most accurate waste characterization data, and it is especially suitable for waste that is typically composed of many small pieces of numerous materials. Generally, an entire vehicle-load of waste is identified for sampling, but only a portion of the load is pulled out for actual sorting. This method is nearly essential for thorough characterization of residential or commercial waste. It is less useful in characterizing waste that typically consists of large piece of material, such as some loads of construction and demolition waste. Because the method is employed at the disposal facility, it is of little use in correlating waste composition with specific types of waste generators, such as particular types of business.
(2) Visual Characterization of Waste Samples Obtained from Vehicles – This method is
ideally suited for waste that is taken to a disposal facility and that arrives in loads that are fairly homogenous individually (even if loads are markedly different from one another). Waste loads from various construction, demolition, and landscaping activities are often suitable for visual characterization, because an individual load often contains just a few materials. The usual approach in visual characterization is to estimate the composition of the entire load and to correlate the visual estimate with the net weight of the load.
(3) Hand-sorting of Waste Samples Obtained from Waste Generators – This study
method produces waste composition data that can be correlated to specific types of waste generators, such as specific categories of business or industry, multifamily buildings, or single-family residences in specific neighborhoods. Waste samples are obtained at the location where they were generated – e.g., from the dumpsters or disposal areas of the business or building in question.
1 While it is not possible in this document to estimate the cost of every type of waste characterization study, it is possible to provide some examples of expected costs. A study based at a disposal site, involving 80 samples of residential waste, 120 samples of commercial waste, and 120 samples of self-haul waste might be expected to cost between $80,000 and $120,000 in 2003 dollars. A study of waste at the generator level (i.e., visits to individual businesses) is relatively more expensive on a per-sample basis.
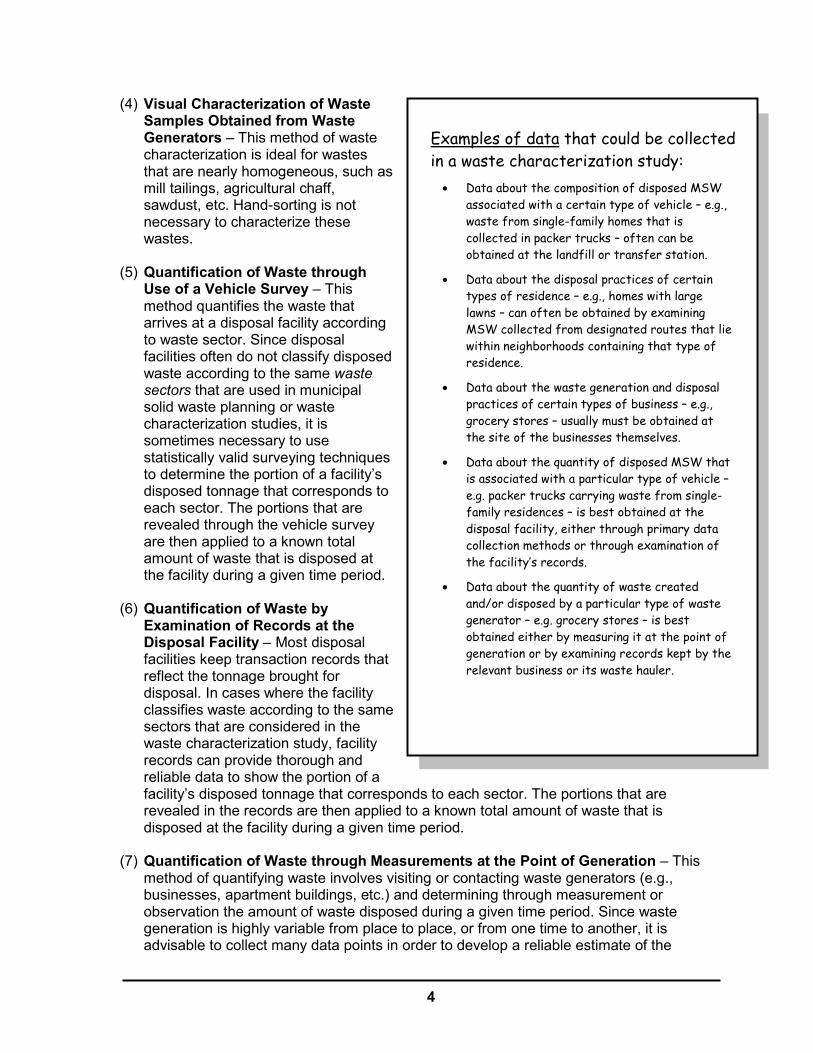
4
(4) Visual Characterization of Waste Samples Obtained from Waste Generators – This method of waste characterization is ideal for wastes that are nearly homogeneous, such as mill tailings, agricultural chaff, sawdust, etc. Hand-sorting is not necessary to characterize these wastes.
(5) Quantification of Waste through
Use of a Vehicle Survey – This method quantifies the waste that arrives at a disposal facility according to waste sector. Since disposal facilities often do not classify disposed waste according to the same waste sectors that are used in municipal solid waste planning or waste characterization studies, it is sometimes necessary to use statistically valid surveying techniques to determine the portion of a facility’s disposed tonnage that corresponds to each sector. The portions that are revealed through the vehicle survey are then applied to a known total amount of waste that is disposed at the facility during a given time period.
(6) Quantification of Waste by
Examination of Records at the Disposal Facility – Most disposal facilities keep transaction records that reflect the tonnage brought for disposal. In cases where the facility classifies waste according to the same sectors that are considered in the waste characterization study, facility records can provide thorough and reliable data to show the portion of a facility’s disposed tonnage that corresponds to each sector. The portions that are revealed in the records are then applied to a known total amount of waste that is disposed at the facility during a given time period.
(7) Quantification of Waste through Measurements at the Point of Generation – This
method of quantifying waste involves visiting or contacting waste generators (e.g., businesses, apartment buildings, etc.) and determining through measurement or observation the amount of waste disposed during a given time period. Since waste generation is highly variable from place to place, or from one time to another, it is advisable to collect many data points in order to develop a reliable estimate of the
Examples of data that could be collected in a waste characterization study:
• Data about the composition of disposed MSW associated with a certain type of vehicle – e.g., waste from single-family homes that is collected in packer trucks – often can be obtained at the landfill or transfer station.
• Data about the disposal practices of certain types of residence – e.g., homes with large lawns – can often be obtained by examining MSW collected from designated routes that lie within neighborhoods containing that type of residence.
• Data about the waste generation and disposal practices of certain types of business – e.g., grocery stores – usually must be obtained at the site of the businesses themselves.
• Data about the quantity of disposed MSW that is associated with a particular type of vehicle – e.g. packer trucks carrying waste from single-family residences – is best obtained at the disposal facility, either through primary data collection methods or through examination of the facility’s records.
• Data about the quantity of waste created and/or disposed by a particular type of waste generator – e.g. grocery stores – is best obtained either by measuring it at the point of generation or by examining records kept by the relevant business or its waste hauler.

5
average amount of waste disposed by that class of waste generator. Typically, estimates of generation are correlated with another variable that describes the generator, such as number of employees, number of acres, etc. This correlation permits estimates of waste quantities to be “scaled up” to a level larger than the individual generator – e.g. to the countywide or statewide level.
(8) Quantification of Waste by Examination of Records at the Point of Generation –
Some businesses and institutions maintain records that reflect the amount of waste disposed over time. This information often can be found in invoices from the waste hauler. Typically, the amount of waste is expressed in terms of volume rather than weight, so a volume-to-weight conversion factor may be necessary in order to quantify the weight of waste disposed.
GGGGENERAL ENERAL ENERAL ENERAL PPPPRINCIPLESRINCIPLESRINCIPLESRINCIPLES
RRRREPRESENTATIVENESS OFEPRESENTATIVENESS OFEPRESENTATIVENESS OFEPRESENTATIVENESS OF DDDDATAATAATAATA
Regardless of which of the eight general approaches are chosen for data collection, it is important to design the study in a way that collects data that is representative of the entire segment of the waste stream being studied. Some questions that can be considered in order to determine whether a study design will produce representative data include:
• Are there segments of the waste stream that will not be encountered during the planned data collection activities? If so, what is the likelihood that those segments are significantly different (in either quantity or composition) from the segments for which data is being collected? The study should not “ignore” segments of the waste stream during data collection if it is going to represent those segments in its conclusions.
• Is one segment of the waste stream overrepresented during data collection activities compared to another segment? If so, is it possible to modify the data collection approach to avoid this overrepresentation? (Even if it is not possible to modify the data collection approach, there may be ways to correct for a biased data collection approach later during analysis of the data.)
The sections below describe common considerations related to the representativeness of data collected in waste characterization studies. DDDDECIDING ECIDING ECIDING ECIDING WWWWHEN TO HEN TO HEN TO HEN TO CCCCOLLECT OLLECT OLLECT OLLECT DDDDATAATAATAATA
COLLECTING DATA IN MULTIPLE SEASONS
If it is reasonable to believe that important aspects of the waste sectors being studied vary by season, then the data should be collected during multiple seasons. For example, if a study is intended to determine the amount of yard waste that is disposed, then it should collect data during seasons when yard waste disposal patterns are different, in order to develop a complete picture of yard waste disposal. Disposal rates and characteristics may be expected to vary by season for many materials, such as:

6
• soft-drink bottles, which may be bought and discarded more frequently during warm months
• waste generated from household clean-up activities, such as “spring cleaning”
• agricultural wastes from seasonal crops
• yard wastes
• construction wastes from seasonal building activities
Both the composition and the quantity of waste disposal may vary by season. In certain parts of Washington, for example, waste disposal quantities change with seasonal influx of tourists and part-time residents, as well as with seasonal changes in economic activity. Therefore, the study designer should consider both aspects of the waste characterization study – composition and quantity – in relation to seasonal changes. COLLECTING DATA AT DIFFERENT TIMES OF THE DAY OR WEEK
Waste disposal patterns often vary according to the time of day or week. This may be true at disposal facilities where, for example, packer trucks carrying single-family residential waste may arrive disproportionately in the early morning hours and on weekdays rather than weekends. This may also be true at the point of waste generation, where for example, a manufacturing plant may take its waste outside to the dumpsters on certain days and not on other days. The study design should include plans either (1) to collect data that covers the entire period of disposal, or (2) to collect data that may be assembled later in a way that represents the entire period. DDDDECIDING ECIDING ECIDING ECIDING WWWWHERE TO HERE TO HERE TO HERE TO CCCCOLLECT OLLECT OLLECT OLLECT DDDDATAATAATAATA
Several factors determine what constitutes the best location for data collection. The scenarios presented below illustrate some of the considerations that affect the choice of location.
Example of timing the data collection to represent a week-long cycle of waste disposal: At a certain landfill, vehicles carrying self-hauled waste arrive six days every week. The ones arriving on weekdays generally come from commercial operations, whereas the ones arriving on Saturdays include a greater number of residents bringing waste from their homes. The residential waste is assumed to have different characteristics than the commercial waste. The County wants to develop a composition profile for all self-hauled waste combined, but it cannot afford to collect data for all six days that make up a complete weekly cycle. In order to represent the entire week of waste disposal, the County decides to collect and sort samples of self-hauled waste on one weekday and one Saturday. This approach allows the County to collect data that is representative of the entire week-long “cycle” of self-hauled waste disposal. Later, when the County develops composition estimates based on data from the waste sorts, it can devise a calculation method that allows the single weekday to “stand in for” the five weekdays in a week-long cycle, while data from the Saturday sort will stand in for the single Saturday in the cycle. (This method of assigning different importance to certain data during the analysis is described on page 31 of this document.)
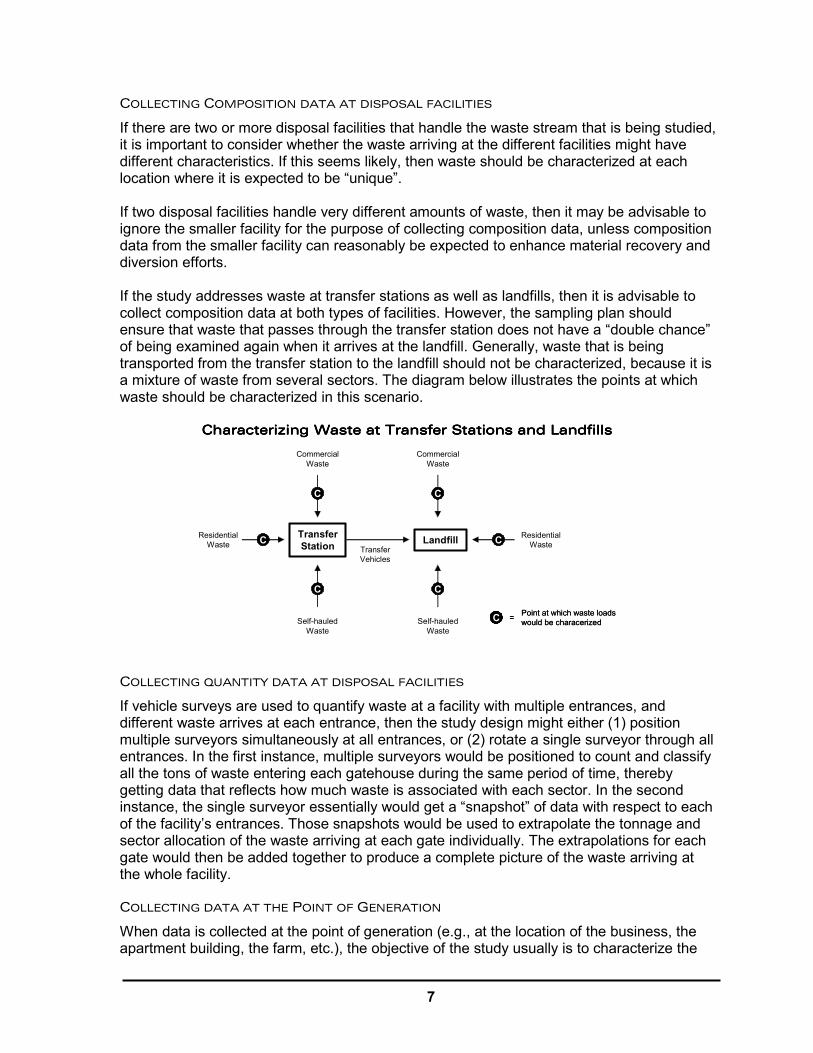
7
COLLECTING COMPOSITION DATA AT DISPOSAL FACILITIES
If there are two or more disposal facilities that handle the waste stream that is being studied, it is important to consider whether the waste arriving at the different facilities might have different characteristics. If this seems likely, then waste should be characterized at each location where it is expected to be “unique”. If two disposal facilities handle very different amounts of waste, then it may be advisable to ignore the smaller facility for the purpose of collecting composition data, unless composition data from the smaller facility can reasonably be expected to enhance material recovery and diversion efforts. If the study addresses waste at transfer stations as well as landfills, then it is advisable to collect composition data at both types of facilities. However, the sampling plan should ensure that waste that passes through the transfer station does not have a “double chance” of being examined again when it arrives at the landfill. Generally, waste that is being transported from the transfer station to the landfill should not be characterized, because it is a mixture of waste from several sectors. The diagram below illustrates the points at which waste should be characterized in this scenario.
Characterizing Waste at Transfer Stations and LandfillsCharacterizing Waste at Transfer Stations and LandfillsCharacterizing Waste at Transfer Stations and LandfillsCharacterizing Waste at Transfer Stations and Landfills
TransferStation Landfill
CommercialWaste
ResidentialWaste
Self-hauledWaste
TransferVehicles
C
C
C
CommercialWaste
ResidentialWaste
Self-hauledWaste
C
C
C
C Point at which waste loads would be characerized=C Point at which waste loads would be characerized=
COLLECTING QUANTITY DATA AT DISPOSAL FACILITIES
If vehicle surveys are used to quantify waste at a facility with multiple entrances, and different waste arrives at each entrance, then the study design might either (1) position multiple surveyors simultaneously at all entrances, or (2) rotate a single surveyor through all entrances. In the first instance, multiple surveyors would be positioned to count and classify all the tons of waste entering each gatehouse during the same period of time, thereby getting data that reflects how much waste is associated with each sector. In the second instance, the single surveyor essentially would get a “snapshot” of data with respect to each of the facility’s entrances. Those snapshots would be used to extrapolate the tonnage and sector allocation of the waste arriving at each gate individually. The extrapolations for each gate would then be added together to produce a complete picture of the waste arriving at the whole facility. COLLECTING DATA AT THE POINT OF GENERATION
When data is collected at the point of generation (e.g., at the location of the business, the apartment building, the farm, etc.), the objective of the study usually is to characterize the
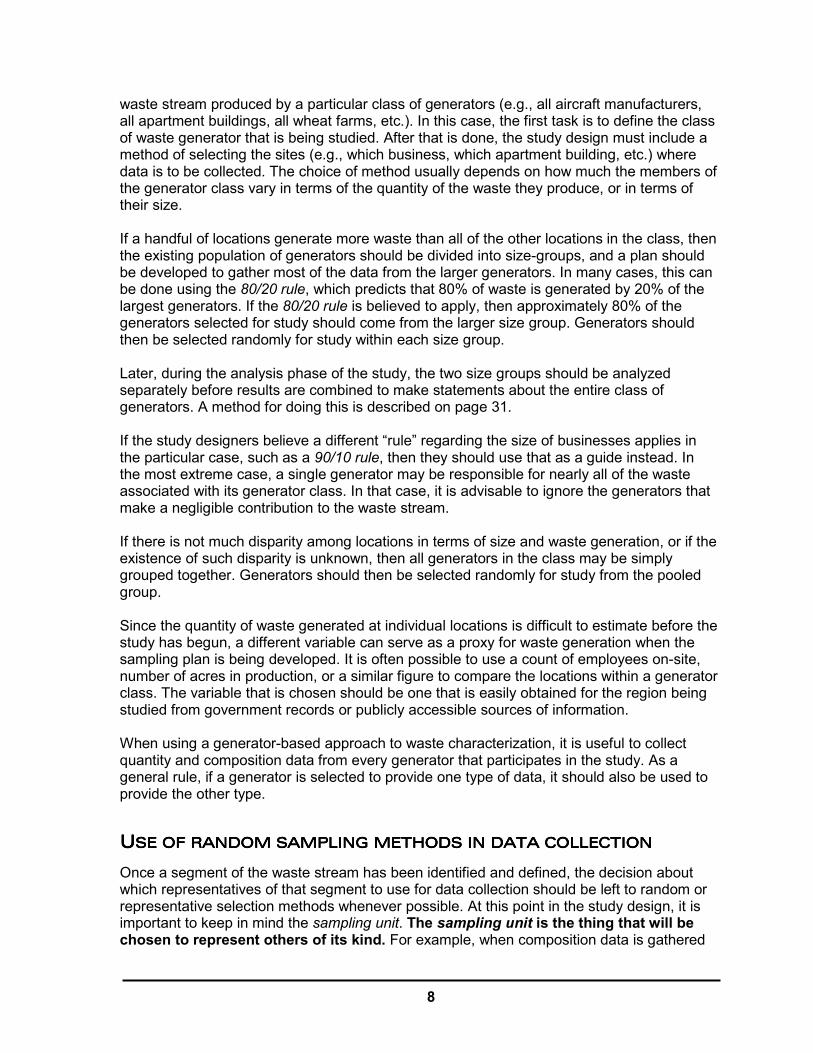
8
waste stream produced by a particular class of generators (e.g., all aircraft manufacturers, all apartment buildings, all wheat farms, etc.). In this case, the first task is to define the class of waste generator that is being studied. After that is done, the study design must include a method of selecting the sites (e.g., which business, which apartment building, etc.) where data is to be collected. The choice of method usually depends on how much the members of the generator class vary in terms of the quantity of the waste they produce, or in terms of their size. If a handful of locations generate more waste than all of the other locations in the class, then the existing population of generators should be divided into size-groups, and a plan should be developed to gather most of the data from the larger generators. In many cases, this can be done using the 80/20 rule, which predicts that 80% of waste is generated by 20% of the largest generators. If the 80/20 rule is believed to apply, then approximately 80% of the generators selected for study should come from the larger size group. Generators should then be selected randomly for study within each size group. Later, during the analysis phase of the study, the two size groups should be analyzed separately before results are combined to make statements about the entire class of generators. A method for doing this is described on page 31. If the study designers believe a different “rule” regarding the size of businesses applies in the particular case, such as a 90/10 rule, then they should use that as a guide instead. In the most extreme case, a single generator may be responsible for nearly all of the waste associated with its generator class. In that case, it is advisable to ignore the generators that make a negligible contribution to the waste stream. If there is not much disparity among locations in terms of size and waste generation, or if the existence of such disparity is unknown, then all generators in the class may be simply grouped together. Generators should then be selected randomly for study from the pooled group. Since the quantity of waste generated at individual locations is difficult to estimate before the study has begun, a different variable can serve as a proxy for waste generation when the sampling plan is being developed. It is often possible to use a count of employees on-site, number of acres in production, or a similar figure to compare the locations within a generator class. The variable that is chosen should be one that is easily obtained for the region being studied from government records or publicly accessible sources of information. When using a generator-based approach to waste characterization, it is useful to collect quantity and composition data from every generator that participates in the study. As a general rule, if a generator is selected to provide one type of data, it should also be used to provide the other type.
UUUUSE OF RANDOM SAMPLINSE OF RANDOM SAMPLINSE OF RANDOM SAMPLINSE OF RANDOM SAMPLING METHODS IN DATA COG METHODS IN DATA COG METHODS IN DATA COG METHODS IN DATA COLLECTIONLLECTIONLLECTIONLLECTION
Once a segment of the waste stream has been identified and defined, the decision about which representatives of that segment to use for data collection should be left to random or representative selection methods whenever possible. At this point in the study design, it is important to keep in mind the sampling unit. The sampling unit is the thing that will be chosen to represent others of its kind. For example, when composition data is gathered

9
for single-family residential waste at disposal facilities, the sampling unit is the packer truck that brings waste to the disposal facility. (Studies are designed this way because it is relatively easy to develop a selection procedure for packer trucks. It would be more difficult to design a study that defined the sampling unit to be a cubic yard of waste, because waste arriving at disposal facilities doesn’t come in discrete cubic-yard-sized bundles.) Likewise, when composition or quantity data is gathered for machine shops, the individual shop is the sampling unit. The sections below present guidelines and examples for the use of random or representative selection of sampling units. RRRRANDOM SELECTION OF VANDOM SELECTION OF VANDOM SELECTION OF VANDOM SELECTION OF VEHICLE LOADS TO GATHEHICLE LOADS TO GATHEHICLE LOADS TO GATHEHICLE LOADS TO GATHER COMPOSITION DATAER COMPOSITION DATAER COMPOSITION DATAER COMPOSITION DATA
When constructing a sampling plan based on vehicles, the quota of vehicles that should be sampled is compared to the number of vehicles of that type that are expected to arrive during the data collection period. For example, the sampling plan for single-family residential waste may call for eight samples from packer trucks, and the number of packer trucks arriving at the disposal facility on the sampling day may be 24. The study designer should choose ahead of time which vehicles will provide waste samples. The choice of vehicles may rely on either of the following approaches:
• random selection of collection routes and identification of the vehicles that correspond to those routes, in which case the designer would pre-select eight of the 24 routes randomly;
• systematic selection of vehicles based on the order in which they arrive at the facility, in which case the designer would develop a worksheet that allows the person selecting vehicles to count off every 3rd vehicle and divert it to the sampling crew.
If a hand-sorting method is used to characterize the waste sample, then the portion of a waste load that is pulled out for hand-sorting should be randomly chosen as well. This procedure is described on page 18. RRRRANDOM SELECTION OF DANDOM SELECTION OF DANDOM SELECTION OF DANDOM SELECTION OF DISPOSAL FACILITIESISPOSAL FACILITIESISPOSAL FACILITIESISPOSAL FACILITIES, , , , WHEN APPROPRIATEWHEN APPROPRIATEWHEN APPROPRIATEWHEN APPROPRIATE
When there is more than one disposal facility at which data could be collected, there are several considerations in choosing where to go. Foremost is the question of which facilities handle the greatest amounts of waste. Data should be collected at those facilities that collectively handle a significant and representative portion of the waste stream being studied. If multiple facilities are approximately equivalent with respect to the quantity and mixture of wastes they receive, then it is permissible to use a random selection approach to assign data collection activities to some facilities and not others. However, if study resources permit, it is preferable to spread the data collection activities among multiple facilities. If multiple days are planned for data collection, a random assignment of days to individual disposal facilities is recommended. However, logistical and scheduling complications may prevent a purely random assignment of days and locations. RRRRANDOM SELECTION OF LANDOM SELECTION OF LANDOM SELECTION OF LANDOM SELECTION OF LOCATIONS FOR GENERATOCATIONS FOR GENERATOCATIONS FOR GENERATOCATIONS FOR GENERATOROROROR––––BASED STUDIESBASED STUDIESBASED STUDIESBASED STUDIES
Once the appropriate generator classes and size groups have been identified, representative generators from within each class and size group should be chosen in the

10
most random method possible. Usually, this involves assembling a list of candidate generators from any available source – the telephone directory, commercial providers of mailing lists, the chamber of commerce, etc. A quota is set for the number of generators that are to be included in the study, and a certain number (more than the quota number) of generators are selected at random from the list. Generators are contacted, screened with respect to the criteria of the study, and scheduled for data collection visits. Lists from which generators are chosen should be as comprehensive as possible. The process of recruiting generators to participate in waste characterization studies is often difficult, and it is not unusual to contact as many as ten generators in order to recruit one that is willing and eligible. When waste is to be physically separated for hand-sorting and characterization (as opposed to visual characterization of homogenous piles of material), the choice of which waste to pull from refuse piles or dumpsters should be random. Procedures for this are recommended on page 20.
DDDDESIGN A STUDYESIGN A STUDYESIGN A STUDYESIGN A STUDY TO MAXIMIZE COMPATI TO MAXIMIZE COMPATI TO MAXIMIZE COMPATI TO MAXIMIZE COMPATIBILITY WITH OTHER BILITY WITH OTHER BILITY WITH OTHER BILITY WITH OTHER STUDIESSTUDIESSTUDIESSTUDIES
Waste characterization studies are often conducted to answer immediate questions related to the feasibility of recovering or diverting certain materials from the disposed waste stream locally. However, each study also represents an important opportunity to contribute to the knowledge and tools available to communities throughout the State and the Nation. In several instances, waste planning efforts in Washington communities have been based on waste composition and quantity data that was collected in other communities inside or outside of the state. Therefore, in addition to the priority of designing a study to answer the immediate questions arising locally, the designer of a waste characterization study should endeavor to produce data that can be used by other communities too. One key to ensuring the usefulness of the data is to make it conform to certain conventions that other communities use as well. These conventions include:
• Standard definitions of waste sectors – Standard definitions for the sectors of the waste stream ensure that waste is counted in the same way in each study. A set of definitions for waste sectors and subsectors is presented in the following section of this document.
• Standard definitions of materials in the waste stream – The list and definitions of materials that are examined in a waste characterization study must be guided by the information needs of the study at hand. However, it is usually possible to design the list and definitions such that they are compatible with waste characterization studies conducted in other locations and in other years. This compatibility in material lists facilitates comparison of disposal behavior, recycling levels, and program performance. A recommended material list for waste characterization studies is presented in Appendix A.
• Standardized recording and presentation of data – There are some specific models for electronic recording and storage of data that facilitate analysis and make the sharing of data easier among jurisdictions. Examples and templates for these storage formats are presented on pages 35 and 36.
11
A A A A SYSTEM FOR CLASSIFYISYSTEM FOR CLASSIFYISYSTEM FOR CLASSIFYISYSTEM FOR CLASSIFYING WASTENG WASTENG WASTENG WASTE
The “universe” of solid waste is depicted in the figure on page 12. It can be divided in several ways to produce answers to the questions that lead to waste characterization studies. Typically, the “universe” of solid waste is studied in segments according to the destination of the waste (e.g., landfilled, recycled, or handled in another way), its origin (e.g., the type of business or household that produced it), who transported it to the disposal location, and the type of vehicle used to transport it. The typical waste characterization study will consider only some of these dimensions at one time. The classifications are described below.
CCCCLASSIFYING WASTE BY LASSIFYING WASTE BY LASSIFYING WASTE BY LASSIFYING WASTE BY ITS DESTINATIONITS DESTINATIONITS DESTINATIONITS DESTINATION
The universe of solid waste can be classified according to three main destinations. • Waste sent to landfill includes waste that is disposed in permitted solid waste disposal
facilities. • Waste put to beneficial use includes materials that are recycled, reused, or
incorporated into another manufacturing or agricultural process, and it includes any material that is used for some beneficial purpose.
• Waste disposed in other ways includes any waste disposed under conditions not
described above. This typically means material that is left on the ground for no beneficial purpose.
The majority of waste characterization studies focus on waste that is sent to landfills, but a complete accounting of the solid waste produced by any enterprise or any part of society would consider the other sectors of waste as well.
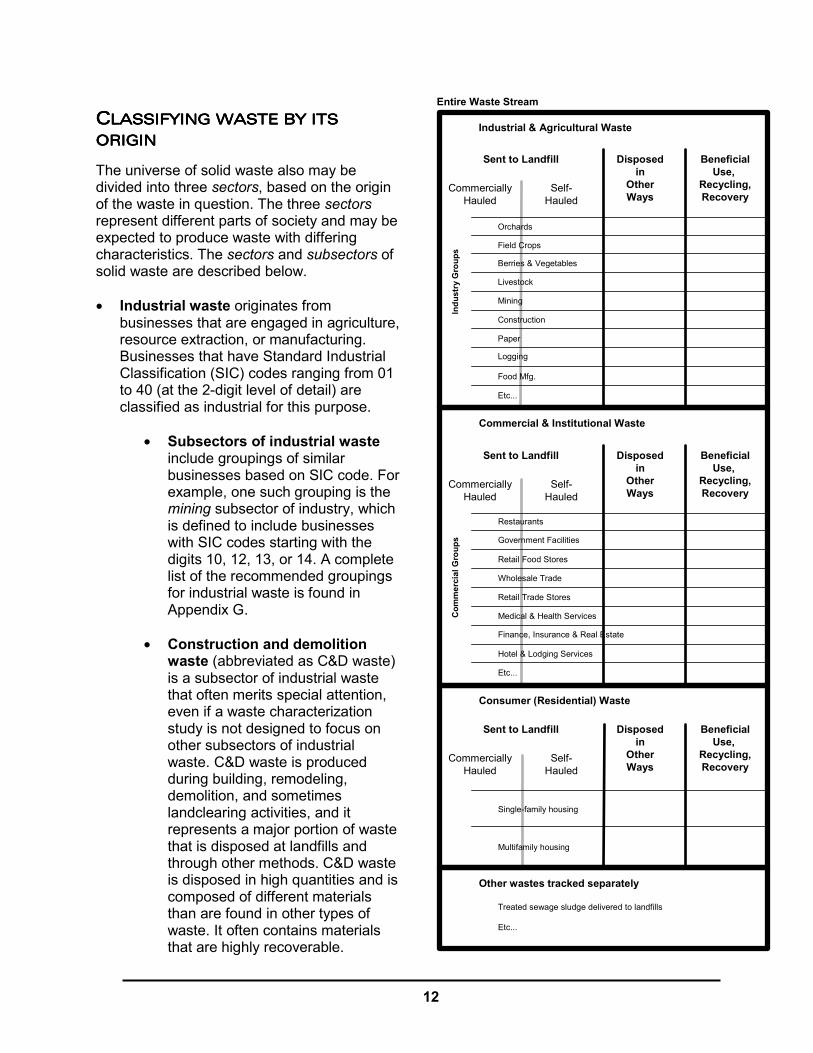
12
CCCCLASSIFYING WASTE BY LASSIFYING WASTE BY LASSIFYING WASTE BY LASSIFYING WASTE BY ITS ITS ITS ITS ORIGINORIGINORIGINORIGIN
The universe of solid waste also may be divided into three sectors, based on the origin of the waste in question. The three sectors represent different parts of society and may be expected to produce waste with differing characteristics. The sectors and subsectors of solid waste are described below.
• Industrial waste originates from
businesses that are engaged in agriculture, resource extraction, or manufacturing. Businesses that have Standard Industrial Classification (SIC) codes ranging from 01 to 40 (at the 2-digit level of detail) are classified as industrial for this purpose.
• Subsectors of industrial waste include groupings of similar businesses based on SIC code. For example, one such grouping is the mining subsector of industry, which is defined to include businesses with SIC codes starting with the digits 10, 12, 13, or 14. A complete list of the recommended groupings for industrial waste is found in Appendix G.
• Construction and demolition
waste (abbreviated as C&D waste) is a subsector of industrial waste that often merits special attention, even if a waste characterization study is not designed to focus on other subsectors of industrial waste. C&D waste is produced during building, remodeling, demolition, and sometimes landclearing activities, and it represents a major portion of waste that is disposed at landfills and through other methods. C&D waste is disposed in high quantities and is composed of different materials than are found in other types of waste. It often contains materials that are highly recoverable.
Entire Waste Stream
Industrial & Agricultural Waste
Indu
stry
Gro
ups
CommerciallyHauled
Self-Hauled
Orchards
Berries & Vegetables
Livestock
Mining
Construction
Paper
Logging
Food Mfg.
Etc...
Disposedin
OtherWays
BeneficialUse,
Recycling,Recovery
Commercial & Institutional Waste
Com
mer
cial
Gro
ups
Restaurants
Government Facilities
Retail Food Stores
Wholesale Trade
Retail Trade Stores
Medical & Health Services
Finance, Insurance & Real Estate
Hotel & Lodging Services
Etc...
Consumer (Residential) Waste
Single-family housing
Multifamily housing
Other wastes tracked separately
Treated sewage sludge delivered to landfills
Etc...
Field Crops
Sent to Landfill
CommerciallyHauled
Self-Hauled
Disposedin
OtherWays
BeneficialUse,
Recycling,Recovery
Sent to Landfill
CommerciallyHauled
Self-Hauled
Disposedin
OtherWays
BeneficialUse,
Recycling,Recovery
Sent to Landfill
13
• Commercial waste originates from businesses, government agencies, and institutions
engaged in any activity other than those associated with industry as defined above. Some examples of commercial waste include waste originating from retail and wholesale businesses, medical facilities, schools, government agencies, and park and street maintenance. Commercial entities have SIC codes ranging from 41 to 97 (at the 2-digit level of detail).
• Subsectors of commercial waste include groupings of similar businesses
based on SIC code. For example, one such grouping is the medical and health services subsector, which is defined to include businesses with SIC codes starting with the digits 80. A complete list of the recommended groupings for industrial waste is found in Appendix G.
• Consumer waste originates from households as a function of the “living” activities in
those households. In the strict definition, it does not include waste generated by business activity conducted at households, although for practical purposes it can be difficult to distinguish home-business waste from consumer waste in a characterization study. Consumer waste also does not include waste generated by construction, remodeling, or landscaping activities that are conducted by hired companies at a residential location.
• Single-family consumer waste originates from households that do not share
trash cans or dumpsters with more than three other households. Typically, the definition of single-family in waste characterization studies encompasses buildings containing from one to four dwelling units. Single-family waste is often collected in packer trucks on routes that service only single-family dwellings.
• Multifamily consumer waste originates from households that share trash cans
or dumpsters. Typically, the definition of multifamily includes buildings containing more than four dwelling units. Multifamily waste often differs in composition from single-family waste by containing fewer materials associated with yard maintenance. Multifamily waste is often collected in packer trucks on routes that service commercial establishments as well as multifamily buildings.
• Other wastes often are tracked and counted separately by waste disposal facilities.
Examples of other waste include sludge from sewage treatment plants, petroleum-contaminated soils, asbestos, and other special wastes.
CCCCLASSIFYING WASTE ACCLASSIFYING WASTE ACCLASSIFYING WASTE ACCLASSIFYING WASTE ACCORDING TO WHORDING TO WHORDING TO WHORDING TO WHO HAULS ITO HAULS ITO HAULS ITO HAULS IT
Quantity and composition characteristics are often different for waste that is collected by waste hauling companies and waste that is hauled by the household or business that generated it. Therefore, in most studies that address waste taken to solid waste facilities, it is important to examine commercially-collected and self-hauled waste separately.
14
CCCCLASSIFYING WASTE ACCLASSIFYING WASTE ACCLASSIFYING WASTE ACCLASSIFYING WASTE ACCORDING TO VEHICLE TYORDING TO VEHICLE TYORDING TO VEHICLE TYORDING TO VEHICLE TYPEPEPEPE
For some types of waste, such as C&D and self-hauled waste, the quantity and composition are correlated with the type of vehicle that brings the waste to the disposal facility. Therefore, in some cases, it is helpful to consider separately the waste arriving on different vehicle types. A typical classification scheme for vehicles might include (1) packer trucks, (2) dump trucks, (3) roll-off boxes or drop boxes, (4) other large vehicles, and (5) vehicles the size of a pickup truck or smaller.
MMMMAKING SENSE OF THE CAKING SENSE OF THE CAKING SENSE OF THE CAKING SENSE OF THE CLASSIFICATIONSLASSIFICATIONSLASSIFICATIONSLASSIFICATIONS
Taken together, the classifications of waste described above represent a system for ensuring that waste characterization studies count things in the same way. However, the typical waste characterization study will consider only a portion of the waste included in the “entire waste stream” depicted in the figure on page 12 and will therefore address fewer classifications of waste. Some examples of the scope of typical waste characterization studies are presented below.
Example: A study of municipal solid waste (MSW) as it arrives at the landfillManagers of a landfill want to know the proportions of commercially-hauled waste arriving from the commercial/industrial and consumer sectors, and they want information about waste composition. They design a study that classifies waste loads arriving at the facility as either single-family, multifamily, commercial, or industrial. As loads arrive during the study period, they record the net weight of each load in the proper category, in order to determine the proportions later. They also select loads from each category for sampling and characterization, to produce data that will portray the composition of each of the identified categories of waste. This study examines commercially hauled waste taken to landfills. It does not make distinctions according to business group or industry group. It does not address waste disposed through other methods or allocated to beneficial use.
Example: A study of commercial waste seeks to correlate waste composition with type of business In order to correlate waste composition with type of business, city managers design a study that entails visits to selected businesses belonging to particular groups of interest (e.g., grocery stores, home & garden stores, and other large retail stores). Quantities of waste are measured in the dumpsters and associated with known time-periods of waste generation. Samples of waste are taken from dumpsters and characterized. This study examines commercial waste from selected industry groups. It does not make distinctions according to hauling method. It does not address waste disposed through other methods or allocated to beneficial use.

15
DATA COLLECTION
This section presents the “how to” of collecting data in waste characterization studies. It provides recommended methods for addressing each type of waste characterization study and collecting data with respect to each type of waste suggested in the diagram of the waste stream shown on page 12.
OOOOVERVIEW OF DATA COLLVERVIEW OF DATA COLLVERVIEW OF DATA COLLVERVIEW OF DATA COLLECTION ANECTION ANECTION ANECTION AND CALCULATION ISSUESD CALCULATION ISSUESD CALCULATION ISSUESD CALCULATION ISSUES
The data collection aspect of a waste characterization study begins with the construction of a sampling plan, which determines when and where data will be collected and specifies the exact pieces of data that will be collected. Construction of the sampling plan often involves nearly as much work as collecting data in the field.
DDDDEFINING AND ISOLATINEFINING AND ISOLATINEFINING AND ISOLATINEFINING AND ISOLATING THE SAMPLEG THE SAMPLEG THE SAMPLEG THE SAMPLE
The first step in designing the sampling plan is to confirm which waste sectors are to be studied. (Please refer to the diagram on page 12.) This means determining which of the “dimensions” of waste variability to pay attention to. (As described in the previous section, the typical “dimensions” of waste variability are its destination, its origin, the type of hauler, and the type of vehicle.) As a guide in choosing which “dimensions” to consider, the study designer should predict which ones are likely to correlate with differences in waste composition while also producing information that can be acted upon by policymakers (see examples at right). Next, a method should be devised for assigning a waste quantity to each waste sector that has been identified for study. In some cases the waste can be quantified, based on records maintained by waste haulers or disposal facilities, before any field work takes place. More often, the data is not available to quantify waste precisely, and only rough estimates can be made. In that case, the study designer should devise a survey-based or measurement-based approach to quantify each waste sector. Then, based on preliminary estimates of the relative quantities associated with each waste
Examples of defining waste sectors Waste sectors usually are identified in a waste characterization study such that they meet two criteria: (1) they can be isolated and studied, and (2) they can be addressed through policy measures. Many waste characterization studies include an examination of single-family residential waste, because that sector is easily studied and is relatively easy to address with waste reduction marketing, messages, and policies. Some studies in recent years have emphasized collection of waste from specific commercial groups, because those groups were believed to produce waste with relatively high amounts of recoverable waste, such as organics for composting or plastics for recycling.
16
sector, the study designer should prioritize the sectors and decide which ones should be characterized through sampling. Usually, the waste sectors that should be sampled are the ones that represent the largest amounts of waste. However, if a waste sector seems especially easy to address with recycling or diversion programs, it may be assigned a higher priority than sectors that are expected to be difficult to address. Likewise, if a waste sector is expected to contain a greater concentration of valuable materials or harmful materials, it may be assigned a higher priority. The paragraphs below describe methods for deciding how to get the waste sample for the purpose of collecting waste composition data. (It is assumed that waste quantity estimates will be developed for all locations and all sectors of waste, even if those estimates are rough, and even if composition data is not collected for those waste sectors.) Specific methods for collecting composition data and quantity data are described later in this chapter.
PPPPROCEDURES FOR SELECTROCEDURES FOR SELECTROCEDURES FOR SELECTROCEDURES FOR SELECTING DISPOSAL FACILITING DISPOSAL FACILITING DISPOSAL FACILITING DISPOSAL FACILITIESIESIESIES
When multiple solid waste facilities handle the waste sectors being addressed in a study, the designers should endeavor to collect composition data from each targeted sector of waste arriving at each of the facilities. If too many facilities exist in the solid waste system to make sampling at all of the facilities practical, then facilities should be selected using the method described below. � First, rank the solid waste facilities in terms of the estimated amounts of “direct-
hauled” waste from targeted sectors that arrives at each facility. (Do not allow waste to be “counted twice” by considering it first at a transfer station and considering it again in the transfer trailers going from the transfer station to the landfill or railhead.)
� Second, determine the “cut-off point” that separates the facilities that handle the
largest amount of the targeted waste sectors from those that handle smaller amounts. Usually, the cut-off point distinguishes the set of facilities that collectively handle approximately 70% to 80% of the targeted waste that is addressed by the study.
� Third, determine how many samples may be collected and how many facilities may
be visited, given the resources available for the waste characterization study. Assume that the most efficient approach to waste sampling is to allow the sampling crew to work at a single location for one or more complete days, rather than expecting the crew to “hop” from one facility to another on the same day.
� Fourth, use a random selection method to choose the requisite number of facilities
from among those that handle the largest amounts of the targeted waste. � Fifth, for the facilities where waste sampling does not occur, correlate the waste in
each sector to the waste at the facilities where sampling does occur. For example, if single family waste is sampled at one large facility, while two small facilities are not visited at all, then single-family waste at the smaller facilities should be assumed to have the same composition as that discovered at the larger facility. Usually, this issue is considered later during the analysis phase of the study.

17
PPPPROCEDURE FOR SELECTIROCEDURE FOR SELECTIROCEDURE FOR SELECTIROCEDURE FOR SELECTING LOADS TO SAMPLE ANG LOADS TO SAMPLE ANG LOADS TO SAMPLE ANG LOADS TO SAMPLE AT DISPOSAT DISPOSAT DISPOSAT DISPOSAL L L L FACILITIESFACILITIESFACILITIESFACILITIES
When obtaining waste samples at disposal facilities, the most practical approach is usually to select certain vehicles through a systematic selection process and then to characterize the loads, or portions of the loads, that are delivered by the selected vehicles. The recommended procedure for selecting loads to sample is described below. The process should be repeated for each targeted waste sector that is to be sampled at the facility. � First, during construction of the sampling plan, the study designer should determine
how many loads representing the targeted waste sector arrive at the facility on the chosen sampling day. Let the variable A represent that number of loads.
� Second, the study designer should allow some margin for uncertainty in the number
of loads that will arrive on the sampling day. It can be extremely disruptive to a waste characterization operation if the sorting crew is left at the end of the day without having enough samples to sort. In order to create a safety margin, the designer should reduce by approximately 20% the number of loads that the study depends on to arrive – i.e. reduce the number of loads expected for planning purposes to approximately 0.8 x A.
� Third, the designer should determine how many waste samples are to be obtained
and characterized for the particular waste sector on the scheduled day. Designate the targeted number of samples with the variable b.
As a guideline for determining the number of samples to capture in a day, an untrained sorting crew can sort approximately 8 to 10 samples by hand in one day, when the samples weigh approximately 200 pounds and are composed of very mixed materials (as is most consumer waste). A highly trained sorting crew can sort as many as 15 consumer waste samples in one day. If visual characterization methods are used, a single person can characterize approximately 25 to 30 loads in one day.
� Fourth, the requisite number of samples, b, will be chosen
systematically from the 0.8 x A loads available for sampling. The number of loads available for sampling will be divided by b to determine the interval, c, at which loads will be chosen for sampling.
� Fifth, a random starting point should be chosen, and
sampling should then proceed throughout the day. Based on a randomly chosen integer, d, between 1 and c, the sampling crew should obtain the first sample of the day from the dth load of the targeted waste sector that arrives on the sampling day. Every cth load thereafter should be sampled, until the quota of samples is met for the day.
It is often helpful to place a staff member at the entrance to the facility to count loads as they arrive and to interview drivers to determine the waste sector arriving in each load.
A is the expected number of loads for the day
b is the targeted
number of samples c is the interval at
which loads will be selected for sampling
d is the number
corresponding to the first load that is sampled
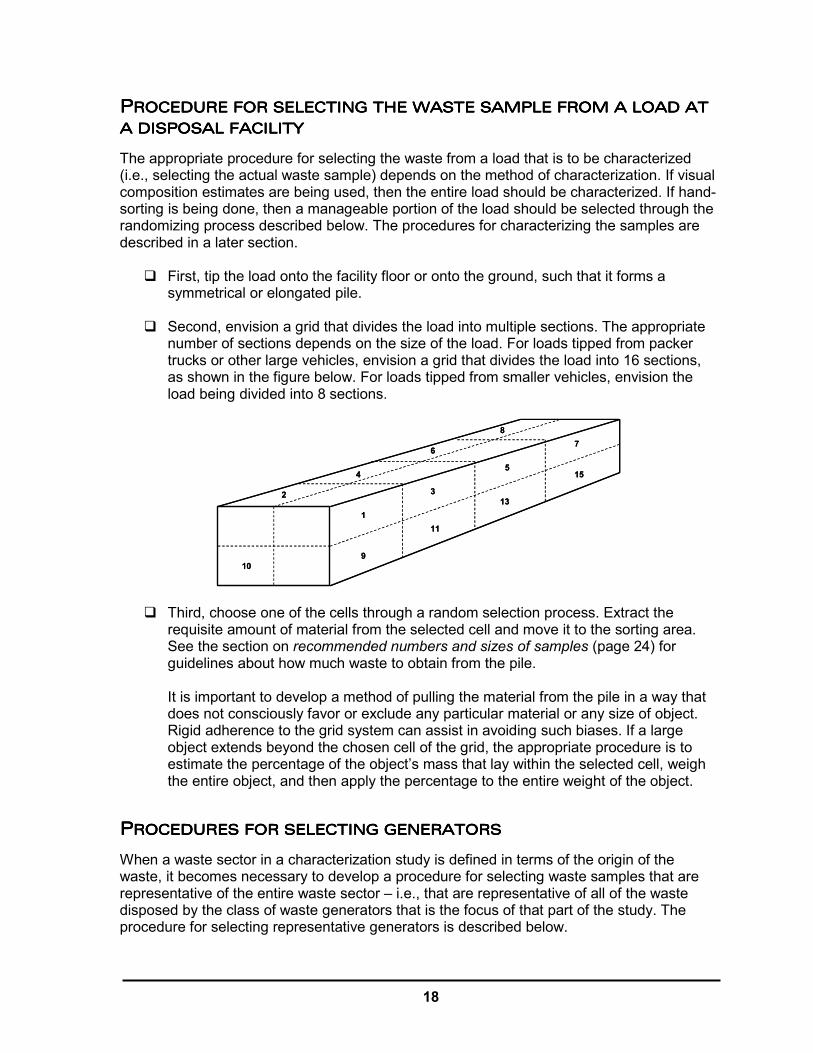
18
PPPPROCEDURE FOR SELECTIROCEDURE FOR SELECTIROCEDURE FOR SELECTIROCEDURE FOR SELECTING THE WASTE SAMPLE NG THE WASTE SAMPLE NG THE WASTE SAMPLE NG THE WASTE SAMPLE FROM A LOAD AT FROM A LOAD AT FROM A LOAD AT FROM A LOAD AT A DA DA DA DISPOSAL FACILITYISPOSAL FACILITYISPOSAL FACILITYISPOSAL FACILITY
The appropriate procedure for selecting the waste from a load that is to be characterized (i.e., selecting the actual waste sample) depends on the method of characterization. If visual composition estimates are being used, then the entire load should be characterized. If hand-sorting is being done, then a manageable portion of the load should be selected through the randomizing process described below. The procedures for characterizing the samples are described in a later section. � First, tip the load onto the facility floor or onto the ground, such that it forms a
symmetrical or elongated pile. � Second, envision a grid that divides the load into multiple sections. The appropriate
number of sections depends on the size of the load. For loads tipped from packer trucks or other large vehicles, envision a grid that divides the load into 16 sections, as shown in the figure below. For loads tipped from smaller vehicles, envision the load being divided into 8 sections.
10
1
9
2 3
11
5
13
7
154
6
8
10
1
9
2 3
11
5
13
7
154
6
8
� Third, choose one of the cells through a random selection process. Extract the
requisite amount of material from the selected cell and move it to the sorting area. See the section on recommended numbers and sizes of samples (page 24) for guidelines about how much waste to obtain from the pile.
It is important to develop a method of pulling the material from the pile in a way that does not consciously favor or exclude any particular material or any size of object. Rigid adherence to the grid system can assist in avoiding such biases. If a large object extends beyond the chosen cell of the grid, the appropriate procedure is to estimate the percentage of the object’s mass that lay within the selected cell, weigh the entire object, and then apply the percentage to the entire weight of the object.
PPPPROCEDURES FOR SELECTROCEDURES FOR SELECTROCEDURES FOR SELECTROCEDURES FOR SELECTING GENERATORSING GENERATORSING GENERATORSING GENERATORS
When a waste sector in a characterization study is defined in terms of the origin of the waste, it becomes necessary to develop a procedure for selecting waste samples that are representative of the entire waste sector – i.e., that are representative of all of the waste disposed by the class of waste generators that is the focus of that part of the study. The procedure for selecting representative generators is described below.

19
� First, define the class of waste generator and decide whether size groupings also should be created. Cases where it is appropriate to establish multiple size groupings are when a handful of members of the class produce the overwhelming majority of the waste and when the composition of the waste is expected to correlate somehow with the size of the waste generator.
It generally is not advisable to create more than three size categories for a class of waste generator. The unit for measuring the size of a waste generator would ideally be the number of tons of waste that each generator produces annually, but other proxy units such as number of employees, number of students, or number of acres are often used instead.
� Second, devise a method of random selection for choosing representative
businesses, agencies, buildings, homes, etc., that belong to the class of generator. Usually this is done by establishing a comprehensive list of all the members of the class. The list may be compiled by someone with local knowledge of the generator class, or it may be taken from an existing source such as the phone book, or from various companies that are in the business of producing lists for marketing purposes. Two national companies that produce such lists are ABI and Dun and Bradstreet. Select members at random from the list and contact them to ensure they meet the criteria for being included in the desired class and/or size group of generators.
PPPPROCEDURES FOR ROCEDURES FOR ROCEDURES FOR ROCEDURES FOR IDENTIFYING THE SAMPIDENTIFYING THE SAMPIDENTIFYING THE SAMPIDENTIFYING THE SAMPLE LE LE LE AT A GENERATOR LOCATAT A GENERATOR LOCATAT A GENERATOR LOCATAT A GENERATOR LOCATIONIONIONION
The first step in characterizing the waste from a selected generator is to identify and distinguish the waste streams produced by the generator. When doing this, it is important to be mindful of the sectors of waste that are being considered in the larger waste characterization study. For example, if a selected generator produces some waste that is sent to landfill and some that is recycled, but the study intends to focus only on landfilled waste, then data collected from the generator should describe only the landfilled waste. However, even when the destination sectors of waste are properly distinguished, it is still possible for the generator to have multiple waste streams within each waste destination sector. As an example, consider the scenario presented in the adjacent sidebar.
Example of multiple waste streams within a waste category produced at a selected generator site As part of a generator-based waste characterization study of orchards, a particular orchard is selected for study of the waste it sends to landfill. In discussions with the orchard owner, the researcher learns that waste is collected in two separate processes before it is picked up by the local waste hauler. In one process, scraps and miscellaneous trash from harvesting activities are placed in a dumpster which is emptied every week by the waste hauler. In the other process, scraps and wood pallets that accumulate from an on-site packing house are placed in a different dumpster, which also is collected every week. Since the composition of the waste in the two dumpsters is known ahead of time to be different, the waste in each dumpster should be considered to represent a distinct waste stream for the purpose of obtaining a sample for characterization. Each waste stream should also be quantified separately so that data from each can be combined appropriately during the analysis phase of the study.

20
After all of the waste streams have been identified for a given waste destination sector at a generator, each waste stream should be characterized separately. In cases where a waste stream consists of a pure material (such as pure dirt or pure food scraps), it usually is not necessary to characterize the waste stream by sorting an actual sample. Rather, it is sufficient to quantify the waste stream and note that it is composed entirely of one material. In cases where the waste stream is not homogeneous, then hand-sorted or visual characterization methods should be applied to a sample of the waste. If a sample is to be hand-sorted, then a method should be devised for selecting a sample at random from the available waste. If the waste is contained in a dumpster, then a vertical cross-section of waste weighing approximately 150 pounds should be extracted from the dumpster and placed in a container for transport to a location where it can be sorted. If there are multiple dumpsters, then one should be chosen at random to provide the sample. (However, multiple dumpsters may be an indication that there are actually multiple waste streams at the location. This possibility should be investigated before a waste sample is taken.)
CCCCOLLECTING DATA TO QUOLLECTING DATA TO QUOLLECTING DATA TO QUOLLECTING DATA TO QUANTIFY WASTEANTIFY WASTEANTIFY WASTEANTIFY WASTE
This section describes procedures for quantifying solid waste in different settings and different study approaches. In any waste characterization study that involves more than one waste sector (please refer to the figure on page 12), it is important to quantify each waste sector so their relative proportions can be known. Quantifying the waste also serves to make the data from composition estimates more useful. For example, when planning a material recovery operation, it may be more helpful to know that 200 pounds of aluminum can be recovered from the 20,000 pounds of solid waste that arrives at a facility each day than to know merely that the waste is composed 1% of aluminum.
QQQQUANTIFYING WASTE AT UANTIFYING WASTE AT UANTIFYING WASTE AT UANTIFYING WASTE AT DISPOSAL FACILITIESDISPOSAL FACILITIESDISPOSAL FACILITIESDISPOSAL FACILITIES
Waste that is taken to a disposal facility may be quantified using either of two methods – by examining records of arriving loads that are kept by the facility or by conducting a survey of vehicles to count and classify waste as it arrives. In either case, it is important to verify that waste is being counted and classified in the same way by the study designer and the facility recordkeeper or vehicle surveyor. Ideally, solid waste facilities and study designers will count and classify solid waste in a systematic way that is compatible with the definitions of waste sectors presented earlier in this document. The standard way of quantifying waste at disposal facilities is to express the amount of waste disposed, in terms of tons, for each waste sector over a year-long period. Therefore, the common unit in this type of waste quantification is tons per year. UUUUSING EXISTING RECORDSING EXISTING RECORDSING EXISTING RECORDSING EXISTING RECORDSSSS
It is sometimes possible to rely on existing records to quantify and classify the waste that arrives at a disposal facility. However, at present it is unusual for a facility to classify waste
21
in a way that is entirely consistent with the guidelines presented in this document. If records are used as the basis for quantity estimates, then there are two important considerations.
• The amount of solid waste taken to a facility may fluctuate by season or in response to changes in the local solid waste system (such as the opening or closing of other solid waste facilities). Therefore, it is better to use a fairly long time-period – ideally a year – as the basis for counting the amount of waste that enters the facility. Data from a shorter period of time, such as a monthly tabulation, can be used to extrapolate annual disposal, but it presents the risk of overlooking fluctuations that occurred outside the given month.
• Some facilities do not weigh every waste load that arrives, but instead assign weight estimates to certain types of loads. For example, loads transported to disposal facilities in small vehicles may be quantified using an “alternative minimum weight,” which is an assumed net weight for all such loads. Other types of loads may have their net weight estimated, based on volume-to-weight conversion factors for materials such as dirt or concrete, or for mixed materials such as construction and demolition debris.
Assembling quantity estimates from records is often like putting a puzzle together. The total amount of solid waste entering the facility is usually known. Specific information may exist for some waste sectors but not for others. Therefore, it is often necessary to deduce the quantity of one waste sector based on information about other waste sectors. It usually is not possible to quantify every waste sector precisely, so estimates of their relative proportions are often used instead. UUUUSING VEHICLE SURVEYSSING VEHICLE SURVEYSSING VEHICLE SURVEYSSING VEHICLE SURVEYS TO QUANTIFY WASTE TO QUANTIFY WASTE TO QUANTIFY WASTE TO QUANTIFY WASTE
When it is not possible to quantify the relevant waste sectors through use of existing records, the alternative is to construct a survey that counts and classifies waste as it arrives at the facility. The procedure for designing a vehicle survey is outlined below. � First, establish and define the waste sectors that will be tracked in the survey. It is
recommended that the survey classify waste in a way that is compatible with the sectors shown in the diagram on page 12, but it usually is not necessary to classify waste at the finest level of detail suggested by the diagram.
� Second, determine the time period of the survey. The survey should collect data
during one or more time periods, such that the data is representative of all of the waste arriving at the facility. The simplest way to accomplish this is to conduct the survey during an entire week of facility operations during what is believed to be a representative time of year, or perhaps during week-long periods in multiple seasons. If this would be too costly, then it is often possible to “piece together” portions of the facility’s weekly disposal cycle. For example, the survey could be conducted on one weekday and one Saturday. Results from the weekday would be multiplied by 5 to determine the quantities of waste arriving on all weekdays of a weekly cycle. Results from the Saturday would then be added to complete the week-long picture.
� Third, if the facility has more than one entrance, devise a system for collecting data
from each entrance such that it provides a representative picture of all of the waste that enters the facility. If different entrances handle different amounts or different
22
waste sectors, then the results from each entrance should be “projected up” to a week-long period separately. Later, the estimates for each entrance may be added together to produce a week-long picture for the entire facility.
� Fourth, devise a method of quantifying each arriving waste load. If the facility has
scales, arrange for all vehicles to be weighed before and after their loads have been tipped, and for weight and sector information to be recorded by the vehicle surveyor. If the facility does not have scales, devise a method for estimating load weights based on their measured volume (i.e., measuring their three dimensions with a tape measure) and on accepted volume-to-weight conversion factors. A set of volume-to-weight conversion factors appears in Appendix B of this document.
� Fifth, devise a form to use when conducting the vehicle survey. An example of a
vehicle survey form appears in Appendix E. The basic information that should be collected on the survey form includes the waste sector to which each load belongs and the net weight of the load (or its dimensional measurements, if necessary). In cases where mixed loads arrive (e.g. loads containing a mixture of commercial waste and multifamily residential waste), it is acceptable to ask the driver of each vehicle to estimate the portion of the load that corresponds to each sector, to the nearest 10%.
� Sixth, implement the survey.
QQQQUANTIFYING WASTE AT UANTIFYING WASTE AT UANTIFYING WASTE AT UANTIFYING WASTE AT THE LOCATION WHERE ITHE LOCATION WHERE ITHE LOCATION WHERE ITHE LOCATION WHERE IT IS GENERATEDT IS GENERATEDT IS GENERATEDT IS GENERATED
When quantifying waste at the point of generation, it is sometimes possible to rely on the generator’s own records, such as invoices from commercial waste haulers or receipts from disposal facilities. When that is not possible, the best approach is to measure the amount of waste that accumulates during a known time period and extrapolate a year’s disposal from the measured amount. In either case, it is important to ensure that each distinct waste stream at the generator is quantified and characterized separately. The procedure for quantifying one waste stream at a generator location is outlined below. � First, locate all of the places where waste from the particular waste stream
accumulates. The locations may include trash cans, dumpsters, waste compactors, piles, etc.
� Second, define an accumulation time that will correspond to the amount of waste you
will measure. For waste that is collected by a commercial hauler or is self-hauled to a disposal facility, the accumulation time is the time between when waste container was last emptied and when the accumulated waste is measured or weighed. Some points to consider when defining the accumulation time are presented below.
• In most cases, accumulation time can be measured in terms of days or fractions of days.
• If the generator is a facility that operates with irregular shifts, then it may be more accurate to measure accumulation time in terms of the number of hours that the facility has operated since the last waste pick-up. This approach also is appropriate when waste is collected more frequently than twice per week.
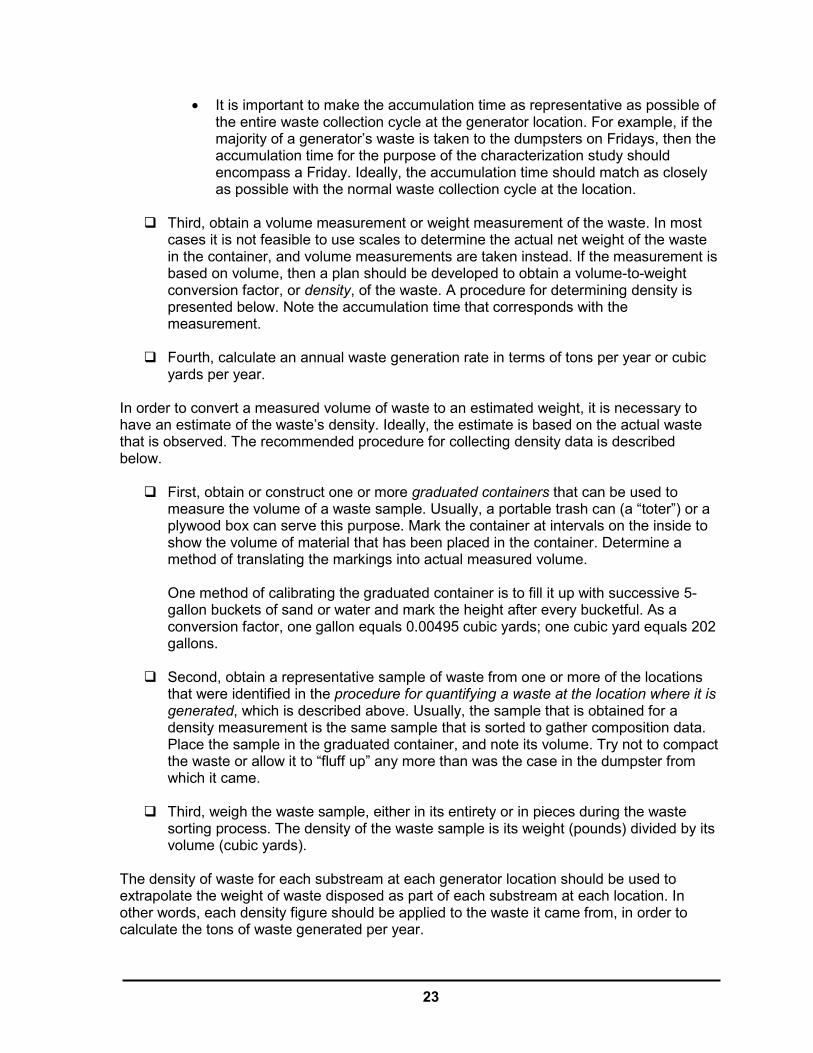
23
• It is important to make the accumulation time as representative as possible of the entire waste collection cycle at the generator location. For example, if the majority of a generator’s waste is taken to the dumpsters on Fridays, then the accumulation time for the purpose of the characterization study should encompass a Friday. Ideally, the accumulation time should match as closely as possible with the normal waste collection cycle at the location.
� Third, obtain a volume measurement or weight measurement of the waste. In most
cases it is not feasible to use scales to determine the actual net weight of the waste in the container, and volume measurements are taken instead. If the measurement is based on volume, then a plan should be developed to obtain a volume-to-weight conversion factor, or density, of the waste. A procedure for determining density is presented below. Note the accumulation time that corresponds with the measurement.
� Fourth, calculate an annual waste generation rate in terms of tons per year or cubic
yards per year. In order to convert a measured volume of waste to an estimated weight, it is necessary to have an estimate of the waste’s density. Ideally, the estimate is based on the actual waste that is observed. The recommended procedure for collecting density data is described below. � First, obtain or construct one or more graduated containers that can be used to
measure the volume of a waste sample. Usually, a portable trash can (a “toter”) or a plywood box can serve this purpose. Mark the container at intervals on the inside to show the volume of material that has been placed in the container. Determine a method of translating the markings into actual measured volume.
One method of calibrating the graduated container is to fill it up with successive 5-gallon buckets of sand or water and mark the height after every bucketful. As a conversion factor, one gallon equals 0.00495 cubic yards; one cubic yard equals 202 gallons.
� Second, obtain a representative sample of waste from one or more of the locations
that were identified in the procedure for quantifying a waste at the location where it is generated, which is described above. Usually, the sample that is obtained for a density measurement is the same sample that is sorted to gather composition data. Place the sample in the graduated container, and note its volume. Try not to compact the waste or allow it to “fluff up” any more than was the case in the dumpster from which it came.
� Third, weigh the waste sample, either in its entirety or in pieces during the waste
sorting process. The density of the waste sample is its weight (pounds) divided by its volume (cubic yards).
The density of waste for each substream at each generator location should be used to extrapolate the weight of waste disposed as part of each substream at each location. In other words, each density figure should be applied to the waste it came from, in order to calculate the tons of waste generated per year.
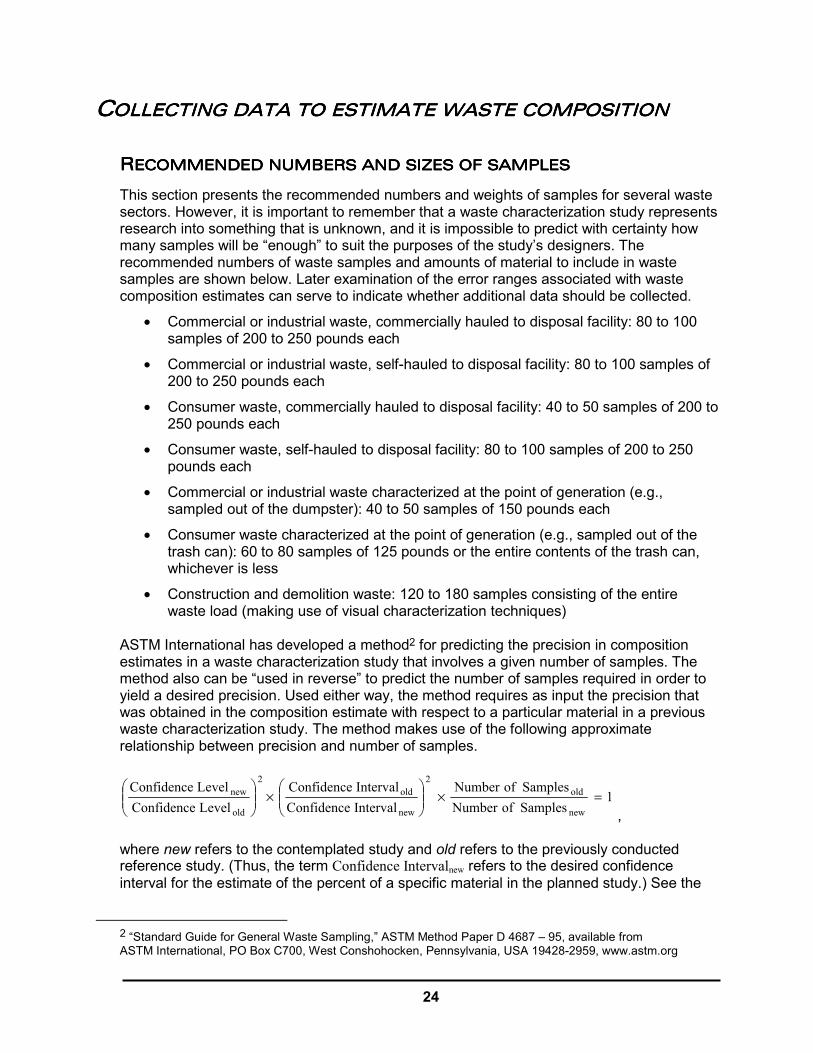
24
CCCCOLLECTING DATA TO ESOLLECTING DATA TO ESOLLECTING DATA TO ESOLLECTING DATA TO ESTIMATE WASTE COMPOSITIMATE WASTE COMPOSITIMATE WASTE COMPOSITIMATE WASTE COMPOSITIONTIONTIONTION
RRRRECOMMENDED NUMBERS AECOMMENDED NUMBERS AECOMMENDED NUMBERS AECOMMENDED NUMBERS AND SIZES OF SAMPLESND SIZES OF SAMPLESND SIZES OF SAMPLESND SIZES OF SAMPLES
This section presents the recommended numbers and weights of samples for several waste sectors. However, it is important to remember that a waste characterization study represents research into something that is unknown, and it is impossible to predict with certainty how many samples will be “enough” to suit the purposes of the study’s designers. The recommended numbers of waste samples and amounts of material to include in waste samples are shown below. Later examination of the error ranges associated with waste composition estimates can serve to indicate whether additional data should be collected.
• Commercial or industrial waste, commercially hauled to disposal facility: 80 to 100 samples of 200 to 250 pounds each
• Commercial or industrial waste, self-hauled to disposal facility: 80 to 100 samples of 200 to 250 pounds each
• Consumer waste, commercially hauled to disposal facility: 40 to 50 samples of 200 to 250 pounds each
• Consumer waste, self-hauled to disposal facility: 80 to 100 samples of 200 to 250 pounds each
• Commercial or industrial waste characterized at the point of generation (e.g., sampled out of the dumpster): 40 to 50 samples of 150 pounds each
• Consumer waste characterized at the point of generation (e.g., sampled out of the trash can): 60 to 80 samples of 125 pounds or the entire contents of the trash can, whichever is less
• Construction and demolition waste: 120 to 180 samples consisting of the entire waste load (making use of visual characterization techniques)
ASTM International has developed a method2 for predicting the precision in composition estimates in a waste characterization study that involves a given number of samples. The method also can be “used in reverse” to predict the number of samples required in order to yield a desired precision. Used either way, the method requires as input the precision that was obtained in the composition estimate with respect to a particular material in a previous waste characterization study. The method makes use of the following approximate relationship between precision and number of samples.
1 Samples ofNumber Samples ofNumber
Interval ConfidenceInterval Confidence
Level ConfidenceLevel Confidence
new
old 2
new
old 2
old
new =×
×
, where new refers to the contemplated study and old refers to the previously conducted reference study. (Thus, the term Confidence Intervalnew refers to the desired confidence interval for the estimate of the percent of a specific material in the planned study.) See the
2 “Standard Guide for General Waste Sampling,” ASTM Method Paper D 4687 – 95, available from ASTM International, PO Box C700, West Conshohocken, Pennsylvania, USA 19428-2959, www.astm.org
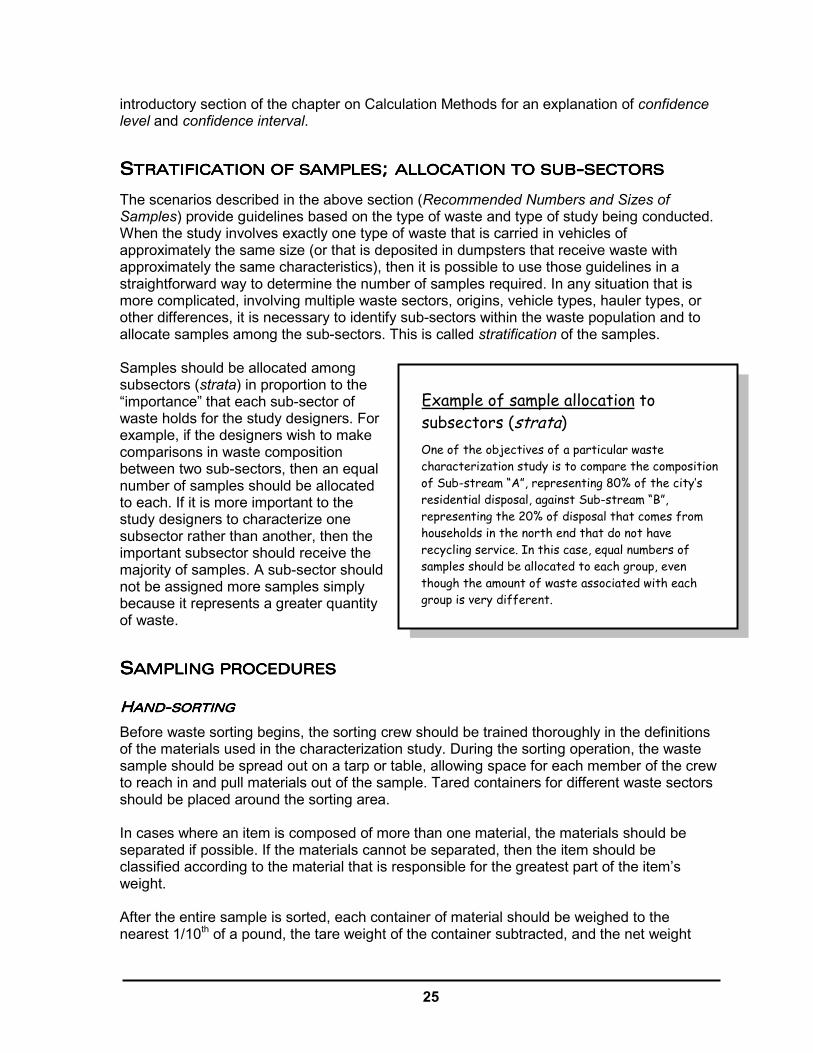
25
introductory section of the chapter on Calculation Methods for an explanation of confidence level and confidence interval.
SSSSTRATIFICATION OF SAMTRATIFICATION OF SAMTRATIFICATION OF SAMTRATIFICATION OF SAMPLESPLESPLESPLES; ; ; ; ALLOCATION TO SUBALLOCATION TO SUBALLOCATION TO SUBALLOCATION TO SUB----SECTORSSECTORSSECTORSSECTORS
The scenarios described in the above section (Recommended Numbers and Sizes of Samples) provide guidelines based on the type of waste and type of study being conducted. When the study involves exactly one type of waste that is carried in vehicles of approximately the same size (or that is deposited in dumpsters that receive waste with approximately the same characteristics), then it is possible to use those guidelines in a straightforward way to determine the number of samples required. In any situation that is more complicated, involving multiple waste sectors, origins, vehicle types, hauler types, or other differences, it is necessary to identify sub-sectors within the waste population and to allocate samples among the sub-sectors. This is called stratification of the samples. Samples should be allocated among subsectors (strata) in proportion to the “importance” that each sub-sector of waste holds for the study designers. For example, if the designers wish to make comparisons in waste composition between two sub-sectors, then an equal number of samples should be allocated to each. If it is more important to the study designers to characterize one subsector rather than another, then the important subsector should receive the majority of samples. A sub-sector should not be assigned more samples simply because it represents a greater quantity of waste.
SSSSAMPLING PROCEDURESAMPLING PROCEDURESAMPLING PROCEDURESAMPLING PROCEDURES
HHHHANDANDANDAND----SORTINGSORTINGSORTINGSORTING
Before waste sorting begins, the sorting crew should be trained thoroughly in the definitions of the materials used in the characterization study. During the sorting operation, the waste sample should be spread out on a tarp or table, allowing space for each member of the crew to reach in and pull materials out of the sample. Tared containers for different waste sectors should be placed around the sorting area. In cases where an item is composed of more than one material, the materials should be separated if possible. If the materials cannot be separated, then the item should be classified according to the material that is responsible for the greatest part of the item’s weight. After the entire sample is sorted, each container of material should be weighed to the nearest 1/10th of a pound, the tare weight of the container subtracted, and the net weight
Example of sample allocation to subsectors (strata) One of the objectives of a particular waste characterization study is to compare the composition of Sub-stream “A”, representing 80% of the city’s residential disposal, against Sub-stream “B”, representing the 20% of disposal that comes from households in the north end that do not have recycling service. In this case, equal numbers of samples should be allocated to each group, even though the amount of waste associated with each group is very different.
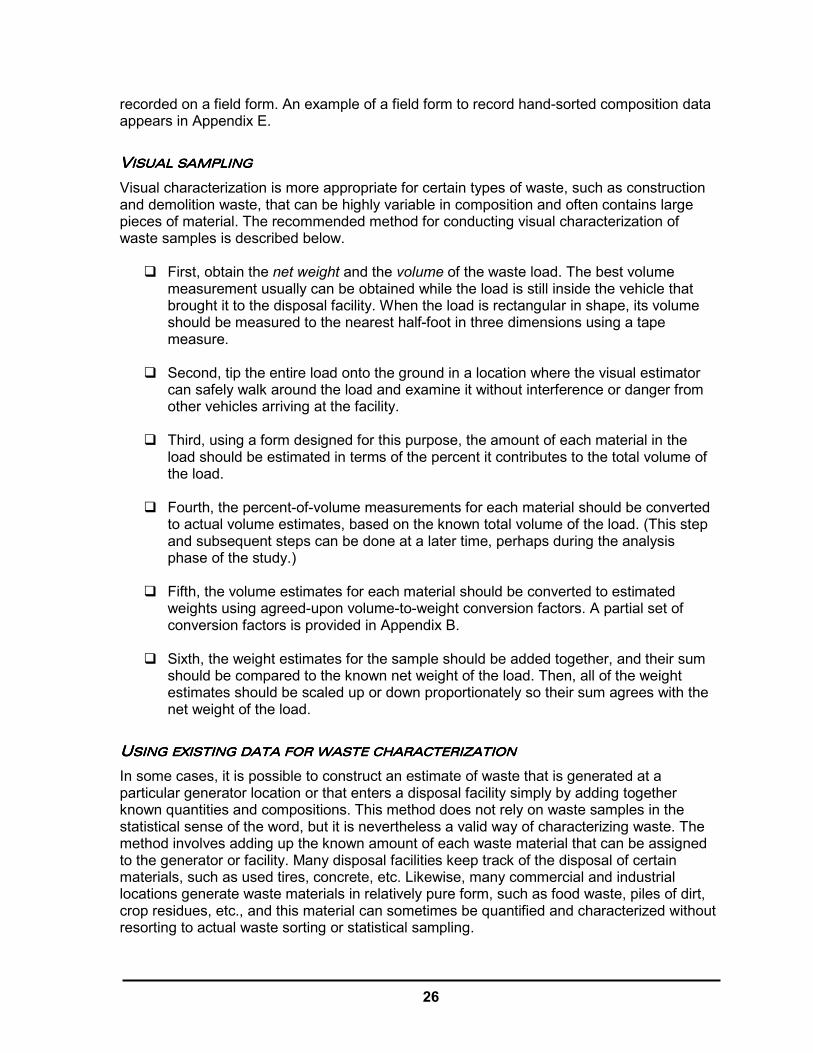
26
recorded on a field form. An example of a field form to record hand-sorted composition data appears in Appendix E. VVVVISUAL SAMPLINGISUAL SAMPLINGISUAL SAMPLINGISUAL SAMPLING
Visual characterization is more appropriate for certain types of waste, such as construction and demolition waste, that can be highly variable in composition and often contains large pieces of material. The recommended method for conducting visual characterization of waste samples is described below. � First, obtain the net weight and the volume of the waste load. The best volume
measurement usually can be obtained while the load is still inside the vehicle that brought it to the disposal facility. When the load is rectangular in shape, its volume should be measured to the nearest half-foot in three dimensions using a tape measure.
� Second, tip the entire load onto the ground in a location where the visual estimator
can safely walk around the load and examine it without interference or danger from other vehicles arriving at the facility.
� Third, using a form designed for this purpose, the amount of each material in the
load should be estimated in terms of the percent it contributes to the total volume of the load.
� Fourth, the percent-of-volume measurements for each material should be converted
to actual volume estimates, based on the known total volume of the load. (This step and subsequent steps can be done at a later time, perhaps during the analysis phase of the study.)
� Fifth, the volume estimates for each material should be converted to estimated
weights using agreed-upon volume-to-weight conversion factors. A partial set of conversion factors is provided in Appendix B.
� Sixth, the weight estimates for the sample should be added together, and their sum
should be compared to the known net weight of the load. Then, all of the weight estimates should be scaled up or down proportionately so their sum agrees with the net weight of the load.
UUUUSINSINSINSING EXISTING DATA FOR G EXISTING DATA FOR G EXISTING DATA FOR G EXISTING DATA FOR WASTE CHARACTERIZATIWASTE CHARACTERIZATIWASTE CHARACTERIZATIWASTE CHARACTERIZATIONONONON
In some cases, it is possible to construct an estimate of waste that is generated at a particular generator location or that enters a disposal facility simply by adding together known quantities and compositions. This method does not rely on waste samples in the statistical sense of the word, but it is nevertheless a valid way of characterizing waste. The method involves adding up the known amount of each waste material that can be assigned to the generator or facility. Many disposal facilities keep track of the disposal of certain materials, such as used tires, concrete, etc. Likewise, many commercial and industrial locations generate waste materials in relatively pure form, such as food waste, piles of dirt, crop residues, etc., and this material can sometimes be quantified and characterized without resorting to actual waste sorting or statistical sampling.

27
EEEEQUIPMENT AND SAFETY QUIPMENT AND SAFETY QUIPMENT AND SAFETY QUIPMENT AND SAFETY MEASURESMEASURESMEASURESMEASURES
A recommended list of equipment for use in waste sampling, waste sorting, and vehicle surveying is presented in Appendix C. Measures that can protect the safety of the data collection crew are described in Appendix D, which presents the draft health and safety protocol for use in waste characterization studies, as developed by the State of California.
CALCULATION METHODS
IIIINTRODUCTIONNTRODUCTIONNTRODUCTIONNTRODUCTION
This section describes methods to calculate estimates of the composition and quantity of one or more segments of the waste stream, based on data that has been collected using the methods described earlier in this document. The estimates produced by waste characterization studies often are presented in the format shown below.
Material
EstimatedPercent
ConfidenceInterval
Estimated Tons
Food waste 23.5% 2.1% 36,800
Confidence interval calculated at the 90% confidence level The estimated percent for each material indicates the best estimate possible, given the available data, for the amount of a particular material in the waste stream being addressed. The confidence interval can be thought of as an “error range” surrounding the estimate. The figure for estimated tons simply reflects the application of the estimated percent for the material to the tons of all disposed material that is the focus of the study. The confidence level is chosen by the study designers during their analysis of the data, and it typically is set at 80% or 90%. Increasing the confidence level has the effect of making the confidence interval wider.

28
The proper way to interpret the example composition estimate shown above is as follows:
If a statistical sampling process is not used, then it is not appropriate to attempt to calculate a confidence interval surrounding a composition estimate. For example, if the composition of a segment of the waste stream is obtained essentially by counting everything that is disposed – rather than sampling just a few pieces of the waste stream and extrapolating – then the composition figure becomes a sum of measurements rather than a statistically-based estimate, and it does not have a confidence interval.
QQQQUANTITY CALCULATIONSUANTITY CALCULATIONSUANTITY CALCULATIONSUANTITY CALCULATIONS
It generally is best to quantify each segment of the waste stream before calculating composition estimates, because the quantities are often used as factors in the composition calculations. The recommended methods for quantifying segments of the waste stream are described below.
QQQQUANTIFYING A WASTE SUANTIFYING A WASTE SUANTIFYING A WASTE SUANTIFYING A WASTE SECTOR BASED ON VEHICECTOR BASED ON VEHICECTOR BASED ON VEHICECTOR BASED ON VEHICLE SURVEYSLE SURVEYSLE SURVEYSLE SURVEYS
If the annual tonnage of all waste disposed at the facility is known, then the analyst should use the vehicle survey to determine the portion of annual disposal corresponding to the waste sectors being studied. For a given waste sector, S, the sector tonnage can be calculated from the tonnage, q, found on individual vehicles.
∑∑
∑ ×= annual all,periodsurvey ,all
periodsurvey , ssector ton qqqS
If the annual tonnage of all waste disposed at the facility is not known, then the analyst should extrapolate sector tons directly from the corresponding tons that were counted during the vehicle survey.
In the segment of the waste stream we studied, our best estimate of the portion that is food waste is 23.5%. Based on our statistical method for calculating the precision of our estimate, we are 90% certain that the true amount of food waste in the part of the waste stream we sampled is between 21.4% and 25.6% (i.e., we are 90% certain it is within plus or minus 2.1% of our best estimate of 23.5%).
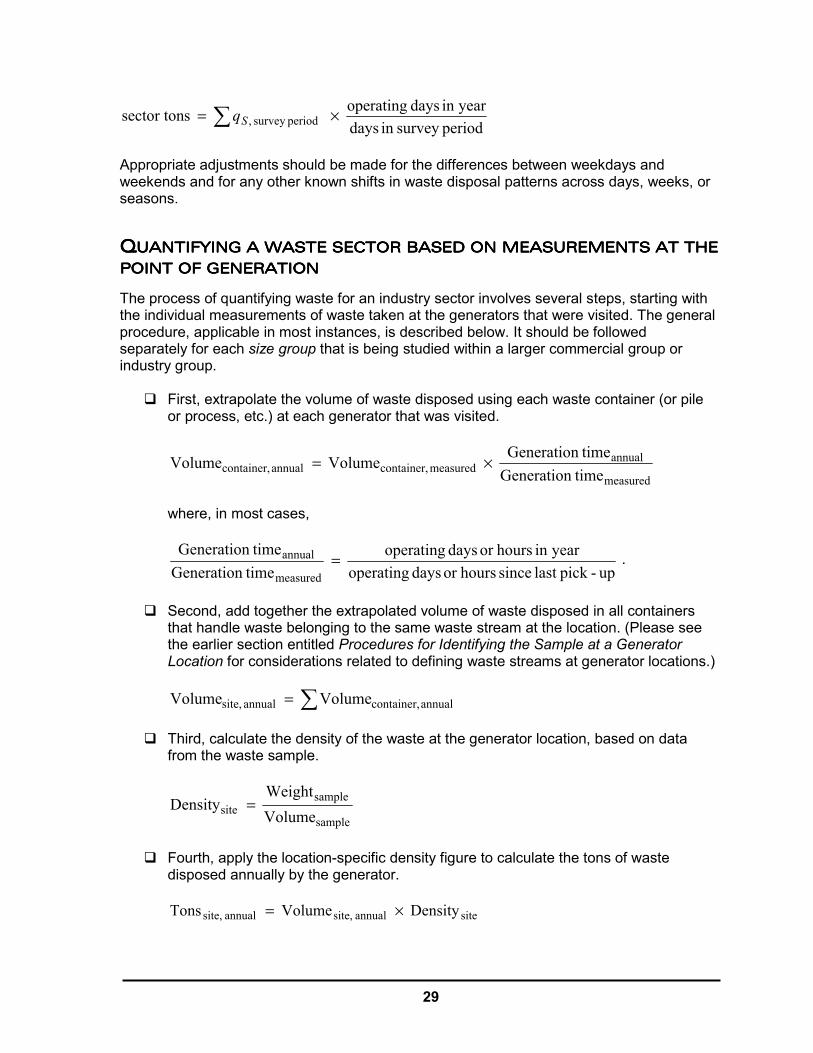
29
periodsurvey in daysyearin days operating ssector ton periodsurvey , ×= ∑ Sq
Appropriate adjustments should be made for the differences between weekdays and weekends and for any other known shifts in waste disposal patterns across days, weeks, or seasons.
QQQQUANTIFYING A WASTE SUANTIFYING A WASTE SUANTIFYING A WASTE SUANTIFYING A WASTE SECTOR BASED ON MEASUECTOR BASED ON MEASUECTOR BASED ON MEASUECTOR BASED ON MEASUREMENTS AT THE REMENTS AT THE REMENTS AT THE REMENTS AT THE POINT OF GENERATIONPOINT OF GENERATIONPOINT OF GENERATIONPOINT OF GENERATION
The process of quantifying waste for an industry sector involves several steps, starting with the individual measurements of waste taken at the generators that were visited. The general procedure, applicable in most instances, is described below. It should be followed separately for each size group that is being studied within a larger commercial group or industry group. � First, extrapolate the volume of waste disposed using each waste container (or pile
or process, etc.) at each generator that was visited.
measured
annualmeasured container,annual container, timeGeneration
timeGeneration Volume Volume ×=
where, in most cases,
up-picklast since hoursor days operatingyearin hoursor days operating
timeGeneration timeGeneration
measured
annual = .
� Second, add together the extrapolated volume of waste disposed in all containers
that handle waste belonging to the same waste stream at the location. (Please see the earlier section entitled Procedures for Identifying the Sample at a Generator Location for considerations related to defining waste streams at generator locations.)
∑= annual container,annual site, Volume Volume
� Third, calculate the density of the waste at the generator location, based on data
from the waste sample.
sample
samplesite Volume
Weight Density =
� Fourth, apply the location-specific density figure to calculate the tons of waste
disposed annually by the generator.
siteannual site,annual site, Density Volume Tons ×=

30
� Fifth, calculate a “scale-up factor” for waste generation by the industry and size group. For many commercial sectors, the appropriate scale-up factor is according to the number of employees. For most agricultural sectors, it is according to number of crop acres or number of animals. The example shown below involves calculating tons per employee, or TPE for a given size group in the industry. It draws upon data reflecting the disposed tons and employment only at the locations that were visited as part of the study.
∑
∑=
sites visitedgroup size annual, site,
sites visitedgroup size annual, site,
group size annual, Employees
Tons TPE
� Sixth, calculate the tons disposed from the entire size group in the industry being
studied. The example below draws upon data reflecting the total number of employees in the larger population (e.g. countywide, statewide, etc.) of industry members in the appropriate size group.
group sizein employment deIndustrywi TPE group size annual,group size annual, ×=q
� Seventh, add the results for the size groups to calculate total tons disposed by the
industry.
∑= group sizeindustry qq
CCCCOMPOSITION CALCULATIOMPOSITION CALCULATIOMPOSITION CALCULATIOMPOSITION CALCULATIONSONSONSONS
The composition of the waste corresponding to a sector of the waste stream is calculated using the method described below. The method should be applied separately to each waste sector being studied and to each size group or distinct waste stream within an industry group. (The next section of this chapter describes how results for individual sectors or size groups can be combined to describe the composition of larger segments of the waste stream.)
CCCCALCULATING THE MEAN ALCULATING THE MEAN ALCULATING THE MEAN ALCULATING THE MEAN ESTIMATEESTIMATEESTIMATEESTIMATE
For a given material, j, in all of the relevant samples, i, calculate the ratio, r, of the material weight, m, to the total sample weight, w.
∑
∑=
iji
iji
j w
mr
,
,
The calculation should be repeated for each material.

31
CCCCALCULATING THE ERRORALCULATING THE ERRORALCULATING THE ERRORALCULATING THE ERROR RANGE RANGE RANGE RANGE
For each mean estimate, jr , calculated as described above, the confidence interval (error range) surrounding the mean estimate is calculated as follows. First, calculate the variance,
jrV̂ , of the mean estimate.
( )
−
−×
×
=∑
1 1 1ˆ
2,
2 n
wrm
wnV i
ijji
rj
where n is the number of samples, and the mean sample weight, n
ww i
i∑= .
Next, calculate the confidence interval, which is
×±
jrVt ˆ , where t depends on the
number of samples, n, and the desired confidence level. The value of t can be estimated based on the table shown in Appendix F.
CCCCOMBINATION OF ESTIMAOMBINATION OF ESTIMAOMBINATION OF ESTIMAOMBINATION OF ESTIMATES TES TES TES ((((WEIGHTED COMBINATIONWEIGHTED COMBINATIONWEIGHTED COMBINATIONWEIGHTED COMBINATIONSSSS))))
Combining the composition estimates for two or more segments of the waste stream requires the use of a weighted averages method. The result for each segment of the waste stream is weighted according to the relative size of that segment in the larger waste stream that is being studied.
CCCCALCULATING THE WEIGHALCULATING THE WEIGHALCULATING THE WEIGHALCULATING THE WEIGHTING FACTORS WHEN COTING FACTORS WHEN COTING FACTORS WHEN COTING FACTORS WHEN COMBINING WASTE MBINING WASTE MBINING WASTE MBINING WASTE SECTORSSECTORSSECTORSSECTORS
A specific weighting factor should be calculated for each sector or segment of the waste stream being studied. The weighting factor, Gp , for each segment or size group, G, within the waste stream is calculated as follows.
annual sectors, all
annual ,
tt
p GG =
A weighting factor should be calculated for every waste sector, and thus the sum of all the values of Gp should equal one.

32
CCCCALCULATING THE MEANALCULATING THE MEANALCULATING THE MEANALCULATING THE MEAN ESTIMATE FOR COMBIN ESTIMATE FOR COMBIN ESTIMATE FOR COMBIN ESTIMATE FOR COMBINED SECTORSED SECTORSED SECTORSED SECTORS
The mean estimate for a given material, j, in a combination of segments (1, 2, 3...) of the waste stream is found as follows.
( ) ( ) ( ) ... 3,32,21,1combined , +×+×+×= jjjj rprprpr
CCCCALCULATING VARIANCE ALCULATING VARIANCE ALCULATING VARIANCE ALCULATING VARIANCE AND CONFIDENCE IAND CONFIDENCE IAND CONFIDENCE IAND CONFIDENCE INTERVALS FOR NTERVALS FOR NTERVALS FOR NTERVALS FOR COMBINED SECTORSCOMBINED SECTORSCOMBINED SECTORSCOMBINED SECTORS
When a mean estimate for combined waste sectors is calculated as shown above, the variance surrounding the estimate can be calculated as follows.
( ) ( ) ( ) ... ˆ ˆ ˆ 3232
221
21combined , +×+×+×=
jjj rrrj VpVpVpV
The confidence interval is then calculated as ( )combined , jVt ×± .
Variables used in the calculations: S tonnage associated with a sector during a
particular time period
q quantity of waste encountered in the study
TPE tons per employee
j designation of a particular material
i designation of a particular sample
r ratio of material weight to total sample weight, for an individual sample
m weight of a material in an individual sample
w total weight of an individual sample
V the variance associated with the estimate for a material’s percent in a group of samples
n number of samples in the group
p a weighting factor given to a segment of the waste stream, where the sum of all the values of p is 1
G designation of a size subgroup within a segment of the waste stream – usually used for generator samples
33
PRODUCTS OF WASTE CHARACTERIZATION
STUDIES
IIIINFORMATION AND ESTIMNFORMATION AND ESTIMNFORMATION AND ESTIMNFORMATION AND ESTIMATES TO BE REPORTEDATES TO BE REPORTEDATES TO BE REPORTEDATES TO BE REPORTED
The most important components of a waste characterization study are described below. (1) List and definitions of waste sectors addressed in the study, in a way that is consistent
with the diagram of waste sectors presented on page 12 of this document. (2) Count of waste samples that were characterized for each waste sector. (3) An annual tonnage estimate for each waste sector addressed in the study, if possible. (4) A description of how waste sectors were combined in order to analyze results for larger
segments of the waste stream. Along with this description, the relevant weighting factors associated with the waste sectors should be presented.
(5) Waste composition estimates for each important waste sector or combination of waste
sectors, broken out by individual material or combined groups of materials. (Please refer to the list and definitions of materials presented in Appendix A.) An example of the recommended reporting format is shown below.
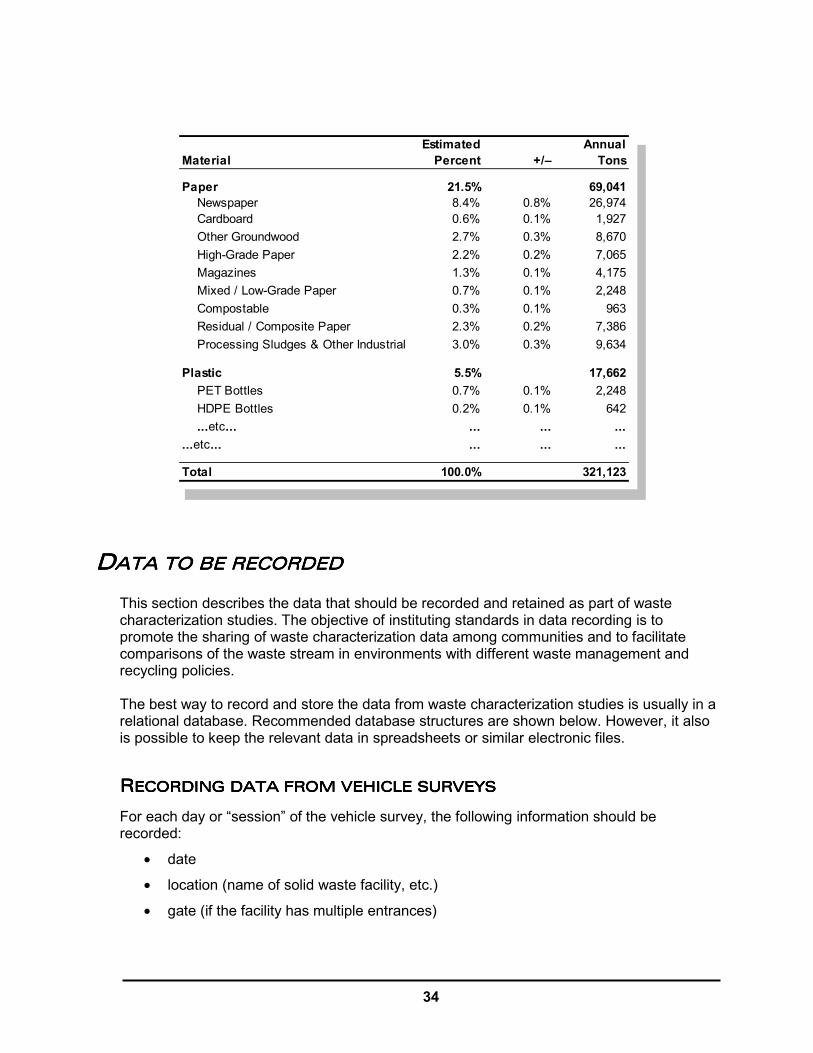
34
MaterialEstimated
Percent +/–Annual
Tons
Paper 21.5% 69,041Newspaper 8.4% 0.8% 26,974Cardboard 0.6% 0.1% 1,927Other Groundwood 2.7% 0.3% 8,670High-Grade Paper 2.2% 0.2% 7,065Magazines 1.3% 0.1% 4,175Mixed / Low-Grade Paper 0.7% 0.1% 2,248Compostable 0.3% 0.1% 963Residual / Composite Paper 2.3% 0.2% 7,386Processing Sludges & Other Industrial 3.0% 0.3% 9,634
Plastic 5.5% 17,662PET Bottles 0.7% 0.1% 2,248HDPE Bottles 0.2% 0.1% 642...etc... ... ... ...
...etc... ... ... ...
Total 100.0% 321,123
DDDDATA TO BE RECORDEDATA TO BE RECORDEDATA TO BE RECORDEDATA TO BE RECORDED
This section describes the data that should be recorded and retained as part of waste characterization studies. The objective of instituting standards in data recording is to promote the sharing of waste characterization data among communities and to facilitate comparisons of the waste stream in environments with different waste management and recycling policies. The best way to record and store the data from waste characterization studies is usually in a relational database. Recommended database structures are shown below. However, it also is possible to keep the relevant data in spreadsheets or similar electronic files.
RRRRECORDING DATA FROM VECORDING DATA FROM VECORDING DATA FROM VECORDING DATA FROM VEHICLE SURVEYSEHICLE SURVEYSEHICLE SURVEYSEHICLE SURVEYS
For each day or “session” of the vehicle survey, the following information should be recorded:
• date
• location (name of solid waste facility, etc.)
• gate (if the facility has multiple entrances)
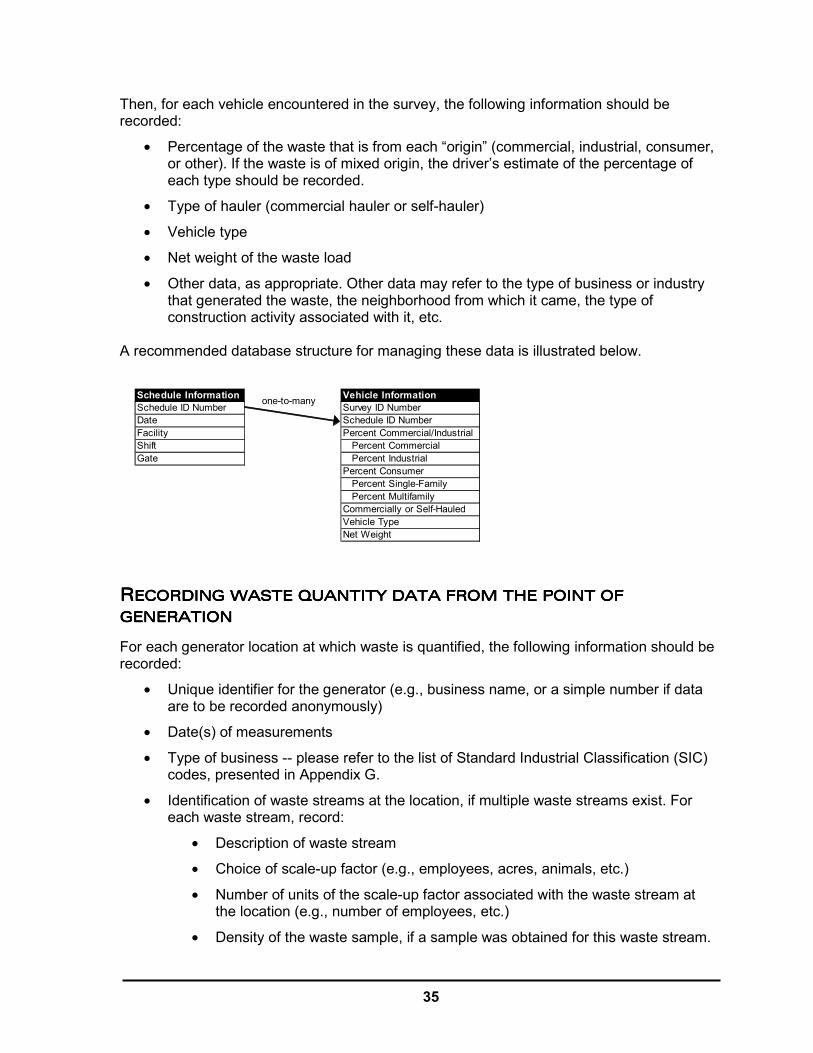
35
Then, for each vehicle encountered in the survey, the following information should be recorded:
• Percentage of the waste that is from each “origin” (commercial, industrial, consumer, or other). If the waste is of mixed origin, the driver’s estimate of the percentage of each type should be recorded.
• Type of hauler (commercial hauler or self-hauler)
• Vehicle type
• Net weight of the waste load
• Other data, as appropriate. Other data may refer to the type of business or industry that generated the waste, the neighborhood from which it came, the type of construction activity associated with it, etc.
A recommended database structure for managing these data is illustrated below.
Schedule Information Vehicle InformationSchedule ID Number Survey ID NumberDate Schedule ID NumberFacility Percent Commercial/IndustrialShift Percent CommercialGate Percent Industrial
Percent ConsumerPercent Single-FamilyPercent Multifamily
Commercially or Self-HauledVehicle TypeNet Weight
one-to-many
RRRRECORDING WASTE QUANTECORDING WASTE QUANTECORDING WASTE QUANTECORDING WASTE QUANTITY DATA FROM THE POITY DATA FROM THE POITY DATA FROM THE POITY DATA FROM THE POINT OF INT OF INT OF INT OF GENERATIONGENERATIONGENERATIONGENERATION
For each generator location at which waste is quantified, the following information should be recorded:
• Unique identifier for the generator (e.g., business name, or a simple number if data are to be recorded anonymously)
• Date(s) of measurements
• Type of business -- please refer to the list of Standard Industrial Classification (SIC) codes, presented in Appendix G.
• Identification of waste streams at the location, if multiple waste streams exist. For each waste stream, record:
• Description of waste stream
• Choice of scale-up factor (e.g., employees, acres, animals, etc.)
• Number of units of the scale-up factor associated with the waste stream at the location (e.g., number of employees, etc.)
• Density of the waste sample, if a sample was obtained for this waste stream.
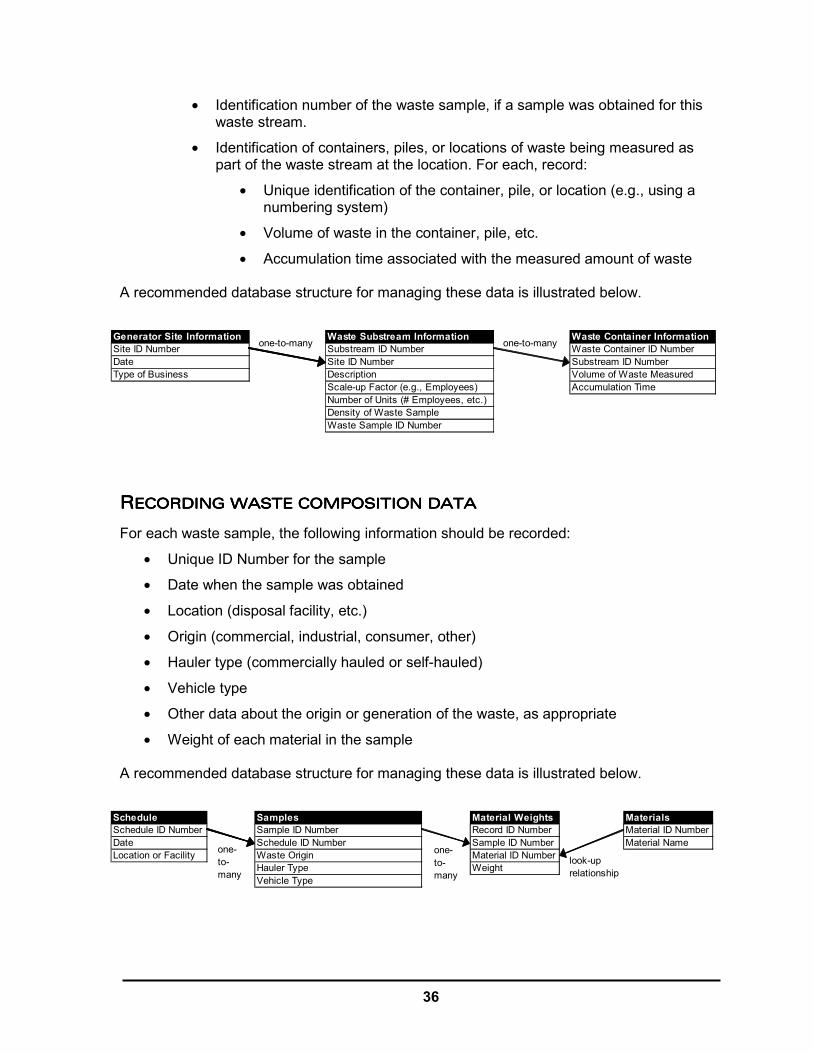
36
• Identification number of the waste sample, if a sample was obtained for this waste stream.
• Identification of containers, piles, or locations of waste being measured as part of the waste stream at the location. For each, record:
• Unique identification of the container, pile, or location (e.g., using a numbering system)
• Volume of waste in the container, pile, etc.
• Accumulation time associated with the measured amount of waste A recommended database structure for managing these data is illustrated below.
Generator Site Information Waste Substream Information Waste Container InformationSite ID Number Substream ID Number Waste Container ID NumberDate Site ID Number Substream ID NumberType of Business Description Volume of Waste Measured
Scale-up Factor (e.g., Employees) Accumulation TimeNumber of Units (# Employees, etc.)Density of Waste SampleWaste Sample ID Number
one-to-manyone-to-many
RRRRECORDING WASTE COMPOECORDING WASTE COMPOECORDING WASTE COMPOECORDING WASTE COMPOSITION DATASITION DATASITION DATASITION DATA
For each waste sample, the following information should be recorded:
• Unique ID Number for the sample
• Date when the sample was obtained
• Location (disposal facility, etc.)
• Origin (commercial, industrial, consumer, other)
• Hauler type (commercially hauled or self-hauled)
• Vehicle type
• Other data about the origin or generation of the waste, as appropriate
• Weight of each material in the sample A recommended database structure for managing these data is illustrated below.
Schedule Samples Material Weights MaterialsSchedule ID Number Sample ID Number Record ID Number Material ID NumberDate Schedule ID Number Sample ID Number Material NameLocation or Facility Waste Origin Material ID Number
Hauler Type WeightVehicle Type
one-to-many
look-uprelationship
one-to-many

37
GLOSSARY
class (of generators) – a grouping of waste generators that are believed to produce waste having similar characteristics, or a grouping of waste generators for which there is no research-motivated or policy-based reason to differentiate the waste generators further. For example, all grocery stores may be envisioned as belonging to the same class, because their waste can reasonably be expected to be very similar. As another example, there may be cases when drug stores are rightfully assigned to the same class as grocery stores, because they often occur together in a particular city, and their waste is always collected together. commercial waste – waste originating from businesses, government agencies, or institutions having SIC “major group” designations ranging from 41 to 97. composition – the average mixture of materials, usually expressed in terms of percents, found in a clearly defined segment of the waste stream. confidence interval – a range of values surrounding the best estimate of a composition percentage for a material in the waste stream. The confidence interval indicates the range in which the true percentage in the sampled population probably lies, with a probability defined by the confidence level. A confidence interval is often referred to as an “error range.” confidence level – an arbitrarily chosen level of certainty that affects the breadth of the confidence interval. A higher, more rigorous value for the confidence level implies a wider, less rigorous confidence interval, and vice versa. For waste composition estimates, the confidence level is usually defined to be 90% or 80%. construction and demolition waste – waste originating from businesses engaged in construction or demolition of structures as their primary business activity. consumer waste – waste originating from households. destination – the place where solid waste goes. In the framework encouraged by this methodology, the three possible destinations for solid waste are landfilling, beneficial use, or other disposal. error range – see confidence interval. generator – A waste generator is defined for the purpose of waste characterization studies as any commercial, governmental, institutional, or residential entity that generates waste. The purpose of defining and focusing on waste generators is to gather information that is obscured when waste from different sources (generators) is mixed together as it passes through the solid waste system.

38
industrial/agricultural waste – waste originating from businesses having SIC “major group” designations ranging from 01 through 39. load – all of the waste brought to a disposal facility on a single vehicle. origin – the type of entity that generated the waste in question. In the framework encouraged by this methodology, solid waste is either commercial, industrial/agricultural, or consumer in origin. material – a set of items and substances that are grouped together for the purpose of the waste characterization study. multifamily – a set of five or more households that share waste collection service in a common waste container (large trash can, dumpster, or compactor). For the purpose of waste characterization studies, some mobile home parks are classified as multifamily residences. random selection – selecting items, such as waste loads or waste generators, from the entire set of ones available, without any pattern to the selection. sample – a portion of waste belonging to a segment of the waste stream and believed to be representative of it, that is sorted or visually characterized to determine its composition. sampling plan – a plan for data collection that is designed to minimize bias and to ensure that waste composition and quantity data are as representative as possible of the waste stream being addressed in the study. scale-up factor – a factor that allows projection of waste quantities disposed at the local level (e.g., at the particular generator sites encountered in the study) to a larger level (e.g., to the statewide level). single-family –households that have individual waste collection, or small groups of two to four households that share waste collection. size category – a stratification within a class of waste generators, used in cases when the size of the generator is expected to correlate somehow with waste composition or waste generation rates (per-employee or per-acre). stratification – any subdivision of a segment of the waste stream for the purpose of selecting waste samples. Stratification is used in order to avoid counting things that are clearly different as being the same. systematic selection – selecting items, such as waste loads or waste generators, by placing them in a list or in some order, and choosing individuals from the list at consistent intervals. universe – the entire solid waste stream that is considered in a study vehicle survey – a series of questions administered to vehicle drivers entering a disposal facility, regarding the waste sector and other classification of their waste loads. A vehicle
39
survey is administered to determine the relative quantity of each segment of the waste stream. visual characterization – estimating the composition of a waste sample by estimating the volume of each material within the sample and applying volume-to-weight conversion factors to derive composition by weight. waste sectors – the segments into which the universe of solid waste is divided for the purposes of the study at hand. waste streams – types of waste generated by the same business having different quantity or composition characteristics and placed in separate containers or handled through distinct processes. weighted combination – combining composition estimates for smaller segments of the waste stream, to produce a composition estimate for a larger segment of the waste stream, while keeping track of the relative magnitude of each of the smaller segments.

A-1
APPENDIX A: RECOMMENDED MATERIAL
LIST AND DEFINITIONS
PAPERPAPERPAPERPAPER
Newspaper: printed groundwood newsprint, including glossy ads and Sunday edition magazines that are delivered with the newspaper (unless these are found separately during sorting). Cardboard: unwaxed Kraft paper corrugated containers and boxes, unless poly- or foil-laminated. Note that this material includes brown Kraft paper bags. Other Groundwood: other products made from groundwood paper, including phone books, paperback books, and egg cartons. High-Grade Paper: high-grade white or light-colored bond and copy machine papers and envelopes, and continuous-feed computer printouts and forms of all types, except multiple-copy carbonless paper. Magazines: magazines, catalogs, and similar products with glossy paper. Mixed / Low-Grade Paper: low-grade recyclable papers, including colored papers, notebook or other lined paper, envelopes with plastic windows, non-corrugated paperboard, carbonless copy paper, polycoated paperboard packaging, and junk mail. Compostable: Paper cups, pizza boxes and papers that can be composted such as paper towels, tissues, paper plates, and waxed cardboard. This material includes all paper that is contaminated or soiled with food or liquid in its normal use. Residual / Composite Paper: non-recyclable and non-compostable types of papers such as carbon paper and hardcover books, and composite materials such as paper packaging with metal or plastic parts. Processing Sludges, Other Industrial: paper-based materials from industrial sources that do not easily fit into the above materials, such as sludges.
PLASTICPLASTICPLASTICPLASTIC
PET Bottles: polyethylene terephthalate (PET) bottles, including soda, oil, liquor, and other types of bottles. No attempt will be made to remove base cups, caps, or wrappers, although these materials will be categorized separately if received separately. The SPI code for PET is 1. HDPE Bottles, Clear: high density polyethylene (HDPE) milk and other bottles that are not colored. The SPI code for HDPE is 2.

A-2
HDPE Bottles, Pigmented: high density polyethylene (HDPE) juice, detergent, and other bottles that are colored. The SPI code for HDPE is 2. Film and Bags: all plastic packaging films and bags. To be counted as this material, the material must be flexible (i.e., can be bent without making a noise). Bottles Types 3 - 7: all bottles that are not PET or HDPE, where the neck of the container is narrower than the body. Includes SPI codes 3 - 7. Expanded Polystyrene: packaging and finished products made of expanded polystyrene. The SPI code for polystyrene (PS) is 6. Other Rigid Plastic Packaging: all plastic packaging that is not a bottle and is not film or bag. Other Plastic Products: finished plastic products such as toys, toothbrushes, vinyl hose, and shower curtains. In cases where there is a large amount of a single type of product, the name of the product should be noted on the data collection form. Residual / Composite Plastic: other types of plastic that are not one of the above materials and items that are composites of plastic and other materials.
ORGANICSORGANICSORGANICSORGANICS
Yard, Garden and Prunings: grass clippings, leaves and weeds, and prunings six inches or less in diameter. Food Waste: food waste and scraps, including bones, rinds, etc., and including the food container when the container weight is not appreciable compared to the food inside. Manures: animal manures and human feces, including kitty litter and any materials contaminated with manures and feces. Disposable Diapers: disposable baby diapers and protective undergarments for adults (including feminine hygiene products). Carcasses, Offal: carcasses and pieces of small and large animal, unless the item is the result of food preparation in a household or commercial setting. For instance, fish or chicken entrails from food preparation and raw, plucked chickens will typically be classified as food, not as an animal carcass, unless the material is from an agricultural or industrial source. Crop Residues: vegetative materials that are left over from growing crops, and that are treated as a waste. Septage: the liquid or semi-liquid material removed from septic tanks. Residual / Composite Organics: other organics that do not easily fit into the above materials, must note identity of whatever material is placed in this material.

A-3
WOOD WASTESWOOD WASTESWOOD WASTESWOOD WASTES
Natural Wood: wood that is not been processed, including stumps of trees and shrubs, with the adhering soil (if any), and other natural woods, such as logs and branches in excess of six inches in diameter. Treated Wood: wood treated with preservatives such as creosote, CCA and ACQ. This includes dimensional lumber and posts if treated, but does not include painted or varnished wood. This material may also include some plywood (especially “marine plywood”), strandboard, and other wood. Painted Wood: wood that has been painted, varnished, or coated in similar ways. Dimensional Lumber: wood commonly used in construction for framing and related uses, including 2 x 4’s, 2 x 6’s and posts/headers (4x8’s, etc.). Engineered: building materials that have been manufactured and that generally include adhesive as one or more layers. Examples include plywood (sheets of wood built up of two or more veneer sheets glued or cemented together under pressure), particle board (wood chips pressed together to form large sheets or boards), fiberboard (like particle board but with fibers), “glu-lam” beams and boards (built up from dimensional or smaller lumber), and similar products. Packaging: partial or whole pallets, crates, and similar shipping containers. Other Untreated Wood: other types of wood products and materials that do not fit into the above materials, excluding composite materials (See Residual / Composite Wood, below). Wood Byproducts: sawdust and shavings, not otherwise identifiable. Residuals/ Composite Wood: items that consist primarily of wood but that do not fit into the above materials, including composite materials that consist primarily (over 50%) of wood. Examples of composites include wood with sheetrock nailed to it or with tiles glued to it (such that the materials cannot be easily separated).
COCOCOCONSTRUCTION, DEMOLITION AND LAND CLEARING (CDL) NSTRUCTION, DEMOLITION AND LAND CLEARING (CDL) NSTRUCTION, DEMOLITION AND LAND CLEARING (CDL) NSTRUCTION, DEMOLITION AND LAND CLEARING (CDL) WASTESWASTESWASTESWASTES
Insulation: Include all pad, roll, or blown-in types of insulation. Do not include expanded polystyrene. Asphalt: asphalt paving material. Concrete: cement (mixed or unmixed), concrete blocks, and similar wastes. Drywall: used or new gypsum wallboard, sheetrock or drywall present in recoverable amounts or pieces (generally any piece larger than two inches square will be recovered from the sample). Soil, Rocks and Sand: rock, gravel, soil, sand and similar naturally-occurring materials.
A-4
Roofing Waste: asphalt and fiberglass shingles, tar paper, and similar wastes from demolition or installation of roofs. Does not include wooden shingle or shakes. Ceramics: includes clay, porcelain bricks, and tiles, such as used toilets, sinks, and bricks of various types and sizes. Residual / Composite C&D: other construction and demolition materials that do not fit easily into the above materials or that are composites made up of two or more different materials.
GLASGLASGLASGLASSSSS
Clear Beverage Glass Green Beverage Glass Brown Beverage Glass: these are three separate materials for glass beverage bottles and jars that are clear, green, or brown in color. Note that blue glass will be included with brown glass. Other Glass Containers – Clear Other Glass Containers – Green Other Glass Containers - Brown: these are three separate materials for glass bottles and jars that are clear, green, or brown in color. Note that blue glass will be included with brown glass. Plate Glass: flat glass products such as windows, mirrors, and flat products. Residual / Composite Glass: other types of glass products and scrap that do not fit into the above materials, including light bulbs, glassware, and non-C&D fiberglass. Note that ceramics (plates and knickknacks) will not be included here but will be placed in “Non-Glass Ceramics” below. Non-glass Ceramics: Ceramics not composed of true glass and not typically used as building materials. Examples include Pyrex, dishes, etc.
METALMETALMETALMETAL
Aluminum Cans: aluminum beverage cans. Aluminum Foil / Containers: aluminum foil, food trays, and similar items. Other Aluminum: aluminum scrap and products that do not fit into the above two materials. Copper: copper scrap and products, excluding composites such as electrical wire. Other Non-Ferrous Metals: metallic products and pieces that are not aluminum or copper and not derived from iron (see “other ferrous”) and which are not significantly contaminated with other metals or materials (see “Residual / Composite Metal”).
A-5
Tin Cans: tin-coated steel food containers. This material includes bi-metal beverage cans, but not paint cans or other types of cans. White Goods: large household appliances or parts thereof. Special note should be taken if any of these are found still containing refrigerant. Other Ferrous: products and pieces made from metal to which a magnet will adhere (but including stainless steel), and which are not significantly contaminated with other metals or materials (in the latter case, the item will instead be included under “Residual / Composite Metal”). This material will include paint and other non-food “tin cans”, as well as aerosol cans. Residual / Composite Metal: items made of a mixture of ferrous and non-ferrous or a mixture of metal and non-metallic materials (as long as these are primarily metal). Examples include small appliances, motors, and insulated wire.
CONSUMER PRODUCTSCONSUMER PRODUCTSCONSUMER PRODUCTSCONSUMER PRODUCTS
Computers: computers and parts of computers, including monitors, base units, keyboards, other accessories, and laptops. Other Electronics: other appliances and products that contain circuit boards and other electronic components (as a significant portion of the product), such as televisions, microwave ovens, and similar products. Textiles, Synthetic: cloth, clothing, and rope made of synthetic materials. Textiles, Organic: cloth, clothing, and rope made of 100% cotton, leather, wool, or other naturally-occurring fibers. Composites of several different naturally-occurring fibers (such as a wool jacket with a cotton liner) can be included in this material, but not if the item has zippers or buttons made from a different material. The working guideline for this material should whether the item could be composted without leaving an identifiable residue or part. Textiles, Mixed or Unknown: cloth, clothing, and rope made of unknown fibers or made from a mixture of synthetic and natural materials, or containing non-textile parts such as metal zippers or plastic buttons. Shoes: all shoes and boots, whether made of leather, rubber, other materials, or a combination thereof. Tires and Other Rubber: vehicle tires of all types, including bicycle tires and including the rims if present, and finished products and scrap materials made of rubber, such as bath mats, inner tubes, rubber hose, and foam rubber (except carpet padding, see below). Furniture and Mattresses: furniture and mattresses made of various materials and in any condition. Carpet: pieces of carpet and rugs made of similar material. Carpet Padding: foam rubber and other materials used as padding under carpets.

A-6
Rejected Products: for industrial samples only, various products that failed internal QA/QC tests. Returned Products: for industrial samples only, various products that were returned by the consumer who purchased the item. Other Composite: This is a catch-all material for objects consisting of more than one material.
RESIDUALSRESIDUALSRESIDUALSRESIDUALS
Ash: fireplace, burn barrel or firepit ash, as well as boiler and ash from industrial sources. Dust: baghouse and other dusts from industrial sources, as well as bags of vacuum cleaner dust. Fines / Sorting Residues: mixed waste that remains on the sorting table after all the materials that can practicably be removed have been sorted out. This material will consist primarily of small pieces of various types of paper and plastic, but will also contain small pieces of broken glass and other materials. May also include material less than one-half inch in diameter that falls through a bottom screen during sorting, for those using sorting boxes with screens, and if the material cannot otherwise be identified. Sludges and Other Special Industrial Wastes: sludges and other wastes from industrial sources that cannot easily be fit into any of the above material. Can include liquids and semi-solids but only if these materials are treated as a solid waste.
HAZARDOUS AND SPECIAL WASTES HAZARDOUS AND SPECIAL WASTES HAZARDOUS AND SPECIAL WASTES HAZARDOUS AND SPECIAL WASTES
Used Oil: used or new lubricating oils and related products, primarily those used in cars but possibly also including other materials with similar characteristics. Oil Filters: used oil filters, primarily those used in cars but possibly including similar filters from other types of vehicles and other applications. Antifreeze: automobile and other antifreeze mixtures based on ethylene or propylene glycol, also brake and other fluids if based on these compounds. Auto Batteries: car, motorcycle, and other lead-acid batteries used for motorized vehicles. Household Batteries: batteries of various sizes and types, as commonly used in households. Pesticides and Herbicides: includes a variety of poisons whose purpose is to discourage or kill pests, weeds, or microorganisms. Fungicides and wood preservatives, such as pentachlorophenol, are also included in this material. Latex Paint: water-based paints.
A-7
Oil Paint: solvent-based paints. Medical Waste: wastes related to medical activities, including syringes, IV tubing, bandages, medications, and other wastes, and not restricted to just those wastes typically classified as pathogenic or infectious. Fluorescent Tubes: in addition to the typical fluorescent tubes (including fluorescent light bulbs and other forms), this material includes mercury vapor and other lamps listed as universal wastes. Asbestos: pure asbestos, and asbestos-containing products where the asbestos present is the most distinguishing characteristic of the material. Other Hazardous Waste: problem wastes that do not fall into one of the above material, such as gasoline, solvents, gunpowder, other unspent ammunition, fertilizers, and radioactive materials. Other Non-Hazardous Waste: problem wastes that do not fall into one of the above materials, but that are not hazardous, such as adhesives, weak acids and bases (cleaners), automotive products (i.e., car wax), etc.
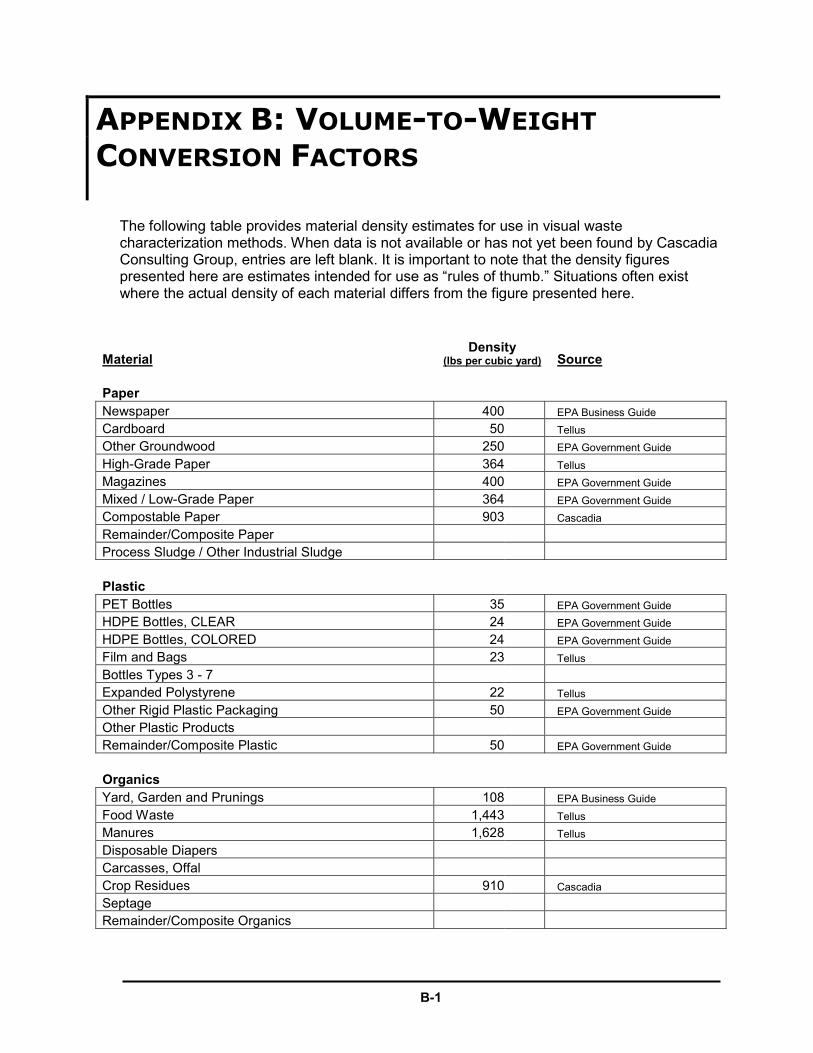
B-1
APPENDIX B: VOLUME-TO-WEIGHT
CONVERSION FACTORS
The following table provides material density estimates for use in visual waste characterization methods. When data is not available or has not yet been found by Cascadia Consulting Group, entries are left blank. It is important to note that the density figures presented here are estimates intended for use as “rules of thumb.” Situations often exist where the actual density of each material differs from the figure presented here.
Material Density
(lbs per cubic yard) Source Paper Newspaper 400 EPA Business Guide Cardboard 50 Tellus Other Groundwood 250 EPA Government Guide High-Grade Paper 364 Tellus Magazines 400 EPA Government Guide Mixed / Low-Grade Paper 364 EPA Government Guide Compostable Paper 903 Cascadia Remainder/Composite Paper Process Sludge / Other Industrial Sludge Plastic PET Bottles 35 EPA Government Guide HDPE Bottles, CLEAR 24 EPA Government Guide HDPE Bottles, COLORED 24 EPA Government Guide Film and Bags 23 Tellus Bottles Types 3 - 7 Expanded Polystyrene 22 Tellus Other Rigid Plastic Packaging 50 EPA Government Guide Other Plastic Products Remainder/Composite Plastic 50 EPA Government Guide Organics Yard, Garden and Prunings 108 EPA Business Guide Food Waste 1,443 Tellus Manures 1,628 Tellus Disposable Diapers Carcasses, Offal Crop Residues 910 Cascadia Septage Remainder/Composite Organics

B-2
Material Density
(lbs per cubic yard) Source Wood Wastes Natural Wood 330 CIWMB Treated Wood 330 CIWMB Painted Wood 330 CIWMB Dimensional Lumber 330 Tellus Engineered 425 Tellus Packaging Other Untreated Wood 330 CIWMB Wood Byproducts 375 Tellus Remainder/Composite Wood Construction, Demolition & Landclearing Wastes Insulation 17 CIWMB Asphalt 1,215 FEECO Concrete 2,700 FEECO Drywall 394 Tellus Soil, Rocks & Sand 2,200 Average of CIWMB figures Roofing Waste 600 Average of figures from San Diego,
CIWMB, Cascadia
Ceramics 320 Cascadia measurement Remainder/Composite C&D Glass Clear Beverage Glass 600 EPA Government Guide Green Beverage Glass 600 EPA Government Guide Brown Beverage Glass 600 EPA Government Guide Clear Container Glass 600 EPA Government Guide Green Container Glass 600 EPA Government Guide Brown Container Glass 600 EPA Government Guide Plate Glass 1,000 EPA Government Guide Remainder/Composite Glass 1,000 EPA Government Guide Non-glass Ceramics Metal Aluminum Cans 91 Tellus Aluminum Foil / Containers Other Aluminum 175 Tellus Copper 1,094 Tellus Other Non-Ferrous Metals Tin Cans 850 EPA Business Guide White Goods 180 EPA Government Guide Other Ferrous 906 EPA Business Guide Remainder/Composite Metals
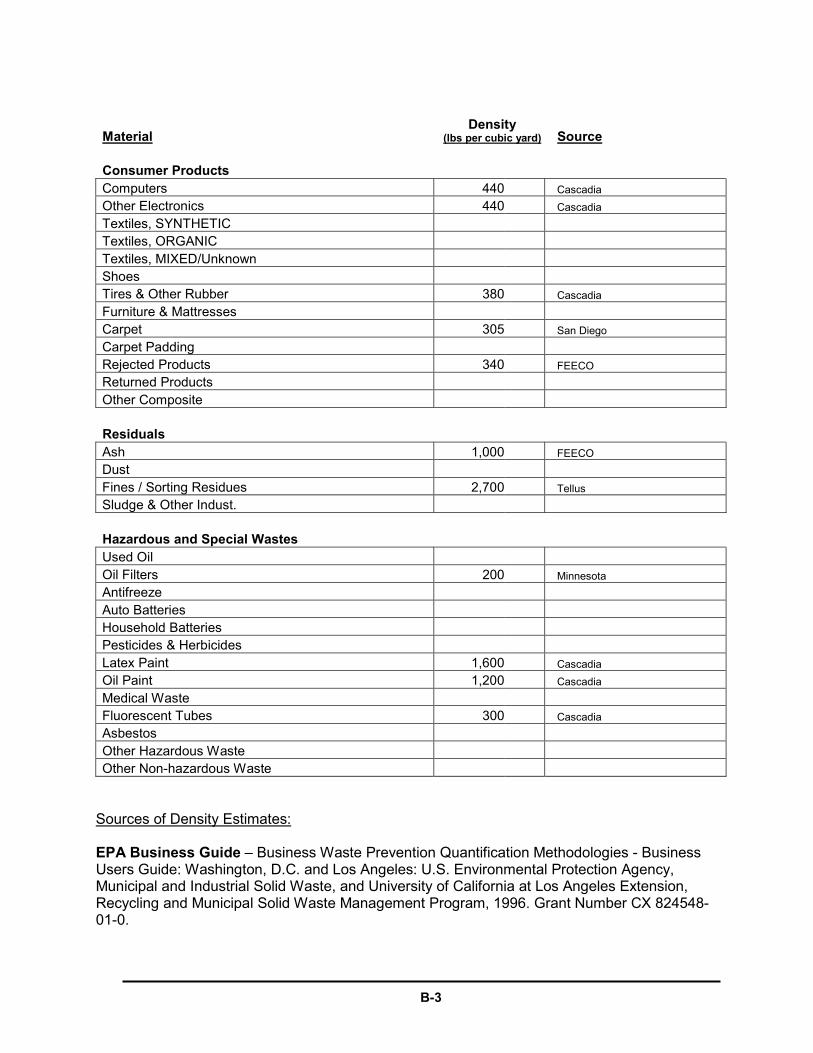
B-3
Material Density
(lbs per cubic yard) Source Consumer Products Computers 440 Cascadia Other Electronics 440 Cascadia Textiles, SYNTHETIC Textiles, ORGANIC Textiles, MIXED/Unknown Shoes Tires & Other Rubber 380 Cascadia Furniture & Mattresses Carpet 305 San Diego Carpet Padding Rejected Products 340 FEECO Returned Products Other Composite Residuals Ash 1,000 FEECO Dust Fines / Sorting Residues 2,700 Tellus Sludge & Other Indust. Hazardous and Special Wastes Used Oil Oil Filters 200 Minnesota Antifreeze Auto Batteries Household Batteries Pesticides & Herbicides Latex Paint 1,600 Cascadia Oil Paint 1,200 Cascadia Medical Waste Fluorescent Tubes 300 Cascadia Asbestos Other Hazardous Waste Other Non-hazardous Waste
Sources of Density Estimates: EPA Business Guide – Business Waste Prevention Quantification Methodologies - Business Users Guide: Washington, D.C. and Los Angeles: U.S. Environmental Protection Agency, Municipal and Industrial Solid Waste, and University of California at Los Angeles Extension, Recycling and Municipal Solid Waste Management Program, 1996. Grant Number CX 824548-01-0.
B-4
EPA Government Guide – Measuring Recycling: A Guide For State and Local Governments. Washington, D.C.: U. S. Environmental Protection Agency, 1997: Phone 1-800-424-9346; http://www.epa.gov. Publication number EPA530-R-97-011. FEECO -- FEECO International Handbook, 8th Printing (Section 22-45 to 22-510). Green Bay, Wisconsin: FEECO International, Inc. Phone (920) 468-1000; FAX (920) 469-5110. Tellus – Conversion Factors for Individual Material Types Submitted to California Integrated Waste Management Board. Cal Recovery Inc., Tellus Institute, and ACT…now, December 1991. San Diego – conversion factors developed and used in Waste Composition Study 1999-2000: Final Report, prepared by Cascadia Consulting Group for the City of San Diego’s Environmental Services Department, 2000. Cascadia – figures based on measurements of the pure material conducted by Cascadia Consulting Group. Minnesota – "Tank Monitor." The Minnesota Pollution Control Agency. Fall/Winter 2000. Vol. 11, No. 3.
C-1
APPENDIX C: EQUIPMENT LISTS
This appendix presents recommended lists of equipment to use when gathering and sorting samples and when conducting vehicle surveys.
EEEEQUIPMENT FOR SAMPLINQUIPMENT FOR SAMPLINQUIPMENT FOR SAMPLINQUIPMENT FOR SAMPLING AND SORTING WASTG AND SORTING WASTG AND SORTING WASTG AND SORTING WASTEEEE
Laundry baskets
Boots
Gloves
Hard hats
Orange safety vests
Stapler
Duct tape
Shovels
Broom
Tarps
Scale
Dust masks
Safety glasses
Sorting tables
Clipboards
Hand warmers
Hand wipes
Calculator
Rain gear
Safety vests
96-gallon toters
Waste Composition Field Forms
First aid kit
2-way radio to communicate with surveyor
C-2
EEEEQUIPMENT FOR CONDUCTQUIPMENT FOR CONDUCTQUIPMENT FOR CONDUCTQUIPMENT FOR CONDUCTING VEHICLE SURVEYSING VEHICLE SURVEYSING VEHICLE SURVEYSING VEHICLE SURVEYS
Map and directions to the solid waste facility
Schedule of days, locations
Cell phone
Calling card, for locations out of cell phone range
Plenty of Vehicle Survey Forms and pre-printed Load Selection Forms specific to the site and day
Numbered cards for net weights
Clipboard with plastic sheet to protect forms from rain
Extra pencils and pens
Language translation cards
Rubber/plastic box to contain survey forms
Hard hat
Safety vest
Apron with pockets
Comfortable & waterproof shoes
Foldable chair (optional)
Raingear, head to toe (where appropriate)
Heavy jacket (where appropriate)
Two pair socks for cold weather (where appropriate)
Sun hat or cold weather hat
Gloves (fingerless work well for writing)
Thermos for tea, coffee of soup
Snacks, hearty lunch (some of the locations are isolated)
Sunglasses
Sunscreen
Radio or something to read if traffic is light
2-way radio to communicate with sampling crew
D-1
APPENDIX D: HEALTH AND SAFETY
MEASURES
This section presents the Draft Health and Safety Protocol for use in waste characterization studies, as developed by the State of California.
DRAFT HEALTH AND SAFETY PROTOCOL
Date: April 7, 1995
ARTICLE 6.0 DISPOSAL CHARACTERIZATION STUDIES
Health and Safety Guidelines for Waste Characterization Studies
1. Introduction: The purpose of this document is to provide safety guidelines for performing visual and/or physical characterizations of non-hazardous solid waste from various selected garbage dumpsters, transfer stations, and sanitary landfills. 2. Table of Contents: 1.0 Introduction 2.0 Table of Contents 3.0 Specific procedure 3.01 List of Potential Hazards 3.02 Recommended Personal Safety/Protective Equipment 3.03 Responsible Personnel 3.04 General Safety Procedures 3.05 Site Control in Work Zones 3.06 Site Resources and personnel 3.07 Site Maps 3.08 Agreement to Comply with the Health and Safety Plan 3. Specific Procedure:
3.01 List of potential hazards
The following section lists some possible hazards that may occur during a visual and a physical sort of solid waste.

D-2
a. Physical hazards:
Cuts and punctures from handling hazardous materials: hypodermic needles, broken glass, razor blades, aerosol cans, chemicals, biohazards, bottles of unknown/unlabeled substances, plastic bottles containing used syringes, and other hazardous materials
Back injury Slipping and falling Heat stress and fatigue Traffic or heavy equipment movement Noise exposure from operation of heavy equipment Animal and/or insect bites
b. Airborne contaminants:
Dust from solid waste
c. Chemical hazards:
Liquid spills from containers Household and hazardous chemicals
d. Biological hazards:
Household hazardous wastes Medical wastes and sharps Bloody rags or objects Hypodermic needles
3.02 Recommended personal safety/protective equipment
The following section lists some of the personal safety/protective equipment
recommended for a visual and physical sort of solid waste.
a. Body protection:
Tyvek or equivalent, disposable coveralls Chemical resistant coveralls, if appropriate Hard bottomed, non-slip, steel toe boots A supply of outer rubber (cut and puncture resistant) gloves Chemical goggles or safety glasses with splash shields Dust masks A supply of inner (latex) gloves Snake guards, if appropriate Insect repellent Dog repellent
b. Hearing protection (if site has equipment or activities that generate loud noises):
D-3
Ear plugs Ear muffs
c. Other safety equipment:
Supportive back belt for heavy lifting Industrial first aid kit Field blanket Eye wash kit Moist, disposable towelettes (e.g., baby wipes) Six foot pole Small fire extinguisher Portable telephone High visibility traffic cones and tapes Site-specific safety plan Liquids to replenish fluids (water and cups for dehydration)
3.03 Responsible personnel
The following section lists some of the duties and responsibilities of personnel
who are supervising and conducting a visual/physical sort of solid waste.
a. Supervising, Project Manager's duties and responsibilities:
Delegate health and safety responsibilities to the Site Safety Officer, ensure that proper procedures are implemented by qualified personnel in a safe manner, make available proper personal protective equipment, adequate time, and budget.
Ensure that all field personnel have read, understood, and
signed the master copy of this document.
Check that all the site personnel have received, and documented training on waste characterization methods, recognizing hazardous wastes, potential risks from handling hazardous materials, managing site traffic, controlling dust/airborne contaminants, and back injury prevention.
b. Site Safety Officer's (can be the same person as above) duties and
responsibilities:
Has the duty and authority to stop unsafe operations, supervise CPR, and decide when to summon emergency services.
Ensure that the guidelines, rules, and procedures in this
document are followed for all site work.
D-4
Be familiar with local emergency services, and maintain a list of emergency phone numbers. Provide a map with the quickest route to a medical facility.
Conduct daily tailgate health and safety meetings before each
shift, and a daily summary meeting at the end of each shift to discuss the day's safety issues, possible solutions, and notify personnel of all changes associated with health, safety, and protocol.
Maintain and inspect personal protective equipment. Ensure
proper use of personal protective equipment by all employees.
Monitor on site hazards and the early health warning signs (e.g., heat stress/stroke, dehydration, or fatigue) of site personnel. It is recommended that on hot days, outdoor sampling should be done during the early hours.
Has completed appropriate health and safety training.
(Recommended: 40-hour Hazardous Waste Operation & Emergency response, CCR, T8, Section 5192-OSHA).
3.04 General safety procedures
The following section lists some of the general safety procedures
recommended for a visual/physical sort of solid waste.
a. All waste sorting personnel should: be in good physical condition, have had a recent medical exam, maintain a current tetanus booster and Hepatitis B shot, not be sensitive to odors and dust, and be able to read warning signs/labels on waste containers.
b. There will be absolutely no eating, smoking or drinking during sorting
activities. Food and liquids are to be away from the sorting area. Plenty of fluids (e.g., water, sports drinks, etc.) and single use, disposable cups must be available at all times. Hands and faces should be washed before eating or drinking. Consume drinks and rest frequently during hot days.
c. The "line of sight buddy system" must always be maintained at the
sorting site. The "line of sight buddy system" is as follows: sorters are grouped into pairs and each member is to periodically assess the physical condition of his/her "buddy".
d. Always wear the following before beginning the sorting procedure:
both pairs of gloves (outer rubber and inner latex), chemical goggles or safety glasses with splash shields, a dust mask, and disposable Tyvek overalls. Use safety boots especially when getting into bins.
D-5
e. Make noise when approaching the actual waste site to allow any wildlife/pest animals to flee. Look for snakes and poisonous spiders around and inside a dumpster/bin by probing with a long stick.
f. Do not attempt to identify unknown chemical substances present in
the waste stream: vials of chemicals, unlabeled pesticide/herbicide containers, and substances (e.g., chemicals, or needles) in unlabeled plastic/glass bottles/jugs.
g. Household hazardous wastes are those wastes resulting from
products purchased by the public for household use which because of their quantity, concentration, physical, or infectious, characteristics, may pose a substantial known or potential hazard to human or environmental health when improperly disposed. Empty containers of household hazardous wastes are generally not considered to be a hazardous waste. If hazardous wastes are detected, the Site Safety Officer will be notified.
h. Hazardous materials and hazardous wastes should not be present in
non-residential sources of municipal solid waste. If hazardous wastes are present in the municipal waste stream, from a commercial or industrial source, the material is not a household hazardous waste, it is a hazardous waste and the Site Safety Officer must be notified.
i. Biohazardous wastes are generally disposed of in red, plastic bags.
Treated biohazardous wastes (by incineration, autoclave, chemical sterilization, etc.), are also usually in red bags. If biohazardous wastes are detected, the sort will be halted (the bag will not be removed from the dumpster/bin) and the Site Safety Officer must be notified.
j. A potential hazard that can arise in waste sampling is the presence of
biohazardous wastes that are not in red bags, referred to as "fugitive regulated wastes". Sorters must be on alert for the indicators of fugitive biohazardous wastes: hypodermic needles, needle covers, medical tubing, articles contaminated with red (blood) colored substances, and medical device packaging. If fugitive biohazardous wastes are detected, the sort will be halted and the Site Safety Officer notified.
k. When sorting glass, remove the large pieces first, then remove the
clear glass. Never use your hands to dig down through the waste. Use a rake or small shovel to pull/push the material to the side and continue sorting.
l. At the end of each shift, remove all disposable clothing into a plastic
trash bag, and place the bag into a solid waste receptacle. All sorters must shower at the end of each shift.
3.05 Site control in work zones

D-6
The following section lists site control recommendations for a visual/physical sort of solid waste.
a. Traffic cones or high visibility warning tape will be placed around the
active sorting area.
b. Each work crew will keep a site-specific safety plan on site at all times.
3.06 Site resources and personnel
The following section lists available site contacts and resources for a
visual/physical sort of solid waste.
a. On-site contact:
Main point of contact: Telephone number: Facility manager: Telephone number:
b. Site resources locations
Toilet facilities: Drinking water: Telephone:
c. Medical information:
Local emergency medical facility: Fire Dept. phone number: Police Dept. phone number: Local ambulance phone number:
3.07 Site maps

D-7
See attachments for a site map that shows the location of local medical
facilities.
3.08 Agreement to comply with the health and safety plan
I _______________________________________ have read and understand print name the health and safety plan and will follow the procedures and protocols
detailed in the plan for waste characterization at all designated sites.
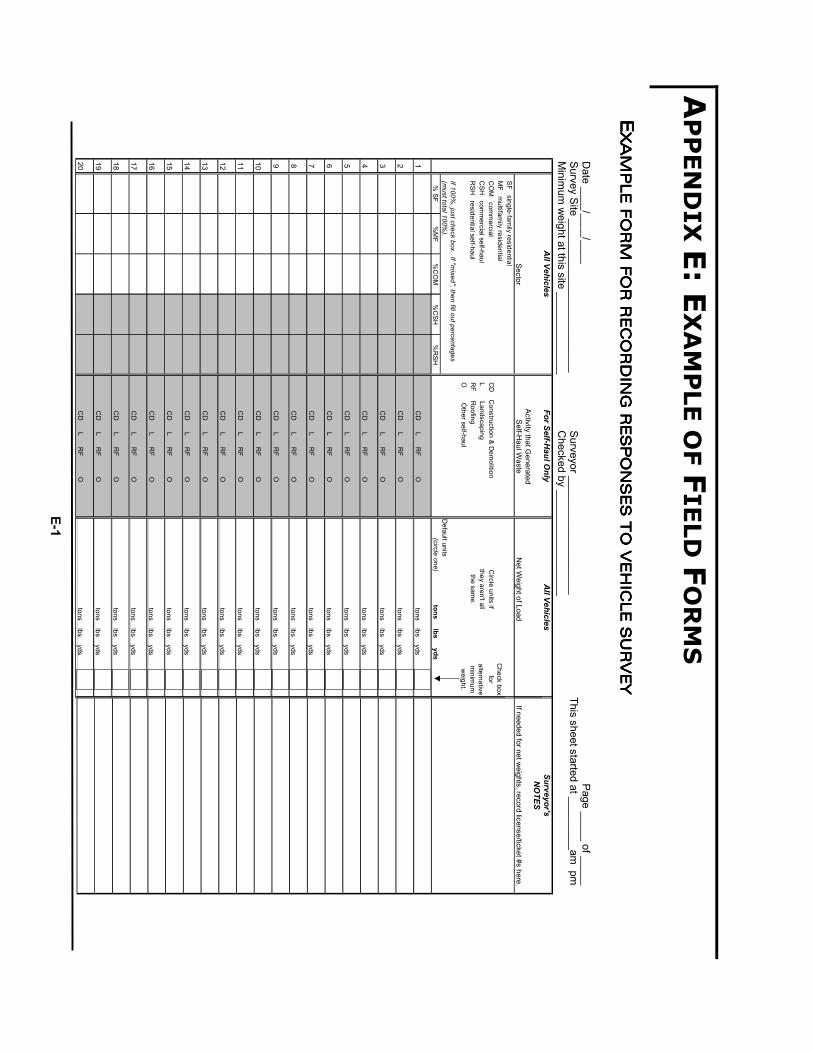
E-1
AP
PEN
DIX
E: E
XA
MP
LE O
F F
IELD
FO
RM
S
EEE EXA
MP
LE F
OR
M F
OR
REC
OXA
MP
LE F
OR
M F
OR
REC
OXA
MP
LE F
OR
M F
OR
REC
OXA
MP
LE F
OR
M F
OR
REC
OR
DIN
G
RD
ING
R
DIN
G
RD
ING
RES
PO
NS
ES
TO
VEH
ICLE
RES
PO
NS
ES
TO
VEH
ICLE
RES
PO
NS
ES
TO
VEH
ICLE
RES
PO
NS
ES
TO
VEH
ICLE
SU
RV
EY
SU
RV
EY
SU
RV
EY
SU
RV
EY
D
ate ____/____/____ Page _____ of _____
Survey Site __________________________ Surveyor ____________________
This sheet started at _________am pm
M
inimum
weight at this site ______________
Checked by __________________
All Vehicles
For Self-Haul O
nlyA
ll Vehicles
Activity that Generated
Self-Haul W
asteN
et Weight of Load
SF single-fam
ily residentialM
F multifam
ily residentialC
OM
comm
ercialC
D C
onstruction & Dem
olitionC
ircle units ifC
SH com
mercial self-haul
L Landscapingthey aren't all
RSH
residential self-haulR
F Roofing
the same.
O O
ther self-haulw
eight.
Default units
% SF
%M
F%
CO
M%
CSH
%R
SH(circle one) tons lbs yds
1C
D L R
F Otons lbs yds
2C
D L R
F Otons lbs yds
3C
D L R
F Otons lbs yds
4C
D L R
F Otons lbs yds
5C
D L R
F Otons lbs yds
6C
D L R
F Otons lbs yds
7C
D L R
F Otons lbs yds
8C
D L R
F Otons lbs yds
9C
D L R
F Otons lbs yds
10C
D L R
F Otons lbs yds
11C
D L R
F Otons lbs yds
12C
D L R
F Otons lbs yds
13C
D L R
F Otons lbs yds
14C
D L R
F Otons lbs yds
15C
D L R
F Otons lbs yds
16C
D L R
F Otons lbs yds
17C
D L R
F Otons lbs yds
18C
D L R
F Otons lbs yds
19C
D L R
F Otons lbs yds
20C
D L R
F Otons lbs yds
Sector
Check box
foralternative m
inimum
If 100%, just check box. If "m
ixed", then fill out percentages (m
ust total 100%).
Surveyor'sN
OTES
If needed for net weights, record license/ticket #s here.

E-2
EEE EXA
MP
LE F
OR
M F
OR
REC
OXA
MP
LE F
OR
M F
OR
REC
OXA
MP
LE F
OR
M F
OR
REC
OXA
MP
LE F
OR
M F
OR
REC
OR
DIN
G M
AT
ER
IAL W
EIG
HR
DIN
G M
AT
ER
IAL W
EIG
HR
DIN
G M
AT
ER
IAL W
EIG
HR
DIN
G M
AT
ER
IAL W
EIG
HT
S IN
A S
AM
PLE
TS
IN A
SA
MP
LE
TS
IN A
SA
MP
LE
TS
IN A
SA
MP
LE
PA
PE
RW
eightM
ETA
LW
eightW
OO
D W
AS
TE
SW
eight
Newspaper
Alum
inum Cans
Natural Wood
LOAD
INFO
RM
ATION
CardboardA
luminum
Foil / ContainersTreated W
oodLocation:
Other G
roundwood
Other A
luminum
Painted Wood
High-Grade Paper
CopperDim
ensional Lumber
Generator Type:
Magazines
Other Non-Ferrous M
etalsEngineered
Date:M
ixed / Low-G
rade PaperTin Cans
PackagingConsum
er
Compostable
White G
oodsO
ther Untreated Wood
R / C PaperO
ther FerrousW
ood ByproductsSam
ple ID:Com
mercial
Process Sludge / Other Indust.
R / C Metals
R / C Wood
PLA
STIC
OR
GA
NIC
SC
ON
SU
ME
R P
RO
DU
CTS
Industrial
PET BottlesY
ard, Garden and Prunings
Computers
HDPE Bottles, CLEAR
Food Waste
Other Electronics
HDPE Bottles, COLO
REDM
anuresTextiles, SY
NTHETICVehicle Type:
Film and Bags
Disposable DiapersTextiles, O
RGA
NIC
Bottles Types 3 - 7Carcasses, O
ffalTextiles, M
IXED/Unknown
Notes:Packer
Expanded PolystyreneCrop Residues
Shoes
Other Rigid Plastic Packaging
SeptageTires & O
ther RubberDrop Box
Other Plastic Products
R / C Organics
Furniture & Mattresses
R / C PlasticR
ES
IDU
ALS
CarpetO
ther Large
GLA
SS
Ash
Carpet Padding
CLEAR Beverage
DustRejected Products
Other Sm
all
GREEN Beverage
Fines / Sorting ResiduesReturned Products
BROW
N BeverageSludge & O
ther Indust.O
ther Composite
Hauler Type:Clear CO
NTAINER
CD
L WA
STE
SH
AZ
AR
DO
US
/S
PE
CIA
L
Com
mercial/Industrial Sam
pleG
reen CONTA
INERInsulation
Used Oil
Business Name/Description:
Comm
ercially Hauled
Brown CO
NTAINER
Asphalt
Oil Filters
Plate Glass
ConcreteA
ntifreezeSelf-hauled
R / C Glass
Drywall
Auto Batteries
Non-glass Ceramics
Soil, Rocks & SandHousehold Batteries
Roofing Waste
Pesticides & HerbicidesRecord VO
LUME of load:
Ceramics
Latex PaintLength:
inchesLoad Net W
eight:R / C C&D
Oil Paint
Width:
inches
Medical W
asteHeight:
inchesLoad Net Volum
e:Fluorescent Tubes
Asbestos
Other Haz W
aste
Other Non-Haz W
aste

F-1
APPENDIX F: VALUES OF THE t-STATISTIC The value of t can be estimated based on number of samples, n, and the desired confidence level.
Values of t Confidence Level n-2 80% 90% 95%
1 3.078 6.314 12.7062 1.886 2.920 4.3033 1.638 2.353 3.1824 1.533 2.132 2.7765 1.476 2.015 2.5716 1.440 1.943 2.4477 1.415 1.895 2.3658 1.397 1.860 2.3069 1.383 1.833 2.262
10 1.372 1.812 2.22811 1.363 1.796 2.20112 1.356 1.782 2.17913 1.350 1.771 2.16014 1.345 1.761 2.14515 1.341 1.753 2.13116 1.337 1.746 2.12017 1.333 1.740 2.11018 1.330 1.734 2.10119 1.328 1.729 2.09320 1.325 1.725 2.08621 1.323 1.721 2.08022 1.321 1.717 2.07423 1.319 1.714 2.06924 1.318 1.711 2.06425 1.316 1.708 2.06026 1.315 1.706 2.05627 1.314 1.703 2.05228 1.313 1.701 2.04829 1.311 1.699 2.04530 1.310 1.697 2.04240 1.303 1.684 2.02150 1.299 1.676 2.00960 1.296 1.671 2.00080 1.294 1.667 1.994
100 1.290 1.660 1.9841,000 1.282 1.646 1.962
∞ 1.282 1.645 1.960

G
-1
AP
PEN
DIX
G: R
EC
OM
MEN
DED
GR
OU
PIN
G O
F IN
DU
STR
Y T
YP
ES
FO
R W
AS
TE
GEN
ER
ATO
R S
TU
DIE
S
SIC Codes
Description of Group
IncludedSIC Code Designations
Agriculture / Fisheries
01A
gricultural production- crops 02
Agricultural production- livestock
07A
gricultural services 09
Fishing, hunting, and trapping Forestry
08Forestry
Mining
10M
etal mining
12C
oal mining
13O
il and gas extraction 14
Nonm
etallic minerals, except fuels
Construction
15G
eneral building contractors 16
Heavy construction contractors
17S
pecial trade contractors M
anufacturing - Food / Kindred
20Food and kindred products
Manufacturing - O
ther21
Tobacco manufactures
29P
etroleum and coal products
30R
ubber and miscellaneous plastics products
31Leather and leather products
32S
tone, clay, glass, and concrete products 39
Miscellaneous m
anufacturing industries M
anufacturing - Apparel / Textile
22Textile m
ill products 23
Apparel and other textile products
Manufacturing - Lum
ber & W
ood Products
24Lum
ber and wood products
Manufacturing - Furniture / Fixtures
25Furniture and fixtures
Manufacturing - P
aper / Allied
26P
aper and allied products

G
-2
SIC CodesDescription of G
roupIncluded
SIC Code DesignationsM
anufacturing - Printing / P
ublishing27
Printing and publishing
Manufacturing - C
hemical / A
llied28
Chem
icals and allied products M
anufacturing - Prim
ary / Fabricated Metal
33P
rimary m
etal industries 34
Fabricated metal products
Manufacturing - Industrial / M
achinery35
Industrial machinery and equipm
ent M
anufacturing - Electronic E
quipment
36E
lectrical and electronic equipment
Manufacturing - Transportation E
quipment
37Transportation equipm
ent M
anufacturing - Instruments / R
elated38
Instruments and related products
Transportation - Other
40R
ailroad operation41
Local and interurban passenger transit 44
Water transportation
46P
ipelines, except natural gas 47
Transportation services Trucking &
Warehousing
42M
otor freight transportation and warehousing
Transportation - Air
45Transportation by air
Com
munications
48C
omm
unications U
tilities49
Electric, gas, and sanitary services
Wholesale Trade - D
urable Goods
50W
holesale trade--durable goods W
holesale Trade - Nondurable G
oods51
Wholesale trade--nondurable goods
Retail Trade - B
uilding Material &
Garden
52B
uilding materials, hardw
are, garden supply, & m
obile R
etail Trade - General M
erchandise Store
53G
eneral merchandise stores
Retail Trade - Food S
tore54
Food stores R
etail Trade - Autom
otive Dealers &
Service S
tations55
Autom
otive dealers and gasoline service stations R
etail Trade - Other
56A
pparel and accessory stores 57
Furniture, home furnishings and equipm
ent stores 59
Miscellaneous retail
Retail Trade - R
estaurants58
Eating and drinking places
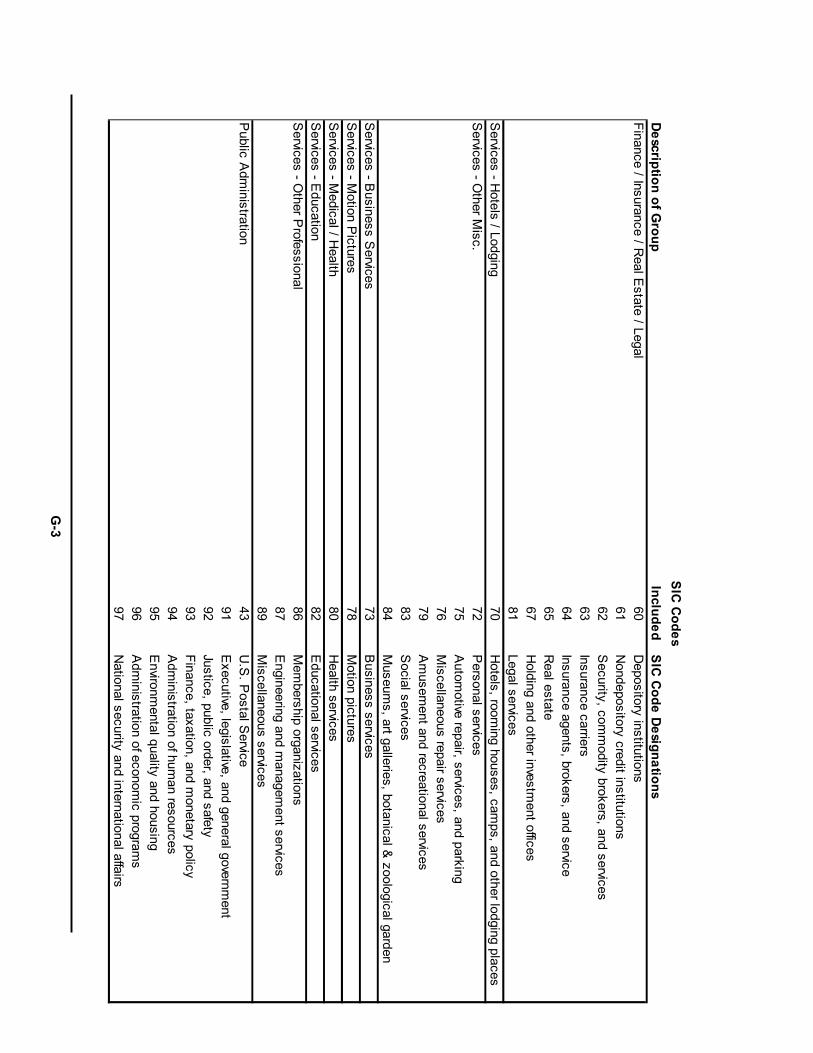
G
-3
SIC CodesDescription of G
roupIncluded
SIC Code DesignationsFinance / Insurance / R
eal Estate / Legal
60D
epository institutions 61
Nondepository credit institutions
62S
ecurity, comm
odity brokers, and services 63
Insurance carriers 64
Insurance agents, brokers, and service 65
Real estate
67H
olding and other investment offices
81Legal services
Services - H
otels / Lodging70
Hotels, room
ing houses, camps, and other lodging places
Services - O
ther Misc.
72P
ersonal services 75
Autom
otive repair, services, and parking 76
Miscellaneous repair services
79A
musem
ent and recreational services 83
Social services
84M
useums, art galleries, botanical &
zoological garden S
ervices - Business S
ervices73
Business services
Services - M
otion Pictures
78M
otion pictures S
ervices - Medical / H
ealth80
Health services
Services - E
ducation82
Educational services
Services - O
ther Professional
86M
embership organizations
87E
ngineering and managem
ent services 89
Miscellaneous services
Public A
dministration
43U
.S. P
ostal Service
91E
xecutive, legislative, and general government
92Justice, public order, and safety
93Finance, taxation, and m
onetary policy 94
Adm
inistration of human resources
95E
nvironmental quality and housing
96A
dministration of econom
ic programs
97N
ational security and international affairs

Washington State Department of Ecology
Rural Waste Characterization Report
Final Report prepared by Cascadia Consulting Group, Inc. in cooperation with Green Solutions, Inc. June 2003

Table of Contents
1. Executive Summary ____________________________________________________1 2. Introduction and Background ____________________________________________4 3. County Profiles________________________________________________________9
3.1 Introduction ................................................................................................................ 9 3.2 Overview of Methodology.......................................................................................... 9 3.3 Findings...................................................................................................................... 9
3.3.1 Grant County 11 3.3.2 Okanogan County 16
4. Statewide Waste Generation Estimates for Selected Rural-based Industry Groups21 4.1 Introduction .............................................................................................................. 21 4.2 Overview of Methodology........................................................................................ 22 4.3 Findings.................................................................................................................... 24
4.3.1 Field Crops 25 4.3.2 Orchards 28 4.3.3 Vegetables 31 4.3.4 Livestock 34 4.3.5 Mining 37 4.3.6 C&D 40 4.3.7 Paper 42 4.3.8 Logging & Primary Wood Products 44 4.3.9 Food Processing 46
Appendix A: Waste Classes and Definitions Appendix B: Disposal Site Waste Characterization Methodology Appendix C: Detailed Generator Waste Characterization Methodology Appendix D: Field Forms Appendix E: Detailed County Waste Composition Profiles by Sector Appendix F: Detailed Waste Composition by Industry Group
Table of Tables
Table 1-1: Summary of Amounts Disposed by Disposal Type for each Industrial Group.............................3 Table 3-1: Numbers of Samples Characterized at Disposal Facilities ..........................................................9 Table 3-2: Landfilled Quantities, Grant County ...........................................................................................11 Table 3-3: Top Ten Components in Landfilled Waste – Grant County, Overall..........................................12 Table 3-4: Top Ten Components in Landfilled Waste – Grant County, Commercial..................................13 Table 3-5: Top Ten Components in Landfilled Waste – Grant County, Industrial ......................................14 Table 3-6: Top Ten Components in Landfilled Waste – Grant County, Consumer ....................................15 Table 3-7: Landfilled Quantities, Okanogan County ...................................................................................16 Table 3-8: Top Ten Components in Landfilled Waste – Okanogan County, Overall ..................................17 Table 3-9: Top Ten Components in Landfilled Waste – Okanogan County, Commercial ..........................18 Table 3-10: Top Ten Components in Landfilled Waste – Okanogan County, Industrial.............................19 Table 3-11: Top Ten Components in Landfilled Waste – Okanogan County, Consumer...........................20 Table 4-1: Overall Targeted versus Actual Generator-based Samples Collected by Industry Group ........23 Table 4-2: Top Five Components – Landfilled ............................................................................................26 Table 4-3: Top Five Components – Beneficial Use.....................................................................................27 Table 4-4: Top Five Components – Landfilled ............................................................................................29 Table 4-5: Top Five Components – Other Disposal....................................................................................30 Table 4-6: Top Five Components – Beneficial Use.....................................................................................30 Table 4-7: Top Five Components – Landfilled ............................................................................................32 Table 4-8: Top Five Components – Beneficial Use.....................................................................................33 Table 4-9: Top Five Components – Landfilled ............................................................................................35 Table 4-10: Top Five Components – Beneficial Use...................................................................................36 Table 4-11: Top Five Components - Landfilled ...........................................................................................38 Table 4-12: Top Five Components – Beneficial Use...................................................................................39 Table 4-13: Top Five Components – Landfilled ..........................................................................................41 Table 4-14: Top Five Components – Landfilled ..........................................................................................43 Table 4-15: Top Five Components - Landfilled ...........................................................................................45 Table 4-16: Top Five Components – Landfilled ..........................................................................................47 Table 4-17: Top Five Components – Beneficial Use...................................................................................48
Table of Figures
Figure 1-1: Composition Summary for Landfilled Waste – Grant County, Overall........................................2 Figure 1-2: Composition Summary for Landfilled Waste – Okanogan County, Overall ................................2 Figure 3-1: Composition Summary for Landfilled Waste – Grant County, Overall......................................12 Figure 3-2: Composition Summary for Landfilled Waste – Grant County, Commercial..............................13 Figure 3-3: Composition Summary for Landfilled Waste – Grant County, Industrial ..................................14 Figure 3-4: Composition Summary for Landfilled Waste – Grant County, Consumer ................................15 Figure 3-5: Composition Summary for Landfilled Waste – Okanogan County, Overall ..............................17 Figure 3-6: Composition Summary for Landfilled Waste – Okanogan County, Commercial ......................18 Figure 3-7: Composition Summary for Landfilled Waste – Okanogan County, Industrial...........................19 Figure 3-8: Composition Summary for Landfilled Waste – Okanogan County, Consumer.........................20 Figure 4-1: Summary of Waste Handling Methods – Field Crops...............................................................25 Figure 4-2: Composition Summary – Field Crops .......................................................................................26 Figure 4-3: Summary of Waste Handling Methods – Orchards ..................................................................28 Figure 4-4: Composition Summary - Orchards............................................................................................29 Figure 4-5: Summary of Waste Handling Methods – Vegetables ...............................................................31 Figure 4-6: Composition Summary - Vegetables ........................................................................................32 Figure 4-7: Summary of Waste Handling Methods – Livestock ..................................................................34 Figure 4-8: Composition Summary – Livestock ..........................................................................................35 Figure 4-9: Summary of Waste Handling Methods – Mining.......................................................................37 Figure 4-10: Composition Summary – Mining .............................................................................................38 Figure 4-11: Summary of Waste Handling Methods – C&D........................................................................40 Figure 4-12: Composition Summary – C&D................................................................................................41 Figure 4-13: Summary of Waste Handling Methods – Paper .....................................................................42 Figure 4-14: Composition Summary – Paper ..............................................................................................43 Figure 4-15: Summary of Waste Handling Methods – Logging & Primary Wood Products........................44 Figure 4-16: Composition Summary – Logging & Primary Wood Products ................................................45 Figure 4-17: Summary of Waste Handling Methods – Food Processors....................................................46 Figure 4-18: Composition Summary – Food Processors ............................................................................47

Cascadia Consulting Group, Inc. 1 Washington State Department of Ecology: Rural Waste Characterization Report
1. EXECUTIVE SUMMARY
The Washington Department of Ecology commissioned this waste characterization study for two purposes – first, to gather data on waste disposal in rural Washington counties, and second, to gather data on types of waste disposal that traditionally have not received attention in waste characterization studies. Until now, few comprehensive waste characterization studies have been conducted for rural Washington counties, and none have been conducted for rural counties in central and eastern Washington. The present study represents the beginning of a compilation of waste characterization and quantity data to reflect disposal patterns in rural counties east of the Cascade Mountains. This study describes two important aspects of solid waste. First, it characterizes waste that is taken to disposal facilities (transfer stations and landfills) from commercial, consumer, and agricultural/industrial sources in Grant and Okanogan Counties. Second, the study addresses waste that is not taken to transfer stations or landfills. Data was collected to reflect a variety of agricultural and industrial disposal practices that, in addition to directing waste to landfills, included putting waste to beneficial use or finding other methods of disposal. This approach was used to examine the complete disposal practices of examples of nine types of business that represent agricultural and industrial enterprises typically found in rural Washington counties. In many ways, this study represents the most comprehensive waste characterization study ever conducted of rural waste generation and disposal, as well as industrial and agricultural waste generation and disposal. However, the study also should be seen as a starting point rather than the final word on waste generation in those settings. Waste composition and generation are highly variable, depending on the exact type of business or household that generates it, and depending on numerous other factors, such as season, economic conditions, and the prevailing character of the community where the study takes place. Therefore, more data ultimately will be necessary in order to form a complete and well-rounded picture of waste generation and disposal patterns in rural Washington. Approximately 77,500 tons of solid waste were landfilled in Grant County in 2002. Of that waste, about 45% was from commercial sources, 22% was from industrial or agricultural sources, and 33% was from residential sources. Figure 1-1, below, presents the composition of landfilled waste in Grant County in terms of ten major categories of materials. Food waste, which is part of the Organics material category, is the largest single component of landfilled waste in Grant County, accounting for approximately 13,400 tons (17.3%) of landfilled waste in 2002.
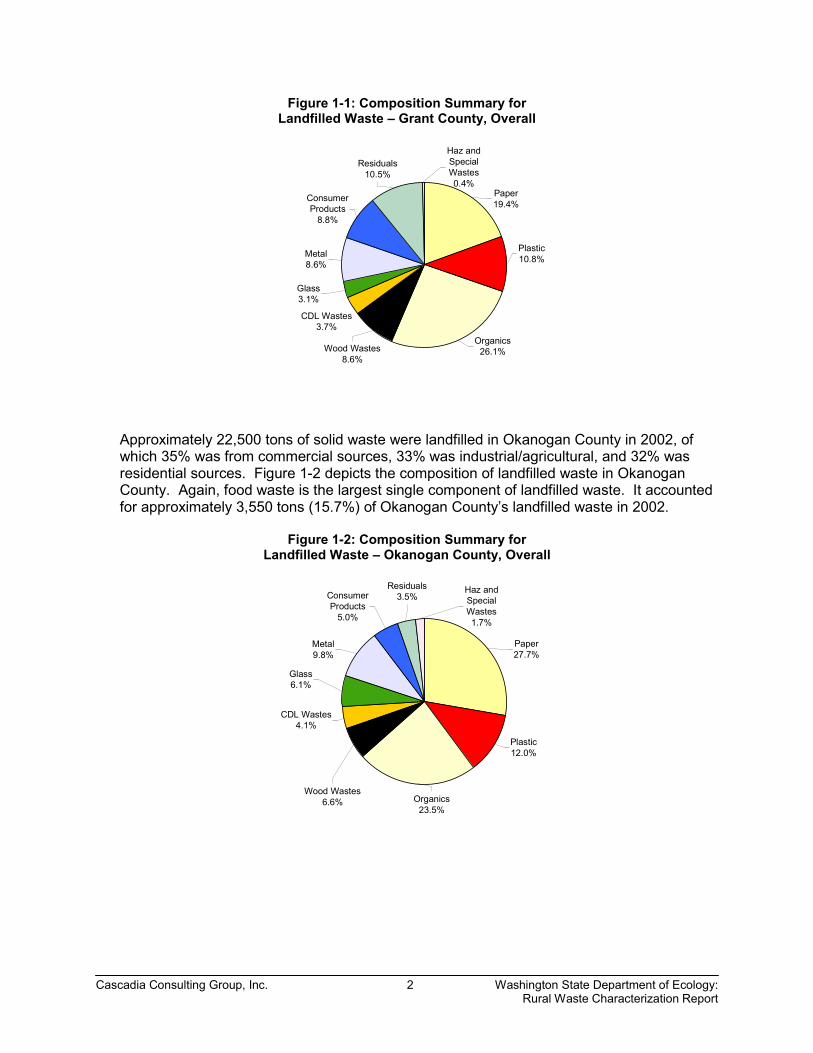
Cascadia Consulting Group, Inc. 2 Washington State Department of Ecology: Rural Waste Characterization Report
Figure 1-1: Composition Summary for Landfilled Waste – Grant County, Overall
Plastic10.8%
Paper19.4%
Wood Wastes8.6%
Organics26.1%
CDL Wastes3.7%
Glass3.1%
Metal8.6%
Consumer Products
8.8%
Residuals10.5%
Haz and Special Wastes0.4%
Approximately 22,500 tons of solid waste were landfilled in Okanogan County in 2002, of which 35% was from commercial sources, 33% was industrial/agricultural, and 32% was residential sources. Figure 1-2 depicts the composition of landfilled waste in Okanogan County. Again, food waste is the largest single component of landfilled waste. It accounted for approximately 3,550 tons (15.7%) of Okanogan County’s landfilled waste in 2002.
Figure 1-2: Composition Summary for
Landfilled Waste – Okanogan County, Overall
Plastic12.0%
Paper27.7%
Wood Wastes6.6% Organics
23.5%
CDL Wastes4.1%
Glass6.1%
Metal9.8%
Consumer Products
5.0%
Residuals3.5%
Haz and Special Wastes1.7%

Cascadia Consulting Group, Inc. 3 Washington State Department of Ecology: Rural Waste Characterization Report
In the portion of this study that examined waste generated by industries and agricultural businesses typical of rural Washington counties, quantity estimates were developed for waste that is sent to landfills and disposed through other methods. The study endeavored to quantify and characterize all types of waste disposed, recycled, or reused through all means for each of nine industrial and agricultural groups. Data was collected by visiting selected locations belonging to each of the nine industry groups and quantifying and characterizing each type of waste that was observed. Locations in Grant, Okanogan, and Clallam Counties were visited. Data from the participating businesses in those counties were used to extrapolate statewide quantity and composition estimates for waste generated by rural industries and agricultural activities. The amount of waste estimated to be generated by each of the nine targeted industry groups is summarized in the table below. Beneficial use is defined as directing what would otherwise be waste to some purpose, including waste-to-energy, replenishment of soil nutrients, recycling, etc. This study concludes that beneficial use represents the largest means of handling waste generated by the industry groups that were examined. Other disposal is defined as any disposition of waste other than sending it to landfills or putting it to beneficial use. To put the disposal figures of the table in context, it is estimated that about 4.5 million tons of solid waste were landfilled in Washington in 2001.1
Figure 1-3: Tons of Waste Generated by Selected Industrial Groups in Washington Industry Group Landfilled Other Disposal Beneficial Use Total WasteField Crops 9,900 0.0% 17,000 0.1% 24,000,000 99.9% 24,000,000 100%Orchards 6,600 0.7% 15,000 1.6% 890,000 97.6% 910,000 100%Vegetables 220 0.0% - 0.0% 583,000 100.0% 580,000 100%Livestock 4,200 0.1% 920,000 26.3% 2,600,000 73.6% 3,500,000 100%Mining 1,400 0.0% 190 0.0% 4,100,000 100.0% 4,100,000 100%Construction & Demolition 900,000 91.8% 5,300 0.5% 80,000 7.6% 980,000 100%Paper and Allied Products 240,000 9.2% 714,000 27.5% 1,600,000 63.3% 2,600,000 100%Logging, Lumber, & Primary Wood Products 17,000 0.2% 33,000 0.4% 8,800,000 99.4% 8,900,000 100%Food and Kindred Products 62,000 4.8% 620 0.0% 1,300,000 95.2% 1,300,000 100%
Since this study allocated relatively few site visits and waste samples to each of the nine industry groups, the statewide estimates are best seen as order-of-magnitude estimates rather than precise projections of statewide disposal.
1 Solid Waste in Washington State, 11th Annual Report, Washington Department of Ecology publication #02-07-19, page 92.

Cascadia Consulting Group, Inc. 4 Washington State Department of Ecology: Rural Waste Characterization Report
2. INTRODUCTION AND BACKGROUND
The Washington Department of Ecology commissioned this waste characterization study for two purposes – first, to gather data on waste disposal in rural Washington counties, and second, to gather data on types of waste disposal that traditionally have not received attention in waste characterization studies. Until now, few comprehensive waste characterization studies have been conducted for rural Washington counties, and none have been conducted for rural counties in central and eastern Washington. The present study represents the beginning of a compilation of waste characterization and quantity data to reflect disposal patterns in rural counties east of the Cascade Mountains. Grant and Okanogan Counties were selected as being representative of rural counties in central and eastern Washington, because of their low population density, and because they contain representative businesses belonging to diverse industrial and agricultural groups. They are highlighted in the map in Figure 1-1. Grant County has a population of approximately 76,221,2 and density of about 28.5 people per square mile.3 Grant County was chosen partly due to the large agricultural presence there. Sixty-four percent of the land in the County is farmland.4 Of the estimated 2.5 million acres of wheat in the State, Grant County has about 180,000 acres. It has the second greatest number of acres devoted to orchards and the largest number of acres for potatoes in the State. It also ranks second of any county in the State for the number of cattle. After agriculture/forestry/fishing, the second largest industry, by employment, is manufacturing, particularly food processing. Grant County ranks 32nd in the State for average income per capita, which is estimated to be $19,424 annually. With a population of approximately 39,543 in 2001, Okanogan County has a population density of about 7.6 people per square mile. The largest industries, by employment, in the County include agriculture/forestry/fishing, government, and services, such as hotel and medical services. It ranks fifth in the State for both the number of acres in orchards and the number of cattle. About 35% of land in the County is farmland. Okanogan County ranks 30th in the state for average income (per capita), which is estimated to be $20,068.
2 2001 U.S. Census Bureau estimate, http://quickfacts.census.gov/qfd/states/53/53025.html 3 State of Washington, Office of Financial Management, http://www.ofm.wa.gov/popden/rural.htm 4 1992 Census of Agriculture, http://www.nass.usda.gov/wa/counties/cnty025.htm

Cascadia Consulting Group, Inc. 5 Washington State Department of Ecology: Rural Waste Characterization Report
Figure 2-1: Washington State
This study characterized waste in Grant and Okanogan Counties that is taken to disposal facilities (transfer stations and landfills) from commercial, consumer, and agricultural/industrial sources. In addition, the study addressed waste that is not taken to transfer stations or landfills. Data was collected to reflect a variety of agricultural and industrial disposal practices that, in addition to directing waste to landfills, included putting waste to beneficial use or finding other methods of disposal. As a result, the study represents a more comprehensive approach to understanding waste disposal than has ever been explored in the State of Washington. This approach was used to examine the complete disposal practices of examples of nine types of business that represent agricultural and industrial enterprises typically found in rural Washington counties. Data from agricultural and industrial locations in Grant, Okanogan, and Clallam Counties contributed to this portion of the study. Because the study addressed multiple parts of a complex waste stream, it is helpful to clarify terms used in the study. The entire solid waste stream is envisioned as including numerous sectors. The sectors that were the focus of this study are depicted in the following diagram and are described below.
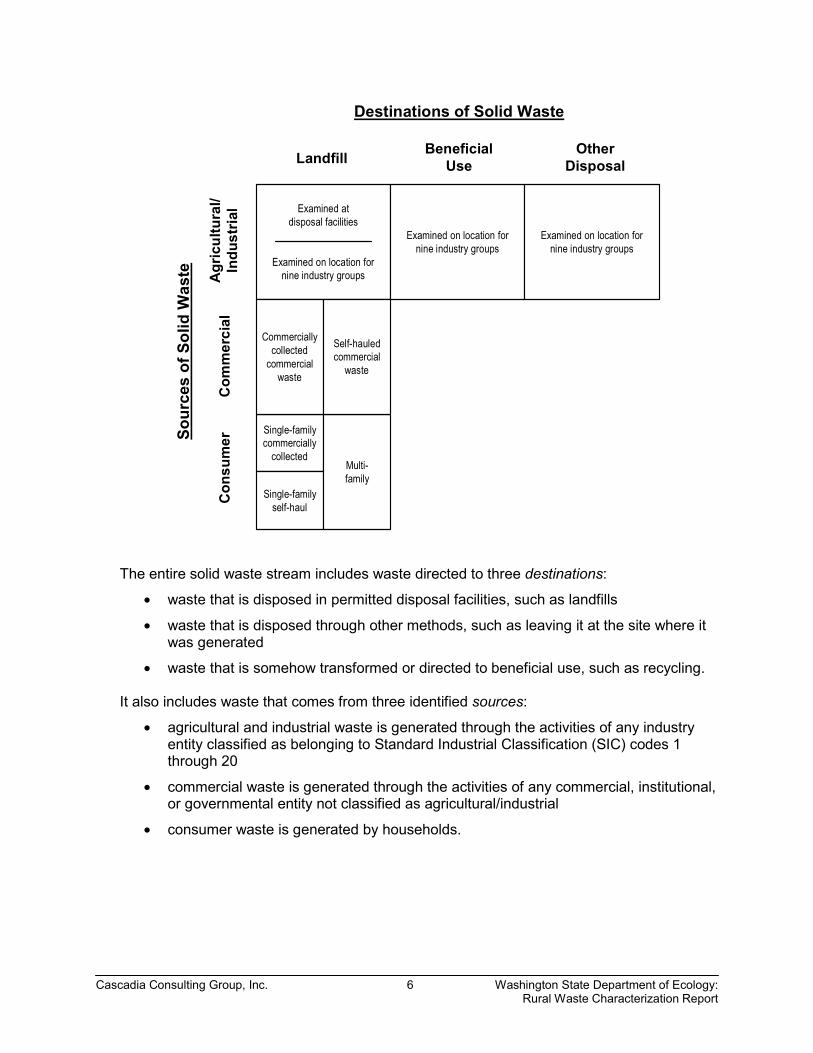
Cascadia Consulting Group, Inc. 6 Washington State Department of Ecology: Rural Waste Characterization Report
Examined atdisposal facilities
Examined on location fornine industry groups
Destinations of Solid Waste
Landfill BeneficialUse
OtherDisposal
Sour
ces
of S
olid
Was
te
Con
sum
erC
omm
erci
alAg
ricul
tura
l/In
dust
rial
Single-familycommercially
collected
Single-familyself-haul
Multi-family
Commerciallycollected
commercialwaste
Self-hauledcommercial
waste
Examined on location fornine industry groups
Examined on location fornine industry groups
The entire solid waste stream includes waste directed to three destinations:
• waste that is disposed in permitted disposal facilities, such as landfills
• waste that is disposed through other methods, such as leaving it at the site where it was generated
• waste that is somehow transformed or directed to beneficial use, such as recycling. It also includes waste that comes from three identified sources:
• agricultural and industrial waste is generated through the activities of any industry entity classified as belonging to Standard Industrial Classification (SIC) codes 1 through 20
• commercial waste is generated through the activities of any commercial, institutional, or governmental entity not classified as agricultural/industrial
• consumer waste is generated by households.

Cascadia Consulting Group, Inc. 7 Washington State Department of Ecology: Rural Waste Characterization Report
Waste originating from commercial and consumer sources was quantified and characterized to the extent that it is disposed in landfills. Waste originating from agricultural/industrial sources was quantified and characterized according to disposal destination for each of nine industry groups:
• field crops
• orchards
• vegetables
• livestock
• mining
• construction & demolition
• paper and allied industries
• logging & primary wood products
• food manufacturing, processing and packaging
In many ways, this study represents the most comprehensive waste characterization study ever conducted of rural waste generation and disposal, as well as industrial and agricultural waste generation and disposal. However, the study also should be seen as a starting point rather than the final word on waste generation in those settings. Waste composition and generation are highly variable, and depend on the exact type of business or household that generates it, and depending on numerous other factors, such as season, economic conditions, and the prevailing character of the community where the study takes place. Therefore, more data ultimately will be necessary in order to form a complete and well-rounded picture of waste generation and disposal patterns in rural Washington. In conjunction with implementing the current waste characterization study, the consultant was commissioned to develop guidelines5 for conducting waste characterization studies in the future. The use of those guidelines at the city, county or state levels will produce data that later can be added to the data that was gathered as part of the current study. It is hoped that additional data will provide a picture of waste disposal in parts of Washington beyond the three counties that were the focus of the present study and for commercial and industry groups that were not covered in the present study. It is also hoped that additional waste samples and generation measurements can be added to the existing data to produce a more precise picture of waste disposal for each sector of the waste stream. Section 3 of this document presents quantity and composition estimates of commercial, agricultural/industrial, and consumer waste that is disposed in landfills in Grant and Okanogan Counties. Overall composition profiles for all landfilled waste in each county are presented, followed by closer examinations of waste from each source. Section 4 of this document presents the estimated quantity and composition of waste statewide that is sent to landfill, employed for beneficial use, or disposed in other ways from each of the nine industry groups mentioned above. The findings are based on data collected in Clallam County6, Grant County, and Okanogan County and are “scaled up” to the statewide level based on statewide data for the number of acres of each crop, the number of each type of farm animal, the number of employees of particular industries, etc.
5 Guidelines for Waste Characterization Studies in the State of Washington. 6 In concert with the Washington Department of Ecology, Clallam County is conducting its own waste characterization study. Data gathered as part of the Clallam County study, from selected agricultural and industrial sites in Clallam County, was used along with data from sites in Grant and Okanogan Counties to develop the statewide waste composition and quantity profiles that are presented in the current study, in Section 4, for selected agricultural and industry groups.
Cascadia Consulting Group, Inc. 8 Washington State Department of Ecology: Rural Waste Characterization Report
Since this study allocated relatively few site visits and waste samples to each of the nine industry groups, the statewide estimates of waste quantities are best seen as order-of-magnitude estimates rather than precise projections of statewide disposal.
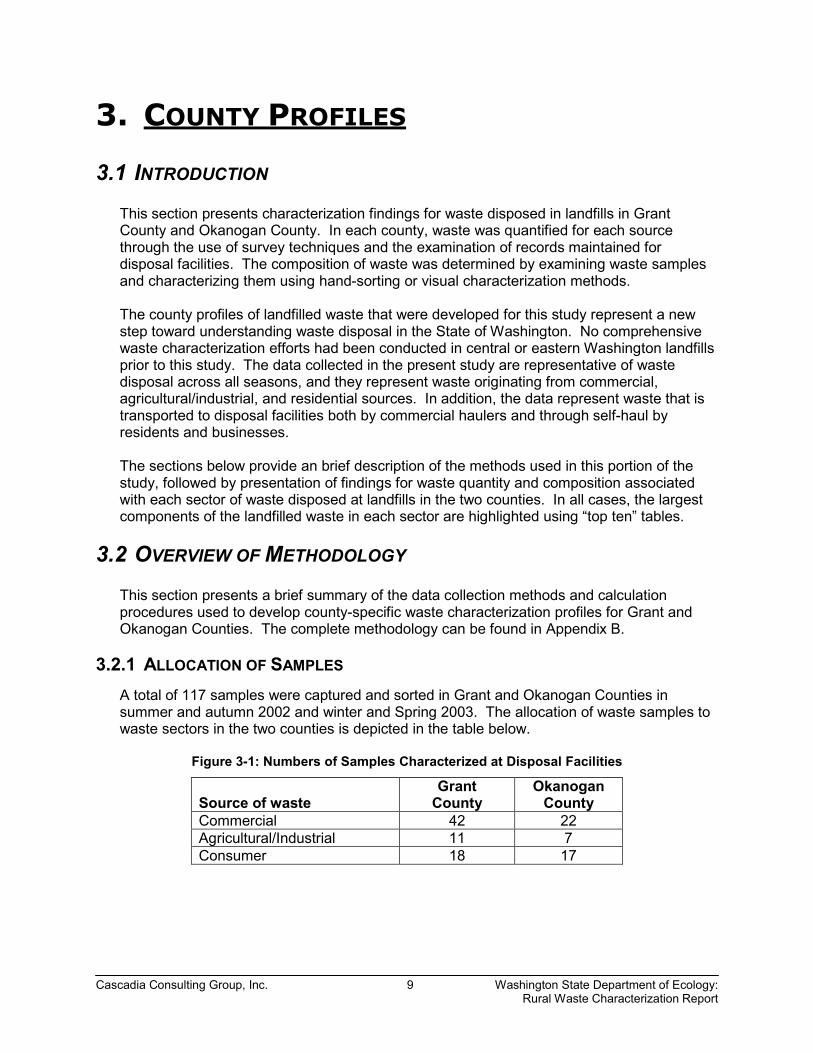
Cascadia Consulting Group, Inc. 9 Washington State Department of Ecology: Rural Waste Characterization Report
3. COUNTY PROFILES
3.1 INTRODUCTION This section presents characterization findings for waste disposed in landfills in Grant County and Okanogan County. In each county, waste was quantified for each source through the use of survey techniques and the examination of records maintained for disposal facilities. The composition of waste was determined by examining waste samples and characterizing them using hand-sorting or visual characterization methods. The county profiles of landfilled waste that were developed for this study represent a new step toward understanding waste disposal in the State of Washington. No comprehensive waste characterization efforts had been conducted in central or eastern Washington landfills prior to this study. The data collected in the present study are representative of waste disposal across all seasons, and they represent waste originating from commercial, agricultural/industrial, and residential sources. In addition, the data represent waste that is transported to disposal facilities both by commercial haulers and through self-haul by residents and businesses. The sections below provide an brief description of the methods used in this portion of the study, followed by presentation of findings for waste quantity and composition associated with each sector of waste disposed at landfills in the two counties. In all cases, the largest components of the landfilled waste in each sector are highlighted using “top ten” tables.
3.2 OVERVIEW OF METHODOLOGY This section presents a brief summary of the data collection methods and calculation procedures used to develop county-specific waste characterization profiles for Grant and Okanogan Counties. The complete methodology can be found in Appendix B.
3.2.1 ALLOCATION OF SAMPLES A total of 117 samples were captured and sorted in Grant and Okanogan Counties in summer and autumn 2002 and winter and Spring 2003. The allocation of waste samples to waste sectors in the two counties is depicted in the table below.
Figure 3-1: Numbers of Samples Characterized at Disposal Facilities
Source of waste
Grant County
Okanogan County
Commercial 42 22 Agricultural/Industrial 11 7 Consumer 18 17

Cascadia Consulting Group, Inc. 10 Washington State Department of Ecology: Rural Waste Characterization Report
Besides the 18 agricultural/industrial samples that were intercepted at the disposal facilities and that are reflected in Table 1, additional information collected from 32 business locations was brought into the analysis to reflect the composition and quantity of agricultural/industrial waste that is sent to landfill. The information from business locations was a summary of composition and quantity data for waste sent to landfills by certain agricultural and industrial business groups. The data had been collected as part of the waste-generator portion of the current study.
3.2.2 COLLECTION OF COMPOSITION AND QUANTITY DATA Cascadia selected waste loads and characterized samples on 10 days between August 2002 and March 2003. The data collection crew used a random selection procedure to identify certain vehicles entering the disposal facility (Ephrata Landfill in Grant County and Okanogan Central Landfill and Ellisforde Transfer Station in Okanogan County). The crew supervisor verified information about each selected vehicle and verified that the load was needed to meet each day’s sampling quotas. The waste loads were then tipped, and samples of waste weighing an average of 232 pounds were selected from within each load using a process that ensured random selection of a portion of the tipped pile. The samples were sorted into 91 material categories (belonging to 10 main material classes), and the material in each category was weighed for each sample. The material weights and other information associated with each sample were recorded on paper field forms. Data also was collected from each facility to estimate the tonnage associated with each of the waste sources shown in Table 1, above. In Okanogan County, this information was provided by the Okanogan County Department of Public Works based on their records of usage of the County’s drop boxes. In Grant County, this information was collected through a survey of vehicle drivers that was designed by Cascadia and implemented by County staff.
3.2.3 CALCULATION PROCEDURES The general approach to developing the waste composition estimates included in this report was to calculate the percent composition of each material in the landfilled waste stream in each of the two counties for each source of waste described in Table 1, above. Results for the sources of waste also were aggregated using a weighted averaging technique to develop composition and quantity estimates for all landfilled waste disposed in each county. All composition estimates presented in this section of the report were calculated at a 90% confidence level. (Please see Appendix B for more detail.) Tonnage data collected or provided by the two counties reflected the calendar year 2002. In addition, wherever possible, the tonnage estimates developed for individual agricultural and industrial sites (data from which was included in the county-specific analysis) was calculated specifically to reflect material sent to landfills during 2002.
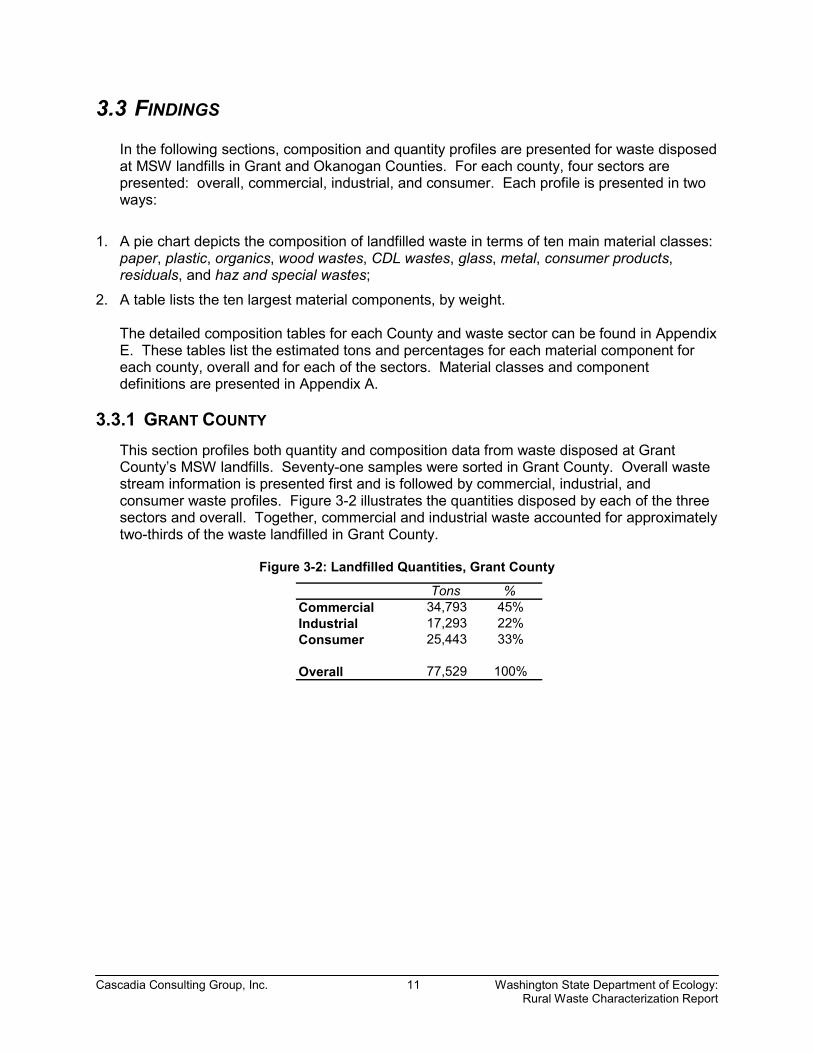
Cascadia Consulting Group, Inc. 11 Washington State Department of Ecology: Rural Waste Characterization Report
3.3 FINDINGS In the following sections, composition and quantity profiles are presented for waste disposed at MSW landfills in Grant and Okanogan Counties. For each county, four sectors are presented: overall, commercial, industrial, and consumer. Each profile is presented in two ways:
1. A pie chart depicts the composition of landfilled waste in terms of ten main material classes: paper, plastic, organics, wood wastes, CDL wastes, glass, metal, consumer products, residuals, and haz and special wastes;
2. A table lists the ten largest material components, by weight. The detailed composition tables for each County and waste sector can be found in Appendix E. These tables list the estimated tons and percentages for each material component for each county, overall and for each of the sectors. Material classes and component definitions are presented in Appendix A.
3.3.1 GRANT COUNTY This section profiles both quantity and composition data from waste disposed at Grant County’s MSW landfills. Seventy-one samples were sorted in Grant County. Overall waste stream information is presented first and is followed by commercial, industrial, and consumer waste profiles. Figure 3-2 illustrates the quantities disposed by each of the three sectors and overall. Together, commercial and industrial waste accounted for approximately two-thirds of the waste landfilled in Grant County.
Figure 3-2: Landfilled Quantities, Grant County
Tons %Commercial 34,793 45%Industrial 17,293 22%Consumer 25,443 33%
Overall 77,529 100%

Cascadia Consulting Group, Inc. 12 Washington State Department of Ecology: Rural Waste Characterization Report
3.3.1.1 OVERALL WASTE Figure 3-3 summarizes the composition of overall landfilled waste for Grant County by the ten main material classes. Organics and paper together make up nearly half of the overall waste. Plastic, residuals, consumer products, metals, and wood wastes each account for about 10% of the total.
Figure 3-3: Composition Summary for Landfilled Waste – Grant County, Overall
Plastic10.8%
Paper19.4%
Wood Wastes8.6%
Organics26.1%
CDL Wastes3.7%
Glass3.1%
Metal8.6%
Consumer Products
8.8%
Residuals10.5%
Haz and Special Wastes0.4%
The ten largest components, listed in Figure 3-4, together account for about 63% of the overall waste stream. Food waste is the largest single component; it accounts for roughly 17%. About 10% of the waste is comprised of sludge and other industrial waste. Yard and garden prunings, dimensional lumber, and plastic film and bags each compose about 5% of the waste.
Figure 3-4: Top Ten Components in Landfilled Waste – Grant County, Overall
Component Mean Cum. % TonsFood Waste 17.3% 17.3% 13,406 Sludge and Other Industrial 9.8% 27.1% 7,573 Yard Garden and Prunings 5.2% 32.2% 4,014 Dimensional Lumber 5.1% 37.3% 3,956 Plastic Film and Bags 5.1% 42.4% 3,933 Mixed/Low-grade Paper 4.3% 46.7% 3,358 Compostable Paper 4.3% 51.0% 3,307 Other Ferrous Metals 4.1% 55.1% 3,197 Cardboard 3.8% 59.0% 2,979 Tires and Other Rubber 3.7% 62.7% 2,885
Total 62.7% 48,608
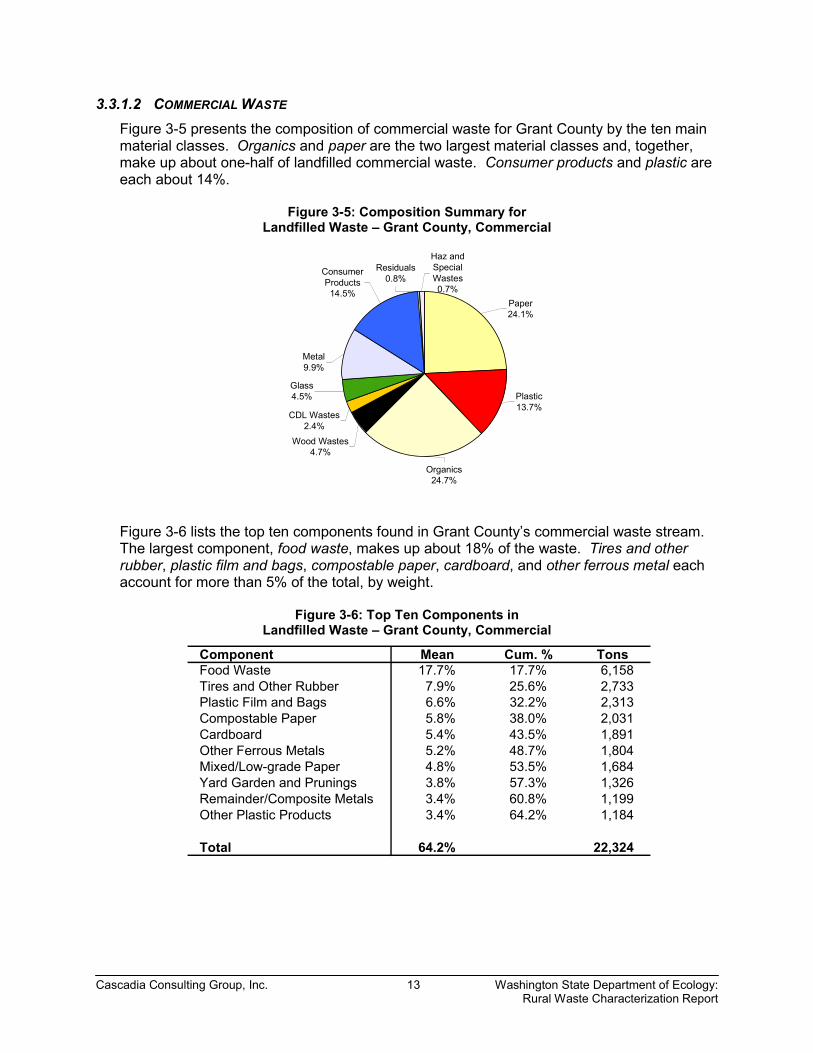
Cascadia Consulting Group, Inc. 13 Washington State Department of Ecology: Rural Waste Characterization Report
3.3.1.2 COMMERCIAL WASTE Figure 3-5 presents the composition of commercial waste for Grant County by the ten main material classes. Organics and paper are the two largest material classes and, together, make up about one-half of landfilled commercial waste. Consumer products and plastic are each about 14%.
Figure 3-5: Composition Summary for Landfilled Waste – Grant County, Commercial
Plastic13.7%
Paper24.1%
Wood Wastes4.7%
Organics24.7%
CDL Wastes2.4%
Glass4.5%
Metal9.9%
Consumer Products
14.5%
Residuals0.8%
Haz and Special Wastes0.7%
Figure 3-6 lists the top ten components found in Grant County’s commercial waste stream. The largest component, food waste, makes up about 18% of the waste. Tires and other rubber, plastic film and bags, compostable paper, cardboard, and other ferrous metal each account for more than 5% of the total, by weight.
Figure 3-6: Top Ten Components in Landfilled Waste – Grant County, Commercial
Component Mean Cum. % TonsFood Waste 17.7% 17.7% 6,158 Tires and Other Rubber 7.9% 25.6% 2,733 Plastic Film and Bags 6.6% 32.2% 2,313 Compostable Paper 5.8% 38.0% 2,031 Cardboard 5.4% 43.5% 1,891 Other Ferrous Metals 5.2% 48.7% 1,804 Mixed/Low-grade Paper 4.8% 53.5% 1,684 Yard Garden and Prunings 3.8% 57.3% 1,326 Remainder/Composite Metals 3.4% 60.8% 1,199 Other Plastic Products 3.4% 64.2% 1,184
Total 64.2% 22,324

Cascadia Consulting Group, Inc. 14 Washington State Department of Ecology: Rural Waste Characterization Report
3.3.1.3 INDUSTRIAL WASTE Residuals account for nearly half of landfilled industrial waste, as shown in Figure 3-7. Wood wastes and paper together make up about one-third of the total. Plastic and organics are each more than 5%. The residuals main material class includes the components ash, dust, fines/sorting residues, and sludges and other special industrial wastes.
Figure 3-7: Composition Summary for Landfilled Waste – Grant County, Industrial
Haz and Special Wastes0.2%
Residuals44.4%
Consumer Products
2.2% Metal3.9%
Glass1.1%
CDL Wastes3.5%
Organics5.6%
Wood Wastes20.3%
Paper12.3%
Plastic6.5%
Sludge and other industrial waste is the largest single item of the landfilled industrial waste stream, accounting for nearly 44% of the total. Dimensional lumber makes up about 15%. The top ten components for industrial waste are listed in Figure 3-8.
Figure 3-8: Top Ten Components in Landfilled Waste – Grant County, Industrial
Component Mean Cum. % TonsSludge and Other Industrial 43.8% 43.8% 7,573 Dimensional Lumber 14.9% 58.7% 2,579 Food Waste 4.1% 62.8% 704 Plastic Film and Bags 3.8% 66.6% 659 Remainder/Composite Paper 3.8% 70.4% 658 Wood Packaging 2.9% 73.3% 508 Cardboard 2.2% 75.6% 386 Other Ferrous Metals 2.2% 77.7% 377 Mixed/Low-grade Paper 2.0% 79.8% 351 High-grade Paper 1.4% 81.2% 248
Total 81.2% 14,044

Cascadia Consulting Group, Inc. 15 Washington State Department of Ecology: Rural Waste Characterization Report
3.3.1.4 CONSUMER WASTE Over 40% of Grant County’s landfilled consumer waste, as shown in Figure 3-9, is composed of organics. Another 20% is made up of paper.
Figure 3-9: Composition Summary for Landfilled Waste – Grant County, Consumer
Haz and Special Wastes0.1%
Residuals0.8%
Consumer Products
5.4%Metal9.9%
Glass2.6%
CDL Wastes5.8%
Organics42.0%
Wood Wastes5.9%
Paper17.9%
Plastic9.7%
As shown in Figure 3-10, food waste is the largest component, making up about one-quarter of the landfilled consumer waste stream for Grant County, and yard, garden and prunings is about 10%. The top ten materials account for nearly 68% of the total, by weight.
Figure 3-10: Top Ten Components in Landfilled Waste – Grant County, Consumer
Component Mean Cum. % TonsFood Waste 25.7% 25.7% 6,544 Yard Garden and Prunings 10.0% 35.7% 2,540 Mixed/Low-grade Paper 5.2% 40.9% 1,323 Disposable Diapers 5.1% 46.0% 1,302 Compostable Paper 4.2% 50.2% 1,069 Other Ferrous Metals 4.0% 54.2% 1,016 Plastic Film and Bags 3.8% 58.0% 961 Remainder/Composite Metals 3.4% 61.4% 872 Dimensional Lumber 3.4% 64.8% 864 Cardboard 2.8% 67.6% 703
Total 67.6% 17,193

Cascadia Consulting Group, Inc. 16 Washington State Department of Ecology: Rural Waste Characterization Report
3.3.2 OKANOGAN COUNTY This section profiles both quantity and composition data for waste disposed at MSW landfills in Okanogan County. A total of 46 samples were captured and sorted. Overall waste stream information is presented first and is followed by commercial, industrial, and consumer waste profiles. As shown in Figure 3-11, each sector accounts for approximately one-third of Okanogan County’s overall waste stream.
Figure 3-11: Landfilled Quantities, Okanogan County
Tons %Commercial 7,924 35%Industrial 7,350 33%Consumer 7,320 32%
Overall 22,594 100%

Cascadia Consulting Group, Inc. 17 Washington State Department of Ecology: Rural Waste Characterization Report
3.3.2.1 OVERALL WASTE Figure 3-12 shows the relative proportions of the main material classes in the waste landfilled in Okanogan County. The two largest material classes, paper and organics, account for 28% and 24%, respectively. Plastic is about 12% of the total.
Figure 3-12: Composition Summary for Landfilled Waste – Okanogan County, Overall
Plastic12.0%
Paper27.7%
Wood Wastes6.6% Organics
23.5%
CDL Wastes4.1%
Glass6.1%
Metal9.8%
Consumer Products
5.0%
Residuals3.5%
Haz and Special Wastes1.7%
The top ten material components are listed in Figure 3-13 for Okanogan County’s overall disposed waste stream. Food waste is the largest single component, accounting for about 16% of the total, by weight. Compostable paper, mixed/low-grade paper, cardboard, and yard garden and prunings each make up 5% or more of the waste stream. The ten largest materials account for almost 60% of the tonnage of Okanogan’s overall waste stream.
Figure 3-13: Top Ten Components in Landfilled Waste – Okanogan County, Overall
Component Mean Cum. % TonsFood Waste 15.7% 15.7% 3,557 Compostable Paper 6.9% 22.7% 1,569 Mixed/Low-grade Paper 6.2% 28.9% 1,402 Cardboard 5.8% 34.7% 1,306 Yard Garden and Prunings 5.0% 39.7% 1,135 Plastic Film and Bags 4.8% 44.5% 1,084 Remainder/Composite Metals 4.5% 49.0% 1,026 Dimensional Lumber 4.5% 53.6% 1,024 Fines/Sorting Residues 2.8% 56.4% 641 Other Ferrous Metals 2.5% 58.9% 573
Total 58.9% 13,317
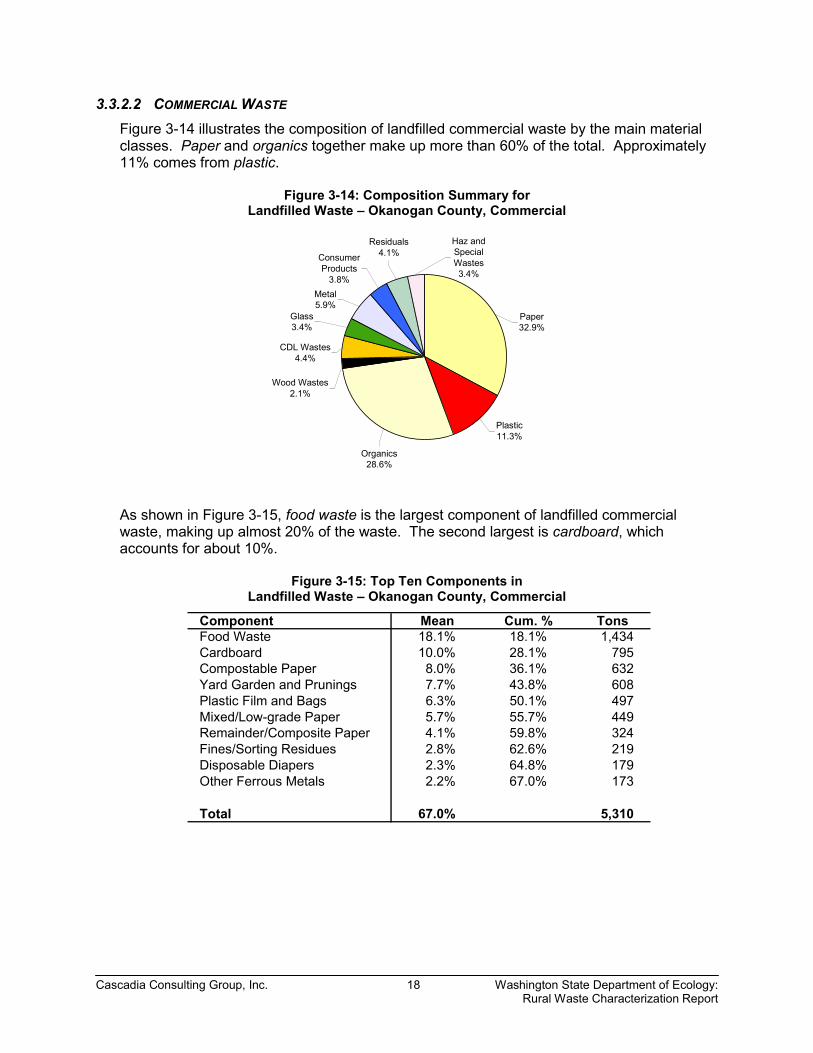
Cascadia Consulting Group, Inc. 18 Washington State Department of Ecology: Rural Waste Characterization Report
3.3.2.2 COMMERCIAL WASTE Figure 3-14 illustrates the composition of landfilled commercial waste by the main material classes. Paper and organics together make up more than 60% of the total. Approximately 11% comes from plastic.
Figure 3-14: Composition Summary for Landfilled Waste – Okanogan County, Commercial
Plastic11.3%
Paper32.9%
Wood Wastes2.1%
Organics28.6%
CDL Wastes4.4%
Glass3.4%
Metal5.9%
Consumer Products
3.8%
Residuals4.1%
Haz and Special Wastes3.4%
As shown in Figure 3-15, food waste is the largest component of landfilled commercial waste, making up almost 20% of the waste. The second largest is cardboard, which accounts for about 10%.
Figure 3-15: Top Ten Components in Landfilled Waste – Okanogan County, Commercial
Component Mean Cum. % TonsFood Waste 18.1% 18.1% 1,434 Cardboard 10.0% 28.1% 795 Compostable Paper 8.0% 36.1% 632 Yard Garden and Prunings 7.7% 43.8% 608 Plastic Film and Bags 6.3% 50.1% 497 Mixed/Low-grade Paper 5.7% 55.7% 449 Remainder/Composite Paper 4.1% 59.8% 324 Fines/Sorting Residues 2.8% 62.6% 219 Disposable Diapers 2.3% 64.8% 179 Other Ferrous Metals 2.2% 67.0% 173
Total 67.0% 5,310
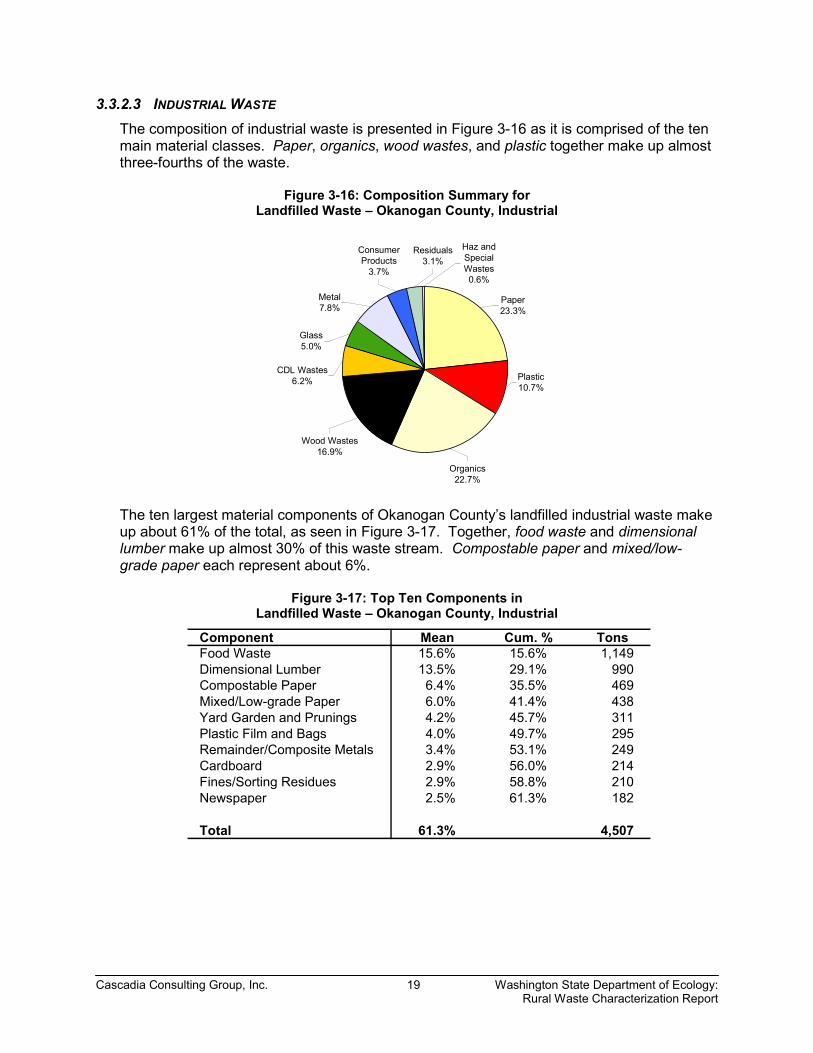
Cascadia Consulting Group, Inc. 19 Washington State Department of Ecology: Rural Waste Characterization Report
3.3.2.3 INDUSTRIAL WASTE The composition of industrial waste is presented in Figure 3-16 as it is comprised of the ten main material classes. Paper, organics, wood wastes, and plastic together make up almost three-fourths of the waste.
Figure 3-16: Composition Summary for Landfilled Waste – Okanogan County, Industrial
Plastic10.7%
Paper23.3%
Wood Wastes16.9%
Organics22.7%
CDL Wastes6.2%
Glass5.0%
Metal7.8%
Consumer Products
3.7%
Residuals3.1%
Haz and Special Wastes0.6%
The ten largest material components of Okanogan County’s landfilled industrial waste make up about 61% of the total, as seen in Figure 3-17. Together, food waste and dimensional lumber make up almost 30% of this waste stream. Compostable paper and mixed/low-grade paper each represent about 6%.
Figure 3-17: Top Ten Components in Landfilled Waste – Okanogan County, Industrial
Component Mean Cum. % TonsFood Waste 15.6% 15.6% 1,149 Dimensional Lumber 13.5% 29.1% 990 Compostable Paper 6.4% 35.5% 469 Mixed/Low-grade Paper 6.0% 41.4% 438 Yard Garden and Prunings 4.2% 45.7% 311 Plastic Film and Bags 4.0% 49.7% 295 Remainder/Composite Metals 3.4% 53.1% 249 Cardboard 2.9% 56.0% 214 Fines/Sorting Residues 2.9% 58.8% 210 Newspaper 2.5% 61.3% 182
Total 61.3% 4,507

Cascadia Consulting Group, Inc. 20 Washington State Department of Ecology: Rural Waste Characterization Report
3.3.2.4 CONSUMER WASTE Figure 3-18 shows the percentages of the main material classes that make up the overall consumer waste stream. Paper, at about 27%, is the largest main material class. Together, organics, metal, and plastic make up about half of the total, by weight. Glass and consumer products account for about 10% and 8%, respectively.
Figure 3-18: Composition Summary for Landfilled Waste – Okanogan County, Consumer
Plastic14.0%
Paper26.6%
Wood Wastes1.2%
Organics18.8%
CDL Wastes1.6%
Glass10.1%
Metal16.0%
Consumer Products
7.6%
Residuals3.1%
Haz and Special Wastes0.9%
As presented in Figure 3-19, the top ten materials in the consumer waste stream account for almost 60% of the total. The largest component, food waste, makes up about 13%. Remainder/composite metals, mixed/low-grade paper, compostable paper, and clear glass container each account for more than 5% of the total, by weight.
Figure 3-19: Top Ten Components in Landfilled Waste – Okanogan County, Consumer
Component Mean Cum. % TonsFood Waste 13.3% 13.3% 974 Remainder/Composite Metals 9.2% 22.5% 673 Mixed/Low-grade Paper 7.0% 29.5% 514 Compostable Paper 6.4% 35.9% 468 Clear Glass Container 5.3% 41.3% 391 Cardboard 4.1% 45.3% 297 Plastic Film and Bags 4.0% 49.3% 292 Other Ferrous Metals 3.5% 52.8% 258 Magazines 3.3% 56.1% 239 Yard Garden and Prunings 3.0% 59.1% 217
Total 59.1% 4,323

Cascadia Consulting Group, Inc. 21 Washington State Department of Ecology: Rural Waste Characterization Report
4. STATEWIDE WASTE GENERATION
ESTIMATES FOR SELECTED RURAL-BASED
INDUSTRY GROUPS
4.1 INTRODUCTION In addition to characterizing waste sent to landfills in Grant and Okanogan Counties, this study examined waste generated by industries and agricultural businesses that are typical of rural Washington counties. This generator-based portion of the study included, but was not limited to, waste sent to landfills. The study endeavored to quantify and characterize all types of waste disposed, recycled, or reused through all means for each of nine industrial and agricultural groups. Data was collected by visiting selected locations belonging to each of the nine groups and quantifying and characterizing each type of waste that was observed. Locations in Grant, Okanogan, and Clallam Counties were visited. Data from the participating businesses in those counties were used to extrapolate statewide quantity and composition estimates for waste generated by rural industries and agricultural activities. The industrial and agricultural groups that were examined are defined in the following table. Group SIC Codes Description Field Crops 0111 through 0161 Includes growers of wheat, barley, oats,
potatoes, corn for grain or silage, hay, and herbs.
Orchards 0174 and 0175 Includes growers of tree fruits, such as apples, pears, and cherries.
Vegetables 0161 Includes growers of asparagus, onions, green peas, and sweet corn.
Livestock 0211 through 0291 Includes businesses that raise animals such as cattle, sheep, hogs, and horses.
Mining 1041 through 1459 Includes mining companies and related services.C&D 1521 through 1799 Includes construction and demolition contractors
and related services. Paper 2653 through 2676 Includes manufacturers of paper and allied
products. Logging & Primary Wood Products
2411 through 2621 Includes businesses involved in logging, lumber, & primary wood products, such as logging companies, sawmills, cabinetmakers, and particleboard plants.
Food Processing 2011 through 2099 Includes manufacturers of food and kindred products.

Cascadia Consulting Group, Inc. 22 Washington State Department of Ecology: Rural Waste Characterization Report
For each industry group, quantity and composition estimates were developed for the following types of disposal:
• waste sent to landfill, which includes waste that is disposed in permitted solid waste disposal facilities.
• waste put to beneficial use, including materials that are recycled, reused, or incorporated into another manufacturing or agricultural process, and it includes any material that is used for some beneficial purpose.
• waste disposed in other ways, which is defined as any waste disposed under conditions not described above. This typically means material that is left on the ground for no beneficial purpose.
4.2 OVERVIEW OF METHODOLOGY
For most of the industry groups studied, the data collection methodology consisted of the phases and steps described below. Recruitment of participants
• First, the industry groups were defined, and the number of samples that could be afforded by the study (159 samples in total) were apportioned to the groups within each county.
• Second, the consultant created a list of all businesses belonging to each industry group in each county. In most cases, the lists were obtained from Dun and Bradstreet, a national provider of mailing and marketing lists.
• Third, each list was placed in random order, and businesses were contacted by going down the list and calling by telephone. Businesses were asked to participate in the study on an anonymous basis.
Collection of data
• Each participating business was visited, and the management at the business was interviewed in order to ensure that the data collection team could obtain and characterize representative samples of waste and could quantify each type of waste produced by the business.
• Measurements were taken and estimates of waste quantity were constructed based on observed amounts of waste corresponding to an elapsed time of waste generation. This produced estimates of waste generation rates for each type of waste at each business. Data also were collected to reflect the number of acres, animals, or employees associated with each type of waste at each business.
• The estimated waste generation rates were expressed in terms of tons per acre per year, tons per animal per year, or tons per employee per year.
• Samples of each type of waste at each business were characterized, either by visual inspection or by hand sorting, using a standardized list of 91 materials that are defined in Appendix A.

Cascadia Consulting Group, Inc. 23 Washington State Department of Ecology: Rural Waste Characterization Report
Figure 4-1: Overall Targeted versus Actual Generator-based Samples Collected by Industry Group
Overall OverallTarget Actual
Industrial 150-180 159
Field Crops 16 20
Orchards 16 23
Vegetables 16 9
Livestock 16 18
Mining 16 21
C&D 16 22
Paper & Allied Products 16 18
Logging & Primary Wood Products 16 10
Food & Kindred Products 16 18 Analysis
• First, the total annual quantity of each individual waste material (e.g., corrugated cardboard, tin cans, etc.) sent to each destination (i.e., landfill, beneficial use, or other disposal) was calculated for the participants in each industry group. For example, this resulted in estimates of the total pounds of cardboard sent to landfill by participating vegetable farmers, and the total pounds of tin cans sent to landfill by the same farmers, etc.
• Next, the total number of acres, animals, or employees was calculated for participants in each industry group.
• Then, for each industry group, waste destination, and waste material, a figure was calculated to reflect annual tons disposed per acre, animal, or employee.
• Finally, the statewide numbers of acres, animals, or employees corresponding to each industry group were used to extrapolate the tons of each material sent to each destination by each industry.
A slightly different analytical method was used to extrapolate the amount of waste disposed by the Construction and Demolition industry group.
• Based on vehicle surveys conducted at landfills (in Grant and Okanogan Counties) and on C&D disposal reported by the landfill (in Clallam County), a figure was calculated for total annual tonnage of C&D waste disposed at landfills in each county. These figures were added together and divided by the total 2002 construction wages in the three counties, producing a figure for average landfilled tons of C&D waste per dollar of construction wages.
• The average figure was then used to extrapolate statewide landfilling of C&D waste based on statewide construction and demolition wages.
Cascadia Consulting Group, Inc. 24 Washington State Department of Ecology: Rural Waste Characterization Report
• Construction and demolition sites were visited in Clallam County, and annual figures for beneficial use and other disposal of waste were calculated for the visited sites on a per-permit-dollar basis. The results were extrapolated for all of Clallam County, and then were expressed in terms of tons of waste per construction and demolition wage dollar. The results were then extrapolated statewide.
In the section below, findings from the analysis are expressed for each industry group, in terms of statewide annual tons and composition of waste sent to each destination.
4.3 FINDINGS This section summarizes the findings from the characterization of waste from the nine industry groups. First, a chart summarizes how waste from each industry group is disposed, either through landfilling, other disposal, or beneficial use. Second, a pie chart shows the percentages of each of the ten main material classes: paper, plastic, organics, wood wastes, CDL wastes, glass, metal, consumer products, residuals, and haz and special wastes. Next, tables display the five largest components for each of the three disposal methods: landfilling, other disposal, and beneficial use. The detailed composition tables for each industry group can be found in Appendix F. These tables list estimated tons and percentages for each material component for total waste generated by each industry group. Material classes and component definitions are presented in Appendix A. Since this study allocated relatively few site visits and waste samples to each of the nine industry groups, the statewide estimates of waste quantities are best seen as order-of-magnitude estimates rather than precise projections of statewide disposal.
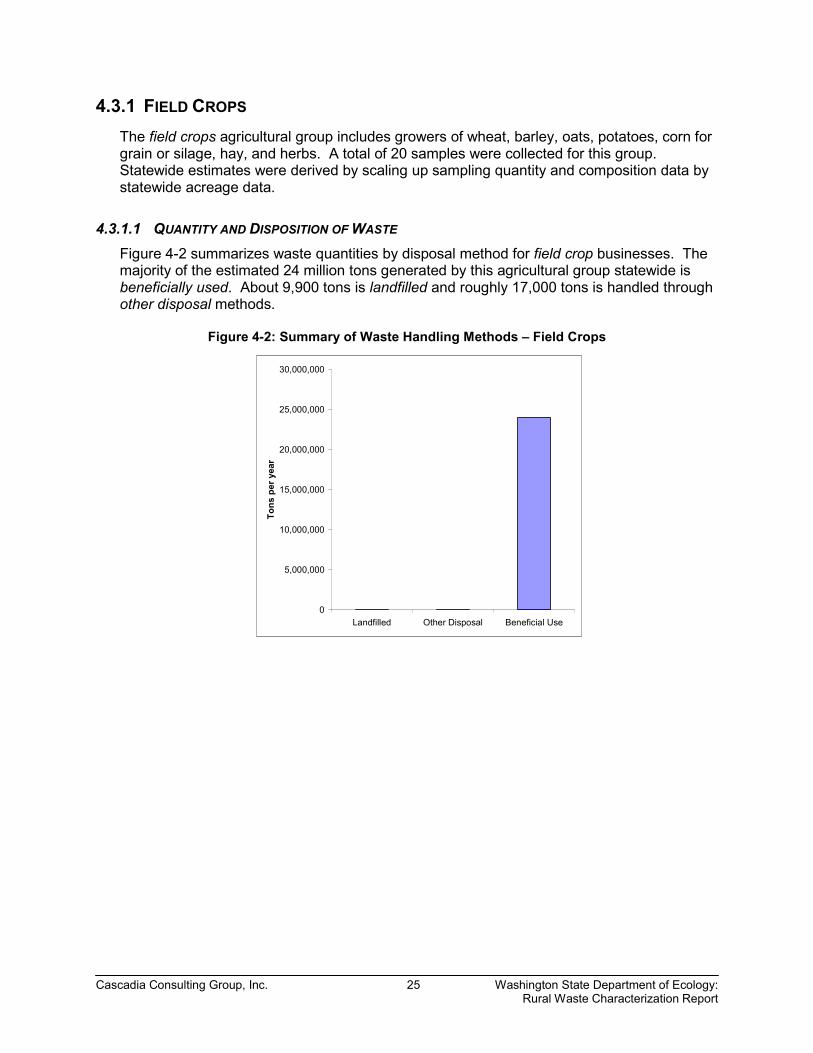
Cascadia Consulting Group, Inc. 25 Washington State Department of Ecology: Rural Waste Characterization Report
4.3.1 FIELD CROPS The field crops agricultural group includes growers of wheat, barley, oats, potatoes, corn for grain or silage, hay, and herbs. A total of 20 samples were collected for this group. Statewide estimates were derived by scaling up sampling quantity and composition data by statewide acreage data.
4.3.1.1 QUANTITY AND DISPOSITION OF WASTE Figure 4-2 summarizes waste quantities by disposal method for field crop businesses. The majority of the estimated 24 million tons generated by this agricultural group statewide is beneficially used. About 9,900 tons is landfilled and roughly 17,000 tons is handled through other disposal methods.
Figure 4-2: Summary of Waste Handling Methods – Field Crops
0
5,000,000
10,000,000
15,000,000
20,000,000
25,000,000
30,000,000
Landfilled Other Disposal Beneficial Use
Tons
per
yea
r

Cascadia Consulting Group, Inc. 26 Washington State Department of Ecology: Rural Waste Characterization Report
4.3.1.2 OVERALL COMPOSITION The percentages of each broad waste class disposed by field crop businesses are shown in Figure 4-3. At over 99%, organics makes up the bulk of the waste stream. The other nine main material classes account for less than 1% of the waste.
Figure 4-3: Composition Summary – Field Crops
Organics99.87%
Other*0.13%
*"Other" is comprised of material categories that account for less than 1.0% of the total, including Paper , Plastic , Metal , Glass, Wood Wastes , Consumer Products , CDL , and Hazardous Waste .
4.3.1.3 LANDFILLED As shown in Figure 4-4, the five largest components together account for approximately 81% of the landfilled waste for field crop businesses. Food waste, the largest component, accounts for about 20% of the total. The landfilled portion of waste for this agricultural group includes a large amount of household waste as many farms have homes at the same site.
Figure 4-4: Top Five Components – Landfilled
Component Mean Cum. % TonsFood Waste 18.52% 18.52% 1,827Compostable Paper 7.71% 26.23% 761Mixed/Low-grade Paper 7.00% 33.23% 690Cardboard 5.65% 38.88% 557Yard, Garden and Prunings 5.08% 43.96% 501
Total 43.96% 4,336
4.3.1.4 OTHER DISPOSAL Two materials were reported by this industry group as being disposed through other methods: synthetic textiles and cardboard. Used twine from bales of hay and used cardboard are typically burned.

Cascadia Consulting Group, Inc. 27 Washington State Department of Ecology: Rural Waste Characterization Report
4.3.1.5 BENEFICIAL USE Figure 4-5 summarizes the top five components that are beneficially used by field crops businesses as estimated from locations visited during this study. Almost 99% of the beneficially used waste is crop residues. These are primarily left in the fields to return nutrients to the soil. Food waste beneficially used from this industry group includes food waste materials from packing houses that are sent to other companies for processing. The other three components in Figure 4-5 are recycled.
Figure 4-5: Top Five Components – Beneficial Use
Component Mean Cum. % TonsCrop Residues 99.32% 99.32% 23,905,027Food Waste 0.65% 99.97% 156,322Other Ferrous Metal 0.02% 99.99% 5,865White Goods 0.00% 100.00% 1,130Tires and Other Rubber 0.00% 100.00% 640
Total 100.00% 24,068,984
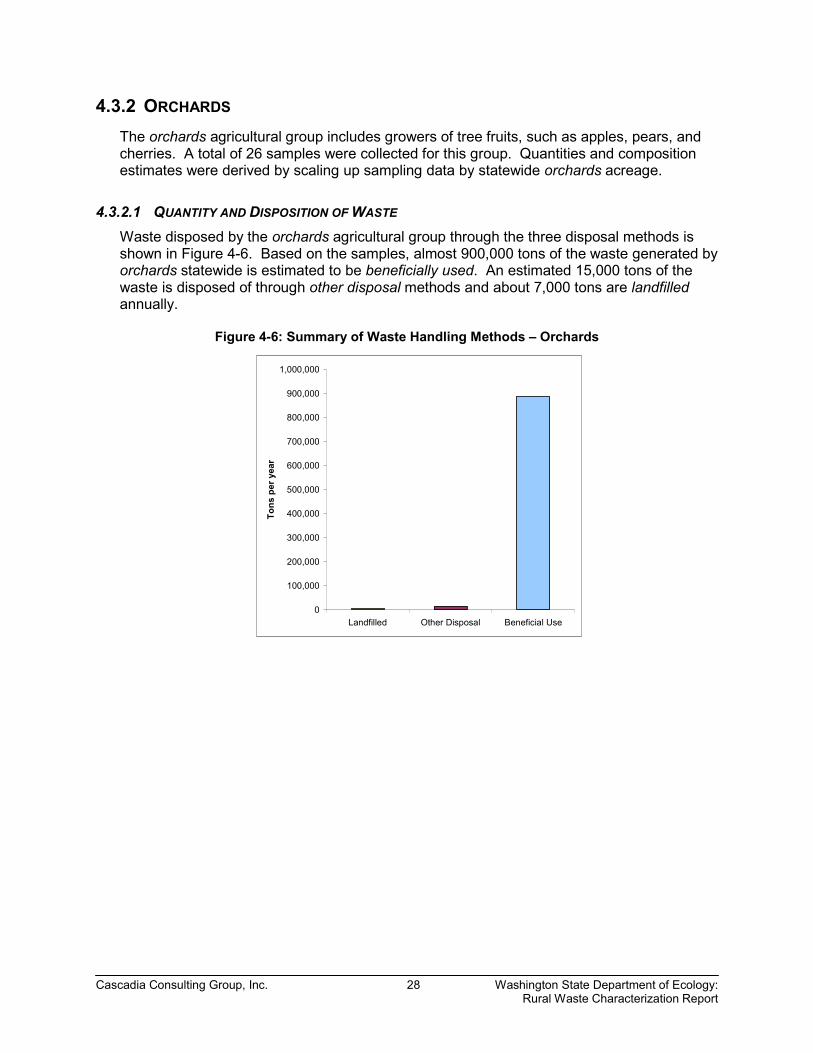
Cascadia Consulting Group, Inc. 28 Washington State Department of Ecology: Rural Waste Characterization Report
4.3.2 ORCHARDS The orchards agricultural group includes growers of tree fruits, such as apples, pears, and cherries. A total of 26 samples were collected for this group. Quantities and composition estimates were derived by scaling up sampling data by statewide orchards acreage.
4.3.2.1 QUANTITY AND DISPOSITION OF WASTE Waste disposed by the orchards agricultural group through the three disposal methods is shown in Figure 4-6. Based on the samples, almost 900,000 tons of the waste generated by orchards statewide is estimated to be beneficially used. An estimated 15,000 tons of the waste is disposed of through other disposal methods and about 7,000 tons are landfilled annually.
Figure 4-6: Summary of Waste Handling Methods – Orchards
0
100,000
200,000
300,000
400,000
500,000
600,000
700,000
800,000
900,000
1,000,000
Landfilled Other Disposal Beneficial Use
Tons
per
yea
r

Cascadia Consulting Group, Inc. 29 Washington State Department of Ecology: Rural Waste Characterization Report
4.3.2.2 OVERALL COMPOSITION Organics is the largest main material class of this agricultural group’s waste (Figure 4-7). Residuals represents about 1% of the waste and may include ash, dust and fines/sorting residues.
Figure 4-7: Composition Summary - Orchards Other*1.05%
Organics97.62%
Residuals1.33%
*"Other" is comprised of material categories that account for less than 1.0% of the total, including Paper , Plastic , Metal , Glass, Wood Wastes , Consumer Products , CDL , and Hazardous Waste .
4.3.2.3 LANDFILLED
The largest five material components of the landfilled waste for the orchards agricultural group are shown in Figure 4-8. Food waste, the largest single component, makes up about 20% of the waste. As with field crops, much of the waste landfilled by orchards is household waste.
Figure 4-8: Top Five Components – Landfilled
Component Mean Cum. % TonsFood Waste 20.06% 20.06% 1,320Mixed/Low-grade Paper 7.10% 27.16% 467Compostable Paper 7.02% 34.18% 462Plastic Film and Bags 6.38% 40.57% 420Yard, Garden and Prunings 4.73% 45.30% 311
Total 45.30% 2,981

Cascadia Consulting Group, Inc. 30 Washington State Department of Ecology: Rural Waste Characterization Report
4.3.2.4 OTHER DISPOSAL Figure 4-9 shows the top five components disposed of through other disposal for orchards. Ash, from burning fruit trees, is the largest component, accounting for more than 78% of the total, by weight. Tree removal generates piles of yard, garden and prunings that make up about 20% of the total waste disposed of through other disposal. Construction activities created the other three largest material components; these are typically stockpiled on-site.
Figure 4-9: Top Five Components – Other Disposal
Component Mean Cum. % TonsAsh 78.09% 78.09% 11,918Yard, Garden and Prunings 21.73% 99.83% 3,317Wood Packaging 0.10% 99.93% 15Drywall 0.05% 99.97% 7Engineered Wood 0.01% 99.99% 2
Total 99.99% 15,259
4.3.2.5 BENEFICIAL USE Figure 4-10 shows the top five components of orchards waste that is beneficially used. The largest component, crop residues, makes up nearly 80% of the beneficially used waste generated by orchards statewide. The next largest material component is yard, garden, and prunings, which accounts for nearly 20%. Crop residues and yard, garden and prunings are left in the orchards as mulch. The white goods include appliances that are recycled from households that are located in the orchards. Food waste comes from fruit packing houses and is transferred to other companies for processing. Tires and other rubber from orchards (and other agricultural groups) are from farming equipment and are recycled.
Figure 4-10: Top Five Components – Beneficial Use
Component Mean Cum. % TonsCrop Residues 79.34% 79.34% 705,854Yard, Garden and Prunings 19.90% 99.23% 177,004White Goods 0.22% 99.46% 2,001Food Waste 0.19% 99.65% 1,729Tires and Other Rubber 0.17% 99.82% 1,487
Total 99.82% 888,076
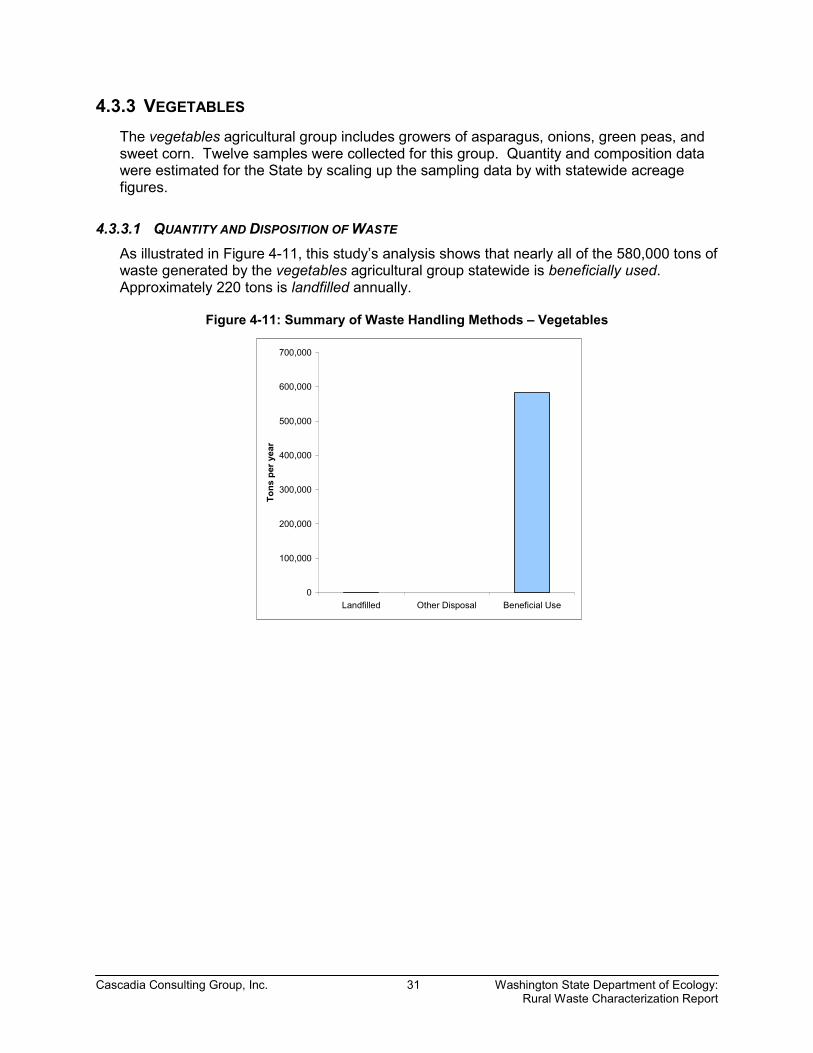
Cascadia Consulting Group, Inc. 31 Washington State Department of Ecology: Rural Waste Characterization Report
4.3.3 VEGETABLES The vegetables agricultural group includes growers of asparagus, onions, green peas, and sweet corn. Twelve samples were collected for this group. Quantity and composition data were estimated for the State by scaling up the sampling data by with statewide acreage figures.
4.3.3.1 QUANTITY AND DISPOSITION OF WASTE As illustrated in Figure 4-11, this study’s analysis shows that nearly all of the 580,000 tons of waste generated by the vegetables agricultural group statewide is beneficially used. Approximately 220 tons is landfilled annually.
Figure 4-11: Summary of Waste Handling Methods – Vegetables
0
100,000
200,000
300,000
400,000
500,000
600,000
700,000
Landfilled Other Disposal Beneficial Use
Tons
per
yea
r
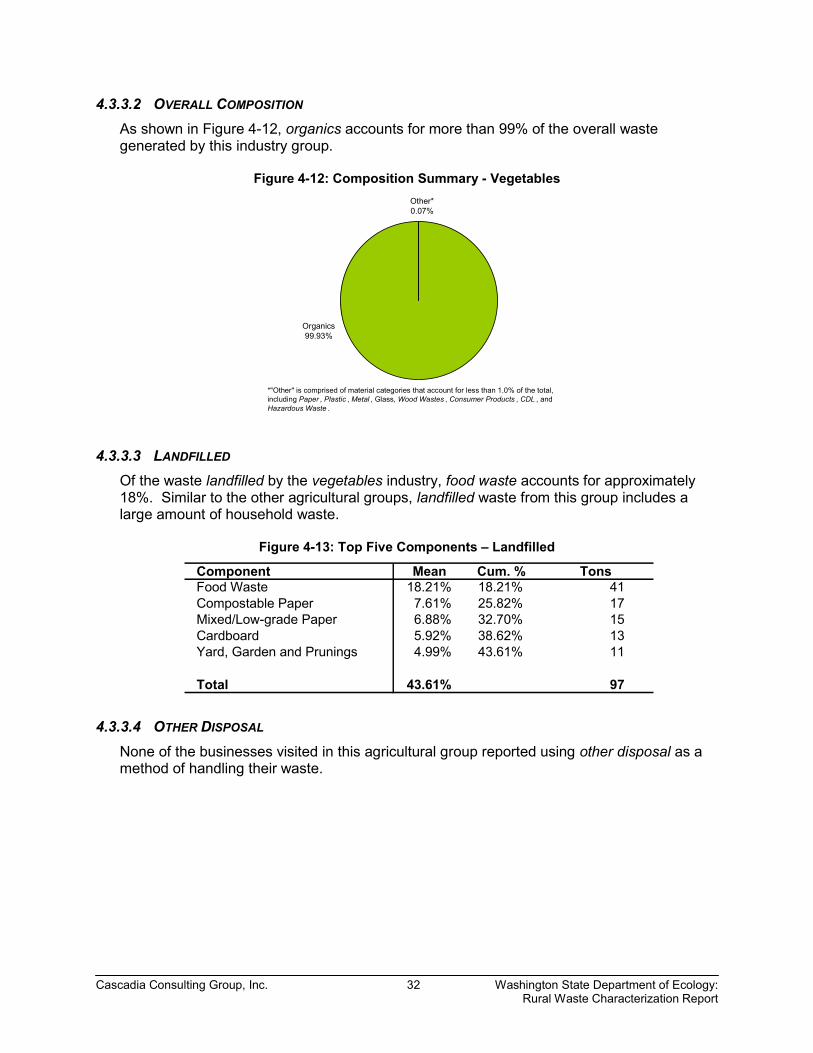
Cascadia Consulting Group, Inc. 32 Washington State Department of Ecology: Rural Waste Characterization Report
4.3.3.2 OVERALL COMPOSITION As shown in Figure 4-12, organics accounts for more than 99% of the overall waste generated by this industry group.
Figure 4-12: Composition Summary - Vegetables Other*0.07%
Organics99.93%
*"Other" is comprised of material categories that account for less than 1.0% of the total, including Paper , Plastic , Metal , Glass, Wood Wastes , Consumer Products , CDL , and Hazardous Waste .
4.3.3.3 LANDFILLED Of the waste landfilled by the vegetables industry, food waste accounts for approximately 18%. Similar to the other agricultural groups, landfilled waste from this group includes a large amount of household waste.
Figure 4-13: Top Five Components – Landfilled
Component Mean Cum. % TonsFood Waste 18.21% 18.21% 41Compostable Paper 7.61% 25.82% 17Mixed/Low-grade Paper 6.88% 32.70% 15Cardboard 5.92% 38.62% 13Yard, Garden and Prunings 4.99% 43.61% 11
Total 43.61% 97
4.3.3.4 OTHER DISPOSAL None of the businesses visited in this agricultural group reported using other disposal as a method of handling their waste.

Cascadia Consulting Group, Inc. 33 Washington State Department of Ecology: Rural Waste Characterization Report
4.3.3.5 BENEFICIAL USE As seen in Figure 4-14, crop residues account for more than 99% of waste that is estimated to be beneficially used. The other top five materials that are beneficially used, other ferrous metal, white goods, tires and other rubber, and colored HDPE bottles from pesticides, are recycled.
Figure 4-14: Top Five Components – Beneficial Use
Component Mean Cum. % TonsCrop Residues 99.96% 99.96% 583,235Other Ferrous Metal 0.03% 99.99% 151White Goods 0.01% 99.99% 30Tires and Other Rubber 0.00% 100.00% 21HDPE Bottles, Colored 0.00% 100.00% 14
Total 100.00% 583,450

Cascadia Consulting Group, Inc. 34 Washington State Department of Ecology: Rural Waste Characterization Report
4.3.4 LIVESTOCK The livestock industrial group includes businesses that raise animals such as cows, sheep, hogs, and horses. A total of 18 samples were collected for this group. Using the samples along with statewide livestock data, quantities and composition data were estimated for the State.
4.3.4.1 QUANTITY AND DISPOSITION OF WASTE About 2.6 million tons of the 3.5 million tons of waste generated annually by livestock businesses statewide is beneficially used. Approximately 920,000 tons is disposed of through other disposal methods, and slightly more than 4,000 tons is landfilled. Figure 4-15 summarizes the disposal methods used by the livestock industrial group.
Figure 4-15: Summary of Waste Handling Methods – Livestock
0
500,000
1,000,000
1,500,000
2,000,000
2,500,000
3,000,000
Landfilled Other Disposal Beneficial Use
Tons
per
yea
r
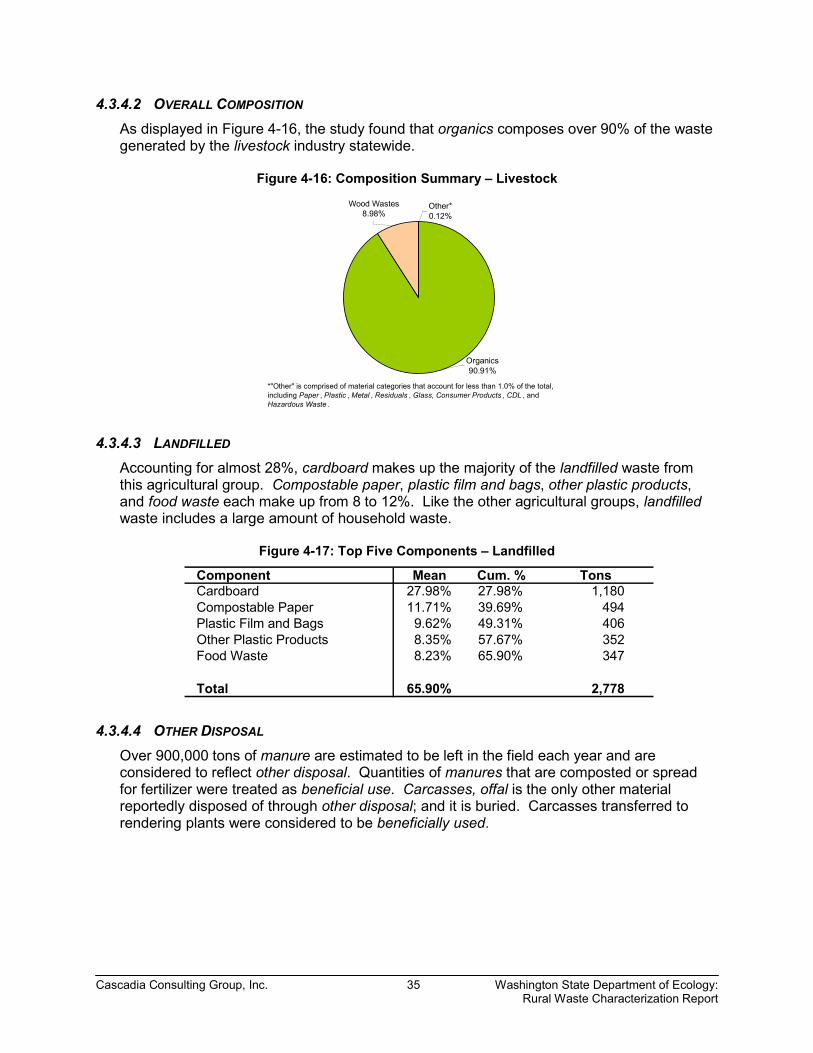
Cascadia Consulting Group, Inc. 35 Washington State Department of Ecology: Rural Waste Characterization Report
4.3.4.2 OVERALL COMPOSITION As displayed in Figure 4-16, the study found that organics composes over 90% of the waste generated by the livestock industry statewide.
Figure 4-16: Composition Summary – Livestock Wood Wastes
8.98%
Organics90.91%
Other*0.12%
*"Other" is comprised of material categories that account for less than 1.0% of the total, including Paper , Plastic , Metal , Residuals , Glass, Consumer Products , CDL , and Hazardous Waste .
4.3.4.3 LANDFILLED
Accounting for almost 28%, cardboard makes up the majority of the landfilled waste from this agricultural group. Compostable paper, plastic film and bags, other plastic products, and food waste each make up from 8 to 12%. Like the other agricultural groups, landfilled waste includes a large amount of household waste.
Figure 4-17: Top Five Components – Landfilled
Component Mean Cum. % TonsCardboard 27.98% 27.98% 1,180Compostable Paper 11.71% 39.69% 494Plastic Film and Bags 9.62% 49.31% 406Other Plastic Products 8.35% 57.67% 352Food Waste 8.23% 65.90% 347
Total 65.90% 2,778
4.3.4.4 OTHER DISPOSAL Over 900,000 tons of manure are estimated to be left in the field each year and are considered to reflect other disposal. Quantities of manures that are composted or spread for fertilizer were treated as beneficial use. Carcasses, offal is the only other material reportedly disposed of through other disposal; and it is buried. Carcasses transferred to rendering plants were considered to be beneficially used.
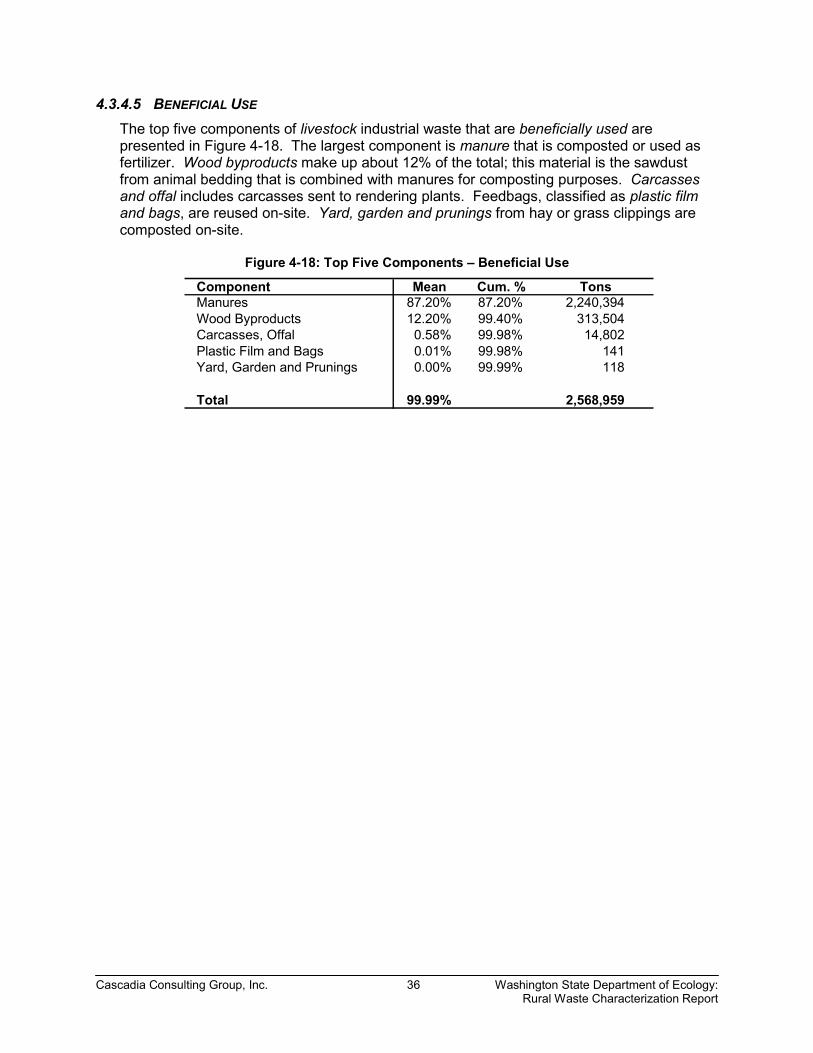
Cascadia Consulting Group, Inc. 36 Washington State Department of Ecology: Rural Waste Characterization Report
4.3.4.5 BENEFICIAL USE The top five components of livestock industrial waste that are beneficially used are presented in Figure 4-18. The largest component is manure that is composted or used as fertilizer. Wood byproducts make up about 12% of the total; this material is the sawdust from animal bedding that is combined with manures for composting purposes. Carcasses and offal includes carcasses sent to rendering plants. Feedbags, classified as plastic film and bags, are reused on-site. Yard, garden and prunings from hay or grass clippings are composted on-site.
Figure 4-18: Top Five Components – Beneficial Use
Component Mean Cum. % TonsManures 87.20% 87.20% 2,240,394Wood Byproducts 12.20% 99.40% 313,504Carcasses, Offal 0.58% 99.98% 14,802Plastic Film and Bags 0.01% 99.98% 141Yard, Garden and Prunings 0.00% 99.99% 118
Total 99.99% 2,568,959

Cascadia Consulting Group, Inc. 37 Washington State Department of Ecology: Rural Waste Characterization Report
4.3.5 MINING The mining industrial group includes mining companies and related services. There were a total of 15 samples collected for this group. Statewide quantity and composition estimates were derived by scaling up the sampling data by statewide mining employment data.
4.3.5.1 QUANTITY AND DISPOSITION OF WASTE As seen in Figure 4-19, more than 4 million tons of mining industry waste is estimated to be beneficially used in the State each year. Compared to beneficial use, landfilled and other disposal account for small amounts of waste, approximately 1,400 tons and 190 tons, respectively.
Figure 4-19: Summary of Waste Handling Methods – Mining
0
500,000
1,000,000
1,500,000
2,000,000
2,500,000
3,000,000
3,500,000
4,000,000
4,500,000
Landfilled Other Disposal Beneficial Use
Tons
per
yea
r

Cascadia Consulting Group, Inc. 38 Washington State Department of Ecology: Rural Waste Characterization Report
4.3.5.2 OVERALL COMPOSITION Over 99% of the waste from the mining group is composed of materials found in the CDL material class, such as soil, rocks, and sand (Figure 4-20).
Figure 4-20: Composition Summary – Mining Other*0.47%
CDL99.53%
*"Other" is comprised of material categories that account for less than 1.0% of the total, including Paper , Plastic , Metal , Glass, Wood Wastes , Consumer Products , and Hazardous Waste .
4.3.5.3 LANDFILLED The five material components in Figure 4-21 make up about 82% of the landfilled waste of mining companies. The two largest components, plastic film and bags and food waste, together make up more than half of the landfilled waste. Compostable paper and rejected products are each at least 10%. Mixed/low-grade paper accounts for about 6% of landfilled waste.
Figure 4-21: Top Five Components - Landfilled
Component Mean Cum. % TonsPlastic Film and Bags 29.72% 29.72% 417Food Waste 22.01% 51.73% 309Compostable Paper 13.78% 65.52% 194Rejected Products 10.28% 75.80% 144Mixed/Low-grade Paper 6.28% 82.08% 88
Total 82.08% 1,152
4.3.5.4 OTHER DISPOSAL About 190 tons of pallets and crates, classified as wood packaging, are estimated to be burned or stockpiled in the state each year by businesses in the mining industry.
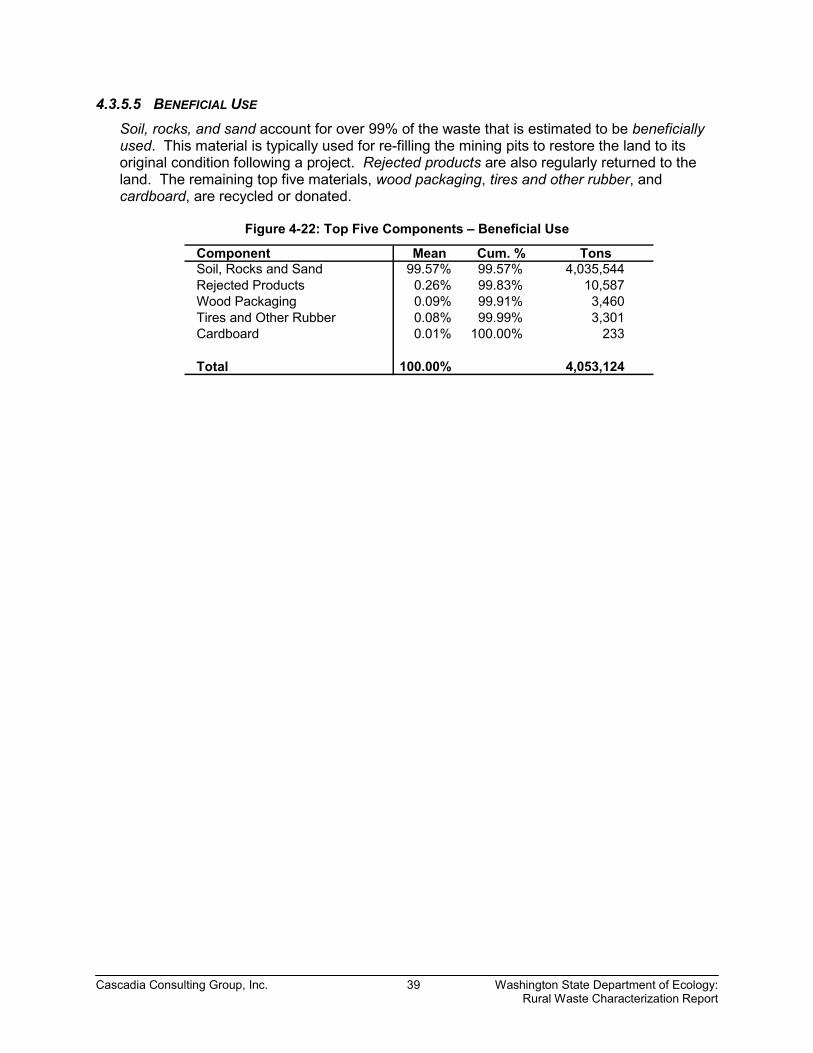
Cascadia Consulting Group, Inc. 39 Washington State Department of Ecology: Rural Waste Characterization Report
4.3.5.5 BENEFICIAL USE Soil, rocks, and sand account for over 99% of the waste that is estimated to be beneficially used. This material is typically used for re-filling the mining pits to restore the land to its original condition following a project. Rejected products are also regularly returned to the land. The remaining top five materials, wood packaging, tires and other rubber, and cardboard, are recycled or donated.
Figure 4-22: Top Five Components – Beneficial Use
Component Mean Cum. % TonsSoil, Rocks and Sand 99.57% 99.57% 4,035,544Rejected Products 0.26% 99.83% 10,587Wood Packaging 0.09% 99.91% 3,460Tires and Other Rubber 0.08% 99.99% 3,301Cardboard 0.01% 100.00% 233
Total 100.00% 4,053,124

Cascadia Consulting Group, Inc. 40 Washington State Department of Ecology: Rural Waste Characterization Report
4.3.6 CONSTRUCTION AND DEMOLITION Businesses in the C&D industry group include construction and demolition contractors and related services. Twenty-two samples were collected from businesses in this industry group. Quantities and composition data were estimated statewide by scaling up the data from sampling by statewide C&D wages.
4.3.6.1 QUANTITY AND DISPOSITION OF WASTE Figure 4-23 illustrates that the majority of the waste from the C&D industry is landfilled: approximately 900,000 tons of a total estimated 980,000 tons. Approximately 80,000 tons is beneficially used and only about 5,300 tons is estimated to be disposed through other disposal.
Figure 4-23: Summary of Waste Handling Methods – C&D
0
100,000
200,000
300,000
400,000
500,000
600,000
700,000
800,000
900,000
1,000,000
Landfilled Other Disposal Beneficial Use
Tons
per
yea
r

Cascadia Consulting Group, Inc. 41 Washington State Department of Ecology: Rural Waste Characterization Report
4.3.6.2 OVERALL COMPOSITION Figure 4-24 summarizes the percentages of broad material classes that make up the C&D waste stream. The two largest material classes, CDL wastes and wood wastes, together make up more than 75% of the total.
Figure 4-24: Composition Summary – C&D
Wood Wastes38.33%
Metal3.53%
Plastic5.99%
Paper6.13%
Residuals1.10%
Other*0.83%
Consumer Products5.14%
CDL38.96%
*"Other" is comprised of material categories that account for less than 1.0% of the total, including Glass, Organics , and Hazardous Waste .
4.3.6.3 LANDFILLED
As seen in the top five table, Figure 4-25, roofing waste makes up about 30% of the landfilled waste for the C&D industry group. The other four large components, drywall, engineered wood, treated wood, and dimensional lumber, each contribute at least 8% to the total.
Figure 4-25: Top Five Components – Landfilled
Component Mean Cum. % TonsRoofing Waste 28.14% 28.14% 252,259Drywall 11.71% 39.85% 104,968Engineered Wood 9.72% 49.56% 87,125Treated Wood 8.71% 58.27% 78,049Dimensional Lumber 8.15% 66.42% 73,054
Total 66.42% 595,456
4.3.6.4 OTHER DISPOSAL Concrete is the only material reported to be disposed of through other disposal. Approximately 5,300 tons is used for on-site fill annually.
4.3.6.5 BENEFICIAL USE Dimensional lumber accounts for about 98% the waste that is beneficially used. This material is reused or burned off-site for heating. Other ferrous metal and other plastics products are also reported to be beneficially used. Other ferrous metal in this instance includes plumbing pipes that are recycled. Other plastic products includes plastic tarps that are reused.

Cascadia Consulting Group, Inc. 42 Washington State Department of Ecology: Rural Waste Characterization Report
4.3.7 PAPER Manufacturers of paper and allied products make up the paper industry group. Eighteen samples were collected from the paper industry group, although all of the samples came from only one business. Quantities and composition data were estimated for the State by scaling up the samples by statewide employment data.
4.3.7.1 QUANTITY AND DISPOSITION OF WASTE Based on this study’s analysis, this industry group relies on beneficial use most frequently to handle waste. Statewide, about 1.6 million tons of waste is estimated to be beneficially used each year. Waste disposed of through other disposal accounts for over 700,000 tons, and an estimated 240,000 tons are landfilled annually.
Figure 4-26: Summary of Waste Handling Methods – Paper
0
200,000
400,000
600,000
800,000
1,000,000
1,200,000
1,400,000
1,600,000
1,800,000
Landfilled Other Disposal Beneficial Use
Tons
per
yea
r
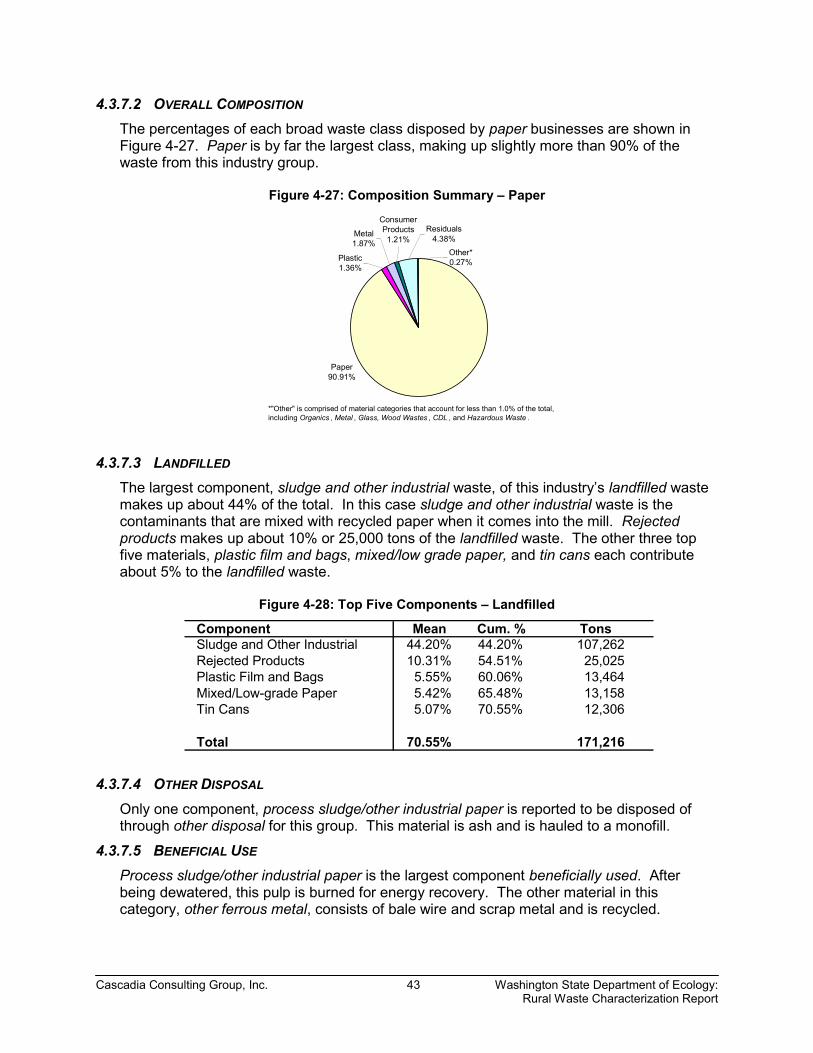
Cascadia Consulting Group, Inc. 43 Washington State Department of Ecology: Rural Waste Characterization Report
4.3.7.2 OVERALL COMPOSITION The percentages of each broad waste class disposed by paper businesses are shown in Figure 4-27. Paper is by far the largest class, making up slightly more than 90% of the waste from this industry group.
Figure 4-27: Composition Summary – Paper
Residuals4.38%
Plastic1.36%
Paper90.91%
Other*0.27%
Consumer Products1.21%
Metal1.87%
*"Other" is comprised of material categories that account for less than 1.0% of the total, including Organics , Metal , Glass, Wood Wastes , CDL , and Hazardous Waste .
4.3.7.3 LANDFILLED
The largest component, sludge and other industrial waste, of this industry’s landfilled waste makes up about 44% of the total. In this case sludge and other industrial waste is the contaminants that are mixed with recycled paper when it comes into the mill. Rejected products makes up about 10% or 25,000 tons of the landfilled waste. The other three top five materials, plastic film and bags, mixed/low grade paper, and tin cans each contribute about 5% to the landfilled waste.
Figure 4-28: Top Five Components – Landfilled
Component Mean Cum. % TonsSludge and Other Industrial 44.20% 44.20% 107,262Rejected Products 10.31% 54.51% 25,025Plastic Film and Bags 5.55% 60.06% 13,464Mixed/Low-grade Paper 5.42% 65.48% 13,158Tin Cans 5.07% 70.55% 12,306
Total 70.55% 171,216
4.3.7.4 OTHER DISPOSAL Only one component, process sludge/other industrial paper is reported to be disposed of through other disposal for this group. This material is ash and is hauled to a monofill.
4.3.7.5 BENEFICIAL USE Process sludge/other industrial paper is the largest component beneficially used. After being dewatered, this pulp is burned for energy recovery. The other material in this category, other ferrous metal, consists of bale wire and scrap metal and is recycled.

Cascadia Consulting Group, Inc. 44 Washington State Department of Ecology: Rural Waste Characterization Report
4.3.8 LOGGING & PRIMARY WOOD PRODUCTS Included in this industry group are businesses such as logging companies, sawmills, cabinetmakers, and particleboard plants. Ten samples were collected from the logging & primary wood products industry group. Quantities and composition data were estimated at the statewide level using state employment data to scale up sampling data.
4.3.8.1 QUANTITY AND DISPOSITION OF WASTE As shown in Figure 4-29, nearly all of the 8.9 million tons of waste generated by logging companies statewide is beneficially used. About 32,000 tons is estimated to be disposed through other disposal methods and an estimated 17,000 tons are landfilled.
Figure 4-29: Summary of Waste Handling Methods – Logging & Primary Wood Products
0
1,000,000
2,000,000
3,000,000
4,000,000
5,000,000
6,000,000
7,000,000
8,000,000
9,000,000
10,000,000
Landfilled Other Disposal Beneficial Use
Tons
per
yea
r

Cascadia Consulting Group, Inc. 45 Washington State Department of Ecology: Rural Waste Characterization Report
4.3.8.2 OVERALL COMPOSITION The percentage of each broad waste material class disposed by logging businesses is shown in Figure 4-30. Wood wastes are estimated to make up over 99% of the waste produced by this industry group.
Figure 4-30: Composition Summary – Logging & Primary Wood Products
Wood Wastes99.91%
Other*0.09%
*"Other" is comprised of material categories that account for less than 1.0% of the total, including Paper , Plastic , Metal , Glass , Organics , CDL , Consumer Products , Residuals , and Hazardous Waste .
4.3.8.3 LANDFILLED
Accounting for approximately 22.5%, wood byproducts is the largest component of landfilled waste for the logging industry group. Treated wood, other non-hazardous waste, and dimensional lumber each make up over 10% of the waste going to landfills. Other non-hazardous waste includes gasoline, solvents, gunpowder, and fertilizers.
Figure 4-31: Top Five Components - Landfilled
Component Mean Cum. % TonsWood Byproducts 22.50% 22.50% 3,884Treated Wood 15.99% 38.49% 2,761Other Non-hazardous Waste 13.56% 52.05% 2,341Dimensional Lumber 11.45% 63.50% 1,976Sludge and Other Industrial 5.68% 69.18% 980
Total 69.18% 11,942
4.3.8.4 OTHER DISPOSAL Natural wood is reported to be disposed through other disposal. This estimate represents the logging “slash” left in the woods after a logging operation.
4.3.8.5 BENEFICIAL USE Wood by-products is reported to be used beneficially by the logging & primary wood products industry group. Sawdust, shavings, and wood chips are burned as hog fuel or sent to other companies for processing.
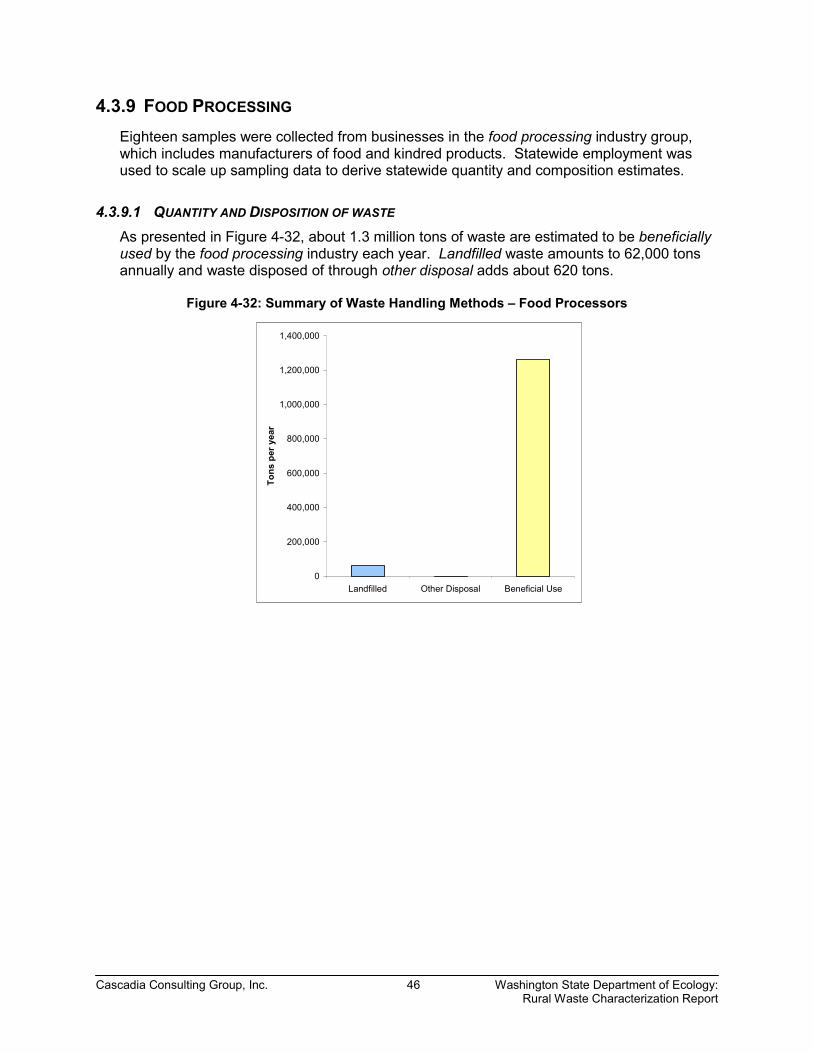
Cascadia Consulting Group, Inc. 46 Washington State Department of Ecology: Rural Waste Characterization Report
4.3.9 FOOD PROCESSING Eighteen samples were collected from businesses in the food processing industry group, which includes manufacturers of food and kindred products. Statewide employment was used to scale up sampling data to derive statewide quantity and composition estimates.
4.3.9.1 QUANTITY AND DISPOSITION OF WASTE As presented in Figure 4-32, about 1.3 million tons of waste are estimated to be beneficially used by the food processing industry each year. Landfilled waste amounts to 62,000 tons annually and waste disposed of through other disposal adds about 620 tons.
Figure 4-32: Summary of Waste Handling Methods – Food Processors
0
200,000
400,000
600,000
800,000
1,000,000
1,200,000
1,400,000
Landfilled Other Disposal Beneficial Use
Tons
per
yea
r
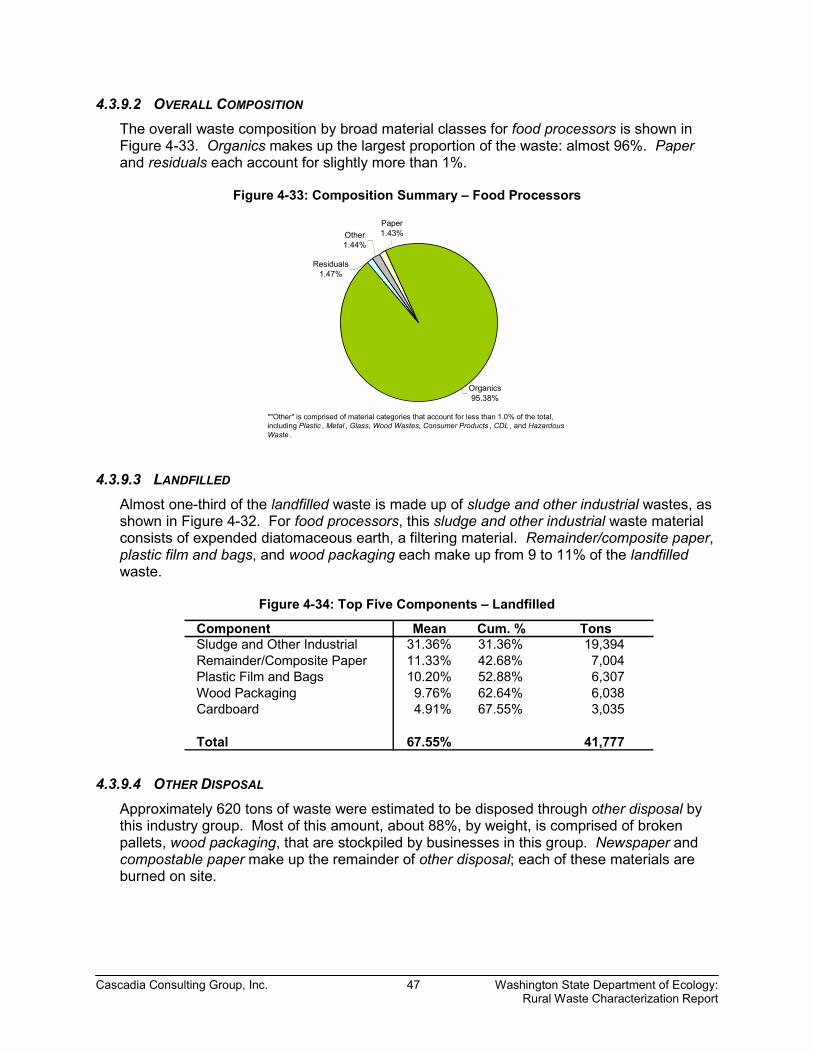
Cascadia Consulting Group, Inc. 47 Washington State Department of Ecology: Rural Waste Characterization Report
4.3.9.2 OVERALL COMPOSITION The overall waste composition by broad material classes for food processors is shown in Figure 4-33. Organics makes up the largest proportion of the waste: almost 96%. Paper and residuals each account for slightly more than 1%.
Figure 4-33: Composition Summary – Food Processors
Organics95.38%
Paper1.43%Other
1.44%
Residuals1.47%
*"Other" is comprised of material categories that account for less than 1.0% of the total, including Plastic , Metal , Glass, Wood Wastes, Consumer Products , CDL , and Hazardous Waste .
4.3.9.3 LANDFILLED
Almost one-third of the landfilled waste is made up of sludge and other industrial wastes, as shown in Figure 4-32. For food processors, this sludge and other industrial waste material consists of expended diatomaceous earth, a filtering material. Remainder/composite paper, plastic film and bags, and wood packaging each make up from 9 to 11% of the landfilled waste.
Figure 4-34: Top Five Components – Landfilled
Component Mean Cum. % TonsSludge and Other Industrial 31.36% 31.36% 19,394Remainder/Composite Paper 11.33% 42.68% 7,004Plastic Film and Bags 10.20% 52.88% 6,307Wood Packaging 9.76% 62.64% 6,038Cardboard 4.91% 67.55% 3,035
Total 67.55% 41,777
4.3.9.4 OTHER DISPOSAL Approximately 620 tons of waste were estimated to be disposed through other disposal by this industry group. Most of this amount, about 88%, by weight, is comprised of broken pallets, wood packaging, that are stockpiled by businesses in this group. Newspaper and compostable paper make up the remainder of other disposal; each of these materials are burned on site.
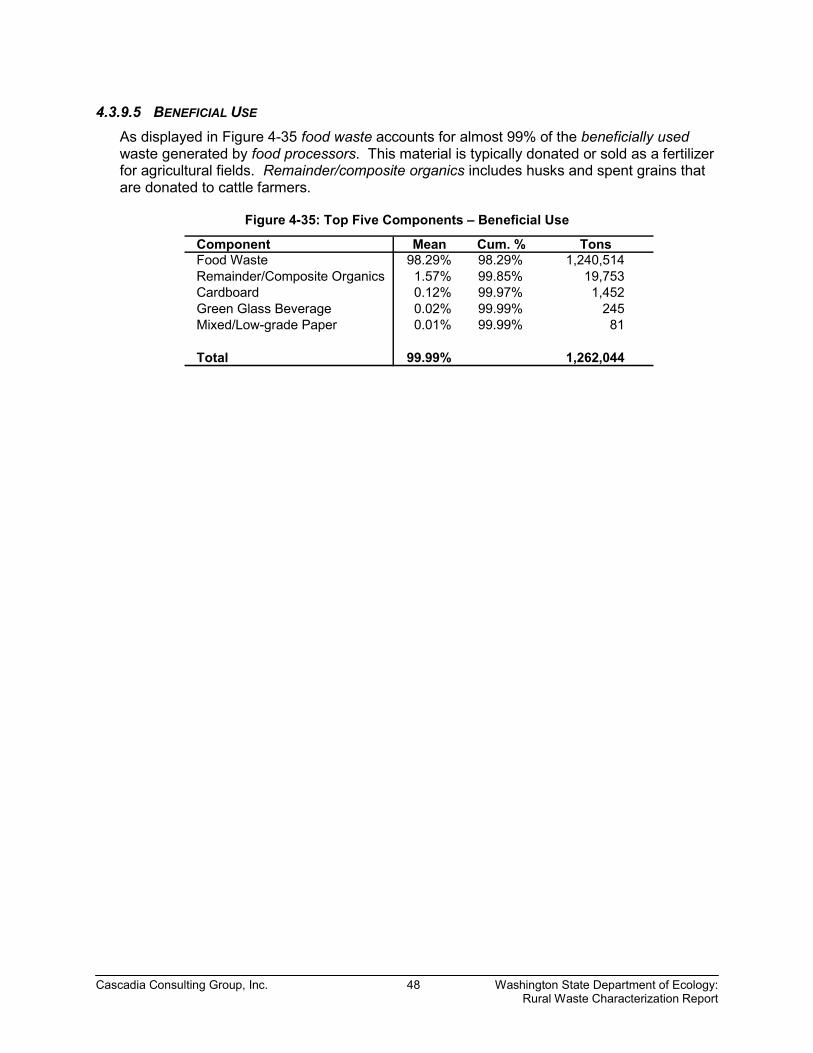
Cascadia Consulting Group, Inc. 48 Washington State Department of Ecology: Rural Waste Characterization Report
4.3.9.5 BENEFICIAL USE As displayed in Figure 4-35 food waste accounts for almost 99% of the beneficially used waste generated by food processors. This material is typically donated or sold as a fertilizer for agricultural fields. Remainder/composite organics includes husks and spent grains that are donated to cattle farmers.
Figure 4-35: Top Five Components – Beneficial Use
Component Mean Cum. % TonsFood Waste 98.29% 98.29% 1,240,514Remainder/Composite Organics 1.57% 99.85% 19,753Cardboard 0.12% 99.97% 1,452Green Glass Beverage 0.02% 99.99% 245Mixed/Low-grade Paper 0.01% 99.99% 81
Total 99.99% 1,262,044

Cascadia Consulting Group, Inc. A-1 Washington State Department of Ecology: Rural Waste Characterization Report
Appendices
APPENDIX A: WASTE CLASSES AND DEFINITIONS
PAPER Newspaper: printed groundwood newsprint, including glossy ads and Sunday edition magazines that are delivered with the newspaper (unless these are found separately during sorting). Cardboard: unwaxed Kraft paper corrugated containers and boxes, unless poly- or foil-laminated. Note that this category includes brown Kraft paper bags. Other Groundwood: other products made from groundwood paper, including phone books, paperback books, and egg cartons. High-Grade Paper: high-grade white or light-colored bond and copy machine papers and envelopes, and continuous-feed computer printouts and forms of all types, except multiple-copy carbonless paper. Magazines: magazines, catalogs and similar products with glossy paper. Mixed/Low-Grade Paper: low-grade recyclable papers, including colored papers, notebook or other lined paper, envelopes with plastic windows, non-corrugated paperboard, carbonless copy paper, polycoated paperboard packaging, and junk mail. Compostable: Paper cups, pizza boxes and papers that can be composted such as paper towels, tissues, paper plates, and waxed cardboard. This category includes all paper that is contaminated or soiled with food or liquid in its normal use. Residual/Composite Paper: non-recyclable and non-compostable types of papers such as carbon paper and hardcover books, and composite materials such as paper packaging with metal or plastic parts. Processing Sludges, Other Industrial: paper-based materials from industrial sources that do not easily fit into the above categories, such as sludges. PLASTIC PET Bottles: polyethylene terephthalate (PET) bottles, including soda, oil, liquor and other types of bottles. No attempt will be made to remove base cups, caps, or wrappers, although these materials will be categorized separately if received separately. The SPI code for PET is 1. HDPE Bottles, Clear: high-density polyethylene (HDPE) milk and other bottles that are not colored. The SPI code for HDPE is 2. HDPE Bottles, Pigmented: high-density polyethylene (HDPE) juice, detergent, and other bottles that are colored. The SPI code for HDPE is 2.

Cascadia Consulting Group, Inc. A-2 Washington State Department of Ecology: Rural Waste Characterization Report
Appendices
Film and Bags: all plastic packaging films and bags. To be counted in this category, the material must be flexible (i.e., can be bent without making a noise). Bottles Types 3 - 7: all bottles that are not PET or HDPE, where the neck of the container is narrower than the body. Includes SPI codes 3 - 7. Expanded Polystyrene: packaging and finished products made of expanded polystyrene. The SPI code for polystyrene (PS) is 6. Other Rigid Plastic Packaging: all plastic packaging that is not a bottle and is not film or bag. Other Plastic Products: finished plastic products such as toys, toothbrushes, vinyl hose and shower curtains. In cases where there is a large amount of a single type of product, the name of the product should be noted on the data collection form. Residual/Composite Plastic: other types of plastic that do not fit into the above categories and items that are composites of plastic and other materials. ORGANICS Yard, Garden and Prunings: grass clippings, leaves and weeds, and prunings six inches or less in diameter. Food Waste: food waste and scraps, including bones, rinds, etc., and including the food container when the container weight is not appreciable compared to the food inside. Manures: animal manures and human feces, including kitty litter and any materials contaminated with manures and feces. Disposable Diapers: disposable baby diapers and protective undergarments for adults (including feminine hygiene products). Carcasses, Offal: carcasses and pieces of small and large animal, unless the item is the result of food preparation in a household or commercial setting. For instance, fish or chicken entrails from food preparation and raw, plucked chickens will typically be classified as food, not as an animal carcass, unless the material is from an agricultural or industrial source. Crop Residues: vegetative materials that are left over from growing crops, and that are treated as a waste. Septage: the liquid or semi-liquid material removed from septic tanks. Residual/Composite: other organics that do not easily fit into the above categories, must note identity of whatever material is placed in this category.

Cascadia Consulting Group, Inc. A-3 Washington State Department of Ecology: Rural Waste Characterization Report
Appendices
WOOD WASTES Natural Wood: wood that is not been processed, including stumps of trees and shrubs, with the adhering soil (if any), and other natural woods, such as logs and branches in excess of six inches in diameter. Treated Wood: wood treated with preservatives such as creosote, CCA and ACQ. This includes dimensional lumber and posts if treated, but does not include painted or varnished wood. This category may also include some plywood (especially “marine plywood”), strandboard, and other wood. Painted Wood: wood that has been painted, varnished or coated in similar ways. Dimensional Lumber: wood commonly used in construction for framing and related uses, including 2 x 4’s, 2 x 6’s and posts/headers (4x8’s, etc.). Engineered: building materials that have been manufactured and that generally include adhesive as one or more layers. Examples include plywood (sheets of wood built up of two or more veneer sheets glued or cemented together under pressure), particle board (wood chips pressed together to form large sheets or boards), fiberboard (like particle board but with fibers), “glu-lam” beams and boards (built up from dimensional or smaller lumber), and similar products. Packaging: partial or whole pallets, crates and similar shipping containers. Other Untreated Wood: other types of wood products and materials that do not fit into the above categories, excluding composite materials (See Residual/Composites, below). Wood Byproducts: sawdust and shavings, not otherwise identifiable. Residuals/Composites: items that consist primarily of wood but that do not fit into the above categories, including composite materials that consist primarily (over 50%) of wood. Examples of composites include wood with sheetrock nailed to it or with tiles glued to it (such that the materials cannot be easily separated) CONSTRUCTION, DEMOLITION AND LAND CLEARING (CDL)
WASTES Insulation: Include all pad, roll, or blown-in types of insulation. Do not include expanded polystyrene. Asphalt: asphalt paving material. Concrete: cement (mixed or unmixed), concrete blocks, and similar wastes. Drywall: used or new gypsum wallboard, sheetrock or drywall present in recoverable amounts or pieces (generally any piece larger than two inches square will be recovered from the sample). Soil, Rocks and Sand: rock, gravel, soil, sand and similar naturally-occurring materials.

Cascadia Consulting Group, Inc. A-4 Washington State Department of Ecology: Rural Waste Characterization Report
Appendices
Roofing Waste: asphalt and fiberglass shingles, tar paper, and similar wastes from demolition or installation of roofs. Does not include wooden shingle or shakes. Ceramics: includes clay, porcelain bricks and tiles, such as used toilets, sinks and bricks of various types and sizes. Residual/Composites: other construction and demolition materials that do not fit easily into the above categories or that are composites made up of two or more different materials. GLASS Clear, Green and Brown Beverage Glass: these are three separate categories for bottles and jars that are clear, green or brown in color. Note that blue glass will be included with brown glass. Other Glass Containers; Clear, Green and Brown: these are three separate categories for bottles and jars that are clear, green or brown in color. Note that blue glass will be included with brown glass. Plate Glass: flat glass products such as windows, mirrors, and flat products. Residual/Composite Glass: other types of glass products and scrap that do not fit into the above categories, including light bulbs, glassware and non-C&D fiberglass. Note that ceramics (plates and knickknacks) will not be included here but will be placed in “Non-Glass Ceramics” below. Non-glass Ceramics: Ceramics not composed of true glass and not typically used as building materials. Examples include Pyrex, dishes, etc. METAL Aluminum Cans: aluminum beverage cans. Aluminum Foil/Containers: aluminum foil, food trays and similar items. Other Aluminum: aluminum scrap and products that do not fit into the above two categories. Copper: copper scrap and products, excluding composites such as electrical wire. Other Non-Ferrous Metals: metallic products and pieces that are not aluminum or copper and not derived from iron (see “other ferrous”) and which are not significantly contaminated with other metals or materials (see “residual/composite”). Tin Cans: tin-coated steel food containers. This category will include bi-metal beverage cans, but not paint cans or other types of cans. White Goods: large household appliances or parts thereof. Special note should be taken if any of these are found still containing refrigerant. Other Ferrous: products and pieces made from metal to which a magnet will adhere (but including stainless steel), and which are not significantly contaminated with other metals or
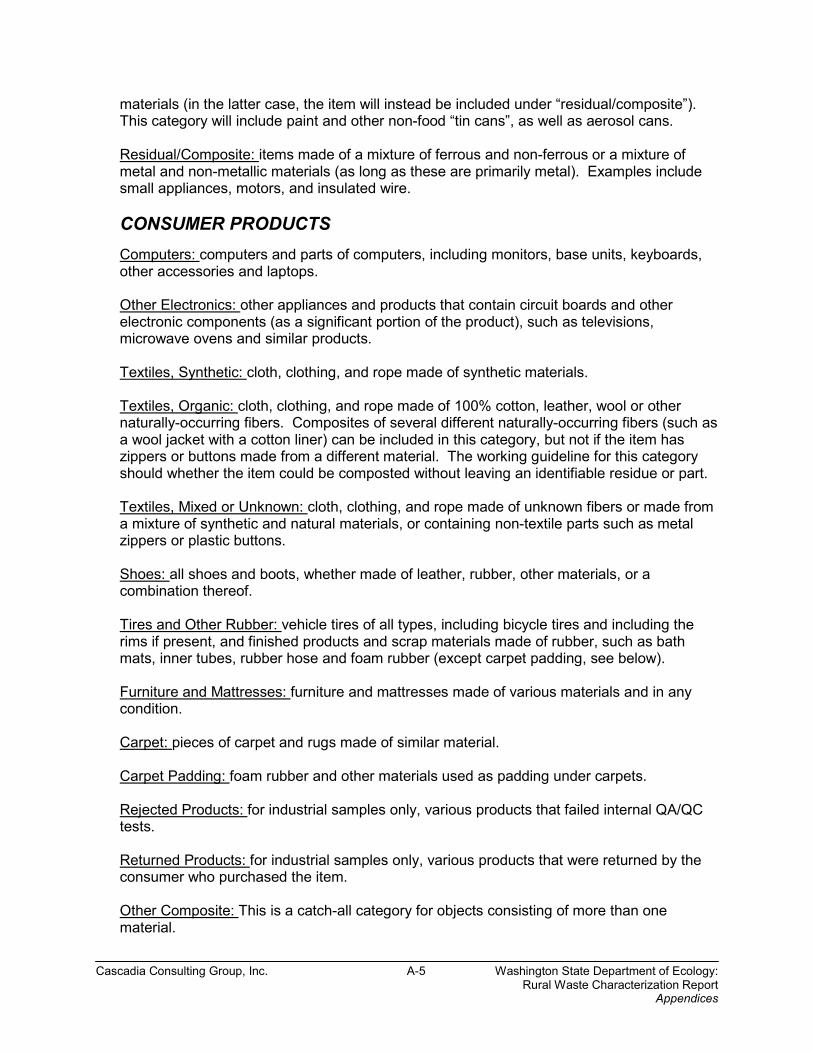
Cascadia Consulting Group, Inc. A-5 Washington State Department of Ecology: Rural Waste Characterization Report
Appendices
materials (in the latter case, the item will instead be included under “residual/composite”). This category will include paint and other non-food “tin cans”, as well as aerosol cans. Residual/Composite: items made of a mixture of ferrous and non-ferrous or a mixture of metal and non-metallic materials (as long as these are primarily metal). Examples include small appliances, motors, and insulated wire. CONSUMER PRODUCTS Computers: computers and parts of computers, including monitors, base units, keyboards, other accessories and laptops. Other Electronics: other appliances and products that contain circuit boards and other electronic components (as a significant portion of the product), such as televisions, microwave ovens and similar products. Textiles, Synthetic: cloth, clothing, and rope made of synthetic materials. Textiles, Organic: cloth, clothing, and rope made of 100% cotton, leather, wool or other naturally-occurring fibers. Composites of several different naturally-occurring fibers (such as a wool jacket with a cotton liner) can be included in this category, but not if the item has zippers or buttons made from a different material. The working guideline for this category should whether the item could be composted without leaving an identifiable residue or part. Textiles, Mixed or Unknown: cloth, clothing, and rope made of unknown fibers or made from a mixture of synthetic and natural materials, or containing non-textile parts such as metal zippers or plastic buttons. Shoes: all shoes and boots, whether made of leather, rubber, other materials, or a combination thereof. Tires and Other Rubber: vehicle tires of all types, including bicycle tires and including the rims if present, and finished products and scrap materials made of rubber, such as bath mats, inner tubes, rubber hose and foam rubber (except carpet padding, see below). Furniture and Mattresses: furniture and mattresses made of various materials and in any condition. Carpet: pieces of carpet and rugs made of similar material. Carpet Padding: foam rubber and other materials used as padding under carpets. Rejected Products: for industrial samples only, various products that failed internal QA/QC tests. Returned Products: for industrial samples only, various products that were returned by the consumer who purchased the item. Other Composite: This is a catch-all category for objects consisting of more than one material.
Cascadia Consulting Group, Inc. A-6 Washington State Department of Ecology: Rural Waste Characterization Report
Appendices
RESIDUALS Ash: fireplace, burn barrel or firepit ash, as well as boiler and ash from industrial sources. Dust: baghouse and other dusts from industrial sources, as well as bags of vacuum cleaner dust. Fines/Sorting Residues: mixed waste that remains on the sorting table after all the materials that can practicably be removed have been sorted out. This material will consist primarily of small pieces of various types of paper and plastic, but will also contain small pieces of broken glass and other materials. May also include material less than one-half inch in diameter that falls through a bottom screen during sorting, for those using sorting boxes with screens, and if the material cannot otherwise be identified. Sludges and Other Special Industrial Wastes: sludges and other wastes from industrial sources that cannot easily be fit into any of the above categories. Can include liquids and semi-solids but only if these materials are treated as a solid waste. HAZARDOUS AND SPECIAL WASTES Used Oil: used or new lubricating oils and related products, primarily those used in cars but possibly also including other materials with similar characteristics. Oil Filters: used oil filters, primarily those used in cars but possibly including similar filters from other types of vehicles and other applications. Antifreeze: automobile and other antifreeze mixtures based on ethylene or propylene glycol, also brake and other fluids if based on these compounds. Auto Batteries: car, motorcycle, and other lead-acid batteries used for motorized vehicles. Household Batteries: batteries of various sizes and types, as commonly used in households. Pesticides and Herbicides: includes a variety of poisons whose purpose is to discourage or kill pests, weeds or microorganisms. Fungicides and wood preservatives, such as pentachlorophenol, are also included in this category. Latex Paint: water-based paints. Oil Paint: solvent-based paints. Medical Waste: wastes related to medical activities, including syringes, IV tubing, bandages, medications, and other wastes, and not restricted to just those wastes typically classified as pathogenic or infectious. Fluorescent Tubes: in addition to the typical fluorescent tubes (including fluorescent light bulbs and other forms), this category includes mercury vapor and other lamps listed as universal wastes. Asbestos: pure asbestos, and asbestos-containing products where the asbestos present is the most distinguishing characteristic of the material.

Cascadia Consulting Group, Inc. A-7 Washington State Department of Ecology: Rural Waste Characterization Report
Appendices
Other Hazardous Waste: problem wastes that do not fall into one of the above categories, such as gasoline, solvents, gunpowder, other unspent ammunition, fertilizers, and radioactive materials. Other Non-Hazardous Waste: problem wastes that do not fall into one of the above categories, but that are not hazardous, such as adhesives, weak acids and bases (cleaners), automotive products (car wax, etc.)

Cascadia Consulting Group, Inc. B-1 Washington Department of Ecology: Rural Waste Characterization Report
Appendices
APPENDIX B: DISPOSAL SITE WASTE CHARACTERIZATION METHODOLOGY
This appendix presents the data collection methods and calculation procedures used to develop disposal site waste characterization profiles for Grant and Okanogan Counties.
GENERAL APPROACH
Each of the collection companies operating in Grant and Okanogan Counties were interviewed to determine the universe or the number of vehicles expected to arrive to the disposal facility each day of the week. Using this data, Cascadia then developed sampling quotas by substream (commercial, agricultural/industrial, and consumer) for each day of sampling. Table A-1 shows the number of samples sorted and characterized at the disposal facilities in Grant and Okanogan Counties.1
Table A-1: Numbers of Samples Characterized at Disposal Facilities
Source of waste
Grant County
Okanogan County
Commercial 42 22 Agricultural/Industrial 11 7 Consumer 18 17
FIELD PROCEDURES
According to the prepared sampling quotas and vehicle selection intervals for each day, the Sorting Crew Manager identified the sample vehicle as it entered the facility and interviewed the driver to determine the substream. The driver was then directed to tip the load in a designated sampling area. Commercially collected loads that were designated for sorting and delivered in compactors or roll-off containers were dumped in an elongated pile. The sample was selected using an imaginary 16-cell grid superimposed over the dumped material. The Manager then identified a randomly pre-selected cell to be sorted. If the designated cell was blocked due to site constraints, an alternate cell was randomly selected. Then, approximately 200 to 300 pounds of waste was extracted by a loader from the designated cell and placed on a tarp. Samples from large (greater than 500 pounds) self-hauled loads were selected in much the same manner as commercially collected loads, using a random and/or representative cell selection. If the self-hauled load weighed less than 300 pounds, the entire load was sorted as a sample.
1 In additional to the 18 agricultural/industrial samples that were intercepted at the disposal facilities and that are reflected in Table 1, information collected from 32 business locations was brought into the analysis to reflect the composition and quantity of agricultural/industrial waste that is sent to landfill. The information from business locations was a summary of composition and quantity data for waste sent to landfills by certain agricultural and industrial business groups. The data had been collected as part of the waste-generator portion of the current study.

Cascadia Consulting Group, Inc. B-2 Washington Department of Ecology: Rural Waste Characterization Report
Appendices
After the extracted material was deposited on the tarp, the Manager checked the weight of each sample manually. If judged to be too light, additional material was pulled from the same cell area until the desired weight was achieved. Samples judged to be excessively heavy were pared down by removing a homogenous slice of material from the tarp. The use of a grid-selection process to identify sample cells helps ensure that bulky items are included. Occasionally, however, bulky items in a sample may result in a sample weight in excess of 500 pounds. If the contents were too bulky to be reasonably and accurately separated, either the entire load was sorted and weighed, or the weight of the bulky item(s) was estimated and combined with data from the sorted portion of the load. Once a sample had been selected, extracted from the load, and placed on a clean tarp, it was sorted by hand into the prescribed component categories (refer to Appendix A for the complete list). Components were placed in plastic laundry baskets to be weighed and recorded. Sorting crewmembers typically specialize in groups of materials, but each is trained in the full list of components. Each crew person directed materials to the appropriate specialist. The Manager monitored the homogeneity of the component baskets as material accumulated, rejecting items, which may be improperly classified. Open laundry baskets allowed the Manager to see the material at all times. The Manager also verified the purity of each component as it was weighed, before recording the weight on the sampling form. All sampling records were checked for accuracy, completeness, and legibility, then entered into a Microsoft Access database that was customized for this project.
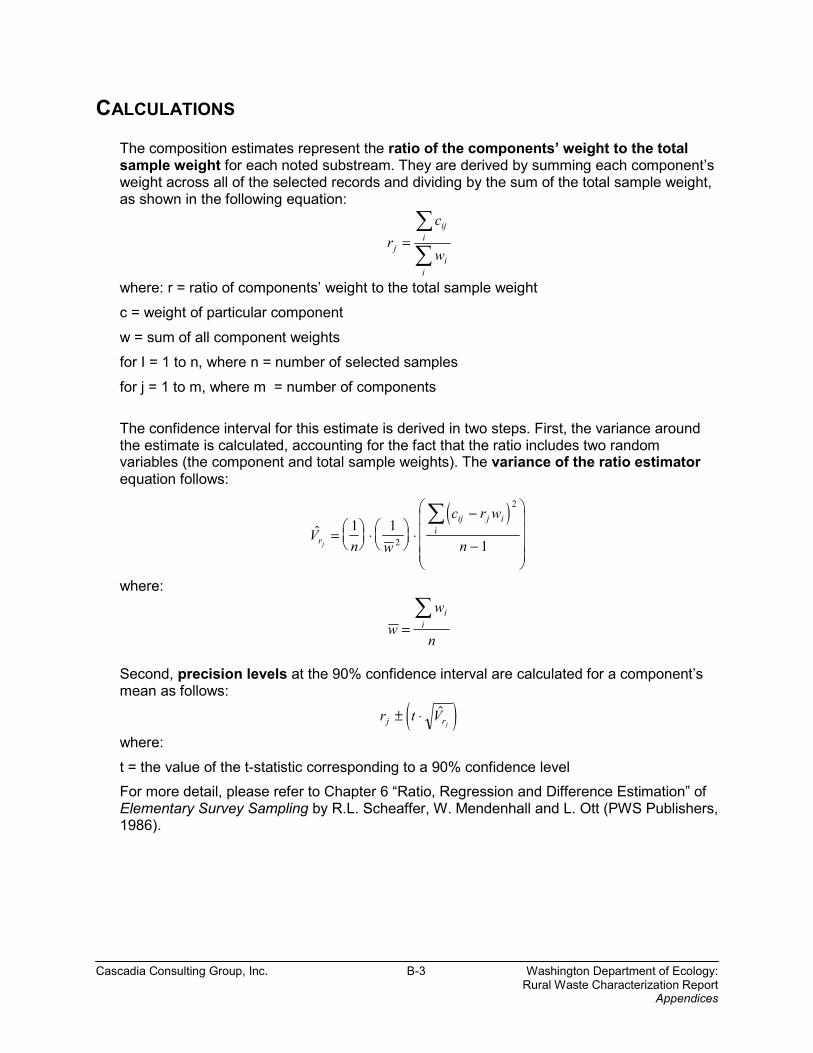
Cascadia Consulting Group, Inc. B-3 Washington Department of Ecology: Rural Waste Characterization Report
Appendices
CALCULATIONS
The composition estimates represent the ratio of the components’ weight to the total sample weight for each noted substream. They are derived by summing each component’s weight across all of the selected records and dividing by the sum of the total sample weight, as shown in the following equation:
rc
wj
iji
ii
=∑
∑
where: r = ratio of components’ weight to the total sample weight c = weight of particular component w = sum of all component weights for I = 1 to n, where n = number of selected samples for j = 1 to m, where m = number of components The confidence interval for this estimate is derived in two steps. First, the variance around the estimate is calculated, accounting for the fact that the ratio includes two random variables (the component and total sample weights). The variance of the ratio estimator equation follows:
( )�V
n w
c r w
nr
ij j ii
j=
⋅
⋅
−
−
∑1 112
2
where:
ww
n
ii=∑
Second, precision levels at the 90% confidence interval are calculated for a component’s mean as follows:
( )r t Vj rj± ⋅ �
where: t = the value of the t-statistic corresponding to a 90% confidence level
For more detail, please refer to Chapter 6 “Ratio, Regression and Difference Estimation” of Elementary Survey Sampling by R.L. Scheaffer, W. Mendenhall and L. Ott (PWS Publishers, 1986).
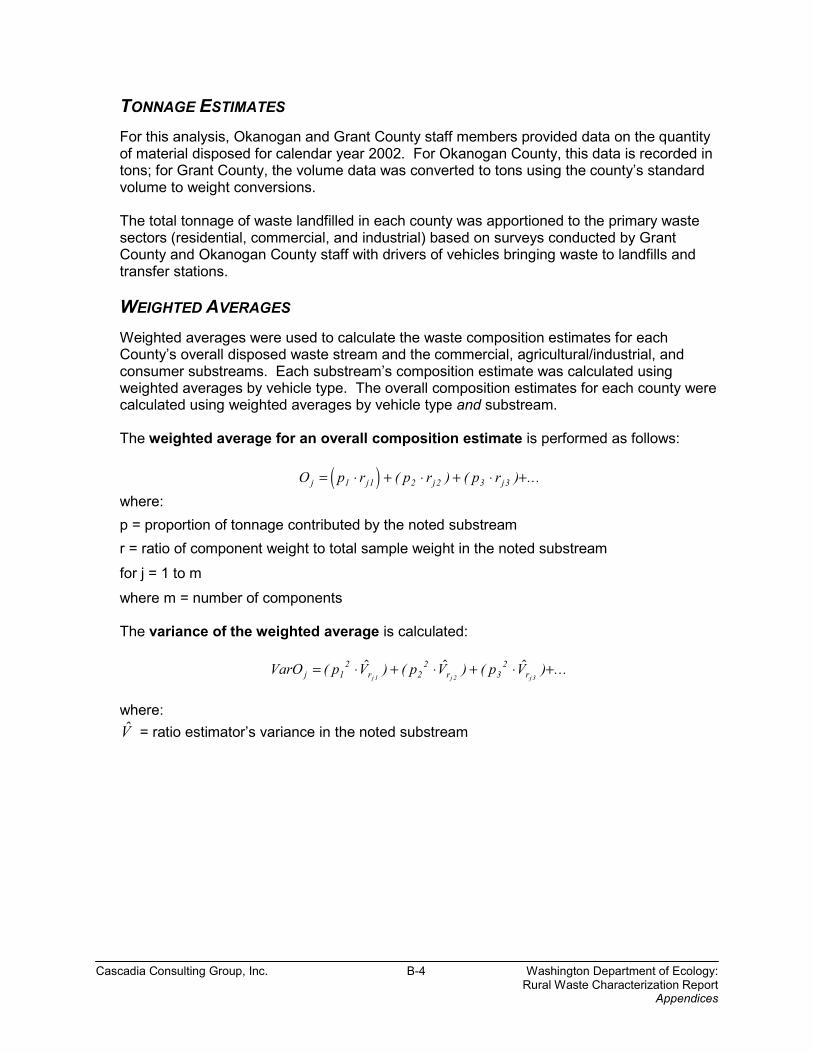
Cascadia Consulting Group, Inc. B-4 Washington Department of Ecology: Rural Waste Characterization Report
Appendices
TONNAGE ESTIMATES For this analysis, Okanogan and Grant County staff members provided data on the quantity of material disposed for calendar year 2002. For Okanogan County, this data is recorded in tons; for Grant County, the volume data was converted to tons using the county’s standard volume to weight conversions. The total tonnage of waste landfilled in each county was apportioned to the primary waste sectors (residential, commercial, and industrial) based on surveys conducted by Grant County and Okanogan County staff with drivers of vehicles bringing waste to landfills and transfer stations. WEIGHTED AVERAGES Weighted averages were used to calculate the waste composition estimates for each County’s overall disposed waste stream and the commercial, agricultural/industrial, and consumer substreams. Each substream’s composition estimate was calculated using weighted averages by vehicle type. The overall composition estimates for each county were calculated using weighted averages by vehicle type and substream. The weighted average for an overall composition estimate is performed as follows:
( )O p r p r p rj j j j= ⋅ + ⋅ + ⋅ +1 1 2 2 3 3( ) ( ) ... where: p = proportion of tonnage contributed by the noted substream r = ratio of component weight to total sample weight in the noted substream for j = 1 to m where m = number of components The variance of the weighted average is calculated:
VarO p V p V p Vj r r rj j j= ⋅ + ⋅ + ⋅ +( > ) ( > ) ( > ) ...1
222
32
1 2 3
where: V̂ = ratio estimator’s variance in the noted substream
Cascadia Consulting Group, Inc. C-1 Washington Department of Ecology: Rural Waste Characterization Report
Appendices
APPENDIX C: GENERATOR WASTE CHARACTERIZATION METHODOLOGY
GENERAL APPROACH
The generator-focused portion of the rural waste characterization study involved developing estimates for the quantity and composition of all solid waste produced by selected industries and types of agriculture that are typical of rural Washington counties. The basic steps involved in developing the estimates were as follows:
• defining the targeted industry groups; deciding how many waste samples or waste characterization “observations” to conduct to represent the waste disposed by each industry group; deciding how many samples would be obtained from each participating county
• using a random selection and recruitment method to identify industrial and agricultural businesses to participate in the study
• contacting and visiting the recruited businesses to conduct measurements of waste generation and to characterize each waste stream produced by each business
• combining the composition and quantity data from each site to form a broader picture of all waste produced by each industrial/agricultural group
• “scaling up” the quantity estimates for each industrial/agricultural group in the participating counties to reflect waste generated by that group statewide
These steps are described in more detail in the sections below. Throughout the study, the consultant adhered to certain key principles. First, representative businesses from each industrial and agricultural group were selected at random from available lists. Second, the study endeavored to classify and quantify all segments of the entire solid waste stream generated by each business, including solid waste that is taken to landfills, recycled, reused, or disposed through other methods. Third, the study applied a consistent protocol of sampling and characterization – through either hand-sorting, visual estimation of contents, or identification of pure material streams – to each type of waste encountered at each business that participated the study.

Cascadia Consulting Group, Inc. C-2 Washington Department of Ecology: Rural Waste Characterization Report
Appendices
ALLOCATION OF SAMPLES TO INDUSTRY GROUPS During the study design phase, 16 waste characterization samples were allocated to each industrial/agricultural group. In practice, some groups ended up having more samples assigned to them, while some received fewer than the planned 16. The differences were the result of the vagaries of recruiting eligible and willing businesses from each group in the participating counties. The planned and actual number of characterization samples for each group is presented in the table below.
Table A-2: Planned and Actual Numbers of Samples by Industry
Overall OverallTarget Actual
Industrial 150-180 159
Field Crops 16 20
Orchards 16 23
Vegetables 16 9
Livestock 16 18
Mining 16 21
C&D 16 22
Paper & Allied Products 16 18
Logging & Primary Wood Products 16 10
Food & Kindred Products 16 18 In addition, the study design included a plan to obtain samples from each of three counties – Grant, Okanogan, and Clallam – in proportions that reflected the presence of each industry in each county and that reflected the resources that each county was devoting to the study. Cascadia Consulting Group conducted the industrial sampling in Grant and Okanogan Counties while Green Solutions, Inc. collected industrial samples in Clallam County.
RECRUITING BUSINESSES TO PARTICIPATE
The first step in recruiting businesses was to obtain a list of sites from a commercial list provider. Then, sites were contacted and screened to determine their cooperativeness and suitability for the study. If a site met the study’s criteria, arrangements were made to obtain waste generation and composition information. The process is described more thoroughly in the sections below.

Cascadia Consulting Group, Inc. C-3 Washington Department of Ecology: Rural Waste Characterization Report
Appendices
SELECTION OF BUSINESS SITES A list of businesses in the State of Washington was obtained from NameFinders, a research organization that supplies business lists and other data collected by Dun and Bradstreet. An industry designation was given to businesses with SIC codes that were included in the nine targeted industry groups. A database record was created for each site in the list, and the records were placed in a random order. Businesses within each industry group were contacted by phone in the order that they occurred in the randomized list. RECRUITING OF BUSINESSES Recruitment was accomplished through the following steps, although the steps may have varied in sequence for particular candidates. Step 1. Make contact. The consultant contacted the randomly selected business, explained the purpose of the study, and asked to speak to the person who is knowledgeable about the types and quantities of wastes the business generates. The consultant recorded the name, phone number, and other contact information for the person who was best able to provide information. Step 2. Gather industry group and size information. The consultant confirmed what the business does as its primary activity and that it fit with its assigned industry group. The consultant then determined the number of employees that work at the site, or, if the business was engaged in agriculture, how many acres or animals it manages. Step 3. Arrange a visit. The consultant made arrangements to visit the site of the business to obtain waste quantity measurements and waste composition data. Step 4. Classify waste streams. The consultant used the interview process to find out about materials that are generated at each site as by-products of the main business activity. Information that could quantify each type of waste was sought, or plans were made to conduct direct measurements during the scheduled visit. The nature and disposition of each waste stream was noted.
VISITING SITES
A visit was arranged with each business. Each visit began with an interview to verify information obtained previously and to discover whether any waste types had been overlooked during the initial phone conversation. Usually, the sampling crew talked through the operation of the business with the representative to confirm that all waste types were mentioned. After it was confirmed that all of the waste had been identified, it was determined which waste could be sampled and sorted and which waste could be quantified and characterized merely by observation or examination of records. The way the waste was “disposed” determined how to sample it. The waste was categorized by three types of “disposal”: landfilled, other disposal, or used beneficially. Landfilled waste. Landfilled waste was generally the easiest type to attach a quantity to. If the business self-hauled the waste, they generally knew the number of trips they made to the landfill each week, month, or year and they knew approximately how much waste they hauled each trip. If the trash was picked up by a commercial hauler, the size of the

Cascadia Consulting Group, Inc. C-4 Washington Department of Ecology: Rural Waste Characterization Report
Appendices
dumpster and frequency of pick-up was determined. If there was currently waste in the dumpster, that waste was manually sorted and weighed, if possible. Otherwise, it characterized visually. Finally, if there was no waste to be sampled at that time, a representative of the business was interviewed to describe the type of waste generated. The annual amount of waste was estimated based on the interview, and a composition profile from other similar sites was applied to the estimated amount. Other disposal. In most cases, businesses used other disposal to handle infrequent wastes. Examples of other disposal include stockpiling or burying waste. In a few cases, businesses consistently used burning as an alternative (other disposal) method of handling refuse. Stockpiled material, such as old equipment or old tires, was easily measured. Beneficial use. While all businesses generally had some type of waste being sent to a landfill, the types and amounts of waste being used beneficially tended to be specific to the industry group. For instance, field crops, orchards, and veggies industry groups had some sort of crop residues that were returned to the field. In most cases, it was possible to obtain a measurement of the amount of material being sent to beneficial use. For example, if a crop had recently been harvested, then a sample of crop residue could be collected and weighed. If it was not possible to obtain an actual measurement of the amount of waste disposed through beneficial use, then an estimate was constructed based on information obtained during the interview with the representative of the business. For example, a business might have records on the amount of waste used beneficially if the waste was transferred to another company for processing.
CALCULATIONS
GENERATION TIME First, each sample was associated with a generation time. The method of determining generation time depended on the type of disposal. For landfilled wastes, if they were commercially collected, the time since the last pick-up was used to estimate generation time, and the amount of waste observed in the waste container was taken to be the amount of waste that had accumulated during that generation time. For example, if the trash was collected on Monday morning and the consultant visited the site on Wednesday morning, the observed quantity would be associated with two days of waste generation. This quantity would then be scaled up to a year. For other landfilled samples, such as self-hauled waste, representatives of participating businesses were interviewed to determine the frequency with which they transported waste to the landfill. Other disposal frequently included stockpiled materials. For such samples, the business representative was asked to estimate the accumulation time associated with the material if the material had been accumulating at a regular rate for the whole time. For instance, a pile of tires might have taken two years to accumulate. This quantity would be divided by two to calculate an annual estimate. If the material did not accumulate at a steady rate, but, instead, was generated as the result of one event, the interviewer asked how often this amount of waste was generated. For example, a pile of trees at an orchard was estimated by the orchard representative to result from tree removals that occur once every ten years. For this reason, the measured quantity was divided by ten to obtain an annual estimate.

Cascadia Consulting Group, Inc. C-5 Washington Department of Ecology: Rural Waste Characterization Report
Appendices
Creating annual estimates for beneficially used waste required a more varied approach than for landfilled or other disposal samples. For instance, for the industrial group field crops, a type of beneficially used waste common to all generators was crop residues. For crops that had been recently harvested, residues were measured by raking up remaining residues within a 625 square foot area. This quantity was first scaled up to an acre then to the total acres at that farm. The resulting quantity represented the quantity of crop residues associated with that crop for that farm. All businesses in the industry group livestock disposed of manures. If they were left in a field, this was considered to be stockpiling. When manures were collected for composting, this material was considered to be beneficially used. Similar to stockpiled materials, if the manures were gathered in one area for composting, the interviewer asked what time it took for the livestock to generate that quantity of manures. This quantity was scaled up to a year based on the estimated generation for that sample. This way, manure generation was estimated for that business for the year. VERIFYING COMPLETENESS OF SAMPLES All businesses were assumed to have landfilled waste. If landfilled waste was not sampled from a business (for example, if the waste had already been picked up on the day of the visit), then a quantity and composition was estimated for the business through interviewing the representative regarding the size of the dumpster, frequency of pick-up, and type of materials disposed of in the dumpster. For certain industry groups, there were types of waste considered crucial to include estimates for. For instance, for the industrial group field crops, crop residues were included for each business. If a sample was not obtained (perhaps because that crop had not recently been harvested), another business’ estimate was used if there existed another sample for this type of material. Otherwise, a literature value was used to supplement the field data. For example, no samples were collected for alfalfa, which is estimated to grow on approximately 810,000 acres of in the State. A National Resources Conservation Service (NRCS) estimate of 2,600 pounds per acre of crop residues was used to fill in this gap in the field data. In this way, crop residues were estimated for different crops when actual samples had not been collected. For livestock industrial group, manures was completed for each business. For orchards, prunings left on the ground as well as periodic tree removals were both estimated for each business in this category as these were known to occur in every instance. DIVISIONS WITHIN INDUSTRY GROUPS Some industry groups were determined to have important divisions with unique waste. All of the agricultural industry groups, field crops, orchards, vegetables, and livestock, were divided further for the purposes of characterizing all types of waste in these groups. The field crops group was divided into alfalfa, potatoes, wheat, herbs, and “all other field crops.” Because the crucial type of waste for this group was crop residues, it was verified that there was an estimate of crop residues for each type of field crop. The estimates for the material manures for livestock also were specific to the animal: llamas, beef cows, dairy cows, other adult cows, calves, sheep, pigs, horses, and chickens. The only animal that manures was not estimated for was fish in fish farms.
Cascadia Consulting Group, Inc. C-6 Washington Department of Ecology: Rural Waste Characterization Report
Appendices
SCALING UP TO STATEWIDE LEVEL
When all businesses and industry groups were considered to represent complete profiles of the waste, quantities of materials were summed across industry groups by types of disposal (landfilled, other disposal, beneficial use). A factor or unit was chosen specific to each industry group to scale up the quantities. For field crops, orchards, and vegetables, that unit was acres. For livestock, it was number of animals. Within each division, samples were scaled up to the State and then summed. In other words, total waste generated in the State was calculated separately for alfalfa, potatoes, wheat, herbs, and “all other field crops” and then summed. This was estimated to be the waste for the entire field crops industrial group. The unit for scaling for mining, paper, logging, and food processing was number of employees. For construction & demolition, quantities were scaled up by construction wages. This was the only data available for this industry at both the county and state level. For each type of waste generated by each industry group, statewide quantities were estimated through the following general steps.
• First, the total amount of each type of waste associated with an industry group was calculated for the participating businesses. For example, of the fruit orchards that were visited, the consultant calculated a total amount of material that was sent to beneficial use annually.
• Second, the total amount of each type of waste was divided by the total number of employees, acres, animals, etc., at the participating businesses. For example, the total number of acres in production for the visited orchards was calculated.
• Third, the per-employee, per-acre, etc. generation figure was multiplied by the numbers of similar employees, acres, etc. throughout the state to develop a statewide generation estimate for the particular type of waste. In our example of orchards, the average per-acre figure for waste generation through beneficial use was applied to the total known acreage of fruit orchards throughout the state.

Cascadia Consulting Group, Inc. D-1 Washington Department of Ecology: Rural Waste Characterization Report
Appendices
APPENDIX D: FIELD FORMS
Field forms used in this study are included in the following order. • Facility Vehicle Survey Sheet • Waste Sorting Tally Sheet

Cascadia Consulting Group, Inc. D-2 Washington Department of Ecology: Rural Waste Characterization Report
Appendices
Figure D-1: Facility Vehicle Survey Sheet
Date __________________ Surveyor: ___________________ Page _____ of _____Site ___________________________
Customer Type Source
For Mixed Res and Biz loads
Net Volume of Load (in yards) Surveyor's Notes
Ask driver toS = self-haul R = residential estimate % of load
B = business that is Res and BizM = mixed R & BCD = const/demo (Must total to 100%)
I = industrial*TS = transfer trailer
O = other % Res % Biz
1 S C R B M CD I TS O
2 S C R B M CD I TS O
3 S C R B M CD I TS O
4 S C R B M CD I TS O
5 S C R B M CD I TS O
6 S C R B M CD I TS O
7 S C R B M CD I TS O
8 S C R B M CD I TS O
9 S C R B M CD I TS O
10 S C R B M CD I TS O
11 S C R B M CD I TS O
12 S C R B M CD I TS O
13 S C R B M CD I TS O
14 S C R B M CD I TS O
15 S C R B M CD I TS O
16 S C R B M CD I TS O
17 S C R B M CD I TS O
18 S C R B M CD I TS O
19 S C R B M CD I TS O
20 S C R B M CD I TS O
21 S C R B M CD I TS O
22 S C R B M CD I TS O
23 S C R B M CD I TS O
24 S C R B M CD I TS O
25 S C R B M CD I TS O
1. Start a new survey sheet for each day of the week-long suvey period.2. Complete a survey entry for each vehicle that enters the facility.3. Make entries neatly in pen.4. Enter the information at the top of each page. Enter total # of pages on each page at the end of the day.5. If you circle the mixed source ask the driver for the % of each.6. If you make an error on an entry, draw a line through the entire entry and start over on a new line.
C = comm'l or public
*7. Industral includes: 1) loads from agriculture, livestock, mining and logging operations and 2) loads from manufacturing operations such as food processing, milling, pulp & paper etc. If uncertain, write the company name in "surveyor's notes."
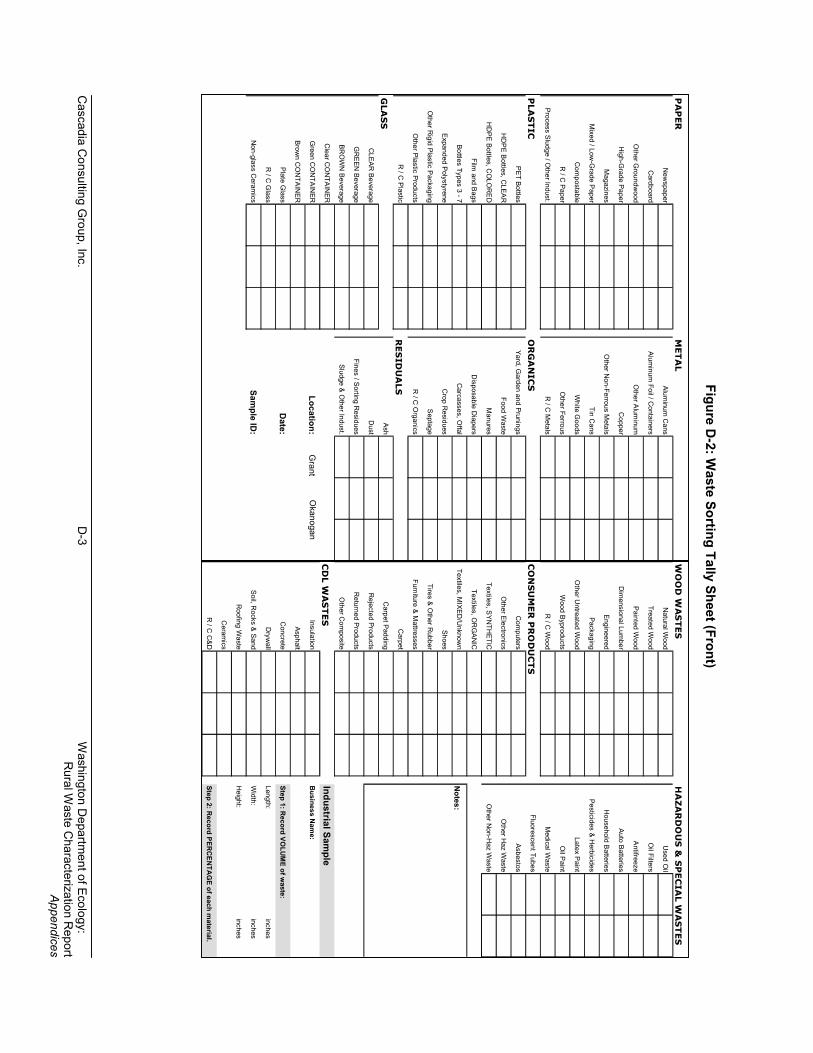
Cascadia C
onsulting Group, Inc.
D-3
Washington D
epartment of Ecology:
Rural W
aste Characterization R
eport Appendices
Figure D-2: W
aste Sorting Tally Sheet (Front)
PA
PE
R
ME
TA
LN
ewspaper
Aluminum
Cans
Cardboard
Aluminum
Foil / Containers
Other G
roundwood
Other A
luminum
High-G
rade PaperC
opper
Magazines
Other N
on-Ferrous Metals
Mixed / Low
-Grade P
aperTin C
ans
Com
postableW
hite Goods
R / C
PaperO
ther Ferrous
Process Sludge / O
ther Indust.R
/ C M
etals
PLA
ST
ICO
RG
AN
ICS
PET BottlesYard, G
arden and Prunings
HD
PE B
ottles, CLEA
RFood W
aste
HD
PE Bottles, CO
LOR
ED
Manures
Film and B
agsD
isposable Diapers
Bottles Types 3 - 7C
arcasses, Offal
Expanded PolystyreneC
rop Residues
Other R
igid Plastic Packaging
Septage
Other Plastic Products
R / C
Organics
R / C
PlasticR
ES
IDU
ALS
GLA
SS
Ash
CLEAR
BeverageD
ust
GR
EEN Beverage
Fines / Sorting Residues
BRO
WN
BeverageSludge &
Other Indust.
Clear C
ON
TAINER
Green C
ON
TAINER
Location:G
rantBrow
n CO
NTAIN
ER
Plate G
lassD
ate:R
/ C G
lass
Non-glass C
eramics
Sample ID
:
Okanogan
WO
OD
WA
ST
ES
H
AZ
AR
DO
US
& S
PE
CIA
L W
AS
TE
S
Natural W
oodU
sed Oil
Treated Wood
Oil Filters
Painted W
oodA
ntifreeze
Dim
ensional Lumber
Auto Batteries
EngineeredH
ousehold Batteries
PackagingPesticides & H
erbicides
Other U
ntreated Wood
Latex Paint
Wood Byproducts
Oil P
aint
R / C
Wood
Medical W
aste
CO
NS
UM
ER
PR
OD
UC
TS
Fluorescent Tubes
Com
putersAsbestos
Other E
lectronicsO
ther Haz W
aste
Textiles, SYN
THETIC
Other N
on-Haz W
aste
Textiles, OR
GA
NIC
Textiles, MIXED
/Unknow
nN
otes:Shoes
Tires & Other R
ubber
Furniture & Mattresses
Carpet
Carpet Padding
Rejected Products
Returned Products
Other C
omposite
CD
L W
AS
TE
SIndustrial Sam
pleInsulation
Business N
ame:
Asphalt
Concrete
Step 1: Record VO
LUM
E of waste:
Dryw
allLength:
inches
Soil, Rocks &
SandW
idth: inches
Roofing W
asteH
eight: inches
Ceram
ics
R / C
C&D
Step 2: Record PER
CEN
TAG
E of each material.
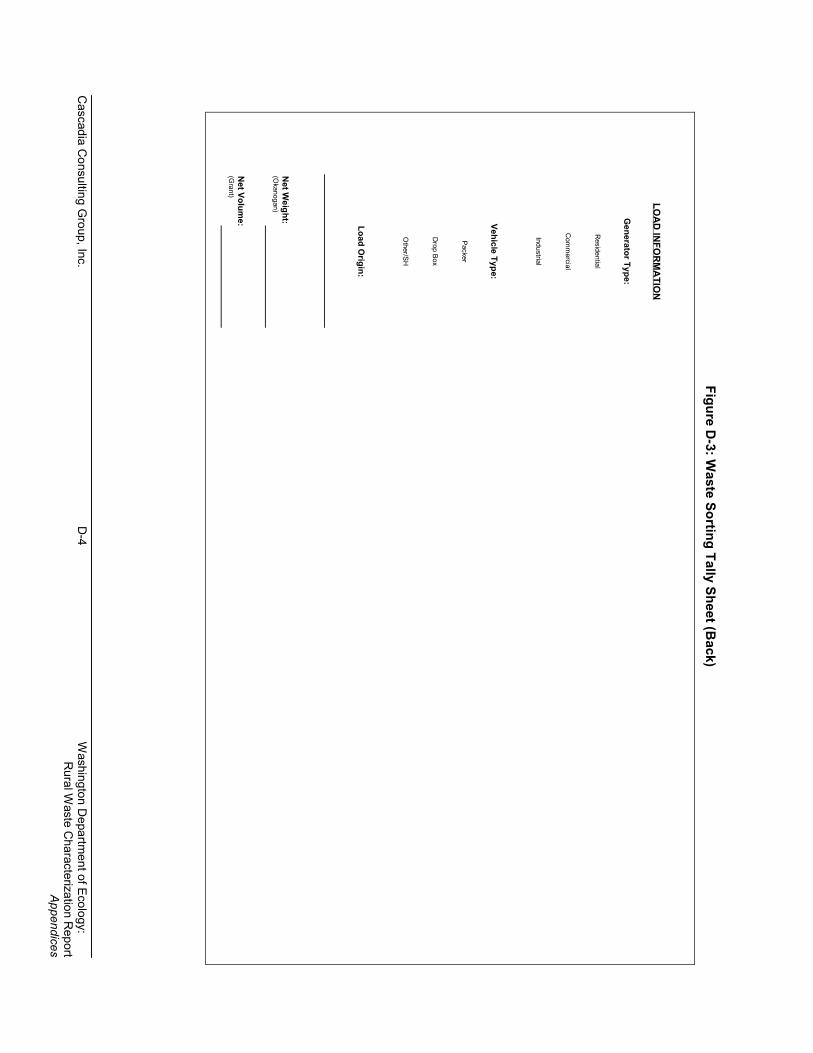
Cascadia C
onsulting Group, Inc.
D-4
Washington D
epartment of Ecology:
Rural W
aste Characterization R
eport Appendices
Figure D-3: W
aste Sorting Tally Sheet (Back)
LOA
D IN
FOR
MA
TION
Generator Type:
Residential
Com
mercial
Industrial
Vehicle Type:
Packer
Drop Box
Other/SH
Load Origin:
Net W
eight:(O
kanogan)
Net Volum
e:(G
rant)
Cascadia Consulting Group, Inc. E-1 Washington Department of Ecology: Rural Waste Characterization Report
Appendices
APPENDIX E: DETAILED COUNTY WASTE COMPOSITION PROFILES BY SECTOR
This appendix presents detailed waste composition and quantity profiles for Grant and Okanogan Counties. Within each County, an overall composition table is first and is followed by detailed tables for the commercial, industrial, and consumer sectors. The profiles are a result of on-site disposal sampling, industrial sampling, and transfer station surveys.
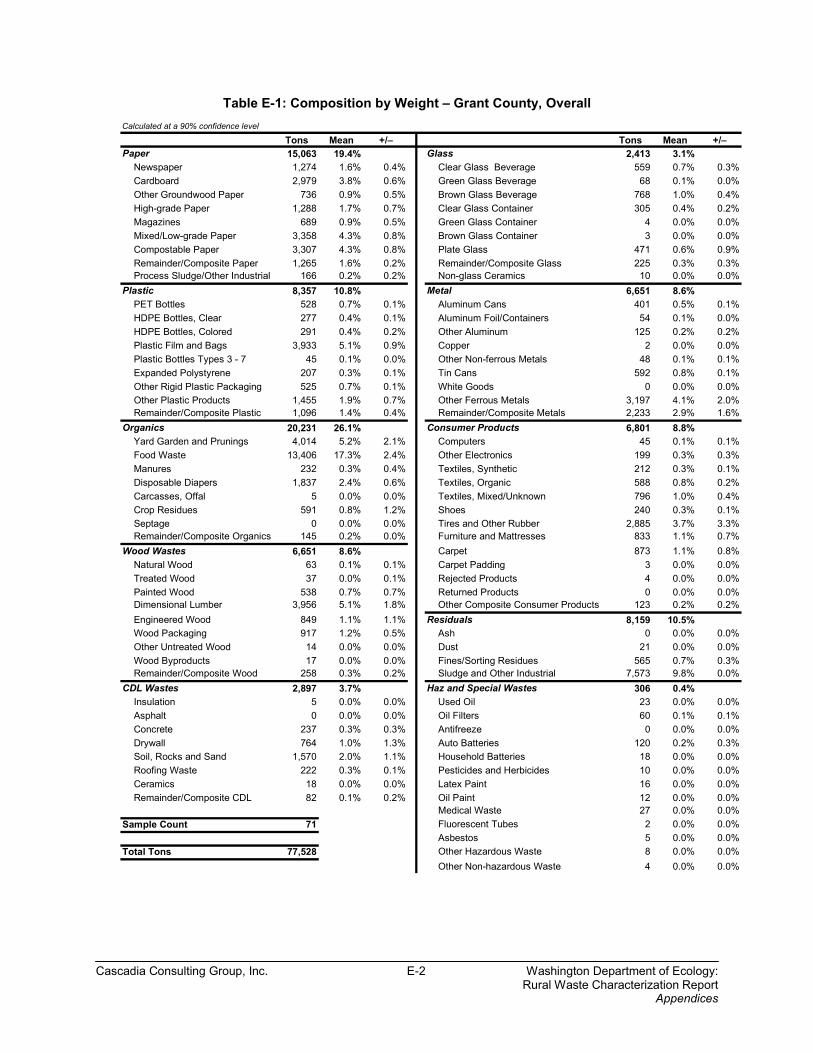
Cascadia Consulting Group, Inc. E-2 Washington Department of Ecology: Rural Waste Characterization Report
Appendices
Table E-1: Composition by Weight – Grant County, Overall Calculated at a 90% confidence level
Tons Mean +/– Tons Mean +/–Paper 15,063 19.4% Glass 2,413 3.1%
Newspaper 1,274 1.6% 0.4% Clear Glass Beverage 559 0.7% 0.3%Cardboard 2,979 3.8% 0.6% Green Glass Beverage 68 0.1% 0.0%Other Groundwood Paper 736 0.9% 0.5% Brown Glass Beverage 768 1.0% 0.4%High-grade Paper 1,288 1.7% 0.7% Clear Glass Container 305 0.4% 0.2%Magazines 689 0.9% 0.5% Green Glass Container 4 0.0% 0.0%Mixed/Low-grade Paper 3,358 4.3% 0.8% Brown Glass Container 3 0.0% 0.0%Compostable Paper 3,307 4.3% 0.8% Plate Glass 471 0.6% 0.9%Remainder/Composite Paper 1,265 1.6% 0.2% Remainder/Composite Glass 225 0.3% 0.3%Process Sludge/Other Industrial 166 0.2% 0.2% Non-glass Ceramics 10 0.0% 0.0%
Plastic 8,357 10.8% Metal 6,651 8.6%PET Bottles 528 0.7% 0.1% Aluminum Cans 401 0.5% 0.1%HDPE Bottles, Clear 277 0.4% 0.1% Aluminum Foil/Containers 54 0.1% 0.0%HDPE Bottles, Colored 291 0.4% 0.2% Other Aluminum 125 0.2% 0.2%Plastic Film and Bags 3,933 5.1% 0.9% Copper 2 0.0% 0.0%Plastic Bottles Types 3 - 7 45 0.1% 0.0% Other Non-ferrous Metals 48 0.1% 0.1%Expanded Polystyrene 207 0.3% 0.1% Tin Cans 592 0.8% 0.1%Other Rigid Plastic Packaging 525 0.7% 0.1% White Goods 0 0.0% 0.0%Other Plastic Products 1,455 1.9% 0.7% Other Ferrous Metals 3,197 4.1% 2.0%Remainder/Composite Plastic 1,096 1.4% 0.4% Remainder/Composite Metals 2,233 2.9% 1.6%
Organics 20,231 26.1% Consumer Products 6,801 8.8%Yard Garden and Prunings 4,014 5.2% 2.1% Computers 45 0.1% 0.1%Food Waste 13,406 17.3% 2.4% Other Electronics 199 0.3% 0.3%Manures 232 0.3% 0.4% Textiles, Synthetic 212 0.3% 0.1%Disposable Diapers 1,837 2.4% 0.6% Textiles, Organic 588 0.8% 0.2%Carcasses, Offal 5 0.0% 0.0% Textiles, Mixed/Unknown 796 1.0% 0.4%Crop Residues 591 0.8% 1.2% Shoes 240 0.3% 0.1%Septage 0 0.0% 0.0% Tires and Other Rubber 2,885 3.7% 3.3%Remainder/Composite Organics 145 0.2% 0.0% Furniture and Mattresses 833 1.1% 0.7%
Wood Wastes 6,651 8.6% Carpet 873 1.1% 0.8%Natural Wood 63 0.1% 0.1% Carpet Padding 3 0.0% 0.0%Treated Wood 37 0.0% 0.1% Rejected Products 4 0.0% 0.0%Painted Wood 538 0.7% 0.7% Returned Products 0 0.0% 0.0%Dimensional Lumber 3,956 5.1% 1.8% Other Composite Consumer Products 123 0.2% 0.2%Engineered Wood 849 1.1% 1.1% Residuals 8,159 10.5%Wood Packaging 917 1.2% 0.5% Ash 0 0.0% 0.0%Other Untreated Wood 14 0.0% 0.0% Dust 21 0.0% 0.0%Wood Byproducts 17 0.0% 0.0% Fines/Sorting Residues 565 0.7% 0.3%Remainder/Composite Wood 258 0.3% 0.2% Sludge and Other Industrial 7,573 9.8% 0.0%
CDL Wastes 2,897 3.7% Haz and Special Wastes 306 0.4%Insulation 5 0.0% 0.0% Used Oil 23 0.0% 0.0%Asphalt 0 0.0% 0.0% Oil Filters 60 0.1% 0.1%Concrete 237 0.3% 0.3% Antifreeze 0 0.0% 0.0%Drywall 764 1.0% 1.3% Auto Batteries 120 0.2% 0.3%Soil, Rocks and Sand 1,570 2.0% 1.1% Household Batteries 18 0.0% 0.0%Roofing Waste 222 0.3% 0.1% Pesticides and Herbicides 10 0.0% 0.0%Ceramics 18 0.0% 0.0% Latex Paint 16 0.0% 0.0%Remainder/Composite CDL 82 0.1% 0.2% Oil Paint 12 0.0% 0.0%
Medical Waste 27 0.0% 0.0%Sample Count 71 Fluorescent Tubes 2 0.0% 0.0%
Asbestos 5 0.0% 0.0%Total Tons 77,528 Other Hazardous Waste 8 0.0% 0.0%
Other Non-hazardous Waste 4 0.0% 0.0%

Cascadia Consulting Group, Inc. E-3 Washington Department of Ecology: Rural Waste Characterization Report
Appendices
Table E-2: Composition by Weight – Grant County, Commercial Calculated at a 90% confidence level
Tons Mean +/– Tons Mean +/–Paper 8,384 24.1% Glass 1,554 4.5%
Newspaper 724 2.1% 0.7% Clear Glass Beverage 366 1.1% 0.6%Cardboard 1,891 5.4% 1.1% Green Glass Beverage 12 0.0% 0.0%Other Groundwood Paper 306 0.9% 0.3% Brown Glass Beverage 491 1.4% 0.8%High-grade Paper 821 2.4% 1.5% Clear Glass Container 158 0.5% 0.3%Magazines 389 1.1% 1.1% Green Glass Container 1 0.0% 0.0%Mixed/Low-grade Paper 1,684 4.8% 1.7% Brown Glass Container 0 0.0% 0.0%Compostable Paper 2,031 5.8% 1.7% Plate Glass 471 1.4% 2.0%Remainder/Composite Paper 409 1.2% 0.5% Remainder/Composite Glass 55 0.2% 0.1%Process Sludge/Other Industrial 129 0.4% 0.4% Non-glass Ceramics 1 0.0% 0.0%
Plastic 4,772 13.7% Metal 3,459 9.9%PET Bottles 218 0.6% 0.2% Aluminum Cans 181 0.5% 0.2%HDPE Bottles, Clear 103 0.3% 0.1% Aluminum Foil/Containers 30 0.1% 0.0%HDPE Bottles, Colored 75 0.2% 0.1% Other Aluminum 32 0.1% 0.1%Plastic Film and Bags 2,313 6.6% 2.0% Copper 1 0.0% 0.0%Plastic Bottles Types 3 - 7 7 0.0% 0.0% Other Non-ferrous Metals 13 0.0% 0.0%Expanded Polystyrene 103 0.3% 0.1% Tin Cans 199 0.6% 0.2%Other Rigid Plastic Packaging 263 0.8% 0.2% White Goods 0 0.0% 0.0%Other Plastic Products 1,184 3.4% 1.5% Other Ferrous Metals 1,804 5.2% 3.4%Remainder/Composite Plastic 506 1.5% 0.8% Remainder/Composite Metals 1,199 3.4% 2.0%
Organics 8,595 24.7% Consumer Products 5,056 14.5%Yard Garden and Prunings 1,326 3.8% 2.3% Computers 45 0.1% 0.2%Food Waste 6,158 17.7% 4.7% Other Electronics 161 0.5% 0.7%Manures 21 0.1% 0.1% Textiles, Synthetic 80 0.2% 0.1%Disposable Diapers 476 1.4% 0.7% Textiles, Organic 292 0.8% 0.3%Carcasses, Offal 0 0.0% 0.0% Textiles, Mixed/Unknown 444 1.3% 0.9%Crop Residues 591 1.7% 2.7% Shoes 130 0.4% 0.3%Septage 0 0.0% 0.0% Tires and Other Rubber 2,733 7.9% 7.3%Remainder/Composite Organics 22 0.1% 0.0% Furniture and Mattresses 577 1.7% 1.1%
Wood Wastes 1,625 4.7% Carpet 521 1.5% 1.6%Natural Wood 57 0.2% 0.3% Carpet Padding 0 0.0% 0.0%Treated Wood 36 0.1% 0.1% Rejected Products 0 0.0% 0.0%Painted Wood 300 0.9% 0.6% Returned Products 0 0.0% 0.0%Dimensional Lumber 514 1.5% 0.8% Other Composite Consumer Products 73 0.2% 0.3%Engineered Wood 75 0.2% 0.2% Residuals 279 0.8%Wood Packaging 408 1.2% 1.2% Ash 0 0.0% 0.0%Other Untreated Wood 9 0.0% 0.0% Dust 0 0.0% 0.0%Wood Byproducts 0 0.0% 0.0% Fines/Sorting Residues 279 0.8% 0.4%Remainder/Composite Wood 226 0.6% 0.5% Sludge and Other Industrial 0 0.0% 0.0%
CDL Wastes 825 2.4% Haz and Special Wastes 244 0.7%Insulation 2 0.0% 0.0% Used Oil 8 0.0% 0.0%Asphalt 0 0.0% 0.0% Oil Filters 50 0.1% 0.2%Concrete 62 0.2% 0.3% Antifreeze 0 0.0% 0.0%Drywall 102 0.3% 0.3% Auto Batteries 120 0.3% 0.6%Soil, Rocks and Sand 568 1.6% 2.0% Household Batteries 12 0.0% 0.0%Roofing Waste 1 0.0% 0.0% Pesticides and Herbicides 0 0.0% 0.0%Ceramics 17 0.1% 0.1% Latex Paint 16 0.0% 0.1%Remainder/Composite CDL 72 0.2% 0.3% Oil Paint 11 0.0% 0.0%
Medical Waste 24 0.1% 0.1%Sample Count 42 Fluorescent Tubes 0 0.0% 0.0%
Asbestos 0 0.0% 0.0%Total Tons 34,793 Other Hazardous Waste 0 0.0% 0.0%
Other Non-hazardous Waste 1 0.0% 0.0%
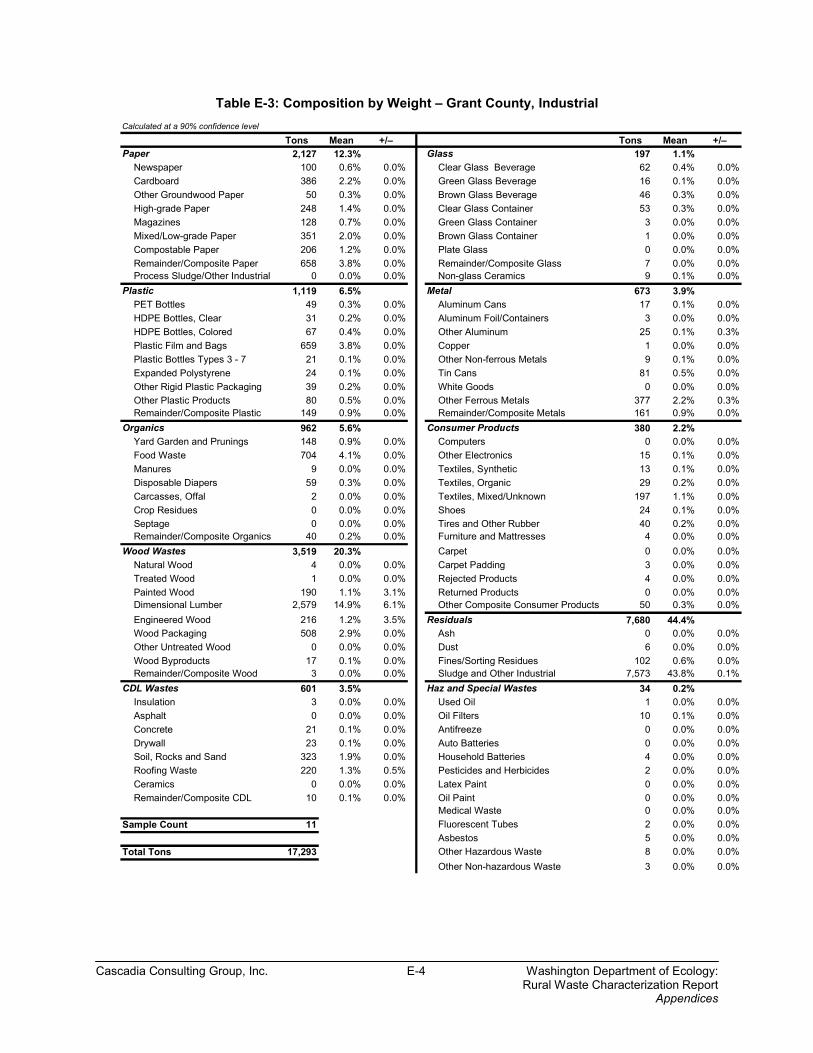
Cascadia Consulting Group, Inc. E-4 Washington Department of Ecology: Rural Waste Characterization Report
Appendices
Table E-3: Composition by Weight – Grant County, Industrial Calculated at a 90% confidence level
Tons Mean +/– Tons Mean +/–Paper 2,127 12.3% Glass 197 1.1%
Newspaper 100 0.6% 0.0% Clear Glass Beverage 62 0.4% 0.0%Cardboard 386 2.2% 0.0% Green Glass Beverage 16 0.1% 0.0%Other Groundwood Paper 50 0.3% 0.0% Brown Glass Beverage 46 0.3% 0.0%High-grade Paper 248 1.4% 0.0% Clear Glass Container 53 0.3% 0.0%Magazines 128 0.7% 0.0% Green Glass Container 3 0.0% 0.0%Mixed/Low-grade Paper 351 2.0% 0.0% Brown Glass Container 1 0.0% 0.0%Compostable Paper 206 1.2% 0.0% Plate Glass 0 0.0% 0.0%Remainder/Composite Paper 658 3.8% 0.0% Remainder/Composite Glass 7 0.0% 0.0%Process Sludge/Other Industrial 0 0.0% 0.0% Non-glass Ceramics 9 0.1% 0.0%
Plastic 1,119 6.5% Metal 673 3.9%PET Bottles 49 0.3% 0.0% Aluminum Cans 17 0.1% 0.0%HDPE Bottles, Clear 31 0.2% 0.0% Aluminum Foil/Containers 3 0.0% 0.0%HDPE Bottles, Colored 67 0.4% 0.0% Other Aluminum 25 0.1% 0.3%Plastic Film and Bags 659 3.8% 0.0% Copper 1 0.0% 0.0%Plastic Bottles Types 3 - 7 21 0.1% 0.0% Other Non-ferrous Metals 9 0.1% 0.0%Expanded Polystyrene 24 0.1% 0.0% Tin Cans 81 0.5% 0.0%Other Rigid Plastic Packaging 39 0.2% 0.0% White Goods 0 0.0% 0.0%Other Plastic Products 80 0.5% 0.0% Other Ferrous Metals 377 2.2% 0.3%Remainder/Composite Plastic 149 0.9% 0.0% Remainder/Composite Metals 161 0.9% 0.0%
Organics 962 5.6% Consumer Products 380 2.2%Yard Garden and Prunings 148 0.9% 0.0% Computers 0 0.0% 0.0%Food Waste 704 4.1% 0.0% Other Electronics 15 0.1% 0.0%Manures 9 0.0% 0.0% Textiles, Synthetic 13 0.1% 0.0%Disposable Diapers 59 0.3% 0.0% Textiles, Organic 29 0.2% 0.0%Carcasses, Offal 2 0.0% 0.0% Textiles, Mixed/Unknown 197 1.1% 0.0%Crop Residues 0 0.0% 0.0% Shoes 24 0.1% 0.0%Septage 0 0.0% 0.0% Tires and Other Rubber 40 0.2% 0.0%Remainder/Composite Organics 40 0.2% 0.0% Furniture and Mattresses 4 0.0% 0.0%
Wood Wastes 3,519 20.3% Carpet 0 0.0% 0.0%Natural Wood 4 0.0% 0.0% Carpet Padding 3 0.0% 0.0%Treated Wood 1 0.0% 0.0% Rejected Products 4 0.0% 0.0%Painted Wood 190 1.1% 3.1% Returned Products 0 0.0% 0.0%Dimensional Lumber 2,579 14.9% 6.1% Other Composite Consumer Products 50 0.3% 0.0%Engineered Wood 216 1.2% 3.5% Residuals 7,680 44.4%Wood Packaging 508 2.9% 0.0% Ash 0 0.0% 0.0%Other Untreated Wood 0 0.0% 0.0% Dust 6 0.0% 0.0%Wood Byproducts 17 0.1% 0.0% Fines/Sorting Residues 102 0.6% 0.0%Remainder/Composite Wood 3 0.0% 0.0% Sludge and Other Industrial 7,573 43.8% 0.1%
CDL Wastes 601 3.5% Haz and Special Wastes 34 0.2%Insulation 3 0.0% 0.0% Used Oil 1 0.0% 0.0%Asphalt 0 0.0% 0.0% Oil Filters 10 0.1% 0.0%Concrete 21 0.1% 0.0% Antifreeze 0 0.0% 0.0%Drywall 23 0.1% 0.0% Auto Batteries 0 0.0% 0.0%Soil, Rocks and Sand 323 1.9% 0.0% Household Batteries 4 0.0% 0.0%Roofing Waste 220 1.3% 0.5% Pesticides and Herbicides 2 0.0% 0.0%Ceramics 0 0.0% 0.0% Latex Paint 0 0.0% 0.0%Remainder/Composite CDL 10 0.1% 0.0% Oil Paint 0 0.0% 0.0%
Medical Waste 0 0.0% 0.0%Sample Count 11 Fluorescent Tubes 2 0.0% 0.0%
Asbestos 5 0.0% 0.0%Total Tons 17,293 Other Hazardous Waste 8 0.0% 0.0%
Other Non-hazardous Waste 3 0.0% 0.0%

Cascadia Consulting Group, Inc. E-5 Washington Department of Ecology: Rural Waste Characterization Report
Appendices
Table E-4: Composition by Weight – Grant County, Consumer Calculated at a 90% confidence level
Tons Mean +/– Tons Mean +/–Paper 4,552 17.9% Glass 662 2.6%
Newspaper 451 1.8% 0.8% Clear Glass Beverage 130 0.5% 0.2%Cardboard 703 2.8% 0.8% Green Glass Beverage 40 0.2% 0.1%Other Groundwood Paper 381 1.5% 1.4% Brown Glass Beverage 231 0.9% 0.4%High-grade Paper 219 0.9% 0.5% Clear Glass Container 95 0.4% 0.3%Magazines 172 0.7% 0.4% Green Glass Container 0 0.0% 0.0%Mixed/Low-grade Paper 1,323 5.2% 1.0% Brown Glass Container 2 0.0% 0.0%Compostable Paper 1,069 4.2% 0.7% Plate Glass 0 0.0% 0.0%Remainder/Composite Paper 198 0.8% 0.4% Remainder/Composite Glass 164 0.6% 1.0%Process Sludge/Other Industrial 37 0.1% 0.2% Non-glass Ceramics 1 0.0% 0.0%
Plastic 2,466 9.7% Metal 2,518 9.9%PET Bottles 261 1.0% 0.1% Aluminum Cans 203 0.8% 0.1%HDPE Bottles, Clear 143 0.6% 0.1% Aluminum Foil/Containers 22 0.1% 0.0%HDPE Bottles, Colored 149 0.6% 0.4% Other Aluminum 68 0.3% 0.4%Plastic Film and Bags 961 3.8% 0.9% Copper 0 0.0% 0.0%Plastic Bottles Types 3 - 7 17 0.1% 0.0% Other Non-ferrous Metals 25 0.1% 0.2%Expanded Polystyrene 79 0.3% 0.1% Tin Cans 312 1.2% 0.3%Other Rigid Plastic Packaging 224 0.9% 0.2% White Goods 0 0.0% 0.0%Other Plastic Products 191 0.8% 0.5% Other Ferrous Metals 1,016 4.0% 3.9%Remainder/Composite Plastic 441 1.7% 0.8% Remainder/Composite Metals 872 3.4% 3.9%
Organics 10,675 42.0% Consumer Products 1,365 5.4%Yard Garden and Prunings 2,540 10.0% 5.6% Computers 0 0.0% 0.0%Food Waste 6,544 25.7% 3.4% Other Electronics 22 0.1% 0.1%Manures 202 0.8% 1.2% Textiles, Synthetic 119 0.5% 0.4%Disposable Diapers 1,302 5.1% 1.5% Textiles, Organic 267 1.1% 0.4%Carcasses, Offal 4 0.0% 0.0% Textiles, Mixed/Unknown 155 0.6% 0.3%Crop Residues 0 0.0% 0.0% Shoes 86 0.3% 0.2%Septage 0 0.0% 0.0% Tires and Other Rubber 112 0.4% 0.1%Remainder/Composite Organics 83 0.3% 0.1% Furniture and Mattresses 252 1.0% 1.6%
Wood Wastes 1,507 5.9% Carpet 352 1.4% 1.0%Natural Wood 2 0.0% 0.0% Carpet Padding 0 0.0% 0.0%Treated Wood 0 0.0% 0.0% Rejected Products 0 0.0% 0.0%Painted Wood 49 0.2% 0.2% Returned Products 0 0.0% 0.0%Dimensional Lumber 864 3.4% 3.6% Other Composite Consumer Products 0 0.0% 0.0%Engineered Wood 559 2.2% 2.4% Residuals 200 0.8%Wood Packaging 0 0.0% 0.0% Ash 0 0.0% 0.0%Other Untreated Wood 5 0.0% 0.0% Dust 16 0.1% 0.1%Wood Byproducts 0 0.0% 0.0% Fines/Sorting Residues 184 0.7% 0.6%Remainder/Composite Wood 29 0.1% 0.1% Sludge and Other Industrial 0 0.0% 0.0%
CDL Wastes 1,471 5.8% Haz and Special Wastes 28 0.1%Insulation 0 0.0% 0.0% Used Oil 14 0.1% 0.1%Asphalt 0 0.0% 0.0% Oil Filters 0 0.0% 0.0%Concrete 154 0.6% 1.0% Antifreeze 0 0.0% 0.0%Drywall 639 2.5% 3.9% Auto Batteries 0 0.0% 0.0%Soil, Rocks and Sand 678 2.7% 2.0% Household Batteries 3 0.0% 0.0%Roofing Waste 0 0.0% 0.0% Pesticides and Herbicides 8 0.0% 0.1%Ceramics 0 0.0% 0.0% Latex Paint 0 0.0% 0.0%Remainder/Composite CDL 0 0.0% 0.0% Oil Paint 0 0.0% 0.0%
Medical Waste 3 0.0% 0.0%Sample Count 18 Fluorescent Tubes 0 0.0% 0.0%
Asbestos 0 0.0% 0.0%Total Tons 25,443 Other Hazardous Waste 0 0.0% 0.0%
Other Non-hazardous Waste 0 0.0% 0.0%
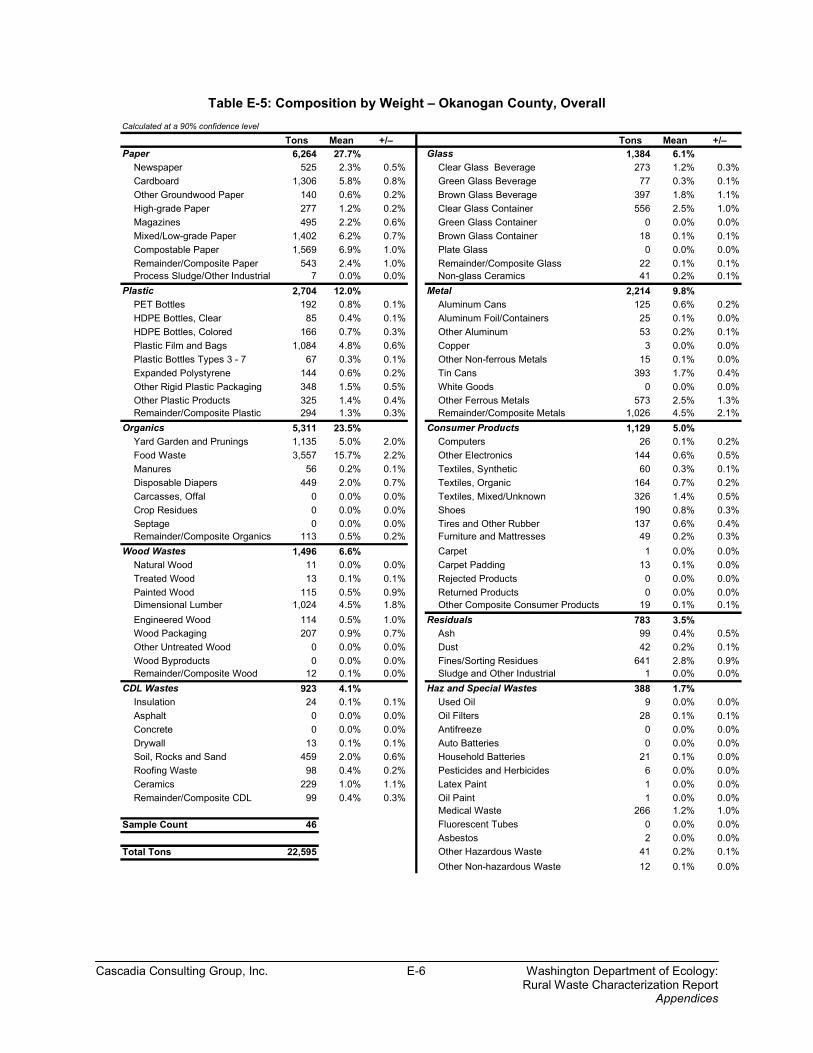
Cascadia Consulting Group, Inc. E-6 Washington Department of Ecology: Rural Waste Characterization Report
Appendices
Table E-5: Composition by Weight – Okanogan County, Overall Calculated at a 90% confidence level
Tons Mean +/– Tons Mean +/–Paper 6,264 27.7% Glass 1,384 6.1%
Newspaper 525 2.3% 0.5% Clear Glass Beverage 273 1.2% 0.3%Cardboard 1,306 5.8% 0.8% Green Glass Beverage 77 0.3% 0.1%Other Groundwood Paper 140 0.6% 0.2% Brown Glass Beverage 397 1.8% 1.1%High-grade Paper 277 1.2% 0.2% Clear Glass Container 556 2.5% 1.0%Magazines 495 2.2% 0.6% Green Glass Container 0 0.0% 0.0%Mixed/Low-grade Paper 1,402 6.2% 0.7% Brown Glass Container 18 0.1% 0.1%Compostable Paper 1,569 6.9% 1.0% Plate Glass 0 0.0% 0.0%Remainder/Composite Paper 543 2.4% 1.0% Remainder/Composite Glass 22 0.1% 0.1%Process Sludge/Other Industrial 7 0.0% 0.0% Non-glass Ceramics 41 0.2% 0.1%
Plastic 2,704 12.0% Metal 2,214 9.8%PET Bottles 192 0.8% 0.1% Aluminum Cans 125 0.6% 0.2%HDPE Bottles, Clear 85 0.4% 0.1% Aluminum Foil/Containers 25 0.1% 0.0%HDPE Bottles, Colored 166 0.7% 0.3% Other Aluminum 53 0.2% 0.1%Plastic Film and Bags 1,084 4.8% 0.6% Copper 3 0.0% 0.0%Plastic Bottles Types 3 - 7 67 0.3% 0.1% Other Non-ferrous Metals 15 0.1% 0.0%Expanded Polystyrene 144 0.6% 0.2% Tin Cans 393 1.7% 0.4%Other Rigid Plastic Packaging 348 1.5% 0.5% White Goods 0 0.0% 0.0%Other Plastic Products 325 1.4% 0.4% Other Ferrous Metals 573 2.5% 1.3%Remainder/Composite Plastic 294 1.3% 0.3% Remainder/Composite Metals 1,026 4.5% 2.1%
Organics 5,311 23.5% Consumer Products 1,129 5.0%Yard Garden and Prunings 1,135 5.0% 2.0% Computers 26 0.1% 0.2%Food Waste 3,557 15.7% 2.2% Other Electronics 144 0.6% 0.5%Manures 56 0.2% 0.1% Textiles, Synthetic 60 0.3% 0.1%Disposable Diapers 449 2.0% 0.7% Textiles, Organic 164 0.7% 0.2%Carcasses, Offal 0 0.0% 0.0% Textiles, Mixed/Unknown 326 1.4% 0.5%Crop Residues 0 0.0% 0.0% Shoes 190 0.8% 0.3%Septage 0 0.0% 0.0% Tires and Other Rubber 137 0.6% 0.4%Remainder/Composite Organics 113 0.5% 0.2% Furniture and Mattresses 49 0.2% 0.3%
Wood Wastes 1,496 6.6% Carpet 1 0.0% 0.0%Natural Wood 11 0.0% 0.0% Carpet Padding 13 0.1% 0.0%Treated Wood 13 0.1% 0.1% Rejected Products 0 0.0% 0.0%Painted Wood 115 0.5% 0.9% Returned Products 0 0.0% 0.0%Dimensional Lumber 1,024 4.5% 1.8% Other Composite Consumer Products 19 0.1% 0.1%Engineered Wood 114 0.5% 1.0% Residuals 783 3.5%Wood Packaging 207 0.9% 0.7% Ash 99 0.4% 0.5%Other Untreated Wood 0 0.0% 0.0% Dust 42 0.2% 0.1%Wood Byproducts 0 0.0% 0.0% Fines/Sorting Residues 641 2.8% 0.9%Remainder/Composite Wood 12 0.1% 0.0% Sludge and Other Industrial 1 0.0% 0.0%
CDL Wastes 923 4.1% Haz and Special Wastes 388 1.7%Insulation 24 0.1% 0.1% Used Oil 9 0.0% 0.0%Asphalt 0 0.0% 0.0% Oil Filters 28 0.1% 0.1%Concrete 0 0.0% 0.0% Antifreeze 0 0.0% 0.0%Drywall 13 0.1% 0.1% Auto Batteries 0 0.0% 0.0%Soil, Rocks and Sand 459 2.0% 0.6% Household Batteries 21 0.1% 0.0%Roofing Waste 98 0.4% 0.2% Pesticides and Herbicides 6 0.0% 0.0%Ceramics 229 1.0% 1.1% Latex Paint 1 0.0% 0.0%Remainder/Composite CDL 99 0.4% 0.3% Oil Paint 1 0.0% 0.0%
Medical Waste 266 1.2% 1.0%Sample Count 46 Fluorescent Tubes 0 0.0% 0.0%
Asbestos 2 0.0% 0.0%Total Tons 22,595 Other Hazardous Waste 41 0.2% 0.1%
Other Non-hazardous Waste 12 0.1% 0.0%

Cascadia Consulting Group, Inc. E-7 Washington Department of Ecology: Rural Waste Characterization Report
Appendices
Table E-6: Composition by Weight – Okanogan County, Commercial Calculated at a 90% confidence level
Tons Mean +/– Tons Mean +/–Paper 2,607 32.9% Glass 272 3.4%
Newspaper 155 2.0% 0.9% Clear Glass Beverage 87 1.1% 0.6%Cardboard 795 10.0% 2.2% Green Glass Beverage 6 0.1% 0.1%Other Groundwood Paper 51 0.6% 0.4% Brown Glass Beverage 122 1.5% 1.7%High-grade Paper 94 1.2% 0.6% Clear Glass Container 40 0.5% 0.4%Magazines 99 1.3% 0.7% Green Glass Container 0 0.0% 0.0%Mixed/Low-grade Paper 449 5.7% 1.0% Brown Glass Container 12 0.2% 0.2%Compostable Paper 632 8.0% 1.7% Plate Glass 0 0.0% 0.0%Remainder/Composite Paper 324 4.1% 3.0% Remainder/Composite Glass 2 0.0% 0.0%Process Sludge/Other Industrial 7 0.1% 0.1% Non-glass Ceramics 3 0.0% 0.0%
Plastic 893 11.3% Metal 471 5.9%PET Bottles 57 0.7% 0.2% Aluminum Cans 46 0.6% 0.3%HDPE Bottles, Clear 23 0.3% 0.1% Aluminum Foil/Containers 8 0.1% 0.0%HDPE Bottles, Colored 30 0.4% 0.2% Other Aluminum 15 0.2% 0.2%Plastic Film and Bags 497 6.3% 1.5% Copper 0 0.0% 0.0%Plastic Bottles Types 3 - 7 7 0.1% 0.0% Other Non-ferrous Metals 3 0.0% 0.0%Expanded Polystyrene 55 0.7% 0.2% Tin Cans 121 1.5% 0.4%Other Rigid Plastic Packaging 78 1.0% 0.3% White Goods 0 0.0% 0.0%Other Plastic Products 75 0.9% 0.4% Other Ferrous Metals 173 2.2% 2.0%Remainder/Composite Plastic 70 0.9% 0.5% Remainder/Composite Metals 105 1.3% 0.9%
Organics 2,266 28.6% Consumer Products 298 3.8%Yard Garden and Prunings 608 7.7% 4.8% Computers 26 0.3% 0.5%Food Waste 1,434 18.1% 5.4% Other Electronics 6 0.1% 0.1%Manures 16 0.2% 0.3% Textiles, Synthetic 6 0.1% 0.1%Disposable Diapers 179 2.3% 1.8% Textiles, Organic 24 0.3% 0.2%Carcasses, Offal 0 0.0% 0.0% Textiles, Mixed/Unknown 105 1.3% 1.1%Crop Residues 0 0.0% 0.0% Shoes 9 0.1% 0.1%Septage 0 0.0% 0.0% Tires and Other Rubber 104 1.3% 1.0%Remainder/Composite Organics 29 0.4% 0.3% Furniture and Mattresses 0 0.0% 0.0%
Wood Wastes 164 2.1% Carpet 0 0.0% 0.0%Natural Wood 2 0.0% 0.0% Carpet Padding 0 0.0% 0.0%Treated Wood 11 0.1% 0.2% Rejected Products 0 0.0% 0.0%Painted Wood 31 0.4% 0.4% Returned Products 0 0.0% 0.0%Dimensional Lumber 26 0.3% 0.4% Other Composite Consumer Products 18 0.2% 0.2%Engineered Wood 20 0.3% 0.3% Residuals 328 4.1%Wood Packaging 73 0.9% 1.6% Ash 99 1.2% 1.3%Other Untreated Wood 0 0.0% 0.0% Dust 10 0.1% 0.1%Wood Byproducts 0 0.0% 0.0% Fines/Sorting Residues 219 2.8% 2.2%Remainder/Composite Wood 1 0.0% 0.0% Sludge and Other Industrial 0 0.0% 0.0%
CDL Wastes 351 4.4% Haz and Special Wastes 273 3.4%Insulation 1 0.0% 0.0% Used Oil 2 0.0% 0.0%Asphalt 0 0.0% 0.0% Oil Filters 2 0.0% 0.0%Concrete 0 0.0% 0.0% Antifreeze 0 0.0% 0.0%Drywall 11 0.1% 0.2% Auto Batteries 0 0.0% 0.0%Soil, Rocks and Sand 46 0.6% 0.8% Household Batteries 4 0.0% 0.0%Roofing Waste 3 0.0% 0.1% Pesticides and Herbicides 0 0.0% 0.0%Ceramics 229 2.9% 3.1% Latex Paint 0 0.0% 0.0%Remainder/Composite CDL 61 0.8% 0.8% Oil Paint 0 0.0% 0.0%
Medical Waste 265 3.3% 2.9%Sample Count 22 Fluorescent Tubes 0 0.0% 0.0%
Asbestos 0 0.0% 0.0%Total Tons 7,924 Other Hazardous Waste 0 0.0% 0.0%
Other Non-hazardous Waste 0 0.0% 0.0%

Cascadia Consulting Group, Inc. E-8 Washington Department of Ecology: Rural Waste Characterization Report
Appendices
Table E-7: Composition by Weight – Okanogan County, Industrial Calculated at a 90% confidence level
Tons Mean +/– Tons Mean +/–Paper 1,710 23.3% Glass 368 5.0%
Newspaper 182 2.5% 0.0% Clear Glass Beverage 89 1.2% 0.0%Cardboard 214 2.9% 0.0% Green Glass Beverage 36 0.5% 0.0%Other Groundwood Paper 39 0.5% 0.0% Brown Glass Beverage 88 1.2% 0.0%High-grade Paper 102 1.4% 0.0% Clear Glass Container 125 1.7% 0.0%Magazines 156 2.1% 0.0% Green Glass Container 0 0.0% 0.0%Mixed/Low-grade Paper 438 6.0% 0.0% Brown Glass Container 2 0.0% 0.0%Compostable Paper 469 6.4% 0.0% Plate Glass 0 0.0% 0.0%Remainder/Composite Paper 110 1.5% 0.0% Remainder/Composite Glass 9 0.1% 0.0%Process Sludge/Other Industrial 0 0.0% 0.0% Non-glass Ceramics 20 0.3% 0.0%
Plastic 785 10.7% Metal 575 7.8%PET Bottles 64 0.9% 0.0% Aluminum Cans 33 0.4% 0.0%HDPE Bottles, Clear 30 0.4% 0.0% Aluminum Foil/Containers 6 0.1% 0.0%HDPE Bottles, Colored 49 0.7% 0.0% Other Aluminum 20 0.3% 0.3%Plastic Film and Bags 295 4.0% 0.0% Copper 2 0.0% 0.0%Plastic Bottles Types 3 - 7 32 0.4% 0.0% Other Non-ferrous Metals 7 0.1% 0.0%Expanded Polystyrene 32 0.4% 0.0% Tin Cans 117 1.6% 0.0%Other Rigid Plastic Packaging 90 1.2% 0.0% White Goods 0 0.0% 0.0%Other Plastic Products 109 1.5% 0.0% Other Ferrous Metals 143 1.9% 0.3%Remainder/Composite Plastic 84 1.1% 0.0% Remainder/Composite Metals 249 3.4% 0.0%
Organics 1,670 22.7% Consumer Products 273 3.7%Yard Garden and Prunings 311 4.2% 0.0% Computers 0 0.0% 0.0%Food Waste 1,149 15.6% 0.0% Other Electronics 36 0.5% 0.0%Manures 20 0.3% 0.0% Textiles, Synthetic 32 0.4% 0.0%Disposable Diapers 140 1.9% 0.0% Textiles, Organic 67 0.9% 0.0%Carcasses, Offal 0 0.0% 0.0% Textiles, Mixed/Unknown 72 1.0% 0.0%Crop Residues 0 0.0% 0.0% Shoes 46 0.6% 0.0%Septage 0 0.0% 0.0% Tires and Other Rubber 0 0.0% 0.0%Remainder/Composite Organics 50 0.7% 0.0% Furniture and Mattresses 10 0.1% 0.0%
Wood Wastes 1,244 16.9% Carpet 1 0.0% 0.0%Natural Wood 3 0.0% 0.0% Carpet Padding 8 0.1% 0.0%Treated Wood 1 0.0% 0.0% Rejected Products 0 0.0% 0.0%Painted Wood 75 1.0% 2.8% Returned Products 0 0.0% 0.0%Dimensional Lumber 990 13.5% 5.5% Other Composite Consumer Products 1 0.0% 0.0%Engineered Wood 89 1.2% 3.2% Residuals 224 3.1%Wood Packaging 81 1.1% 0.0% Ash 0 0.0% 0.0%Other Untreated Wood 0 0.0% 0.0% Dust 13 0.2% 0.0%Wood Byproducts 0 0.0% 0.0% Fines/Sorting Residues 210 2.9% 0.0%Remainder/Composite Wood 5 0.1% 0.0% Sludge and Other Industrial 1 0.0% 0.0%
CDL Wastes 456 6.2% Haz and Special Wastes 45 0.6%Insulation 7 0.1% 0.0% Used Oil 1 0.0% 0.0%Asphalt 0 0.0% 0.0% Oil Filters 6 0.1% 0.0%Concrete 0 0.0% 0.0% Antifreeze 0 0.0% 0.0%Drywall 1 0.0% 0.0% Auto Batteries 0 0.0% 0.0%Soil, Rocks and Sand 333 4.5% 0.0% Household Batteries 7 0.1% 0.0%Roofing Waste 89 1.2% 0.5% Pesticides and Herbicides 4 0.0% 0.0%Ceramics 0 0.0% 0.0% Latex Paint 1 0.0% 0.0%Remainder/Composite CDL 26 0.4% 0.0% Oil Paint 0 0.0% 0.0%
Medical Waste 0 0.0% 0.0%Sample Count 7 Fluorescent Tubes 0 0.0% 0.0%
Asbestos 2 0.0% 0.0%Total Tons 7,350 Other Hazardous Waste 18 0.2% 0.0%
Other Non-hazardous Waste 6 0.1% 0.0%

Cascadia Consulting Group, Inc. E-9 Washington Department of Ecology: Rural Waste Characterization Report
Appendices
Table E-8: Composition by Weight – Okanogan County, Consumer Calculated at a 90% confidence level
Tons Mean +/– Tons Mean +/–Paper 1,946 26.6% Glass 743 10.1%
Newspaper 188 2.6% 1.2% Clear Glass Beverage 97 1.3% 0.7%Cardboard 297 4.1% 0.4% Green Glass Beverage 35 0.5% 0.3%Other Groundwood Paper 50 0.7% 0.4% Brown Glass Beverage 187 2.6% 2.9%High-grade Paper 81 1.1% 0.3% Clear Glass Container 391 5.3% 3.2%Magazines 239 3.3% 1.6% Green Glass Container 0 0.0% 0.0%Mixed/Low-grade Paper 514 7.0% 1.9% Brown Glass Container 3 0.0% 0.0%Compostable Paper 468 6.4% 2.4% Plate Glass 0 0.0% 0.0%Remainder/Composite Paper 109 1.5% 0.4% Remainder/Composite Glass 11 0.2% 0.2%Process Sludge/Other Industrial 0 0.0% 0.0% Non-glass Ceramics 18 0.2% 0.2%
Plastic 1,027 14.0% Metal 1,168 16.0%PET Bottles 70 1.0% 0.3% Aluminum Cans 46 0.6% 0.3%HDPE Bottles, Clear 32 0.4% 0.2% Aluminum Foil/Containers 11 0.2% 0.1%HDPE Bottles, Colored 87 1.2% 1.0% Other Aluminum 18 0.2% 0.3%Plastic Film and Bags 292 4.0% 0.9% Copper 1 0.0% 0.0%Plastic Bottles Types 3 - 7 28 0.4% 0.4% Other Non-ferrous Metals 4 0.1% 0.1%Expanded Polystyrene 57 0.8% 0.4% Tin Cans 155 2.1% 1.0%Other Rigid Plastic Packaging 180 2.5% 1.7% White Goods 0 0.0% 0.0%Other Plastic Products 141 1.9% 1.1% Other Ferrous Metals 258 3.5% 3.5%Remainder/Composite Plastic 140 1.9% 0.9% Remainder/Composite Metals 673 9.2% 6.5%
Organics 1,375 18.8% Consumer Products 559 7.6%Yard Garden and Prunings 217 3.0% 3.0% Computers 0 0.0% 0.0%Food Waste 974 13.3% 3.6% Other Electronics 101 1.4% 1.4%Manures 20 0.3% 0.2% Textiles, Synthetic 22 0.3% 0.3%Disposable Diapers 131 1.8% 0.9% Textiles, Organic 73 1.0% 0.5%Carcasses, Offal 0 0.0% 0.0% Textiles, Mixed/Unknown 149 2.0% 0.9%Crop Residues 0 0.0% 0.0% Shoes 135 1.8% 1.1%Septage 0 0.0% 0.0% Tires and Other Rubber 33 0.5% 0.3%Remainder/Composite Organics 34 0.5% 0.4% Furniture and Mattresses 40 0.5% 0.9%
Wood Wastes 88 1.2% Carpet 0 0.0% 0.0%Natural Wood 6 0.1% 0.1% Carpet Padding 5 0.1% 0.1%Treated Wood 1 0.0% 0.0% Rejected Products 0 0.0% 0.0%Painted Wood 9 0.1% 0.2% Returned Products 0 0.0% 0.0%Dimensional Lumber 8 0.1% 0.1% Other Composite Consumer Products 0 0.0% 0.0%Engineered Wood 5 0.1% 0.1% Residuals 230 3.1%Wood Packaging 54 0.7% 1.1% Ash 0 0.0% 0.0%Other Untreated Wood 0 0.0% 0.0% Dust 19 0.3% 0.3%Wood Byproducts 0 0.0% 0.0% Fines/Sorting Residues 212 2.9% 1.6%Remainder/Composite Wood 6 0.1% 0.1% Sludge and Other Industrial 0 0.0% 0.0%
CDL Wastes 115 1.6% Haz and Special Wastes 69 0.9%Insulation 16 0.2% 0.3% Used Oil 6 0.1% 0.1%Asphalt 0 0.0% 0.0% Oil Filters 19 0.3% 0.4%Concrete 0 0.0% 0.0% Antifreeze 0 0.0% 0.0%Drywall 1 0.0% 0.0% Auto Batteries 0 0.0% 0.0%Soil, Rocks and Sand 81 1.1% 1.8% Household Batteries 11 0.1% 0.1%Roofing Waste 5 0.1% 0.1% Pesticides and Herbicides 2 0.0% 0.1%Ceramics 0 0.0% 0.0% Latex Paint 0 0.0% 0.0%Remainder/Composite CDL 12 0.2% 0.3% Oil Paint 0 0.0% 0.0%
Medical Waste 1 0.0% 0.0%Sample Count 17 Fluorescent Tubes 0 0.0% 0.0%
Asbestos 0 0.0% 0.0%Total Tons 7,320 Other Hazardous Waste 23 0.3% 0.3%
Other Non-hazardous Waste 6 0.1% 0.1%

Cascadia Consulting Group, Inc. F-1 Washington Department of Ecology: Rural Waste Characterization Report
Appendices
APPENDIX F: DETAILED WASTE GENERATION RATES AND COMPOSITION BY INDUSTRY GROUP
Figure E-1, below, compares waste generation rates for the industrial and agricultural groups that were the focus of this study, in terms of tons of waste generated annually per acre, per animal, or per employee.
Figure E-1: Summary of Waste Generation by Industry Group
Industry Group Units Landfilled Other Disposal Beneficial UseField Crops <0.01 <0.01 5.32 Orchards 0.03 0.06 3.47 Vegetables <0.01 - 3.37
Livestocktons/animal/
year <0.01 0.41 1.14 Mining 0.42 0.06 1,215.34 Construction & Demolition 6.00 0.04 0.53 Paper and Allied Products 16.32 48.00 110.50 Logging, Lumber, & Primary Wood Products 0.57 1.07 291.79 Food and Kindred Products 1.57 0.02 32.04
tons/acre/ year
tons/employee/year
Detailed composition tables, with quantities, are presented below for the nine industrial/agricultural groups: field crops, orchards, vegetables, livestock, mining, construction & demolition (C&D), paper, logging, and food processing. These tables reflect all the waste generated by each industry group including landfilled, other disposal, and beneficially used waste.

Cascadia Consulting Group, Inc. F-2 Washington Department of Ecology: Rural Waste Characterization Report
Appendices
Table F-1: Composition by Weight – Field Crops Calculated at a 90% confidence level
Tons Mean Tons MeanPaper 7,471 0.0% Glass 592 0.0%
Newspaper 285 0.0% Clear Glass Beverage 142 0.0%Cardboard 5,118 0.0% Green Glass Beverage 57 0.0%Other Groundwood Paper 60 0.0% Brown Glass Beverage 142 0.0%High-grade Paper 159 0.0% Clear Glass Container 201 0.0%Magazines 243 0.0% Green Glass Container 0 0.0%Mixed/Low-grade Paper 690 0.0% Brown Glass Container 4 0.0%Compostable Paper 761 0.0% Plate Glass 0 0.0%Remainder/Composite Paper 154 0.0% Remainder/Composite Glass 13 0.0%Process Sludge/Other Industrial 0 0.0% Non-glass Ceramics 33 0.0%
Plastic 1,898 0.0% Metal 7,837 0.0%PET Bottles 137 0.0% Aluminum Cans 52 0.0%HDPE Bottles, Clear 47 0.0% Aluminum Foil/Containers 10 0.0%HDPE Bottles, Colored 488 0.0% Other Aluminum 21 0.0%Plastic Film and Bags 478 0.0% Copper 3 0.0%Plastic Bottles Types 3 - 7 52 0.0% Other Non-ferrous Metals 37 0.0%Expanded Polystyrene 127 0.0% Tin Cans 185 0.0%Other Rigid Plastic Packaging 145 0.0% White Goods 1,130 0.0%Other Plastic Products 305 0.0% Other Ferrous Metal 6,006 0.0%Remainder/Composite Plastic 119 0.0% Remainder/Composite Metals 395 0.0%
Organics 24,063,980 99.9% Consumer Products 13,341 0.1%Yard, Garden and Prunings 501 0.0% Computers 0 0.0%Food Waste 158,149 0.7% Other Electronics 59 0.0%Manures 33 0.0% Textiles, Synthetic 12,198 0.1%Disposable Diapers 226 0.0% Textiles, Organic 109 0.0%Carcasses, Offal 0 0.0% Textiles, Mixed/Unknown 168 0.0%Crop Residues 23,905,027 99.2% Shoes 75 0.0%Septage 0 0.0% Tires and Other Rubber 640 0.0%Remainder/Composite Organics 45 0.0% Furniture and Mattresses 16 0.0%
Wood Wastes 169 0.0% Carpet 1 0.0%Natural Wood 5 0.0% Carpet Padding 13 0.0%Treated Wood 1 0.0% Rejected Products 0 0.0%Painted Wood 4 0.0% Returned Products 0 0.0%Dimensional Lumber 15 0.0% Other Composite Consumer Products 63 0.0%Engineered Wood 11 0.0% Residuals 359 0.0%Wood Packaging 125 0.0% Ash 0 0.0%Other Untreated Wood 0 0.0% Dust 21 0.0%Wood Byproducts 0 0.0% Fines/Sorting Residues 338 0.0%Remainder/Composite Wood 8 0.0% Sludge and Other Industrial 0 0.0%
CDL Wastes 120 0.0% Haz and Special Wastes 134 0.0%Insulation 11 0.0% Used Oil 2 0.0%Asphalt 0 0.0% Oil Filters 74 0.0%Concrete 0 0.0% Antifreeze 0 0.0%Drywall 2 0.0% Auto Batteries 0 0.0%Soil, Rocks and Sand 32 0.0% Household Batteries 11 0.0%Roofing Waste 46 0.0% Pesticides and Herbicides 6 0.0%Ceramics 0 0.0% Latex Paint 1 0.0%Remainder/Composite CDL 29 0.0% Oil Paint 1 0.0%
Medical Waste 0 0.0%Sample Count 20 Fluorescent Tubes 0 0.0%
Asbestos 1 0.0%Total Tons 24,095,901 Other Hazardous Waste 28 0.0%
Other Non-hazardous Waste 10 0.0%

Cascadia Consulting Group, Inc. F-3 Washington Department of Ecology: Rural Waste Characterization Report
Appendices
Table F-2: Composition by Weight – Orchards Calculated at a 90% confidence level
Tons Mean Tons MeanPaper 1,967 0.2% Glass 374 0.0%
Newspaper 182 0.0% Clear Glass Beverage 94 0.0%Cardboard 264 0.0% Green Glass Beverage 36 0.0%Other Groundwood Paper 46 0.0% Brown Glass Beverage 89 0.0%High-grade Paper 117 0.0% Clear Glass Container 124 0.0%Magazines 167 0.0% Green Glass Container 0 0.0%Mixed/Low-grade Paper 467 0.1% Brown Glass Container 2 0.0%Compostable Paper 465 0.1% Plate Glass 0 0.0%Remainder/Composite Paper 259 0.0% Remainder/Composite Glass 9 0.0%Process Sludge/Other Industrial 0 0.0% Non-glass Ceramics 20 0.0%
Plastic 2,491 0.3% Metal 2,550 0.3%PET Bottles 67 0.0% Aluminum Cans 33 0.0%HDPE Bottles, Clear 34 0.0% Aluminum Foil/Containers 6 0.0%HDPE Bottles, Colored 1,620 0.2% Other Aluminum 13 0.0%Plastic Film and Bags 420 0.0% Copper 2 0.0%Plastic Bottles Types 3 - 7 34 0.0% Other Non-ferrous Metals 7 0.0%Expanded Polystyrene 31 0.0% Tin Cans 122 0.0%Other Rigid Plastic Packaging 89 0.0% White Goods 2,001 0.2%Other Plastic Products 91 0.0% Other Ferrous Metal 110 0.0%Remainder/Composite Plastic 105 0.0% Remainder/Composite Metals 257 0.0%
Organics 889,846 97.6% Consumer Products 1,848 0.2%Yard, Garden and Prunings 180,632 19.8% Computers 0 0.0%Food Waste 3,050 0.3% Other Electronics 36 0.0%Manures 20 0.0% Textiles, Synthetic 31 0.0%Disposable Diapers 138 0.0% Textiles, Organic 86 0.0%Carcasses, Offal 0 0.0% Textiles, Mixed/Unknown 131 0.0%Crop Residues 705,854 77.4% Shoes 46 0.0%Septage 0 0.0% Tires and Other Rubber 1,487 0.2%Remainder/Composite Organics 152 0.0% Furniture and Mattresses 10 0.0%
Wood Wastes 182 0.0% Carpet 1 0.0%Natural Wood 3 0.0% Carpet Padding 8 0.0%Treated Wood 1 0.0% Rejected Products 0 0.0%Painted Wood 2 0.0% Returned Products 0 0.0%Dimensional Lumber 14 0.0% Other Composite Consumer Products 12 0.0%Engineered Wood 9 0.0% Residuals 12,141 1.3%Wood Packaging 148 0.0% Ash 11,918 1.3%Other Untreated Wood 0 0.0% Dust 13 0.0%Wood Byproducts 0 0.0% Fines/Sorting Residues 210 0.0%Remainder/Composite Wood 5 0.0% Sludge and Other Industrial 0 0.0%
CDL Wastes 73 0.0% Haz and Special Wastes 44 0.0%Insulation 7 0.0% Used Oil 1 0.0%Asphalt 0 0.0% Oil Filters 6 0.0%Concrete 6 0.0% Antifreeze 0 0.0%Drywall 15 0.0% Auto Batteries 0 0.0%Soil, Rocks and Sand 20 0.0% Household Batteries 7 0.0%Roofing Waste 8 0.0% Pesticides and Herbicides 4 0.0%Ceramics 0 0.0% Latex Paint 1 0.0%Remainder/Composite CDL 18 0.0% Oil Paint 0 0.0%
Medical Waste 0 0.0%Sample Count 23 Fluorescent Tubes 0 0.0%
Asbestos 0 0.0%Total Tons 911,515 Other Hazardous Waste 18 0.0%
Other Non-hazardous Waste 6 0.0%
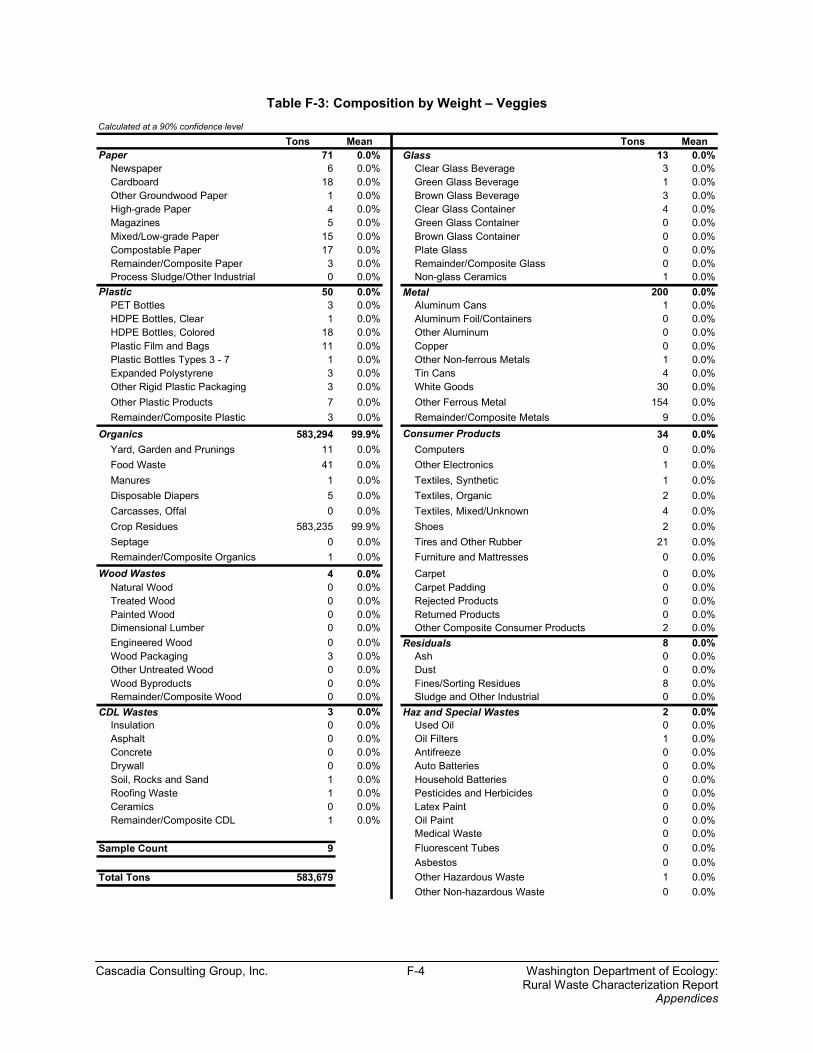
Cascadia Consulting Group, Inc. F-4 Washington Department of Ecology: Rural Waste Characterization Report
Appendices
Table F-3: Composition by Weight – Veggies Calculated at a 90% confidence level
Tons Mean Tons MeanPaper 71 0.0% Glass 13 0.0%
Newspaper 6 0.0% Clear Glass Beverage 3 0.0%Cardboard 18 0.0% Green Glass Beverage 1 0.0%Other Groundwood Paper 1 0.0% Brown Glass Beverage 3 0.0%High-grade Paper 4 0.0% Clear Glass Container 4 0.0%Magazines 5 0.0% Green Glass Container 0 0.0%Mixed/Low-grade Paper 15 0.0% Brown Glass Container 0 0.0%Compostable Paper 17 0.0% Plate Glass 0 0.0%Remainder/Composite Paper 3 0.0% Remainder/Composite Glass 0 0.0%Process Sludge/Other Industrial 0 0.0% Non-glass Ceramics 1 0.0%
Plastic 50 0.0% Metal 200 0.0%PET Bottles 3 0.0% Aluminum Cans 1 0.0%HDPE Bottles, Clear 1 0.0% Aluminum Foil/Containers 0 0.0%HDPE Bottles, Colored 18 0.0% Other Aluminum 0 0.0%Plastic Film and Bags 11 0.0% Copper 0 0.0%Plastic Bottles Types 3 - 7 1 0.0% Other Non-ferrous Metals 1 0.0%Expanded Polystyrene 3 0.0% Tin Cans 4 0.0%Other Rigid Plastic Packaging 3 0.0% White Goods 30 0.0%Other Plastic Products 7 0.0% Other Ferrous Metal 154 0.0%Remainder/Composite Plastic 3 0.0% Remainder/Composite Metals 9 0.0%
Organics 583,294 99.9% Consumer Products 34 0.0%Yard, Garden and Prunings 11 0.0% Computers 0 0.0%Food Waste 41 0.0% Other Electronics 1 0.0%Manures 1 0.0% Textiles, Synthetic 1 0.0%Disposable Diapers 5 0.0% Textiles, Organic 2 0.0%Carcasses, Offal 0 0.0% Textiles, Mixed/Unknown 4 0.0%Crop Residues 583,235 99.9% Shoes 2 0.0%Septage 0 0.0% Tires and Other Rubber 21 0.0%Remainder/Composite Organics 1 0.0% Furniture and Mattresses 0 0.0%
Wood Wastes 4 0.0% Carpet 0 0.0%Natural Wood 0 0.0% Carpet Padding 0 0.0%Treated Wood 0 0.0% Rejected Products 0 0.0%Painted Wood 0 0.0% Returned Products 0 0.0%Dimensional Lumber 0 0.0% Other Composite Consumer Products 2 0.0%Engineered Wood 0 0.0% Residuals 8 0.0%Wood Packaging 3 0.0% Ash 0 0.0%Other Untreated Wood 0 0.0% Dust 0 0.0%Wood Byproducts 0 0.0% Fines/Sorting Residues 8 0.0%Remainder/Composite Wood 0 0.0% Sludge and Other Industrial 0 0.0%
CDL Wastes 3 0.0% Haz and Special Wastes 2 0.0%Insulation 0 0.0% Used Oil 0 0.0%Asphalt 0 0.0% Oil Filters 1 0.0%Concrete 0 0.0% Antifreeze 0 0.0%Drywall 0 0.0% Auto Batteries 0 0.0%Soil, Rocks and Sand 1 0.0% Household Batteries 0 0.0%Roofing Waste 1 0.0% Pesticides and Herbicides 0 0.0%Ceramics 0 0.0% Latex Paint 0 0.0%Remainder/Composite CDL 1 0.0% Oil Paint 0 0.0%
Medical Waste 0 0.0%Sample Count 9 Fluorescent Tubes 0 0.0%
Asbestos 0 0.0%Total Tons 583,679 Other Hazardous Waste 1 0.0%
Other Non-hazardous Waste 0 0.0%

Cascadia Consulting Group, Inc. F-5 Washington Department of Ecology: Rural Waste Characterization Report
Appendices
Table F-4: Composition by Weight – Livestock Calculated at a 90% confidence level
Tons Mean Tons MeanPaper 2,346 0.1% Glass 106 0.0%
Newspaper 51 0.0% Clear Glass Beverage 25 0.0%Cardboard 1,242 0.0% Green Glass Beverage 10 0.0%Other Groundwood Paper 323 0.0% Brown Glass Beverage 25 0.0%High-grade Paper 29 0.0% Clear Glass Container 36 0.0%Magazines 44 0.0% Green Glass Container 0 0.0%Mixed/Low-grade Paper 136 0.0% Brown Glass Container 1 0.0%Compostable Paper 494 0.0% Plate Glass 0 0.0%Remainder/Composite Paper 28 0.0% Remainder/Composite Glass 2 0.0%Process Sludge/Other Industrial 0 0.0% Non-glass Ceramics 6 0.0%
Plastic 1,102 0.0% Metal 195 0.0%PET Bottles 23 0.0% Aluminum Cans 9 0.0%HDPE Bottles, Clear 8 0.0% Aluminum Foil/Containers 2 0.0%HDPE Bottles, Colored 22 0.0% Other Aluminum 4 0.0%Plastic Film and Bags 547 0.0% Copper 0 0.0%Plastic Bottles Types 3 - 7 9 0.0% Other Non-ferrous Metals 5 0.0%Expanded Polystyrene 19 0.0% Tin Cans 33 0.0%Other Rigid Plastic Packaging 97 0.0% White Goods 45 0.0%Other Plastic Products 352 0.0% Other Ferrous Metal 25 0.0%Remainder/Composite Plastic 25 0.0% Remainder/Composite Metals 71 0.0%
Organics 3,175,641 90.9% Consumer Products 191 0.0%Yard, Garden and Prunings 208 0.0% Computers 0 0.0%Food Waste 347 0.0% Other Electronics 11 0.0%Manures 3,159,831 90.5% Textiles, Synthetic 82 0.0%Disposable Diapers 41 0.0% Textiles, Organic 20 0.0%Carcasses, Offal 15,207 0.4% Textiles, Mixed/Unknown 27 0.0%Crop Residues 0 0.0% Shoes 13 0.0%Septage 0 0.0% Tires and Other Rubber 28 0.0%Remainder/Composite Organics 8 0.0% Furniture and Mattresses 3 0.0%
Wood Wastes 313,626 9.0% Carpet 0 0.0%Natural Wood 1 0.0% Carpet Padding 2 0.0%Treated Wood 0 0.0% Rejected Products 0 0.0%Painted Wood 1 0.0% Returned Products 0 0.0%Dimensional Lumber 3 0.0% Other Composite Consumer Products 6 0.0%Engineered Wood 2 0.0% Residuals 65 0.0%Wood Packaging 115 0.0% Ash 0 0.0%Other Untreated Wood 0 0.0% Dust 4 0.0%Wood Byproducts 313,504 9.0% Fines/Sorting Residues 61 0.0%Remainder/Composite Wood 1 0.0% Sludge and Other Industrial 0 0.0%
CDL Wastes 20 0.0% Haz and Special Wastes 19 0.0%Insulation 2 0.0% Used Oil 0 0.0%Asphalt 0 0.0% Oil Filters 9 0.0%Concrete 0 0.0% Antifreeze 0 0.0%Drywall 0 0.0% Auto Batteries 0 0.0%Soil, Rocks and Sand 6 0.0% Household Batteries 2 0.0%Roofing Waste 6 0.0% Pesticides and Herbicides 1 0.0%Ceramics 0 0.0% Latex Paint 0 0.0%Remainder/Composite CDL 5 0.0% Oil Paint 0 0.0%
Medical Waste 0 0.0%Sample Count 18 Fluorescent Tubes 0 0.0%
Asbestos 0 0.0%Total Tons 3,493,312 Other Hazardous Waste 5 0.0%
Other Non-hazardous Waste 2 0.0%
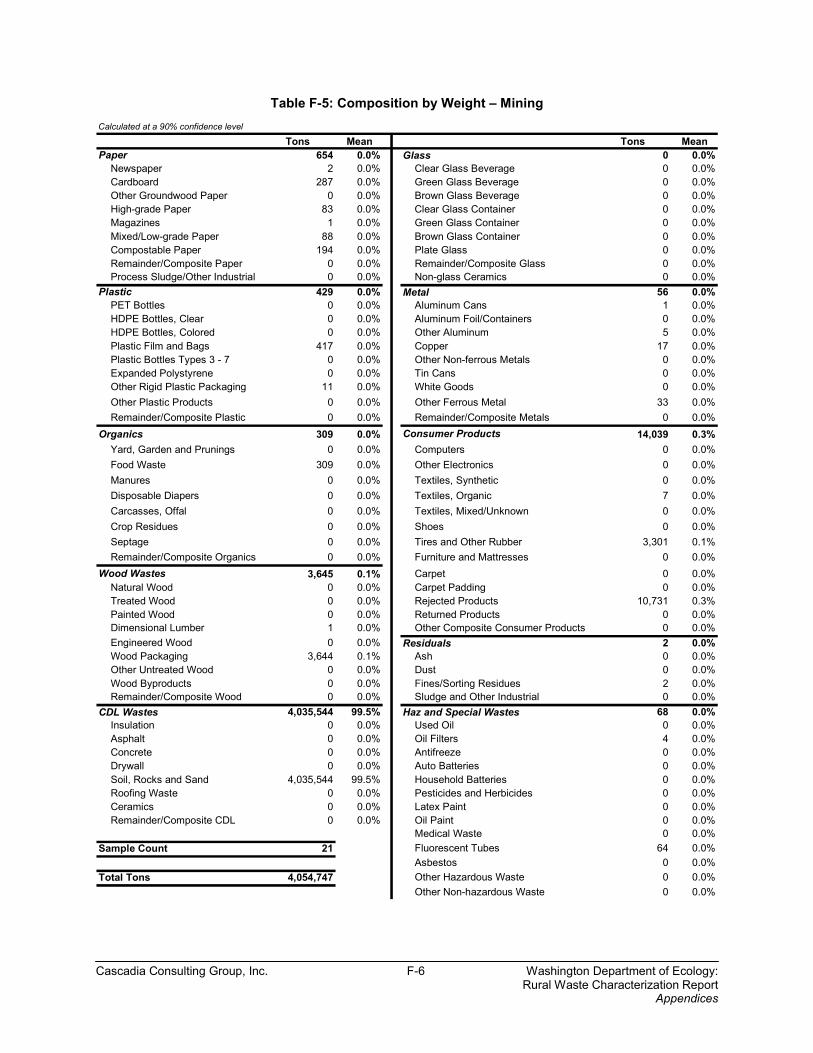
Cascadia Consulting Group, Inc. F-6 Washington Department of Ecology: Rural Waste Characterization Report
Appendices
Table F-5: Composition by Weight – Mining Calculated at a 90% confidence level
Tons Mean Tons MeanPaper 654 0.0% Glass 0 0.0%
Newspaper 2 0.0% Clear Glass Beverage 0 0.0%Cardboard 287 0.0% Green Glass Beverage 0 0.0%Other Groundwood Paper 0 0.0% Brown Glass Beverage 0 0.0%High-grade Paper 83 0.0% Clear Glass Container 0 0.0%Magazines 1 0.0% Green Glass Container 0 0.0%Mixed/Low-grade Paper 88 0.0% Brown Glass Container 0 0.0%Compostable Paper 194 0.0% Plate Glass 0 0.0%Remainder/Composite Paper 0 0.0% Remainder/Composite Glass 0 0.0%Process Sludge/Other Industrial 0 0.0% Non-glass Ceramics 0 0.0%
Plastic 429 0.0% Metal 56 0.0%PET Bottles 0 0.0% Aluminum Cans 1 0.0%HDPE Bottles, Clear 0 0.0% Aluminum Foil/Containers 0 0.0%HDPE Bottles, Colored 0 0.0% Other Aluminum 5 0.0%Plastic Film and Bags 417 0.0% Copper 17 0.0%Plastic Bottles Types 3 - 7 0 0.0% Other Non-ferrous Metals 0 0.0%Expanded Polystyrene 0 0.0% Tin Cans 0 0.0%Other Rigid Plastic Packaging 11 0.0% White Goods 0 0.0%Other Plastic Products 0 0.0% Other Ferrous Metal 33 0.0%Remainder/Composite Plastic 0 0.0% Remainder/Composite Metals 0 0.0%
Organics 309 0.0% Consumer Products 14,039 0.3%Yard, Garden and Prunings 0 0.0% Computers 0 0.0%Food Waste 309 0.0% Other Electronics 0 0.0%Manures 0 0.0% Textiles, Synthetic 0 0.0%Disposable Diapers 0 0.0% Textiles, Organic 7 0.0%Carcasses, Offal 0 0.0% Textiles, Mixed/Unknown 0 0.0%Crop Residues 0 0.0% Shoes 0 0.0%Septage 0 0.0% Tires and Other Rubber 3,301 0.1%Remainder/Composite Organics 0 0.0% Furniture and Mattresses 0 0.0%
Wood Wastes 3,645 0.1% Carpet 0 0.0%Natural Wood 0 0.0% Carpet Padding 0 0.0%Treated Wood 0 0.0% Rejected Products 10,731 0.3%Painted Wood 0 0.0% Returned Products 0 0.0%Dimensional Lumber 1 0.0% Other Composite Consumer Products 0 0.0%Engineered Wood 0 0.0% Residuals 2 0.0%Wood Packaging 3,644 0.1% Ash 0 0.0%Other Untreated Wood 0 0.0% Dust 0 0.0%Wood Byproducts 0 0.0% Fines/Sorting Residues 2 0.0%Remainder/Composite Wood 0 0.0% Sludge and Other Industrial 0 0.0%
CDL Wastes 4,035,544 99.5% Haz and Special Wastes 68 0.0%Insulation 0 0.0% Used Oil 0 0.0%Asphalt 0 0.0% Oil Filters 4 0.0%Concrete 0 0.0% Antifreeze 0 0.0%Drywall 0 0.0% Auto Batteries 0 0.0%Soil, Rocks and Sand 4,035,544 99.5% Household Batteries 0 0.0%Roofing Waste 0 0.0% Pesticides and Herbicides 0 0.0%Ceramics 0 0.0% Latex Paint 0 0.0%Remainder/Composite CDL 0 0.0% Oil Paint 0 0.0%
Medical Waste 0 0.0%Sample Count 21 Fluorescent Tubes 64 0.0%
Asbestos 0 0.0%Total Tons 4,054,747 Other Hazardous Waste 0 0.0%
Other Non-hazardous Waste 0 0.0%

Cascadia Consulting Group, Inc. F-7 Washington Department of Ecology: Rural Waste Characterization Report
Appendices
Table F-6: Composition by Weight – C&D Calculated at a 90% confidence level
Tons Mean Tons MeanPaper 60,149 6.1% Glass 1,133 0.1%
Newspaper 245 0.0% Clear Glass Beverage 396 0.0%Cardboard 28,963 3.0% Green Glass Beverage 616 0.1%Other Groundwood Paper 169 0.0% Brown Glass Beverage 0 0.0%High-grade Paper 167 0.0% Clear Glass Container 0 0.0%Magazines 135 0.0% Green Glass Container 0 0.0%Mixed/Low-grade Paper 3,587 0.4% Brown Glass Container 0 0.0%Compostable Paper 787 0.1% Plate Glass 0 0.0%Remainder/Composite Paper 26,096 2.7% Remainder/Composite Glass 71 0.0%Process Sludge/Other Industrial 0 0.0% Non-glass Ceramics 50 0.0%
Plastic 58,769 6.0% Metal 34,680 3.5%PET Bottles 1,117 0.1% Aluminum Cans 371 0.0%HDPE Bottles, Clear 67 0.0% Aluminum Foil/Containers 175 0.0%HDPE Bottles, Colored 280 0.0% Other Aluminum 0 0.0%Plastic Film and Bags 16,259 1.7% Copper 37 0.0%Plastic Bottles Types 3 - 7 0 0.0% Other Non-ferrous Metals 0 0.0%Expanded Polystyrene 1,009 0.1% Tin Cans 874 0.1%Other Rigid Plastic Packaging 3,712 0.4% White Goods 14,839 1.5%Other Plastic Products 35,662 3.6% Other Ferrous Metal 17,129 1.7%Remainder/Composite Plastic 662 0.1% Remainder/Composite Metals 1,253 0.1%
Organics 6,972 0.7% Consumer Products 50,408 5.1%Yard, Garden and Prunings 0 0.0% Computers 0 0.0%Food Waste 6,864 0.7% Other Electronics 0 0.0%Manures 0 0.0% Textiles, Synthetic 0 0.0%Disposable Diapers 107 0.0% Textiles, Organic 564 0.1%Carcasses, Offal 0 0.0% Textiles, Mixed/Unknown 451 0.0%Crop Residues 0 0.0% Shoes 0 0.0%Septage 0 0.0% Tires and Other Rubber 0 0.0%Remainder/Composite Organics 0 0.0% Furniture and Mattresses 0 0.0%
Wood Wastes 376,095 38.3% Carpet 23,024 2.3%Natural Wood 0 0.0% Carpet Padding 26,368 2.7%Treated Wood 78,049 8.0% Rejected Products 0 0.0%Painted Wood 56,906 5.8% Returned Products 0 0.0%Dimensional Lumber 151,238 15.4% Other Composite Consumer Products 0 0.0%Engineered Wood 87,125 8.9% Residuals 10,822 1.1%Wood Packaging 0 0.0% Ash 0 0.0%Other Untreated Wood 2,740 0.3% Dust 37 0.0%Wood Byproducts 0 0.0% Fines/Sorting Residues 10,786 1.1%Remainder/Composite Wood 37 0.0% Sludge and Other Industrial 0 0.0%
CDL Wastes 382,299 39.0% Haz and Special Wastes 0 0.0%Insulation 13,975 1.4% Used Oil 0 0.0%Asphalt 0 0.0% Oil Filters 0 0.0%Concrete 7,403 0.8% Antifreeze 0 0.0%Drywall 104,968 10.7% Auto Batteries 0 0.0%Soil, Rocks and Sand 0 0.0% Household Batteries 0 0.0%Roofing Waste 252,259 25.7% Pesticides and Herbicides 0 0.0%Ceramics 270 0.0% Latex Paint 0 0.0%Remainder/Composite CDL 3,424 0.3% Oil Paint 0 0.0%
Medical Waste 0 0.0%Sample Count 22 Fluorescent Tubes 0 0.0%
Asbestos 0 0.0%Total Tons 981,327 Other Hazardous Waste 0 0.0%
Other Non-hazardous Waste 0 0.0%
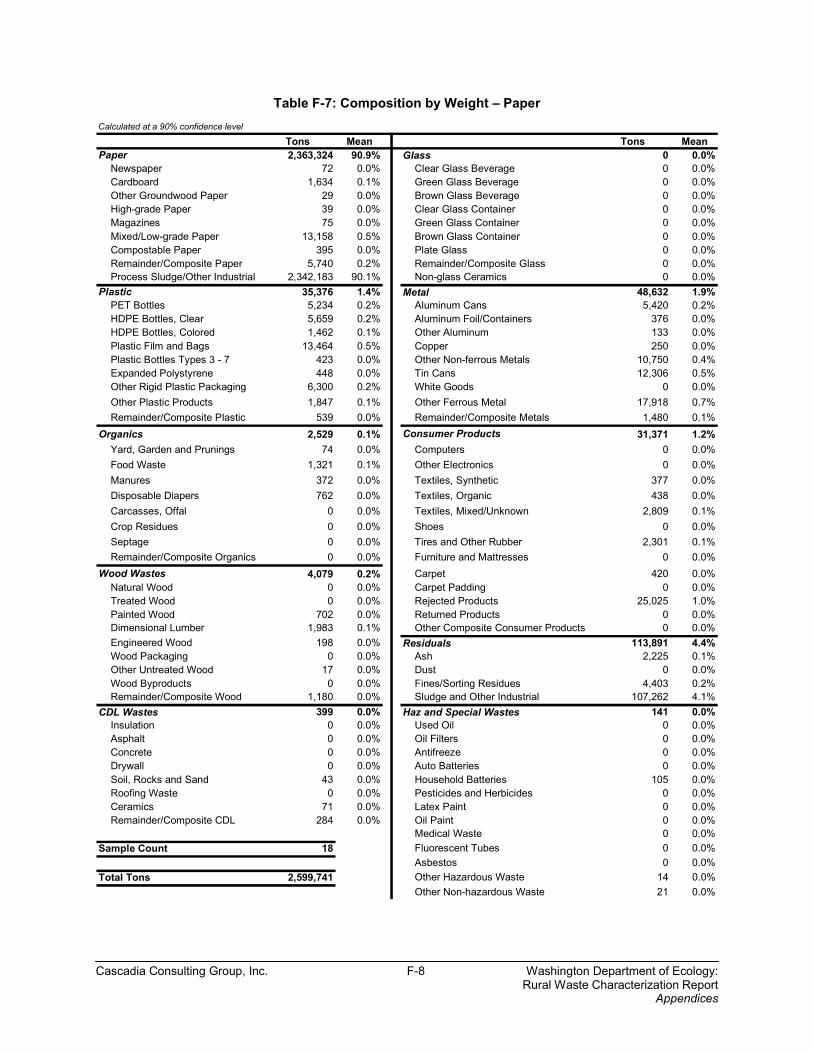
Cascadia Consulting Group, Inc. F-8 Washington Department of Ecology: Rural Waste Characterization Report
Appendices
Table F-7: Composition by Weight – Paper Calculated at a 90% confidence level
Tons Mean Tons MeanPaper 2,363,324 90.9% Glass 0 0.0%
Newspaper 72 0.0% Clear Glass Beverage 0 0.0%Cardboard 1,634 0.1% Green Glass Beverage 0 0.0%Other Groundwood Paper 29 0.0% Brown Glass Beverage 0 0.0%High-grade Paper 39 0.0% Clear Glass Container 0 0.0%Magazines 75 0.0% Green Glass Container 0 0.0%Mixed/Low-grade Paper 13,158 0.5% Brown Glass Container 0 0.0%Compostable Paper 395 0.0% Plate Glass 0 0.0%Remainder/Composite Paper 5,740 0.2% Remainder/Composite Glass 0 0.0%Process Sludge/Other Industrial 2,342,183 90.1% Non-glass Ceramics 0 0.0%
Plastic 35,376 1.4% Metal 48,632 1.9%PET Bottles 5,234 0.2% Aluminum Cans 5,420 0.2%HDPE Bottles, Clear 5,659 0.2% Aluminum Foil/Containers 376 0.0%HDPE Bottles, Colored 1,462 0.1% Other Aluminum 133 0.0%Plastic Film and Bags 13,464 0.5% Copper 250 0.0%Plastic Bottles Types 3 - 7 423 0.0% Other Non-ferrous Metals 10,750 0.4%Expanded Polystyrene 448 0.0% Tin Cans 12,306 0.5%Other Rigid Plastic Packaging 6,300 0.2% White Goods 0 0.0%Other Plastic Products 1,847 0.1% Other Ferrous Metal 17,918 0.7%Remainder/Composite Plastic 539 0.0% Remainder/Composite Metals 1,480 0.1%
Organics 2,529 0.1% Consumer Products 31,371 1.2%Yard, Garden and Prunings 74 0.0% Computers 0 0.0%Food Waste 1,321 0.1% Other Electronics 0 0.0%Manures 372 0.0% Textiles, Synthetic 377 0.0%Disposable Diapers 762 0.0% Textiles, Organic 438 0.0%Carcasses, Offal 0 0.0% Textiles, Mixed/Unknown 2,809 0.1%Crop Residues 0 0.0% Shoes 0 0.0%Septage 0 0.0% Tires and Other Rubber 2,301 0.1%Remainder/Composite Organics 0 0.0% Furniture and Mattresses 0 0.0%
Wood Wastes 4,079 0.2% Carpet 420 0.0%Natural Wood 0 0.0% Carpet Padding 0 0.0%Treated Wood 0 0.0% Rejected Products 25,025 1.0%Painted Wood 702 0.0% Returned Products 0 0.0%Dimensional Lumber 1,983 0.1% Other Composite Consumer Products 0 0.0%Engineered Wood 198 0.0% Residuals 113,891 4.4%Wood Packaging 0 0.0% Ash 2,225 0.1%Other Untreated Wood 17 0.0% Dust 0 0.0%Wood Byproducts 0 0.0% Fines/Sorting Residues 4,403 0.2%Remainder/Composite Wood 1,180 0.0% Sludge and Other Industrial 107,262 4.1%
CDL Wastes 399 0.0% Haz and Special Wastes 141 0.0%Insulation 0 0.0% Used Oil 0 0.0%Asphalt 0 0.0% Oil Filters 0 0.0%Concrete 0 0.0% Antifreeze 0 0.0%Drywall 0 0.0% Auto Batteries 0 0.0%Soil, Rocks and Sand 43 0.0% Household Batteries 105 0.0%Roofing Waste 0 0.0% Pesticides and Herbicides 0 0.0%Ceramics 71 0.0% Latex Paint 0 0.0%Remainder/Composite CDL 284 0.0% Oil Paint 0 0.0%
Medical Waste 0 0.0%Sample Count 18 Fluorescent Tubes 0 0.0%
Asbestos 0 0.0%Total Tons 2,599,741 Other Hazardous Waste 14 0.0%
Other Non-hazardous Waste 21 0.0%
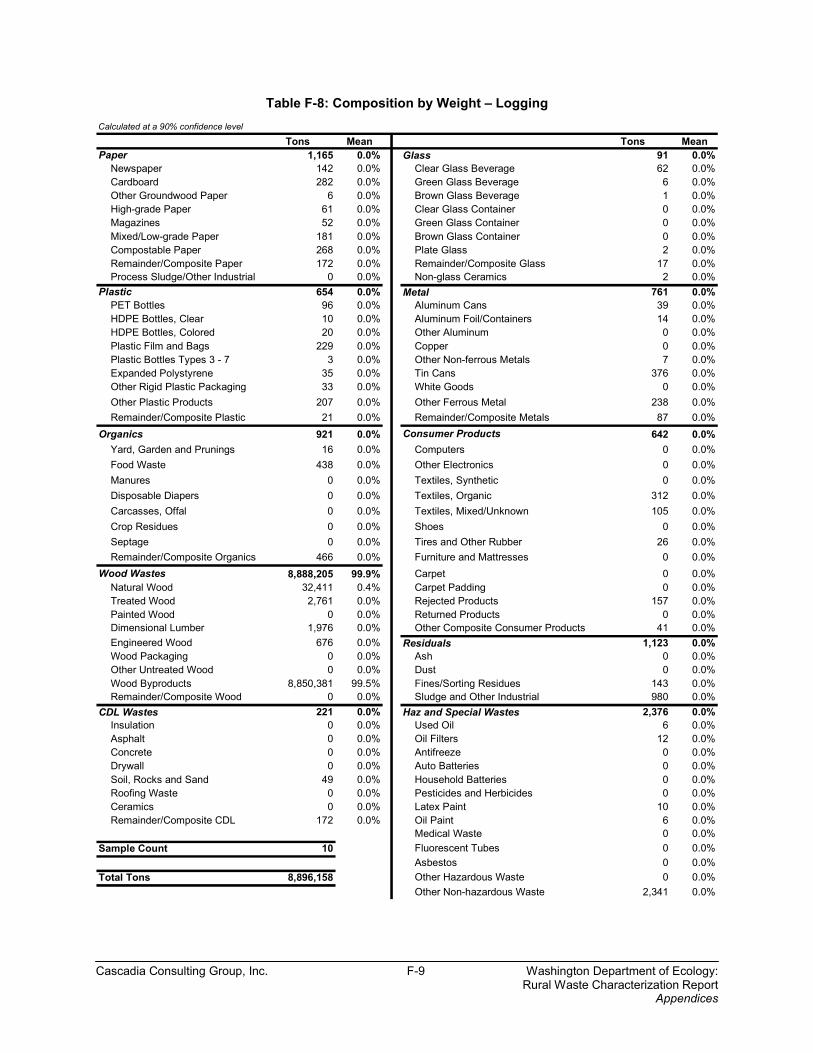
Cascadia Consulting Group, Inc. F-9 Washington Department of Ecology: Rural Waste Characterization Report
Appendices
Table F-8: Composition by Weight – Logging Calculated at a 90% confidence level
Tons Mean Tons MeanPaper 1,165 0.0% Glass 91 0.0%
Newspaper 142 0.0% Clear Glass Beverage 62 0.0%Cardboard 282 0.0% Green Glass Beverage 6 0.0%Other Groundwood Paper 6 0.0% Brown Glass Beverage 1 0.0%High-grade Paper 61 0.0% Clear Glass Container 0 0.0%Magazines 52 0.0% Green Glass Container 0 0.0%Mixed/Low-grade Paper 181 0.0% Brown Glass Container 0 0.0%Compostable Paper 268 0.0% Plate Glass 2 0.0%Remainder/Composite Paper 172 0.0% Remainder/Composite Glass 17 0.0%Process Sludge/Other Industrial 0 0.0% Non-glass Ceramics 2 0.0%
Plastic 654 0.0% Metal 761 0.0%PET Bottles 96 0.0% Aluminum Cans 39 0.0%HDPE Bottles, Clear 10 0.0% Aluminum Foil/Containers 14 0.0%HDPE Bottles, Colored 20 0.0% Other Aluminum 0 0.0%Plastic Film and Bags 229 0.0% Copper 0 0.0%Plastic Bottles Types 3 - 7 3 0.0% Other Non-ferrous Metals 7 0.0%Expanded Polystyrene 35 0.0% Tin Cans 376 0.0%Other Rigid Plastic Packaging 33 0.0% White Goods 0 0.0%Other Plastic Products 207 0.0% Other Ferrous Metal 238 0.0%Remainder/Composite Plastic 21 0.0% Remainder/Composite Metals 87 0.0%
Organics 921 0.0% Consumer Products 642 0.0%Yard, Garden and Prunings 16 0.0% Computers 0 0.0%Food Waste 438 0.0% Other Electronics 0 0.0%Manures 0 0.0% Textiles, Synthetic 0 0.0%Disposable Diapers 0 0.0% Textiles, Organic 312 0.0%Carcasses, Offal 0 0.0% Textiles, Mixed/Unknown 105 0.0%Crop Residues 0 0.0% Shoes 0 0.0%Septage 0 0.0% Tires and Other Rubber 26 0.0%Remainder/Composite Organics 466 0.0% Furniture and Mattresses 0 0.0%
Wood Wastes 8,888,205 99.9% Carpet 0 0.0%Natural Wood 32,411 0.4% Carpet Padding 0 0.0%Treated Wood 2,761 0.0% Rejected Products 157 0.0%Painted Wood 0 0.0% Returned Products 0 0.0%Dimensional Lumber 1,976 0.0% Other Composite Consumer Products 41 0.0%Engineered Wood 676 0.0% Residuals 1,123 0.0%Wood Packaging 0 0.0% Ash 0 0.0%Other Untreated Wood 0 0.0% Dust 0 0.0%Wood Byproducts 8,850,381 99.5% Fines/Sorting Residues 143 0.0%Remainder/Composite Wood 0 0.0% Sludge and Other Industrial 980 0.0%
CDL Wastes 221 0.0% Haz and Special Wastes 2,376 0.0%Insulation 0 0.0% Used Oil 6 0.0%Asphalt 0 0.0% Oil Filters 12 0.0%Concrete 0 0.0% Antifreeze 0 0.0%Drywall 0 0.0% Auto Batteries 0 0.0%Soil, Rocks and Sand 49 0.0% Household Batteries 0 0.0%Roofing Waste 0 0.0% Pesticides and Herbicides 0 0.0%Ceramics 0 0.0% Latex Paint 10 0.0%Remainder/Composite CDL 172 0.0% Oil Paint 6 0.0%
Medical Waste 0 0.0%Sample Count 10 Fluorescent Tubes 0 0.0%
Asbestos 0 0.0%Total Tons 8,896,158 Other Hazardous Waste 0 0.0%
Other Non-hazardous Waste 2,341 0.0%
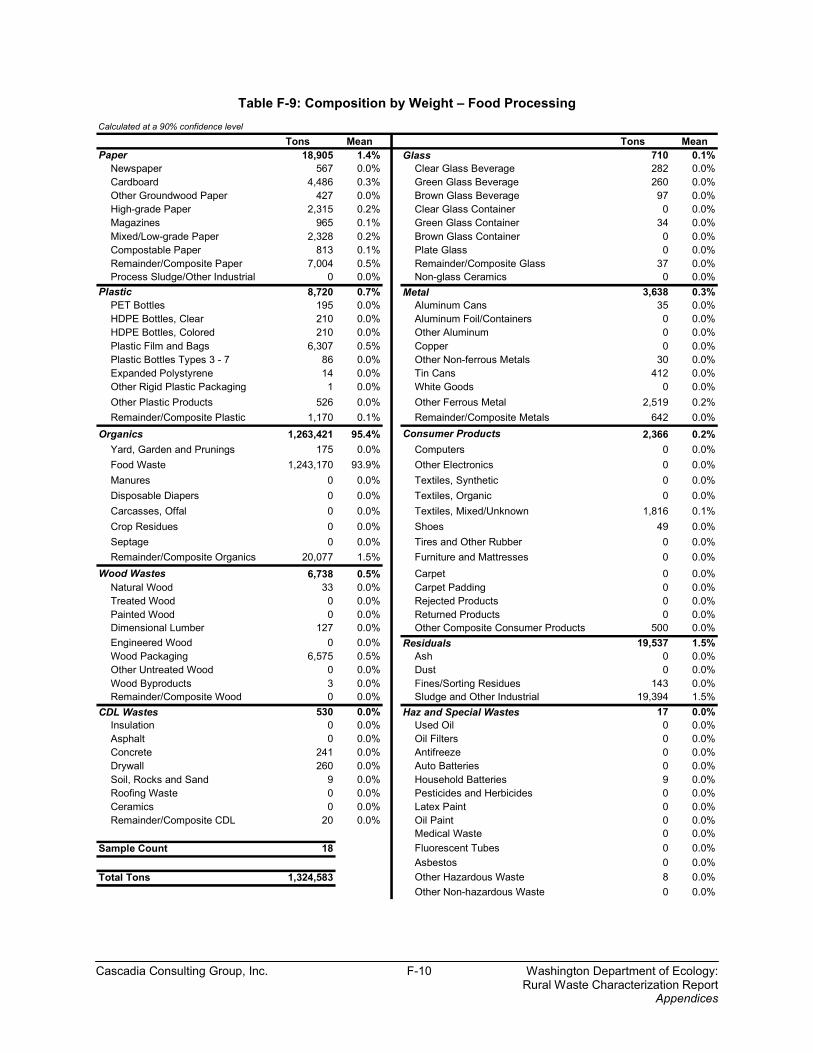
Cascadia Consulting Group, Inc. F-10 Washington Department of Ecology: Rural Waste Characterization Report
Appendices
Table F-9: Composition by Weight – Food Processing Calculated at a 90% confidence level
Tons Mean Tons MeanPaper 18,905 1.4% Glass 710 0.1%
Newspaper 567 0.0% Clear Glass Beverage 282 0.0%Cardboard 4,486 0.3% Green Glass Beverage 260 0.0%Other Groundwood Paper 427 0.0% Brown Glass Beverage 97 0.0%High-grade Paper 2,315 0.2% Clear Glass Container 0 0.0%Magazines 965 0.1% Green Glass Container 34 0.0%Mixed/Low-grade Paper 2,328 0.2% Brown Glass Container 0 0.0%Compostable Paper 813 0.1% Plate Glass 0 0.0%Remainder/Composite Paper 7,004 0.5% Remainder/Composite Glass 37 0.0%Process Sludge/Other Industrial 0 0.0% Non-glass Ceramics 0 0.0%
Plastic 8,720 0.7% Metal 3,638 0.3%PET Bottles 195 0.0% Aluminum Cans 35 0.0%HDPE Bottles, Clear 210 0.0% Aluminum Foil/Containers 0 0.0%HDPE Bottles, Colored 210 0.0% Other Aluminum 0 0.0%Plastic Film and Bags 6,307 0.5% Copper 0 0.0%Plastic Bottles Types 3 - 7 86 0.0% Other Non-ferrous Metals 30 0.0%Expanded Polystyrene 14 0.0% Tin Cans 412 0.0%Other Rigid Plastic Packaging 1 0.0% White Goods 0 0.0%Other Plastic Products 526 0.0% Other Ferrous Metal 2,519 0.2%Remainder/Composite Plastic 1,170 0.1% Remainder/Composite Metals 642 0.0%
Organics 1,263,421 95.4% Consumer Products 2,366 0.2%Yard, Garden and Prunings 175 0.0% Computers 0 0.0%Food Waste 1,243,170 93.9% Other Electronics 0 0.0%Manures 0 0.0% Textiles, Synthetic 0 0.0%Disposable Diapers 0 0.0% Textiles, Organic 0 0.0%Carcasses, Offal 0 0.0% Textiles, Mixed/Unknown 1,816 0.1%Crop Residues 0 0.0% Shoes 49 0.0%Septage 0 0.0% Tires and Other Rubber 0 0.0%Remainder/Composite Organics 20,077 1.5% Furniture and Mattresses 0 0.0%
Wood Wastes 6,738 0.5% Carpet 0 0.0%Natural Wood 33 0.0% Carpet Padding 0 0.0%Treated Wood 0 0.0% Rejected Products 0 0.0%Painted Wood 0 0.0% Returned Products 0 0.0%Dimensional Lumber 127 0.0% Other Composite Consumer Products 500 0.0%Engineered Wood 0 0.0% Residuals 19,537 1.5%Wood Packaging 6,575 0.5% Ash 0 0.0%Other Untreated Wood 0 0.0% Dust 0 0.0%Wood Byproducts 3 0.0% Fines/Sorting Residues 143 0.0%Remainder/Composite Wood 0 0.0% Sludge and Other Industrial 19,394 1.5%
CDL Wastes 530 0.0% Haz and Special Wastes 17 0.0%Insulation 0 0.0% Used Oil 0 0.0%Asphalt 0 0.0% Oil Filters 0 0.0%Concrete 241 0.0% Antifreeze 0 0.0%Drywall 260 0.0% Auto Batteries 0 0.0%Soil, Rocks and Sand 9 0.0% Household Batteries 9 0.0%Roofing Waste 0 0.0% Pesticides and Herbicides 0 0.0%Ceramics 0 0.0% Latex Paint 0 0.0%Remainder/Composite CDL 20 0.0% Oil Paint 0 0.0%
Medical Waste 0 0.0%Sample Count 18 Fluorescent Tubes 0 0.0%
Asbestos 0 0.0%Total Tons 1,324,583 Other Hazardous Waste 8 0.0%
Other Non-hazardous Waste 0 0.0%