proving our mettle - husky energy chains that support production from the expanding suite of lloyd...
TRANSCRIPT

Annual Report 2016
P r o v i n gO urM e t t l e

Overview01 Highlights02 Statement from the Co-Chairs03 CEO Report to Shareholders08 Business Results
Financial11 Management’s Discussion and Analysis80 Consolidated Financial Statements and Notes135 Supplemental Financial and Operating Information142 Advisories144 Corporate Information145 Investor Information
Cor por ate Profile
Husky Energy is one of Canada’s largest integrated energy companies. It is based in Calgary,
Alberta and its common shares are publicly traded on the Toronto Stock Exchange under
the symbol HSE. The Company operates in Canada, the United States and the Asia Pacific
region with Upstream and Downstream business segments.

Operational Highlights
Year ended December 31 2016 2015
Daily production, before royalties
Thermal heavy oil/bitumen (mbbls/day) 97.4 63.1
Non-thermal heavy oil (mbbls/day) 54.1 69.1
Light and medium crude oil (mbbls/day) 63.1 80.5
NGL (mbbls/day) 14.0 18.2
Total crude oil & NGL (mbbls/day) 228.6 230.9
Natural gas (mmcf/day) 555.9 689.0
Total (mboe/day) 321.2 345.7
Total proved reserves, before royalties (mmboe)(1) 1,224 1,324
U.S. Refinery net throughput (mbbls/day)(2) 200.4 204.3
Canadian Refining & Upgrading throughput (mbbls/day) 109.7 108.6
(1) Proved reserves based on forecasted prices in accordance with NI 51-101.(2) Husky owns 50% of the Toledo Refinery.
Financial Highlights(1)
Year ended December 31 2016 2015
(millions of dollars except where indicated)
Gross revenue 13,224 16,801
Revenues, net of royalties 12,919 16,369
Funds from operations(2) 2,076 3,329
Per common share (dollars) Basic 2.07 3.38
Diluted 2.07 3.38
Adjusted net earnings(2) (655) 149
Net earnings 922 (3,850)
Per common share (dollars) Basic 0.88 (3.95)
Diluted 0.88 (4.01)
Dividends
Per common share (dollars) Ordinary — 0.90(3)
Capital expenditures(4) 1,705 3,005
Debt to capital employed (%)(2) 23.2 28.9
(1) Results are reported in accordance with IFRS, as issued by the IASB, except where indicated.(2) Non-GAAP measures. Please refer to Section 11.3 of the MD&A.(3) Dividends declared for the third quarter of 2015 were issued in the form of common shares. The quarterly common share dividend was suspended for the fourth quarter of 2015.(4) Excludes capitalized costs related to asset retirement obligations incurred during the period.
Highlights
01Highlights

Statement from the Co-Ch a ir s
Victor T.K. Li
Co-Chairman
Canning K.N. Fok
Co-Chairman
The past year marked a milestone for Husky. The
transformation that has been under way to improve
the resilience of the business reached a critical mass.
The Company has significantly reduced its cost structure,
and continues to increase the percentage of production
coming from longer life projects with lower operating
costs and reduced sustaining capital requirements.
In line with the objective to strengthen the balance sheet, net
debt was reduced by 40 percent from $7 billion to $4 billion.
This was achieved in part by the creation of a new Midstream
partnership, which generated $1.7 billion in cash while
laying the groundwork for further expansion of the heavy
oil thermal business.
At the same time, Husky has built a deep portfolio of
investment opportunities that will continue to improve
our cost structure.
The heavy oil thermal business in Lloydminster has been at
the forefront of the Company’s transformation. Three new
Lloyd thermal projects at Edam East, Vawn and Edam West
were started up in 2016, bringing total Lloyd thermal
production to 80,700 barrels per day (bbls/day) by the
end of the year.
In Downstream, the Company strengthened the integrated
value chains that support production from the expanding
suite of Lloyd thermal developments, the Tucker Thermal
Project and the Sunrise Energy Project. New heavy oil
processing capacity was added at both Ohio refineries
to further increase flexibility and improve margins.
The Western Canada portfolio has been repositioned through
the sale of non-core production. This has resulted in a more
focused and capital efficient business.
We continued to build a material business in the Asia Pacific
region with the producing Liwan Gas Project in China and the
advancement of several natural gas fields offshore Indonesia.
In the Atlantic region, we realized steady, high netback
production through existing satellite extensions and new
infill wells.
Husky’s transformation into a more resilient business has
proven our mettle. We are pleased with the progress made in
strengthening the Company’s financial and ratings profile and
improving profitability, in particular in the core Western
Canadian operations.
We have also seen a more stable and benign commodity price
environment over the latter part of 2016 and continuing into
2017, which we are hopeful will restore operating profitability
this year. Should these positive developments continue, the
Board will be better placed to consider re-establishing an
appropriate cash dividend policy.
The Board of Directors would like to express its appreciation
to Asim Ghosh for bringing his extensive business experience
to bear over the past seven years in reshaping and positioning
Husky for a new energy era. Under the new leadership of
Rob Peabody, the Company is well positioned to further
reduce our break-even oil price and increase our ability to
generate free cash flow.
We thank our shareholders for your support.
02 Statement from the Co-Chairs

CEO R eport to Sh a r eholder s
Husky began 2016 with three primary business objectives:
to strengthen its balance sheet, lower its cost structure
and further advance a deep portfolio of projects and
investment opportunities.
Those business objectives were met. By meeting its debt
target, Husky has greatly strengthened its balance sheet. Every
new dollar invested in production is further improving the
Company's cost structure, margin capture and ability to
generate free cash flow.
In addition, Husky achieved its 2016 target of generating more
than 40 percent of production from longer life projects with
improved margins, lower sustaining capital requirements and
reduced operating costs.
Meanwhile, sustaining and maintenance costs – the amount
of spending required to keep production steady, maintain
facilities and meet regulatory requirements – are expected
to further decrease in 2017 after a 25 percent reduction in the
last two years.
Husky’s application of thermal technology is providing
further value. Lloyd thermal projects, the Tucker Thermal
Project and the Sunrise Energy Project contributed to
average thermal volumes of 97,400 bbls/day, a 55 percent
increase from 2015.
Looking forward, the Company has identified more than
$20 billion worth of projects capable of generating more
than a 10 percent rate of return with oil prices in the low
$40s US WTI and a break-even in the low $30s.
The business objectives achieved in 2016 have placed Husky
on solid footing to invest in the next phase of growth.
03CEO Report to Shareholders
Rob Peabody, President & Chief Executive Officer

2016 Operational Highlights
Husky made good progress in several segments of its
portfolio in 2016.
Highlights included:
• First oil from three new Lloyd thermal projects, which
added a combined 24,500 bbls/day of design capacity
• Surpassing 20,000 bbls/day at the Tucker Thermal Project
• Strong performance at the Lloydminster Upgrader and
asphalt refinery
• Commencement of the crude oil flexibility project at the
Lima Refinery
• Completion of a project at the Toledo Refinery to increase
high-TAN processing capacity to 65,000 bbls/day, supporting
production from the Sunrise Energy Project
• Four development wells drilled at the liquids-rich BD project
offshore Indonesia
• First oil from the Hibernia formation well at North Amethyst
in the Atlantic region
• Completion of an exploration and appraisal program in the
Bay du Nord discovery area of the Flemish Pass
Thermal Production
Lloyd Thermal Projects
With a repeatable blueprint for 5,000 bbls/day and 10,000
bbls/day projects, the long life, higher return Lloyd thermal
portfolio continues to grow.
By the end of 2016, approximately two-thirds of Husky’s heavy
oil production was generated by thermal technology.
Including the Tucker Thermal Project, average annual heavy
oil thermal production increased about 40 percent in 2016,
from approximately 60,000 bbls/day in 2015 to 84,600 bbls/day
in 2016.
Site work commenced at the 10,000 bbls/day Rush Lake 2
Lloyd thermal project, with production on track for the first
half of 2019.
Three new Lloyd thermal projects with a total design capacity
of 30,000 bbls/day were sanctioned at Dee Valley, Spruce Lake
North and Spruce Lake Central. Subject to regulatory approval,
first production for all three is expected in 2020.
The Company has identified an additional 14 potential
Lloyd thermal developments representing 110,000 bbls/day
of future production capacity, and continues to explore for
further opportunities.
04 CEO Report to Shareholders

Tucker Thermal Project
Steaming commenced in early 2016 at the new Colony pad
at Tucker, which has similar characteristics to the heavy oil
reservoirs in the Lloydminster region. Production at Tucker
ramped up through the year and surpassed 20,000 bbls/day.
Further gains are expected as new well pads are brought
online. Tucker is scheduled to ramp up throughout 2017
and 2018 towards plant capacity of 30,000 bbls/day.
Sunrise Energy Project
Production climbed steadily in 2016, reaching year-end
volumes of more than 35,000 bbls/day from 55 producing
well pairs. Bitumen is being processed at the partner-operated
refinery in Toledo, Ohio.
Wildfires in the Fort McMurray region in May 2016 triggered
the temporary suspension of operations at Sunrise and other
oil sands operations in the region. Following the fires, steaming
of the wells resumed and production continued to increase as
steam chambers began to rebuild.
Average gross production in 2016 was approximately
26,000 bbls/day. Production will continue to ramp up
through 2017 and 2018.
Downstream
Total Downstream throughputs averaged 310,000 bbls/day,
with planned turnarounds completed at several facilities.
The Company continues to invest in increasing heavy oil
processing capacity while improving reliability and flexibility.
At the Lima Refinery, the completion of the initial stage of the
crude oil flexibility project increased heavy crude processing
capacity to approximately 10,000 bbls/day. The refinery, which
has a total throughput capacity of 160,000 bbls/day, is expected
to be processing approximately 40,000 bbls/day of heavy crude
in 2018 to further accommodate Lloyd thermal production.
The partner-operated Toledo Refinery increased its high-TAN
crude feedstock processing capacity to 65,000 bbls/day,
further supporting production from the Sunrise Energy
Project. The Company completed arrangements to lift and
market its refined products from Toledo, with first deliveries
commencing in January 2017.
Husky is the largest producer of asphalt in Western Canada,
representing five percent of total North American asphalt
production. With strong economics in place, a project to
double asphalt capacity to 60,000 bbls/day will be considered
for sanction in 2017.
05CEO Report to Shareholders

The creation of a new Midstream partnership in 2016 included
commitments to fund takeaway capacity for at least eight
additional Lloyd thermal projects, while preserving the tight
integration between the Company’s heavy oil production,
marketing and refining assets. Husky remains operator of the
assets and retains a 35 percent interest.
Husky Midstream Limited Partnership includes approximately
1,900 kilometres of pipeline, 4.1 million barrels of oil storage
capacity and other ancillary assets.
Western Canada
The Company’s transformation was accelerated in 2016 with
the disposition of select legacy oil and natural gas properties
in Western Canada. Approximately 32,000 barrels of oil
equivalent per day (boe/day) of production, including royalty
interests, was sold for gross proceeds of about $1.3 billion.
A focus on fewer, more material plays has resulted in a portfolio
that now requires less sustaining and maintenance capital
and has lower administrative costs and reduced reclamation
obligations. New production from resource plays is replacing
declines from higher cost wells. The repositioned Western
Canada portfolio is now more than 70 percent gas-weighted,
which provides the supply and a natural hedge for Husky's
energy requirements at its thermal projects and refineries.
Asia Pacific
Husky and its partners are advancing a series of projects
and opportunities in the Asia Pacific region, including
several near-term natural gas and liquids developments
offshore Indonesia.
At the liquids-rich BD project in the Madura Strait, four
development wells were drilled and completed in 2016 with
ramp up to full sales gas rates expected in the second half
of 2017. A floating production, storage and offloading (FPSO)
vessel will process the gas and liquids from the project, with
expected net production of approximately 40 million cubic
feet per day (mmcf/day) of gas and 2,400 bbls/day of liquids.
The engineering, procurement, construction and installation
contract to develop the shallow water MDA-MBH and MDK
gas fields has been signed and the platforms are under
construction. The fields are anticipated to be brought on
production in the 2018-2019 timeframe.
Combined net sales volumes from BD, MDA-MBH and
MDK are expected to be approximately 100 mmcf/day of
gas and 2,400 bbls/day of liquids once production is fully
ramped up. A development plan has been approved for
a fifth field, and additional discoveries in the Madura Strait
are being assessed.
06 CEO Report to Shareholders
At the Liwan Gas Project offshore China, gross production
averaged about 224 mmcf/day, with gross sales of associated
natural gas liquids of about 14,600 bbls/day. A second subsea
pipeline was completed at Liwan to provide for additional
operating flexibility over the life of the project.
In July 2016, the Company reached an agreement with its
partners on a new pricing arrangement for sales gas from the
Liwan 3-1 and 34-2 fields. Gross take-or-pay volumes from the
fields remained unchanged in the range of 300-330 mmcf/day.
Liquids production, net to Husky, is anticipated to remain in
the range of 5,000-6,000 bbls/day.
Preliminary work is progressing on plans to tie the Liuhua 29-1
field into the Liwan infrastructure.
Atlantic
In the Atlantic region, the Company continued to add infill
wells in 2016, with new production from the North Amethyst
and South White Rose extensions.
At North Amethyst, first oil was achieved from a Hibernia
formation well beneath the main field. The well reached its
planned net peak production rate of 5,000 bbls/day in the
third quarter.
A third infill well began production at South White Rose,
with two additional White Rose infill wells planned in 2017
to support production levels in the region.
The West White Rose extension remains a key project in
Husky’s portfolio and will be considered for sanction in 2017.
In the Flemish Pass Basin, the Company and its partner
wrapped up an extensive exploration and appraisal program
in the Bay du Nord discovery area, with two new oil discoveries
at the Bay de Verde and Baccalieu prospects. Preparations were
finalized for two exploration wells that are scheduled to be
drilled beginning in mid-2017.
Proving Our Mettle
Husky has made good progress in transforming its business
amidst persistent volatility in oil prices. Under the leadership of
former CEO Asim Ghosh, it has emerged from this challenging
period on exceptionally strong financial footing and with a
clear strategy.
The Company continues to improve margin capture, further
reduce its break-even and increase its ability to generate free
cash flow and return cash to shareholders.
Guided by the solid business fundamentals of a strong
balance sheet, a lower cost structure and a deep portfolio
of investment opportunities, Husky stands today a more
resilient energy company.
07CEO Report to Shareholders
Rob Peabody
CEO

Business R esults
Process Safety and Operational Reliability
Husky sharpened its focus on occupational and process safety and reliability in
2016. The Husky Operational Integrity Management System (HOIMS) promotes
safe and reliable operations to provide for efficient and consistent performance.
The Total Recordable Injury Rate (TRIR) was 0.5. TRIR measures lost time,
restricted work, medical aid incidents and fatalities. The rate has declined in
each of the past six years.
Less than one critical or serious incident was recorded per 200,000 hours
worked in 2016.
Husky worked closely with government, regulatory officials and downstream
communities following a pipeline incident in Saskatchewan. Learnings from
the investigation are being implemented to further improve operations.
Debt Reduction
The Company reduced net debt to approximately $4 billion at the end of the
year from $7 billion at the beginning of 2016.
As part of the debt reduction initiative, the 2016 business plan included
the fundamental principle of balancing capital expenditures with cash flow
at $30 US WTI.
Capital spending was $1.9 billion, including equity accounted entities. This was
approximately $200 million less than the lower end of the 2016 guidance range,
reflecting the ongoing cost reduction program and improved productivity. In
addition to the savings achieved, an expanded work program was completed.
Husky continues to maintain strong investment-grade credit ratings.
08 Business Results
Total Recordable Injury Rate(per 200,000 exposure hours)
201620152014
0.5
0.6
0.4
0.9
0.7
0.8
201620152014
2.0
8.0
6.0
4.0
Net Debt($ billions)
(1) Non-GAAP measure. Please refer to Section 11.3 of the MD&A.

Production
Average annual production was within guidance at 321,000 boe/day.
This takes into account the repositioning of the Western Canada portfolio
through the sale of about 32,000 boe/day of non-core production, including
royalty volumes, resulting in a more focused and capital efficient business.
Annual production does not reflect 43 mmcf/day of deferred production at the
Liwan Gas Project, for which cash was received.
Lloyd Thermal Production
Three new Lloyd thermal projects were brought online in 2016. The projects
exceeded their combined 24,500 bbls/day design capacity by 15 percent,
averaging 28,500 bbls/day in the fourth quarter.
Including the Tucker Thermal Project, which exited the year at 21,700 bbls/day,
average annual heavy oil thermal production was 84,600 bbls/day, an increase
of 41 percent over 2015.
Funds from Operations
Funds from operations in 2016 was $2.1 billion, including a pre-tax FIFO gain of
$79 million. This did not reflect $209 million in cash received as pre-payment for
future gas volumes at Liwan.
Results were impacted by challenging U.S. refining market conditions, including
narrower differentials and high finished product inventory levels, as well as
several major planned turnarounds at Husky facilities.
The average realized crude oil price was $35.78 per boe compared to $44.18
per boe in 2015.
Earnings
Net earnings were $922 million, benefiting from the one-time gains associated
with the new Midstream partnership and the dispositions in Western Canada,
as well as higher commodity prices and lower operating costs.
Adjusted net earnings were a loss of $655 million.
09Business Results
201620152014
2.0
6.0
4.0
3.0
1.0
5.0
Funds from Operations(1)
($ billions)
(1) Non-GAAP measure. Please refer to Section 11.3 of the MD&A.
201620152014
150
100
50
350
300
250
200
Production(mboe/day)
201620152014
40
20
100
80
60
Heavy Oil Thermal Production(mbbls/day)

Reserves Replacement
Total proved reserves before royalties at the end of 2016 were 1.2 billion boe,
and probable reserves were 1.6 billion boe. The average five-year proved
reserves replacement ratio, including acquisitions and dispositions, was 121
percent, excluding economic factors (109 percent including economic factors.)
Taking into account the acquisitions and dispositions, which included a reduction
of 86 million boe of proved reserves in Western Canada, the 2016 proved reserves
replacement ratio was 19 percent, excluding economic factors. Including
economic factors, the proved reserves replacement ratio was 15 percent.
Not including the acquisitions and dispositions, the 2016 proved reserves
replacement ratio was 92 percent, excluding economic factors. Including
economic factors, the proved reserves replacement ratio was 88 percent.
Proved reserves additions and revisions of 104 million boe reflect major
additions from Lloyd thermal projects, the Tucker Thermal Project and the
Liwan Gas Project.
10 Business Results
Total Proved Reservesbefore Royalties (mmboe)
201620142012 2013 2015
300
1,500
900
600
1,200

M anagement’s Discussion and Analysis
1.0 Financial Summary 12
1.1 Financial Position 12
1.2 Financial Performance 12
1.3 Total Shareholder Returns 13
1.4 Selected Annual Information 13
2.0 Husky Business Overview 14
2.1 Upstream 14
2.2 Downstream 15
2.3 Divestitures 16
2.4 Saskatchewan Pipeline
Spill Recovery Efforts 16
3.0 The 2016 Business Environment 17
4.0 Strategic Plan 22
4.1 Upstream 22
4.2 Downstream 23
4.3 Financial 23
5.0 Key Growth Highlights 24
5.1 Upstream 24
5.2 Downstream 26
6.0 Results of Operations 27
6.1 Segment Earnings 27
6.2 Upstream 27
6.3 Downstream 38
6.4 Corporate 41
7.0 Risk and Risk Management 42
7.1 Enterprise Risk Management 42
7.2 Significant Risk Factors 42
7.3 Financial Risks 47
8.0 Liquidity and Capital Resources 49
8.1 Summary of Cash Flow 49
8.2 Working Capital Components 49
8.3 Sources of Liquidity 50
8.4 Capital Structure 53
8.5 Contractual Obligations, Commitments
and Off-Balance Sheet Arrangements 54
8.6 Transactions with Related Parties 55
8.7 Outstanding Share Data 56
9.0 Critical Accounting Estimates
and Key Judgments 57
9.1 Accounting Estimates 57
9.2 Key Judgments 58
10.0 Recent Accounting Standards and
Changes in Accounting Policies 60
11.0 Reader Advisories 61
11.1 Forward-Looking Statements 61
11.2 Oil and Gas Reserves Reporting 62
11.3 Non-GAAP Measures 63
11.4 Additional Reader Advisories 66
11.5 Disclosure Controls and Procedures 69
12.0 Selected Quarterly Financial
and Operating Information 70
12.1 Summary of Quarterly Results 70
February 23, 2017
Contents
11Management’s Discussion and Analysis

Management’s Discussion and Analysis 2016
1
MANAGEMENT'S DISCUSSION AND ANALYSIS
1.0 Financial Summary
1.1 Financial Position
1.2 Financial Performance
(1) Debt to capital employed, debt to funds from operations and adjusted net earnings are non-GAAP measures. Adjusted net earnings was redefined in the second quarter of 2016 to equal net earnings before after-tax property, plant and equipment impairment (reversal), goodwill impairment charges, exploration and evaluation asset write-downs, inventory write-downs and loss (gain) on sale of assets. Prior periods have been revised to conform with the current period presentation. Refer to Section 11.3 for a reconciliation to the GAAP measures.
12 Management’s Discussion and Analysis
14 15 14 15
Total Assets($ billions)
Total Equity($ billions)
10
20
40
14 15
Total Long-term Debt ($ billions)
14 15
Debt to CapitalEmployed(1) (%)
2.0
3.0
1.0
14 1516 16 16 16 16
Debt to Fundsfrom Operations(1)
(times)
30
10
5
15
25
2020
30
102
4
6
1614 15
Cash Provided – OperatingCash Used (From) – Investing
Cash Flow($ billions)
2
4
(2)
0
6
1614 15
Net Earnings (Loss)Adjusted Net Earnings(1)
Net Earnings($ billions)
(2)
0
2
(4)
Management’s Discussion and Analysis 2016
1
MANAGEMENT'S DISCUSSION AND ANALYSIS
1.0 Financial Summary
1.1 Financial Position
1.2 Financial Performance
(1) Debt to capital employed, debt to funds from operations and adjusted net earnings are non-GAAP measures. Adjusted net earnings was redefined in the second quarter of 2016 to equal net earnings before after-tax property, plant and equipment impairment (reversal), goodwill impairment charges, exploration and evaluation asset write-downs, inventory write-downs and loss (gain) on sale of assets. Prior periods have been revised to conform with the current period presentation. Refer to Section 11.3 for a reconciliation to the GAAP measures.

13Management’s Discussion and Analysis
Management’s Discussion and Analysis 2016
2
1.3 Total Shareholder ReturnsThe following graph shows the total shareholder returns compared with the Standard and Poor’s (“S&P”) and the Toronto Stock Exchange (“TSX”) energy and composite indices.
1.4 Selected Annual Information
($ millions, except where indicated) 2016 2015 2014Gross revenues and Marketing and other 13,224 16,801 25,122
Net earnings (loss) by business segment
Upstream 1,091 (4,254) 1,106
Downstream 342 660 363
Corporate (511) (256) (211)
Net earnings (loss) 922 (3,850) 1,258
Net earnings (loss) per share – basic 0.88 (3.95) 1.26
Net earnings (loss) per share – diluted 0.88 (4.01) 1.20
Adjusted net earnings (loss)(1) (655) 149 1,992
Funds from operations(1) 2,076 3,329 5,535
Ordinary dividends per common share(2) — 0.90 1.20
Dividends per cumulative redeemable preferred share, series 1 0.73 1.11 1.11
Dividends per cumulative redeemable preferred share, series 2 0.42 — —
Dividends per cumulative redeemable preferred share, series 3 1.13 1.19 —
Dividends per cumulative redeemable preferred share, series 5 1.25 0.90 —
Dividends per cumulative redeemable preferred share, series 7 1.15 0.62 —
Total assets 32,260 33,056 38,848
Net debt(3) 4,020 6,686 4,025(1) Adjusted net earnings and funds from operations are non-GAAP measures. Adjusted net earnings was redefined in the second quarter of 2016 to equal net earnings before after-
tax property, plant and equipment impairment (reversal), goodwill impairment charges, exploration and evaluation asset write-downs, inventory write-downs and loss (gain) on sale of assets. Prior periods have been revised to conform with the current period presentation. Refer to Section 11.3 for a reconciliation to the GAAP measures.
(2) Dividends declared for the third quarter of 2015 were issued in the form of common shares. The quarterly common share dividend was suspended in the fourth quarter of 2015.(3) Net debt is a non-GAAP measure. Refer to Section 11.3 for a reconciliation to the GAAP measure.
16 Five YearAverage
Total Shareholder Returns(%)
Husky Common Shares S&P/TSX Capped Energy Index S&P/TSX Composite Index
(20)
0
3040
12 13 14 15 Five YearCumulative
Return
2010
(10)
(50)(40)(30)

14 Management’s Discussion and Analysis
Management’s Discussion and Analysis 2016
3
2.0 Husky Business Overview
Husky Energy Inc. (“Husky” or the “Company”) is one of Canada's largest integrated energy companies and is based in Calgary, Alberta. The Company’s common shares are listed on the Toronto Stock Exchange (“TSX”) under the symbol “HSE” and the Cumulative Redeemable Preferred Shares Series 1, Series 2, Series 3, Series 5 and Series 7 are listed under the symbols, “HSE.PR.A”, “HSE.PR.B”, “HSE.PR.C”, “HSE.PR.E” and “HSE.PR.G”, respectively. The Company operates in Canada, the United States and the Asia Pacific Region with Upstream and Downstream business segments. The Company's balanced growth strategy focuses on consistent execution, disciplined financial management and safe and reliable operations.
2.1 Upstream
Upstream includes exploration for, and development and production of, crude oil, bitumen, natural gas and natural gas liquids (“NGL“) (Exploration and Production) and marketing of the Company’s and other producers’ crude oil, natural gas, NGL, sulphur and petroleum coke, pipeline transportation, the blending of crude oil and natural gas, and storage of crude oil, diluent and natural gas (Infrastructure and Marketing). Infrastructure and Marketing markets and distributes products to customers on behalf of Exploration and Production and is grouped in the Upstream business segment based on the nature of its interconnected operations. The Company’s Upstream operations are located primarily in Western Canada, offshore East Coast of Canada (Atlantic Region) and offshore China and offshore Indonesia (Asia Pacific Region).
Profile and highlights of the Upstream segment include:
Heavy Oil• The heavy oil thermal portfolio, including the Tucker Thermal Project, averaged 84,600 bbls/day in 2016, compared to 59,900 bbls/
day in 2015;• First oil was achieved at the 10,000 bbls/day Edam East heavy oil thermal development in the second quarter of 2016. Production
averaged 14,900 bbls/day in December, exceeding its design capacity;• First oil was achieved at the 10,000 bbls/day Vawn heavy oil thermal development in the second quarter of 2016. Production
averaged 11,400 bbls/day in December, exceeding its design capacity;• First oil was achieved at the 4,500 bbls/day Edam West heavy oil thermal development in the third quarter of 2016. Production
averaged 4,200 bbls/day in December;• First oil was achieved from the Colony formation at the Tucker Thermal Project in the Cold Lake region of Alberta in the second
quarter of 2016. Total production from the Tucker Thermal Project averaged 21,700 bbls/day in December;• Development continues at the 10,000 bbls/day Rush Lake 2 heavy oil thermal development, with first production expected in the
first half of 2019; and• Three new Lloyd thermal projects with total design capacity of about 30,000 bbls/day have been sanctioned at Dee Valley, Spruce
Lake North and Spruce Lake Central. Subject to regulatory approval, first production for all three is expected in 2020.
Oil Sands• Gross production from the Sunrise Energy Project continued to ramp-up in 2016, averaging 25,600 bbls/day (12,800 bbls/day net
Husky share) during 2016, with average annual production in 2017 expected to be in the range of 40,000 to 44,000 bbls/day (20,000 to 22,000 bbls/day net Husky share).
Asia Pacific Region• The Liwan Gas Project, the first deepwater development offshore China, consists of three deepwater natural gas fields: Liwan 3-1,
Liuhua 34-2 and Liuhua 29-1. The Company holds a 49 percent working interest in the production sharing contract (”PSC”) at the Liwan Gas Project and operates the deepwater infrastructure;
• Combined gross production from Liwan 3-1 and Liuhua 34-2 averaged 48,800 boe/day (24,800 boe/day net Husky share) in 2016, compared to 62,300 boe/day (38,400 boe/day net Husky share) in 2015. The decrease in the overall production is due to issues within the buyer’s onshore pipeline network in the first quarter of 2016 and reduced buyer gas demand in 2016. The decrease in the Company's net share of production was also due to the entitlement share of production volumes reverting back to 49 percent in the second quarter of 2015 following the completion of exploration cost recoveries from the Liwan 3-1 field;
• During the third quarter of 2016, the Company's China subsidiary signed a Heads of Agreement (”HOA”) with China National Offshore Oil Corporation (”CNOOC”) and relevant companies for the price adjustment of natural gas from the Liwan 3-1 and Liuhua 34-2 fields to set the price at Cdn. $12.50 - Cdn. $15.00 per mcf at the current exchange rates. Gross take-or-pay volumes from the fields remain unchanged in the range of 300-330 mmcf/day. Liquids production, net to Husky, is also expected to remain in the range of 5,000 - 6,000 bbls/day. The price adjustment under the HOA is effective as of November 20, 2015, and the settlement of outstanding payment was calculated from that date;
• The second 22-inch subsea pipeline connecting the deepwater pipeline to the central platform has been completed, tested and placed in service. This pipeline provides operating flexibility for the deepwater infrastructure and completes the Liwan facilities to its full design specification;
• Negotiations for the sale of gas and liquids from Liuhua 29-1, the third deepwater field, are being pursued together with CNOOC;

15Management’s Discussion and Analysis
Management’s Discussion and Analysis 2016
4
• The Company holds a 40 percent working interest in the Wenchang oil field, located in the Pearl River Mouth Basin approximately 400 kilometres southwest of the Hong Kong Special Administrative Region. The PSC will expire in the fourth quarter of 2017, after which the Company will not have a working interest in this field;
• In 2015, the Company signed a PSC for the 15/33 exploration block offshore China. The 15/33 block covers approximately 155 square kilometres and is located in the Pearl River Mouth Basin in the South China Sea, approximately 140 kilometres southeast of the Hong Kong Special Administrative Region, in water depths of approximately 80 - 100 metres. The Company is the operator of the block during the exploration phase, with a working interest of 100 percent. In the event of a commercial discovery, its partner CNOOC may assume a working interest of up to 51 percent during the development and production phase. The corresponding CNOOC share of exploration cost recovery from production would be allocated to the Company;
• The Company holds a 40 percent working interest in a joint venture company that holds the PSC for the Madura Strait Block covering approximately 622,000 acres, offshore Indonesia. It is focused on the development of the BD, MDA, MBH, MDK and MAC fields;
• The liquids-rich BD field, which is the first gas development the Company is advancing in Indonesia, remains on target for first production in 2017 and is scheduled to ramp up to its full gas sales rate by the second half of 2017;
• At the MDA, MBH and MDK gas fields, the Company has secured a gas sales agreement for the MDA and MBH fields, which will be developed in tandem. Production from the MDA, MBH and MDK gas fields is expected in the 2018 - 2019 timeframe;
• Combined net sales volumes from the BD, MDA, MBH and MDK fields are expected to be about 100 mmcf/day of gas and 2,400 boe/day of associated NGL once fully ramped up;
• Longer term, the MAC field is proceeding with front-end engineering and design (”FEED”) for development and the Company has three additional discoveries in the Madura Straight Block that are under evaluation for development;
• The Company has a 100 percent interest in the rights to the Anugerah exploration block covering approximately two million acres. The Anugerah exploration block is located in the East Java Basin, Indonesia approximately 150 kilometres east of the Madura Strait Block; and
• The Company and its joint venture partner CPC Corporation have rights to an exploration block in the South China Sea covering approximately 7,700 square kilometres located southwest of the island of Taiwan. The Company holds a 75 percent working interest during exploration, while CPC Corporation has the right to participate in the development program up to a 50 percent interest.
Atlantic Region • The Company is the operator of the White Rose field with a 72.5 percent working interest in the core field and a 68.875 percent
working interest in satellite tiebacks, including the North Amethyst, South White Rose and West White Rose extensions. The Company has a 13 percent non-operated interest in the Terra Nova oil field;
• First production was achieved from the North Amethyst Hibernia formation well in the third quarter of 2016 and an additional well was brought into production at the South White Rose drill centre in the fourth quarter of 2016;
• Engineering design and subsurface evaluation work continues at West White Rose to increase capital efficiency and improve resource capture. The project will be considered for sanction in 2017;
• In November 2016, the Canada-Newfoundland and Labrador Petroleum Board announced that the Company was the successful bidder on two parcels of land in its 2016 land sale. The lands cover an area of 211,574 hectares and brought the Company’s Exploration Licenses (”ELs”) in the region to eight. The southwest parcel is adjacent to the White Rose field and satellite extensions, while the other is northeast of the field and adjacent to other Company operated ELs in the Jeanne d’Arc Basin; and
• The Company has a 35 percent non-operated working interest in five discoveries in the Flemish Pass: Bay du Nord, Bay de Verde, Baccalieu, Harpoon and Mizzen.
Western Canada Resource Play Development• Expertise and experience exploring and developing the natural gas potential in the Alberta Deep Basin, Foothills and Northwest
Plains of Alberta and British Columbia.
Infrastructure and Marketing• The Infrastructure and Marketing business supports Upstream production while providing integration with the Company's
Downstream assets through optimization of market access;• The Infrastructure and Marketing business manages the sale and transportation of the Company's Upstream and Downstream
production and third-party commodity trading volumes through access to capacity on third-party pipelines and storage facilities in both Canada and the United States; and
• Plans to expand export pipeline access and production storage opportunities to enhance market access for the Company's heavy oil production are being evaluated.
2.2 Downstream
Downstream includes upgrading of heavy crude oil feedstock into synthetic crude oil in Canada (Upgrading), refining in Canada of crude oil, marketing of refined petroleum products including gasoline, diesel, ethanol blended fuels, asphalt and ancillary products, and production of ethanol (Canadian Refined Products) and refining in the U.S. of primarily crude oil to produce and market gasoline, jet fuel and diesel fuels that meet U.S. clean fuels standards (U.S. Refining and Marketing). Upgrading, Canadian Refined Products and U.S. Refining and Marketing all process and refine natural resources into marketable products and therefore are grouped together as the Downstream business segment due to the similar nature of their products and services.

16 Management’s Discussion and Analysis
Management’s Discussion and Analysis 2016
5
Profile and highlights of the Downstream segment include:
Upgrading• Heavy oil upgrading facility located in Lloydminster, Saskatchewan with a throughput capacity of 82 mbbls/day.
Canadian Refined Products• Largest marketer of paving asphalt in Western Canada with a 29 mbbls/day capacity asphalt refinery located in Lloydminster, Alberta
integrated with the local heavy oil production, transportation and upgrading infrastructure; • Largest producer of ethanol in Western Canada with a combined 260 million litres per year of capacity at plants located in
Lloydminster, Saskatchewan and Minnedosa, Manitoba;• Refinery at Prince George, British Columbia with throughput capacity of 12 mbbls/day producing low sulphur gasoline and ultra
low sulphur diesel;• Major regional motor fuel marketer with an average of 481 retail marketing locations in 2016, including bulk plants and travel
centres with strategic land positions in Western Canada and Ontario. The Company also entered into a contractual agreement with Imperial Oil to create a single expanded truck transport network of approximately 160 sites. The agreement was approved by Canada's Competition Bureau in June 2016 and contract closing conditions were met late in the fourth quarter 2016. Progress continues to be made on the implementation of the agreement, and the consolidation of the two networks is expected in the second half of 2017; and
• The Company has started the pre-FEED work on a potential 30,000 bbls/day expansion of its asphalt processing capacity in Lloydminster. This business continues to show strong returns through the cycle and its expansion would provide an additional outlet for the Company's growing heavy oil thermal production.
U.S. Refining and Marketing• Refinery in Lima, Ohio with a gross crude oil throughput capacity of 165,000 bbls/day and operating capacity of 140,000 – 165,000
bbls/day on its current crude slate. The Company continues to work on a crude oil flexibility project designed to improve reliability at the facility and allow for the processing of up to 40,000 bbls/day of heavy crude oil feedstock from Western Canada. Current heavy crude oil feedstock capability is up to 10,000 bbls/day. The full scope of the project is expected to be completed in 2018; and
• A 50 percent interest in the BP-Husky Refinery in Toledo, Ohio with a nameplate capacity of 160,000 bbls/day and operating capacity of 135,000 - 145,000 bbls/day on its current crude slate. The Company and its partner completed a feedstock optimization project at the BP-Husky Toledo Refinery in mid-July 2016. The Refinery is now able to process approximately 65,000 bbls/day of high content naphthenic acids (”High-TAN”) crude oil to support production from the Sunrise Energy Project. The Refinery's overall nameplate capacity remains unchanged at 160,000 bbls/day.
2.3 Divestitures
• On May 25, 2016, the Company completed the sale of royalty interests representing approximately 1,700 boe/day of Western Canada production for gross proceeds of $165 million;
• On July 15, 2016, the Company completed the sale of 65 percent of its ownership interest in select midstream assets in the Lloydminster region of Alberta and Saskatchewan for gross proceeds of $1.69 billion in cash. The assets include approximately 1,900 kilometres of pipeline in the Lloydminster region, 4.1 mmbbls of storage capacity at Hardisty and Lloydminster and other ancillary assets. The assets are held by a newly-formed limited partnership, Husky Midstream Limited Partnership (”HMLP”), of which the Company owns 35 percent, Power Assets Holdings Limited (”PAH”) owns 48.75 percent and Cheung Kong Infrastructure Holdings Limited (”CKI”) owns 16.25 percent. The transaction enabled the Company to further strengthen its balance sheet while maintaining operatorship and preserving the integration between its heavy oil production, marketing and refining assets; and
• During 2016, the company completed the sale of approximately 30,200 boe/day of legacy crude oil and natural gas assets in Western Canada for gross proceeds of $1.12 billion.
2.4 Saskatchewan Pipeline Spill Recovery Efforts
• During the third quarter of 2016, a pipeline leak occurred on the south shore of the North Saskatchewan River, spilling approximately 225 m3 (+/- 10 percent) of heavy oil and diluent. Approximately 210 m3 was recovered in cleanup operations completed in 2016; and
• As at December 31, 2016, total gross costs incurred in response to the spill were approximately $107 million, for which $88 million has been recovered through insurance proceeds. Both the spill costs and insurance recoveries have been incurred by HMLP. The Company is the operator of the assets within HMLP and holds a 35 percent interest.
17Management’s Discussion and Analysis
Management’s Discussion and Analysis 2016
6
3.0 The 2016 Business Environment
The Company's operations are significantly influenced by domestic and international business environment factors including, but not limited to the following:
• The imbalance between global crude oil supply and demand, led primarily by the growth in U.S. unconventional and the Organization of the Petroleum Exporting Countries (”OPEC”) production, lower economic growth forecasts from emerging markets and corresponding growth in global crude oil inventories, resulted in the continued weakness of key crude oil benchmarks. However, in late 2016, OPEC came to an agreement to reduce production by 1.2 mmbbls/day from their daily production, which has led to crude oil benchmarks showing signs of recovery in the fourth quarter;
• North American natural gas benchmarks continued to be weak in 2016 due to an oversupply of natural gas in North America, which is largely the result of technological advances in horizontal drilling and hydraulic fracturing that have unlocked significant reserves;
• The Canadian dollar continued to be weak relative to the U.S. dollar in 2016;• In early 2016, the Alberta government adopted the recommendation of its Royalty Review Panel. The new royalty framework
preserves the existing royalty structure and rates for oil sands. It also creates a harmonized royalty formula for crude oil, natural gas and NGL that emulates a revenue minus cost system. The new rates will be calibrated to match rates of returns that could be expected under the existing system. The royalty changes will take effect in 2017 and only apply to new wells. Royalties on existing wells will remain in place for 10 years;
• Reduced production from the Western Canadian oil sands resulting from a temporary production interruption in May due to the Fort McMurray wildfire;
• Industry advancement in alternative and improved extraction methods have rapidly evolved in North American and international onshore and offshore activity;
• A continuing emphasis on environmental, health and safety, enterprise risk management, resource sustainability and corporate social responsibility;
• Transportation constraints on crude oil produced in Western Canada. The oil and gas industry continues to work with stakeholders to develop a strong network of transportation infrastructure including pipelines, rail, marine and trucks. The development of a strong infrastructure network continues to be an important challenge for the industry in order to obtain market access for the growing supply of crude oil from the Western Canadian oil sands;
• The increasing targets in the U.S. Renewable Fuel Standard (”RFS”) program have led to an increase in the price of Renewable Identification Number (”RIN”) credits for U.S. refiners;
• The convergence of North American and International crude oil prices has led to a decrease in crack spreads for North American refiners; and
• Continued global economic uncertainty has led to a tightening of investment from historical norms, creating greater competition among companies within capital markets and the postponement of various capital projects.
Major business factors are considered in the formulation of the Company's short and longer term business strategy.
The Company is exposed to a number of risks inherent to the exploration, development, production, marketing, transportation, storage and sale of crude oil, liquids-rich natural gas and related products. For a discussion on Risk and Risk Management, see Section 7.0 and the 2016 Annual Information Form.
Commodity prices, refining crack spreads and foreign exchange rates are some of the most significant factors that affect the results of the Company's operations. The following average benchmarks have been provided to assist in understanding the Company's financial results.

18 Management’s Discussion and Analysis
Management’s Discussion and Analysis 2016
7
Average Benchmarks
Average Benchmarks Summary 2016 2015
West Texas Intermediate (”WTI”) crude oil(1) (U.S. $/bbl) 43.32 48.80Brent crude oil(2) (U.S. $/bbl) 43.69 52.46Light sweet at Edmonton ($/bbl) 52.99 57.21Daqing(3) (U.S. $/bbl) 40.86 49.26Western Canada Select at Hardisty(4) (U.S. $/bbl) 29.48 35.28Lloyd heavy crude oil at Lloydminster ($/bbl) 32.61 39.15WTI/Lloyd crude blend differential (U.S. $/bbl) 13.70 13.43Condensate at Edmonton (U.S. $/bbl) 42.47 47.36NYMEX natural gas(5) (U.S. $/mmbtu) 2.46 2.66Nova Inventory Transfer (”NIT”) natural gas ($/GJ) 1.98 2.62Chicago Regular Unleaded Gasoline (U.S. $/bbl) 56.07 67.11Chicago Ultra-low Sulphur Diesel (U.S. $/bbl) 56.48 68.02Chicago 3:2:1 crack spread (U.S. $/bbl) 12.74 18.62U.S./Canadian dollar exchange rate (U.S. $) 0.755 0.783Canadian Equivalents(6)
WTI crude oil ($/bbl) 57.38 62.32Brent crude oil ($/bbl) 57.87 67.00Daqing ($/bbl) 54.12 62.91Western Canada Select at Hardisty ($/bbl) 39.05 45.06WTI/Lloyd crude blend differential ($/bbl) 18.15 17.15NYMEX natural gas ($/mmbtu) 3.26 3.40(1) Calendar Month Average of settled prices for West Texas Intermediate at Cushing, Oklahoma.(2) Calendar Month Average of settled prices for Dated Brent.(3) Calendar Month Average of settled prices for Daqing.(4) Western Canadian Select is a heavy blended crude oil, comprised of conventional and bitumen crude oils, blended with diluent, which terminals at Hardisty, Alberta. Quoted
prices are indicative of the Index for Western Canadian Select at Hardisty, Alberta, set in the month prior to delivery.(5) Prices quoted are average settlement prices during the period.(6) Prices quoted are calculated using U.S. dollar benchmark commodity prices and U.S./Canadian dollar exchange rates.
As an integrated producer, the Company’s profitability is largely determined by realized prices for crude oil and natural gas, marketing margins on committed pipeline capacity and refinery margins, as well as the effect of changes in the U.S./Canadian dollar exchange rate. All of Husky’s crude oil production and the majority of its natural gas production receives the prevailing market price. The price realized for crude oil is determined by North American and global factors. The price realized for natural gas production from Western Canada is determined primarily by North American fundamentals since virtually all natural gas production in North America is consumed by North American customers, predominantly in the United States. In the Asia Pacific Region, natural gas is sold to a specific buyer with long-term contracts. For the Liwan 3-1 gas field, a price profile has been fixed for five years and then will be linked to local benchmark pricing for the years following subject to a floor and ceiling. For the Liuhua 34-2 field, the price is fixed with a single escalation step during the contract delivery period.
The Downstream segment is heavily impacted by the price of crude oil and natural gas, as the largest cost factor in the Downstream segment is crude oil feedstock, a portion of which is heavy crude oil. In the Upgrading business, heavy crude oil feedstock is processed into light synthetic crude oil. The Company’s U.S. Refining and Marketing business processes a mix of different types of crude oil from various sources, but the mix is primarily light sweet crude oil at the Lima Refinery and approximately 52 percent heavy crude oil feedstock at the BP-Husky Toledo Refinery. The Company’s Canadian Refined Products business relies primarily on purchased refined products for resale in the retail distribution network. Refined products are acquired, under supply contracts, from other Canadian refiners at rack prices or from production from the Husky Prince George Refinery.

19Management’s Discussion and Analysis
Management’s Discussion and Analysis 2016
8
Crude Oil Benchmarks
Global crude oil benchmarks remained weak during 2016 due to the continued market imbalance between supply and demand. While crude oil production in the U.S. has declined relative to 2015, it remained at near record levels. Towards the end of 2016, OPEC members and some key non-OPEC producers agreed to reduce production in 2017 which has improved the outlook for global crude oil benchmarks. West Texas Intermediate (”WTI”) reached a low of U.S. $26.21/bbl in the first quarter of 2016 and subsequently increased to an average of U.S. $49.29/bbl during the fourth quarter of 2016. WTI averaged U.S. $43.32/bbl in 2016, which was weaker compared to 2015 when WTI averaged U.S. $48.80/bbl. Brent averaged U.S. $43.69/bbl in 2016 compared to U.S. $52.46/bbl in 2015.
The price received by the Company for crude oil production from Western Canada is primarily driven by the price of WTI, adjusted to Western Canada. The price received by the Company for crude oil production from the Atlantic Region is primarily driven by the price of Brent and the price received by the Company for crude oil and NGL production from the Asia Pacific Region is primarily driven by the price of Daqing. A portion of the Company's crude oil production from Western Canada is classified as either heavy crude oil or bitumen, which trades at a discount to light crude oil. In 2016, 66 percent of the Company's crude oil and NGLs production was heavy crude oil or bitumen compared to 57 percent in 2015.
The Company's heavy crude oil and bitumen production is blended with diluent (condensate) in order to facilitate its transportation through pipelines. Therefore, the price received for a barrel of blended heavy crude oil or bitumen is impacted by the prevailing market price for condensate. The price of condensate at Edmonton decreased in 2016 primarily due to lower expected demand growth from oil sands and declining market benchmarks for energy commodities.
Natural Gas Benchmarks
North American natural gas benchmarks continued to be weak in 2016 due to an oversupply of natural gas in North America, which is largely the result of technological advances in horizontal drilling and hydraulic fracturing which have unlocked significant reserves that were not economical under previously applied extraction methods. The Nova Inventory Transfer (”NIT”) natural gas benchmark observed a temporary decline in the second quarter of 2016 due to reduced demand from Canadian oil sands operations, which were impacted by the Fort McMurray wildfire.
Q1 Q2 Q3 Q4 Q1 Q2 Q3 Q4
WTI, Brent and Husky Average Crude Oil Prices(U.S. $/bbl)
20
60
80
0
40
1615
West Texas IntermediateHusky Light Husky Medium Husky Heavy Brent
15 16
WTIBrent
Average WTI and Brent(U.S. $/bbl)
60
80
20
40
NYMEX Natural Gas, NIT Natural Gas and Husky Average Natural Gas Prices
15 16
Average NYMEX(U.S. $/mmbtu)
2
4
6
0
Husky (U.S. $/mcf) NIT (U.S. $/GJ) NYMEX (U.S. $/mmbtu)
2
4
6
Q1 Q2 Q3 Q4 Q1 Q2 Q3 Q41615

Management’s Discussion and Analysis 2016
9
The price received by the Company for natural gas production from Western Canada is primarily driven by the NIT near-month contract price of natural gas, while the price received by the Company for production from the Asia Pacific Region are covered by fixed long-term sales contracts.
North American natural gas is consumed internally by the Company's Upstream and Downstream operations, which mitigates the impact of weak natural gas benchmark prices on the Company's results.
Refining Benchmarks
The 3:2:1 crack spread is the key indicator for refining margins and reflects refinery gasoline output that is approximately twice the distillate output. This crack spread is calculated as the price of two-thirds of a barrel of gasoline plus one-third of a barrel of distillate fuel less one barrel of crude oil. Market crack spreads are based on quoted near-month contracts for WTI and spot prices for gasoline and diesel and do not reflect the actual crude purchase costs nor the product configuration of a specific refinery. The Chicago Regular Unleaded Gasoline and the Chicago Ultra-low Sulphur Diesel average benchmark prices are the standard products included in the Chicago 3:2:1 market crack spread benchmark.
The cost of the Renewable Fuels Standard legislation has become a material economic factor for refineries in the U.S. as the market value of RINs has risen. The 3:2:1 crack spread is a gross margin based on the prices of unblended fuels that will be blended with biofuel. The cost of purchasing RINs or physical biofuel blending into a final gasoline or diesel has not been deducted from the Chicago 3:2:1 gross margin. The market value of gasoline or distillate that has been blended may be lower than the value of unblended petroleum products given the value a buyer of unblended petroleum can gain by generating a RIN through blending. Husky sells both blended fuels and unblended fuels with the goal of maximizing revenue net of RINs purchases.
The Company's realized refining margins are affected by the product configuration of its refineries, crude oil feedstock, product slates, transportation costs to benchmark hubs and the time lag between the purchase and delivery of crude oil. The product slates produced at the Lima and BP-Husky Toledo Refineries contain approximately 10 to 15 percent of other products that are sold at discounted market prices compared to gasoline and distillate. The Company's realized refining margins are accounted for on a first in first out (”FIFO”) basis in accordance with International Financial Reporting Standards (“IFRS”).
20 Management’s Discussion and Analysis
Chicago Average Crack Spread and Husky Realized U.S. Re�ning Margin(U.S. $/bbl)
10
30
0
20
Chicago 3:2:1 Re�ning Margin
Average Crack Spread(U.S. $/bbl)
Q1 Q2 Q3 Q4 Q1 Q2 Q3 Q41615
15 16
Chicago 3:2:1Re�ning Margin
20
30
10

21Management’s Discussion and Analysis
Management’s Discussion and Analysis 2016
10
Foreign Exchange
The majority of the Company's revenues are received in U.S. dollars from the sale of oil and gas commodities and refined products whose prices are determined by reference to U.S. benchmark prices. The majority of the Company's non-hydrocarbon related expenditures are denominated in Canadian dollars. An increase in the value of the Canadian dollar relative to the U.S. dollar will decrease the revenues received from the sale of oil and gas commodities. Correspondingly, a decrease in the value of the Canadian dollar relative to the U.S. dollar will increase the revenues received from the sale of oil and gas commodities. In addition, changes in foreign exchange rates impact the translation of U.S. Downstream and Asia Pacific operations and U.S. dollar denominated debt. The Company's earnings benefited from the weakening of the Canadian dollar in 2016, which averaged U.S. $0.755 compared to U.S. $0.783 in 2015.
The Company’s fixed long-term sales contracts in the Asia Pacific Region are priced in Chinese Yuan (“RMB”) and therefore, an increase in the value of RMB relative to the Canadian dollar will increase the revenues received in Canadian dollars from the sale of natural gas commodities in the region. The Canadian dollar averaged RMB 5.01 in 2016 compared to RMB 4.92 in 2015.
Sensitivity AnalysisThe following table is indicative of the impact of changes in certain key variables in 2016 on earnings before income taxes and net earnings. The table below reflects what the expected effect would have been on the financial results for 2016 had the indicated variable increased by the notional amount. The analysis is based on business conditions and production volumes during 2016. Each separate item in the sensitivity analysis shows the approximate effect of an increase in that variable only; all other variables are held constant. While these sensitivities are indicative for the period and magnitude of changes on which they are based, they may not be applicable in other periods, under other economic circumstances or upon greater magnitudes of change.
2016 Effect on Earnings Effect on
Sensitivity Analysis Average Increase before Income Taxes(1) Net Earnings(1)
($ millions) ($/share)(2) ($ millions) ($/share)(2)
WTI benchmark crude oil price (3)(4) 43.32 U.S. $1.00/bbl 101 0.10 73 0.07
NYMEX benchmark natural gas price(5) 2.46 U.S. $0.20/mmbtu 14 0.01 11 0.01
WTI/Lloyd crude blend differential(6) 13.70 U.S. $1.00/bbl (56) (0.06) (42) (0.04)
Canadian light oil margins 0.057 Cdn $0.005/litre 12 0.01 9 0.01
Asphalt margins 20.80 Cdn $1.00/bbl 10 0.01 8 0.01
Chicago 3:2:1 crack spread 12.74 U.S. $1.00/bbl 80 0.08 51 0.05Exchange rate (U.S. $ per Cdn $)(3)(7) 0.755 U.S. $0.01 (45) (0.04) (33) (0.03)
(1) Excludes mark to market accounting impacts.(2) Based on 1,005.5 million common shares outstanding as of December 31, 2016.(3) Does not include gains or losses on inventory.(4) Includes impacts related to Brent based production.(5) Includes impact of natural gas consumption.(6) Excludes impact on asphalt operations.(7) Assumes no foreign exchange gains or losses on U.S. dollar denominated long-term debt and other monetary items, including cash balances.
15 16
1.00
Average U.S./Canadian Dollar Exchange Rate (U.S. $ per Cdn $)
Average U.S./CanadianDollar Exchange Rate(U.S. $ per Cdn $)
0.90
0.80
0.70
0.80
0.90
1.00
0.70
Q1 Q2 Q3 Q4 Q1 Q2 Q3 Q41615

22 Management’s Discussion and Analysis
Management’s Discussion and Analysis 2016
11
4.0 Strategic Plan
The Company's strategy is to continue to develop a higher return production base, which will further lower its cost structure and drive free cash flow growth.
The Company is building on its thermal expertise through its expanding Lloyd heavy oil thermal developments, the Tucker Thermal Project and the Sunrise Energy Project. The integrated Downstream business maximizes margins from this thermal production while helping shield the Company from volatile differentials. In the Asia Pacific Region, Husky continues to develop its fixed-price natural gas business offshore China and Indonesia, further insulating the Company from commodity price instability. The Western Canada and Atlantic Region portfolios are being rejuvenated with a balance of short to long-term opportunities that provide for higher return production growth.
The Company’s strategic direction by business segment is summarized as follows:
4.1 Upstream
The Company's heavy oil strategy is focused on expanding its long life, higher return Lloyd thermal production. The Company advanced the development of its heavy oil thermal assets in 2016 with the addition of three new thermal projects with a combined nameplate capacity of 24,500 bbls/day and is currently developing the 10,000 bbls/day Rush Lake 2 project, with expected first production in the first half of 2019. The Company also sanctioned three new Lloyd thermal projects with a total design capacity of about 30,000 bbls/day, which are subject to regulatory approval, with expected first production for all three in 2020.
The Asia Pacific Region consists of the Liwan 3-1, Liuhua 34-2 and Liuhua 29-1 fields on Block 29/26 located offshore China, the Wenchang oil field, the Madura Strait block BD, MDA, MBH, MDK and MAC development fields, three discoveries offshore Indonesia and rights to additional exploration blocks in the South China Sea, offshore Taiwan and offshore Indonesia. The Liwan Gas Project, located approximately 300 kilometres southeast of the Hong Kong Special Administrative Region, is an important component of the Company’s near term production growth strategy and a key step in accessing the burgeoning energy markets in the Hong Kong Special Administrative Region and Mainland China. The Company, and its partner CNOOC, achieved first gas production from the Liwan 3-1 gas field in March 2014 and from the Liuhua 34-2 gas field in December 2014. At the Liwan Gas Project, the second 22-inch subsea pipeline connecting the deepwater pipeline to the central platform has been completed, tested and placed in service. This pipeline provides operating flexibility for the deepwater infrastructure and completes the Liwan facilities to its full design specification. Negotiations for the sale of gas and liquids from the Liuhua 29-1 gas field are ongoing. At the BD development, the project is on target for first production in the 2017 timeframe and is scheduled to ramp up to its full gas sales rate by the second half of 2017.
The Sunrise Energy Project achieved steady production ramp-up, despite wildfires temporarily impacting production in the second quarter of 2016. Total production averaged 25,600 bbls/day (12,800 bbls day net Husky share) in 2016 with annual average production in 2017 expected to be in the range of 40,000 to 44,000 bbls/day (20,000 to 22,000 bbls/day net Husky share).
In the Atlantic Region, the Company holds interests in eight Production Licences, eight Exploration Licences and 23 Significant Discovery Areas. Development activity continued to advance at the White Rose core field and its satellites, with first oil achieved at the North Amethyst Hibernia formation well and an additional well brought into production at the South White Rose drill centre. Engineering design and subsurface evaluation work continues at the West White Rose extension to increase capital efficiency and improve resource capture, with the project being considered for sanction in 2017. In the Flemish Pass, the Company holds a 35 percent non-operated working interest in the Bay du Nord, Bay de Verde, Baccalieu, Harpoon and Mizzen discoveries. The Company and its partner continue to assess the commercial potential of these discoveries. In November 2016, the Canada-Newfoundland and Labrador Petroleum Board announced that the Company was the successful bidder on two parcels of land in its 2016 land sale. The lands cover an area of 211,574 hectares and brought the Company’s ELs in the region to eight. The southwest parcel is adjacent to the White Rose field and satellite extensions, while the other is northeast of the field and adjacent to other Company operated ELs in the Jeanne d’Arc Basin.
The Company's Western Canada resource play strategy is to advance developments in the Spirit River (predominantly Wilrich), Montney and Duvernay formations.
The Infrastructure and Marketing business supports Upstream production while providing integration with the Company's Downstream assets through optimization of market access. The Company plans to expand export pipeline access and product storage opportunities to enhance market access. On July 15, 2016, the Company completed the sale of 65 percent of its ownership interest in select midstream assets in the Lloydminster region of Alberta and Saskatchewan for gross proceeds of $1.69 billion in cash. The Company retains a 35 percent ownership interest and remains the operator of the assets, which will provide the takeaway capacity for another eight heavy oil thermal developments. Strategically, the deal facilitates both the expansion of Husky Lloydminster area production and the expansion of third-party tariff business.

23Management’s Discussion and Analysis
Management’s Discussion and Analysis 2016
12
4.2 Downstream
The Company's Downstream operations target three primary objectives: increasing feedstock flexibility to bring the best-priced crude to the Company's refineries, improving flexibility in the range of its products to capitalize on opportunities and enhancing market access to achieve the best returns. The Company's focused integration strategy helps to capture refined product pricing for its Western Canada heavy oil, bitumen and light oil production and assists in mitigating market volatility.
Downstream operations include upgrading and refining crude oil and marketing gasoline, diesel, jet fuel, asphalt, ethanol and related products in Canada and the United States.
The Company’s strategic plans emphasize safe, reliable, cost effective operations. To enhance crude oil processing optionality at the Lima Refinery, the Company continued to make progress on the crude oil flexibility project targeted for completion in 2018. The project will allow for the processing of up to 40,000 bbls/day of heavy crude oil feedstock from Western Canada, enabling the Lima Refinery to swing between light and heavy crude oil feedstock and strengthening the Company’s integration model. The first stage of the project is now complete and the Refinery can currently process up to 10,000 bbls/day of heavy crude oil feedstock.
At the BP-Husky Toledo Refinery, the Company and its partner completed a feedstock optimization project in 2016. The Refinery is now able to process approximately 65,000 bbls/day of High-TAN crude oil to support production from the Sunrise Energy Project. The Refinery's overall nameplate capacity remains unchanged at 160,000 bbls/day.
4.3 Financial
The Company is committed to ensuring sufficient liquidity, financial flexibility and access to long-term capital to fund the Company's growth. The Company maintains undrawn committed term credit facilities with a portfolio of creditworthy financial institutions and other sources of liquidity to provide timely access to funding to supplement cash flow.
The Company intends to continue to maintain a healthy balance sheet to provide financial flexibility. The Company's target is to maintain a debt to funds from operations ratio of under 2.0 times and a debt to capital employed ratio of under 25 percent, which are both non-GAAP measures (refer to Sections 8.4 and 11.3). The Company is committed to retaining its investment grade credit ratings to support access to debt capital markets. The Company has taken measures to strengthen its financial position and navigate through this commodity down cycle which include, but are not limited to, a reduction of budgeted capital spending, the suspension of the quarterly common share dividend, the sale of royalty interests in Western Canada production, the sale of non-core assets in Western Canada, a strategic disposition of select midstream assets and the continued transition to lower sustaining and higher return Lloyd thermal projects. Refer to Section 8.0 for additional information on the Company's liquidity and capital resources.

24 Management’s Discussion and Analysis
Management’s Discussion and Analysis 2016
13
5.0 Key Growth Highlights
The 2016 Capital Program enabled the Company to advance its near-term profitable growth projects while maintaining prudent capital management in a weak commodity price environment.
5.1 Upstream
Heavy Oil
Heavy Oil Thermal DevelopmentsThe Company continued to advance its inventory of heavy oil thermal developments in 2016. These long-life developments are built with modular, repeatable designs and require low sustaining capital once brought online.
The following table lists the design capacity, percentage completion and status for the Company's near-term heavy oil thermal developments:
Heavy Oil Thermal DevelopmentsDevelopment Design Capacity (bbls/day) Percentage Completion Status 2016 Exit Production (bbls/day) (1)
Edam East 10,000 100% On production 14,900
Vawn 10,000 100% On production 11,400
Edam West 4,500 100% On production 4,200(1) Exit production is the average production for the month of December.
Total heavy oil thermal production, including the Tucker Thermal Project averaged 84,600 bbls/day in 2016 compared to 59,900 bbls/day in 2015, a 41 percent increase. The increase is primarily attributed to new production from the Edam East, Vawn, and Edam West heavy oil thermal developments in addition to steady production from the balance of the Company's other heavy oil thermal developments, including the Tucker Thermal Project.
Total heavy oil thermal production reached an average production of 102,400 bbls/day in December.
First oil was achieved from the Colony formation at the Tucker Thermal Project in the Cold Lake region of Alberta on April 19, 2016. Total production from the Tucker Thermal Project averaged 21,700 bbls/day in December.
Development continues at the 10,000 bbls/day Rush Lake 2 heavy oil thermal development, with first production expected in the first half of 2019.
The Company sanctioned three new Lloyd thermal projects with total design capacity of about 30,000 bbls/day at Dee Valley, Spruce Lake North and Spruce Lake Central. Subject to regulatory approval, first production for all three is expected in 2020.
Oil Sands
Sunrise Energy Project Production from the Sunrise Energy Project averaged 25,600 bbls/day (12,800 bbls/day net Husky share) in 2016. Production was temporarily impacted by the wildfire in the second quarter and averaged approximately 35,000 bbls/day (17,500 bbls/day net Husky share) in December. The Company has introduced higher operating pressures, as approved by the Alberta Energy Regulator (”AER”), contributing to higher steam-oil ratio (”SOR”) in the short term. As a result, the Company expects improved well conformance and production rates over the next two years.
Production is expected to continue to ramp up in 2017 with average annual production in the range of 40,000 to 44,000 bbls/day (20,000 to 22,000 bbls/day net Husky share).

25Management’s Discussion and Analysis
Management’s Discussion and Analysis 2016
14
Asia Pacific Region
ChinaBlock 29/26Combined gross production from Liwan 3-1 and Liuhua 34-2 averaged 48,800 boe/day (24,800 boe/day net Husky share) in 2016, consisting of gross natural gas production of 224 mmcf/day and NGL production of 11.5 mbbls/day compared to 62,300 boe/day (38,400 boe/day net Husky share) in 2015, consisting of gross natural gas production of 286 mmcf/day and NGL production of 14.6 mbbls/day. The decrease in production in 2016 was due to issues within the buyer’s onshore pipeline network in the first quarter, reduced demand throughout the year and the Company's share of production volumes reverted back to 49 percent in the second quarter of 2015 following the completion of exploration cost recoveries from the Liwan 3-1 field. The second 22-inch subsea pipeline connecting the deepwater pipeline to the central platform has been completed, tested and placed in service. This pipeline provides operating flexibility for the deepwater infrastructure and completes the Liwan facilities to its full design specification.
Negotiations for the sale of gas and liquids from the Liuhua 29-1 gas field are ongoing.
Block 15/33On the 15/33 block located offshore China, the Company is continuing to plan for exploration activities and expects to drill two wells in the 2017-2018 timeframe.
Offshore TaiwanAnalysis of the two-dimensional seismic survey data acquired in 2014 has been completed and a number of significant prospects have been identified. The Company plans to acquire three-dimensional seismic survey data on the most attractive prospects during 2017.
IndonesiaMadura StraitProgress continued on the shallow water gas developments during 2016. At the liquids-rich BD field, development well drilling, completion and testing of all four wells has been completed. The facilities construction project is approximately 97 percent complete including the installation and testing of the shallow water platform, the subsea pipeline to shore and the onshore gas metering station. The FPSO vessel construction has been completed and the vessel is now moored at the field location in preparation for in-situ testing and commissioning. The project is on target for first production in the 2017 timeframe and is scheduled to ramp up to its full gas sales rate by the second half of 2017.
The Company has secured a gas sales agreement for the MDA and MBH fields, which will be developed in tandem. Negotiations of additional gas sales agreements for the MDA, MBH and MDK gas fields are in progress. A re-tendering process for a floating production vessel has been completed and the winning bidder was approved by SKK Migas. The vessel lease contract is being finalized and is planned to be signed in early 2017. Tendering is also underway for related engineering, procurement, construction and installation contracts. Production from the MDA, MBH and MDK fields is expected in the 2018 - 2019 timeframe. Combined net sales volumes from the BD, MDA, MBH and MDK fields are expected to be approximately 100 mmcf/day of natural gas and 2,400 bbls/day of associated NGLs once production is fully ramped up.
AnugerahDuring 2015, the Company acquired two-dimensional and three-dimensional seismic survey data on the contract area. Results from analysis of the data is being evaluated to confirm whether the Company will accept a future drilling commitment.
Atlantic Region
White Rose Field and Satellite ExtensionsIn 2016, the Henry Goodrich rig resumed operations at North Amethyst. First production was achieved from the North Amethyst Hibernia formation well on September 15, 2016. An additional well was brought into production at the South White Rose drill centre on November 29, 2016. The rig has since drilled an infill well at North Amethyst.
Engineering design and subsurface evaluation work continues at West White Rose to increase capital efficiency and improve resource capture. The project will be considered for sanction in 2017.
26 Management’s Discussion and Analysis
Management’s Discussion and Analysis 2016
15
Atlantic ExplorationThe exploration and appraisal drilling program at the Bay du Nord discovery in the Flemish Pass Basin was completed during 2016. Since the program commenced in the fourth quarter of 2014, Husky has participated in three appraisal and four exploration wells in and around Bay du Nord, leading to two new oil discoveries at Bay de Verde and Baccalieu and two unsuccessful wells at Bay d`Espoir and Bay du Loup. The Company holds a 35 percent non-operated working interest in the Bay du Nord, Bay de Verde, Baccalieu, Harpoon and Mizzen discoveries. The Company and its partner continue to assess the commercial potential of these discoveries.
In November 2016, the Canada-Newfoundland and Labrador Petroleum Board announced that the Company was the successful bidder on two parcels of land in its 2016 land sale. The lands cover an area of 211,574 hectares and brought the Company’s ELs in the region to eight. The southwest parcel is adjacent to the White Rose field and satellite extensions, while the other is northeast of the field and adjacent to other Company operated ELs in the Jeanne d’Arc Basin.
Western Canada Resource Play Development
Oil and Natural Gas Resource PlaysOverall resource play production in Western Canada averaged approximately 34,500 boe/day in 2016, with current development primarily focused on the Ansell multi-zone natural gas resource play.
The Company is pursuing liquids-rich natural gas development opportunities within the existing asset portfolio primarily in the Ansell and Kakwa areas.
5.2 Downstream
Canadian Refined ProductsThe Company and Imperial Oil received regulatory approval from the Canadian Competition Bureau during the second quarter of 2016 to create a single expanded truck transport network of approximately 160 sites. The agreement was approved by Canada's Competition Bureau in June 2016 and contract closing conditions were met late in the fourth quarter 2016. Progress continues to be made on the implementation of the agreement and the consolidation of the two networks is expected in the second half of 2017.
Lima RefineryThe Company continued work on a crude oil flexibility project in 2016. The project is designed to allow for the processing of up to 40,000 bbls/day of heavy crude oil feedstock from Western Canada providing the Refinery with the ability to swing between light and heavy crude oil feedstock. The first stage of the project was completed in 2016 and the Refinery can currently process up to 10,000 bbls/day of heavy crude oil feedstock. The full scope of the project is expected to be completed in 2018.
BP-Husky Toledo RefineryThe Company and its partner completed a feedstock optimization project at the BP-Husky Toledo Refinery in mid-July 2016. The Refinery is now able to process approximately 65,000 bbls/day of High-TAN crude oil to support production from the Sunrise Energy Project.
Lloydminster Asphalt ExpansionThe Company has started pre-FEED work on a potential 30,000 bbls/day expansion of its asphalt processing capacity in Lloydminster with sanctioning expected in 2017. This business continues to show strong returns through the cycle and its expansion would provide an additional outlet for the Company's growing heavy oil thermal production.

27Management’s Discussion and Analysis
Management’s Discussion and Analysis 2016
16
6.0 Results of Operations
6.1 Segment Earnings
Earnings (Loss) before Income Taxes Net Earnings (Loss) Capital Expenditures(1)
($ millions) 2016 2015 2016 2015 2016 2015Upstream
Exploration and Production (298) (5,945) (217) (4,338) 872 2,269
Infrastructure and Marketing 1,430 115 1,308 84 54 168
Downstream
Upgrading 241 128 175 93 51 46
Canadian Refined Products 151 231 110 170 52 30
U.S. Refining and Marketing 90 306 57 397 623 425
Corporate (664) (206) (511) (256) 53 67
Total 950 (5,371) 922 (3,850) 1,705 3,005
(1) Excludes capitalized costs related to asset retirement obligations and capitalized interest incurred during the period.
6.2 Upstream
Exploration and Production
Exploration and Production Earnings Summary ($ millions) 2016 2015Gross revenues 4,036 5,374
Royalties (305) (432)
Net revenues 3,731 4,942
Purchases of crude oil and products 32 41
Production, operating and transportation expenses 1,760 2,076
Selling, general and administrative expenses 232 237
Depletion, depreciation, amortization and impairment 1,815 7,993
Exploration and evaluation expenses 188 447
Gain on sale of assets (192) (17)
Other – net 53 (34)
Share of equity investment loss 1 5
Financial items 140 139
Recovery of income taxes (81) (1,607)
Net earnings (loss) (217) (4,338)
(4,254)(555) (329) (61)
(96)
189 241494
4,014
1,448 1,091
2015
Other Depletion,depreciation
andamortization
Commodityvolumechangenet of
royalties
Operatingand
administrationexpenses
Commodityprice
changenet of
royalties
Explorationand
evaluationexpense
Impairmentcharge
Gain(loss)
on saleof assets
After Tax Earnings Variance Analysis($ millions)
0
(1,000)
(2,000)
(3,000)
(4,000)
(5,000)
(6,000)
1,000
2,000
Infrastructureand
marketing
2016
Management’s Discussion and Analysis 2016
16
6.0 Results of Operations
6.1 Segment Earnings
Earnings (Loss) before Income Taxes Net Earnings (Loss) Capital Expenditures(1)
($ millions) 2016 2015 2016 2015 2016 2015Upstream
Exploration and Production (298) (5,945) (217) (4,338) 872 2,269
Infrastructure and Marketing 1,430 115 1,308 84 54 168
Downstream
Upgrading 241 128 175 93 51 46
Canadian Refined Products 151 231 110 170 52 30
U.S. Refining and Marketing 90 306 57 397 623 425
Corporate (664) (206) (511) (256) 53 67
Total 950 (5,371) 922 (3,850) 1,705 3,005
(1) Excludes capitalized costs related to asset retirement obligations and capitalized interest incurred during the period.
6.2 Upstream
Exploration and Production
Exploration and Production Earnings Summary ($ millions) 2016 2015Gross revenues 4,036 5,374
Royalties (305) (432)
Net revenues 3,731 4,942
Purchases of crude oil and products 32 41
Production, operating and transportation expenses 1,760 2,076
Selling, general and administrative expenses 232 237
Depletion, depreciation, amortization and impairment 1,815 7,993
Exploration and evaluation expenses 188 447
Gain on sale of assets (192) (17)
Other – net 53 (34)
Share of equity investment loss 1 5
Financial items 140 139
Recovery of income taxes (81) (1,607)
Net earnings (loss) (217) (4,338)

28 Management’s Discussion and AnalysisManagement’s Discussion and Analysis 2016
17
Exploration and Production net revenues decreased by $1,211 million in 2016 compared to 2015, primarily due to lower global crude oil benchmark prices, lower crude oil and natural gas production in North America due to the disposition of select legacy Western Canada crude oil and natural gas assets and lower natural gas production in the Asia Pacific Region due to lower demand and the reversion of the Company's entitlement share of production at Liwan 3-1 to 49 percent, from approximately 76 percent in the second quarter of 2015. The factors affecting the decline in Exploration and Production net revenues were partially offset by higher heavy oil thermal production and lower royalties.
Production, operating, and transportation costs decreased by $316 million in 2016 compared to 2015 primarily due to cost savings initiatives and lower energy costs.
Depletion, depreciation, amortization (”DD&A”) and impairment expense decreased by $6,178 million in 2016 compared to 2015 primarily due to the recognition of a pre-tax impairment charge of $5,181 million on crude oil and natural gas assets in 2015, which reduced the carrying value of the Company's depletable asset base in 2016 and the recognition of a pre-tax net impairment reversal of $261 million in 2016 related to Western Canada assets.
Exploration and evaluation expenses decreased by $259 million in 2016 compared to 2015. The decrease is primarily due to a $277 million write-down of certain Western Canada resource play assets including associated unfulfilled work commitment penalties in the third quarter of 2015, compared to an $86 million write-off in 2016 primarily due to two unsuccessful exploration wells in the Atlantic Region and a decision by management to not pursue further evaluation of certain Oil Sands assets at this time.
Gain on sale of assets increased by $175 million in 2016 compared to 2015 due to the sale of royalty interests and select legacy Western Canada crude oil and natural gas assets.
Recovery of income taxes decreased by $1,526 million primarily due to a $1,357 million deferred income tax recovery associated with impairment charges recognized on crude oil and natural gas assets located in Western Canada in 2015.
Average Sales Prices Realized
Average Sales Prices Realized 2016 2015Crude oil and NGL ($/bbl)
Light & Medium crude oil 52.40 57.55
NGL 38.01 45.88
Heavy crude oil 30.50 37.16
Bitumen 27.63 34.47
Total crude oil and NGL average 35.78 44.18
Natural gas average ($/mcf) 4.40 5.80
Total average ($/boe) 33.08 41.06
The average sales prices realized by the Company declined by 19 percent for crude oil and NGL in 2016 compared to 2015 reflecting significant declines in global crude oil benchmarks.
15 16
Average Price RealizedNatural Gas($/mcf)
15 16
Average Price RealizedCrude Oil and NGL($/bbl)
20
30
40
50
102.00
6.00
4.00

29Management’s Discussion and AnalysisManagement’s Discussion and Analysis 2016
18
The average sales prices realized by the Company for natural gas declined by 24 percent in 2016 compared to 2015. The decrease in realized natural gas pricing was primarily due to lower fixed priced natural gas production from the Liwan Gas Project relative to total natural gas production and a price adjustment for natural gas from the Liwan 3-1 and Liuhua 34-2 fields, per the Heads of Agreement (”HOA”) signed by the Company with CNOOC Limited in the third quarter of 2016. The price adjustment under the HOA is effective as of November 2015 and a retroactive adjustment was recognized in the third quarter of 2016. Asia Pacific natural gas production was also lower in 2016 due to reduced buyer demand, temporary production shut-in for the gas buyer's onshore gas pipeline infrastructure in the first quarter of 2016 and the Company's share of production volumes reverted back to 49 percent in the second quarter of 2015 following the completion of exploration cost recoveries from the Liwan 3-1 field.
Daily Gross Production
Daily Gross Production 2016 2015
Crude oil and NGL (mbbls/day)
Western Canada
Light & Medium crude oil 23.4 36.4
NGL 8.0 8.8
Heavy crude oil 54.1 69.1
Bitumen(1) 84.6 59.9
170.1 174.2
Oil Sands
Sunrise – bitumen 12.8 3.2
Atlantic Region
White Rose and Satellite Fields – light crude oil 28.8 32.1
Terra Nova – light crude oil 4.3 4.7
33.1 36.8
Asia Pacific Region
Wenchang – light crude oil 6.6 7.3
Liwan and Wenchang – NGL(2) 6.0 9.4
12.6 16.7
228.6 230.9
Natural gas (mmcf/day)
Western Canada 442.4 513.9
Asia Pacific Region(2) 113.5 175.1
555.9 689.0
Total (mboe/day) 321.2 345.7
(1) Bitumen consists of production from heavy oil thermal developments and the Tucker Thermal Project located near Cold Lake, Alberta. Heavy oil thermal average daily gross production was 65.4 mbbls/day and 48.4 mbbls/day for the years ended December 31, 2016 and 2015, respectively.
(2) Reported production volumes include Husky’s net working interest production from the Liwan Gas Project (49 percent) and an incremental share of production volumes allocated to Husky for exploration cost recoveries. The incremental share of production volumes ceased during the second quarter of 2015 reflecting the completion of exploration cost recoveries from the Liwan 3-1 field.
15 16
ProductionNatural Gas(mmcf/day)
15 16
ProductionOil & NGL(mbbls/day)
15 16
ProductionCombined(mboe/day)
100
200
300
400
Light & Medium NGL Heavy Bitumen
60
80
100
40
20 200
600
800
400

30 Management’s Discussion and AnalysisManagement’s Discussion and Analysis 2016
19
Crude Oil and NGL ProductionCrude oil and NGL production decreased by 2.3 mbbls/day or one percent compared to 2015 primarily due to divestitures of select legacy Western Canada crude oil and natural gas assets in 2016 and natural reservoir declines from mature properties in Western Canada and the Atlantic Region. The decreases were partially offset by strong performance from new and existing heavy oil thermal developments and production ramp-up at the Sunrise Energy Project.
Natural Gas ProductionNatural gas production decreased by 133.1 mmcf/day or 19 percent compared to 2015. In the Asia Pacific Region, natural gas production decreased by 61.6 mmcf/day due to reduced buyer demand, temporary production shut-in for the connection of a second deepwater pipeline and an unscheduled isolation and temporary repair in the Liwan 3-1 field related to the gas buyer's onshore gas pipeline infrastructure in the first quarter of 2016. Additionally, the Company's entitlement share of production volumes reverted back to 49 percent in late May 2015 following the completion of exploration cost recoveries from the Liwan 3-1 field.
In Western Canada, natural gas production decreased by 71.5 mmcf/day primarily due to divestitures of select legacy Western Canada crude oil and natural gas assets, reduced investment, natural reservoir declines from mature properties, strategic shut-ins due to unfavourable economics and third-party pipeline restrictions.
Exploration and Production Revenue Mix (Percentage of Upstream Net Revenues) 2016 2015Crude oil and NGL
Light & Medium crude oil 32% 33%
NGL 5% 6%
Heavy crude oil 15% 18%
Bitumen 25% 15%
Crude oil and NGL 77% 72%
Natural gas 23% 28%
Total 100% 100%
2017 Production Guidance and 2016 Actual
GuidanceYear ended
December 31 Guidance(1)
Gross Production 2017 2016 2016Canada
Light & Medium crude oil (mbbls/day) 46 - 48 56 66 - 68
NGL (mboe/day) 8 - 9 8 7 - 8
Heavy crude oil & bitumen (mbbls/day) 167 - 173 151 142 - 157
Natural gas (mmcf/day) 345 - 353 442 380 - 430
Canada total (mboe/day) 278 - 288 289 279 - 305
Asia PacificLight crude oil (mbbls/day) 5 - 6 7 6 - 7
NGL (mboe/day) 8 - 10 6 7 - 8
Natural gas (mmcf/day) 171 - 182 114 140 - 150
Asia Pacific total (mboe/day) 42 - 46 32 36 - 40
Total (mboe/day) 320 - 335 321 315 - 345(1) 2016 production guidance does not reflect the impact of asset dispositions in Western Canada.
The Company’s total production for the year ended December 31, 2016 was within the production guidance. The Company expects that total production volumes in 2017 will be comparable to 2016. The 2017 production guidance reflects increasing thermal heavy oil production along with increasing bitumen production from the Sunrise Energy Project and initial production from the BD liquids rich gas field in Indonesia. The increases are anticipated to be offset by continued natural declines from mature properties in the Atlantic Region and Western Canada and reflects the Company's decision to reduce the amount of capital in Western Canada.

Management’s Discussion and Analysis 2016
20
Factors that could potentially impact the Company’s production performance in 2017 include, but are not limited to:• potential divestment of certain producing crude oil or natural gas properties in Western Canada;• declines in crude oil and natural gas prices which may result in the decision to temporarily shut-in production or delay capital
expenditures;• increases in crude oil and natural gas prices which may result in the decision to accelerate near-term growth projects;• performance on recently commissioned facilities, new wells brought onto production and unanticipated reservoir response from
existing fields;• unplanned or extended maintenance and turnarounds at any of the Company’s operated or non-operated facilities, upgrading,
refining, pipeline or offshore assets;• business interruptions due to unexpected events such as severe weather, fires, blowouts, freeze-ups, equipment failures, unplanned
and extended pipeline shutdowns and other similar events;• defaults by contracting parties whose services or facilities are necessary for the Company's production; and• operations and assets which are subject to a number of political, economic and socio-economic risks.
RoyaltiesRoyalty rates as a percentage of gross revenues were consistent in 2016 and 2015 at eight percent. Royalty rates in Western Canada averaged seven percent in 2016 compared to nine percent in 2015 primarily due to a higher percentage of production from thermal projects, which are at a lower royalty rate and due to lower commodity prices, which affect royalties on a sliding scale of price sensitivity. Royalty rates in the Atlantic Region averaged 15 percent in 2016 compared to 11 percent in 2015 due to lower eligible royalty costs. Royalty rates in the Asia Pacific Region averaged six percent in 2016 compared to five percent in 2015.
Operating Costs
($ millions) 2016 2015Western Canada 1,413 1,692
Atlantic Region 224 225
Asia Pacific 92 97
Total 1,729 2,014
Per unit operating costs ($/boe) 14.04 15.14
Total Exploration and Production operating costs were $1,729 million in 2016 compared to $2,014 million in 2015. Total Upstream unit operating costs averaged $14.04/boe in 2016 compared to $15.14/boe in 2015 with the decrease primarily attributable to lower unit operating costs per boe in Western Canada.
Per unit operating costs in Western Canada averaged $14.21/boe in 2016 compared to $16.55/boe in 2015. The decrease in unit operating costs per boe was primarily attributable to cost savings initiatives, lower energy costs and divestitures of higher operating cost assets.
Per unit operating costs in the Atlantic Region averaged $18.48/boe in 2016 compared to $16.76/boe in 2015. The increase in unit operating costs per boe was primarily attributable to a decrease in production.
Per unit operating costs in the Asia Pacific Region averaged $8.01/boe in 2016 compared to $5.78/boe in 2015. The increase in unit operating costs per boe was primarily attributable to lower production at the Liwan Gas Project, partially offset by cost saving initiatives.
Exploration and Evaluation Expenses
($ millions) 2016 2015Seismic, geological and geophysical 78 103
Expensed drilling 66 297
Expensed land 44 47
Total 188 447
Exploration and evaluation expenses in 2016 were $188 million compared to $447 million in 2015. The decrease in expense drilling is primarily attributable to a $277 million write-down of certain Western Canada resource play assets including associated unfulfilled work commitment penalties in the third quarter of 2015. Included in expensed land and drilling in 2016 is a pre-tax write-off of $86 million mainly related to Oil Sands and Atlantic Region assets. The decrease in seismic, geological and geophysical costs resulted from lower seismic activity across the portfolio.
31Management’s Discussion and Analysis

32 Management’s Discussion and AnalysisManagement’s Discussion and Analysis 2016
21
Depletion, Depreciation, Amortization and Impairment DD&A and impairment expense decreased by $6,178 million in 2016 compared to 2015 primarily due to the recognition of a pre-tax impairment charge of $5,181 million on crude oil and natural gas assets, including associated goodwill, located in Western Canada during the third quarter of 2015. The impairment charge reduced the carrying value of the Company's depletable asset base and resulted in a lower DD&A expense per unit of production in 2016. In 2016, the Company recognized a net pre-tax impairment reversal of $261 million on assets located in Western Canada due to the acceleration of forecasted production and revised operational economics, based on recent production performance and market transactions. Additionally, in 2016, production was lower from the Liwan Gas Project, which carries a higher per unit of production DD&A expense. In 2016, total DD&A excluding impairment averaged $17.67/boe compared to $22.28/boe in 2015.
(1) Operating netback is a non-GAAP measure and is equal to gross revenue less royalties, production and operating costs and transportation costs on a per unit basis. Refer to section 11.3.
(2) DD&A excludes impairment and impairment reversals.
Exploration and Production Capital ExpendituresExploration and Production capital expenditures were lower in 2016 compared to 2015 and reflect the Company's prudent capital management in a low commodity price environment. Exploration and Production capital expenditures were as follows:
Exploration and Production Capital Expenditures(1) ($ millions) 2016 2015
ExplorationWestern Canada 18 24
Heavy Oil 6 12
Atlantic Region 18 169
Asia Pacific Region 4 —
46 205
DevelopmentWestern Canada 116 420
Heavy Oil 335 899
Oil Sands 28 264
Atlantic Region 226 379
Asia Pacific Region 114 46
819 2,008
AcquisitionsWestern Canada — 2
Heavy Oil 7 54
7 56
872 2,269
(1) Excludes capitalized costs related to asset retirement obligations and capitalized interest incurred during the period.
Western CanadaDuring 2016, $134 million (15 percent) was invested in Western Canada conventional and resource plays, compared to $446 million(20 percent) in 2015. Capital expenditures in 2016 relate primarily to sustainment and maintenance activities and the development of the Rainbow Lake NGL project. The decrease in capital expenditures in 2016 compared to 2015 is due to the low commodity price environment.
Q1 Q2 Q3 Q4 Q1 Q2 Q3 Q4
Operating Netback(1), Unit Operating Costs and DD&A(2) ($/boe)
10
20
30
0
1615Operating Netback Operating Costs DD&A

33Management’s Discussion and AnalysisManagement’s Discussion and Analysis 2016
22
Heavy OilDuring 2016, $348 million (40 percent) was invested in Heavy Oil, compared to $965 million (42 percent) in 2015. Capital expenditures in 2016 relate primarily to the development of the Edam East, Edam West and Vawn heavy oil thermal developments in addition to the Colony formation at the Tucker Thermal Project. The decrease in capital expenditures in 2016 compared to 2015 reflects the completion of thermal projects.
Oil Sands During 2016, $28 million (three percent) was invested in Oil Sands, compared to $264 million (12 percent) in 2015. Capital expenditures in 2016 and 2015 relate primarily to the Sunrise Energy Project. The decrease in capital expenditures in 2016 compared to 2015 reflects the completion of Phase 1 of the Sunrise Energy Project in the third quarter of 2015.
Atlantic RegionDuring 2016, $244 million (28 percent) was invested in the Atlantic Region, compared to $548 million (24 percent) in 2015. Capital expenditures in 2016 relate primarily to the development of the White Rose extension projects, including North Amethyst and South White Rose satellite fields and further exploration and appraisal drilling in the Flemish Pass Basin. The decrease in capital expenditures in 2016 compared to 2015 reflects the completion of the Bay du Nord delineation program in 2016.
Asia Pacific RegionDuring 2016, $118 million (14 percent) was invested in the Asia Pacific Region, compared to $46 million (two percent) in 2015. Capital expenditures in 2016 relate primarily to the Liwan Gas Project. The increase in capital expenditures in 2016 compared to 2015 relates primarily to the planned completion of a second subsea pipeline at Liwan.
Onshore drilling activityThe following table discloses the number of wells drilled in Heavy Oil, Oil Sands and Western Canada conventional and resource plays during 2016 and 2015:
2016 2015
Wells Drilled (wells)(1) Gross Net Gross Net
Heavy Oil 75 75 87 86
Oil Sands(2) — — 28 14
Western Canada conventional and resource plays
Gas Resource 3 2 39 29
Oil Resource — — 1 1
Conventional Oil — — 6 3
Conventional Gas — — 2 —
Enhanced Oil Recovery — — 2 2
78 77 165 135(1) Excludes Service/Stratigraphic test wells for evaluation purposes.(2) Reflects Husky's 50 percent working interest in the Sunrise Energy Project.
During 2016, the Company's onshore drilling was focused primarily on Heavy Oil thermal developments. The decrease of Heavy Oil and Oil Sands drilling and completion activity is due to the completion of three new heavy oil thermal developments in 2016 and first oil at Sunrise Energy Project in 2015. Western Canada resource play drilling and completion activity has been curtailed due to limited capital investment in a low commodity price environment.
Offshore drilling activityThe following table discloses the Company's offshore Atlantic Region and Asia Pacific Region drilling activity during 2016:
Region Well Working Interest Well TypeAtlantic Region Bay d'Espoir B-09 (1) WI 35 percent Exploration
Atlantic Region Bay du Loup M-62 (1) WI 35 percent Exploration
Atlantic Region Baccalieu F-89 WI 35 percent Exploration
Atlantic Region North Amethyst E-18 12Y WI 68.875 percent Development
Atlantic Region South White Rose Extension J-05 4 WI 68.875 percent Development
Asia Pacific Region Madura BD A-1 WI 40 percent Development
Asia Pacific Region Madura BD A-2 WI 40 percent Development
Asia Pacific Region Madura BD A-3 WI 40 percent Development
Asia Pacific Region Madura BD A-4 WI 40 percent Development(1) The Bay d'Espoir B-09 and Bay du Loup M-62 exploration wells were fully written off in the second quarter of 2016 as the wells did not encounter economic quantities of hydrocarbons.

34 Management’s Discussion and AnalysisManagement’s Discussion and Analysis 2016
23
2017 Upstream Capital Expenditures Program
($ millions)
Western Canada 210 - 225Heavy Oil 685 - 720Oil Sands 90 -100Atlantic Region 320 - 335Asia Pacific Region(1) 230 - 240Total Upstream capital expenditures 1,535 - 1,620
(1) Includes capital expenditures expected to be incurred by the Husky-CNOOC Madura Ltd. joint venture which are classified as contribution to joint ventures in the investing activities on the Company's Consolidated Statements of Cash Flows.
The 2017 Upstream capital expenditures program reflects the Company's prudent capital management in a weak commodity price environment. The Company will continue its transition towards a low sustaining capital business. The Company's 2017 Upstream capital expenditures program has been designed to remain in balance with funds from operations.
The Company has budgeted $685 - $720 million in Heavy Oil for 2017, primarily for the development of Rush Lake 2 and three newly sanctioned Lloyd thermal projects with total design capacity of about 30,000 bbls/day at Dee Valley, Spruce Lake North and Spruce Lake Central. The three newly sanctioned Lloyd thermal projects are subject to regulatory approval, first production for all three is expected in 2020. The Company is making progress in its strategy to transition a greater percentage of production to long-life heavy oil thermal production and the 2017 Upstream capital expenditures program will continue to build on this momentum.
The Company has budgeted $90 - $100 million in Oil Sands for 2017, primarily for the continued development of the Sunrise Energy Project.
The Company has budgeted $210 - $225 million in Western Canada resource play development for 2017, primarily for development drilling at the Spirit River formation in the Ansell and Kakwa areas.
The Company has budgeted $320 - $335 million in the Atlantic Region for 2017, primarily for the continued development of the main White Rose field and satellite extensions.
The Company has budgeted $230 - $240 million for the Asia Pacific Region in 2017, primarily for the continued development of the Liwan Gas Project and the development of the Madura Strait Block in Indonesia.
Oil and Gas ReservesThe Company's reserves disclosure was prepared in accordance with Canadian Securities Administrators' National Instrument 51-101 “Standards of Disclosure for Oil and Gas Activities” (“NI 51-101”) effective December 31, 2016 with a preparation date of January 31, 2017.
Proved and Probable Reserves at December 31:
Note: All heavy oil thermal reserves are classified as bitumen.
15 16
Light Oil, Medium Oil & NGL (mmbbls)
200
300
400
100
15
50
100
150
16 15 16 15 16
Heavy Oil(mmbbls)
Bitumen(mmbbls)
Natural Gas(bcf)
500
1,500
2,000
1,000
15 16
1,000
3,000
2,000
Combined(mmboe)
ProbableProved
1,000
2,000
3,000
4,000

Management’s Discussion and Analysis 2016
24
The Company’s complete oil and gas reserves disclosure, prepared in accordance with NI 51-101 is contained in the Company’s Annual Information Form, which is available at www.sedar.com, and certain supplementary oil and gas reserves disclosure prepared in accordance with U.S. disclosure requirements is contained in the Company’s Form 40-F, which is available at www.sec.gov or on the Company’s website at www.huskyenergy.com.
Sproule Associates Ltd. (“Sproule”), an independent firm of qualified oil and gas reserves evaluation engineers, was engaged to conduct an audit of the Company's crude oil, natural gas and NGL reserves estimates. Sproule issued an audit opinion on January 31, 2017stating that the Company’s internally generated proved and probable reserves and net present values based on forecast and constant price assumptions are, in aggregate, reasonable and have been prepared in accordance with generally accepted oil and gas engineering and evaluation practices as set out in the Canadian Oil and Gas Evaluation Handbook.
At December 31, 2016, the Company’s proved oil and gas reserves were 1,224 mmboe, down from 1,324 mmboe at the end of 2015. The Company's 2016 reserve replacement ratio, defined as net additions divided by total production during the period, was 19 percentexcluding economic revisions (15 percent including economic revisions). The 2016 reserves replacement ratio, excluding disposition/acquisition and economic factors was 92 percent (88 percent including economic factors). Major changes to proved reserves in 2016included:• The disposition of a significant portion of the Western Canada assets resulted in a total divestiture of 90 mmboe. Total acquisitions
were 5 mmboe, mainly in the Heavy Oil and Gas thermal bitumen area and Western Canada gas plays;• Technical revisions in Heavy Oil and Gas thermal bitumen projects that resulted in the booking of an additional 47 mmbbls of
bitumen in proved reserves;• An additional 102 bcf of conventional natural gas in proved developed producing reserves was booked from Liwan 3-1; and• The extension through additional drilling locations and technical revisions at the Tucker Thermal Project that resulted in the booking
of an additional 9 mmbbls of bitumen in proved undeveloped reserves.
Proved Plus Probable Reserves and Production at December 31, 2016:
35Management’s Discussion and Analysis
Western Canada
500
1,500
2,000
1,000 1,000
1,500
2,000
500
China
10
20
30
IndonesiaAtlantic Region
100
200
300
3
6
9
300
450
(mmbbls) (bcf) (mmbbls)(mmbbls) (mmbbls) (bcf)
150200
400
600
(bcf)
ReservesOil & NGL
Production ReservesBitumen
Production ReservesNatural Gas
Production

36 Management’s Discussion and AnalysisManagement’s Discussion and Analysis 2016
25
Reconciliation of Proved Reserves
(forecast prices and costsbefore royalties)
Canada International Total
Western CanadaAtlanticRegion
Light/Medium
Crude Oil & NGL
(mmbbls)
Heavy Crude Oil
(mmbbls) (1)Bitumen
(mmbbls)(1)
Natural Gas
(bcf)
Light Crude Oil (mmbbls)
LightCrude Oil
& NGL(mmbbls)
Natural Gas (bcf)
Crude Oil, Bitumen &
NGL(mmbbls)
Natural Gas
(bcf)
Equivalent Units
(mmboe)
Proved reserves
December 31, 2015 117 113 625 1,733 55 24 608 934 2,341 1,324
Technical revisions 3 14 45 40 4 4 102 70 142 94
Acquisitions — — 3 8 — — — 3 8 5
Dispositions (29) (44) — (105) — — — (73) (105) (90)
Discoveries, extensionsand improved recovery — 2 11 13 — — — 13 13 14
Economic factors (1) (2) — (10) — — — (3) (10) (5)
Production (11) (20) (36) (162) (12) (5) (42) (84) (204) (118)
Proved reservesDecember 31, 2016 79 63 648 1,517 47 23 668 860 2,185 1,224
Proved and probablereserves December31, 2016
95 83 1,923 1,940 207 29 926 2,337 2,866 2,815
December 31, 2015 143 147 1,905 2,211 169 32 889 2,396 3,100 2,912
(1) Heavy oil thermal property reserves are classified as bitumen.
Reconciliation of Proved Developed Reserves
(forecast prices and costsbefore royalties)
Canada International Total
Western CanadaAtlanticRegion
Light/Medium
Crude Oil & NGL
(mmbbls)
Heavy Crude Oil
(mmbbls) (1)Bitumen
(mmbbls)(1)
NaturalGas
(bcf)
Light Crude Oil (mmbbls)
LightCrude Oil
& NGL(mmbbls)
Natural Gas (bcf)
Crude Oil, Bitumen
& NGL (mmbbls)
NaturalGas (bcf)
Equivalent Units
(mmboe)
Proved developed reserves
December 31, 2015 113 108 157 1,390 45 17 339 440 1,729 728
Technical revisions 3 19 19 41 7 4 103 52 144 74
Transfer from provedundeveloped — — 19 9 2 7 167 28 176 58
Acquisitions — — — 8 — — — — 8 2
Dispositions (29) (44) — (105) — — — (73) (105) (90)
Discoveries, extensionsand improved recovery — 2 1 12 — — — 3 12 5
Economic factors (1) (2) — (10) — — — (3) (10) (5)
Production (11) (20) (36) (162) (12) (5) (42) (84) (204) (118)
December 31, 2016 75 63 160 1,183 42 23 567 363 1,750 654(1) Heavy oil thermal property reserves are classified as bitumen.

Management’s Discussion and Analysis 2016
26
Infrastructure and Marketing The Company is engaged in the marketing of both its own and other producers' crude oil, natural gas, NGLs, sulphur and petroleum coke production. The Company owns infrastructure in Western Canada, including pipeline and storage facilities, and has access to capacity on third party pipelines and storage facilities in both Canada and the U.S. The Company is able to capture differences between the two markets by utilizing infrastructure capacity to deliver feedstock acquired in Canada to the U.S. market.
On July 15, 2016, the Company completed the sale of 65 percent of its ownership interest in select midstream assets in the Lloydminster region of Alberta and Saskatchewan for gross proceeds of $1.69 billion in cash. The assets include approximately 1,900 kilometres of pipeline in the Lloydminster region, 4.1 mmbbls of storage capacity at Hardisty and Lloydminster and other ancillary assets. The assets are held by HMLP, of which the Company owns 35 percent, PAH owns 48.75 percent and CKI owns 16.25 percent. The transaction enabled the Company to further strengthen its balance sheet while maintaining operatorship and preserving the integration between its heavy oil production, marketing and refining assets.
Infrastructure and Marketing Earnings Summary ($ millions, except where indicated) 2016 2015
Gross revenues 955 1,264
Purchases of crude oil and products 857 1,123
Infrastructure gross margin 98 141
Marketing and other (88) 38
Total Infrastructure and Marketing gross margin 10 179
Production, operating and transportation expenses 20 37
Selling, general and administrative expenses 5 7
Depletion, depreciation, amortization and impairment 13 25
Gain on sale of assets (1,439) —
Other – net (3) (5)
Share of equity investment gain (16) —
Provisions for income taxes 122 31
Net earnings 1,308 84
Infrastructure and Marketing gross revenues and purchases of crude oil products decreased by $309 million and $266 millionrespectively in 2016 compared to 2015, primarily due to lower commodity prices in the first half of 2016 and the sale of 65 percent of the Company's ownership interest in select midstream assets.
Marketing and other decreased by $126 million in 2016 compared with 2015 primarily due to crude oil marketing losses from narrowing price differentials between Canada and the United States during 2016. This was partially offset by unrealized gas storage mark-to-market gains as a result of rising forward North American natural gas prices towards the end of 2016.
Gain on sale of assets increased by $1,439 million in 2016 compared with 2015 due to the sale of 65 percent of the Company's ownership interest in select midstream assets.
Share of equity investment gain increased by $16 million in 2016 compared with 2015 due to the formation of HMLP. Refer to Note 11 of the Consolidated Financial Statements.
37Management’s Discussion and Analysis
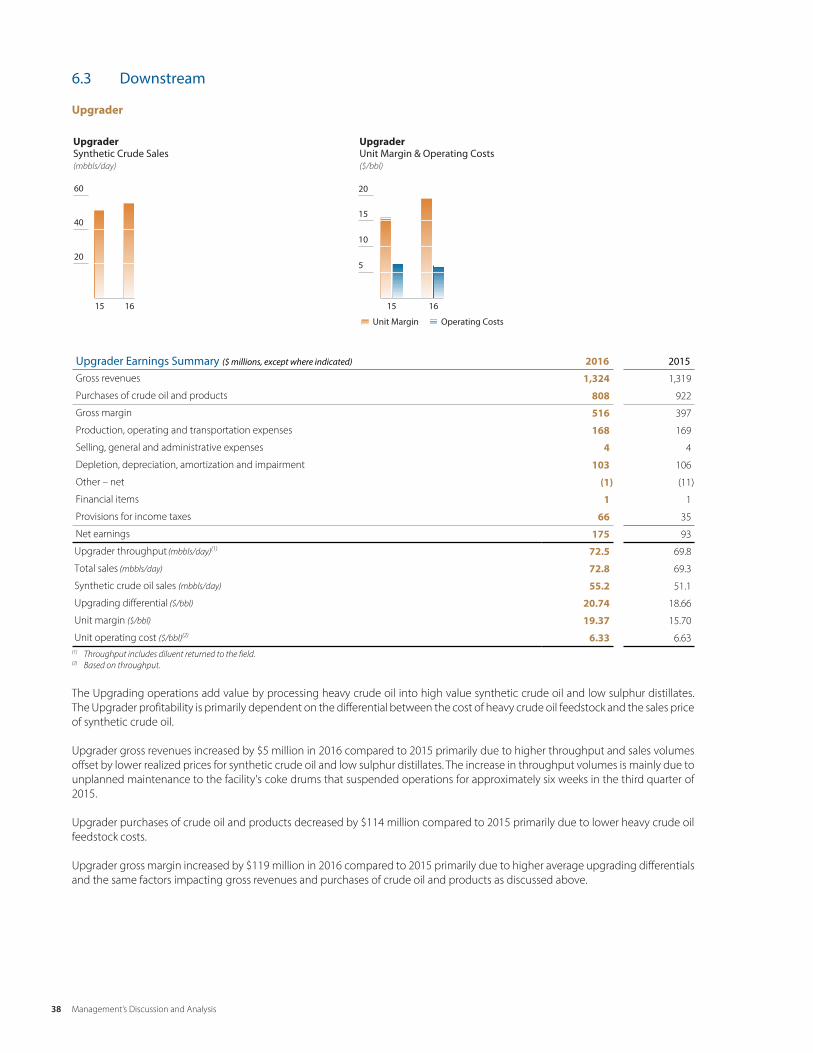
Management’s Discussion and Analysis 2016
27
6.3 Downstream
Upgrader
Upgrader Earnings Summary ($ millions, except where indicated) 2016 2015
Gross revenues 1,324 1,319
Purchases of crude oil and products 808 922
Gross margin 516 397
Production, operating and transportation expenses 168 169
Selling, general and administrative expenses 4 4
Depletion, depreciation, amortization and impairment 103 106
Other – net (1) (11)
Financial items 1 1
Provisions for income taxes 66 35
Net earnings 175 93
Upgrader throughput (mbbls/day)(1) 72.5 69.8
Total sales (mbbls/day) 72.8 69.3
Synthetic crude oil sales (mbbls/day) 55.2 51.1
Upgrading differential ($/bbl) 20.74 18.66
Unit margin ($/bbl) 19.37 15.70
Unit operating cost ($/bbl)(2) 6.33 6.63(1) Throughput includes diluent returned to the field.(2) Based on throughput.
The Upgrading operations add value by processing heavy crude oil into high value synthetic crude oil and low sulphur distillates. The Upgrader profitability is primarily dependent on the differential between the cost of heavy crude oil feedstock and the sales price of synthetic crude oil.
Upgrader gross revenues increased by $5 million in 2016 compared to 2015 primarily due to higher throughput and sales volumes offset by lower realized prices for synthetic crude oil and low sulphur distillates. The increase in throughput volumes is mainly due to unplanned maintenance to the facility's coke drums that suspended operations for approximately six weeks in the third quarter of 2015.
Upgrader purchases of crude oil and products decreased by $114 million compared to 2015 primarily due to lower heavy crude oil feedstock costs.
Upgrader gross margin increased by $119 million in 2016 compared to 2015 primarily due to higher average upgrading differentials and the same factors impacting gross revenues and purchases of crude oil and products as discussed above.
38 Management’s Discussion and Analysis
15 16 15 16
UpgraderSynthetic Crude Sales(mbbls/day)
Unit Margin Operating Costs
UpgraderUnit Margin & Operating Costs($/bbl)
20
40
60
5
15
20
10
Management’s Discussion and Analysis 2016
27
6.3 Downstream
Upgrader
Upgrader Earnings Summary ($ millions, except where indicated) 2016 2015
Gross revenues 1,324 1,319
Purchases of crude oil and products 808 922
Gross margin 516 397
Production, operating and transportation expenses 168 169
Selling, general and administrative expenses 4 4
Depletion, depreciation, amortization and impairment 103 106
Other – net (1) (11)
Financial items 1 1
Provisions for income taxes 66 35
Net earnings 175 93
Upgrader throughput (mbbls/day)(1) 72.5 69.8
Total sales (mbbls/day) 72.8 69.3
Synthetic crude oil sales (mbbls/day) 55.2 51.1
Upgrading differential ($/bbl) 20.74 18.66
Unit margin ($/bbl) 19.37 15.70
Unit operating cost ($/bbl)(2) 6.33 6.63(1) Throughput includes diluent returned to the field.(2) Based on throughput.
The Upgrading operations add value by processing heavy crude oil into high value synthetic crude oil and low sulphur distillates. The Upgrader profitability is primarily dependent on the differential between the cost of heavy crude oil feedstock and the sales price of synthetic crude oil.
Upgrader gross revenues increased by $5 million in 2016 compared to 2015 primarily due to higher throughput and sales volumes offset by lower realized prices for synthetic crude oil and low sulphur distillates. The increase in throughput volumes is mainly due to unplanned maintenance to the facility's coke drums that suspended operations for approximately six weeks in the third quarter of 2015.
Upgrader purchases of crude oil and products decreased by $114 million compared to 2015 primarily due to lower heavy crude oil feedstock costs.
Upgrader gross margin increased by $119 million in 2016 compared to 2015 primarily due to higher average upgrading differentials and the same factors impacting gross revenues and purchases of crude oil and products as discussed above.
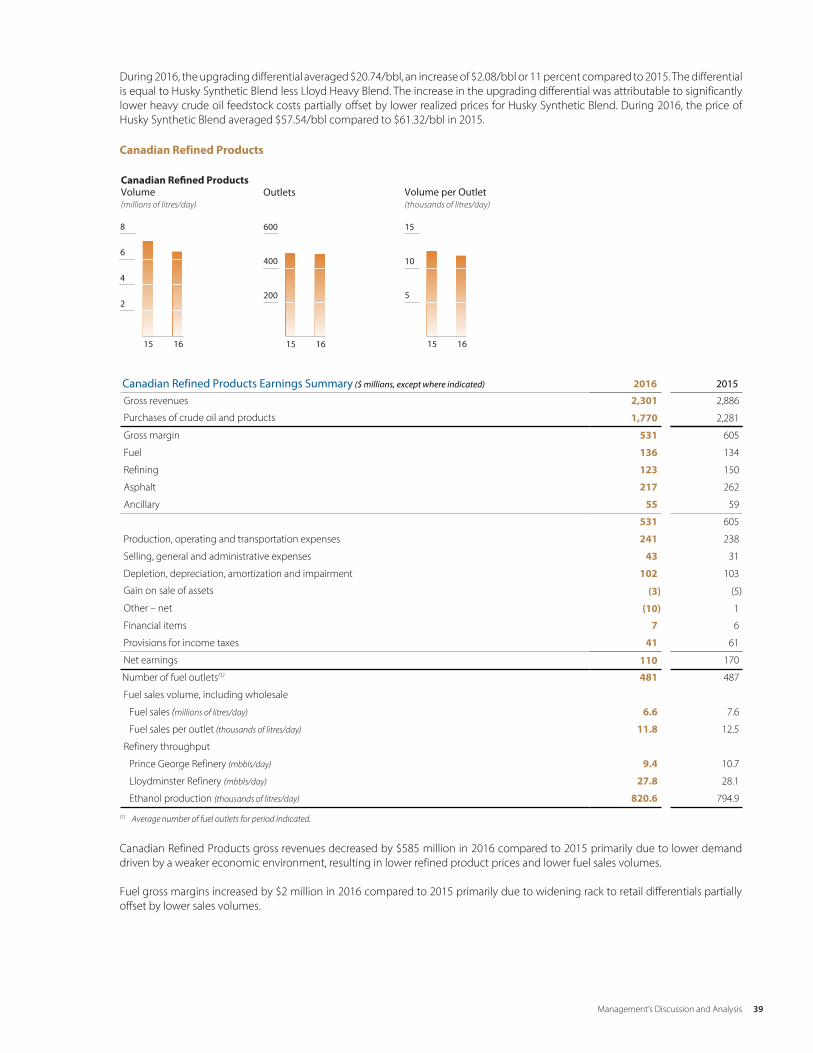
Management’s Discussion and Analysis 2016
28
During 2016, the upgrading differential averaged $20.74/bbl, an increase of $2.08/bbl or 11 percent compared to 2015. The differential is equal to Husky Synthetic Blend less Lloyd Heavy Blend. The increase in the upgrading differential was attributable to significantly lower heavy crude oil feedstock costs partially offset by lower realized prices for Husky Synthetic Blend. During 2016, the price of Husky Synthetic Blend averaged $57.54/bbl compared to $61.32/bbl in 2015.
Canadian Refined Products
Canadian Refined Products Earnings Summary ($ millions, except where indicated) 2016 2015
Gross revenues 2,301 2,886
Purchases of crude oil and products 1,770 2,281
Gross margin 531 605
Fuel 136 134
Refining 123 150
Asphalt 217 262
Ancillary 55 59
531 605
Production, operating and transportation expenses 241 238
Selling, general and administrative expenses 43 31
Depletion, depreciation, amortization and impairment 102 103
Gain on sale of assets (3) (5)
Other – net (10) 1
Financial items 7 6
Provisions for income taxes 41 61
Net earnings 110 170
Number of fuel outlets(1) 481 487
Fuel sales volume, including wholesale
Fuel sales (millions of litres/day) 6.6 7.6
Fuel sales per outlet (thousands of litres/day) 11.8 12.5
Refinery throughput
Prince George Refinery (mbbls/day) 9.4 10.7
Lloydminster Refinery (mbbls/day) 27.8 28.1
Ethanol production (thousands of litres/day) 820.6 794.9
(1) Average number of fuel outlets for period indicated.
Canadian Refined Products gross revenues decreased by $585 million in 2016 compared to 2015 primarily due to lower demand driven by a weaker economic environment, resulting in lower refined product prices and lower fuel sales volumes.
Fuel gross margins increased by $2 million in 2016 compared to 2015 primarily due to widening rack to retail differentials partially offset by lower sales volumes.
39Management’s Discussion and Analysis
15 16
Canadian Re�ned ProductsVolume(millions of litres/day)
15 16
Outlets
4
6
8
2200
400
600
15 16
Volume per Outlet(thousands of litres/day)
10
15
5
Management’s Discussion and Analysis 2016
28
During 2016, the upgrading differential averaged $20.74/bbl, an increase of $2.08/bbl or 11 percent compared to 2015. The differential is equal to Husky Synthetic Blend less Lloyd Heavy Blend. The increase in the upgrading differential was attributable to significantly lower heavy crude oil feedstock costs partially offset by lower realized prices for Husky Synthetic Blend. During 2016, the price of Husky Synthetic Blend averaged $57.54/bbl compared to $61.32/bbl in 2015.
Canadian Refined Products
Canadian Refined Products Earnings Summary ($ millions, except where indicated) 2016 2015
Gross revenues 2,301 2,886
Purchases of crude oil and products 1,770 2,281
Gross margin 531 605
Fuel 136 134
Refining 123 150
Asphalt 217 262
Ancillary 55 59
531 605
Production, operating and transportation expenses 241 238
Selling, general and administrative expenses 43 31
Depletion, depreciation, amortization and impairment 102 103
Gain on sale of assets (3) (5)
Other – net (10) 1
Financial items 7 6
Provisions for income taxes 41 61
Net earnings 110 170
Number of fuel outlets(1) 481 487
Fuel sales volume, including wholesale
Fuel sales (millions of litres/day) 6.6 7.6
Fuel sales per outlet (thousands of litres/day) 11.8 12.5
Refinery throughput
Prince George Refinery (mbbls/day) 9.4 10.7
Lloydminster Refinery (mbbls/day) 27.8 28.1
Ethanol production (thousands of litres/day) 820.6 794.9
(1) Average number of fuel outlets for period indicated.
Canadian Refined Products gross revenues decreased by $585 million in 2016 compared to 2015 primarily due to lower demand driven by a weaker economic environment, resulting in lower refined product prices and lower fuel sales volumes.
Fuel gross margins increased by $2 million in 2016 compared to 2015 primarily due to widening rack to retail differentials partially offset by lower sales volumes.

40 Management’s Discussion and Analysis
Management’s Discussion and Analysis 2016
29
Refining gross margins decreased by $27 million in 2016 compared to 2015 primarily due to a planned turnaround at the Prince George Refinery in 2016, which resulted in lower throughput and the need to purchase finished products from third parties to deliver on committed sales volumes. Gross margins also decreased at the Lloydminster and Minnedosa Ethanol plants primarily due to higher grain feedstock costs.
Asphalt gross margins decreased by $45 million in 2016 compared to 2015 primarily due to weather related impacts, which reduced demand and the prevailing price of asphalt.
U.S. Refining and Marketing
U.S. Refining and Marketing Earnings Summary ($ millions, except where indicated) 2016 2015
Gross revenues 5,995 7,345
Purchases of crude oil and products 5,188 6,455
Gross margin 807 890
Production, operating and transportation expenses 535 474
Selling, general and administrative expenses 13 10
Depletion, depreciation, amortization and impairment 342 333
Other – net (176) (236)
Financial items 3 3
Provisions for (recovery of) income taxes 33 (91)
Net earnings 57 397
Selected operating data:
Lima Refinery throughput (mbbls/day) 138.2 136.1
BP-Husky Toledo Refinery throughput (mbbls/day)(1) 62.2 68.2
Refining margin (U.S. $/bbl crude throughput) 8.94 10.09
Refinery inventory (mmbbls)(2) 10.8 9.8(1) BP-Husky Toledo Refinery throughput was revised in the first quarter of 2016 to reflect total throughput. Prior periods reflected crude throughput only and have been restated to
conform with current presentation.(2) Included in refinery inventory is feedstock and refined products.
U.S. Refining and Marketing gross revenues and purchases of crude oil and products decreased by $1,350 million and $1,267 million, respectively in 2016 compared to 2015, primarily due to lower product and crude pricing, higher cost of RINs, as well as lower sales volumes and throughput at the BP-Husky Toledo Refinery resulting from the scheduled major turnaround earlier in the year.Throughput increased at the Lima Refinery due to unplanned outages in the isocracker and coker units in 2015, partially offset by the scheduled major turnaround in the second quarter of 2016. The isocracker unit was repaired and returned to service in the third quarter of 2016.
Production and operating costs increased by $61 million in 2016 compared to 2015 primarily due to the completion of the scheduled major turnarounds at both the BP-Husky Toledo Refinery and Lima Refinery in 2016.
The Company accrued business interruption and property damage insurance recoveries of $176 million in 2016 associated with the isocracker unit fire at the Lima Refinery, compared to $235 million in 2015, which is reflected in other–net expense. To date, the Company has recorded $411 million in insurance recoveries.
15 16
ThroughputLima Re�nery(mbbls/day)
15 16
Toledo Re�nery(mbbls/day)
15 16
Re�ning MarginU.S.(U.S. $/bbl crude throughput)
4
8
12
50
100
150
50
100
150
Management’s Discussion and Analysis 2016
29
Refining gross margins decreased by $27 million in 2016 compared to 2015 primarily due to a planned turnaround at the Prince George Refinery in 2016, which resulted in lower throughput and the need to purchase finished products from third parties to deliver on committed sales volumes. Gross margins also decreased at the Lloydminster and Minnedosa Ethanol plants primarily due to higher grain feedstock costs.
Asphalt gross margins decreased by $45 million in 2016 compared to 2015 primarily due to weather related impacts, which reduced demand and the prevailing price of asphalt.
U.S. Refining and Marketing
U.S. Refining and Marketing Earnings Summary ($ millions, except where indicated) 2016 2015
Gross revenues 5,995 7,345
Purchases of crude oil and products 5,188 6,455
Gross margin 807 890
Production, operating and transportation expenses 535 474
Selling, general and administrative expenses 13 10
Depletion, depreciation, amortization and impairment 342 333
Other – net (176) (236)
Financial items 3 3
Provisions for (recovery of) income taxes 33 (91)
Net earnings 57 397
Selected operating data:
Lima Refinery throughput (mbbls/day) 138.2 136.1
BP-Husky Toledo Refinery throughput (mbbls/day)(1) 62.2 68.2
Refining margin (U.S. $/bbl crude throughput) 8.94 10.09
Refinery inventory (mmbbls)(2) 10.8 9.8(1) BP-Husky Toledo Refinery throughput was revised in the first quarter of 2016 to reflect total throughput. Prior periods reflected crude throughput only and have been restated to
conform with current presentation.(2) Included in refinery inventory is feedstock and refined products.
U.S. Refining and Marketing gross revenues and purchases of crude oil and products decreased by $1,350 million and $1,267 million, respectively in 2016 compared to 2015, primarily due to lower product and crude pricing, higher cost of RINs, as well as lower sales volumes and throughput at the BP-Husky Toledo Refinery resulting from the scheduled major turnaround earlier in the year.Throughput increased at the Lima Refinery due to unplanned outages in the isocracker and coker units in 2015, partially offset by the scheduled major turnaround in the second quarter of 2016. The isocracker unit was repaired and returned to service in the third quarter of 2016.
Production and operating costs increased by $61 million in 2016 compared to 2015 primarily due to the completion of the scheduled major turnarounds at both the BP-Husky Toledo Refinery and Lima Refinery in 2016.
The Company accrued business interruption and property damage insurance recoveries of $176 million in 2016 associated with the isocracker unit fire at the Lima Refinery, compared to $235 million in 2015, which is reflected in other–net expense. To date, the Company has recorded $411 million in insurance recoveries.
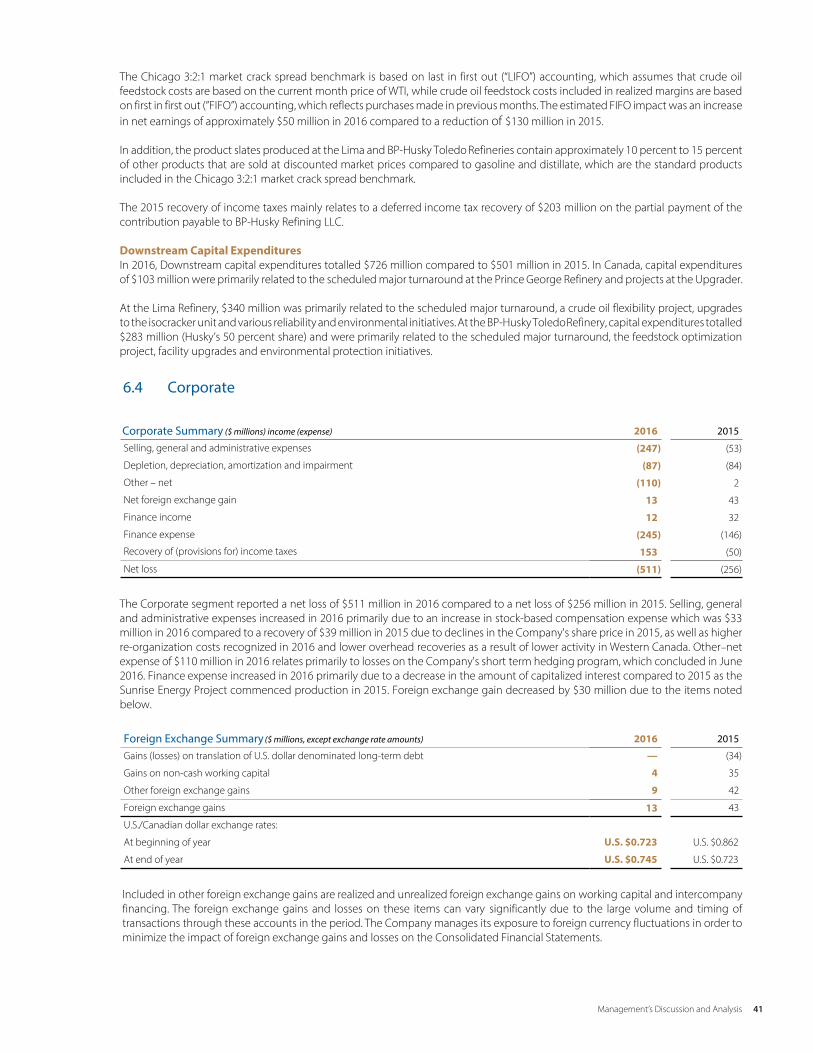
41Management’s Discussion and Analysis
Management’s Discussion and Analysis 2016
30
The Chicago 3:2:1 market crack spread benchmark is based on last in first out (“LIFO”) accounting, which assumes that crude oil feedstock costs are based on the current month price of WTI, while crude oil feedstock costs included in realized margins are based on first in first out (”FIFO”) accounting, which reflects purchases made in previous months. The estimated FIFO impact was an increasein net earnings of approximately $50 million in 2016 compared to a reduction of $130 million in 2015.
In addition, the product slates produced at the Lima and BP-Husky Toledo Refineries contain approximately 10 percent to 15 percent of other products that are sold at discounted market prices compared to gasoline and distillate, which are the standard products included in the Chicago 3:2:1 market crack spread benchmark.
The 2015 recovery of income taxes mainly relates to a deferred income tax recovery of $203 million on the partial payment of the contribution payable to BP-Husky Refining LLC.
Downstream Capital ExpendituresIn 2016, Downstream capital expenditures totalled $726 million compared to $501 million in 2015. In Canada, capital expenditures of $103 million were primarily related to the scheduled major turnaround at the Prince George Refinery and projects at the Upgrader.
At the Lima Refinery, $340 million was primarily related to the scheduled major turnaround, a crude oil flexibility project, upgrades to the isocracker unit and various reliability and environmental initiatives. At the BP-Husky Toledo Refinery, capital expenditures totalled $283 million (Husky’s 50 percent share) and were primarily related to the scheduled major turnaround, the feedstock optimization project, facility upgrades and environmental protection initiatives.
6.4 Corporate
Corporate Summary ($ millions) income (expense) 2016 2015
Selling, general and administrative expenses (247) (53)
Depletion, depreciation, amortization and impairment (87) (84)
Other – net (110) 2
Net foreign exchange gain 13 43
Finance income 12 32
Finance expense (245) (146)
Recovery of (provisions for) income taxes 153 (50)
Net loss (511) (256)
The Corporate segment reported a net loss of $511 million in 2016 compared to a net loss of $256 million in 2015. Selling, general and administrative expenses increased in 2016 primarily due to an increase in stock-based compensation expense which was $33 million in 2016 compared to a recovery of $39 million in 2015 due to declines in the Company's share price in 2015, as well as higher re-organization costs recognized in 2016 and lower overhead recoveries as a result of lower activity in Western Canada. Other–net expense of $110 million in 2016 relates primarily to losses on the Company's short term hedging program, which concluded in June 2016. Finance expense increased in 2016 primarily due to a decrease in the amount of capitalized interest compared to 2015 as the Sunrise Energy Project commenced production in 2015. Foreign exchange gain decreased by $30 million due to the items noted below.
Foreign Exchange Summary ($ millions, except exchange rate amounts) 2016 2015
Gains (losses) on translation of U.S. dollar denominated long-term debt — (34)
Gains on non-cash working capital 4 35
Other foreign exchange gains 9 42
Foreign exchange gains 13 43
U.S./Canadian dollar exchange rates:
At beginning of year U.S. $0.723 U.S. $0.862
At end of year U.S. $0.745 U.S. $0.723
Included in other foreign exchange gains are realized and unrealized foreign exchange gains on working capital and intercompany financing. The foreign exchange gains and losses on these items can vary significantly due to the large volume and timing of transactions through these accounts in the period. The Company manages its exposure to foreign currency fluctuations in order to minimize the impact of foreign exchange gains and losses on the Consolidated Financial Statements.

42 Management’s Discussion and Analysis
Management’s Discussion and Analysis 2016
31
Consolidated Income Taxes
($ millions) 2016 2015
Provisions for (recovery of) income taxes 28 (1,521)
Income taxes paid (received) (3) 227
Consolidated income taxes were an expense of $28 million in 2016 compared to an income tax recovery of $1,521 million in 2015. The increase in consolidated income taxes was primarily due to the recognition of gains on the sale of 65 percent of the Company's ownership interest in select midstream assets and the sale of select Western Canada legacy oil and natural gas assets in 2016. The income tax recovery in 2015 was primarily due to a $1,357 million deferred income tax recovery associated with impairment charges recognized on crude oil and natural gas assets located in Western Canada.
7.0 Risk and Risk Management
7.1 Enterprise Risk Management
The Company's enterprise risk management program supports decision-making via comprehensive and systematic identification and assessment of risks that could materially impact the results of the Company. Through this framework, the Company builds risk management and mitigation into strategic planning and operational processes for its business units through the adoption of standards and best practices. The Company has developed an enterprise risk matrix to identify risks to its people, the environment, its assets and its reputation, and to systematically mitigate these risks to an acceptable level.
The Company attempts to mitigate its financial, operational and strategic risks to an acceptable level through a variety of policies, systems and processes. The following provides a list of the most significant risks relating to the Company and its operations.
7.2 Significant Risk Factors
Operational, Environmental and Safety IncidentsThe Company's businesses are subject to inherent operational risks in respect to safety and the environment that require continuous vigilance. The Company seeks to minimize these operational risks by carefully designing and building its facilities and conducting its operations in a safe and reliable manner using Husky Operational Integrity Management System (”HOIMS”), its integrated management system that considers environmental requirements and process and occupational safety. Failure to manage the risks effectively could result in potential fatalities, serious injury, interruptions to activities or use of assets, damage to assets, environmental impact or loss of licence to operate. Enterprise risk management, emergency preparedness, business continuity and security policies and programs are in place for all operating areas and are adhered to on an ongoing basis. The Company, in accordance with industry practice, maintains insurance coverage against losses from certain of these risks. Nonetheless, insurance proceeds may not be sufficient to cover all losses, and insurance coverage may not be available for all types of operational risks.
Commodity Price VolatilityHusky's results of operations and financial condition are dependent on the prices received for its refined products, crude oil, NGL and natural gas production. Lower prices for crude oil, NGLs and natural gas could adversely affect the value and quantity of Husky's oil and gas reserves. Husky's reserves include significant quantities of heavier grades of crude oil that trade at a discount to light crude oil. Heavier grades of crude oil are typically more expensive to produce, process, transport and refine into high value refined products. Refining and transportation capacity for heavy crude oil is limited and planned increases of North American heavy crude oil production may create the need for additional heavy oil refining and transportation capacity. Wider price differentials between heavier and lighter grades of crude oil could have a material adverse effect on Husky's results of operations and financial condition, reduce the value and quantities of Husky's heavier crude oil reserves and delay or cancel projects that involve the development of heavier crude oil resources. There is no guarantee that pipeline development projects will provide sufficient transportation capacity and access to refining capacity to accommodate expected increases in North American heavy crude oil production.
Prices for refined products and crude oil are based on world supply and demand. Supply and demand can be affected by a number of factors including, but not limited to, actions taken by OPEC, non-OPEC crude oil supply, social conditions in oil producing countries, the occurrence of natural disasters, general and specific economic conditions, technological developments, prevailing weather patterns and the availability of alternate sources of energy.

43Management’s Discussion and Analysis
Management’s Discussion and Analysis 2016
32
Husky's natural gas production is currently located in Western Canada and the Asia Pacific Region. Western Canada is subject to North American market forces. North American natural gas supply and demand is affected by a number of factors including, but not limited to, the amount of natural gas available to specific market areas either from the well head of existing or accessible conventional or unconventional sources (such as from shale), or from storage facilities, technological developments, prevailing weather patterns, the U.S. and Canadian economies, the occurrence of natural disasters and pipeline restrictions.
The natural gas Husky produces in the Asia Pacific Region is sold to specific buyers with long-term contracts. For the Liwan 3-1 gas field, a price profile has been fixed for five years and then will be linked to local benchmark pricing for the years following subject to a floor and ceiling. For the Liuhua 34-2 field, the price is fixed with a single escalation step during the contract delivery period. Natural gas price in North America is affected primarily by supply and demand, as well as by prices for alternative energy sources.
In certain instances, the Company uses derivative commodity instruments and futures contracts on commodity exchanges, including commodity put and call options under a short-term hedging program, to manage exposure to price volatility on a portion of its refined product, oil and gas production, inventory or volumes in long distance transit. The Company may also use firm commitments for the purchase or sale of crude oil and natural gas.
The fluctuations in refined products, crude oil and natural gas prices are beyond the Company's control and could have a material adverse effect on the Company's results of operations and financial condition.
Reservoir Performance RiskLower than projected reservoir performance on the Company's key growth projects could have a material adverse effect on the Company's results of operations, financial condition and business strategy. Inaccurate appraisal of large project reservoirs could result in missed production, revenue and earnings targets and negatively affect the Company's reputation, investor confidence and the Company's ability to deliver on its growth strategy.
In order to maintain the Company's future production of crude oil, natural gas and NGLs and maintain the value of the reserves portfolio, additional reserves must be added through discoveries, extensions, improved recovery, performance related revisions and acquisitions. The production rate of oil and gas properties tends to decline as reserves are depleted while the associated unit operating costs increase. In order to mitigate the effects of this, the Company must undertake successful exploration and development programs, increase the recovery factor from existing properties through applied technology and identify and execute strategic acquisitions of proved developed and undeveloped properties and unproved prospects. Maintaining an inventory of projects that can be developed depends upon, but is not limited to, obtaining and renewing rights to explore, develop and produce oil and natural gas, drilling success, completion of long lead time capital intensive projects on budget and on schedule and the application of successful exploitation techniques on mature properties.
Restricted Market Access and Pipeline InterruptionsHusky's results depend upon the Company's ability to deliver products to the most attractive markets. The Company's results of operations could be materially adversely effected by restricted market access resulting from a lack of pipeline or other transportation alternatives to attractive markets as well as regulatory and/or other marketplace barriers. Interruptions and restrictions may be caused by the inability of a pipeline to operate, or they can be related to capacity constraints as the supply of feedstock into the system exceeds the infrastructure capacity. With growing oil production across North America and the limited availability of infrastructure to carry the Company's products to the marketplace, oil and natural gas transportation capacity is expected to be restricted in the next few years. Restricted market access may potentially have a material adverse effect on the Company's results of operations, financial condition and business strategy. Unplanned shutdowns and closures of its refineries or Upgrader may limit Husky’s ability to deliver product with a material adverse effect on sales and results of operations.
Security and Terrorist ThreatsSecurity threats and terrorist or activist activities may impact the Company’s personnel, which could result in injury, death, extortion, hostage situations and/or kidnapping, including unlawful confinement. A security threat, terrorist attack or activist incident targeted at a facility, office or offshore vessel/installation owned or operated by the Company could result in the interruption or cessation of key elements of the Company's operations. Outcomes of such incidents could have a material adverse effect on the Company’s results of operations, financial condition and business strategy.
International OperationsInternational operations can expose the Company to uncertain political, economic and other risks. The Company's operations in certain jurisdictions may be adversely affected by political, economic or social instability or events. These events may include, but are not limited to, onerous fiscal policy, renegotiation or nullification of agreements and treaties, imposition of onerous regulation, changes in laws governing existing operations, financial constraints, including currency and exchange rate fluctuations, unreasonable taxation and corrupt behaviour of public officials, joint venture partners or third-party representatives that could result in lost business opportunities for Husky. This could materially adversely affect the Company's interest in its foreign operations, results of operations and financial condition.

44 Management’s Discussion and Analysis
Management’s Discussion and Analysis 2016
33
Major Project Execution The Company manages a variety of oil and gas projects ranging from upstream to downstream assets. The risks associated with project development and execution, which include the Company's ability to obtain the necessary environmental and regulatory approvals, changing government regulation and public expectation in relation to the impact on the environment, as well as the risks involved in commissioning and integration of new assets with existing facilities, can impact the economic feasibility of the Company’s projects. Obtaining regulatory approvals can involve significant stakeholder consultation, environmental impact assessments and public hearings.These risks can result in, among other things, cost overruns, schedule delays and decreases in product markets. These risks can also impact the Company’s safety and environmental performance, which could negatively affect the Company’s reputation.
Litigation, Administrative Proceedings and Regulatory ActionsThe Company may be subject to litigation, claims, administrative proceedings and regulatory actions, which may be material. Such claims could relate to environmental damage, breach of contract, tax, bribery and employment matters, which could result in an unfavourable decision, including fines, sanctions, monetary damages or the inability to engage in certain operations or transactions. The outcome of such claims can be difficult to assess or quantify and may have a material adverse effect on the Company’s reputation, financial condition and results of operations. The defence to such claims may be costly and could divert management’s attention away from day-to-day operations.
Partner MisalignmentJoint venture partners operate a portion of Husky's assets in which the Company has an ownership interest. This can reduce Husky’s control and ability to manage risks. Husky is at times dependent upon its partners for the successful execution of various projects. If a dispute with partners were to occur over the development and operation of a project or if partners were unable to fund their contractual share of the capital expenditures, a project could be delayed and the Company could be partially or totally liable for its partner's share of the project.
Reserves Data and Future Net Revenue Estimates The reserves data contained or referenced in the MD&A represent estimates only. The accurate assessment of oil and gas reserves is critical to the continuous and effective management of the Company's upstream assets. Reserves estimates support various investment decisions about the development and management of oil and gas properties. In general, estimates of economically recoverable crude oil and natural gas reserves and the future net cash flow therefrom are based upon a number of variable factors and assumptions, such as product prices, future operating and capital costs, historical production from the properties and the effects of regulation by government agencies, including with respect to royalty payments, all of which may vary considerably from actual results. All such estimates are to some degree uncertain, and classifications of reserves are only attempts to define the degree of uncertainty involved. All reserves estimates involve a degree of ambiguity and, at times, rely on indirect measurement techniques to estimate the size and recoverability of the resource. While new technologies have increased the accuracy of these techniques, there remains the potential for human or systemic error in recording and reporting the magnitude of the Company's oil and gas reserves. For those reasons, the Company's estimates of the economically recoverable oil and gas reserves attributable to any particular group of properties, classification of such reserves based on risk of recovery and estimates of future net revenues expected therefrom may differ substantially from actual results. Inaccurate appraisal of large project reservoirs could result in missed production, revenue and earnings targets and could have a material adverse effect on the Company's results of operations, financial condition, and ability to deliver on its growth business strategy.
Government RegulationGiven the scope and complexity of Husky's operations, the Company is subject to regulation and intervention by governments at the federal, provincial, state and municipal levels in the countries in which it conducts its operations or exploratory activities. As these governments continually balance competing demands from different interest groups and stakeholders, the Company recognizes that the magnitude of regulatory risks has the potential to change over time. Changes in government policy, legislation or regulation could impact the Company's existing and planned projects as well as impose costs of compliance and increase capital expenditures and operating expenses. Examples of the Company's regulatory risks include, but are not limited to, uncertain or negative interactions with governments, uncertain energy policies, uncertain climate policies, uncertain environmental and safety policies, penalties, taxes, royalties, government fees, reserves access, limitations or increases in costs relating to the exportation of commodities, restrictions on the acquisition of exploration and production rights and land tenure, expropriation or cancellation of contract rights, limitations on control over the development and abandonment of fields and loss of licences to operate.
Environmental RegulationChanges in environmental regulation could have a material adverse effect on Husky's financial condition and results of operations by requiring increased capital expenditures and operating costs or by impacting the quality, formulation or demand of products, which may or may not be offset through market pricing.
The scope and complexity of changes in environmental regulation make it challenging to forecast the potential impact to Husky. Husky has made projections of the impact of scenarios involving certain potential laws and regulations relating to climate change. Husky engages in dialogue on proposed changes, both directly and through industry associations, with the goal of ensuring the Company’s interests are recognized and Husky is sufficiently prepared to fully comply when new regulations come into force.
45Management’s Discussion and Analysis
Management’s Discussion and Analysis 2016
34
Husky anticipates further changes in environmental legislation could occur, which may result in stricter standards and enforcement, larger fines and liabilities, increased compliance costs and approval delays for critical licences and permits, which could have a material adverse effect on Husky's financial condition and results of operations through increased capital and operating costs.
Climate Change RegulationThe Company continues to monitor international and domestic efforts to address climate change, including international low carbon fuel standards and regulations and emerging regulations in the jurisdictions in which the Company operates.
The Alberta Climate Leadership Plan is expected to be implemented starting in 2017. This plan includes an economy wide carbon levy, rising to $30/ton in 2018 as well as a Carbon Competitiveness Regulation that will manage emissions at large final emitting facilities (”LFEs”) including the Ram River Gas Plant, Tucker Thermal Facility and Sunrise Energy Project. The regulations under this plan are currently under development and will cover all of the Company’s assets in Alberta. These regulations may materially adversely affect the Company’s results of operations in the province.
Climate change regulations to be developed in Saskatchewan will have to meet equivalency standards with the Canadian federal government and may materially adversely affect the Company’s results of operations in the province.
The cost of compliance with British Columbia’s $30 per ton carbon tax and the Renewable and Low Carbon Fuel Requirements Regulation may become material. Additionally, future regulations in support of British Columbia’s commitment under its Climate Leadership Plan may materially adversely affect the Company’s results of operations in British Columbia.
The Manitoba Climate Change and Green Economy Action Plan implementation may materially adversely affect Husky’s results of operations in Manitoba.
The Federal Government of Canada has announced its intention to commence developing a new federal climate change plan in consultation with the provinces. It is not clear how this new plan will be structured and what impacts it will have on Husky’s results of operations. Climate change regulations may become more onerous over time as governments implement policies to further reduce GHG emissions. Although the impact of emerging regulations is uncertain, they could have a material adverse effect on the Company’s financial condition and results of operations through increased capital and operating costs and change in demand for refined products.
The Company’s U.S. refining business may be materially adversely affected by the implementation of the EPA’s climate change rules or by future U.S. GHG legislation that applies to the oil and gas industry or the consumption of petroleum products. Such legislation or regulation could require the Company's U.S. refining operations to significantly reduce emissions and/or purchase allowances, which may have a material adverse effect on the Company’s financial condition and results of operations through increased capital and operating costs and change in demand for refined products.
The U.S. RFS program, through the U.S. EPA specified renewable volume obligation (”RVO”), requires refiners to add annually increasing amounts of renewable fuels to their petroleum products or to purchase RINs in lieu of such blending. Due to regulatory uncertainty and in part due to the U.S. fuel supply reaching the “blend wall” (the 10% limit prescribed by most automobile warranties), the price and availability of RINs has been volatile.
The Company complies with the RFS program in the US by blending renewable fuels manufactured by third parties and by purchasing RINs on the open market. The Company cannot predict the future prices of RINs and renewable fuel blendstocks, and the costs to obtain the necessary RINs and blendstocks could be material. The Company’s financial position and results of operations could be adversely affected if it is unable to pass the costs of compliance on to its customers and if the Company pays significantly higher prices for RINs or blendstocks to comply with the RFS mandated standards.
CompetitionThe energy industry is highly competitive with respect to gaining access to the resources required to increase oil and gas reserves and production and gain access to markets. The Company competes with others to acquire prospective lands, retain drilling capacity and field operating and construction services, obtain sufficient pipeline and other transportation capacity, gain access to and retain adequate markets for its products and services and gain access to capital markets. The Company's ability to successfully complete development projects could be adversely affected if it is unable to acquire economic supplies and services due to competition. Subsequent increases in the cost of or delays in acquiring supplies and services could result in uneconomic projects. The Company's competitors comprise all types of energy companies, some of which have greater resources.
General Economic ConditionsGeneral economic conditions may have a material adverse effect on the Company's results of operations and financial condition. A decline in economic activity will reduce demand for petroleum products and adversely affect the price the Company receives for its commodities. The Company's cash flow could decline, assets could be impaired, future access to capital could be restricted and major development projects could be delayed or abandoned.

46 Management’s Discussion and Analysis
Management’s Discussion and Analysis 2016
35
Cost or Availability of Oil and Gas Field EquipmentThe cost or availability of oil and gas field equipment may adversely affect the Company's ability to undertake exploration, development and construction projects. The oil and gas industry is cyclical in nature and is prone to shortages of supply of equipment and services including land and offshore drilling rigs, land and offshore geological and geophysical services, engineering and construction services and construction materials. These materials and services may not be available when required at reasonable prices.
Climatic Conditions Extreme climatic conditions may have material adverse effects on results of operations. Weather and climate affect demand, and therefore, the predictability of the demand for energy is affected to a large degree by the predictability of weather and climate. In addition, the Company's exploration, production and construction operations, or disruptions to the operations of major customers or suppliers, can be affected by extreme weather. This may result in cessation or diminishment of production, delay of exploration and development activities or delay of plant construction. All of these could potentially cause material adverse effects on the Company's results of operations and financial condition.
The Company operates in some of the harshest environments in the world, including offshore in the Atlantic Region. Climate change may increase severe weather conditions in these locations including winds, flooding and variable temperatures, which are contributing to the melting of Northern ice and increased creation of icebergs. Icebergs off the coast of Newfoundland and Labrador may threaten offshore oil production facilities, causing damage to equipment and possible production disruptions, spills, asset damage and human impacts. The Company has in place a number of policies to protect people, equipment and the environment in the event of extreme weather conditions and ice melt conditions.
The Company’s Atlantic Region business unit has a robust ice management program, which uses a range of resources including a dedicated ice surveillance aircraft, as well as synergistic relationships with government agencies including Environment Canada, the Coast Guard and Canadian Ice Service. Regular ice surveillance flights commence in February and continue until the threat has abated. In addition, Atlantic Region operators employ a series of supply and support vessels to actively manage ice and icebergs. These vessels are equipped with a variety of ice management tools including towing ropes, towing nets and water cannons. The Company also maintains a series of ad-hoc relationships with contractors, allowing the quick mobilization of additional resources as required.
Financial ControlsWhile the Company has determined that its disclosure controls and procedures and internal controls over financial reporting are effective, such controls can only provide reasonable assurance with respect to financial statement preparation and disclosure. Failure to prevent, detect and correct misstatements could have a material adverse effect on the Company’s results of operations and financial condition.
Cybersecurity ThreatsAs an oil and gas producer, the Company’s ability to operate effectively is dependent upon developing and maintaining information systems and infrastructure that support the financial and general operating aspects of the business. Concurrently, the oil and gas industry has become the subject of increased levels of cybersecurity threats.
The Company has security measures, policies and controls designed to protect and secure the integrity of its information technology systems. The Company takes a proactive approach by continuing to invest in technology, processes and people to help minimize the impact of the changing cyber landscape and enhance the Company’s resilience to cyber incidents. However, cybersecurity threats frequently change and require ongoing monitoring and detection capabilities. Such cybersecurity threats include unauthorized access to information technology systems due to hacking, viruses and other causes for purposes of misappropriating assets or sensitive information, corrupting data or causing operational disruption by third parties. Cyber-attacks could result in the loss or exposure of confidential information related to retail credit card information, personnel files, exploration activities, corporate actions, executive officer communications and financial results. The significance of any such event is difficult to quantify, but if the breach is material in nature, it could adversely affect the financial performance of the Company, its operations, its reputation and standing and expose it to regulatory consequences and claims of third-party damage, all of which could materially adversely affect the Company’s results of operations and financial condition if the situation is not resolved in a timely manner, or if the financial impact of such adverse effects is not alleviated through insurance policies.
Although to date the Company has not experienced any material losses relating to cyber attacks or other information security breaches, there can be no assurance that the Company will not incur such losses in the future. The Company’s risk and exposure to these matters cannot be fully mitigated because of, among other things, the evolving nature of these threats. The Audit Committee of the Company’s Board of Directors has oversight of the Company’s risk mitigation strategies related to cybersecurity.
Skilled Workforce ShortageSuccessful execution of Husky’s strategy is dependent on ensuring our workforce possesses the appropriate skill level. There is a risk that the Company may have difficulty attracting and retaining personnel with the required skill levels. Failure to attract and retain personnel with the required skill levels could have a material adverse effect on the Company’s results of operations.

47Management’s Discussion and Analysis
Management’s Discussion and Analysis 2016
36
7.3 Financial Risks
The Company's financial risks are largely related to commodity price risk, foreign currency risk, interest rate risk, counterparty credit risk, liquidity risk and credit rating risk. From time to time, the Company uses derivative financial instruments to manage its exposure to these risks. These derivative financial instruments are not intended for trading or speculative purposes.
Fair Value of Financial InstrumentsThe Company's financial assets and liabilities that are recorded at fair value on a recurring basis have been categorized into one ofthree categories based upon the fair value hierarchy. Level 1 fair value measurements are determined by reference to quoted prices in active markets for identical assets and liabilities. Fair value measurements of assets and liabilities in Level 2 include valuations using inputs other than quoted prices for which all significant outputs are observable, either directly or indirectly. Level 3 fair value measurements are based on inputs that are unobservable and significant to the overall fair value measurement.
The Company's financial instruments include cash and cash equivalents, accounts receivable, restricted cash, accounts payable and accrued liabilities, short-term debt, long-term debt, contribution payable, inventories measured at fair value, long-term income tax receivable, portions of other assets and other long-term liabilities.
For the year ended December 31, 2016, the Company recognized a $39 million unrealized loss on its crude oil and natural gas riskmanagement positions which were recorded in marketing and other. In addition, the Company recognized a $10 million realized gain recorded in net foreign exchange and a $121 million realized loss on a short-term corporate hedging program recorded in other-net. Refer to Note 24 to the 2016 Consolidated Financial Statements.
Commodity Price RiskIn certain instances, the Company uses derivative commodity instruments and futures contracts on commodity exchanges, including commodity put and call options under a short-term hedging program, to manage exposure to price volatility on a portion of its refined product, oil and gas production, and inventory or volumes in long distance transit. The Company may also use firm commitments for the purchase or sale of crude oil and natural gas. For the year ended December 31, 2016, the Company incurred a realized loss of $121 million on a short-term corporate hedging program, which is recorded in other-net in the Consolidated Statements of Income (Loss). The hedging program concluded in June 2016.
The Company’s results will be impacted by a decrease in the price of crude oil and natural gas inventory. The Company has crude oil inventories that are feedstock, held at terminals or part of the in-process inventories at its refineries and at offshore sites. The Company also has natural gas inventory that could have an impact on earnings based on changes in natural gas prices. All these inventories are subject to a lower of cost or net realizable value test on a monthly basis.
Foreign Currency RiskThe Company's results are affected by the exchange rates between various currencies including the Canadian and U.S. dollars. The majority of the Company's expenditures are in Canadian dollars while the majority of the Company's revenues are received in U.S. dollars from the sale of oil and gas commodities that receive prices determined by reference to U.S. benchmark prices. An increase in the value of the Canadian dollar relative to the U.S. dollar will decrease the revenues received from the sale of oil and gas commodities. Correspondingly, a decrease in the value of the Canadian dollar relative to the U.S. dollar will increase the revenues received from the sale of oil and gas commodities. In addition, a change in the value of the Canadian dollar against the U.S. dollar will result in an increase or decrease in the Company's U.S. dollar denominated debt and related interest expense, as expressed in Canadian dollars. The fluctuations in exchange rates are beyond the Company's control and could have a material adverse effect on the Company's results of operations and financial condition.
The Company enters into short-dated foreign exchange contracts to fix the exchange rate for conversion of U.S. dollar denominated revenue to hedge against these potential fluctuations. The Company also designates its U.S denominated debt as a hedge of the Company's net investment in selected foreign operations with a U.S. dollar functional currency.
Interest Rate Risk Interest rate risk is the impact of fluctuating interest rates on financial condition. In order to manage interest rate risk and the resulting interest expense, the Company mitigates some of its exposure to interest rate changes by maintaining a mix of both fixed and floating rate debt through the use of its credit facilities and various financial instruments. The optimal mix maintained will depend on market conditions. The Company may also enter into interest rate swaps from time to time as an additional means of managing current and future interest rate risk.

48 Management’s Discussion and Analysis
Management’s Discussion and Analysis 2016
37
Counterparty Credit RiskCredit risk represents the financial loss that the Company would suffer if the Company's counterparties in a transaction fail to meet or discharge their obligation to the Company. The Company actively manages this exposure to credit and contract execution risk from both a customer and a supplier perspective. Internal credit policies govern the Company's credit portfolio and limit transactions according to a counterparty's and a supplier's credit quality. Counterparties for financial derivatives transacted by the Company are generally major financial institutions or counterparties with investment grade credit ratings.
Liquidity RiskLiquidity risk is the risk that the Company will not be able to meet its financial obligations as they become due. Liquidity risk also includes the risk of not being able to liquidate assets in a timely manner at a reasonable price. The Company's process for managing liquidity risk includes ensuring, to the extent possible, that it has access to multiple sources of capital including: cash and cash equivalents, cash from operating activities, undrawn credit facilities and the availability to raise capital from various debt and equity capital markets under its shelf prospectuses. The availability of capital under its shelf prospectuses is dependent on market conditions at the time of sale.
Credit Rating RiskCredit ratings affect Husky's ability to obtain short-term and long-term financing and the cost of such financing. Additionally, the ability of Husky to engage in ordinary course derivative or hedging transactions and maintain ordinary course contracts with customers and suppliers on acceptable terms depends on Husky's credit ratings. A reduction in the current rating on Husky's debt by one or more of its rating agencies, particularly a downgrade below investment grade ratings, or a negative change in Husky's ratings outlook could adversely affect Husky's cost of financing and its access to sources of liquidity and capital. Credit ratings are intended to provide investors with an independent measure of credit quality of any issuer of securities. The credit ratings accorded to Husky's securities by the rating agencies are not recommendations to purchase, hold or sell the securities in as much as such ratings do not comment as to market price or suitability for a particular investor. Any rating may not remain in effect for any given period of time or may be revised or withdrawn entirely by a rating agency in the future if in its judgment circumstances so warrant.
The Company is committed to retaining investment grade credit ratings to support access to capital markets and currently has the following credit ratings:
Standard and Poor’s Rating Services
Moody’s Investor Service(”Moody’s”)
Dominion Bond Rating ServicesLimited
Outlook/Trend Stable Stable Stable
Senior Unsecured Debt BBB+ Baa2 A(low)
Series 1 Preferred Shares P-2(low) Pfd-2(low)
Series 2 Preferred Shares P-2(low) Pfd-2(low)
Series 3 Preferred Shares P-2(low) Pfd-2(low)
Series 5 Preferred Shares P-2(low) Pfd-2(low)
Series 7 Preferred Shares P-2(low) Pfd-2(low)
Commercial Paper R-1(low)
Debt CovenantsThe Company’s credit facilities include financial covenants, which include a debt to capital covenant. If the Company does not comply with the covenants under these credit facilities, there is a risk that repayment could be accelerated.

49Management’s Discussion and Analysis
Management’s Discussion and Analysis 2016
38
8.0 Liquidity and Capital Resources
8.1 Summary of Cash Flow
Cash Flow Summary ($ millions) 2016 2015
Cash flow
Operating activities 1,971 3,760
Financing activities (1,362) (210)
Investing activities 632 (4,817)
Cash Flow from Operating ActivitiesCash flow generated from operating activities was $1,971 million in 2016 compared to $3,760 million in 2015. The decrease was primarily due to lower realized crude oil and North American natural gas prices, a reduction to the fixed priced natural gas from Asia Pacific and lower U.S. market crack spreads, partially offset by lower operating costs due to cost savings initiatives and increased production from new and existing heavy oil thermal developments.
Cash Flow used for Financing ActivitiesCash flow used for financing activities was $1,362 million in 2016 compared to $210 million in 2015. In 2016, cash flow used for financing activities was primarily used for the net repayment of $520 million of short-term debt and $768 million of long term debt, compared to to the net repayment of $175 million of short-term debt and net issuance of $949 million of long term debt in 2015. In 2015, the Company paid $1,167 million on dividends on common shares, the common share dividends were subsequently suspended in late 2015 and the Company did not pay cash dividends on common shares in 2016.
Cash Flow from (used for) Investing ActivitiesCash flow generated from investing activities was $632 million in 2016 compared to cash flow used for investing activities of $4,817 million in 2015. The increase was primarily due to total cash proceeds from asset sales of $2,935 million in 2016 from the sale of 65 percent of the Company's ownership interest in select midstream assets, the sale of royalty interests representing approximately 1,700 boe/day of Western Canada Production and the sale of approximately 30,200 boe/day of select legacy Western Canada crude oil and natural gas assets combined with the decrease of capital expenditures in 2016. The cash flow used for investing activities in 2015 also included $1,363 million of a partial payment of the contribution payable to BP-Husky Refining LLC, compared to $193 million in 2016.
8.2 Working Capital Components
Working capital is the amount by which current assets exceed current liabilities. At December 31, 2016, Husky’s working capital was $1,125 million compared to a deficiency of $922 million at December 31, 2015. A reconciliation of Husky's working capital (deficiency) is as follows:
($ millions) December 31, 2016 December 31, 2015 ChangeCash and cash equivalents 1,319 70 1,249
Accounts receivable 1,036 1,014 22
Income taxes receivable 186 312 (126)
Inventories 1,558 1,247 311
Prepaid expenses 135 271 (136)
Restricted cash 84 — 84
Accounts payable and accrued liabilities (2,226) (2,527) 301
Short-term debt (200) (720) 520
Long-term debt due within one year (403) (277) (126)
Contribution payable (146) (210) 64
Asset retirement obligations (218) (102) (116)
Net working capital (deficiency) 1,125 (922) 2,047
50 Management’s Discussion and Analysis
Management’s Discussion and Analysis 2016
39
The increase in cash was primarily due to proceeds from the sale of royalty interests representing approximately 1,700 boe/day of Western Canada production, the sale of 65 percent of the Company's ownership interest in select midstream assets and the sale of approximately 30,200 boe/day of legacy Western Canada crude oil and natural gas assets in 2016. Fluctuations in accounts receivable and accounts payable are due to the timing of settlements in 2016 compared to 2015. The decrease in income taxes receivable is due to timing of expected tax refunds. The increase in inventories is primarily due to higher U.S. refining throughputs in the fourth quarter of 2016 compared to 2015.
The decrease in short-term debt is due to the the net repayment of $520 million of short-term debt in 2016 compared to the net repayment of $175 million of short-term debt in 2015.
8.3 Sources of Liquidity
Liquidity describes a company’s ability to access cash. Sources of liquidity include funds from operations, proceeds from the issuance of equity, proceeds from the issuance of short and long-term debt, availability of short and long-term credit facilities and proceeds from asset sales. Since the Company operates in the upstream oil and gas industry, it requires significant cash to fund capital programs necessary to maintain or increase production, develop reserves, acquire strategic oil and gas assets and repay maturing debt.
During times of low oil and gas prices, a portion of capital programs can generally be deferred. However, due to the long cycle times and the importance to future cash flow in maintaining the Company's production, it may be necessary to utilize alternative sources of capital to continue the Company’s strategic investment plan during periods of low commodity prices. As a result, the Company frequently evaluates the options available with respect to sources of short and long-term capital resources. The Company believes that it has sufficient liquidity to sustain its operations, fund capital programs and meet non-cancellable contractual obligations and commitments in the short and long-term principally by cash generated from operating activities, cash on hand, the issuance of equity, the issuance of debt, borrowings under committed and uncommitted credit facilities and cash proceeds from asset sales. The Company is continually examining its options with respect to sources of long and short-term capital resources to ensure it retains financial flexibility.
At December 31, 2016, the Company had the following available credit facilities:
Credit Facilities($ millions) Available Unused
Operating facilities(1) 670 292
Syndicated credit facilities(2) 4,000 3,800
4,670 4,092(1) Consists of demand credit facilities and letter of credit. (2) Commercial paper outstanding is supported by the Company's syndicated credit facilities.
At December 31, 2016, the Company had $4,092 million of unused credit facilities of which $3,800 million are long-term committed credit facilities and $292 million are short-term uncommitted credit facilities. A total of $378 million of the Company's short-term uncommitted borrowing credit facilities was used in support of outstanding letters of credit and $200 million of the Company's long-term committed borrowing credit facilities was used in support of commercial paper. At December 31, 2016, the Company had no direct borrowing against committed credit facilities. The Company's ability to renew existing bank credit facilities and raise new debt is dependent upon maintaining an investment grade debt rating and the condition of capital and credit markets. Credit ratings may be affected by the Company's level of debt, from time to time.
The Company’s share capital is not subject to external restrictions; however, the Company's leverage covenant under both of its revolving syndicated credit facilities was modified to a debt to capital covenant calculated as total debt (long-term debt including long-term debt due within one year and short-term debt) and certain adjusting items specified in the agreement divided by total debt, shareholders' equity and certain adjusting items specified in the agreement. This covenant is used to assess the Company's financial strength. If the Company does not comply with the covenants under the syndicated credit facilities, there is the risk that repayment could be accelerated. The Company was in compliance with the syndicated credit facility covenants at December 31, 2016 and assesses the risk of non-compliance to be low.
The Sunrise Oil Sands Partnership has an unsecured demand credit facility of $10 million available for general purposes. The Company's proportionate share is $5 million. There were no amounts drawn on this demand credit facility at December 31, 2016.
On February 23, 2015, the Company filed a universal short form base shelf prospectus with applicable securities regulators in each of the provinces of Canada (the ”Canadian Shelf Prospectus”) that enables the Company to offer up to $3.0 billion of common shares, preferred shares, debt securities, subscription receipts, warrants and other units in Canada up to and including March 23, 2017. During the 25-month period that the Canadian Shelf Prospectus is effective, securities may be offered in amounts, at prices and on terms set forth in a prospectus supplement.

51Management’s Discussion and Analysis
Management’s Discussion and Analysis 2016
40
On March 6, 2015, the Company's $1.63 billion and $1.60 billion revolving syndicated credit facilities were each increased to $2.0 billion. The terms of the revolving syndicated credit facilities remain unchanged.
On March 12, 2015, the Company issued eight million Cumulative Redeemable Preferred Shares, Series 5 (the ”Series 5 Preferred Shares”) at a price of $25.00 per share for aggregate gross proceeds of $200 million, by way of a prospectus supplement dated March 5, 2015, to the Canadian Shelf Prospectus. Net proceeds after share issue costs were $195 million. Holders of the Series 5 Preferred Shares are entitled to receive a cumulative quarterly fixed dividend yielding 4.50 percent annually for the initial period ending March 31, 2020 as declared by the Board of Directors. Thereafter, the dividend rate will be reset every five years at the rate equal to the five-year Government of Canada bond yield plus 3.57 percent. Holders of Series 5 Preferred Shares will have the right, at their option, to convert their shares into Cumulative Redeemable Preferred Shares, Series 6 (the ”Series 6 Preferred Shares”), subject to certain conditions, on March 31, 2020 and on March 31 every five years thereafter. Holders of the Series 6 Preferred Shares will be entitled to receive cumulative quarterly floating dividends at a rate equal to the 90-day Government of Canada Treasury Bill yield plus 3.57 percent. Net proceeds from the Series 5 Preferred Shares was used for general corporate purposes, which included, among other things, the partial repayment of bank debt incurred by the Company to fund early payment of U.S. $1 billion of the Company's net capital contribution payable with BP-Husky Refining LLC.
On March 12, 2015, the Company repaid the maturing 3.75 percent notes issued under a trust indenture dated December 21, 2009. The amount paid to noteholders was $306 million, including $6 million of interest.
On March 12, 2015, the Company issued $750 million of 3.55 percent notes due March 12, 2025 by way of a prospectus supplement dated March 9, 2015 to the Canadian Shelf Prospectus. The notes are redeemable at the option of the Company at any time, subject to a make whole premium unless the notes are redeemed in the three month period prior to maturity. Interest is payable semi-annually on March 12 and September 12 of each year, beginning September 12, 2015. The notes are unsecured and unsubordinated and rank equally with all of the Company's other unsecured and unsubordinated indebtedness. Net proceeds from the offering was used for general corporate purposes, which included, among other things, the partial repayment of bank debt incurred by the Company to fund early payment of U.S. $1 billion of the Company's net capital contribution payable with BP-Husky Refining LLC.
On June 17, 2015, the Company issued six million Cumulative Redeemable Preferred Shares, Series 7 (the ”Series 7 Preferred Shares”) at a price of $25.00 per share for aggregate gross proceeds of $150 million, by way of a prospectus supplement dated June 10, 2015, to the Canadian Shelf Prospectus. Net proceeds after share issue costs were $145 million. Holders of the Series 7 Preferred Shares are entitled to receive a cumulative fixed dividend yielding 4.60 percent annually for the initial period ending June 30, 2020 as declared by the Board of Directors. Thereafter, the dividend rate will be reset every five years at the rate equal to the five-year Government of Canada bond yield plus 3.52 percent. Holders of the Series 7 Preferred Shares will have the right, at their option, to convert their shares into Cumulative Redeemable Preferred Shares, Series 8 (the ”Series 8 Preferred Shares”), subject to certain conditions, on June 30, 2020 and on June 30 every five years thereafter. Holders of the Series 8 Preferred Shares will be entitled to receive cumulative quarterly floating dividends at a rate equal to the 90-day Government of Canada Treasury Bill yield plus 3.52 percent. Net proceeds from the Series 7 Preferred Shares was used for general corporate purposes, which included, among other things, the partial repayment of bank debt incurred by the Company to fund capital expenditures for the advancement of near term heavy oil thermal projects.
On December 22, 2015, the Company filed a universal short form base shelf prospectus (the ”U.S. Shelf Prospectus”) with the Alberta Securities Commission and a related U.S. registration statement containing the U.S. Shelf Prospectus with the SEC that enables the Company to offer up to U.S. $3.0 billion of debt securities, common shares, preferred shares, subscription receipts, warrants and units of the Company in the United States up to and including January 22, 2018. During the 25-month period that the U.S. Shelf Prospectus and the related U.S registration statement are effective, securities may be offered in amounts, at prices and on terms set forth in a prospectus supplement.
In March 2016, holders of 1,564,068 Cumulative Redeemable Preferred Shares, Series 1 (the ”Series 1 Preferred Shares”) exercised their option to convert their shares, on a one-for-one basis, to Cumulative Redeemable Preferred Shares, Series 2 (the ”Series 2 Preferred Shares”) and receive a floating rate quarterly dividend. The dividend rate applicable to the Series 2 Preferred Shares for the three month period commencing September 30, 2016 to, but excluding, December 31, 2016, is equal to the sum of the Government of Canada 90 day treasury bill rate on August 31, 2016 plus 1.73 percent, being 2.242 percent. The floating rate quarterly dividend applicable to the Series 2 Preferred Shares will be reset every quarter. The dividend rate applicable to the Series 1 Preferred Shares for the five year period commencing March 31, 2016, to, but excluding, March 31, 2021 is equal to the sum of the Government of Canada five year bond yield on March 1, 2016 plus 1.73 percent, being 2.404 percent. Both rates were calculated in accordance with the articles of amendment of the Company creating the Series 1 Preferred Shares and Series 2 Preferred Shares dated March 11, 2011.
On March 9, 2016, the maturity date for one of the Company's $2.0 billion revolving syndicated credit facilities, previously set to expire on December 14, 2016, was extended to March 9, 2020. In addition, the Company's the leverage covenant under both of its revolving syndicated credit facilities ($2.0 billion maturing June 19, 2018 and $2.0 billion maturing March 9, 2020) was modified to a debt to capital covenant. At December 31, 2016 the Company was in compliance with the syndicated credit facility covenants and assesses the risk of non-compliance to be low.

52 Management’s Discussion and Analysis
Management’s Discussion and Analysis 2016
41
On November 15, 2016, the Company repaid the maturing 7.55 percent notes issued under a trust indenture dated October 31, 1996. The amount paid to noteholders was $280 million, including $10 million of interest.
The Company has $1.9 billion in unused capacity under the Canadian Shelf Prospectus and U.S. $3.0 billion in unused capacity under the U.S. Shelf Prospectus and related U.S. registration statement as at December 31, 2016. The ability of the Company to utilize the capacity under its Canadian Shelf Prospectus and U.S. Shelf Prospectus and related U.S. registration statement is subject to market conditions at the time of sale.
Net DebtNet debt is calculated as total debt less cash and cash equivalents. At December 31, 2016, the Company had total debt of $5,339 million and cash and cash equivalents of $1,319 million compared to total debt of $6,756 million and cash and cash equivalents of $70 million at December 31, 2015. The Company's net debt decreased by $2,666 million when compared to December 31, 2015:
Net Debt ($ millions) December 31, 2016 December 31, 2015
Net debt at beginning of period (6,686) (4,025)
Change in net debt due to:
Funds from operations(1) 2,076 3,329
Capital expenditures (1,705) (3,005)
Cash dividends paid on common and preferred shares (27) (1,203)
Change in non-cash working capital (227) 498
Proceeds from asset sales 2,935 122
Net proceeds from issuance of preferred shares — 340
Effect of exchange rates on cash and cash equivalents 8 70
Effect of exchange rates on long-term debt 130 (692)
Income taxes received (paid) 3 (227)
Net interest paid (344) (320)
Contribution payable (193) (1,363)
Other 10 (210)
2,666 (2,661)
Net debt at end of period (4,020) (6,686)(1) Funds from operations is a non-GAAP measure. Refer to Section 11.3 for a reconciliation to the GAAP measure.
During the years ended December 31, 2016 and 2015, the Company's capital expenditures were funded by funds from operations. The Company's funds from operations is dependent on a number of factors, including commodity prices, production and sales volumes, refining and marketing margins, operating expenses, taxes, royalties and foreign exchange rates. Management prepares capital expenditure budgets annually which are regularly monitored and updated to adapt to changes in market factors. In addition, the Company requires authorizations for capital expenditures on projects, which assists with the management of capital.
During the year ended December 31, 2016, the Company issued common stock dividends of $296 million on January 11, 2016, on account of common share dividends declared for the third quarter of 2015. The common share dividend was suspended by the Board of Directors in the fourth quarter of 2015. This initiative supports long-term value maximization while providing further financial flexibility for the Company to achieve its business and financial objectives. The Board of Directors carefully considers numerous factors, including earnings, commodity price outlook, future capital requirements and the financial condition of the Company. The Board will continue to review the Company's common share dividend policy on a quarterly basis. During the year ended December 31, 2016, there were no common share dividends declared compared to $1,181 million during 2015.

53Management’s Discussion and Analysis
Management’s Discussion and Analysis 2016
42
8.4 Capital Structure
Capital Structure December 31, 2016($ millions) Outstanding Available(1)
Total debt 5,339 4,092Common shares, preferred shares, retained earnings and other reserves 17,616
(1) Total debt available includes committed and uncommitted credit facilities.
The Company’s objectives when managing capital are to maintain a flexible capital structure, which optimizes the cost of capital at acceptable risk, and to maintain investor, creditor and market confidence to sustain the future development of the business. The Company manages its capital structure and makes adjustments as economic conditions and the risk characteristics of its underlying assets change. The Company considers its capital structure to include shareholders’ equity and debt, which was $23.0 billion at December 31, 2016 (December 31, 2015 – $23.3 billion). To maintain or adjust the capital structure, the Company may, from time to time, issue shares, raise debt and/or adjust its capital spending to manage its current and projected debt levels.
The Company monitors its capital structure and financing requirements using, among other things, non-GAAP financial metrics consisting of debt to capital employed and debt to funds from operations (refer to section 11.3). The Company’s objective is to maintain a debt to capital employed target of less than 25 percent and a debt to funds from operations ratio of less than 2.0 times. At December 31, 2016, debt to capital employed was 23.2 percent (December 31, 2015 – 28.9 percent) and debt to funds from operations was 2.6 times (December 31, 2015 – 2.0 times).
The decrease in the Company's debt to capital employed as at December 31, 2016 is due to proceeds received from the sale of 65 percent of the Company's ownership interest in select midstream assets in the third quarter of 2016 and the sale of royalty interests representing approximately 1,700 boe/day of Western Canada production and the sale of approximately 30,200 boe/day of legacy Western Canada crude oil and natural gas assets in 2016, which were partially used for the repayment of debt. The higher debt to funds from operations ratio as at December 31, 2016 reflects the impact of lower global crude oil and North American natural gas benchmark pricing, which resulted in significantly lower funds from operations. To facilitate the management of these ratios, the Company prepares annual budgets, which are updated depending on varying factors such as general market conditions and successful capital deployment. The annual budget is approved by the Board of Directors.
The Company has taken measures to strengthen its financial position and navigate through this commodity down cycle which include, but are not limited to, a reduction of budgeted capital spending, the suspension of the quarterly common share dividend, the sale of royalty interests in Western Canada production, the sale of non-core assets in Western Canada, a strategic disposition of select midstream assets and the continued transition to lower sustaining and higher return Lloyd thermal projects.
Divestitures Pipeline and Terminals On July 15, 2016, the Company completed the sale of 65 percent of its ownership interest in select midstream assets in the Lloydminster region of Alberta and Saskatchewan for gross proceeds of $1.69 billion in cash. The assets include approximately 1,900 kilometres of pipeline in the Lloydminster region, 4.1 mmbbls of storage capacity at Hardisty and Lloydminster and other ancillary assets. The assets are held by HMLP, of which the Company owns 35 percent, PAH owns 48.75 percent and CKI owns 16.25 percent. The transaction enabled the Company to further strengthen its balance sheet while maintaining operatorship and preserving the integration between its heavy oil production, marketing and refining assets.
Upstream Exploration and Production – Western Canada In 2016, the Company completed the sale of royalty interests representing approximately 1,700 boe/day of Western Canada production for gross proceeds of $165 million and the sale of approximately 30,200 boe/day of legacy crude oil and natural gas assets in Western Canada for gross proceeds of $1.12 billion.
Use of ProceedsCash proceeds from the dispositions allowed the Company to pay down debt, which served to strengthen the Company's balance sheet. This also enables the Company to focus on fewer, more material plays while providing for a more capital efficient business with reduced sustaining capital requirements.
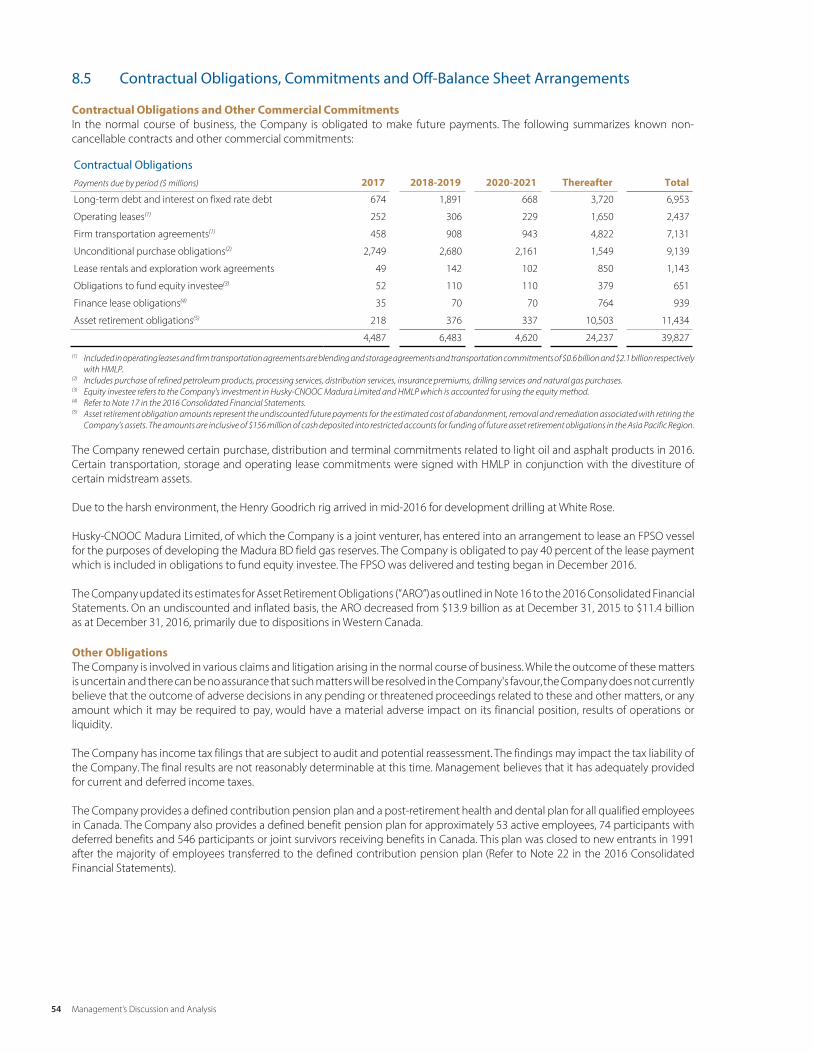
54 Management’s Discussion and Analysis
Management’s Discussion and Analysis 2016
43
8.5 Contractual Obligations, Commitments and Off-Balance Sheet Arrangements
Contractual Obligations and Other Commercial CommitmentsIn the normal course of business, the Company is obligated to make future payments. The following summarizes known non-cancellable contracts and other commercial commitments:
Contractual ObligationsPayments due by period ($ millions) 2017 2018-2019 2020-2021 Thereafter Total
Long-term debt and interest on fixed rate debt 674 1,891 668 3,720 6,953
Operating leases(1) 252 306 229 1,650 2,437
Firm transportation agreements(1) 458 908 943 4,822 7,131
Unconditional purchase obligations(2) 2,749 2,680 2,161 1,549 9,139
Lease rentals and exploration work agreements 49 142 102 850 1,143
Obligations to fund equity investee(3) 52 110 110 379 651
Finance lease obligations(4) 35 70 70 764 939
Asset retirement obligations(5) 218 376 337 10,503 11,434
4,487 6,483 4,620 24,237 39,827
(1) Included in operating leases and firm transportation agreements are blending and storage agreements and transportation commitments of $0.6 billion and $2.1 billion respectively with HMLP.
(2) Includes purchase of refined petroleum products, processing services, distribution services, insurance premiums, drilling services and natural gas purchases. (3) Equity investee refers to the Company's investment in Husky-CNOOC Madura Limited and HMLP which is accounted for using the equity method. (4) Refer to Note 17 in the 2016 Consolidated Financial Statements.(5) Asset retirement obligation amounts represent the undiscounted future payments for the estimated cost of abandonment, removal and remediation associated with retiring the
Company's assets. The amounts are inclusive of $156 million of cash deposited into restricted accounts for funding of future asset retirement obligations in the Asia Pacific Region.
The Company renewed certain purchase, distribution and terminal commitments related to light oil and asphalt products in 2016. Certain transportation, storage and operating lease commitments were signed with HMLP in conjunction with the divestiture of certain midstream assets.
Due to the harsh environment, the Henry Goodrich rig arrived in mid-2016 for development drilling at White Rose.
Husky-CNOOC Madura Limited, of which the Company is a joint venturer, has entered into an arrangement to lease an FPSO vessel for the purposes of developing the Madura BD field gas reserves. The Company is obligated to pay 40 percent of the lease payment which is included in obligations to fund equity investee. The FPSO was delivered and testing began in December 2016.
The Company updated its estimates for Asset Retirement Obligations (”ARO”) as outlined in Note 16 to the 2016 Consolidated Financial Statements. On an undiscounted and inflated basis, the ARO decreased from $13.9 billion as at December 31, 2015 to $11.4 billionas at December 31, 2016, primarily due to dispositions in Western Canada.
Other ObligationsThe Company is involved in various claims and litigation arising in the normal course of business. While the outcome of these matters is uncertain and there can be no assurance that such matters will be resolved in the Company's favour, the Company does not currently believe that the outcome of adverse decisions in any pending or threatened proceedings related to these and other matters, or any amount which it may be required to pay, would have a material adverse impact on its financial position, results of operations or liquidity.
The Company has income tax filings that are subject to audit and potential reassessment. The findings may impact the tax liability of the Company. The final results are not reasonably determinable at this time. Management believes that it has adequately provided for current and deferred income taxes.
The Company provides a defined contribution pension plan and a post-retirement health and dental plan for all qualified employees in Canada. The Company also provides a defined benefit pension plan for approximately 53 active employees, 74 participants with deferred benefits and 546 participants or joint survivors receiving benefits in Canada. This plan was closed to new entrants in 1991 after the majority of employees transferred to the defined contribution pension plan (Refer to Note 22 in the 2016 Consolidated Financial Statements).
55Management’s Discussion and Analysis
Management’s Discussion and Analysis 2016
44
The Company has an obligation to fund capital expenditures of the BP-Husky Toledo Refinery. The remaining net contribution payable amount of approximately U.S. $110 million (CDN $146 million) will be paid by way of funding all capital contributions of the BP-Husky Refining LLC joint operation and the remaining balance will be fully repaid by the end of 2017.
In accordance with the provisions of the regulations of the People's Republic of China, the Company is required to deposit funds in separate accounts restricted to future decommissioning and disposal obligations. The funds will be used for decommissioning and disposal expenses upon the expiry or termination of the contract for the Asia Pacific Region. As at December 31, 2016, Husky has deposited funds of $156 million into the restricted cash accounts, of which $84 million relates to the Wenchang field and has been classified as current.
The Company is also subject to various contingent obligations that become payable only if certain events or rulings occur. The inherent uncertainty surrounding the timing and financial impact of these events or rulings prevents any meaningful measurement, which is necessary to assess their impact on future liquidity. Such obligations include environmental contingencies, contingent consideration and potential settlements resulting from litigation.
The Company has a number of contingent environmental liabilities, which individually have been estimated to be immaterial. These contingent environmental liabilities are primarily related to the migration of contamination at fuel outlets and certain legacy sites where the Company had previously conducted operations. The contingent environmental liabilities involved have been considered in aggregate and based on reasonable estimates the Company does not believe they will result, in aggregate, in a material adverse effect on its financial position, results of operations or liquidity.
Off-Balance Sheet ArrangementsThe Company does not believe it has any guarantees or off-balance sheet arrangements that have, or are reasonably likely to have, a current or future effect on the Company's financial condition, results of operations, liquidity or capital expenditures.
Standby Letters of CreditOn occasion, the Company issues letters of credit in connection with transactions in which the counterparty requires such security.
8.6 Transactions with Related Parties
On July 15, 2016, the Company completed the sale of 65 percent of its ownership interest in select midstream assets in the Lloydminster region of Alberta and Saskatchewan for gross proceeds of $1.69 billion in cash. The assets include approximately 1,900 kilometres of pipeline in the Lloydminster region, 4.1 mmbbls of storage capacity at Hardisty and Lloydminster and other ancillary assets. The assets are held by HMLP, of which the Company owns 35 percent, PAH owns 48.75 percent and CKI owns 16.25 percent. This transaction is a related party transaction, as PAH and CKI are affiliates of one of the Company’s principal shareholders, and has been measured at fair value. The transaction enabled the Company to further strengthen its balance sheet while maintaining operatorship and preserving the integration between its heavy oil production, marketing and refining assets. Subsequent to the sale of its ownership interest, the Company performs management services as the operator of the pipeline for which it earns a management fee from HMLP. The Company is also the contractor for HMLP and constructs its assets on a cost recovery basis with certain restrictions. HMLP charges an access fee to the Company for the use of its pipeline systems in performing its blending business and the Company also pays for transportation and storage services. For the year ended December 31, 2016, the Company charged HMLP $133 million related to construction and management services, and the Company had purchases from HMLP of $15 million related to the use of the pipeline for the Company's blending activities and $64 million related to transportation and storage. As at December 31, 2016, the Company had $26 million due from HMLP and nil due to HMLP related to these transactions. All transactions with HMLP have been measured at fair value.
The Company sells natural gas to and purchases steam from the Meridian Limited Partnership (”Meridian”), owner of the Meridian cogeneration facility, for use at the facility, Upgrader and Lloydminster ethanol plant. In addition, the Company provides facilities services and personnel for the operations of the Meridian cogeneration facility, which are primarily measured and reimbursed at cost. These transactions are related party transactions, as Meridian is an affiliate of one of the Company's principal shareholders, and have been measured at fair value. For the year ended December 31, 2016, the amount of natural gas sales to Meridian totalled $41 million. For the year ended December 31, 2016, the amount of steam purchased by the Company from Meridian totalled $13 million. For the year ended December 31, 2016, the total cost recovery by the Company for facilities services was $12 million. At December 31, 2016, the Company had under $1 million due from Meridian with respect to these transactions.
56 Management’s Discussion and Analysis
Management’s Discussion and Analysis 2016
45
At December 31, 2016, $34 million of the May 11, 2009 7.25 percent senior notes were held by a related party, Ace Dimension Limited, and are included in long-term debt in the Company's consolidated balance sheet. The related party transaction was measured at fair market value at the date of the transaction and has been carried out on the same terms as applied with unrelated parties.
On June 29, 2011, the Company issued 7.4 million common shares at a price of $27.05 per share for total gross proceeds of $200 million in a private placement to its then principal shareholders, L.F. Management and Investment S.à r.l (formerly L.F. Investments (Barbados) Limited) and Hutchison Whampoa Luxembourg Holdings S.à r.l, which was completed in conjunction with a public offering by the Company of common shares.
On December 7, 2010, the Company issued 28.9 million common shares at a price of $24.50 per share for total gross proceeds of $707 million in a private placement to its principal shareholders, L.F. Management and Investment S.à r.l (formerly L.F. Investments (Barbados) Limited) and Hutchison Whampoa Luxembourg Holdings S.à r.l, which was completed in conjunction with a public offering by the Company of common shares in Canada.
8.7 Outstanding Share Data
Authorized:• unlimited number of common shares• unlimited number of preferred shares
Issued and outstanding: February 20, 2017• common shares 1,005,451,845• cumulative redeemable preferred shares, series 1 10,435,932• cumulative redeemable preferred shares, series 2 1,564,068• cumulative redeemable preferred shares, series 3 10,000,000• cumulative redeemable preferred shares, series 5 8,000,000• cumulative redeemable preferred shares, series 7 6,000,000• stock options 25,300,870• stock options exercisable 15,596,918
57Management’s Discussion and Analysis
Management’s Discussion and Analysis 2016
46
9.0 Critical Accounting Estimates and Key Judgments
The Company's consolidated financial statements have been prepared in accordance with IFRS as issued by the International Accounting Standards Board (“IASB”). Significant accounting policies are disclosed in Note 3 to the 2016 Consolidated Financial Statements. Certain of the Company's accounting policies require subjective judgment and estimation about uncertain circumstances.
9.1 Accounting Estimates
Estimates and underlying assumptions are reviewed on an ongoing basis. Revisions to accounting estimates are recognized in the period in which the estimates are revised and on a prospective basis. By their nature, estimates are subject to measurement uncertainty and changes in such estimates in future years could require a material change in the consolidated financial statements. These underlying assumptions are based on historical experience and other factors that management believes to be reasonable under the circumstances, and are subject to change as new events occur, as more industry experience is acquired, as additional information is obtained and as the Company's operating environment changes. Specifically, amounts recorded for depletion, depreciation, amortization and impairment, asset retirement obligations, assets and liabilities measured at fair value, employee future benefits, income taxes and estimates and reserves and contingencies are based on estimates.
Depletion, Depreciation, Amortization and ImpairmentEligible costs associated with oil and gas activities are capitalized on a unit of measure basis. Depletion expense is subject to estimates including petroleum and natural gas reserves, future petroleum and natural gas prices, estimated future remediation costs, future interest rates as well as other fair value assumptions. The aggregate of capitalized costs, net of accumulated DD&A, less estimated salvage values, is charged to DD&A over the life of the proved developed reserves using the unit of production method, except in the case of assets whose useful life is shorter or longer than the lifetime of the proved developed reserves of that field, in which case the straight-line method or a unit-of-production method based on total proved plus probable reserves is applied.
Impairment and Reversals of Impairment of Non-Financial AssetsThe carrying amounts of the Company's non-financial assets are reviewed at the end of each reporting period to determine whether there is any indication of impairment. Determining whether there are any indications of impairment requires significant judgment of external factors, such as an extended decrease in prices or margins for oil and gas commodities or products, a significant decline in an asset's market value, a significant downward revision of estimated volumes, an upward revision of future development costs, a decline in the entity's market capitalization or significant changes in the technological, market, economic or legal environment that would have an adverse impact on the entity. If impairment is indicated, the amount by which the carrying value exceeds the estimated fair value of the long-lived asset is charged to net earnings.
The determination of the recoverable amount for impairment purposes involves the use of numerous assumptions and estimates. Estimates of future cash flows used in the evaluation of impairment of assets are made using management's forecasts of commodity prices, operating costs and future capital expenditures, marketing supply and demand, forecasted crack spreads, growth rate, discount rate and, in the case of oil and gas properties, expected production volumes. Expected production volumes take into account assessments of field reservoir performance and include expectations about proved and probable volumes and where applicable economically recoverable resources associated with interests in certain Husky properties which are risk-weighted utilizing geological, production, recovery, market price and economic projections. Either the cash flow estimates or the discount rate is risk-adjusted to reflect local conditions as appropriate. Future revisions to these assumptions impact the recoverable amount.
Impairment losses recognized for other assets in prior years are assessed at the end of each reporting period for indications that the impairment has decreased or no longer exists. An impairment loss is reversed only to the extent that the carrying amount of the asset or cash generating units (”CGUs”) does not exceed the carrying amount that would have been determined, net of depletion, depreciation and amortization, if no impairment loss had been recognized.
Asset Retirement Obligations Estimating ARO requires that the Company estimates costs that are many years in the future. Restoration technologies and costs are constantly changing, as are regulatory, political, environment, safety and public relations considerations. Inherent in the calculation of ARO are numerous assumptions and estimates, including the ultimate settlement amounts, future third-party pricing, inflation factors, credit-adjusted discount rates, timing of settlement and changes in the legal, regulatory, environmental and political environments. Future revisions to these assumptions may result in changes to the ARO.
Fair Value of Financial InstrumentsThe fair values of derivatives are determined using valuation models which require assumptions concerning the amount and timing of future cash flows and discount rates. These estimates are also subject to change with fluctuations in commodity prices, interest rates, foreign currency exchange rates and estimates of non-performance. The actual settlement of a derivative instrument could differ materially from the fair value recorded and could impact future results.

58 Management’s Discussion and Analysis
Management’s Discussion and Analysis 2016
47
Employee Future BenefitsThe determination of the cost of the defined benefit pension plan and the other post-retirement benefit plans reflects a number of estimates that affect expected future benefit payments. These estimates include, but are not limited to, attrition, mortality, the rate of return on pension plan assets, salary escalations for the defined benefit pension plan and expected health care cost trends for the post-retirement health and dental care plan. The fair value of the plan assets is used for the purposes of calculating the expected return on plan assets.
Income TaxesThe determination of the Company's income and other tax liabilities requires interpretation of complex laws and regulations often involving multiple jurisdictions. Estimates that require significant judgments are also made with respect to the timing of temporary difference reversals, the realizability of tax assets and in circumstances where the transaction and calculations for which the ultimate tax determination are uncertain. All tax filings are subject to audit and potential reassessment, often after the passage of considerable time. Accordingly, the actual income tax liability may differ significantly from that estimated and recorded by management.
Legal, Environmental Remediation and Other Contingent Matters The Company is required to determine both whether a loss is probable based on judgment and interpretation of laws and regulations and whether the loss can be reasonably estimated. When a loss is determined it is charged to net earnings. The Company must continually monitor known and potential contingent matters and make appropriate provisions by charges to net earnings when warranted by circumstances.
9.2 Key Judgments
Management makes judgments regarding the application of IFRS for each accounting policy. Critical judgments that have the most significant effect on the amounts recognized in the consolidated financial statements include determination of technical feasibility and commercial viability, impairment assessments, the determination of CGUs, changes in reserve estimates, the determination of a joint arrangement, the designation of the Company's functional currency and the fair value of related party transactions.
Exploration and Evaluation CostsCosts directly associated with an exploration well are initially capitalized as exploration and evaluation assets. Expenditures related to wells that do not find reserves or where no future activity is planned are expensed as exploration and evaluation expenses. Exploration and evaluation costs are excluded from costs subject to depletion until technical feasibility and commercial viability is assessed or production commences. At that time, costs are either transferred to property, plant and equipment or their value is impaired. Impairment is charged directly to net earnings. Drilling results, required operating costs and capital expenditure and estimated reserves are important judgments when making this determination and may change as new information becomes available.
Impairment of Financial AssetsA financial asset is assessed at the end of each reporting period to determine whether it is impaired based on objective evidence indicating that one or more events have had a negative effect on the estimated future cash flows of that asset. Objective evidence used by the Company to assess impairment of financial assets includes quoted market prices for similar financial assets and historical collection rates for loans and receivables. The calculations for the net present value of estimated future cash flows related to derivative financial assets requires the use of estimates and assumptions, including forecasts of commodity prices, marketing supply and demand, product margins and expected production volumes, and it is possible that the assumptions may change, which may require a material adjustment to the carrying value of financial assets.
Cash Generating UnitsThe Company's assets are grouped into respective CGUs, which is the smallest identifiable group of assets, liabilities and associated goodwill that generates cash inflows that are largely independent of the cash inflows from other assets or groups of assets. The determination of the Company's CGUs is subject to management's judgment.

59Management’s Discussion and Analysis
Management’s Discussion and Analysis 2016
48
ReservesOil and gas reserves are evaluated internally and audited by independent qualified reserve engineers. The estimation of reserves is an inherently complex process and involves the exercise of professional judgment. Estimates are based on projected future rates of production, estimated commodity prices, engineering data and the timing of future expenditures, all of which are subject to uncertainty. Changes in reserve estimates can have an impact on reported net earnings through revisions to depletion, depreciation and amortization expense, in addition to determining possible impairments and reversal of impairments of property, plant and equipment.
Net reserves represent the Company's undivided gross working interest in total reserves after deducting crown, freehold and overriding royalty interests. Assumptions reflect market and regulatory conditions, as applicable, as at the balance sheet date and could differ significantly from other points in time throughout the year or future periods. Changes in market and regulatory conditions and assumptions can materially impact the estimation of net reserves.
Joint ArrangementsJoint arrangements represent activities where the Company has joint control established by a contractual agreement. Joint control requires unanimous consent for financial and operational decisions. A joint arrangement is either a joint operation, whereby the parties have rights to the assets and obligations for the liabilities, or a joint venture, whereby the parties have rights to the net assets.
Classification of a joint arrangement as either joint operation or joint venture requires judgment. Management's considerations include, but are not limited to, determining if the arrangement is structured through a separate vehicle and whether the legal form and contractual arrangements give the entity direct rights to the assets and obligations for the liabilities within the normal course of business. Other facts and circumstances are also assessed by management, including the entity’s rights to the economic benefits of assets and its involvement and responsibility for settling liabilities associated with the arrangement.
Functional and Presentation CurrencyFunctional currency is the currency of the primary economic environment in which the Company and its subsidiaries operate and is normally the currency in which the entity primarily generates and expends cash. The designation of the Company's functional currency is a management judgment based on the composition of revenues and costs in the locations in which it operates.
Related Party Judgments and EstimatesThe Company entered into transactions and agreements in the normal course of business with certain related parties, joint arrangements and associates. These transactions are on terms equivalent to those that prevail in arm’s length transactions, unless otherwise noted. Proceeds for disposition of assets to related parties are recognized at fair value, based on discounted cash flow forecast from those assets. Independent opinions of the fair value may be obtained. Changes in the assumptions used to determine these fair values may result in a material difference in the proceeds and any gain or loss on disposition.
60 Management’s Discussion and Analysis
Management’s Discussion and Analysis 2016
49
10.0 Recent Accounting Standards and Changes in Accounting Policies
Recent Accounting StandardsThe Company has not early adopted any standard, interpretation or amendment that has been issued but is not yet effective.
LeasesIn January 2016, the IASB issued IFRS 16 Leases, which replaces the current IFRS guidance on leases. Under the current guidance, lessees are required to determine if the lease is a finance or operating lease, based on specified criteria. Finance leases are recognized on the balance sheet, while operating leases are recognized in the Consolidated Statements of Income (Loss) when the expense is incurred. Under IFRS 16, lessees must recognize a lease liability and a right-of-use asset for virtually all lease contracts. The recognition of the present value of minimum lease payments for certain contracts currently classified as operating leases will result in increases to assets, liabilities, depletion, depreciation and amortization, and finance expense, and a decrease to production, operating and transportation expense upon implementation. An optional exemption to not recognize certain short-term leases and leases of low value can be applied by lessees. For lessors, the accounting remains essentially unchanged. The standard will be effective for annual periods beginning on or after January 1, 2019. Early adoption is permitted, provided IFRS 15 Revenue from Contracts with Customers, has been applied, or is applied at the same date as IFRS 16. The Company is currently evaluating the dollar impact of adopting IFRS 16 on the Company’s consolidated financial statements.
Revenue from Contracts with CustomersIn September 2015, the IASB published an amendment to IFRS 15, deferring the effective date of the standard by one year to annual periods beginning on or after January 1, 2018. IFRS 15 replaces existing revenue recognition guidance with a single comprehensive accounting model. The standard requires an entity to recognize revenue to reflect the transfer of goods and services for the amount it expects to receive, when control is transferred to the purchaser. Early adoption is permitted. The Company is currently in the scoping phase of implementation. Adopting IFRS 15 is not expected to have a material impact on the Company's consolidated financial statements.
Financial InstrumentsIn July 2014, the IASB issued IFRS 9, “Financial Instruments” to replace IAS 39, which provides a single model for classification and measurement based on how an entity manages its financial instruments in the context of its business model and the contractual cash flow characteristics of the financial instruments. For financial liabilities, the change in fair value resulting from an entity’s own credit risk is recorded in OCI rather than net earnings, unless this creates an accounting mismatch. IFRS 9 includes a new, forward-looking ‘expected loss’ impairment model that will result in more timely recognition of expected credit losses. In addition, IFRS 9 provides a substantially-reformed approach to hedge accounting. The standard is effective for annual periods beginning on or after January 1, 2018, with required retrospective application and early adoption permitted. The Company intends to retrospectively adopt the standard on January 1, 2018. The adoption of IFRS 9 is not expected to have a material impact on the Company's consolidated financial statements.
Amendments to IAS 7 Statement of Cash FlowsIn January 2016, the IASB issued amendments to IAS 7 to be applied prospectively for annual periods beginning on or after January 1, 2017 with early adoption permitted. The amendments require disclosure of information enabling users of financial statements to evaluate changes in liabilities arising from financing activities. The adoption of the IAS 7 amendments will require additional disclosure in the Company’s consolidated financial statements.
Amendments to IFRS 2 Share-based PaymentIn June 2016, the IASB issued amendments to IFRS 2 to be applied prospectively for annual periods beginning on or after January 1, 2018 with early adoption permitted. The amendments clarify how to account for certain types of share-based payment transactions. The adoption of the amendments is not expected to have a material impact on the Company’s consolidated financial statements.
Change in Accounting PolicyThe Company has applied the following amendments to accounting standards issued by the IASB for the first time for the annual reporting period commencing January 1, 2016:
Amendments to IAS 1 Presentation of Financial StatementsThe amendments clarify guidance on materiality and aggregation, use of subtotals, aggregation and disaggregation of financial statement line items, the order of the notes to the financial statements and disclosure of significant accounting policies. The adoption of this amended standard had no material impact on the Company’s consolidated financial statements.
Amendments to IFRS 7 Financial Instrument: DisclosuresThe amendments clarify: • Whether a servicing contract is continuing involvement in a transferred asset for the purpose of determining the disclosures
required; and • The applicability of the amendments to IFRS 7 on offsetting disclosures to condensed interim financial statements. The adoption of this amended standard had no material impact on the Company's consolidated financial statements.

61Management’s Discussion and Analysis
Management’s Discussion and Analysis 2016
50
11.0 Reader Advisories
11.1 Forward-Looking Statements
Special Note Regarding Forward-Looking Statements
Certain statements in this document are forward-looking statements and information (collectively “forward-looking statements”), within the meaning of the applicable Canadian securities legislation, Section 21E of the United States Securities Exchange Act of 1934, as amended, and Section 27A of the United States Securities Act of 1933, as amended. The forward-looking statements contained in this document are forward-looking and not historical facts.
Some of the forward-looking statements may be identified by statements that express, or involve discussions as to, expectations, beliefs, plans, objectives, assumptions or future events or performance (often, but not always, through the use of words or phrases such as “will likely result”, “are expected to”, “will continue”, “is anticipated”, “is targeting”, “estimated”, “intend”, “plan”, “projection”, “forecast”, “guidance”, “could”, ”may”, ”would”, “aim”, “vision”, “goals”, “objective”, “target”, “schedules” and “outlook”). In particular, forward-looking statements in this document include, but are not limited to, references to:
• with respect to the business, operations and results of the Company generally: the Company’s general strategic plans and growth strategies; the Company’s 2017 production guidance, including guidance for specified areas and product types; the Company’s 2017 Upstream capital expenditures program, including guidance for specified areas and product types; and the Company’s objective to maintain debt to capital employed and debt to funds from operations below certain levels;
• with respect to the Company's Asia Pacific Region: anticipated volumes of peak combined net sales volumes of gas and NGL from the BD, MDA, MBH and MDK fields; anticipated timing of signing the floating production vessel lease contract for, and first production at, the MDA, MBH, and MDK gas fields; anticipated timing of exploration and drilling plans at Block 15/33; anticipated timing of acquisition of seismic surveying data at the Taiwan exploration block; and anticipated timing of first production from and achieving full gas sales rates at the BD field;
• with respect to the Company's Atlantic Region: anticipated exploration and growth potential in the region; and timing to consider sanction of the West White Rose extension project;
• with respect to the Company's Oil Sands properties: anticipated range of daily production volumes from the Company's Sunrise Energy Project for 2017; and expected improved well conformance and production rates at the Company's Sunrise Energy Project over the next two years;
• with respect to the Company's Heavy Oil properties: the Company’s strategic plans for its Heavy Oil Thermal production; anticipated timing of first production from, and combined nameplate capacities of, the Dee Valley, Spruce Lake North and Spruce Lake Central thermal projects; nameplate capacity for the Company’s Edam West thermal development; and nameplate capacity and expected timing for first production of the Rush Lake 2 thermal development;
• with respect to the Company's Western Canadian oil and gas resource plays: the Company’s strategic plans for its Western Canada resource plays;
• with respect to the Company's Infrastructure and Marketing business: the Company’s plans to expand export pipeline access and product storage opportunities to enhance market access; and
• with respect to the Company's Downstream operating segment: potential expansion of the Company's asphalt processing capacity in Lloydminster and the benefits and timing of such expansion; anticipated timing of completion, outcome, and benefits of the crude oil flexibility project at the Company's Lima Refinery; and the timing of the implementation of the agreement with Imperial Oil and consolidation of the two networks to create a single expended truck transport network.
In addition, statements relating to ”reserves” are deemed to be forward-looking statements as they involve the implied assessment based on certain estimates and assumptions that the reserves described can be profitably produced in the future. There are numerous uncertainties inherent in estimating quantities of reserves and in projecting future rates of production and the timing of development expenditures. The total amount or timing of actual future production may vary from reserve and production estimates.
Although the Company believes that the expectations reflected by the forward-looking statements presented in this document are reasonable, the Company’s forward-looking statements have been based on assumptions and factors concerning future events that may prove to be inaccurate. Those assumptions and factors are based on information currently available to the Company about itself and the businesses in which it operates. Information used in developing forward-looking statements has been acquired from various sources including third party consultants, suppliers, regulators and other sources.
62 Management’s Discussion and Analysis
Management’s Discussion and Analysis 2016
51
Because actual results or outcomes could differ materially from those expressed in any forward-looking statements, investors should not place undue reliance on any such forward-looking statements. By their nature, forward-looking statements involve numerous assumptions, inherent risks and uncertainties, both general and specific, which contribute to the possibility that the predicted outcomes will not occur. Some of these risks, uncertainties and other factors are similar to those faced by other oil and gas companies and some are unique to Husky.
The Company’s Annual Information Form for the year ended December 31, 2016 and other documents filed with securities regulatory authorities (accessible through the SEDAR website www.sedar.com and the EDGAR website www.sec.gov) describe risks, material assumptions and other factors that could influence actual results and are incorporated herein by reference.
11.2 Oil and Gas Reserves Reporting
Disclosure of Oil and Gas Reserves and Other Oil and Gas InformationUnless otherwise stated, reserve estimates in this document, have been prepared by internal qualified reserves evaluators in accordance with the Canadian Oil and Gas Evaluation Handbook, have an effective date of December 31, 2016 and represent Husky's share. Unless otherwise noted, historical production numbers given represent Husky’s share.
The Company uses the terms barrels of oil equivalent (”boe”), which is consistent with other oil and gas companies' disclosures, and is calculated on an energy equivalence basis applicable at the burner tip whereby one barrel of crude oil is equivalent to six thousand cubic feet of natural gas. The term boe is used to express the sum of the total company products in one unit that can be used for comparisons. Readers are cautioned that the term boe may be misleading, particularly if used in isolation. This measure is used for consistency with other oil and gas companies but does not represent value equivalency at the wellhead.
The Company uses the term reserve replacement ratio, which is consistent with other oil and gas companies’ disclosures. Reserve replacement ratios for a given period are determined by taking the Company's incremental proved reserve additions for that period divided by the Company's upstream gross production for the same period. The reserve replacement ratio measures the amount of reserves added to a company's reserve base during a given period relative to the amount of oil and gas produced during that same period. A company's reserve replacement ratio must be at least 100 percent for the company to maintain its reserves. The reserve replacement ratio only measures the amount of reserves added to a company's reserve base during a given period.
Steam-oil ratio measures the average volume of steam required to produce a barrel of oil. This measure does not have any standardized meaning and should not be used to make comparisons to similar measures presented by other issuers.
Note to U.S. ReadersThe Company reports its reserves information in accordance with Canadian practices and specifically in accordance with National Instrument 51-101, ”Standards of Disclosure for Oil and Gas Disclosure”, adopted by the Canadian securities regulators. Because the Company is permitted to prepare its reserves information in accordance with Canadian disclosure requirements, it may use certain terms in that disclosure that U.S. oil and gas companies generally do not include or may be prohibited from including in their filings with the Securities and Exchange Commission.

63Management’s Discussion and Analysis
Management’s Discussion and Analysis 2016
52
11.3 Non-GAAP Measures
Disclosure of non-GAAP MeasurementsThe Company uses measurements primarily based on IFRS and also on secondary non-GAAP measurements. The non-GAAP measurements included in this MD&A and related disclosures are: adjusted net earnings (loss), funds from operations, free cash flow, net debt, operating netback, debt to capital employed, earnings coverage, debt to funds from operations and LIFO. None of these measurements are used to enhance the Company's reported financial performance or position. There are no comparable measures in accordance with IFRS for operating netback, debt to capital employed, earnings coverage or debt to funds from operations. These are useful complementary measures in assessing the Company's financial performance, efficiency and liquidity. The non-GAAP measurements do not have a standardized meaning prescribed by IFRS and therefore are unlikely to be comparable to similar measures presented by other issuers. They are common in the reports of other companies but may differ by definition and application. All non-GAAP measures are defined below.
Adjusted Net Earnings (Loss)The term ”adjusted net earnings (loss)” is a non-GAAP measure which should not be considered an alternative to, or more meaningful than, ”net earnings (loss)” as determined in accordance with IFRS, as an indicator of financial performance. Adjusted net earnings (loss) is comprised of net earnings (loss) and excludes items such as after-tax property, plant and equipment impairment charges (reversals), goodwill impairment charges, exploration and evaluation asset write-downs, inventory write-downs and loss (gain) on sale of assets which are not considered to be indicative of the Company's ongoing financial performance. Adjusted net earnings (loss) is a complementary measure used in assessing the Company's financial performance through providing comparability between periods. Adjusted net earnings (loss) was redefined in the second quarter of 2016. Previously, adjusted net earnings (loss) was defined as net earnings (loss) plus after-tax property, plant and equipment impairment charges (reversals), goodwill impairment charges, exploration and evaluation asset write-downs and inventory write-downs.
The following table shows the reconciliation of net earnings (loss) to adjusted net earnings (loss) for the three months and years ended December 31:
Three months ended Dec. 31, Year ended Dec. 31,
($ millions) 2016 2015 2016 2015 2014
Net earnings (loss) 186 (69) 922 (3,850) 1,258
Impairment (impairment reversal) of property, plant andequipment, net of tax (202) — (190) 3,664 622
Impairment of goodwill — — — 160 —
Exploration and evaluation asset write-downs, net of tax 41 6 63 177 4
Inventory write-downs, net of tax 6 14 6 14 135
Loss (gain) on sale of assets, net of tax (37) (4) (1,456) (16) (27)
Adjusted net earnings (loss) (6) (53) (655) 149 1,992
Funds from Operations and Free Cash FlowThe term ”funds from operations” is a non-GAAP measure which should not be considered an alternative to, or more meaningful than, ”cash flow – operating activities” as determined in accordance with IFRS, as an indicator of financial performance. Funds from operations is presented in the Company’s financial reports to assist management and investors in analyzing operating performance of the Company in the stated period. Funds from operations equals cash flow – operating activities less the settlement of asset retirement obligations, deferred revenue, income taxes received (paid) and change in non-cash working capital. The term “free cash flow” is a non-GAAP measure, which should not be considered an alternative to, or more meaningful than, “cash flow - operating activities” as determined in accordance with IFRS, as an indicator of financial performance. Free cash flow is presented to assist management and investors in analyzing operating performance by the business in the stated period. Free cash flow equals funds from operations less capital expenditures.

64 Management’s Discussion and Analysis
Management’s Discussion and Analysis 2016
53
The following table shows the reconciliation of cash flow – operating activities to funds from operations and free cash flow, and related per share amounts for the three months and years ended December 31:
Three months ended Dec. 31, Year ended Dec. 31,
($ millions) 2016 2015 2016 2015 2014
Cash flow – operating activities 644 1,291 1,971 3,760 5,585
Settlement of asset retirement obligations 31 31 87 98 167
Deferred revenue (23) (26) (209) (102) —
Income taxes received (paid) 6 31 (3) 227 661
Interest received (1) (3) (5) (3) (7)
Change in non-cash working capital 13 (684) 235 (651) (871)
Funds from operations 670 640 2,076 3,329 5,535
Capital expenditures (391) (641) (1,705) (3,005) (5,023)
Free cash flow 279 (1) 371 324 512
Funds from operations – basic 0.67 0.65 2.07 3.38 5.63
Funds from operations – diluted 0.67 0.65 2.07 3.38 5.62
Net DebtNet debt is a non-GAAP measure that equals total debt less cash and cash equivalents. Total debt is calculated as long-term debt, long-term debt due within one year and short-term debt. Management believes this measurement assists management and investors in evaluating the Company’s financial strength.
The following table shows the reconciliation of total debt to net debt as at December 31, 2016, 2015 and 2014:
($ millions) December 31, 2016 December 31, 2015 December 31, 2014
Short-term debt 200 720 895
Long-term debt due within one year 403 277 300
Long-term debt 4,736 5,759 4,097
Total Debt 5,339 6,756 5,292
Cash and cash equivalents (1,319) (70) (1,267)
Net Debt 4,020 6,686 4,025
Operating NetbackOperating netback is a common non-GAAP metric used in the oil and gas industry. Management believes this measurement assists management and investors to evaluate the specific operating performance by product at the oil and gas lease level. The operating netback was determined as gross revenue less royalties, production and operating and transportation costs on a per unit basis.

65Management’s Discussion and Analysis
Management’s Discussion and Analysis 2016
54
Debt to Capital EmployedDebt to capital employed percentage is a non-GAAP measure and is equal to long-term debt, long-term debt due within one year, and short-term debt divided by capital employed. Capital employed is equal to long-term debt, long-term debt due within one year, short-term debt and shareholders' equity. Management believes this measurement assists management and investors in evaluating the Company's financial strength.
Debt to Funds from OperationsDebt to funds from operations is a non-GAAP measure and is equal to long-term debt, long-term debt due within one year and short-term debt divided by funds from operations. Funds from operations is equal to cash flow – operating activities less the settlement of asset retirement obligations, deferred revenue, income taxes received (paid) and change in non-cash working capital. Management believes this measurement assists management and investors in evaluating the Company's financial strength.
The following table shows the reconciliation of debt to funds from operations for the periods ended December 31, 2016, 2015 and 2014:
December 31, 2016 December 31, 2015 December 31, 2014($ millions)
Total Debt 5,339 6,756 5,292
Funds from operations 2,076 3,329 5,535
Debt to Funds from Operations 2.6 2.0 1.0
Earnings CoverageEarnings coverage is a non-GAAP measure and is equal to net earnings (loss) before finance expense on long-term debt, capitalized interest and income taxes divided by finance expense on long-term debt, dividends on preferred shares and capitalized interest. Long-term debt includes the current portion of long-term debt. The Company's earnings coverage on long-term debt was 3.2 times for the twelve month period ended December 31, 2016.
LIFO The Chicago 3:2:1 market crack spread benchmark is based on LIFO inventory costing, a non-GAAP measure, which assumes that crude oil feedstock costs are based on the current month price of WTI, while on a FIFO basis, the comparable GAAP measure, crude oil feedstock costs included in realized margins reflect purchases made in previous months. Management believes that comparisons between LIFO and FIFO inventory costing assist management and investors in assessing differences in the Company's realized refining margins compared to the Chicago 3:2:1 market crack spread benchmark.

66 Management’s Discussion and Analysis
Management’s Discussion and Analysis 2016
55
11.4 Additional Reader Advisories
Intention of Management’s Discussion and Analysis This Management's Discussion and Analysis is intended to provide an explanation of financial and operational performance compared with prior periods and the Company’s prospects and plans. It provides additional information that is not contained in the Company’s Consolidated Financial Statements.
Review by the Audit CommitteeThis Management's Discussion and Analysis was reviewed by the Audit Committee and approved by the Company’s Board of Directors on February 23, 2017. Any events subsequent to that date could materially alter the veracity and usefulness of the information contained in this document.
Additional Husky Documents Filed with Securities Commissions This Management's Discussion and Analysis dated February 23, 2017 should be read in conjunction with the 2016 Consolidated Financial Statements and related notes. The readers are also encouraged to refer to the Company’s interim reports filed for 2016, which contain the Management's Discussion and Analysis and Consolidated Financial Statements, and the Company’s 2016 Annual Information Form filed separately with Canadian regulatory agencies and Form 40-F filed with the SEC, the U.S. regulatory agency. These documents are available at www.sedar.com, at www.sec.gov and www.huskyenergy.com. Husky's Management's Discussion and Analysis for the interim period ended December 31, 2016 is incorporated herein by reference.
Use of Pronouns and Other Terms“Husky” and “the Company” refer to Husky Energy Inc. on a consolidated basis.
Standard Comparisons in this DocumentUnless otherwise indicated, comparisons of results are for the years ended December 31, 2016 and 2015 and the Company’s financial position at December 31, 2016 and 2015. All currency is expressed in Canadian dollars unless otherwise directed.
Reclassifications and Materiality for DisclosuresCertain prior year amounts have been reclassified to conform to current year presentation. Materiality for disclosures is determined on the basis of whether the information omitted or misstated would cause a reasonable investor to change their decision to buy, sell or hold Husky's securities.
Additional Reader GuidanceUnless otherwise indicated:• Financial information is presented in accordance with IFRS as issued by the IASB;• Currency is presented in millions of Canadian dollars (“$ millions”);• Gross production and reserves are the Company’s working interest prior to deduction of royalty volume; and• Prices are presented before the effect of hedging.

67Management’s Discussion and Analysis
Management’s Discussion and Analysis 2016
56
Terms
Adjusted Net Earnings (Loss) Net earnings (loss) before after-tax property, plant and equipment impairment charges (reversals), goodwillimpairment charges, exploration and evaluation asset write-downs, inventory write-downs and loss (gain) onthe sale of assets
Bitumen Bitumen is a naturally occurring solid or semi-solid hydrocarbon consisting mainly of heavier hydrocarbons, with a viscosity greater than 10,000 millipascal-seconds or 10,000 centipoise measured at the hydrocarbon's original temperature in the reservoir and at atmospheric pressure on a gas-free basis, and that is not primarily recoverable at economic rates through a well without the implementation of enhanced recovery methods
Capital Employed Long-term debt, long-term debt due within one year, short-term debt and shareholders’ equity
Capital Expenditures Includes capitalized administrative expenses but does not include asset retirement obligations or capitalized interest
Capital Program Capital expenditures not including capitalized administrative expenses or capitalized interest
Debt to Capital Employed Long-term debt, long-term debt due within one year and short-term debt divided by capital employed
Debt to Funds from Operations Long-term debt, long-term debt due within one year and short-term debt divided by funds from operations
Diluent A lighter gravity liquid hydrocarbon, usually condensate or synthetic oil, added to heavy oil and bitumen to facilitate transmissibility of the oil through a pipeline
Earnings Coverage Net earnings (loss) before finance expense on long-term debt, capitalized interest and income taxes divided by finance expense on long-term debt, dividends on preferred shares and capitalized interest. Long-term debt includes the current portion of long-term debt
Feedstock Raw materials which are processed into petroleum products
Free Cash Flow Funds from operations less capital expenditures
Funds from Operations Cash flow - operating activities plus items affecting cash which includes settlement of asset retirement obligations, deferred revenue, income taxes received (paid) and change in non-cash working capital.
Gross/Net Acres/Wells Gross refers to the total number of acres/wells in which a working interest is owned. Net refers to the sum of the fractional working interests owned by a company
Gross Reserves/Production A company’s working interest share of reserves/production before deduction of royalties
Heavy crude oil Crude oil with a relative density greater than 10 degrees API gravity and less than or equal to 22.3 degrees API gravity
High-TAN A measure of acidity. Crude oils with a high content of naphthenic acids are referred to as high total acid number (TAN) crude oils or high acid crude oil. The TAN value is defined as the milligrams of Potassium Hydroxide required to neutralize the acidic group of one gram of the oil sample. Crude oils in the industry with a TAN value greater than 1 are referred to as Hi-TAN crudes
Last in first out (”LIFO”) Last in first out accounting assumes that crude oil feedstock costs are based on the current month price of WTI
Light crude oil Crude oil with a relative density greater than 31.1 degrees API gravity
Medium crude oil Crude oil with a relative density that is greater than 22.3 degrees API gravity and less than or equal to 31.1 degrees API gravity
Net Debt Total debt less cash and cash equivalents
Net Revenue Gross revenues less royalties
NOVA Inventory Transfer (”NIT”) Exchange or transfer of title of gas that has been received into the NOVA pipeline system but not yet delivered to a connecting pipeline
Oil sands Sands and other rock materials that contain crude bitumen and include all other mineral substances in association therewith
Operating Netback Gross revenue less royalties, operating costs and transportation costs on a per unit basis
Proved reserves Reserves that can be estimated with a high degree of certainty to be recoverable. It is likely that the actual remaining quantities recovered will exceed the estimated proved reserves.
Proved developed reserves Those reserves that are expected to be recovered from existing wells and installed facilities or, if facilities have not been installed, that would involve a low expenditure (e.g., when compared to the cost of drilling a well) to put the reserves on production. The developed category may be subdivided into producing and non-producing
Proved undeveloped reserves Those reserves expected to be recovered from known accumulations where a significant expenditure (e.g., when compared to the cost of drilling a well) is required to render them capable of production. They must fully meet the requirements of the reserves category (proved, probable, possible) to which they are assigned
Probable reserves Those additional reserves that are less certain to be recovered than proved reserves. It is equally likely that the actual remaining quantities recovered will be greater or less than the sum of the estimated proved plus probable reserves

68 Management’s Discussion and Analysis
Management’s Discussion and Analysis 2016
57
Seismic survey A method by which the physical attributes in the outer rock shell of the earth are determined by measuring, with a seismograph, the rate of transmission of shock waves through the various rock formations
Shareholders’ Equity Common shares, preferred shares, retained earnings and other reserves
Steam-oil ratio The steam-oil ratio measures the volume of steam used to produce one unit volume of oil
Stratigraphic Well A geologically directed test well to obtain information. These wells are usually drilled without the intention of being completed for production
Synthetic Oil A mixture of hydrocarbons derived by upgrading heavy crude oils, including bitumen, through a process that reduces the carbon content and increases the hydrogen content
Total Debt Long-term debt including long-term debt due within one year and short-term debt
Turnaround Performance of plant or facility maintenance
Abbreviations
ARO asset retirement obligations mbbls/day thousand barrels per day
bbls barrels mboe thousand barrels of oil equivalent
bbls/day barrels per day mboe/day thousand barrels of oil equivalent per day
bcf billion cubic feet mcf thousand cubic feet
boe barrels of oil equivalent mcfge thousand cubic feet of gas equivalent
boe/day barrels of oil equivalent per day MD&A Management’s Discussion and Analysis
bps basis points mmbbls million barrels
CGUs cash generating units mmboe million barrels of oil equivalent
CHOPS cold heavy oil production with sand mmbtu million British Thermal Units
CO2e carbon dioxide equivalent mmcf million cubic feet
CSA Canadian Securities Administrators mmcf/day million cubic feet per day
DD&A depletion, depreciation and amortization m3 cubic meter
ELs exploration licenses NGL natural gas liquids
EOR enhanced oil recovery NIT NOVA Inventory Transfer
EPA U.S. Environmental Protection Agency NYMEX New York Mercantile Exchange
FEED front end engineering and design OPEC Organization of Petroleum Exporting Countries
FIFO first in first out PHMSA Pipeline and Hazardous Materials Safety Administration
FPSO floating production, storage and offloading vessel PSC production sharing contract
FVTPL fair value through profit or loss RFS Renewable Fuel Standard
GAAP Generally Accepted Accounting Principles RIN Renewable Identification Number
GHG greenhouse gas RVO renewable volume obligation
GJ gigajoule S&P Standard and Poor's
HOIMS Husky Operational Integrity Management System SAGD steam assisted gravity drainage
IASB International Accounting Standards Board SEC U.S. Securities and Exchange Commission
IFRIC International Financial Reporting InterpretationsCommittee Interpretation
SEDAR System for Electronic Document Analysis and Retrieval
IFRS International Financial Reporting Standards tCO2e tons of carbon dioxide equivalent
LFEs Large Final Emitting Facilities TSX Toronto Stock Exchange
LIFO last in first out WI working interest
mbbls thousand barrels WTI West Texas Intermediate

69Management’s Discussion and Analysis
Management’s Discussion and Analysis 2016
58
11.5 Disclosure Controls and Procedures
Disclosure Controls and ProceduresHusky’s management, under supervision of the Chief Executive Officer and the Chief Financial Officer, have evaluated the effectiveness of Husky’s disclosure controls and procedures (as defined in the rules of the SEC and the Canadian Securities Administrators (“CSA”)) as at December 31, 2016, and have concluded that such disclosure controls and procedures are effective.
Management’s Annual Report on Internal Control over Financial ReportingThe following report is provided by management in respect of Husky’s internal controls over financial reporting (as defined in the rules of the SEC and the CSA):
1) Husky’s management, under the supervision of the Chief Executive Officer and Chief Financial Officer, is responsible for designing, establishing and maintaining adequate internal control over financial reporting for Husky. All internal control systems, no matter how well designed, have inherent limitations. Therefore, even those systems determined to be effective can provide only reasonable assurance with respect to financial statement preparation and presentation.
2) Husky’s management has used the Committee of Sponsoring Organizations of the Treadway Commission framework to evaluate the effectiveness of Husky’s internal control over financial reporting.
3) As at December 31, 2016, management, under the supervision of the Chief Executive Officer and Chief Financial Officer, evaluated the effectiveness of Husky's internal control over financial reporting and concluded that such internal control over financial reporting is effective.
4) KPMG LLP, who has audited the Consolidated Financial Statements of Husky for the year ended December 31, 2016, has also issued a report on internal controls over financial reporting under Auditing Standard No. 5 of the Public Company Accounting Oversight Board (United States) that attests to Husky’s internal controls over financial reporting.
Changes in Internal Control over Financial Reporting There have been no changes in Husky’s internal control over financial reporting during the year ended December 31, 2016, that have materially affected or are reasonably likely to materially affect its internal control over financial reporting.
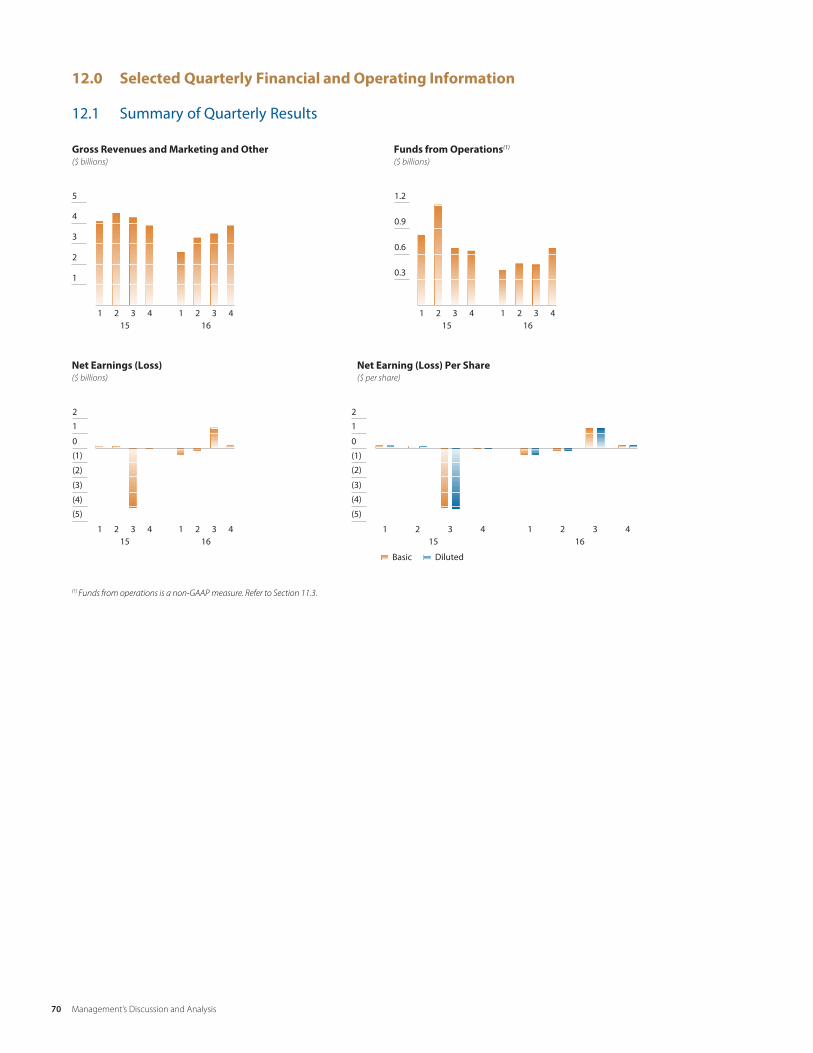
70 Management’s Discussion and Analysis
Management’s Discussion and Analysis 2016
59
12.0 Selected Quarterly Financial and Operating Information
12.1 Summary of Quarterly Results
(1) Funds from operations is a non-GAAP measure. Refer to Section 11.3.
1 2 3 4 1 2 3 415 16
Gross Revenues and Marketing and Other($ billions)
1
4
5
2
3
1 2 3 4 1 2 3 415 16
Funds from Operations(1)
($ billions)
0.6
0.9
1.2
0.3
1 2 3 4 1 2 3 415 16
Net Earnings (Loss)($ billions)
(3)
(5)
0
2
(4)
1
(2)
(1)
2
(5)
1 2 3 4 1 2 3 415 16
Net Earning (Loss) Per Share($ per share)
(3)
(4)
0
1
(2)
(1)
Basic Diluted
Management’s Discussion and Analysis 2016
59
12.0 Selected Quarterly Financial and Operating Information
12.1 Summary of Quarterly Results
(1) Funds from operations is a non-GAAP measure. Refer to Section 11.3.

71Management’s Discussion and Analysis
Management’s Discussion and Analysis 2016
60
Three months endedFourth Quarter Results Summary Dec. 31 Dec. 31($ millions, except where indicated) 2016 2015Gross revenues and marketing and other
UpstreamExploration and Production 1,215 1,189Infrastructure and Marketing 186 301
DownstreamUpgrader 340 364Canadian Refined Products 603 699U.S. Refining and Marketing 1,890 1,692
Corporate and Eliminations (369) (342)Total gross revenues and marketing and other 3,865 3,903Net earnings (loss)
UpstreamExploration and Production 198 (134)Infrastructure and Marketing 18 10
DownstreamUpgrader 32 57Canadian Refined Products 8 49U.S. Refining and Marketing 19 (5)
Corporate and Eliminations (89) (46)Net earnings (loss) 186 (69)
Per share – Basic 0.19 (0.08)Per share – Diluted 0.19 (0.09)
Adjusted net earnings (loss)(1) (6) (53)Funds from operations(1) 670 640
Per share – Basic 0.67 0.65Per share – Diluted 0.67 0.65
UpstreamDaily gross production
Crude oil and NGL production (mbbls/day) 234.5 246.9Natural gas production (mmcf/day) 555.4 660.7
Total production (mboe/day) 327.0 357.0Average sales prices realized ($/boe)
Crude oil and NGL ($/bbl) 42.27 35.71Natural gas ($/mcf) 5.65 5.51
Total average sales prices realized ($/boe) 39.90 34.89DownstreamRefinery throughput
Lloydminster Upgrader (mbbls/day) 66.5 81.2Lloydminster Refinery (mbbls/day) 28.4 28.2Prince George Refinery (mbbls/day) 11.8 11.3Lima Refinery (mbbls/day) 165.1 144.8Toledo Refinery (mbbls/day)(2) 78.8 72.8
Total throughput (mbbls/day) 350.6 338.3Upgrader unit margin ($/bbl) 18.85 20.47Upgrader synthetic crude oil sales (mbbls/day) 50.0 59.4Upgrader total sales (mbbls/day) 66.9 80.7Retail fuel sales (million of litres/day) 6.6 7.3Canadian light oil margins ($/litre) 0.057 0.048Lloydminster Refinery asphalt margin ($/bbl) 20.80 23.57U.S. Refining Margin (U.S. $/bbl crude throughput) 9.86 4.51U.S./Canadian dollar exchange rate (U.S. $) 0.750 0.749
(1) Adjusted net earnings (loss) and funds from operations are non-GAAP measures. Refer to Section 11.3 for a reconciliation to the GAAP measures. (2) BP-Husky Toledo Refinery throughput was revised in the first quarter of 2016 to reflect total throughput. Prior periods reflected crude throughput only and have been restated to
conform with current presentation.

72 Management’s Discussion and Analysis
Management’s Discussion and Analysis 2016
61
Gross Revenue and Marketing and otherThe Company's consolidated gross revenues and marketing and other decreased by $38 million in the fourth quarter of 2016 compared to the fourth quarter of 2015.
In the Upstream business segment, Exploration and Production gross revenues increased primarily due to higher crude and North American natural gas pricing in the fourth quarter of 2016, which was partially offset by a higher Canadian dollar and lower Liwan natural gas pricing. Infrastructure and Marketing gross revenues and marketing and other decreased primarily due to the sale of select midstream assets.
In the Downstream business segment, Upgrader gross revenues decreased primarily due to reduced sales volumes resulting from plant maintenance in the fourth quarter of 2016. Canadian Refined Products gross revenues decreased primarily due to lower refined product prices and lower fuel sales volumes and demand resulting from a weak economic environment. U.S. Refining and Marketing gross revenues increased primarily due to higher sales price and volume at both the BP-Husky Toledo Refinery and Lima Refinery.
Net Earnings (Loss)The Company's consolidated net earnings increased by $255 million in the fourth quarter of 2016 compared to the same period in 2015.
In the Upstream business segment, Exploration and Production net earnings increased primarily due to higher commodity prices, lower operating costs due to cost saving initiatives and a net impairment reversal in the fourth quarter of 2016. The increase to net earnings was partially offset by a higher Canadian dollar and lower Liwan natural gas pricing.
In the Downstream business segment, Upgrader net earnings decreased primarily due to lower average upgrading differentials and lower sales volumes due to plant maintenance. The decline in upgrading differentials was attributable to significantly higher heavy crude oil feedstock costs partially offset by higher realized prices for Husky Synthetic Blend. During the fourth quarter of 2016, the price of Husky Synthetic Blend averaged $64.39/bbl compared to $56.50/bbl in the fourth quarter of 2015. Canadian Refined Products net earnings decreased primarily due to a lower asphalt gross margin due to lower asphalt prices and rising crude feedstock costs in the fourth quarter of 2016. U.S. Refining and Marketing net earnings increased primarily due to the factors noted above that positively impacted gross revenue. The Company recorded FIFO gains of $25 million during the fourth quarter of 2016 compared to FIFO losses of $72 million during the fourth quarter of 2015. During the fourth quarter of 2016, the Company recorded pre-tax business interruption loss and property damage insurance recoveries associated with the unplanned outage in the isocracker unit of $1 million compared to $79 million in the fourth quarter of 2015.
Adjusted Net Earnings (Loss) Adjusted net earnings (loss), which excludes after-tax property, plant and equipment impairment (reversal), goodwill impairment charges, exploration and evaluation asset write-downs, inventory write-downs and losses (gains) on sale of assets, increased by $47 million in the fourth quarter of 2016 compared to the fourth quarter of 2015. The increase was primarily attributable to higher adjusted net earnings from Exploration and Production due to an increase in average realized crude oil and North American natural gas prices and higher U.S. Refining and Marketing adjusted net earnings due to a higher volume and margins. The increase was partially offset by lower adjusted net earnings from the Upgrader primarily due to lower average upgrading differentials and sales volume and from Canadian Refined Products primarily due to lower asphalt prices and rising crude feedstock prices. Adjusted net earnings (loss) is a non-GAAP measure; refer to section 11.3.
Funds from OperationsFunds from operations increased by $30 million in the fourth quarter of 2016 compared to the fourth quarter of 2015 primarily due to the same factors which impacted adjusted net earnings (loss). Funds from operations is a non-GAAP measure; refer to section 11.3.
Daily Gross ProductionProduction decreased by 30 mbbls/day during the fourth quarter of 2016 compared to the fourth quarter of 2015 as a result of: • Disposition of select legacy Western Canada crude oil and natural gas assets; and • Natural reservoir declines at mature properties in Western Canada and the Atlantic Region with limited sustaining capital investment
in a low commodity price environment. Partially offset by: • Increased thermal production driven by the Rush Lake ramp up, strong production performance from Tucker, and new production
from Edam East, Vawn and Edam West; and• The production ramp up at the Sunrise Energy Project.
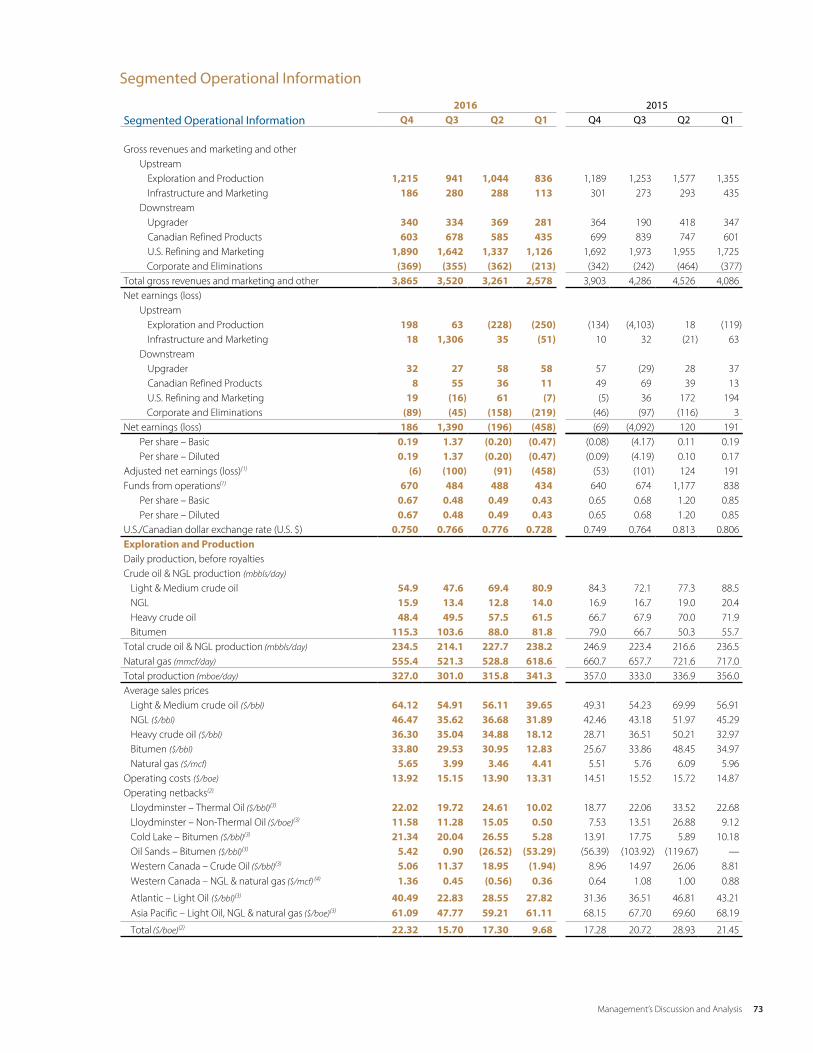
73Management’s Discussion and Analysis
Management’s Discussion and Analysis 2016
62
Segmented Operational Information
2016 2015Segmented Operational Information Q4 Q3 Q2 Q1 Q4 Q3 Q2 Q1
Gross revenues and marketing and otherUpstream
Exploration and Production 1,215 941 1,044 836 1,189 1,253 1,577 1,355Infrastructure and Marketing 186 280 288 113 301 273 293 435
DownstreamUpgrader 340 334 369 281 364 190 418 347Canadian Refined Products 603 678 585 435 699 839 747 601U.S. Refining and Marketing 1,890 1,642 1,337 1,126 1,692 1,973 1,955 1,725
Corporate and Eliminations (369) (355) (362) (213) (342) (242) (464) (377)Total gross revenues and marketing and other 3,865 3,520 3,261 2,578 3,903 4,286 4,526 4,086Net earnings (loss)
UpstreamExploration and Production 198 63 (228) (250) (134) (4,103) 18 (119)Infrastructure and Marketing 18 1,306 35 (51) 10 32 (21) 63
DownstreamUpgrader 32 27 58 58 57 (29) 28 37Canadian Refined Products 8 55 36 11 49 69 39 13U.S. Refining and Marketing 19 (16) 61 (7) (5) 36 172 194
Corporate and Eliminations (89) (45) (158) (219) (46) (97) (116) 3Net earnings (loss) 186 1,390 (196) (458) (69) (4,092) 120 191
Per share – Basic 0.19 1.37 (0.20) (0.47) (0.08) (4.17) 0.11 0.19Per share – Diluted 0.19 1.37 (0.20) (0.47) (0.09) (4.19) 0.10 0.17
Adjusted net earnings (loss)(1) (6) (100) (91) (458) (53) (101) 124 191Funds from operations(1) 670 484 488 434 640 674 1,177 838
Per share – Basic 0.67 0.48 0.49 0.43 0.65 0.68 1.20 0.85Per share – Diluted 0.67 0.48 0.49 0.43 0.65 0.68 1.20 0.85
U.S./Canadian dollar exchange rate (U.S. $) 0.750 0.766 0.776 0.728 0.749 0.764 0.813 0.806Exploration and ProductionDaily production, before royaltiesCrude oil & NGL production (mbbls/day)
Light & Medium crude oil 54.9 47.6 69.4 80.9 84.3 72.1 77.3 88.5 NGL 15.9 13.4 12.8 14.0 16.9 16.7 19.0 20.4 Heavy crude oil 48.4 49.5 57.5 61.5 66.7 67.9 70.0 71.9 Bitumen 115.3 103.6 88.0 81.8 79.0 66.7 50.3 55.7Total crude oil & NGL production (mbbls/day) 234.5 214.1 227.7 238.2 246.9 223.4 216.6 236.5Natural gas (mmcf/day) 555.4 521.3 528.8 618.6 660.7 657.7 721.6 717.0Total production (mboe/day) 327.0 301.0 315.8 341.3 357.0 333.0 336.9 356.0Average sales prices Light & Medium crude oil ($/bbl) 64.12 54.91 56.11 39.65 49.31 54.23 69.99 56.91 NGL ($/bbl) 46.47 35.62 36.68 31.89 42.46 43.18 51.97 45.29 Heavy crude oil ($/bbl) 36.30 35.04 34.88 18.12 28.71 36.51 50.21 32.97 Bitumen ($/bbl) 33.80 29.53 30.95 12.83 25.67 33.86 48.45 34.97 Natural gas ($/mcf) 5.65 3.99 3.46 4.41 5.51 5.76 6.09 5.96Operating costs ($/boe) 13.92 15.15 13.90 13.31 14.51 15.52 15.72 14.87Operating netbacks(2)
Lloydminster – Thermal Oil ($/bbl)(3) 22.02 19.72 24.61 10.02 18.77 22.06 33.52 22.68 Lloydminster – Non-Thermal Oil ($/boe)(3) 11.58 11.28 15.05 0.50 7.53 13.51 26.88 9.12 Cold Lake – Bitumen ($/bbl)(3) 21.34 20.04 26.55 5.28 13.91 17.75 5.89 10.18 Oil Sands – Bitumen ($/bbl)(3) 5.42 0.90 (26.52) (53.29) (56.39) (103.92) (119.67) — Western Canada – Crude Oil ($/bbl)(3) 5.06 11.37 18.95 (1.94) 8.96 14.97 26.06 8.81 Western Canada – NGL & natural gas ($/mcf) (4) 1.36 0.45 (0.56) 0.36 0.64 1.08 1.00 0.88
Atlantic – Light Oil ($/bbl)(3) 40.49 22.83 28.55 27.82 31.36 36.51 46.81 43.21 Asia Pacific – Light Oil, NGL & natural gas ($/boe)(3) 61.09 47.77 59.21 61.11 68.15 67.70 69.60 68.19
Total ($/boe)(2) 22.32 15.70 17.30 9.68 17.28 20.72 28.93 21.45

Management’s Discussion and Analysis 2016
63
2016 2015Segmented Operational Information (continued) Q4 Q3 Q2 Q1 Q4 Q3 Q2 Q1UpgraderSynthetic crude oil sales (mbbls/day) 50.0 53.3 59.8 57.7 59.4 31.6 55.0 58.5Total sales (mbbls/day) 66.9 69.7 76.5 78.3 80.7 42.5 73.2 81.0Upgrading differential ($/bbl) 20.36 19.45 20.85 22.23 22.19 17.58 18.93 15.72Canadian Refined ProductsFuel sales (million litres/day) 6.6 6.8 6.8 6.2 7.3 7.7 7.6 7.6Refinery throughput Lloydminster refinery (mbbls/day) 28.4 26.7 28.2 28.0 28.2 26.4 28.4 29.2 Prince George refinery (mbbls/day) 11.8 9.7 5.1 11.0 11.3 11.0 8.5 11.4U.S. Refining and MarketingRefinery throughput Lima refinery (mbbls/day) 165.1 155.6 103.9 127.5 144.8 142.9 136.1 119.2 BP-Husky Toledo refinery (mbbls/day)(5) 78.8 58.4 41.2 69.4 72.8 68.0 75.5 56.3
(1) Adjusted net earnings (loss) and funds from operations are non-GAAP measures. Refer to Section 11.3 for a reconciliation to the GAAP measures. (2) Operating netback is a non-GAAP measure and is equal to gross revenue less royalties, production and operating costs and transportation costs on a per unit basis.. Refer to
Section 11.3.(3) Includes associated co-products converted to boe.(4) Includes associated co-products converted to mcfge.(5) BP-Husky Toledo Refinery throughput was revised in the first quarter of 2016 to reflect total throughput. Prior periods reflected crude throughput only and have been restated to
conform with current presentation.
Significant Items Impacting Gross Revenues, Net Earnings (Loss) and Funds from OperationsVariations in the Company's gross revenues, net earnings (loss) and funds from operations (non-GAAP measure) are primarily driven by changes in production volumes, commodity prices, commodity price differentials, refining crack spreads, foreign exchange rates and planned turnarounds. Weak crude oil and North American natural gas prices throughout 2016, resulted in significant declines in the Company's gross revenues, net earnings and funds from operations (non-GAAP measure). Other significant items which impacted gross revenues, net earnings and funds from operations (non-GAAP measure) over the last eight quarters include:
• In 2016, the Company accrued business interruption and property damage insurance recoveries of $176 million associated with a fire that damaged the Company's isocracker unit at Lima during the first quarter of 2015. To date, the Company has recorded $411 million in insurance recoveries.
• In the fourth quarter of 2016, the Company recognized after-tax property, plant and equipment net impairment reversal charges of $202 million related to crude oil and natural gas assets located in Western Canada. The impairment reversal was due to an acceleration of forecasted production and revised operational economics, based on recent production performance and market transactions. In addition, the Company recorded an exploration and evaluation land after-tax write-down of $41 million primarily related to Oil Sands assets.
• In the fourth quarter of 2016, the Company completed the sale of select assets in southern Alberta representing approximately 4,700 boe/day for gross proceeds of $24 million and after-tax gains of $37 million.
• In the fourth quarter of 2016, an additional well was brought into production at the South White Rose drill centre.• In the third quarter of 2016, the Company completed the sale of 65 percent of its ownership interest in select midstream assets in
the Lloydminster region of Alberta and Saskatchewan for gross proceeds of $1.69 billion in cash and an after-tax gain of $1.32 billion. The assets include approximately 1,900 kilometres of pipeline in the Lloydminster region, 4.1 mmbbls of storage capacity at Hardisty and Lloydminster and other ancillary assets. The assets are held by a newly-formed limited partnership, of which the Company owns 35 percent, PAH owns 48.75 percent and CKI owns 16.25 percent.
• In the third quarter of 2016, the Company completed the sale of several packages of select legacy Western Canada crude and natural gas assets in Saskatchewan and Alberta representing approximately 5,000 boe/day for total gross proceeds of approximately $299 million, resulting in an after-tax gain of $167 million.
• In the third quarter of 2016, the Company's China subsidiary signed a Heads of Agreement (”HOA”) with China National Offshore Oil Corporation (”CNOOC”) and relevant companies for the price adjustment of natural gas from the Liwan 3-1 and Liuhua 34-2 fields to set the price at Cdn. $12.50- Cdn. $15.00 per thousand cubic feet (mcf) at the current exchange rates. Gross take-or-pay volumes from the fields remain unchanged in the range of 300-330 million cubic feet per day (mmcf/day). Liquids production, net to Husky, is also expected to remain in the range of 5,000 - 6,000 bbls/day. The price adjustment under the HOA is effective as of November 20, 2015, and the settlement of outstanding payment was calculated from that date.
• In the third quarter of 2016, the Company achieved first production at the North Amethyst Hibernia formation well.• In the third quarter of 2016, the Company achieved first oil at the 4,500 bbls/day Edam West heavy oil thermal development.• In the second quarter of 2016, U.S. Refining and Marketing throughput and sales volumes were lower due to major planned
turnarounds at both the Lima and BP-Husky Toledo Refineries.• In the second quarter of 2016, Prince George Refinery gross margins were lower due to a planned turnaround.• In the second quarter of 2016, the demand for natural gas in North America was lower due to unseasonably mild weather conditions
coupled with a temporary decline in natural gas demand from Canadian oil sands operations due to the wildfires in the Fort McMurray region of Alberta.
74 Management’s Discussion and Analysis

Management’s Discussion and Analysis 2016
64
• In the second quarter of 2016, the Company recorded an exploration and evaluation land after-tax write-down of $22 million relating to two exploration wells drilled in the Flemish Pass Basin which did not encounter economic quantities of hydrocarbons.
• In the second quarter of 2016, the Company completed the sale of several packages of select legacy Western Canada crude oil and natural gas assets in Saskatchewan and Alberta representing approximately 20,500 boe/day for total gross proceeds of approximately $791 million. As a part of one of the transactions, the Company obtained interests in lands with thermal development potential in the Lloydminster region. The Company recorded an after-tax loss of $184 million for the sale.
• In the second quarter of 2016, the Company completed the sale of royalty interests representing approximately 1,700 boe/day of Western Canada production. The sale proceeds include $165 million in cash and other considerations, including the transfer to the Company of royalty and working interests in select heavy oil properties in the Lloydminster area. The Company recorded an after-tax gain of $119 million for the sale.
• In the second quarter of 2016, first oil was achieved at the 10,000 bbls/day Vawn heavy oil thermal development.• In the second quarter of 2016, the Company achieved first oil at the 10,000 bbls/day Edam East heavy oil thermal development.• In the second quarter of 2016, the Company achieved first oil at the development of the Colony formation at the Tucker Thermal
Project. This formation has similar characteristics to heavy oil thermal reservoirs in the Lloydminster region. • In the first quarter of 2016, throughput decreased at the Upgrader primarily due to unscheduled maintenance.• In 2015, the Company accrued business interruption and property damage insurance recoveries of $235 million associated with
a fire that damaged the Company's isocracker unit at Lima during the first quarter of 2015.• In the fourth quarter of 2015, the Company recorded a pre-tax provision of $16 million in the U.S. Refining and Marketing business
segment and a pre-tax provision of $6 million in the Infrastructure and Marketing business segment to bring inventory to net realizable value.
• In the third quarter of 2015, the Company recorded after-tax property, plant and equipment and goodwill impairment charges of $3,824 million related to crude oil and natural gas assets located in Western Canada. The after-tax impairment charge was the result of sustained declines in forecasted short and long-term crude oil and natural gas prices and management's decision to reduce capital expenditures in these areas. In addition, the Company recorded an after-tax exploration and evaluation asset write-down of $167 million during the third quarter on certain Western Canada resource play assets and an associated $35 million after-tax work commitment penalty. The write-down was the result of management's plan to withdraw from further exploration and evaluation due to lower estimated short and long-term crude oil and natural gas prices.
• In the third quarter of 2015, the Company derecognized approximately $46 million pre-tax of assets related to the cancellation of the West Mira drilling rig contract.
• In the third quarter of 2015, operations at the Company's Upgrader were suspended for approximately eight weeks for unplanned maintenance to address repairs to the facility's coke drums.
• In the second quarter of 2015, the Company recognized a deferred income tax expense of $157 million related to an increase in Alberta provincial tax rates.
• In the second quarter of 2015, the Company wrote-off approximately $46 million pre-tax of the carrying value of the isocracker unit at the Lima Refinery which was damaged by a fire in the first quarter of 2015.
• In the first quarter of 2015, the Company recognized a deferred income tax recovery of $203 million in its U.S. Refining and Marketing business segment related to the partial payment of the contribution payable to BP-Husky Refining LLC.
• In the first quarter of 2015, the Company was negatively impacted by unplanned outages at the Lima and BP-Husky Toledo refineries. The Lima Refinery was negatively impacted by an unplanned outage when a fire occurred in the isocracker unit in January 2015 and the BP-Husky Toledo Refinery was negatively impacted by unplanned maintenance to repair a damaged fluid catalytic cracking unit.
75Management’s Discussion and Analysis
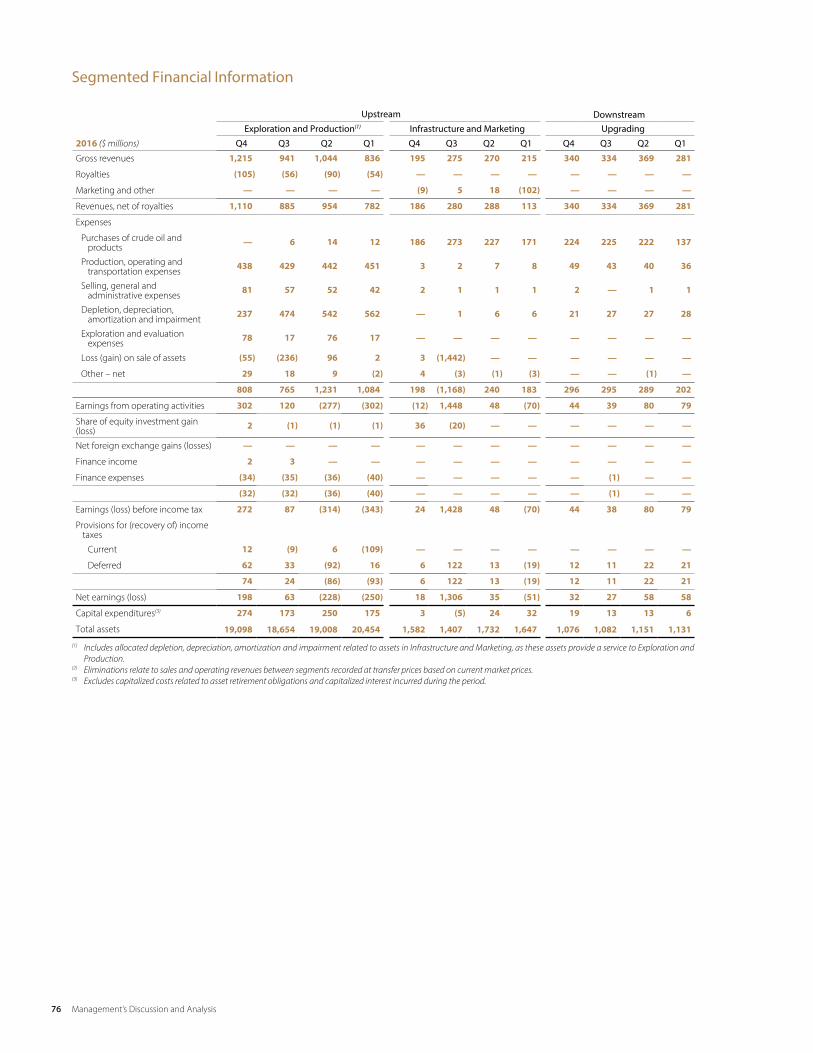
Management’s Discussion and Analysis 2016
65
Segmented Financial Information
Upstream DownstreamExploration and Production(1) Infrastructure and Marketing Upgrading
2016 ($ millions) Q4 Q3 Q2 Q1 Q4 Q3 Q2 Q1 Q4 Q3 Q2 Q1
Gross revenues 1,215 941 1,044 836 195 275 270 215 340 334 369 281
Royalties (105) (56) (90) (54) — — — — — — — —
Marketing and other — — — — (9) 5 18 (102) — — — —
Revenues, net of royalties 1,110 885 954 782 186 280 288 113 340 334 369 281
Expenses
Purchases of crude oil andproducts — 6 14 12 186 273 227 171 224 225 222 137
Production, operating andtransportation expenses 438 429 442 451 3 2 7 8 49 43 40 36
Selling, general andadministrative expenses 81 57 52 42 2 1 1 1 2 — 1 1
Depletion, depreciation,amortization and impairment 237 474 542 562 — 1 6 6 21 27 27 28
Exploration and evaluationexpenses 78 17 76 17 — — — — — — — —
Loss (gain) on sale of assets (55) (236) 96 2 3 (1,442) — — — — — —
Other – net 29 18 9 (2) 4 (3) (1) (3) — — (1) —
808 765 1,231 1,084 198 (1,168) 240 183 296 295 289 202
Earnings from operating activities 302 120 (277) (302) (12) 1,448 48 (70) 44 39 80 79
Share of equity investment gain(loss) 2 (1) (1) (1) 36 (20) — — — — — —
Net foreign exchange gains (losses) — — — — — — — — — — — —
Finance income 2 3 — — — — — — — — — —
Finance expenses (34) (35) (36) (40) — — — — — (1) — —
(32) (32) (36) (40) — — — — — (1) — —
Earnings (loss) before income tax 272 87 (314) (343) 24 1,428 48 (70) 44 38 80 79
Provisions for (recovery of) incometaxes
Current 12 (9) 6 (109) — — — — — — — —
Deferred 62 33 (92) 16 6 122 13 (19) 12 11 22 21
74 24 (86) (93) 6 122 13 (19) 12 11 22 21
Net earnings (loss) 198 63 (228) (250) 18 1,306 35 (51) 32 27 58 58
Capital expenditures(3) 274 173 250 175 3 (5) 24 32 19 13 13 6
Total assets 19,098 18,654 19,008 20,454 1,582 1,407 1,732 1,647 1,076 1,082 1,151 1,131
(1) Includes allocated depletion, depreciation, amortization and impairment related to assets in Infrastructure and Marketing, as these assets provide a service to Exploration and Production.
(2) Eliminations relate to sales and operating revenues between segments recorded at transfer prices based on current market prices.(3) Excludes capitalized costs related to asset retirement obligations and capitalized interest incurred during the period.
76 Management’s Discussion and Analysis

Management’s Discussion and Analysis 2016
66
Downstream (continued) Corporate and Eliminations(2) Total
Canadian Refined Products U.S. Refining and Marketing
Q4 Q3 Q2 Q1 Q4 Q3 Q2 Q1 Q4 Q3 Q2 Q1 Q4 Q3 Q2 Q1
603 678 585 435 1,890 1,642 1,337 1,126 (369) (355) (362) (213) 3,874 3,515 3,243 2,680
— — — — — — — — — — — — (105) (56) (90) (54)
— — — — — — — — — — — — (9) 5 18 (102)
603 678 585 435 1,890 1,642 1,337 1,126 (369) (355) (362) (213) 3,760 3,464 3,171 2,524
475 516 440 339 1,617 1,448 1,083 1,040 (369) (355) (362) (213) 2,133 2,113 1,624 1,486
66 62 64 49 144 127 127 137 — — — — 700 663 680 681
23 6 7 7 4 3 3 3 63 39 82 63 175 106 146 117
27 26 25 24 96 88 77 81 24 22 20 21 405 638 697 722
— — — — — — — — — — — — 78 17 76 17
— (2) (1) — — — — — — — — — (52) (1,680) 95 2
(1) (8) — (1) (1) — (50) (125) (4) (17) 65 66 27 (10) 22 (65)
590 600 535 418 1,860 1,666 1,240 1,136 (286) (311) (195) (63) 3,466 1,847 3,340 2,960
13 78 50 17 30 (24) 97 (10) (83) (44) (167) (150) 294 1,617 (169) (436)
— — — — — — — — — — — — 38 (21) (1) (1)
— — — — — — — — 8 1 (9) 13 8 1 (9) 13
— — — — — — — — 5 2 — 5 7 5 — 5
(2) (2) (1) (2) (1) — (1) (1) (63) (60) (58) (64) (100) (98) (96) (107)
(2) (2) (1) (2) (1) — (1) (1) (50) (57) (67) (46) (85) (92) (105) (89)
11 76 49 15 29 (24) 96 (11) (133) (101) (234) (196) 247 1,504 (275) (526)
— — — — — — — — 4 24 23 48 16 15 29 (61)
3 21 13 4 10 (8) 35 (4) (48) (80) (99) (25) 45 99 (108) (7)
3 21 13 4 10 (8) 35 (4) (44) (56) (76) 23 61 114 (79) (68)
8 55 36 11 19 (16) 61 (7) (89) (45) (158) (219) 186 1,390 (196) (458)
12 3 29 8 67 107 267 182 16 18 12 7 391 309 595 410
1,410 1,419 1,458 1,399 7,017 6,822 6,866 6,444 2,077 2,179 763 821 32,260 31,563 30,978 31,896
77Management’s Discussion and Analysis

Management’s Discussion and Analysis 2016
67
Upstream DownstreamExploration and Production(1) Infrastructure and Marketing Upgrading
2015 ($ millions) Q4 Q3 Q2 Q1 Q4 Q3 Q2 Q1 Q4 Q3 Q2 Q1
Gross revenues 1,189 1,253 1,577 1,355 311 250 337 366 364 190 418 347
Royalties (85) (83) (134) (130) — — — — — — — —
Marketing and other — — — — (10) 23 (44) 69 — — — —
Revenues, net of royalties 1,104 1,170 1,443 1,225 301 273 293 435 364 190 418 347
Expenses
Purchases of crude oil andproducts 7 8 17 9 269 217 302 335 212 162 310 238
Production, operating andtransportation expenses 524 519 521 512 12 7 9 9 44 40 42 43
Selling, general andadministrative expenses 57 51 60 69 2 2 1 2 1 1 1 1
Depletion, depreciation,amortization and impairment 641 5,920 713 719 8 6 6 5 28 26 26 26
Exploration and evaluationexpenses 39 308 43 57 — — — — — — — —
Loss (gain) on sale of assets (4) (15) — 2 — — — — — — — —
Other – net (17) (33) 33 (17) (3) (4) 3 (1) — — — (11)
1,247 6,758 1,387 1,351 288 228 321 350 285 229 379 297
Earnings from operating activities (143) (5,588) 56 (126) 13 45 (28) 85 79 (39) 39 50
Share of equity investment gain(loss) (4) (1) — — — — — — — — — —
Net foreign exchange gains (losses) — — — — — — — — — — — —
Finance income — 1 1 1 — — — — — — — —
Finance expenses (36) (35) (35) (36) — — — — (1) — — —
(36) (34) (34) (35) — — — — (1) — — —
Earnings (loss) before income taxes (183) (5,623) 22 (161) 13 45 (28) 85 78 (39) 39 50
Provisions for (recovery of) incometaxes
Current 111 27 (14) (165) (5) 5 40 182 7 (2) (6) (16)
Deferred (160) (1,547) 18 123 8 8 (47) (160) 14 (8) 17 29
(49) (1,520) 4 (42) 3 13 (7) 22 21 (10) 11 13
Net earnings (loss) (134) (4,103) 18 (119) 10 32 (21) 63 57 (29) 28 37
Capital expenditures(3)(4) 378 597 571 723 42 77 30 19 12 19 7 8
Total assets 21,103 21,296 26,550 26,488 1,699 1,814 1,857 1,830 1,141 1,098 1,107 1,209
(1) Includes allocated depletion, depreciation, amortization and impairment related to assets in Infrastructure and Marketing, as these assets provide a service to Exploration and Production.
(2) Eliminations relate to sales and operating revenues between segments recorded at transfer prices based on current market prices.(3) Excludes capitalized costs related to asset retirement obligations and capitalized interest incurred during the period.(4) 2015 Exploration and Production capital expenditures were revised during the fourth quarter of 2015 to exclude capital expenditures incurred by the Husky-CNOOC Madura Ltd
joint venture, which are classified as contribution to joint venture investing activities on the Company's Consolidated Statements of Cash Flows.
78 Management’s Discussion and Analysis
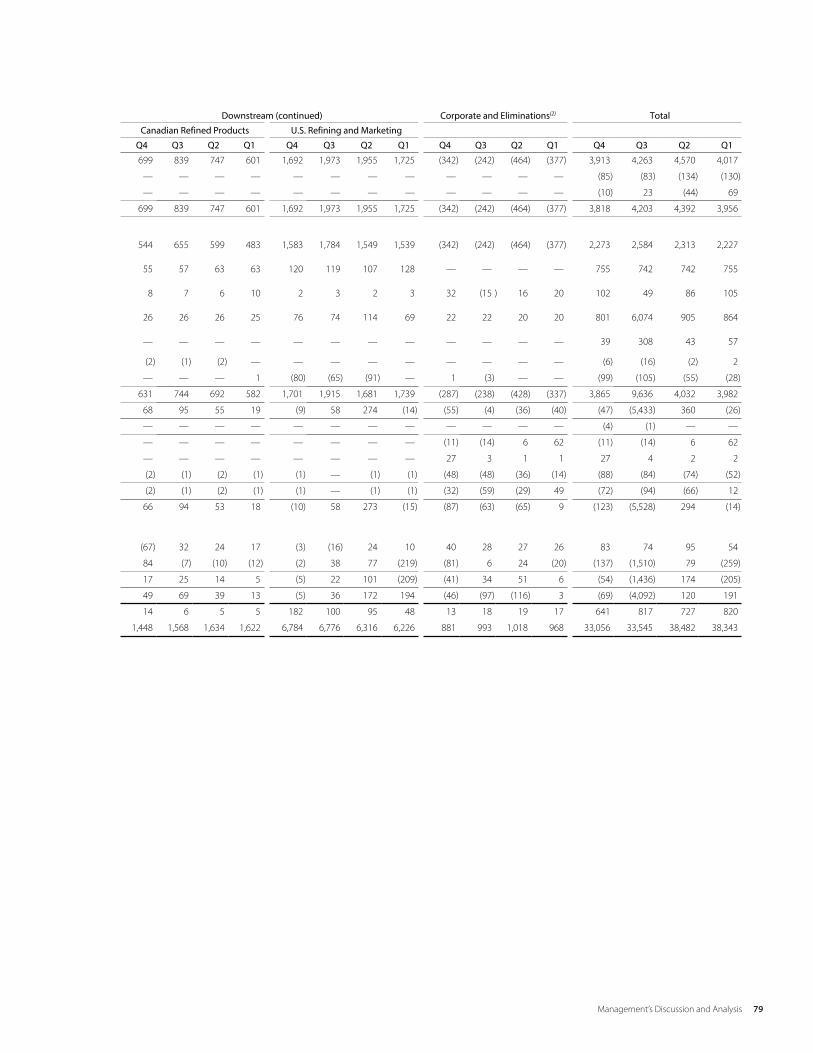
79Management’s Discussion and Analysis
Management’s Discussion and Analysis 2016
68
Downstream (continued) Corporate and Eliminations(2) Total
Canadian Refined Products U.S. Refining and Marketing
Q4 Q3 Q2 Q1 Q4 Q3 Q2 Q1 Q4 Q3 Q2 Q1 Q4 Q3 Q2 Q1
699 839 747 601 1,692 1,973 1,955 1,725 (342) (242) (464) (377) 3,913 4,263 4,570 4,017
— — — — — — — — — — — — (85) (83) (134) (130)
— — — — — — — — — — — — (10) 23 (44) 69
699 839 747 601 1,692 1,973 1,955 1,725 (342) (242) (464) (377) 3,818 4,203 4,392 3,956
544 655 599 483 1,583 1,784 1,549 1,539 (342) (242) (464) (377) 2,273 2,584 2,313 2,227
55 57 63 63 120 119 107 128 — — — — 755 742 742 755
8 7 6 10 2 3 2 3 32 (15 ) 16 20 102 49 86 105
26 26 26 25 76 74 114 69 22 22 20 20 801 6,074 905 864
— — — — — — — — — — — — 39 308 43 57
(2) (1) (2) — — — — — — — — — (6) (16) (2) 2
— — — 1 (80) (65) (91) — 1 (3) — — (99) (105) (55) (28)
631 744 692 582 1,701 1,915 1,681 1,739 (287) (238) (428) (337) 3,865 9,636 4,032 3,982
68 95 55 19 (9) 58 274 (14) (55) (4) (36) (40) (47) (5,433) 360 (26)
— — — — — — — — — — — — (4) (1) — —
— — — — — — — — (11) (14) 6 62 (11) (14) 6 62
— — — — — — — — 27 3 1 1 27 4 2 2
(2) (1) (2) (1) (1) — (1) (1) (48) (48) (36) (14) (88) (84) (74) (52)
(2) (1) (2) (1) (1) — (1) (1) (32) (59) (29) 49 (72) (94) (66) 12
66 94 53 18 (10) 58 273 (15) (87) (63) (65) 9 (123) (5,528) 294 (14)
(67) 32 24 17 (3) (16) 24 10 40 28 27 26 83 74 95 54
84 (7) (10) (12) (2) 38 77 (219) (81) 6 24 (20) (137) (1,510) 79 (259)
17 25 14 5 (5) 22 101 (209) (41) 34 51 6 (54) (1,436) 174 (205)
49 69 39 13 (5) 36 172 194 (46) (97) (116) 3 (69) (4,092) 120 191
14 6 5 5 182 100 95 48 13 18 19 17 641 817 727 820
1,448 1,568 1,634 1,622 6,784 6,776 6,316 6,226 881 993 1,018 968 33,056 33,545 38,482 38,343

Consolidated Financial Statements 1
MANAGEMENT’S REPORTThe management of Husky Energy Inc. (“the Company”) is responsible for the financial information and operating data presented in this financial document.
The consolidated financial statements have been prepared by management in accordance with International Financial Reporting Standards as issued by the International Accounting Standards Board. When alternative accounting methods exist, management has chosen those it deems most appropriate in the circumstances. Financial statements are not precise as they include certain amounts based on estimates and judgments. Management has determined such amounts on a reasonable basis in order to ensure that the financial statements are presented fairly, in all material respects. Financial information presented elsewhere in this financial document has been prepared on a basis consistent with that in the consolidated financial statements.
The Company maintains systems of internal accounting and administrative controls. These systems are designed to provide reasonable assurance that the financial information is relevant, reliable and accurate and that the Company’s assets are properly accounted for and adequately safeguarded. Management’s evaluation concluded that the Company's internal control over financial reporting was effective as of December 31, 2016. The system of internal controls is further supported by an internal audit function.
The Audit Committee of the Board of Directors, composed of independent non-management directors, meets regularly with management, internal auditors as well as the external auditors, to discuss audit (external, internal and joint venture), internal controls, accounting policy and financial reporting matters as well as the reserves determination process. The Committee reviews the annual consolidated financial statements with both management and the independent auditors and reports its findings to the Board of Directors before such statements are approved by the Board. The Committee is also responsible for the appointment of the external auditors for the Company.
The consolidated financial statements have been audited by KPMG LLP, the independent auditors, in accordance with Canadian Auditing Standards and the standards of the Public Company Accounting Oversight Board (United States) on behalf of the shareholders. KPMG LLP has full and free access to the Audit Committee.
”Robert J. Peabody”
Robert J. Peabody
President & Chief Executive Officer
”Jonathan M. McKenzie”
Jonathan M. McKenzie
Chief Financial Officer
Calgary, Canada
February 23, 2017
M a nagement ’s R eport
80 Consolidated Financial Statements

Consolidated Financial Statements 2
INDEPENDENT AUDITORS’ REPORT To the Shareholders and Board of Directors of Husky Energy Inc.
We have audited the accompanying consolidated financial statements of Husky Energy Inc., which comprise the consolidated balance sheets as at December 31, 2016 and December 31, 2015, the consolidated statements of income (loss), comprehensive income (loss), changes in shareholders’ equity and cash flows for the years then ended, and notes, comprising a summary of significant accounting policies and other explanatory information.
Management’s Responsibility for the Consolidated Financial Statements
Management is responsible for the preparation and fair presentation of these consolidated financial statements in accordance with International Financial Reporting Standards as issued by the International Accounting Standards Board, and for such internal control as management determines is necessary to enable the preparation of consolidated financial statements that are free from material misstatement, whether due to fraud or error.
Auditors’ Responsibility
Our responsibility is to express an opinion on these consolidated financial statements based on our audits. We conducted our audits in accordance with Canadian generally accepted auditing standards and the standards of the Public Company Accounting Oversight Board (United States). Those standards require that we comply with ethical requirements and plan and perform the audit to obtain reasonable assurance about whether the consolidated financial statements are free from material misstatement.
An audit involves performing procedures to obtain audit evidence about the amounts and disclosures in the consolidated financial statements. The procedures selected depend on our judgment, including the assessment of the risks of material misstatement of the consolidated financial statements, whether due to fraud or error. In making those risk assessments, we consider internal control relevant to the entity’s preparation and fair presentation of the consolidated financial statements in order to design audit procedures that are appropriate in the circumstances. An audit also includes evaluating the appropriateness of accounting policies used and the reasonableness of accounting estimates made by management, as well as evaluating the overall presentation of the consolidated financial statements.
We believe that the audit evidence we have obtained in our audits is sufficient and appropriate to provide a basis for our audit opinion.
Opinion
In our opinion, the consolidated financial statements present fairly, in all material respects, the consolidated financial position of Husky Energy Inc. as at December 31, 2016 and December 31, 2015, and its consolidated financial performance and its consolidated cash flows for the years then ended in accordance with International Financial Reporting Standards as issued by the International Accounting Standards Board.
”KPMG LLP”
KPMG LLP
Chartered Professional Accountants
February 23, 2017
Calgary, Canada
Independent Auditor s ’ R eport
81Consolidated Financial Statements

Consolidated Financial Statements 3
CONSOLIDATED FINANCIAL STATEMENTSConsolidated Balance Sheets
(millions of Canadian dollars) December 31, 2016 December 31, 2015AssetsCurrent assets
Cash and cash equivalents (note 4) 1,319 70
Accounts receivable (notes 5, 24) 1,036 1,014
Income taxes receivable 186 312
Inventories (note 6) 1,558 1,247
Prepaid expenses 135 271
Restricted cash (note 7, 16) 84 —
4,318 2,914
Restricted cash (note 7, 16) 72 121
Exploration and evaluation assets (note 8) 1,066 1,091
Property, plant and equipment, net (note 9) 24,593 27,634
Goodwill (note 10) 679 700
Investment in joint ventures (note 11) 1,128 359
Long-term income taxes receivable 232 109
Other assets (note 12) 172 128
Total Assets 32,260 33,056
Liabilities and Shareholders’ EquityCurrent liabilities
Accounts payable and accrued liabilities (note 14) 2,226 2,527
Short-term debt (note 15) 200 720
Long-term debt due within one year (note 15) 403 277
Contribution payable due within one year (note 11) 146 210
Asset retirement obligations (note 16) 218 102
3,193 3,836
Long-term debt (note 15) 4,736 5,759
Other long-term liabilities (note 17) 1,020 743
Contribution payable (note 11) — 138
Asset retirement obligations (note 16) 2,573 2,882
Deferred tax liabilities (note 18) 3,111 3,112
Total Liabilities 14,633 16,470
Shareholders’ equity
Common shares (note 19) 7,296 7,000
Preferred shares (note 19) 874 874
Retained earnings 8,457 7,589
Other reserves 989 1,123
Non-controlling interest 11 —
Total Shareholders’ Equity 17,627 16,586
Total Liabilities and Shareholders’ Equity 32,260 33,056
The accompanying notes to the consolidated financial statements are an integral part of these statements.
On behalf of the Board:
”Robert J. Peabody” ”William Shurniak”
Robert J. Peabody William ShurniakDirector Director
82 Consolidated Financial Statements
Consolidated Fina nci a l Statements
Consolidated Financial Statements 3
CONSOLIDATED FINANCIAL STATEMENTSConsolidated Balance Sheets
(millions of Canadian dollars) December 31, 2016 December 31, 2015AssetsCurrent assets
Cash and cash equivalents (note 4) 1,319 70
Accounts receivable (notes 5, 24) 1,036 1,014
Income taxes receivable 186 312
Inventories (note 6) 1,558 1,247
Prepaid expenses 135 271
Restricted cash (note 7, 16) 84 —
4,318 2,914
Restricted cash (note 7, 16) 72 121
Exploration and evaluation assets (note 8) 1,066 1,091
Property, plant and equipment, net (note 9) 24,593 27,634
Goodwill (note 10) 679 700
Investment in joint ventures (note 11) 1,128 359
Long-term income taxes receivable 232 109
Other assets (note 12) 172 128
Total Assets 32,260 33,056
Liabilities and Shareholders’ EquityCurrent liabilities
Accounts payable and accrued liabilities (note 14) 2,226 2,527
Short-term debt (note 15) 200 720
Long-term debt due within one year (note 15) 403 277
Contribution payable due within one year (note 11) 146 210
Asset retirement obligations (note 16) 218 102
3,193 3,836
Long-term debt (note 15) 4,736 5,759
Other long-term liabilities (note 17) 1,020 743
Contribution payable (note 11) — 138
Asset retirement obligations (note 16) 2,573 2,882
Deferred tax liabilities (note 18) 3,111 3,112
Total Liabilities 14,633 16,470
Shareholders’ equity
Common shares (note 19) 7,296 7,000
Preferred shares (note 19) 874 874
Retained earnings 8,457 7,589
Other reserves 989 1,123
Non-controlling interest 11 —
Total Shareholders’ Equity 17,627 16,586
Total Liabilities and Shareholders’ Equity 32,260 33,056
The accompanying notes to the consolidated financial statements are an integral part of these statements.
On behalf of the Board:
”Robert J. Peabody” ”William Shurniak”
Robert J. Peabody William ShurniakDirector Director

83Consolidated Financial Statements
Consolidated Financial Statements 4
Consolidated Statements of Income (Loss)
Year ended December 31,
(millions of Canadian dollars, except share data) 2016 2015
Gross revenues 13,312 16,763
Royalties (305) (432)
Marketing and other (88) 38
Revenues, net of royalties 12,919 16,369
Expenses
Purchases of crude oil and products 7,356 9,397
Production, operating and transportation expenses (note 20) 2,724 2,994
Selling, general and administrative expenses (note 20) 544 342
Depletion, depreciation, amortization and impairment (notes 9, 10) 2,462 8,644
Exploration and evaluation expenses (note 8) 188 447
Gain on sale of assets (note 9) (1,634) (22)
Other – net (27) (287)
11,613 21,515
Earnings (loss) from operating activities 1,306 (5,146)
Share of equity investment gain (loss) (note 11) 15 (5)
Financial items (note 21)
Net foreign exchange gains 13 43
Finance income 17 35
Finance expenses (401) (298)
(371) (220)
Earnings (loss) before income taxes 950 (5,371)
Provisions for (recovery of) income taxes (note 18)
Current (1) 306
Deferred 29 (1,827)
28 (1,521)
Net earnings (loss) 922 (3,850)
Earnings (loss) per share (note 19)
Basic 0.88 (3.95)
Diluted 0.88 (4.01)
Weighted average number of common shares outstanding (note 19)
Basic (millions) 1,004.9 984.1
Diluted (millions) 1,004.9 984.1
The accompanying notes to the consolidated financial statements are an integral part of these statements.

84 Consolidated Financial Statements
Consolidated Financial Statements 5
Consolidated Statements of Comprehensive Income (Loss)
Year ended December 31,
(millions of Canadian dollars) 2016 2015
Net earnings (loss) 922 (3,850)
Other comprehensive income (loss)
Items that will not be reclassified into earnings, net of tax:
Remeasurements of pension plans (note 22) (18) (10)
Items that may be reclassified into earnings, net of tax (note 18):
Derivatives designated as cash flow hedges (note 24) (2) (3)
Equity investment – share of other comprehensive income 2 —
Exchange differences on translation of foreign operations (247) 1,324
Hedge of net investment (note 24) 113 (587)
Other comprehensive income (loss) (152) 724
Comprehensive income (loss) 770 (3,126)
The accompanying notes to the consolidated financial statements are an integral part of these statements.

85Consolidated Financial Statements
Consolidated Financial Statements 6
Consolidated Statements of Changes in Shareholders’ Equity
Attributable to Equity Holders
Other Reserves
(millions of Canadian dollars)Common
SharesPreferred
SharesRetainedEarnings
ForeignCurrency
Translation Hedging
Non-Controlling
Interest
Total Shareholders’
Equity
Balance as at December 31, 2014 6,986 534 12,666 366 23 — 20,575
Net loss — — (3,850) — — — (3,850)
Other comprehensive income (loss)
Remeasurements of pension plans (net of tax recovery of $3 million) (note 18, 22)
— — (10) — — — (10)
Derivatives designated as cash flow hedges (net of tax recovery of $1 million) (note 18, 24)
— — — — (3) — (3)
Exchange differences on translation of foreign operations (net of tax of $215 million) (note 18)
— — — 1,324 — — 1,324
Hedge of net investment (net of tax recovery of $92 million) (note 18, 24)
— — — (587) — — (587)
Total comprehensive income (loss) — — (3,860) 737 (3) — (3,126)
Transactions with owners recognized directly inequity:
Preferred shares issuance (note 19) — 350 — — — — 350
Share issue costs (note 19) — (10) — — — — (10)
Stock dividends paid (note 19) 14 — — — — — 14
Dividends declared on common shares (note 19) — — (1,181) — — — (1,181)
Dividends declared on preferred shares (note 19) — — (36) — — — (36)
Balance as at December 31, 2015 7,000 874 7,589 1,103 20 — 16,586
Net earnings — — 922 — — — 922
Other comprehensive income (loss)
Remeasurements of pension plans (net of tax recovery of $6 million) (note 18, 22)
— — (18) — — — (18)
Derivatives designated as cash flow hedges (net of tax recovery of less than $1 million) (note 18, 24)
— — — — (2) — (2)
Equity investment - share of othercomprehensive income — — — — 2 — 2
Exchange differences on translation of foreign operations (net of tax recovery of $40 million) (note 18)
— — — (247) — — (247)
Hedge of net investment (net of tax of $17 million) (note 18, 24)
— — — 113 — — 113
Total comprehensive income (loss) — — 904 (134) — — 770
Transactions with owners recognized directly inequity:
Stock dividends paid (note 19) 296 — — — — — 296
Dividends declared on preferred shares (note 19) — — (36) — — — (36)
Non-Controlling Interest in Subsidiary — — — — — 11 11
Balance as at December 31, 2016 7,296 874 8,457 969 20 11 17,627
The accompanying notes to the consolidated financial statements are an integral part of these statements.

86 Consolidated Financial Statements
Consolidated Financial Statements 7
Consolidated Statements of Cash Flows
Year ended December 31,
(millions of Canadian dollars) 2016 2015
Operating activities
Net earnings (loss) 922 (3,850)
Items not affecting cash:
Accretion (note 21) 126 121
Depletion, depreciation, amortization and impairment (notes 9, 10) 2,462 8,644
Inventory write-down to net realizable value (note 6) 9 22
Exploration and evaluation expenses (note 8) 86 242
Deferred income taxes (note 18) 29 (1,827)
Foreign exchange (4) 27
Stock-based compensation (note 19, 20) 33 (39)
Gain on sale of assets (note 9) (1,634) (22)
Unrealized mark to market 38 (14)
Other 9 25
Settlement of asset retirement obligations (note 16) (87) (98)
Deferred revenue (note 17) 209 102
Income taxes received (paid) 3 (227)
Interest received 5 3
Change in non-cash working capital (note 23) (235) 651
Cash flow – operating activities 1,971 3,760
Financing activities
Long-term debt issuance (note 15) 6,181 9,449
Long-term debt repayment (note 15) (6,949) (8,500)
Short-term debt (note 15) (520) (175)
Debt issue costs — (7)
Proceeds from preferred share issuance, net of share issue costs (note 19) — 340
Dividends on common shares (note 19) — (1,167)
Dividends on preferred shares (note 19) (27) (36)
Interest paid (349) (323)
Other 21 30
Change in non-cash working capital (note 23) 281 179
Cash flow – financing activities (1,362) (210)
Investing activities
Capital expenditures (1,705) (3,005)
Proceeds from asset sales (note 9) 2,935 122
Contribution payable payment (note 11) (193) (1,363)
Contribution to joint ventures (note 11) (102) (122)
Other (30) (117)
Change in non-cash working capital (note 23) (273) (332)
Cash flow – investing activities 632 (4,817)
Increase (decrease) in cash and cash equivalents 1,241 (1,267)
Effect of exchange rates on cash and cash equivalents 8 70
Cash and cash equivalents at beginning of year 70 1,267
Cash and cash equivalents at end of year 1,319 70
The accompanying notes to the consolidated financial statements are an integral part of these statements.

87Notes to the Consolidated Financial Statements
Notes to the Consolidated Fina nci a l Statements
Consolidated Financial Statements 8
NOTES TO THE CONSOLIDATED FINANCIAL STATEMENTSNote 1 Description of Business and Segmented Disclosures
Husky Energy Inc. (“Husky” or “the Company”) is an international integrated energy company incorporated under the Business Corporations Act (Alberta). The Company’s common shares are listed on the Toronto Stock Exchange (“TSX”) under the symbol “HSE” and the Cumulative Redeemable Preferred Shares, Series 1, Cumulative Redeemable Preferred Shares, Series 2, Cumulative Redeemable Preferred Shares, Series 3, Cumulative Redeemable Preferred Shares, Series 5 and Cumulative Redeemable Preferred Shares, Series 7 are listed under the symbols, ”HSE.PR.A”, “HSE.PR.B”, ”HSE.PR.C”, ”HSE.PR.E” and ”HSE.PR.G”, respectively. The registered office is located at 707, 8th Avenue S.W., PO Box 6525, Station D, Calgary, Alberta, T2P 3G7.
Management has identified segments for the Company’s business based on differences in products, services and management responsibility. The Company’s business is conducted predominantly through two major business segments – Upstream and Downstream.
Upstream includes exploration for, and development and production of, crude oil, bitumen, natural gas and natural gas liquids (“NGL“) (Exploration and Production) and marketing of the Company’s and other producers’ crude oil, natural gas, NGL, sulphur and petroleum coke, pipeline transportation, the blending of crude oil and natural gas, and storage of crude oil, diluent and natural gas (Infrastructure and Marketing). Infrastructure and Marketing markets and distributes products to customers on behalf of Exploration and Production and is grouped in the Upstream business segment based on the nature of its interconnected operations. The Company’s Upstream operations are located primarily in Western Canada, offshore East Coast of Canada (Atlantic Region) and offshore China and offshore Indonesia (Asia Pacific Region).
Downstream includes upgrading of heavy crude oil feedstock into synthetic crude oil in Canada (Upgrading), refining in Canada of crude oil, marketing of refined petroleum products including gasoline, diesel, ethanol blended fuels, asphalt and ancillary products, and production of ethanol (Canadian Refined Products) and refining in the U.S. of primarily crude oil to produce and market gasoline, jet fuel and diesel fuels that meet U.S. clean fuels standards (U.S. Refining and Marketing). Upgrading, Canadian Refined Products and U.S. Refining and Marketing all process and refine natural resources into marketable products and therefore are grouped together as the Downstream business segment due to the similar nature of their products and services.

88 Notes to the Consolidated Financial StatementsConsolidated Financial Statements 9
Segmented Financial Information
Upstream
($ millions)Exploration and
Production(1)Infrastructure and Marketing Total
Year ended December 31, 2016 2015 2016 2015 2016 2015
Gross revenues 4,036 5,374 955 1,264 4,991 6,638
Royalties (305) (432) — — (305) (432)
Marketing and other — — (88) 38 (88) 38
Revenues, net of royalties 3,731 4,942 867 1,302 4,598 6,244
Expenses
Purchases of crude oil and products 32 41 857 1,123 889 1,164
Production, operating and transportation expenses 1,760 2,076 20 37 1,780 2,113
Selling, general and administrative expenses 232 237 5 7 237 244
Depletion, depreciation, amortization and impairment 1,815 7,993 13 25 1,828 8,018
Exploration and evaluation expenses 188 447 — — 188 447
Gain on sale of assets (192) (17) (1,439) — (1,631) (17)
Other – net 53 (34) (3) (5) 50 (39)
3,888 10,743 (547) 1,187 3,341 11,930
Earnings (loss) from operating activities (157) (5,801) 1,414 115 1,257 (5,686)
Share of equity investment gain (loss) (1) (5) 16 — 15 (5)
Financial items
Net foreign exchange gains — — — — — —
Finance income 5 3 — — 5 3
Finance expenses (145) (142) — — (145) (142)
(140) (139) — — (140) (139)
Earnings (loss) before income taxes (298) (5,945) 1,430 115 1,132 (5,830)
Provisions for (recovery of) income taxes
Current (100) (41) — 222 (100) 181
Deferred 19 (1,566) 122 (191) 141 (1,757)
(81) (1,607) 122 31 41 (1,576)
Net earnings (loss) (217) (4,338) 1,308 84 1,091 (4,254)
Intersegment revenues 988 1,081 — — 988 1,081
(1) Includes allocated depletion, depreciation, amortization and impairment related to assets in Infrastructure and Marketing, as these assets provide a service to Exploration and Production.
(2) Eliminations relate to sales and operating revenues between segments recorded at transfer prices based on current market prices. Segment results include transactions between business segments.

89Notes to the Consolidated Financial StatementsConsolidated Financial Statements 10
DownstreamCorporate and Eliminations(2) Total
UpgradingCanadian Refined
ProductsU.S. Refining
and Marketing Total
2016 2015 2016 2015 2016 2015 2016 2015 2016 2015 2016 2015
1,324 1,319 2,301 2,886 5,995 7,345 9,620 11,550 (1,299) (1,425) 13,312 16,763
— — — — — — — — — — (305) (432)
— — — — — — — — — — (88) 38
1,324 1,319 2,301 2,886 5,995 7,345 9,620 11,550 (1,299) (1,425) 12,919 16,369
808 922 1,770 2,281 5,188 6,455 7,766 9,658 (1,299) (1,425) 7,356 9,397
168 169 241 238 535 474 944 881 — — 2,724 2,994
4 4 43 31 13 10 60 45 247 53 544 342
103 106 102 103 342 333 547 542 87 84 2,462 8,644
— — — — — — — — — — 188 447
— — (3) (5) — — (3) (5) — — (1,634) (22)
(1) (11) (10) 1 (176) (236) (187) (246) 110 (2) (27) (287)
1,082 1,190 2,143 2,649 5,902 7,036 9,127 10,875 (855) (1,290) 11,613 21,515
242 129 158 237 93 309 493 675 (444) (135) 1,306 (5,146)
— — — — — — — — — — 15 (5)
— — — — — — — — 13 43 13 43
— — — — — — — — 12 32 17 35
(1) (1) (7) (6) (3) (3) (11) (10) (245) (146) (401) (298)
(1) (1) (7) (6) (3) (3) (11) (10) (220) (71) (371) (220)
241 128 151 231 90 306 482 665 (664) (206) 950 (5,371)
— (17) — 6 — 15 — 4 99 121 (1) 306
66 52 41 55 33 (106) 140 1 (252) (71) 29 (1,827)
66 35 41 61 33 (91) 140 5 (153) 50 28 (1,521)
175 93 110 170 57 397 342 660 (511) (256) 922 (3,850)
157 164 154 180 — — 311 344 — — 1,299 1,425
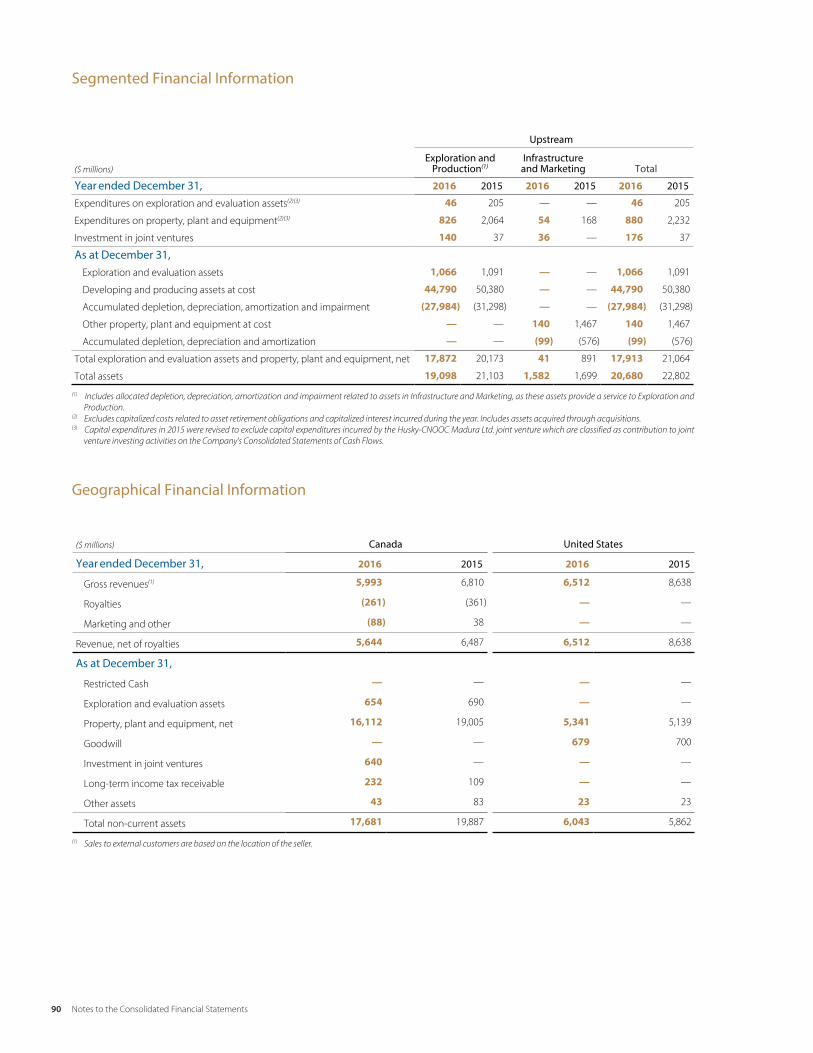
90 Notes to the Consolidated Financial StatementsConsolidated Financial Statements 11
Segmented Financial Information
Upstream
($ millions)Exploration and
Production(1)Infrastructure and Marketing Total
Year ended December 31, 2016 2015 2016 2015 2016 2015
Expenditures on exploration and evaluation assets(2)(3) 46 205 — — 46 205
Expenditures on property, plant and equipment(2)(3) 826 2,064 54 168 880 2,232
Investment in joint ventures 140 37 36 — 176 37
As at December 31,Exploration and evaluation assets 1,066 1,091 — — 1,066 1,091
Developing and producing assets at cost 44,790 50,380 — — 44,790 50,380
Accumulated depletion, depreciation, amortization and impairment (27,984) (31,298) — — (27,984) (31,298)
Other property, plant and equipment at cost — — 140 1,467 140 1,467
Accumulated depletion, depreciation and amortization — — (99) (576) (99) (576)
Total exploration and evaluation assets and property, plant and equipment, net 17,872 20,173 41 891 17,913 21,064
Total assets 19,098 21,103 1,582 1,699 20,680 22,802
(1) Includes allocated depletion, depreciation, amortization and impairment related to assets in Infrastructure and Marketing, as these assets provide a service to Exploration and Production.
(2) Excludes capitalized costs related to asset retirement obligations and capitalized interest incurred during the year. Includes assets acquired through acquisitions.(3) Capital expenditures in 2015 were revised to exclude capital expenditures incurred by the Husky-CNOOC Madura Ltd. joint venture which are classified as contribution to joint
venture investing activities on the Company's Consolidated Statements of Cash Flows.
Geographical Financial Information
($ millions) Canada United States
Year ended December 31, 2016 2015 2016 2015
Gross revenues(1) 5,993 6,810 6,512 8,638
Royalties (261) (361) — —
Marketing and other (88) 38 — —
Revenue, net of royalties 5,644 6,487 6,512 8,638
As at December 31,
Restricted Cash — — — —
Exploration and evaluation assets 654 690 — —
Property, plant and equipment, net 16,112 19,005 5,341 5,139
Goodwill — — 679 700
Investment in joint ventures 640 — — —
Long-term income tax receivable 232 109 — —
Other assets 43 83 23 23
Total non-current assets 17,681 19,887 6,043 5,862
(1) Sales to external customers are based on the location of the seller.

91Notes to the Consolidated Financial StatementsConsolidated Financial Statements 12
DownstreamCorporate and
Eliminations Total
UpgradingCanadian Refined
ProductsU.S. Refining
and Marketing Total
2016 2015 2016 2015 2016 2015 2016 2015 2016 2015 2016 2015
— — — — — — — — — — 46 205
51 46 52 30 623 425 726 501 53 67 1,659 2,800
— — — — — — — — — — 176 37
— — — — — — — — — — 1,066 1,091
— — — — — — — — — — 44,790 50,380
— — — — — — — — — — (27,984) (31,298)
2,367 2,313 2,500 2,438 7,897 7,435 12,764 12,186 1,011 957 13,915 14,610
(1,363) (1,260) (1,344) (1,245) (2,556) (2,296) (5,263) (4,801) (766) (681) (6,128) (6,058)
1,004 1,053 1,156 1,193 5,341 5,139 7,501 7,385 245 276 25,659 28,725
1,076 1,141 1,410 1,448 7,017 6,784 9,503 9,373 2,077 881 32,260 33,056
China Other International Total
2016 2015 2016 2015 2016 2015
807 1,315 — — 13,312 16,763
(44) (71) — — (305) (432)
— — — — (88) 38
763 1,244 — — 12,919 16,369
72 121 — — 72 121
407 394 5 7 1,066 1,091
3,139 3,490 1 — 24,593 27,634
— — — — 679 700
— — 488 359 1,128 359
— — — — 232 109
83 — 23 22 172 128
3,701 4,005 517 388 27,942 30,142
Consolidated Financial Statements 12
DownstreamCorporate and
Eliminations Total
UpgradingCanadian Refined
ProductsU.S. Refining
and Marketing Total
2016 2015 2016 2015 2016 2015 2016 2015 2016 2015 2016 2015
— — — — — — — — — — 46 205
51 46 52 30 623 425 726 501 53 67 1,659 2,800
— — — — — — — — — — 176 37
— — — — — — — — — — 1,066 1,091
— — — — — — — — — — 44,790 50,380
— — — — — — — — — — (27,984) (31,298)
2,367 2,313 2,500 2,438 7,897 7,435 12,764 12,186 1,011 957 13,915 14,610
(1,363) (1,260) (1,344) (1,245) (2,556) (2,296) (5,263) (4,801) (766) (681) (6,128) (6,058)
1,004 1,053 1,156 1,193 5,341 5,139 7,501 7,385 245 276 25,659 28,725
1,076 1,141 1,410 1,448 7,017 6,784 9,503 9,373 2,077 881 32,260 33,056
China Other International Total
2016 2015 2016 2015 2016 2015
807 1,315 — — 13,312 16,763
(44) (71) — — (305) (432)
— — — — (88) 38
763 1,244 — — 12,919 16,369
72 121 — — 72 121
407 394 5 7 1,066 1,091
3,139 3,490 1 — 24,593 27,634
— — — — 679 700
— — 488 359 1,128 359
— — — — 232 109
83 — 23 22 172 128
3,701 4,005 517 388 27,942 30,142
92 Notes to the Consolidated Financial Statements
Consolidated Financial Statements 13
Note 2 Basis of Presentation
a) Basis of Measurement and Statement of Compliance
The consolidated financial statements have been prepared by management on a historical cost basis with some exceptions, as detailed in the accounting policies set out below in accordance with International Financial Reporting Standards (“IFRS”), as issued by the International Accounting Standards Board (“IASB”). These accounting policies have been applied consistently for all periods presented in these consolidated financial statements.
These consolidated financial statements were approved and signed by the Chair of the Audit Committee and the Chief Executive Officer on February 23, 2017 having been duly authorized to do so by the Board of Directors.
Certain prior years’ amounts have been restated to conform with current presentation.
b) Principles of Consolidation
The consolidated financial statements include the accounts of Husky Energy Inc. and its subsidiaries. Subsidiaries are defined as any entities, including unincorporated entities such as partnerships, for which the Company has the power to govern their financial and operating policies to obtain benefits from their activities. Substantially all of the Company's Upstream activities are conducted jointly with third parties, and accordingly, the accounts reflect the Company's proportionate share of the assets, liabilities, revenues, expenses and cash flows from these activities. Intercompany balances, net earnings and unrealized gains and losses arising from intercompany transactions are eliminated in preparing the consolidated financial statements. A portion of the Company's activities relate to joint ventures (see Note 11), which are accounted for using the equity method.
c) Use of Estimates, Judgments and Assumptions
The timely preparation of the consolidated financial statements requires management to make estimates, judgments and assumptions that affect the reported amounts of assets and liabilities and disclosures of contingencies, if any, as at the date of the financial statements and the reported amounts of revenue and expenses during the period. Actual results may differ from these estimates, judgments and assumptions.
Estimates and underlying assumptions are reviewed on an ongoing basis. Revisions to accounting estimates are recognized in the period in which the estimates are revised and on a prospective basis. By their nature, estimates are subject to measurement uncertainty and changes in such estimates in future years could require a material change in the consolidated financial statements. These underlying assumptions are based on historical experience and other factors that management believes to be reasonable under the circumstances, and are subject to change as new events occur, as more industry experience is acquired, as additional information is obtained and as the Company's operating environment changes. Specifically, amounts recorded for depletion, depreciation, amortization and impairment, asset retirement obligations, assets and liabilities measured at fair value, employee future benefits, income taxes and estimates and reserves and contingencies are based on estimates.
Management makes judgments regarding the application of IFRS for each accounting policy. Critical judgments that have the most significant effect on the amounts recognized in the consolidated financial statements include determination of technical feasibility and commercial viability, impairment assessments, the determination of cash generating units (“CGUs”), changes in reserve estimates, the determination of a joint arrangement, the designation of the Company's functional currency and the fair value of related party transactions.
Significant estimates, judgments and assumptions made by management in the preparation of these consolidated financial statements are outlined in detail in Note 3.
d) Functional and Presentation Currency
The consolidated financial statements are presented in Canadian dollars, which is the Company's functional currency. All financial information is presented in millions of Canadian dollars, except per share amounts and unless otherwise stated.
The designation of the Company's functional currency is a management judgment based on the currency of the primary economic environment in which the Company operates.

93Notes to the Consolidated Financial Statements
Consolidated Financial Statements 14
Note 3 Significant Accounting Policies
a) Cash and Cash Equivalents
Cash and cash equivalents consist of cash on hand less outstanding cheques and deposits with an original maturity of less than three months at the time of purchase. When outstanding cheques are in excess of cash on hand and short-term deposits, and the Company has the ability to net settle, the excess is reported in bank operating loans.
Cash and cash equivalents held that are not available for use are classified as restricted cash. When restricted cash is not expected to be used within 12 months, it is classified as a non-current asset.
b) Inventories
Crude oil, natural gas, refined petroleum products and sulphur inventories are valued at the lower of cost or net realizable value. Cost is determined using average cost or on a first-in, first-out basis, as appropriate. Materials, parts and supplies are valued at the lower of average cost or net realizable value. Cost consists of raw material, labour, direct overhead, operating costs, transportation and depreciation, depletion and amortization. Commodity inventories held for trading purposes are carried at fair value and measured at fair value less costs to sell based on Level 2 observable inputs, refer to policy Note 3 (m). Any changes in commodity inventory fair value are included as gains or losses in marketing and other in the consolidated statements of income, during the period of change. Previous inventory impairment provisions are reversed when there is a change in the condition that caused the impairment and the inventory remains on hand. Unrealized intersegment net earnings on inventory sales are eliminated.
c) Precious Metals
The Company uses precious metals in conjunction with a catalyst as part of the downstream upgrading and refining processes. These precious metals remain intact; however, there is a loss during the reclamation process. The estimated loss is amortized to production and operating expenses over the period that the precious metal is in use, which is approximately two to five years. After the reclamation process, the actual loss is compared to the estimated loss and any difference is recognized in net earnings. Precious metals are included in other assets on the balance sheet.
d) Exploration and Evaluation Assets and Property, Plant and Equipment
i) CostOil and gas properties and other property, plant and equipment are recorded at cost, including expenditures that are directly attributable to the purchase or development of an asset. Borrowing costs directly attributable to the acquisition, construction or production of a qualifying asset are included in the asset cost. Capitalization ceases when substantially all activities necessary to prepare the qualifying asset for its intended use are complete.
ii) Exploration and evaluation costsThe accounting treatment of costs incurred for oil and natural gas exploration, evaluation and development is determined by the classification of the underlying activities as either exploratory or developmental. The results from an exploration drilling program can take considerable time to analyze, and the determination that commercial reserves have been discovered requires determination of technical feasibility, commercial viability and industry experience. Exploration activities can fluctuate from year to year, due to such factors as the level of exploratory spending, the level of risk sharing with third parties participating in exploratory drilling and the degree of risk associated with drilling in particular areas. Properties that are assumed to be productive may, over a period of time, actually deliver oil and gas in quantities different than originally estimated because of changes in reservoir performance.

94 Notes to the Consolidated Financial Statements
Consolidated Financial Statements 15
Costs incurred after the legal right to explore an area has been obtained and before technical feasibility and commercial viability of the area have been established are capitalized as exploration and evaluation assets. These costs include costs to acquire acreage and exploration rights, legal and other professional fees and land brokerage fees. Pre-license costs and geological and geophysical costs associated with exploration activities are expensed in the period incurred. Costs directly associated with an exploration well are initially capitalized as an exploration and evaluation asset until the drilling of the well is complete and the results have been evaluated. If extractable hydrocarbons are found and are likely to be developed commercially, but are subject to further appraisal activity, which may include the drilling of wells, the costs continue to be carried as an exploration and evaluation asset while sufficient and continued progress is made in assessing the commercial viability of the hydrocarbons. Capitalized exploration and evaluation costs or assets are not depreciated and are carried forward until technical feasibility and commercial viability of the area is determined or the assets are determined to be impaired. Management determines technical feasibility and commercial viability when exploration and evaluation assets are reclassified to property, plant and equipment. This decision considers several factors, including the existence of reserves, establishing commercial and technical feasibility and whether the asset can be developed using a proved development concept and has received internal approval. Upon the determination of technical feasibility and commercial viability, capitalized exploration and evaluation assets are then transferred to property, plant and equipment. All such carried costs are subject to technical, commercial and management review, as well as review for impairment indicators, at least every reporting period to confirm the continued intent to develop or otherwise extract value from the discovery. These costs are also tested for impairment when transferred to property, plant and equipment. Capitalized exploration and evaluation expenditures related to wells that do not find reserves, or where no future activity is planned, are expensed as exploration and evaluation expenses.
The application of the Company's accounting policy for exploration and evaluation costs requires judgment in determining whether it is likely that future economic benefit exists when activities have not reached a stage where technical feasibility and commercial viability can be reasonably determined. Judgments may change as new information becomes available.
iii) Development costs Expenditures, including borrowing costs, on the construction, installation and completion of infrastructure facilities, such as platforms, pipelines and the drilling of development wells, including unsuccessful development or delineation wells, are capitalized as oil and gas properties. Costs incurred to operate and maintain wells and equipment to lift oil and gas to the surface are expensed as production and operating expenses.
iv) Other property, plant and equipmentRepair and maintenance costs, other than major turnaround costs, are expensed as incurred. Major turnaround costs are capitalized as part of property, plant and equipment when incurred and are amortized over the estimated period of time to the anticipated date of the next turnaround.
v) Depletion, depreciation and amortizationOil and gas properties are depleted on a unit-of-production basis over the proved developed reserves of the particular field, except in the case of assets whose useful life is shorter or longer than the lifetime of the proved developed reserves of that field, in which case the straight-line method or a unit-of-production method based on total proved plus probable reserves is applied. The unit-of-production rate for the depletion of oil and gas properties related to total proved plus probable reserves takes into account expenditures incurred to date together with sanctioned future development expenditures required to develop the field.
Oil and gas reserves are evaluated internally and audited by independent qualified reserve engineers. The estimation of reserves is an inherently complex process and involves the exercise of professional judgment. Estimates are based on projected future rates of production, estimated commodity prices, engineering data and the timing of future expenditures, all of which are subject to uncertainty. Changes in reserve estimates can have an impact on reported net earnings through revisions to depletion, depreciation and amortization expense, in addition to determining possible impairments and reversal of impairments of property, plant and equipment.
Net reserves represent the Company's undivided gross working interest in total reserves after deducting crown, freehold and overriding royalty interests. Assumptions reflect market and regulatory conditions, as applicable, as at the balance sheet date and could differ significantly from other points in time throughout the year or future periods. Changes in market and regulatory conditions and assumptions can materially impact the estimation of net reserves.
Depreciation for substantially all other property, plant and equipment is provided using the straight-line method based on the estimated useful lives of assets, which range from five to forty-five years, less any estimated residual value. The useful lives of assets are estimated based upon the period the asset is expected to be available for use by the Company. Residual values are based upon the estimated amount that would be obtained on disposal, net of any costs associated with the disposal. Other property, plant and equipment held under finance leases are depreciated over the shorter of the lease term and the estimated useful life of the asset.

95Notes to the Consolidated Financial Statements
Consolidated Financial Statements 16
Depletion, depreciation and amortization rates for all capitalized costs associated with the Company's activities are reviewed at least annually, or when events or conditions occur that impact capitalized costs, reserves and estimated service lives.
vi) Finance LeasesFinance leases, which transfer substantially all of the risks and rewards incidental to ownership of the leased item to the Company, are capitalized at the commencement of the lease term at the fair value of the lease property or, if lower, at the present value of the minimum lease payments. Capitalized leased assets are depreciated over the shorter of the estimated useful life of the asset or the lease term.
All other leases are accounted for as operating leases and the lease costs are expensed as incurred.
e) Joint Arrangements
Joint arrangements represent activities where the Company has joint control established by a contractual agreement. Joint control requires unanimous consent for financial and operational decisions. A joint arrangement is either a joint operation, whereby the parties have rights to the assets and obligations for the liabilities, or a joint venture, whereby the parties have rights to the net assets.
For a joint operation, the consolidated financial statements include the Company's proportionate share of the assets, liabilities, revenues, expenses and cash flows of the joint arrangement. The Company reports items of a similar nature to those on the financial statements of the joint arrangement, on a line-by-line basis, from the date that joint control commences until the date that joint control ceases.
Joint ventures are accounted for using the equity method of accounting and recognized at cost and adjusted thereafter for the post-acquisition change in the Company's share of the joint venture’s net assets. The Company's consolidated financial statements include its share of the joint venture's profit or loss and other comprehensive income (“OCI”) included in investment in joint ventures, until the date that joint control ceases.
Classification of a joint arrangement as either joint operation or joint venture requires judgment. Management's considerations include, but are not limited to, determining if the arrangement is structured through a separate vehicle and whether the legal form and contractual arrangements give the entity direct rights to the assets and obligations for the liabilities within the normal course of business. Other facts and circumstances are also assessed by management, including the entity’s rights to the economic benefits of assets and its involvement and responsibility for settling liabilities associated with the arrangement.
f) Investments in Associates
An associate is an entity for which the Company has significant influence and thereby has the power to participate in the financial and operational decisions but does not control or jointly control the investee. Investments in associates are accounted for using the equity method of accounting and are recognized at cost and adjusted thereafter for the post-acquisition change in the Company's share of the investee’s net assets. The Company's consolidated financial statements include its share of the investee’s profit or loss and OCI until the date that significant influence ceases.
g) Business Combinations
Business combinations are accounted for using the acquisition method. Determining whether an acquisition meets the definition of a business combination or represents an asset purchase requires judgment on a case-by-case basis. If the acquisition meets the definition of a business combination, the assets and liabilities are recognized based on the contractual terms, economic conditions, the Company's operating and accounting policies and other factors that exist on the acquisition date, which is the date on which control is transferred to the Company. The identifiable assets and liabilities are measured at their fair values on the acquisition date with limited exceptions. Any additional consideration payable, contingent upon the occurrence of a future event, is recognized at fair value on the acquisition date; subsequent changes in the fair value of the liability are recognized in net earnings. Acquisition costs incurred are expensed and included in other – net in the consolidated statements of income.

96 Notes to the Consolidated Financial Statements
Consolidated Financial Statements 17
h) Goodwill
Goodwill is the excess of the purchase price paid over the recognized amount of net assets acquired through business combinations, which is inherently imprecise as judgment is required in the determination of the fair value of assets and liabilities. Goodwill, which is not amortized, is assigned to appropriate CGUs or groups of CGUs. Goodwill is tested for impairment annually and when circumstances indicate that the carrying value may be impaired. Impairment losses are recognized in net earnings and are not subject to reversal. On the disposal or termination of a previously acquired business, any remaining balance of associated goodwill is included in the determination of the gain or loss on disposal.
i) Impairment and Reversals of Impairment on Non-Financial Assets
The carrying amounts of the Company's non-financial assets, other than inventories and deferred tax assets, are reviewed at the end of each reporting period to determine whether there is an indication of impairment. If such indication exists, the recoverable amount is estimated.
Determining whether there are any indications of impairment or impairment reversals requires significant judgment of external factors, such as an extended decrease in prices or margins for oil and gas commodities or products, a significant decline in an asset's market value, a significant downward revision of estimated volumes, an upward revision of future development costs, a decline in the entity's market capitalization or significant changes in the technological, market, economic or legal environment that would have an adverse impact on the Company's CGUs. If any indication of impairment or impairment reversals exist, an estimate of the asset's recoverable amount is calculated as the higher of the fair value less costs to sell (“FVLCS”) and the asset's value in use (“VIU”) for an individual asset or CGU. If the asset does not generate cash inflows that are largely independent of those from other assets or groups of assets, the asset is tested as part of a CGU, which is the smallest identifiable group of assets, liabilities and associated goodwill that generates cash inflows that are largely independent of the cash inflows from other assets or groups of assets. Determination of the Company's CGUs is subject to management's judgment.
FVLCS is the amount that would be obtained from the sale of a CGU in an arm's length transaction between knowledgeable and willing parties. The FVLCS is generally determined as the net present value of the estimated future cash flows expected to arise from a CGU, including any expansion prospects, and its eventual disposal, using assumptions that an independent market participant may take into account. These cash flows are discounted using a rate that would be applied by a market participant to arrive at a net present value of the CGU.
VIU is the net present value of the estimated future cash flows expected to arise from the continued use of the asset in its present form and its eventual disposal. VIU is determined by applying assumptions specific to the Company's continued use and can only take into account sanctioned future development costs. Estimates of future cash flows used in the evaluation of impairment of assets are made using management's forecasts of commodity prices, operating costs and future capital expenditures, forecasted crack spreads, growth rate, discount rate and, in the case of oil and gas properties, expected production volumes. Expected production volumes take into account assessments of field reservoir performance and include expectations about proved and probable volumes and where applicable economically recoverable resources associated with interests in certain Husky properties which are risk-weighted utilizing geological, production, recovery, market price and economic projections. Either the cash flow estimates or the discount rate is risk-adjusted to reflect local conditions as appropriate.
Given that the calculations for recoverable amounts require the use of estimates and assumptions, including forecasts of commodity prices, marketing supply and demand, product margins and in the case of oil and gas properties, expected production volumes, it is possible that the assumptions may change, which may impact the estimated life of the CGU and may require a material adjustment to the carrying value of goodwill and non-financial assets.
An impairment loss is recognized if the carrying amount of an asset or its CGU exceeds its estimated recoverable amount. Impairment losses recognized with respect to CGUs are allocated first to reduce the carrying amount of any goodwill allocated to the units and then to reduce the carrying amounts of the other assets in the CGU or group of CGUs on a pro rata basis. Impairment losses are recognized in depletion, depreciation, amortization and impairment in the consolidated statements of income (loss).
Impairment losses recognized for other assets in prior years are assessed at the end of each reporting period for indications that the impairment has decreased or no longer exists. An impairment loss is reversed only to the extent that the carrying amount of the asset or CGU does not exceed the carrying amount that would have been determined, net of depletion, depreciation and amortization, if no impairment loss had been recognized.

97Notes to the Consolidated Financial Statements
Consolidated Financial Statements 18
j) Asset Retirement Obligations (“ARO”)
A liability is recognized for future legal or constructive retirement obligations associated with the Company's assets. The Company has significant obligations to remove tangible assets and restore land after operations cease and the Company retires or relinquishes the asset. The retirement of Upstream and Downstream assets consists primarily of plugging and abandoning wells, abandoning surface and subsea plant and equipment and facilities and restoring land to a state required by regulation or contract. The amount recognized is the net present value of the estimated future expenditures determined in accordance with local conditions, current technology and current regulatory requirements. The obligation is calculated using the current estimated costs to retire the asset inflated to the estimated retirement date and then discounted using a credit-adjusted risk-free discount rate. The liability is recorded in the period in which an obligation arises with a corresponding increase to the carrying value of the related asset. The liability is progressively accreted over time as the effect of discounting unwinds, creating an expense recognized in finance expenses. The costs capitalized to the related assets are amortized in a manner consistent with the depletion, depreciation and amortization of the underlying assets. Actual retirement expenditures are charged against the accumulated liability as incurred.
Liabilities for ARO are adjusted every reporting period for changes in estimates. These adjustments are accounted for as a change in the corresponding capitalized cost, except where a reduction in the provision is greater than the undepreciated capitalized cost of the related assets, in which case the capitalized cost is reduced to nil and the remaining adjustment is recognized in net earnings. Changes to the amount of capitalized costs will result in an adjustment to future depletion, depreciation and amortization, and to finance expenses.
Estimating the ARO requires significant judgment as restoration technologies and costs are constantly changing, as are regulatory, political, environmental and safety considerations. Inherent in the calculation of the ARO are numerous assumptions including the ultimate settlement amounts, future third-party pricing, inflation factors, risk-free discount rates, credit risk, timing of settlement and changes in the legal, regulatory, environmental and political environments. Future revisions to these assumptions may result in material changes to the ARO liability. Adjustments to the estimated amounts and timing of future ARO cash flows are a regular occurrence in light of the significant judgments and estimates involved.
k) Legal and Other Contingent Matters
Provisions and liabilities for legal and other contingent matters are recognized in the period when the circumstance becomes probable that a future cash outflow resulting from past operations or events will occur and the amount of the cash outflow can be reasonably estimated. The timing of recognition and measurement of the provision requires the application of judgment to existing facts and circumstances, which can be subject to change, and the carrying amounts of provisions and liabilities are reviewed regularly and adjusted accordingly. The Company is required to both determine whether a loss is probable based on judgment and interpretation of laws and regulations, and determine that the loss can be reasonably estimated. When a loss is recognized, it is charged to net earnings. The Company continually monitors known and potential contingent matters and makes appropriate disclosure and provisions when warranted by the circumstances present.
l) Share Capital
Preferred shares are classified as equity since they are cancellable and redeemable only at the Company's option and dividends are discretionary and payable only if declared by the Board of Directors. Incremental costs directly attributable to the issuance of shares and stock options are recognized as a deduction from equity, net of tax. Common share dividends are paid out in common shares, or in cash, and preferred share dividends are paid in cash. Both common and preferred share dividends are recognized as distributions within equity.
m) Financial Instruments
Financial instruments are any contracts that give rise to a financial asset of one entity and a financial liability or equity instrument of another entity. Financial instruments are initially recognized at fair value, and subsequently measured based on classification in one of the following categories: loans and receivables, held to maturity investments, other financial liabilities, fair value through profit or loss (“FVTPL”) or available-for-sale (”AFS”) financial assets.
Financial instruments classified as FVTPL or AFS are measured at fair value at each reporting date; any transaction costs associated with these types of instruments are expensed as incurred. Unrealized gains and losses on AFS financial assets are recognized in OCI (see policy note o) and transferred to net earnings when the asset is derecognized. Unrealized gains and losses on FVTPL financial instruments related to trading activities are recognized in marketing and other in the consolidated statements of income, and unrealized gains and losses on all other FVTPL financial instruments are recognized in other – net.
98 Notes to the Consolidated Financial Statements
Consolidated Financial Statements 19
Financial instruments classified as loans or receivables, held to maturity investments and other financial liabilities are initially measured at fair value and subsequently carried at amortized cost using the effective interest rate method. Transaction costs that are directly attributable to the acquisition or issue of a financial instrument are measured at amortized cost and added to the fair value initially recognized.
Financial instruments subsequently revalued at fair value are further categorized using a three-level hierarchy that reflects the significance of the inputs used in determining fair value. Level 1 fair value is determined by reference to quoted prices in active markets for identical assets and liabilities. Level 2 fair value is based on inputs that are independently observable for similar assets or liabilities. Level 3 fair value is not based on independently observable market data. The disclosure of the fair value hierarchy excludes financial assets and liabilities where book value approximates fair value.
n) Derivative Instruments and Hedging Activities
Derivatives are financial instruments for which the fair value changes in response to market risks, require little or no initial investment and are settled at a future date. Derivative instruments are utilized by the Company to manage various market risks including volatility in commodity prices, foreign exchange rates and interest rate exposures. The Company's policy is not to utilize derivative instruments for speculative purposes. The Company may enter into swap and other derivative transactions to hedge or mitigate the Company's commercial risk, including derivatives that reduce risks that arise in the ordinary course of the Company's business. The Company may choose to apply hedge accounting to derivative instruments.
The fair values of derivatives are determined using valuation models that require assumptions concerning the amount and timing of future cash flows and discount rates. These estimates are also subject to change with fluctuations in commodity prices, interest rates, foreign currency exchange rates and estimates of non-performance. The actual settlement of a derivative instrument could differ materially from the fair value recorded and could impact future results.
i) Derivative InstrumentsAll derivative instruments, other than those designated as effective hedging instruments or certain non-financial derivative contracts that meet the Company's own use requirements, are classified as held for trading and are recorded at fair value. Gains and losses on these instruments are recorded in the consolidated statements of income in the period they occur.
The Company may enter into commodity price contracts in order to offset fixed or floating prices with market rates to manage exposures to fluctuations in commodity prices. The estimation of the fair value of commodity derivatives incorporates forward prices and adjustments for quality or location. The related inventory is measured at fair value based on exit prices. Gains and losses from these derivative contracts, which are not designated as effective hedging instruments, are recognized in revenues or purchases of crude oil and products and are initially recorded at settlement date. Derivative instruments that have been designated as effective hedging instruments are further classified as either fair value or cash flow hedges (see “Hedging Activities”).
ii) Embedded DerivativesDerivatives embedded in a host contract are recorded separately when the economic characteristics and risks of the embedded derivative are not clearly and closely related to those of the host contract and the host contract is not measured at FVTPL. The definition of an embedded derivative is the same as freestanding derivatives. Embedded derivatives are measured at fair value with gains and losses recognized in net earnings.
iii) Hedging ActivitiesAt the inception of a derivative transaction, if the Company elects to use hedge accounting, formal designation and documentation is required. The documentation must include: identification of the hedged item or transaction, the hedging instrument, the nature of the risk being hedged, the Company’s risk management objective and strategy for undertaking the hedge and how the Company will assess the hedging instrument’s effectiveness in offsetting the exposure to changes in the hedged item.
A hedge is assessed at inception and at the end of each reporting period to ensure that it is highly effective in offsetting changes in fair values or cash flows of the hedged item. For a fair value hedge, the gain or loss from remeasuring the hedging instrument at fair value is recognized immediately in net earnings with the offsetting gain or loss on the hedged item. When fair value hedge accounting is discontinued, the carrying amount of the hedging instrument is deferred and amortized to net earnings over the remaining maturity of the hedged item.
For a cash flow hedge, the effective portion of the gain or loss is recorded in OCI. Any hedge or portion of a hedge that is ineffective is immediately recognized in net earnings. Hedge accounting is discontinued on a prospective basis when the hedging relationship no longer qualifies for hedge accounting. Any gain or loss on the hedging instrument resulting from the discontinuation of a cash flow hedge is deferred in OCI until the forecasted transaction date. If the forecasted transaction date is no longer expected to occur, the gain or loss is recognized in net earnings in the period of discontinuation.

99Notes to the Consolidated Financial Statements
Consolidated Financial Statements 20
A net investment hedge of a foreign operation is accounted for similarly to a cash flow hedge. The Company may designate certain U.S. dollar denominated debt as a hedge of its net investment in foreign operations for which the U.S. dollar is the functional currency. The unrealized foreign exchange gains and losses arising from the translation of the debt are recorded in OCI, net of tax, and are limited to the translation gain or loss on the net investment.
o) Comprehensive Income
Comprehensive income consists of net earnings and OCI. OCI is comprised of the change in the fair value of the effective portion of the derivatives used as hedging items in a cash flow hedge or net investment hedge, the unrealized gains and losses on AFS financial assets, the exchange gains and losses arising from the translation of foreign operations with a functional currency that is not Canadian dollars and the actuarial gains and losses on defined benefit pension plans. Amounts included in OCI are shown net of tax. Other reserves is an equity category comprised of the cumulative amounts of OCI, relating to foreign currency translation and hedging.
p) Impairment of Financial Assets
A financial asset is assessed at the end of each reporting period to determine whether it is impaired, based on objective evidence indicating that one or more events have had a negative effect on the estimated future cash flows of that asset. Objective evidence used by the Company to assess impairment of financial assets includes quoted market prices for similar financial assets and historical collection rates for loans and receivables.
An impairment loss with respect to a financial asset measured at amortized cost is calculated as the difference between its carrying amount and the net present value of the estimated future cash flows discounted at the original effective interest rate. A revaluation with respect to an AFS financial asset is calculated by reference to its fair value and any amounts in OCI are transferred to net earnings.
Significant financial assets are tested for impairment on an individual basis. The remaining financial assets are assessed collectively in groups that share similar credit risk characteristics.
All impairment losses are recognized in net earnings. An impairment loss is reversed if the reversal can be related objectively to an event occurring after the impairment loss was recognized.
Given that the calculations for the net present value of estimated future cash flows related to derivative financial assets require the use of estimates and assumptions, including forecasts of commodity prices, marketing supply and demand, product margins and expected production volumes, it is possible that the assumptions may change, which may require a material adjustment to the carrying value of financial assets.
q) Pensions and Other Post-employment Benefits
In Canada, the Company provides a defined contribution pension plan and other post-retirement benefits to qualified employees. The Company also maintains a defined benefit pension plan for a small number of employees who did not choose to join the defined contribution pension plan in 1991. In the United States, the Company provides two defined contribution pension plans (401(k)) and one other post-retirement benefits plan.
The cost of the pension benefits earned by employees in the defined contribution pension plans is expensed as incurred. The cost of the benefits earned by employees in the defined benefit pension plans is determined using the projected unit credit funding method. Actuarial gains and losses are recognized in retained earnings as incurred.
The defined benefit asset or liability is comprised of the fair value of plan assets from which the obligations are to be settled and the present value of the defined benefit obligation. Plan assets are measured at fair value based on the closing bid price when there is a quoted price in an active market. Plan assets are assets that are held by a long-term employee benefit fund or qualifying insurance policies. Plan assets are not available to the Company's creditors. The value of any defined benefit asset is restricted to the sum of any past service costs and the present value of refunds from and reductions in future contributions to the plan. Defined benefit obligations are estimated by discounting expected future payments using the year-end market rate of interest for high-quality corporate debt instruments with cash flows that match the timing and amount of expected benefit payments.
Post-retirement medical benefits are also provided to qualifying retirees. In some cases the benefits are provided through medical care plans to which the Company, the employees, the retirees and covered family members contribute. In some plans there is no funding of the benefits before retirement. These plans are recognized on the same basis as described above for the defined benefit pension plan.

100 Notes to the Consolidated Financial Statements
Consolidated Financial Statements 21
The determination of the cost of the defined benefit pension plan and the other post-retirement benefit plans reflects a number of assumptions that affect the expected future benefit payments. The valuation of these plans is prepared by an independent actuary engaged by the Company. These assumptions include, but are not limited to, the estimate of expected plan investment performance, salary escalation, retirement age, attrition, future health care costs and mortality. The fair value of the plan assets is used for the purposes of calculating the expected return on plan assets.
The assumptions for each country are reviewed each year and are adjusted where necessary to reflect changes in fund experience and actuarial recommendations. Mortality rates are based on the latest available standard mortality tables for the individual countries concerned. The rate of return on pension plan assets is based on a projection of real long-term bond yields and an equity risk premium, which are combined with local inflation assumptions and applied to the actual asset mix of each plan. The amount of the expected return on plan assets is calculated using the expected rate of return for the year and the fair value of assets at the beginning of the year. Future salary increases are based on expected future inflation rates for the individual countries.
r) Income Taxes
Current income tax is recognized in net earnings in the period unless it relates to items recognized directly to equity, including OCI, in which case the deferred income tax is also recorded in equity. Management periodically evaluates positions taken in the Company's tax returns with respect to situations in which applicable tax regulations are subject to interpretation and reassessment and establishes provisions where appropriate.
Deferred tax is measured using the liability method on temporary differences at the reporting date between the tax bases of assets and liabilities and their carrying amounts for financial reporting purposes.
Deferred tax assets and liabilities are recognized at expected tax rates in effect in the year when the asset is expected to be realized or the liability settled, based on tax rates and tax laws that have been enacted or substantively enacted at the reporting date. Deferred income tax balances are adjusted to reflect changes in income tax rates that are substantively enacted with the adjustment being recognized in net earnings in the period that the change occurs unless it relates to items recognized directly to equity, including OCI, in which case the deferred income tax is also recorded in equity. Deferred tax assets and deferred tax liabilities are offset if a legally enforceable right exists to set off current tax assets against current income tax liabilities and the deferred taxes relate to the same taxable entity and the same taxation authority.
The determination of the Company's income and other tax liabilities requires interpretation of complex laws and regulations often involving multiple jurisdictions. Estimates that require significant judgments are also made with respect to the timing of temporary difference reversals, the realizability of tax assets and in circumstances where the transaction and calculations for which the ultimate tax determination are uncertain. All tax filings are subject to audit and potential reassessment after the lapse of considerable time. Accordingly, the actual income tax liability may differ significantly from that estimated and recorded by management.
s) Asset Exchange Transactions
Asset exchange transactions are measured at cost if the transaction lacks commercial substance or the fair value of neither the asset received nor the asset given up is reliably measurable. Otherwise, asset exchange transactions are measured at the fair value of the asset given up, unless the fair value of the asset received is more clearly evident. If the acquired item is not measured at fair value, its cost is measured at the carrying amount of the asset given up. Gains and losses are recorded in other – net in the consolidated statements of income in the period they occur.
t) Revenue Recognition
Revenue from the sale of goods is recognized when the significant risks and rewards of ownership have passed to the buyer and it can be reliably measured. Revenues associated with the sale of crude oil, natural gas, natural gas liquids, synthetic crude oil, purchased commodities and refined petroleum products are recognized when the title passes to the customer. Revenues associated with the sale of transportation, processing and natural gas storage services are recognized when the services are provided.
Under take or pay contracts, the Company makes a long-term supply commitment in return for a commitment from the buyer to pay for minimum quantities, whether or not the customer takes delivery. If a buyer has a right to get a “make-up” delivery at a later date, revenue is deferred and recognized only when the product is delivered or the make-up product can no longer be taken. If no such option exists within the contractual terms, revenue is recognized when the take-or-pay penalty is triggered.

101Notes to the Consolidated Financial Statements
Consolidated Financial Statements 22
Revenue is measured at the fair value of the consideration received or receivable and represents amounts receivable for goods or services provided in the normal course of business, net of discounts, customs duties and sales taxes. Crude oil and natural gas sold below or above the Company’s working interest share of production results in production underlifts or overlifts. Underlifts are recorded as a receivable at cost with a corresponding decrease to production and operating expense, while overlifts are recorded as a payable at fair value with a corresponding increase to production and operating expense.
Physical exchanges of inventory are reported on a net basis for swaps of similar items, as are sales and purchases made with a common counterparty as part of an arrangement similar to a physical exchange.
Finance income is recognized as the interest accrues using the effective interest rate, which is the rate that exactly discounts estimated future cash receipts through the expected life of the financial instrument to the net carrying amount of the financial asset.
u) Foreign Currency
Functional currency is the currency of the primary economic environment in which the Company and its subsidiaries operate and is normally the currency in which the entity primarily generates and expends cash. The financial statements of Husky's subsidiaries are translated into Canadian dollars, which is the presentation and functional currency of the Company. The assets and liabilities of subsidiaries whose functional currencies are other than Canadian dollars are translated into Canadian dollars at the foreign exchange rate at the balance sheet date, while revenues and expenses of such subsidiaries are translated using average monthly foreign exchange rates, which approximate the foreign exchange rates on the dates of the transactions. Foreign exchange differences arising on translation are included in OCI.
The Company's transactions in foreign currencies are translated to the appropriate functional currency at the foreign exchange rate on the dates of the transactions. Monetary assets and liabilities denominated in foreign currencies are translated to the functional currency at the foreign exchange rate at the balance sheet date and differences arising on translation are recognized in net earnings. Non-monetary assets that are measured in terms of historical cost in a foreign currency are translated using the exchange rate at the dates of the transactions.
v) Share-based Payments
In accordance with the Company's stock option plan, stock options to acquire common shares may be granted to officers and certain other employees. The Company records compensation expense over the vesting period based on the fair value of options granted. Compensation expense is recorded in net earnings as part of selling, general and administrative expenses.
The Company's stock option plan is a tandem plan that provides the stock option holder with the right to exercise the stock option or surrender the option for a cash payment. A liability for the stock options is accrued over their vesting period and measured at fair value using the Black-Scholes option pricing model. The liability is revalued each reporting period until it is settled to reflect changes in the fair value of the options. The net change is recognized in net earnings. When stock options are surrendered for cash, the cash settlement paid reduces the outstanding liability. When stock options are exercised for common shares, consideration paid by the stock option holders and the previously recognized liability associated with the stock options are recorded as share capital.
The Company's Performance Share Unit Plan provides a time-vested award to certain officers and employees of the Company. Performance Share Units (“PSU”) entitle participants to receive cash based on the Company's share price at the time of vesting. The amount of cash payment is contingent on the Company's total shareholder return relative to a peer group of companies and achieving a return on capital in use (”ROCIU”) target. ROCIU equals net earnings plus after tax interest expense divided by the two-year average capital employed, less any capital invested in assets that are not in use. Net earnings is adjusted for the difference between actual realized and budgeted commodity prices and foreign exchange rates and other actual and budgeted exceptional items. A liability for expected cash payments is accrued over the vesting period of the PSUs and is revalued at each reporting date based on the market price of the Company's common shares and the expected vesting percentage. Upon vesting, a cash payment is made to the participants and the outstanding liability is reduced by the payment amount.

102 Notes to the Consolidated Financial Statements
Consolidated Financial Statements 23
w) Earnings per Share
The number of basic common shares outstanding is the weighted average number of common shares outstanding for each period. Shares issued during the period are included in the weighted average number of shares from the date consideration is receivable. The calculation of basic earnings per common share is based on net earnings attributable to common shareholders divided by the weighted average number of common shares outstanding.
The number of diluted common shares outstanding is calculated using the treasury stock method, which assumes that any proceeds received from in-the-money stock options would be used to buy back common shares at the average market price for the period. The calculation of diluted earnings per share is based on net earnings attributable to common shareholders divided by the weighted average number of common shares outstanding adjusted for the effects of all potential dilutive common share issuances, which are comprised of common shares issuable upon exercise of stock options granted to employees. Stock options granted to employees provide the holder with the ability to settle in cash or equity. For the purposes of the diluted earnings per share calculation, the Company must adjust the numerator for the more dilutive effect of cash-settlement versus equity-settlement despite how the stock options are accounted for in net earnings. As a result, net earnings reported based on accounting of cash-settled stock options may be adjusted for the results of equity-settlements for the purposes of determining the numerator for the diluted earnings per share calculation.
x) Government Grants
Government grants are recognized when there is reasonable assurance that the grant will be received and all attached conditions will be complied with. If a grant is received but reasonable assurance and compliance with conditions is not achieved, the grant is recognized as a deferred liability until such conditions are fulfilled. When the grant relates to an expense item, it is recognized as income in the period in which the costs are incurred. Where the grant relates to an asset, it is recognized as a reduction to the net book value of the related asset and recognized in net earnings in equal amounts over the expected useful life of the related asset through lower depletion, depreciation and amortization.
y) Related Party Judgments and Estimates
The Company entered into transactions and agreements in the normal course of business with certain related parties, joint arrangements and associates. These transactions are on terms equivalent to those that prevail in arm’s length transactions, unless otherwise noted. Proceeds for disposition of assets to related parties are recognized at fair value, based on discounted cash flow forecast from those assets. Independent opinions of the fair value may be obtained. Changes in the assumptions used to determine these fair values may result in a material difference in the proceeds and any gain or loss on disposition. See Note 25.
z) Recent Accounting Standards
The Company has not early adopted any standard, interpretation or amendment that has been issued but is not yet effective.
LeasesIn January 2016, the IASB issued IFRS 16 Leases, which replaces the current IFRS guidance on leases. Under the current guidance, lessees are required to determine if the lease is a finance or operating lease, based on specified criteria. Finance leases are recognized on the balance sheet, while operating leases are recognized in the Consolidated Statements of Income (Loss) when the expense is incurred. Under IFRS 16, lessees must recognize a lease liability and a right-of-use asset for virtually all lease contracts. The recognition of the present value of minimum lease payments for certain contracts currently classified as operating leases will result in increases to assets, liabilities, depletion, depreciation and amortization, and finance expense, and a decrease to production, operating and transportation expense upon implementation. An optional exemption to not recognize certain short-term leases and leases of low value can be applied by lessees. For lessors, the accounting remains essentially unchanged. The standard will be effective for annual periods beginning on or after January 1, 2019. Early adoption is permitted, provided IFRS 15 Revenue from Contracts with Customers, has been applied, or is applied at the same date as IFRS 16. The Company is currently evaluating the dollar impact of adopting IFRS 16 on the Company’s consolidated financial statements.
Revenue from Contracts with Customers In September 2015, the IASB published an amendment to IFRS 15, deferring the effective date of the standard by one year to annual periods beginning on or after January 1, 2018. IFRS 15 replaces existing revenue recognition guidance with a single comprehensive accounting model. The standard requires an entity to recognize revenue to reflect the transfer of goods and services for the amount it expects to receive, when control is transferred to the purchaser. Early adoption is permitted. The Company is currently in the scoping phase of implementation. Adopting IFRS 15 is not expected to have a material impact on the Company's consolidated financial statements.
103Notes to the Consolidated Financial Statements
Consolidated Financial Statements 24
Financial InstrumentsIn July 2014, the IASB issued IFRS 9, “Financial Instruments” to replace IAS 39, which provides a single model for classification and measurement based on how an entity manages its financial instruments in the context of its business model and the contractual cash flow characteristics of the financial instruments. For financial liabilities, the change in fair value resulting from an entity’s own credit risk is recorded in OCI rather than net earnings, unless this creates an accounting mismatch. IFRS 9 includes a new, forward-looking ‘expected loss’ impairment model that will result in more timely recognition of expected credit losses. In addition, IFRS 9 provides a substantially-reformed approach to hedge accounting. The standard is effective for annual periods beginning on or after January 1, 2018, with required retrospective application and early adoption permitted. The Company intends to retrospectively adopt the standard on January 1, 2018. The adoption of IFRS 9 is not expected to have a material impact on the Company's consolidated financial statements.
Amendments to IAS 7 Statement of Cash FlowsIn January 2016, the IASB issued amendments to IAS 7 to be applied prospectively for annual periods beginning on or after January 1, 2017 with early adoption permitted. The amendments require disclosure of information enabling users of financial statements to evaluate changes in liabilities arising from financing activities. The adoption of the IAS 7 amendments will require additional disclosure in the Company’s consolidated financial statements.
Amendments to IFRS 2 Share-based PaymentIn June 2016, the IASB issued amendments to IFRS 2 to be applied prospectively for annual periods beginning on or after January 1, 2018 with early adoption permitted. The amendments clarify how to account for certain types of share-based payment transactions. The adoption of the amendments is not expected to have a material impact on the Company’s consolidated financial statements.
aa) Change in Accounting Policy
The Company has applied the following amendments to accounting standards issued by the IASB for the first time for the annual reporting period commencing January 1, 2016:
Amendments to IAS 1 Presentation of Financial StatementsThe amendments clarify guidance on materiality and aggregation, use of subtotals, aggregation and disaggregation of financial statement line items, the order of the notes to the financial statements and disclosure of significant accounting policies. The adoption of this amended standard had no material impact on the Company’s consolidated financial statements.
Amendments to IFRS 7 Financial Instrument: DisclosuresThe amendments clarify:• Whether a servicing contract is continuing involvement in a transferred asset for the purpose of determining the disclosures
required; and• The applicability of the amendments to IFRS 7 on offsetting disclosures to condensed interim financial statements.The adoption of this amended standard had no material impact on the Company's consolidated financial statements.

104 Notes to the Consolidated Financial Statements
Consolidated Financial Statements 25
Note 4 Cash and Cash Equivalents
Cash and cash equivalents at December 31, 2016 included $271 million of cash (December 31, 2015 – $68 million) and $1,048 millionof short-term investments with original maturities less than three months at the time of purchase (December 31, 2015 – $2 million ).
Note 5 Accounts Receivable
Accounts Receivable($ millions) December 31, 2016 December 31, 2015
Trade receivables 1,019 962
Allowance for doubtful accounts (32) (31)
Derivatives due within one year 9 59
Other 40 24
End of year 1,036 1,014
Note 6 Inventories
Inventories($ millions) December 31, 2016 December 31, 2015
Crude oil, natural gas and sulphur 523 536
Refined petroleum products 433 257
Trading inventories measured at fair value less costs to sell 399 257
Materials, supplies and other 203 197
End of year 1,558 1,247
Impairment of inventory to net realizable value for the year ended December 31, 2016 was $9 million (December 31, 2015 – $22 million).
Trading inventories measured at fair value less costs to sell consist of natural gas inventories and crude oil inventories. The fair value measurement incorporates exit commodity prices and adjustments for quality and location. Refer to Note 24.
Note 7 Restricted Cash
In accordance with the provisions of the regulations of the People’s Republic of China, the Company is required to deposit funds into separate accounts restricted to the funding of future asset retirement obligations in the Asia Pacific Region. As at December 31, 2016, the Company had deposited funds of $156 million (2015 – $121 million) into the restricted cash account, of which $84 million relates to the Wenchang field and have been classified as current and the remaining balance of $72 million have been classified as non-current.

105Notes to the Consolidated Financial Statements
Consolidated Financial Statements 26
Note 8 Exploration and Evaluation Costs
Exploration and Evaluation Assets($ millions) 2016 2015
Beginning of year 1,091 1,149
Additions 95 227
Disposals (6) —
Transfers to oil and gas properties (note 9) (18) (97)
Expensed exploration expenditures previously capitalized (86) (242)
Exchange adjustments (10) 54
End of year 1,066 1,091
During 2016, the $86 million in expensed exploration expenditures previously capitalized primarily relates to two unsuccessful exploration wells in the Atlantic Region and a decision by management to not pursue further evaluation of certain Oil Sands assets at this time, due to them being uneconomic under current and long term commodity prices.
The following exploration and evaluation expenses for the years ended December 31, 2016 and 2015 relate to activities associated with the exploration for and evaluation of crude oil and natural gas resources and were recorded in the Upstream Exploration and Production business.
Exploration and Evaluation Expense Summary($ millions) 2016 2015
Seismic, geological and geophysical 78 103
Expensed drilling 66 297
Expensed land 44 47
188 447
During 2015, $48 million of the $297 million in total expensed drilling was recorded as an exploration and evaluation expense due to unfulfilled work commitment penalties in Western Canada resulting from management's plan to withdraw from further exploration and evaluation due to lower estimated short and long-term crude oil and natural gas prices.

106 Notes to the Consolidated Financial Statements
Consolidated Financial Statements 27
Note 9 Property, Plant and Equipment
Property, Plant and EquipmentOil and Gas
Properties
Processing,Transportation
and Storage Upgrading RefiningRetail and
Other Total($ millions)
Cost
December 31, 2014 47,974 1,296 2,274 6,561 2,632 60,737
Additions 2,128 173 46 452 76 2,875
Acquisitions 57 — — — — 57
Transfers from exploration and evaluation (note 8) 97 — — — — 97
Intersegment transfers 6 (6) — — — —
Changes in asset retirement obligations (note 16) (107) — (7) (5) (18) (137)
Disposals and derecognition (487) — — (24) (4) (515)
Exchange adjustments 720 2 — 1,152 2 1,876
December 31, 2015 50,388 1,465 2,313 8,136 2,688 64,990
Additions 818 55 51 712 61 1,697
Acquisitions 67 — — — — 67
Transfers from exploration and evaluation (note 8) 18 — — — — 18
Changes in asset retirement obligations (note 16) 231 — 3 11 9 254
Disposals and derecognition (6,590) (1,383) — — (3) (7,976)
Exchange adjustments (131) — — (214) — (345)
December 31, 2016 44,801 137 2,367 8,645 2,755 58,705
Accumulated depletion, depreciation, amortization and impairment
December 31, 2014 (23,687) (527) (1,154) (1,988) (1,394) (28,750)
Depletion, depreciation, amortization and impairment (7,811) (48) (106) (365) (154) (8,484)
Intersegment transfers (2) 2 — — — —
Disposals and derecognition 370 — — 18 2 390
Exchange adjustments (170) (1) — (341) — (512)
December 31, 2015 (31,300) (574) (1,260) (2,676) (1,546) (37,356)
Depletion, depreciation, amortization and impairment (1,806) (23) (103) (380) (150) (2,462)
Disposals and derecognition 5,082 501 — 13 4 5,600
Exchange adjustments 38 — — 68 — 106
December 31, 2016 (27,986) (96) (1,363) (2,975) (1,692) (34,112)
Net book value
December 31, 2015 19,088 891 1,053 5,460 1,142 27,634
December 31, 2016 16,815 41 1,004 5,670 1,063 24,593
Included in depletion, depreciation, amortization and impairment expense for the year ended December 31, 2016 is a pre-tax net impairment reversal of $261 million (2015 – pre-tax impairment expense of $5,021 million) on crude oil and natural gas assets located in Western Canada in the Upstream Exploration and Production segment.
Under IFRS, any asset impairment that is recorded must be reversed to its original value less any associated depletion, depreciation and amortization expenses should there be indicators that the recoverable amount of the asset has increased in value since the time of recognizing the initial impairment. At December 31, 2016, a $336 million pre-tax recovery of impairment was recognized on the Rainbow CGU in the Upstream Exploration and Production segment, due to acceleration of production profiles and revised operational economics, based on recent production performance and reinforced by market transactions. The recoverable amount for the Rainbow CGU as at December 31, 2016 is $604 million (2015 – $346 million). The recoverable amount of the CGU was estimated based on FVLCS using estimated discounted cash flows based on proved plus probable reserves and a pre-tax discount rate of 11 percent (Level 3). The Company did not identify any further impairment reversal indicators across the other CGUs.

107Notes to the Consolidated Financial Statements
Consolidated Financial Statements 28
The pre-tax impairment expense of $58 million (2015 – $101 million) for the year ended December 31, 2016 related to crude oil and natural gas assets located in the Provost West CGU. The impairment charge within the Upstream Exploration and Production segment, reflected in the fourth quarter of 2016, was the result of negative technical reserve revisions based on recent production performance and reinforced by market transactions. The recoverable amount for the Provost West CGU as at December 31, 2016 is $10 million (2015 – $91 million). The recoverable amount is based on FVLCS using estimated discounted cash flows based on proved plus probable reserves and a pre-tax discount rate of 11 percent (Level 3). In addition, an impairment of $17 million was recorded on the Northern CGU prior to sale (Level 3). The Company did not identify any further impairment indicators across the other CGUs.
The recoverable amount is sensitive to commodity price, discount rate, production volumes, operating costs, royalty rates and future capital expenditures. Commodity prices are based on market indicators at the end of the period. Management’s long-term assumptions are benchmarked against the forward price curve and external firms. The prices used are consistent with those used by the Company in determining the recoverable amount of property, plant and equipment. The discount rate for FVLCS represents the rate a market participant would apply to the cash flows in a market transaction. Production volumes, operating costs and future capital expenditures are based on management’s best estimates of future costs included in the long range plan approved by the Board of Directors.
A change in the discount rate or forward price over the life of the reserves will result in the following impact on the Provost West and Rainbow CGUs:
Discount Rate Commodity Price
($ millions)1% Increase inDiscount Rate
1% Decrease inDiscount Rate
5% Increase in Forward Price
5% Decrease in Forward Price
Impairment of PP&E, Provost West – Increase (Decrease) 2 (2) (12) 11
Impairment Reversal of PP&E, Rainbow – Increase (Decrease) (25) 26 95 (95)
The table below summarizes the forecasted prices used in determining the recoverable amounts in the above CGUs:
WTI ($US/bbl)
Brent ($US/bbl)
Edmonton Light($CDN/bbl)
AECO($CDN/mcf)
Foreign Exchange($US/$CDN)
2017 55.00 60.00 64.94 3.06 0.770
2018 60.00 70.00 74.88 3.12 0.800
2019 65.00 71.40 76.37 3.18 0.800
2020 70.00 72.83 77.90 3.25 0.800
2021 71.40 74.28 79.46 3.31 0.800
2022 72.83 75.77 81.05 3.38 0.800
2023(1) 74.28 77.29 82.67 3.45 0.800
(1) Prices are escalated at 2 percent thereafter.
Costs of property, plant and equipment, including major development projects, not subject to depletion, depreciation and amortization as at December 31, 2016 were $1.8 billion (December 31, 2015 – $3.0 billion) including undeveloped land assets of $95 million as at December 31, 2016 (December 31, 2015 – $68 million).
The net book values of assets held under finance lease within property, plant and equipment are as follows:
Assets Under Finance LeaseOil and Gas
Properties($ millions) Refining Total
December 31, 2015 26 255 281
December 31, 2016 24 255 279

108 Notes to the Consolidated Financial Statements
Consolidated Financial Statements 29
Assets Dispositions On May 25, 2016, the Company completed the sale of royalty interests representing approximately 1,700 boe/day of Western Canada production for gross proceeds of $165 million, resulting in a pre-tax gain of $163 million and an after-tax gain of $119 million.
On July 15, 2016, the Company completed the sale of 65 percent of its ownership interest in select midstream assets in the Lloydminster region of Alberta and Saskatchewan for gross proceeds of $1.69 billion in cash. The Company also recognized an investment of $621 million for its 35 percent retained interest. This transaction resulted in a change of control and the recognition of a pre-tax gain of $1.44 billion and an after-tax gain of $1.32 billion. The assets and related liabilities were recorded in the Upstream Infrastructure and Marketing segment. The assets are held by a newly formed limited partnership, Husky Midstream Limited Partnership (“HMLP”), of which the Company owns 35 percent, Power Assets Holding Ltd. (“PAH”) owns 48.75 percent and Cheung Kong Infrastructure Holdings Ltd. (“CKI”) owns 16.25 percent. Husky remains operator of the assets.
During 2016, the Company completed the sale of approximately 30,200 boe/day of legacy crude oil and gas assets in Western Canada for gross proceeds of $1.12 billion. The Company recognized a pre-tax gain of $35 million and an after-tax gain of $25 million.
Note 10 Goodwill
Goodwill($ millions) December 31, 2016 December 31, 2015
Beginning of year 700 746
Exchange adjustments (21) 114
Impairment — (160)
End of year 679 700
As at December 31, 2016, the Company's goodwill balance related entirely to the Lima Refinery. For impairment testing purposes, the recoverable amount of the Lima Refinery CGU was estimated using the higher of FVLCS and VIU methodology based on cash flows expected over a 50-year period and discounted using a pre-tax discount rate of 8 percent (2015 – 8 percent).
The value-in-use calculation for the Lima Refinery CGU is sensitive to changes in discount rate, forecasted crack spreads and growth rate. The discount rate is derived from the Company’s post-tax weighted average cost of capital with appropriate adjustments made to reflect the risks specific to the refinery. Forecasted crack spreads are based on quoted near-month contracts for WTI and spot prices for gasoline and diesel, and are consistent with crack spreads used in the Company's long range plan.
Cash flow projections for the initial 10-year period are based on long range plan future cash flows and inflated by a 2 percent long-term growth rate for the remaining 40-year period. The inflation rate was based upon an average expected inflation rate for the U.S. of 2 percent (2015 – 2 percent). As at December 31, 2016, the recoverable amount exceeded the carrying amount and no impairment was identified.
The Company used the market capitalization and comparative market multiplier to corroborate discounted cash flow results.

109Notes to the Consolidated Financial Statements
Consolidated Financial Statements 30
Note 11 Joint Arrangements
Joint Operations
BP-Husky Refining LLCThe Company holds a 50 percent ownership interest in BP-Husky Refining LLC, which owns and operates the BP-Husky Toledo Refinery in Ohio. On March 31, 2008, the Company completed a transaction with BP whereby BP contributed the BP-Husky Toledo Refinery plus inventories and other related net assets and the Company contributed U.S. $250 million in cash and a contribution payable of U.S. $2.6 billion.
The Company’s proportionate share of the contribution payable included in the consolidated balance sheets is as follows:
Contribution Payable ($ millions) December 31, 2016 December 31, 2015
Beginning of year 348 1,528
Accretion (note 21) 6 16
Paid (193) (1,363)
Foreign exchange (15) 167
End of year 146 348
Expected to be incurred within 1 year 146 210
Expected to be incurred beyond 1 year — 138
The Company amended the terms of payment of the Company's contribution payable with BP-Husky Refining LLC in the first quarter of 2015. In accordance with the amendment, U.S. $1 billion of the net contribution payable was paid on February 2, 2015. Subsequent to the payment, BP-Husky Refining LLC distributed U.S. $1 billion to each of the joint arrangement partners, which resulted in the creation of a deferred tax asset and deferred tax recovery of $203 million. As a result of prepayment, the accretion rate was reduced from 6 percent to 2.5 percent for the future term of the agreement and the remaining maturity date was extended to December 31, 2017. The remaining net contribution payable amount of approximately U.S. $110 million (CDN $146 million) will be paid by way of funding all capital contributions of the BP-Husky Refining LLC joint operation during 2017 and repaying the remaining balance by the end of 2017.
Summarized below is the Company’s proportionate share of operating results and financial position in the BP-Husky Refining LLC joint operation that have been included in the consolidated statements of income (loss) and the consolidated balance sheets in U.S. Refining and Marketing in the Downstream segment:
Results of Operations ($ millions) 2016 2015
Revenues 1,521 1,959
Expenses (1,570) (1,826)
Proportionate share of net earnings (loss) (49) 133
Balance Sheets ($ millions) December 31, 2016 December 31, 2015
Current assets 395 469
Non-current assets 2,446 2,405
Current liabilities (324) (367)
Non-current liabilities (535) (681)
Proportionate share of net assets 1,982 1,826

110 Notes to the Consolidated Financial Statements
Consolidated Financial Statements 31
Sunrise Oil Sands PartnershipThe Company holds a 50 percent interest in the Sunrise Oil Sands Partnership, which is engaged in operating an oil sands project in Northern Alberta.
Summarized below is the Company’s proportionate share of operating results and financial position in the Sunrise Oil Sands Partnership that have been included in the consolidated statements of income (loss) and the consolidated balance sheets in Exploration and Production in the Upstream segment:
Results of Operations ($ millions) 2016 2015
Revenues 106 17
Expenses (220) (160)
Financial items (28) (28)
Proportionate share of net loss (142) (171)
Balance Sheets ($ millions) December 31, 2016 December 31, 2015
Current assets 57 28
Non-current assets 3,147 3,161
Current liabilities (98) (104)
Non-current liabilities (274) (248)
Proportionate share of net assets 2,832 2,837
Joint Venture
Husky-CNOOC Madura Ltd. The Company currently holds 40 percent joint control in Husky-CNOOC Madura Ltd., which is engaged in exploring for oil and gas resources in Indonesia with a fiscal year end of December 31. Results of the joint venture are included in the consolidated statements of income (loss) in Exploration and Production in the Upstream segment.
Summarized below is the financial information for Husky-CNOOC Madura Ltd. accounted for using the equity method:
Results of Operations ($ millions, except share of equity investment) 2016 2015
Revenues — —
Expenses (32) (25)
Net loss (32) (25)
Share of equity investment (percent) 40% 40%
Proportionate share of equity investment (1) (5)
Balance Sheets($ millions, except share of equity investment) December 31, 2016 December 31, 2015
Current assets(1) 67 79
Non-current assets 1,111 780
Current liabilities (134) (46)
Non-current liabilities (836) (559)
Net assets 208 254
Share of net assets (percent) 40% 40%
Carrying amount in balance sheet 488 359
(1) Current assets include cash and cash equivalents of $7 million (2015 – $34 million).

111Notes to the Consolidated Financial Statements
Consolidated Financial Statements 32
The Company's share of equity investment and carrying amount of share of net assets does not equal the 40 percent joint control of the expenses and net assets of Husky-CNOOC Madura Ltd. due to differences in the accounting policies of the joint venture and the Company and non-current liabilities of the joint venture which are not included in the Company's carrying amount of net assets due to equity accounting.
Husky Midstream Limited Partnership On July 15, 2016, the Company completed the sale of its ownership interest in select midstream assets in the Lloydminster region of Alberta and Saskatchewan. The assets are held by a newly-formed limited partnership, HMLP, of which Husky owns 35 percent, PAH owns 48.75 percent and CKI owns 16.25 percent. Results of the joint venture are included in the Upstream Infrastructure and Marketing segment.
Summarized below is the financial information for HMLP accounted for using the equity method:
Results of Operations ($ millions, except share of equity investment) 2016
Revenues 138
Expenses(1) (97)
Net income 41
Share of equity investment (percent) 35%
Proportionate share of equity investment 16
Balance Sheet($ millions, except share of net assets) December 31, 2016
Current assets(2) 55Non-current assets 2,403Current liabilities (44)Non-current liabilities (590)
Net assets 1,824
Share of net assets (percent) 35%
Carrying amount in balance sheet 640
(1) As at December 31, 2016, total gross costs incurred in response to the pipeline leak were approximately $107 million, for which $88 million hasbeen recovered through insurance proceeds. Both the spill costs and insurance recoveries have been incurred by HMLP.
(2) Current assets include cash and cash equivalents of $23 million.
The Company's share of equity investment and carrying amount of share of net assets does not equal the 35 percent joint control of the net income and net assets of HMLP due to the potential fluctuation in the partnership profit structure.

112 Notes to the Consolidated Financial Statements
Consolidated Financial Statements 33
Note 12 Other Assets
Other Assets($ millions) December 31, 2016 December 31, 2015
Long-term receivables 117 33
Leasehold incentives 13 34
Precious metals 23 23
Other 19 38
End of period 172 128
Note 13 Bank Operating Loans
At December 31, 2016, the Company had unsecured short-term borrowing lines of credit with banks totalling $670 million (December 31, 2015 – $645 million) and letters of credit under these lines of credit totalling $378 million (December 31, 2015 – $216 million). As at December 31, 2016, bank operating loans were nil (December 31, 2015 – nil). Interest payable is based on Bankers’ Acceptance, U.S. LIBOR or prime rates.
The Sunrise Oil Sands Partnership has an unsecured demand credit facility of $10 million (December 31, 2015 – $10 million) available for general purposes. The Company’s proportionate share of the liability for any drawings under this credit facility is $5 million (December 31, 2015 – $5 million). As at December 31, 2016, there was no balance outstanding under this credit facility (December 31, 2015 – nil).
Note 14 Accounts Payable and Accrued Liabilities
Accounts Payable and Accrued Liabilities($ millions) December 31, 2016 December 31, 2015
Trade payables 762 636
Accrued liabilities 1,275 1,498
Dividend payable (note 19) 9 296
Stock-based compensation 17 6
Derivatives due within one year 61 18
Other 102 73
End of year 2,226 2,527
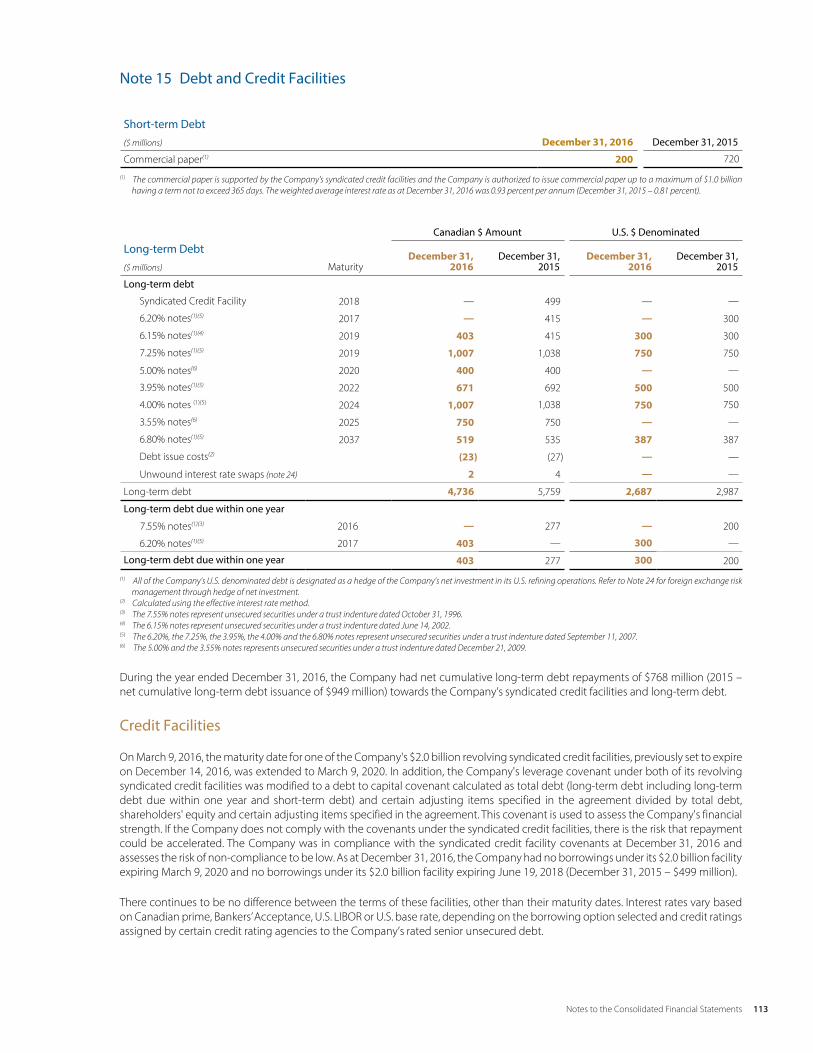
113Notes to the Consolidated Financial Statements
Consolidated Financial Statements 34
Note 15 Debt and Credit Facilities
Short-term DebtDecember 31, 2016 December 31, 2015($ millions)
Commercial paper(1) 200 720
(1) The commercial paper is supported by the Company's syndicated credit facilities and the Company is authorized to issue commercial paper up to a maximum of $1.0 billion having a term not to exceed 365 days. The weighted average interest rate as at December 31, 2016 was 0.93 percent per annum (December 31, 2015 – 0.81 percent).
Canadian $ Amount U.S. $ Denominated
Long-term DebtMaturity
December 31,2016
December 31,2015
December 31,2016
December 31,2015($ millions)
Long-term debt
Syndicated Credit Facility 2018 — 499 — —
6.20% notes(1)(5) 2017 — 415 — 300
6.15% notes(1)(4) 2019 403 415 300 300
7.25% notes(1)(5) 2019 1,007 1,038 750 750
5.00% notes(6) 2020 400 400 — —
3.95% notes(1)(5) 2022 671 692 500 500
4.00% notes (1)(5) 2024 1,007 1,038 750 750
3.55% notes(6) 2025 750 750 — —
6.80% notes(1)(5) 2037 519 535 387 387
Debt issue costs(2) (23) (27) — —
Unwound interest rate swaps (note 24) 2 4 — —
Long-term debt 4,736 5,759 2,687 2,987
Long-term debt due within one year
7.55% notes(1)(3) 2016 — 277 — 200
6.20% notes(1)(5) 2017 403 — 300 —
Long-term debt due within one year 403 277 300 200
(1) All of the Company’s U.S. denominated debt is designated as a hedge of the Company’s net investment in its U.S. refining operations. Refer to Note 24 for foreign exchange risk management through hedge of net investment.
(2) Calculated using the effective interest rate method.(3) The 7.55% notes represent unsecured securities under a trust indenture dated October 31, 1996. (4) The 6.15% notes represent unsecured securities under a trust indenture dated June 14, 2002. (5) The 6.20%, the 7.25%, the 3.95%, the 4.00% and the 6.80% notes represent unsecured securities under a trust indenture dated September 11, 2007. (6) The 5.00% and the 3.55% notes represents unsecured securities under a trust indenture dated December 21, 2009.
During the year ended December 31, 2016, the Company had net cumulative long-term debt repayments of $768 million (2015 – net cumulative long-term debt issuance of $949 million) towards the Company’s syndicated credit facilities and long-term debt.
Credit Facilities
On March 9, 2016, the maturity date for one of the Company's $2.0 billion revolving syndicated credit facilities, previously set to expire on December 14, 2016, was extended to March 9, 2020. In addition, the Company's leverage covenant under both of its revolving syndicated credit facilities was modified to a debt to capital covenant calculated as total debt (long-term debt including long-term debt due within one year and short-term debt) and certain adjusting items specified in the agreement divided by total debt, shareholders' equity and certain adjusting items specified in the agreement. This covenant is used to assess the Company's financial strength. If the Company does not comply with the covenants under the syndicated credit facilities, there is the risk that repayment could be accelerated. The Company was in compliance with the syndicated credit facility covenants at December 31, 2016 and assesses the risk of non-compliance to be low. As at December 31, 2016, the Company had no borrowings under its $2.0 billion facility expiring March 9, 2020 and no borrowings under its $2.0 billion facility expiring June 19, 2018 (December 31, 2015 – $499 million).
There continues to be no difference between the terms of these facilities, other than their maturity dates. Interest rates vary based on Canadian prime, Bankers’ Acceptance, U.S. LIBOR or U.S. base rate, depending on the borrowing option selected and credit ratings assigned by certain credit rating agencies to the Company’s rated senior unsecured debt.

114 Notes to the Consolidated Financial Statements
Consolidated Financial Statements 35
Notes
On February 23, 2015, the Company filed a universal short form base shelf prospectus with applicable securities regulators in each of the provinces of Canada (the ”Canadian Shelf Prospectus”) that enables the Company to offer up to $3.0 billion of common shares, preferred shares, debt securities, subscription receipts, warrants and other units in Canada up to and including March 23, 2017. During the 25-month period that the Canadian Shelf Prospectus is effective, securities may be offered in amounts, at prices and on terms set forth in a prospectus supplement.
On March 12, 2015, the Company repaid the maturing 3.75 percent notes issued under a trust indenture dated December 21, 2009. The amount paid to noteholders was $306 million, including $6 million of interest.
On March 12, 2015, the Company issued $750 million of 3.55 percent notes due March 12, 2025 by way of a prospectus supplement dated March 9, 2015 to the Canadian Shelf Prospectus. The notes are redeemable at the option of the Company at any time, subject to a make whole premium unless the notes are redeemed in the three month period prior to maturity. Interest is payable semi-annually on March 12 and September 12 of each year, beginning September 12, 2015. The notes are unsecured and unsubordinated and rank equally with all of the Company's other unsecured and unsubordinated indebtedness. Net proceeds from the offering was used for general corporate purposes, which included, among other things, the partial repayment of bank debt incurred by the Company to fund early payment of U.S. $1 billion of the Company's net capital contribution payable with BP-Husky Refining LLC.
On December 22, 2015, the Company filed a universal short form base shelf prospectus (the ”U.S. Shelf Prospectus”) with the Alberta Securities Commission and a related U.S. registration statement containing the U.S. Shelf Prospectus with the SEC that enables the Company to offer up to U.S. $3.0 billion of debt securities, common shares, preferred shares, subscription receipts, warrants and units of the Company in the United States up to and including January 22, 2018. During the 25-month period that the U.S. Shelf Prospectus and the related U.S registration statement are effective, securities may be offered in amounts, at prices and on terms set forth in a prospectus supplement.
On November 15, 2016, the Company repaid the maturing 7.55 percent notes issued under a trust indenture dated October 31, 1996. The amount paid to noteholders was $280 million, including $10 million of interest.
At December 31, 2016, the Company had unused capacity of $1.9 billion under its Canadian Shelf Prospectus and U.S. $3.0 billionunder its U.S. Shelf Prospectus and related U.S. registration statement.
The Company's notes, credit facilities and short-term lines of credit rank equally in right of payment.
Note 16 Asset Retirement Obligations
At December 31, 2016, the estimated total undiscounted inflation-adjusted amount required to settle the Company’s ARO was $11.4 billion (December 31, 2015 – $13.9 billion). These obligations will be settled based on the useful lives of the underlying assets, which currently extend an average of 41 years into the future. This amount has been discounted using credit-adjusted risk-free rates of 2.8 percent to 5.3 percent (December 31, 2015 – 2.7 percent to 5.8 percent) and an inflation rate of 2 percent (December 31, 2015 – 2 percent). Obligations related to future environmental remediation and cleanup of oil and gas assets are included in the estimated ARO. The Company had deposited funds of $156 million (2015 – $121 million) into the restricted cash account, of which $84 millionrelates to the Wenchang field and have been classified as current and the remaining balance of $72 million have been classified as non-current.
The change in the provision in 2016 is primarily due to the disposition of select legacy Western Canada crude oil and natural gas assets in 2016.
While the provision is based on management's best estimates of future costs, discount rates and the economic lives of the assets, there is uncertainty regarding the amount and timing of incurring these costs.

115Notes to the Consolidated Financial Statements
Consolidated Financial Statements 36
A reconciliation of the carrying amount of asset retirement obligations at December 31, 2016 and 2015 is set out below:
Asset Retirement Obligations($ millions) 2016 2015
Beginning of year 2,984 3,065
Additions 16 23
Liabilities settled (87) (98)
Liabilities disposed (452) (19)
Change in discount rate 205 (500)
Change in estimates 25 340
Exchange adjustment (26) 52
Accretion (note 21) 126 121
End of year 2,791 2,984
Expected to be incurred within 1 year 218 102
Expected to be incurred beyond 1 year 2,573 2,882
Note 17 Other Long-term Liabilities
Other Long-term Liabilities($ millions) December 31, 2016 December 31, 2015
Employee future benefits (note 22) 208 176
Finance lease obligations 288 266
Stock-based compensation 14 12
Deferred revenue 321 109
Leasehold incentives 104 104
Other 85 76
End of year 1,020 743
Finance lease obligationsThe Company, on behalf of the Sunrise Oil Sands Partnership, entered into an arrangement for the construction and use of pipeline and storage facilities in its oil sands operations. The substance of the arrangement has been determined to be a lease and has been classified as a finance lease. The assets are to be used for a minimum period of 20 years with options to renew.
The future minimum lease payments under existing finance leases are payable as follows:
Within 1 yearAfter 1 year but nomore than 5 years More than 5 years Total
($ millions) 2016 2015 2016 2015 2016 2015 2016 2015
Future minimum lease payments 35 35 140 139 764 800 939 974
Interest 30 30 112 115 505 532 647 677
Present value of minimum lease payments 33 31 102 104 153 162 288 297
Deferred revenueThe deferred revenue relates to the take or pay commitment with respect to natural gas production volumes from the Liwan 3-1 field in the Asia Pacific Region not taken by the purchaser, as per the terms of the agreement. The purchaser has until the end of the agreement to take these volumes.

116 Notes to the Consolidated Financial Statements
Consolidated Financial Statements 37
Note 18 Income Taxes
The major components of income tax expense for the years ended December 31, 2016 and 2015 were as follows:
Income Tax Expense (Recovery)($ millions) 2016 2015
Current income tax
Current income tax charge 90 308
Adjustments to current income tax estimates (91) (2)
(1) 306
Deferred income tax
Relating to origination and reversal of temporary differences (121) (1,760)
Adjustments to deferred income tax estimates 150 (67)
29 (1,827)
Deferred Tax Items in OCI($ millions) 2016 2015
Deferred tax items expensed (recovered) directly in OCI
Derivatives designated as cash flow hedges (1) (1)
Remeasurement of pension plans (6) (3)
Exchange differences on translation of foreign operations (40) 215
Hedge of net investment 17 (92)
(30) 119
The provision for income taxes in the consolidated statements of income (loss) reflects an effective tax rate which differs from the expected statutory tax rate. Differences for the years ended December 31, 2016 and 2015 were accounted for as follows:
Reconciliation of Effective Tax Rate($ millions, except tax rate) 2016 2015
Earnings (loss) before income taxes
Canada 615 (6,245)
United States 5 241
Other foreign jurisdictions 330 633
950 (5,371)
Statutory Canadian income tax rate (percent) 27.2% 27.0%
Expected income tax 258 (1,450)
Effect on income tax resulting from:
Capital gains and losses — 2
Foreign jurisdictions (3) 23
Non-taxable items (272) (31)
Revaluation of foreign tax pools (11) (14)
Other – net 56 (51)
Income tax expense (recovery) 28 (1,521)
The statutory tax rate is 27.2 percent in 2016 (2015 – 27.0 percent). The 2015 to 2016 tax rates were similar due to no significant changes to applicable tax rates.

117Notes to the Consolidated Financial Statements
Consolidated Financial Statements 38
The following reconciles the movements in the deferred income tax liabilities and assets:
Deferred Tax Liabilities and Assets
($ millions) January 1, 2016Recognizedin Earnings
Recognizedin OCI Other
December 31,2016
Deferred tax liabilities
Exploration and evaluation assets andproperty, plant and equipment (4,233) 187 48 — (3,998)
Foreign exchange gains taxable on realization (42) (166) (16) — (224)
Debt issue costs (1) (1) — — (2)
Other temporary differences 141 (162) — — (21)
Deferred tax assets
Pension plans 43 (17) 6 — 32
Asset retirement obligations 892 (196) (3) — 693
Loss carry-forwards 75 319 (5) — 389
Financial assets at fair value 13 7 — — 20
(3,112) (29) 30 — (3,111)
Deferred Tax Liabilities and Assets
($ millions) January 1, 2015Recognized in
EarningsRecognized in
OCI OtherDecember 31,
2015
Deferred tax liabilities
Exploration and evaluation assets andproperty, plant and equipment (5,840) 1,853 (240) (6) (4,233)
Foreign exchange gains taxable onrealization (35) (100) 93 — (42)
Debt issue costs (1) — — — (1)
Deferred tax assets
Pension plans 39 1 3 — 43
Asset retirement obligations 870 6 16 — 892
Loss carry-forwards 87 (21) 9 — 75
Financial assets at fair value 12 1 — — 13
Other temporary differences 54 87 — — 141
(4,814) 1,827 (119) (6) (3,112)
The Company has temporary differences associated with its investments in its foreign subsidiaries, branches, and interests in joint ventures. At December 31, 2016, the Company has no deferred tax liabilities in respect to these investments (December 31, 2015 – nil).
At December 31, 2016, the Company had $1,257 million (December 31, 2015 – $174 million) of U.S. tax losses that will expire between 2030 and 2036. The Company has recorded deferred tax assets in respect of these losses, as there are sufficient taxable temporary differences in the U.S. jurisdiction to utilize these losses.

118 Notes to the Consolidated Financial Statements
Consolidated Financial Statements 39
Note 19 Share Capital
Common Shares
The Company is authorized to issue an unlimited number of no par value common shares.
Common SharesNumber of
SharesAmount
($ millions)
December 31, 2014 983,738,062 6,986
Stock dividends 590,853 14
December 31, 2015 984,328,915 7,000
Stock dividends 21,122,939 296
December 31, 2016 1,005,451,854 7,296
Quarterly dividends may be declared in an amount expressed in dollars per common share or could be paid by way of issuance of a fraction of a common share per outstanding common share determined by dividing the dollar amount of the dividend by the volume-weighted average trading price of the common shares on the principal stock exchange on which the common shares are traded. The volume-weighted average trading price of the common shares is calculated by dividing the total value by the total volume of common shares traded over the five trading day period immediately prior to the payment date of the dividend on the common shares.
The Company issued stock dividends of $296 million on January 11, 2016, on account of common share dividends declared for the third quarter of 2015 (2015 – $1,167 million in cash and $14 million in common shares). The common share and cash dividend was suspended by the Board of Directors in the fourth quarter of 2015 (2015 – declared $1.20 per common share). At December 31, 2016, the Company had no common share dividends payable (December 31, 2015 – $296 million in common shares).
Preferred Shares
The Company is authorized to issue an unlimited number of no par value preferred shares.
Cumulative Redeemable Preferred Shares Number of SharesAmount
($ millions)
December 31, 2014 22,000,000 534
Series 5 issued, net of share issue costs 8,000,000 195
Series 7 issued, net of share issue costs 6,000,000 145
December 31, 2015 36,000,000 874
Series 1 shares converted to Series 2 shares (1,564,068) (38)
Series 2 shares converted from Series 1 shares 1,564,068 38
December 31, 2016 36,000,000 874
On February 16, 2016, Husky announced that it did not intend to exercise its right to redeem its Cumulative Redeemable Preferred Shares, Series 1 (the ”Series 1 Preferred Shares”) on March 31, 2016. As a result, subject to certain conditions, the holders of Series 1 Preferred Shares were notified of their right to choose one of the following options with regard to their shares: retain any or all of their Series 1 Preferred Shares and continue to receive an annual fixed rate dividend paid quarterly; or convert, on a one-for-one basis, any or all of their Series 1 Preferred Shares into Cumulative Redeemable Preferred Shares, Series 2 (the ”Series 2 Preferred Shares”) of Husky Energy and receive a floating rate quarterly dividend. On March 31, 2016, holders of 1,564,068 Series 1 Preferred Shares exercised their option to convert their shares, on a one-for-one basis, to Series 2 Preferred Shares.
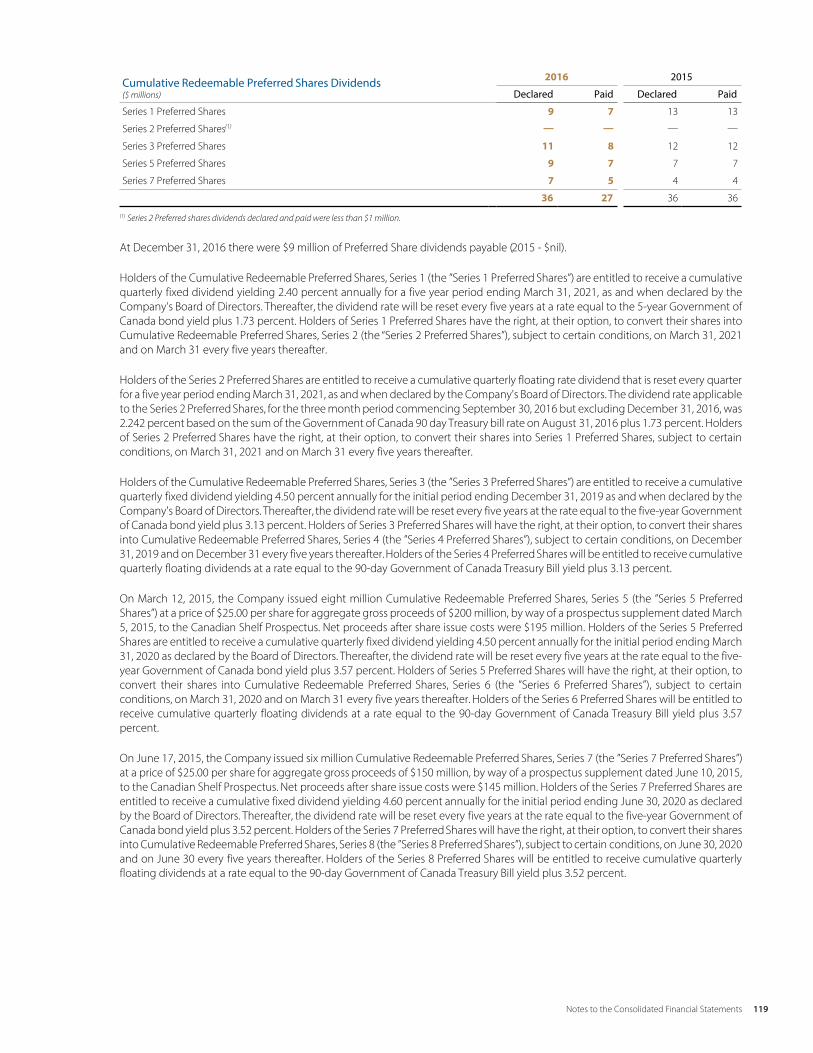
119Notes to the Consolidated Financial Statements
Consolidated Financial Statements 40
Cumulative Redeemable Preferred Shares Dividends($ millions)
2016 2015
Declared Paid Declared Paid
Series 1 Preferred Shares 9 7 13 13
Series 2 Preferred Shares(1) — — — —
Series 3 Preferred Shares 11 8 12 12
Series 5 Preferred Shares 9 7 7 7
Series 7 Preferred Shares 7 5 4 4
36 27 36 36
(1) Series 2 Preferred shares dividends declared and paid were less than $1 million.
At December 31, 2016 there were $9 million of Preferred Share dividends payable (2015 - $nil).
Holders of the Cumulative Redeemable Preferred Shares, Series 1 (the ”Series 1 Preferred Shares”) are entitled to receive a cumulative quarterly fixed dividend yielding 2.40 percent annually for a five year period ending March 31, 2021, as and when declared by the Company’s Board of Directors. Thereafter, the dividend rate will be reset every five years at a rate equal to the 5-year Government of Canada bond yield plus 1.73 percent. Holders of Series 1 Preferred Shares have the right, at their option, to convert their shares into Cumulative Redeemable Preferred Shares, Series 2 (the “Series 2 Preferred Shares”), subject to certain conditions, on March 31, 2021 and on March 31 every five years thereafter.
Holders of the Series 2 Preferred Shares are entitled to receive a cumulative quarterly floating rate dividend that is reset every quarter for a five year period ending March 31, 2021, as and when declared by the Company's Board of Directors. The dividend rate applicable to the Series 2 Preferred Shares, for the three month period commencing September 30, 2016 but excluding December 31, 2016, was 2.242 percent based on the sum of the Government of Canada 90 day Treasury bill rate on August 31, 2016 plus 1.73 percent. Holders of Series 2 Preferred Shares have the right, at their option, to convert their shares into Series 1 Preferred Shares, subject to certain conditions, on March 31, 2021 and on March 31 every five years thereafter.
Holders of the Cumulative Redeemable Preferred Shares, Series 3 (the ”Series 3 Preferred Shares”) are entitled to receive a cumulative quarterly fixed dividend yielding 4.50 percent annually for the initial period ending December 31, 2019 as and when declared by the Company's Board of Directors. Thereafter, the dividend rate will be reset every five years at the rate equal to the five-year Government of Canada bond yield plus 3.13 percent. Holders of Series 3 Preferred Shares will have the right, at their option, to convert their shares into Cumulative Redeemable Preferred Shares, Series 4 (the ”Series 4 Preferred Shares”), subject to certain conditions, on December 31, 2019 and on December 31 every five years thereafter. Holders of the Series 4 Preferred Shares will be entitled to receive cumulative quarterly floating dividends at a rate equal to the 90-day Government of Canada Treasury Bill yield plus 3.13 percent.
On March 12, 2015, the Company issued eight million Cumulative Redeemable Preferred Shares, Series 5 (the ”Series 5 Preferred Shares”) at a price of $25.00 per share for aggregate gross proceeds of $200 million, by way of a prospectus supplement dated March 5, 2015, to the Canadian Shelf Prospectus. Net proceeds after share issue costs were $195 million. Holders of the Series 5 Preferred Shares are entitled to receive a cumulative quarterly fixed dividend yielding 4.50 percent annually for the initial period ending March 31, 2020 as declared by the Board of Directors. Thereafter, the dividend rate will be reset every five years at the rate equal to the five-year Government of Canada bond yield plus 3.57 percent. Holders of Series 5 Preferred Shares will have the right, at their option, to convert their shares into Cumulative Redeemable Preferred Shares, Series 6 (the ”Series 6 Preferred Shares”), subject to certain conditions, on March 31, 2020 and on March 31 every five years thereafter. Holders of the Series 6 Preferred Shares will be entitled to receive cumulative quarterly floating dividends at a rate equal to the 90-day Government of Canada Treasury Bill yield plus 3.57 percent.
On June 17, 2015, the Company issued six million Cumulative Redeemable Preferred Shares, Series 7 (the ”Series 7 Preferred Shares”) at a price of $25.00 per share for aggregate gross proceeds of $150 million, by way of a prospectus supplement dated June 10, 2015, to the Canadian Shelf Prospectus. Net proceeds after share issue costs were $145 million. Holders of the Series 7 Preferred Shares are entitled to receive a cumulative fixed dividend yielding 4.60 percent annually for the initial period ending June 30, 2020 as declared by the Board of Directors. Thereafter, the dividend rate will be reset every five years at the rate equal to the five-year Government of Canada bond yield plus 3.52 percent. Holders of the Series 7 Preferred Shares will have the right, at their option, to convert their shares into Cumulative Redeemable Preferred Shares, Series 8 (the ”Series 8 Preferred Shares”), subject to certain conditions, on June 30, 2020 and on June 30 every five years thereafter. Holders of the Series 8 Preferred Shares will be entitled to receive cumulative quarterly floating dividends at a rate equal to the 90-day Government of Canada Treasury Bill yield plus 3.52 percent.

120 Notes to the Consolidated Financial Statements
Consolidated Financial Statements 41
Stock Option Plan
Pursuant to the Incentive Stock Option Plan (the “Option Plan”), the Company may grant from time to time to officers and employees of the Company options to purchase common shares of the Company. The term of each option is five years, and vests one-third on each of the first three anniversary dates from the grant date. The Option Plan provides the option holder with the right to exercise the option to acquire one common share at the exercise price or surrender the option for a cash payment. The exercise price of the option is equal to the weighted average trading price of the Company’s common shares during the five trading days prior to the grant date. When the stock option is surrendered to the Company, the cash payment is equal to the excess of the aggregate fair market value of the common shares able to be purchased pursuant to the vested and exercisable portion of such stock options on the date of surrender over the aggregate exercise price for those common shares pursuant to those stock options. The fair market value of common shares is calculated as the closing price of the common shares on the date on which board lots of common shares have traded immediately preceding the date a holder of the stock options provides notice to the Company that he or she wishes to surrender his or her stock options to the Company in lieu of exercise.
Included in accounts payable and accrued liabilities and other long-term liabilities in the consolidated balance sheets at December 31, 2016 was $8 million (December 31, 2015 – $1 million) representing the estimated fair value of options outstanding. The total expenserecognized in selling, general and administrative expenses in the consolidated statements of income (loss) for the Option Plan for the year ended December 31, 2016 was $7 million (2015 – $39 million recovery). At December 31, 2016, stock options exercisable for cash had an intrinsic value of $1 million (December 31, 2015 – nil).
The following options to purchase common shares have been awarded to officers and certain other employees:
Outstanding and Exercisable Options 2016 2015
Number of Options (thousands)
Weighted Average Exercise Prices ($)
Number of Options (thousands)
Weighted Average Exercise Prices ($)
Outstanding, beginning of year 27,621 28.79 26,742 29.47
Granted(1) 5,381 15.67 5,681 25.35
Surrendered for cash — — (632) 26.65
Expired or forfeited (7,543) 27.94 (4,170) 28.76
Outstanding, end of year 25,459 26.26 27,621 28.79
Exercisable, end of year 15,662 29.03 16,635 28.59
(1) Options granted during the year ended December 31, 2016 were attributed a fair value of $2.26 per option (2015 – $2.56) at grant date.
Outstanding and Exercisable Options Outstanding Options Exercisable Options
Range of Exercise Price
Number of Options
(thousands)
Weighted Average
Exercise Prices ($)
Weighted Average
Contractual Life (years)
Number of Options
(thousands)
Weighted Average
Exercise Prices ($)
$14.20 – $29.99 15,889 22.44 2.46 7,752 25.60
$30.00 – $36.20 9,570 32.59 1.71 7,910 32.39
December 31, 2016 25,459 26.26 2.18 15,662 29.03
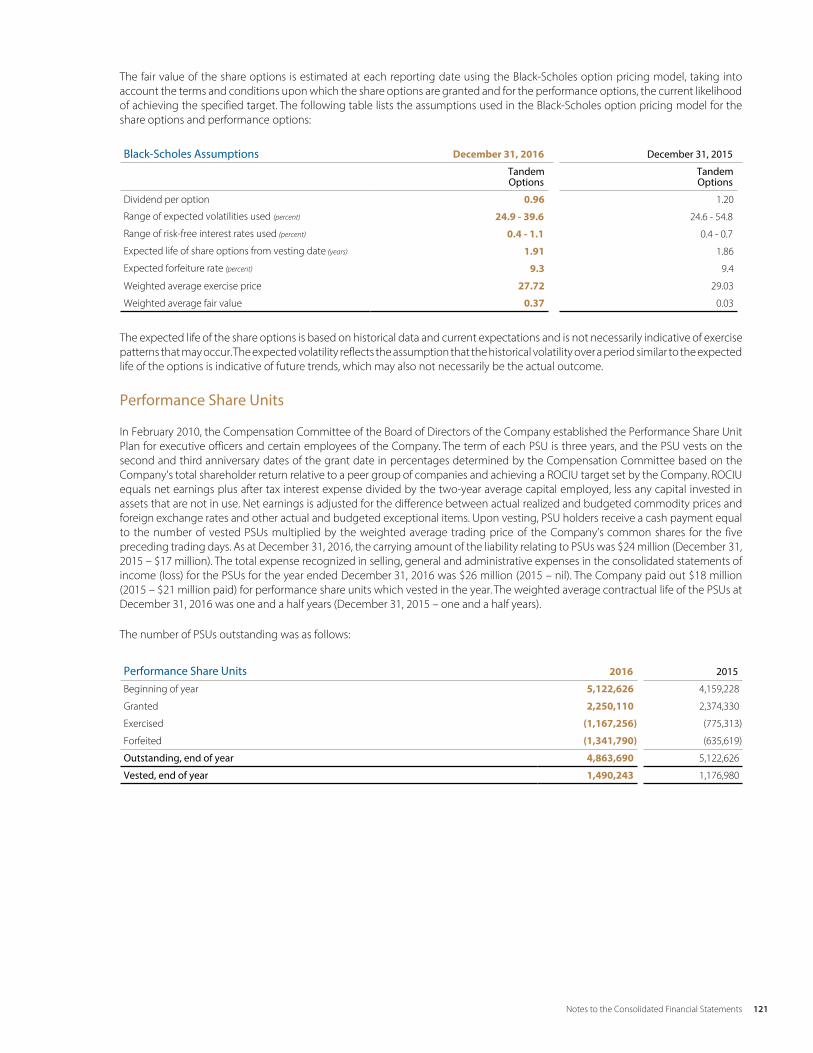
121Notes to the Consolidated Financial Statements
Consolidated Financial Statements 42
The fair value of the share options is estimated at each reporting date using the Black-Scholes option pricing model, taking into account the terms and conditions upon which the share options are granted and for the performance options, the current likelihood of achieving the specified target. The following table lists the assumptions used in the Black-Scholes option pricing model for the share options and performance options:
Black-Scholes Assumptions December 31, 2016 December 31, 2015
Tandem Options
Tandem Options
Dividend per option 0.96 1.20
Range of expected volatilities used (percent) 24.9 - 39.6 24.6 - 54.8
Range of risk-free interest rates used (percent) 0.4 - 1.1 0.4 - 0.7
Expected life of share options from vesting date (years) 1.91 1.86
Expected forfeiture rate (percent) 9.3 9.4
Weighted average exercise price 27.72 29.03
Weighted average fair value 0.37 0.03
The expected life of the share options is based on historical data and current expectations and is not necessarily indicative of exercise patterns that may occur. The expected volatility reflects the assumption that the historical volatility over a period similar to the expected life of the options is indicative of future trends, which may also not necessarily be the actual outcome.
Performance Share Units
In February 2010, the Compensation Committee of the Board of Directors of the Company established the Performance Share Unit Plan for executive officers and certain employees of the Company. The term of each PSU is three years, and the PSU vests on the second and third anniversary dates of the grant date in percentages determined by the Compensation Committee based on the Company's total shareholder return relative to a peer group of companies and achieving a ROCIU target set by the Company. ROCIU equals net earnings plus after tax interest expense divided by the two-year average capital employed, less any capital invested in assets that are not in use. Net earnings is adjusted for the difference between actual realized and budgeted commodity prices and foreign exchange rates and other actual and budgeted exceptional items. Upon vesting, PSU holders receive a cash payment equal to the number of vested PSUs multiplied by the weighted average trading price of the Company’s common shares for the five preceding trading days. As at December 31, 2016, the carrying amount of the liability relating to PSUs was $24 million (December 31, 2015 – $17 million). The total expense recognized in selling, general and administrative expenses in the consolidated statements of income (loss) for the PSUs for the year ended December 31, 2016 was $26 million (2015 – nil). The Company paid out $18 million (2015 – $21 million paid) for performance share units which vested in the year. The weighted average contractual life of the PSUs at December 31, 2016 was one and a half years (December 31, 2015 – one and a half years).
The number of PSUs outstanding was as follows:
Performance Share Units 2016 2015
Beginning of year 5,122,626 4,159,228
Granted 2,250,110 2,374,330
Exercised (1,167,256) (775,313)
Forfeited (1,341,790) (635,619)
Outstanding, end of year 4,863,690 5,122,626
Vested, end of year 1,490,243 1,176,980
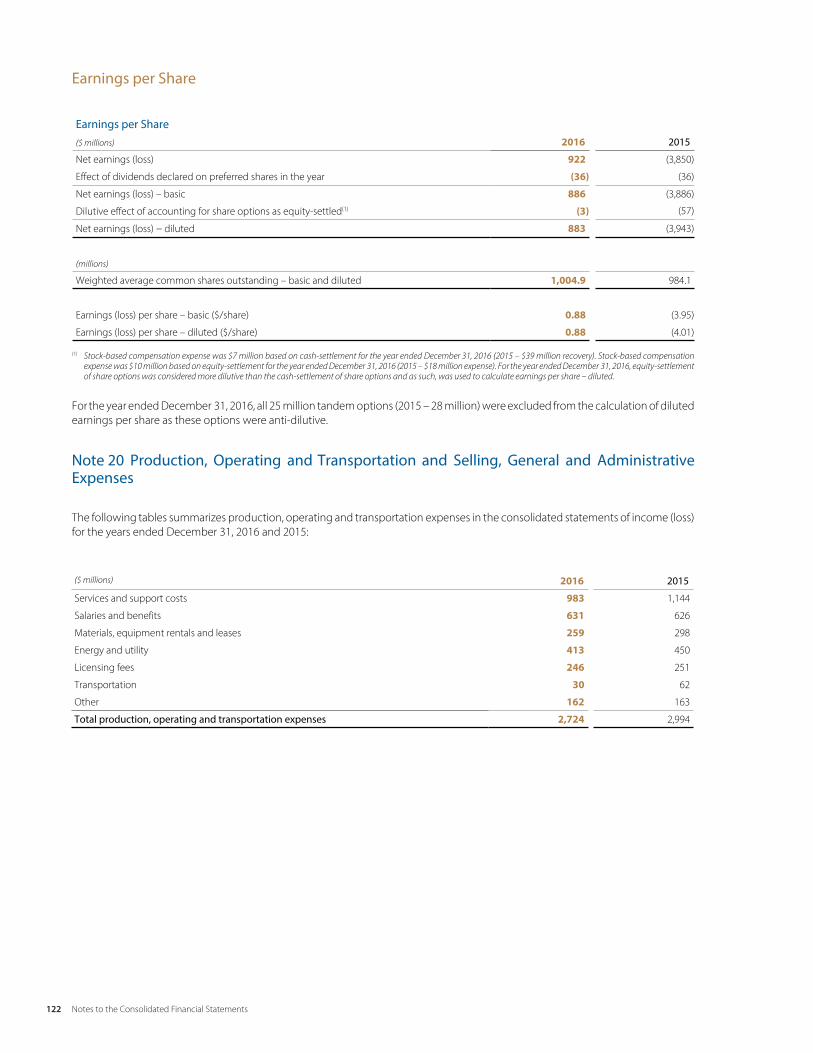
122 Notes to the Consolidated Financial Statements
Consolidated Financial Statements 43
Earnings per Share
Earnings per Share($ millions) 2016 2015
Net earnings (loss) 922 (3,850)
Effect of dividends declared on preferred shares in the year (36) (36)
Net earnings (loss) – basic 886 (3,886)
Dilutive effect of accounting for share options as equity-settled(1) (3) (57)
Net earnings (loss) – diluted 883 (3,943)
(millions)
Weighted average common shares outstanding – basic and diluted 1,004.9 984.1
Earnings (loss) per share – basic ($/share) 0.88 (3.95)
Earnings (loss) per share – diluted ($/share) 0.88 (4.01)
(1) Stock-based compensation expense was $7 million based on cash-settlement for the year ended December 31, 2016 (2015 – $39 million recovery). Stock-based compensation expense was $10 million based on equity-settlement for the year ended December 31, 2016 (2015 – $18 million expense). For the year ended December 31, 2016, equity-settlement of share options was considered more dilutive than the cash-settlement of share options and as such, was used to calculate earnings per share – diluted.
For the year ended December 31, 2016, all 25 million tandem options (2015 – 28 million) were excluded from the calculation of diluted earnings per share as these options were anti-dilutive.
Note 20 Production, Operating and Transportation and Selling, General and Administrative Expenses
The following tables summarizes production, operating and transportation expenses in the consolidated statements of income (loss) for the years ended December 31, 2016 and 2015:
($ millions) 2016 2015
Services and support costs 983 1,144
Salaries and benefits 631 626
Materials, equipment rentals and leases 259 298
Energy and utility 413 450
Licensing fees 246 251
Transportation 30 62
Other 162 163
Total production, operating and transportation expenses 2,724 2,994

123Notes to the Consolidated Financial Statements
Consolidated Financial Statements 44
The following table summarizes selling, general and administrative expenses in the consolidated statements of income (loss) for the years ended December 31, 2016 and 2015:
($ millions) 2016 2015
Employee costs(1) 319 251
Stock based compensation(2) 33 (39)
Contract services 85 77
Equipment rentals and leases 36 31
Maintenance and other 71 22
Total selling, general and administrative expenses 544 342
(1) Employee costs are comprised of salary and benefits earned during the year, plus cash bonuses awarded during the year. Annual bonus awards settled in shares are included in stock-based compensation expense.
(2) Stock-based compensation expense (recovery) represents the cost to the Company for participation in share-based payment plans.
Note 21 Financial Items
Financial Items ($ millions) 2016 2015
Foreign exchange
Gains (losses) on translation of U.S. dollar denominated long-term debt — (34)
Gains on non-cash working capital 4 35
Other foreign exchange gains 9 42
Net foreign exchange gains 13 43
Finance income 17 35
Finance expenses
Long-term debt (330) (300)
Contribution payable (note 11) (6) (16)
Other (17) (18)
(353) (334)
Interest capitalized(1) 78 157
(275) (177)
Accretion of asset retirement obligations (note 16) (126) (121)
Finance expenses (401) (298)
Total Financial Items (371) (220)
(1) Interest capitalized on project costs in 2016 is calculated using the Company’s annualized effective interest rate of 5 percent (2015 – 5 percent).

124 Notes to the Consolidated Financial Statements
Consolidated Financial Statements 45
Note 22 Pensions and Other Post-employment Benefits
The Company currently provides defined contribution pension plans for all qualified employees and two other post-employment benefit plans to its retirees. The other post-employment benefit plan provides certain retired employees with health care and dental benefits. The Company also maintains a defined benefit pension plan, which is closed to new entrants. The defined benefit pension plan provides pension benefits to certain employees based on years of service and final average earnings. The amount and timing of funding of these plans is subject to the funding policy as approved by the Board of Directors.
The measurement date of all plan assets and the accrued benefit obligations was December 31, 2016. The Company is required to file an actuarial valuation of its defined benefit pension with the provincial or state regulator at least every three years. The most recent actuarial valuation was December 31, 2015 for the Canadian defined benefit plan. The most recent actuarial valuation was December 31, 2014 for the Canadian Other Post-employment benefit plan. The most recent actuarial valuation of the U.S. Other Post-employment benefit plan was December 31, 2015.
Defined Contribution Pension Plan
During the year ended December 31, 2016, the Company recognized a $46 million expense (2015 – $44 million) for the defined contribution plan and the two U.S. 401(k) plans in net earnings.
Defined Benefit Pension Plan (“DB Pension Plan”) and Other Post-employment Benefit Plans (“OPEB Plans”)
Defined Benefit Obligation DB Pension Plan OPEB Plans
($ millions) 2016 2015 2016 2015
Beginning of year 177 179 180 143
Current service cost 1 4 13 10
Interest cost 6 7 7 6
Benefits paid (11) (11) (3) (3)
Remeasurements
Actuarial (gain) loss – experience (1) — (1) 17
Actuarial (gain) loss – financial assumptions 6 (2) 17 7
End of year 178 177 213 180
Fair Value of Plan Assets DB Pension Plan OPEB Plans
($ millions) 2016 2015 2016 2015
Beginning of year 181 180 — —
Contributions by employer 2 2 — —
Benefits paid (11) (11) — —
Interest income 6 7 — —
Return on plan assets greater (less) than discount rate 5 3 — —
Settlements — — — —
End of year 183 181 — —
Funded status DB Pension Plan OPEB Plans
($ millions) 2016 2015 2016 2015
Net asset (liability) 5 4 (213) (180)
The Company has accrued the total net liability for the DB Pension Plan and the OPEB Plans in the consolidated balance sheets in other long-term liabilities.

125Notes to the Consolidated Financial Statements
Consolidated Financial Statements 46
The composition of the DB Pension Plan assets at December 31, 2016 and 2015 was as follows:
DB Pension Plan Assets
(percent)Target allocation
range 2016 2015
Money market type funds 0 - 5 0.6 0.5
Equity securities 30 - 50 43.8 41.5
Debt securities 50 - 65 55.6 58.0
The following tables summarize amounts recognized in net earnings and OCI for the DB Pension Plan and the OPEB Plans for the years ended December 31, 2016 and 2015:
DB Pension Plan OPEB Plans
($ millions) 2016 2015 2016 2015
Amounts recognized in net earnings
Current service cost 1 4 13 10
Net Interest cost — — 7 6
Gain on settlement — — — —
Benefit cost (gain) 1 4 20 16
Remeasurements
Actuarial (gain) loss due to liability experience (1) — (1) 17
Actuarial (gain) loss due to liability assumption changes 6 (2) 17 7
Loss (gain) on plan assets (5) (3) — —
Remeasurement effects recognized in OCI — (5) 16 24
The following long-term assumptions were used to estimate the value of the defined benefit obligations, the plan assets and the OPEB Plans:
Assumptions DB Pension Plan OPEB Plans
(percent) 2016 2015 2016 2015
Discount rate for benefit expense and obligation 3.5 - 3.8 3.7 - 3.8 3.7 - 4.1 3.7 - 4.1
Rate of compensation expense 3.5 3.5 N/A N/A
The average health care cost trend rate used for the benefit expense for the Canadian OPEB Plan was 7.0 percent for 2016, grading 0.4 percent per year for 5 years to 5.0 percent in 2021 and thereafter. The average health care cost trend rate used for the obligation related to the Canadian OPEB Plan was 7.0 percent for 2016, grading 0.4 percent per year for 5 years to 5.0 percent in 2021 and thereafter.
The average health care cost trend rate used for the benefit expense for the U.S. OPEB Plan was 6.5 percent for 2016, grading 0.25 percent per year for 6 years to 5.0 percent per year in 2022 and thereafter. The average health care cost trend rate used for the obligation related to the U.S. OPEB Plan was 6.3 percent for 2016, grading 0.21 percent per year for 6 years to 5.0 percent in 2022 and thereafter.
The sensitivity of the defined benefit and OPEB obligation to changes in relevant actuarial assumption is shown below:
Sensitivity Analysis DB Pension Plan OPEB Plans
($ millions) 1% increase 1% decrease 1% increase 1% decrease
Discount rate (18) 20 (36) 41
Health Care Cost Trend Rate N/A N/A 40 (32)

126 Notes to the Consolidated Financial Statements
Consolidated Financial Statements 47
Note 23 Cash Flows – Change in Non-cash Working Capital
Non-cash Working Capital($ millions) 2016 2015
Decrease (increase) in non-cash working capital
Accounts receivable (340) 844
Inventories (334) 570
Prepaid expenses 131 10
Accounts payable and accrued liabilities 316 (926)
Change in non-cash working capital (227) 498
Relating to:
Operating activities (235) 651
Financing activities 281 179
Investing activities (273) (332)
Note 24 Financial Instruments and Risk Management
Financial Instruments
The Company's financial instruments include cash and cash equivalents, accounts receivable, restricted cash, accounts payable and accrued liabilities, short-term debt, long-term debt, contribution payable, derivatives, portions of other assets and other long-term liabilities.
The following table summarizes the Company's financial instruments that are carried at fair value in the Consolidated Balance Sheets:
Financial Instruments at Fair Value($ millions) December 31, 2016 December 31, 2015
Commodity contracts - fair value through profit or loss (”FVTPL”)
Natural gas(1) 5 6
Crude oil(2) (30) 8
Other assets – FVTPL 1 2
Hedge of net investment(3)(4) (827) (940)
End of year (851) (924)
(1) Natural gas contracts includes an $11 million increase at December 31, 2016 (December 31, 2015 – $14 million decrease ) to the fair value of held-for-trading inventory, recognized in the Consolidated Balance Sheets, related to third party physical purchase and sale contracts for natural gas held in storage. Total fair value of the related natural gas storage inventory was $45 million at December 31, 2016 (December 31, 2015 – $67 million).
(2) Crude oil contracts includes an $17 million increase at December 31, 2016 (December 31, 2015 – $6 million decrease) to the fair value of held-for-trading inventory, recognized in the Consolidated Balance Sheets, related to third party crude oil physical purchase and sale contracts. Total fair value of the related crude oil inventory was $354 million at December 31, 2016 (December 31, 2015 – $190 million).
(3) Hedging instruments are presented net of tax.(4) Represents the translation of the Company's U. S. denominated long-term debt designated as a hedge of the Company's net investment in its U.S. refining operations.
The Company's other financial instruments that are not related to derivatives, contingent consideration or hedging activities are included in cash and cash equivalents, accounts receivable, restricted cash, income tax receivable, accounts payable and accrued liabilities, short-term debt, long-term debt, contribution payable, and portions of other assets and other long-term liabilities. These financial instruments are classified as loans and receivables or other financial liabilities and are carried at amortized cost. Excluding long-term debt, the carrying values of these financial instruments and cash and cash equivalents approximate their fair values.
The fair value of long-term debt represents the present value of future cash flows associated with the debt. Market information, such as treasury rates and credit spreads, are used to determine the appropriate discount rates. These fair value determinations are compared to quotes received from financial institutions to ensure reasonability. The estimated fair value of long-term debt at December 31, 2016was $5.5 billion (December 31, 2015 – $5.6 billion).

127Notes to the Consolidated Financial Statements
Consolidated Financial Statements 48
The estimation of the fair value of commodity derivatives and held-for-trading inventories incorporates exit prices and adjustments for quality and location. The estimation of the fair value of interest rate and foreign currency derivatives incorporates forward market prices, which are compared to quotes received from financial institutions to ensure reasonability. The estimation of the fair value of the net investment hedge incorporates foreign exchange rates and market interest rates from financial institutions. All financial assets and liabilities are classified as Level 2 measurements.
Risk Management Overview
The Company is exposed to risks related to the volatility of commodity prices, foreign exchange rates and interest rates. It is also exposed to financial risks related to liquidity and credit and contract risks. In certain instances, the Company uses derivative instruments to manage the Company's exposure to these risks. Derivative instruments are recorded at fair value in accounts receivable, inventory, other assets and accounts payable and accrued liabilities in the Consolidated Balance Sheets. The Company has crude oil and natural gas inventory held in storage related to commodity price risk management contracts that is recognized at fair value. The Company employs risk management strategies and policies to ensure that any exposures to risk are in compliance with the Company’s business objectives and risk tolerance levels.
Responsibility for risk management is held by the Company’s Board of Directors and is implemented and monitored by senior management within the Company.
a) Market Risk
i) Commodity Price Risk ManagementAll derivative instruments, other than those designated as effective hedging instruments or certain non-financial derivative contracts that meet the Company's own use requirements, are classified as held for trading and are recorded at fair value. Gains and losses on these instruments are recorded in the consolidated statements of income in the period they occur.
In certain instances, the Company uses derivative commodity instruments and futures contracts on commodity exchanges, including commodity put and call options under a short-term hedging program, to manage exposure to price volatility on a portion of its refined product, oil and gas production, and inventory or volumes in long distance transit. The Company may also use firm commitments for the purchase or sale of crude oil and natural gas. For the year ended December 31, 2016, the Company incurred a realized loss of $121 million on a short-term corporate hedging program, which is recorded in other-net in the Consolidated Statements of Income (Loss). The hedging program concluded in June 2016.
The Company’s results will be impacted by a decrease in the price of crude oil and natural gas inventory. The Company has crude oil inventories that are feedstock, held at terminals or part of the in-process inventories at its refineries and at offshore sites. The Company also has natural gas inventory that could have an impact on earnings based on changes in natural gas prices. All these inventories are subject to a lower of cost or net realizable value test on a monthly basis.
Foreign Exchange Risk ManagementThe Company’s results are affected by the exchange rates between various currencies, including the Canadian and U.S. dollar. The majority of the Company’s revenues are received in U.S. dollars or from the sale of oil and gas commodities that receive prices determined by reference to U.S. benchmark prices. An increase in the value of the Canadian dollar relative to the U.S. dollar will decrease the revenues received from the sale of oil and gas commodities. Correspondingly, a decrease in the value of the Canadian dollar relative to the U.S. dollar will increase the revenues received from the sale of oil and gas commodities. The majority of the Company’s expenditures are in Canadian dollars. The Company enters into short-dated foreign exchange contracts to fix the exchange rate for conversion of U.S. revenue dollars to hedge against these fluctuations and to mitigate its exposure to foreign exchange risk.
A change in the value of the Canadian dollar against the U.S. dollar will also result in an increase or decrease in the Company’s U.S. dollar denominated debt, as expressed in Canadian dollars, as well as the related finance expense. In order to mitigate the Company’s exposure to long-term debt affected by the U.S./Canadian dollar exchange rate, the Company may enter into cash flow hedges using cross currency debt swap arrangements. In addition, the Company’s U.S. dollar denominated debt has been designated as a hedge of a net investment in a foreign operation that has a U.S. dollar functional currency. The unrealized foreign exchange gain or loss related to this hedge is recorded in OCI.
At December 31, 2016, the Company had designated U.S. $3.0 billion denominated debt as a hedge of the Company’s selected net investments in its foreign operations with a U.S. dollar functional currency (December 31, 2015 – U.S. $3.2 billion). For the year ended December 31, 2016, the unrealized gain arising from the translation of the debt was $113 million (December 31, 2015 – unrealized loss of $587 million), net of tax loss of $17 million (December 31, 2015 – recovery of $92 million), which was recorded in hedge of net investment within OCI.
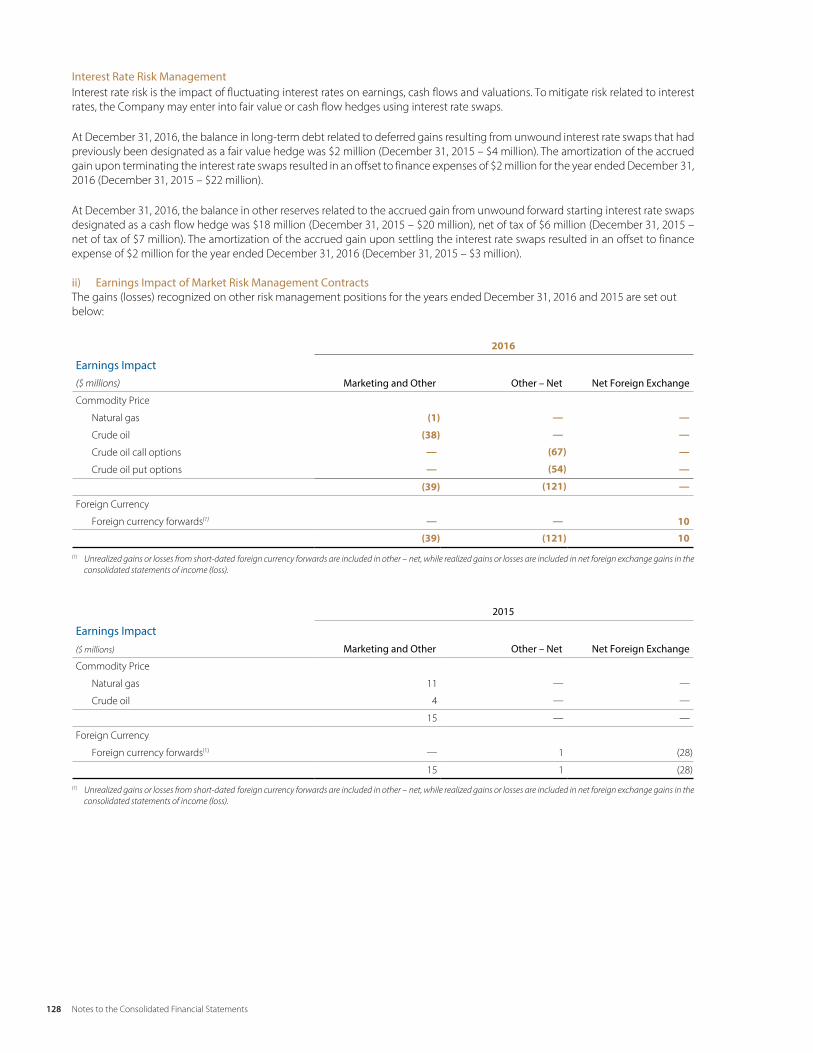
128 Notes to the Consolidated Financial Statements
Consolidated Financial Statements 49
Interest Rate Risk ManagementInterest rate risk is the impact of fluctuating interest rates on earnings, cash flows and valuations. To mitigate risk related to interest rates, the Company may enter into fair value or cash flow hedges using interest rate swaps.
At December 31, 2016, the balance in long-term debt related to deferred gains resulting from unwound interest rate swaps that had previously been designated as a fair value hedge was $2 million (December 31, 2015 – $4 million). The amortization of the accrued gain upon terminating the interest rate swaps resulted in an offset to finance expenses of $2 million for the year ended December 31, 2016 (December 31, 2015 – $22 million).
At December 31, 2016, the balance in other reserves related to the accrued gain from unwound forward starting interest rate swaps designated as a cash flow hedge was $18 million (December 31, 2015 – $20 million), net of tax of $6 million (December 31, 2015 – net of tax of $7 million). The amortization of the accrued gain upon settling the interest rate swaps resulted in an offset to finance expense of $2 million for the year ended December 31, 2016 (December 31, 2015 – $3 million).
ii) Earnings Impact of Market Risk Management ContractsThe gains (losses) recognized on other risk management positions for the years ended December 31, 2016 and 2015 are set out below:
2016
Earnings ImpactMarketing and Other Other – Net Net Foreign Exchange($ millions)
Commodity Price
Natural gas (1) — —
Crude oil (38) — —
Crude oil call options — (67) —
Crude oil put options — (54) —
(39) (121) —
Foreign Currency
Foreign currency forwards(1) — — 10
(39) (121) 10
(1) Unrealized gains or losses from short-dated foreign currency forwards are included in other – net, while realized gains or losses are included in net foreign exchange gains in the consolidated statements of income (loss).
2015
Earnings ImpactMarketing and Other Other – Net Net Foreign Exchange($ millions)
Commodity Price
Natural gas 11 — —
Crude oil 4 — —
15 — —
Foreign Currency
Foreign currency forwards(1) — 1 (28)
15 1 (28)
(1) Unrealized gains or losses from short-dated foreign currency forwards are included in other – net, while realized gains or losses are included in net foreign exchange gains in the consolidated statements of income (loss).

129Notes to the Consolidated Financial Statements
Consolidated Financial Statements 50
Offsetting Financial Assets and Liabilities
The tables below outline the financial assets and financial liabilities that are subject to set-off rights and related arrangements, and the effect of those rights and arrangements on the consolidated balance sheets:
As at December 31, 2016
Offsetting Financial Assets and Liabilities($ millions) Gross Amount Amount Offset Net Amount
Financial Assets
Financial derivatives 57 (38) 19
Normal purchase and sale agreements 529 (199) 330
End of year 586 (237) 349
Financial Liabilities
Financial derivatives (161) 70 (91)
Normal purchase and sale agreements (644) 234 (410)
End of year (805) 304 (501)
As at December 31, 2015
Offsetting Financial Assets and Liabilities ($ millions) Gross Amount Amount Offset Net Amount
Financial Assets
Financial derivatives 87 (37) 50
Normal purchase and sale agreements 353 (122) 231
End of year 440 (159) 281
Financial Liabilities
Financial derivatives (108) 48 (60)
Normal purchase and sale agreements (368) 68 (300)
End of year (476) 116 (360)
Market Risk Sensitivity AnalysisA sensitivity analysis for commodities, foreign currency exchange and interest rate risks has been calculated by increasing or decreasing commodity prices, foreign currency exchange rates or interest rates, as appropriate. These sensitivities represent the increase or decrease in earnings before income taxes resulting from changing the relevant rates, with all other variables held constant. These sensitivities have only been applied to financial instruments held at fair value. The Company’s process for determining these sensitivities has not changed during the year.
Commodity Price Risk(1)
($ millions) 10% price increase 10% price decrease
Crude oil price (6) 6
Natural gas price (7) 7
Foreign Exchange Rate(2)
Canadian dollar$0.01 increase
Canadian dollar$0.01 decrease($ millions)
U.S. dollar per Canadian dollar(3) — —
(1) Based on average crude oil and natural gas market prices as at December 31, 2016.(2) Based on the U.S./Canadian dollar exchange rate as at December 31, 2016.(3) Foreign Exchange sensitivity on U.S. dollar per Canadian dollar is less than $1 million.

130 Notes to the Consolidated Financial Statements
Consolidated Financial Statements 51
b) Financial Risk
i) Liquidity Risk ManagementLiquidity risk is the risk that the Company will not be able to meet its financial obligations as they become due. Liquidity risk also includes the risk of not being able to liquidate assets in a timely manner at a reasonable price. The Company’s processes for managing liquidity risk include ensuring, to the extent possible, that it has access to multiple sources of capital including cash and cash equivalents, cash from operating activities, undrawn credit facilities and capability to raise capital from various debt and equity capital markets under its shelf prospectuses. The Company prepares annual capital expenditure budgets, which are monitored and updated as required. In addition, the Company requires authorizations for expenditures on projects, which assists with the management of capital.
Since the Company operates in the Upstream oil and gas industry, it requires significant cash to fund capital programs necessary to maintain or increase production, develop reserves, acquire strategic oil and gas assets and repay maturing debt. The Company’s upstream capital programs are funded principally by cash provided from operating activities and issuances of debt and equity. During times of low oil and gas prices, a portion of capital programs can generally be deferred. However, due to the long cycle times and the importance to future cash flow of maintaining the Company’s production, it may be necessary to utilize alternative sources of capital to continue the Company’s strategic investment plan during periods of low commodity prices. As a result, the Company frequently evaluates the options available with respect to sources of short and long-term capital resources. Occasionally, the Company will economically hedge a portion of its production to protect cash flow in the event of commodity price declines.
The Company had the following available credit facilities as at December 31, 2016:
Credit Facilities($ millions) Available Unused
Operating facilities(1) (note 13) 670 292
Syndicated bank facilities(2) (note 15) 4,000 3,800
End of year 4,670 4,092(1) Consists of demand credit facilities and letter of credit. (2) Commercial paper outstanding is supported by the Company's Syndicated credit facilities.
In addition to the credit facilities listed above, the Company had unused capacity under the Canadian Shelf Prospectus of $1.9 billionand unused capacity under the U.S Shelf Prospectus and related U.S registration statement of U.S. $3.0 billion. The ability of the Company to raise additional capital utilizing these Shelf Prospectuses is dependent on market conditions.
The Company believes it has sufficient funding through the use of these facilities and access to the capital markets to meet its future capital requirements.
ii) Credit and Contract Risk ManagementCredit and contract risk represent the financial loss that the Company would suffer if a counterparty in a transaction fails to meet its obligations in accordance with the agreed terms. The Company actively manages its exposure to credit and contract execution risk from both a customer and a supplier perspective. The Company’s accounts receivables are broad based with customers in the energy industry and midstream and end user segments and are subject to normal industry risks. The Company’s policy to mitigate credit risk includes granting credit limits consistent with the financial strength of the counterparties and customers, requiring financial assurances as deemed necessary, reducing the amount and duration of credit exposures and close monitoring of all accounts. The Company had one external customer that constituted more than 10 percent of gross revenues during the years ended December 31, 2016 and December 31, 2015. Sales to this customer were approximately $1,832 million for the year ended December 31, 2016 (December 31, 2015 – $2,868 million).
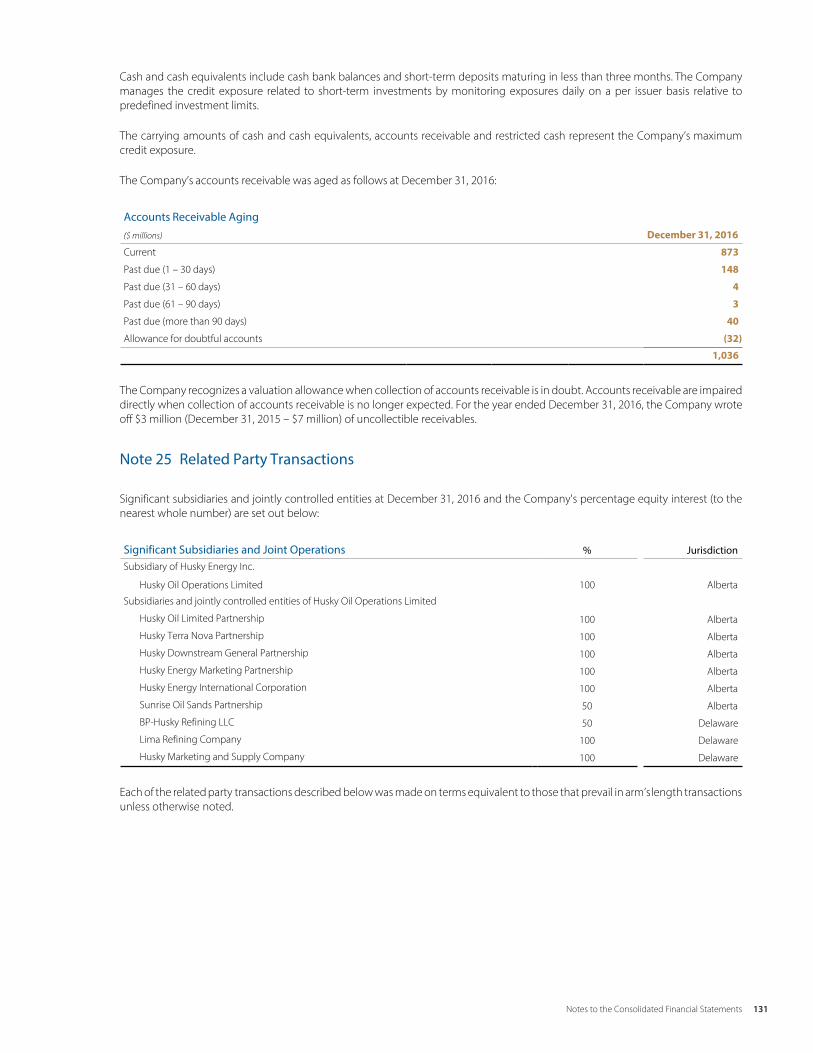
131Notes to the Consolidated Financial Statements
Consolidated Financial Statements 52
Cash and cash equivalents include cash bank balances and short-term deposits maturing in less than three months. The Company manages the credit exposure related to short-term investments by monitoring exposures daily on a per issuer basis relative to predefined investment limits.
The carrying amounts of cash and cash equivalents, accounts receivable and restricted cash represent the Company’s maximum credit exposure.
The Company’s accounts receivable was aged as follows at December 31, 2016:
Accounts Receivable Aging($ millions) December 31, 2016
Current 873
Past due (1 – 30 days) 148
Past due (31 – 60 days) 4
Past due (61 – 90 days) 3
Past due (more than 90 days) 40
Allowance for doubtful accounts (32)
1,036
The Company recognizes a valuation allowance when collection of accounts receivable is in doubt. Accounts receivable are impaired directly when collection of accounts receivable is no longer expected. For the year ended December 31, 2016, the Company wrote off $3 million (December 31, 2015 – $7 million) of uncollectible receivables.
Note 25 Related Party Transactions
Significant subsidiaries and jointly controlled entities at December 31, 2016 and the Company's percentage equity interest (to the nearest whole number) are set out below:
Significant Subsidiaries and Joint Operations % Jurisdiction
Subsidiary of Husky Energy Inc.
Husky Oil Operations Limited 100 Alberta
Subsidiaries and jointly controlled entities of Husky Oil Operations Limited
Husky Oil Limited Partnership 100 Alberta
Husky Terra Nova Partnership 100 Alberta
Husky Downstream General Partnership 100 Alberta
Husky Energy Marketing Partnership 100 Alberta
Husky Energy International Corporation 100 Alberta
Sunrise Oil Sands Partnership 50 Alberta
BP-Husky Refining LLC 50 Delaware
Lima Refining Company 100 Delaware
Husky Marketing and Supply Company 100 Delaware
Each of the related party transactions described below was made on terms equivalent to those that prevail in arm’s length transactions unless otherwise noted.

132 Notes to the Consolidated Financial Statements
Consolidated Financial Statements 53
On July 15, 2016, the Company completed the sale of 65 percent of its ownership interest in select midstream assets in the Lloydminster region of Alberta and Saskatchewan for gross proceeds of $1.69 billion in cash. The assets include approximately 1,900 kilometres of pipeline in the Lloydminster region, 4.1 mmbbls of storage capacity at Hardisty and Lloydminster and other ancillary assets. The assets are held by a newly-formed limited partnership, of which Husky owns 35 percent, PAH owns 48.75 percent and CKI owns 16.25 percent. This transaction is a related party transaction, as PAH and CKI are affiliates of one of the Company’s principal shareholders, and has been measured at fair value. The transaction enabled the Company to further strengthen its balance sheet while maintaining operatorship and preserving the integration between its heavy oil production, marketing and refining assets. Subsequent to the sale of its ownership interest, the Company performs management services as the operator of the pipeline for which it earns a management fee from HMLP. The Company is also the contractor for HMLP and constructs its assets on a cost recovery basis with certain restrictions. HMLP charges an access fee to the Company for the use of its pipeline systems in performing its blending business and the Company also pays for transportation and storage services. For the year ended December 31, 2016, the Company charged HMLP $133 millionrelated to construction and management services, and the Company had purchases from HMLP of $15 million related to the use of the pipeline for the Company's blending activities and $64 million related to transportation and storage. As at December 31, 2016, the Company had $26 million due from HMLP and nil due to HMLP related to these transactions. All transactions with HMLP have been measured at fair value.
The Company sells natural gas to and purchases steam from the Meridian Limited Partnership (”Meridian”), owner of the Meridian cogeneration facility, for use at the facility, Upgrader and Lloydminster ethanol plant. In addition, the Company provides facilities services and personnel for the operations of the Meridian cogeneration facility, which are primarily measured and reimbursed at cost. These transactions are related party transactions, as Meridian is an affiliate of one of the Company's principal shareholders, and have been measured at fair value. For the year ended December 31, 2016, the amount of natural gas sales to Meridian totalled $41 million(December 31, 2015 – $50 million). For the year ended December 31, 2016, the amount of steam purchased by the Company from Meridian totalled $13 million (December 31, 2015 – $16 million). For the year ended December 31, 2016, the total cost recovery by the Company for facilities services was $12 million (December 31, 2015 – $17 million). At December 31, 2016 the Company had under $1 million due from Meridian with respect to these transactions (December 31, 2015 – $2 million).
At December 31, 2016, $34 million of the May 11, 2009 7.25 percent senior notes were held by a related party, Ace Dimension Limited, and are included in long-term debt in the Company's consolidated balance sheet. The related party transaction was measured at fair market value at the date of the transaction and has been carried out on the same terms as applied with unrelated parties.
On June 29, 2011, the Company issued 7.4 million common shares at a price of $27.05 per share for total gross proceeds of $200 million in a private placement to its then principal shareholders, L.F. Management and Investment S.à r.l (formerly L.F. Investments (Barbados) Limited) and Hutchison Whampoa Luxembourg Holdings S.à r.l, which was completed in conjunction with a public offering by the Company of common shares.
On December 7, 2010, the Company issued 28.9 million common shares at a price of $24.50 per share for total gross proceeds of $707 million in a private placement to its principal shareholders, L.F. Management and Investment S.à r.l (formerly L.F. Investments (Barbados) Limited) and Hutchison Whampoa Luxembourg Holdings S.à r.l, which was completed in conjunction with a public offering by the Company of common shares in Canada.
The Company defines its key management as the officers and executives within the executive department of the Company. The amounts disclosed in the table below are the amounts recognized as an expense during the reporting period related to key management personnel:
Compensation of Key Management Personnel($ millions) 2016 2015
Short-term employee benefits(1) 9 15
Stock-based compensation(2) 4 8
13 23
(1) Short-term employee benefits are comprised of salary and benefits earned during the year, plus cash bonuses awarded during the year. Annual bonus awards settled in shares are included in stock-based compensation expense.
(2) Stock-based compensation expense represents the cost to the Company for participation in share-based payment plans.

Consolidated Financial Statements 54
Note 26 Commitments and Contingencies
At December 31, 2016, the Company had commitments that require the following minimum future payments, which are not accrued in the consolidated balance sheets:
Minimum Future Payments for Commitments
($ millions) Within 1 yearAfter 1 year but not
more than 5 years More than 5 years Total
Operating leases(1) 252 535 1,650 2,437
Firm transportation agreements(1) 458 1,851 4,822 7,131
Unconditional purchase obligations(2) 2,749 4,841 1,549 9,139
Lease rentals and exploration work agreements 49 244 850 1,143
Obligations to fund equity investee(3) 52 220 379 651
3,560 7,691 9,250 20,501
(1) Included in operating leases and firm transportation agreements are blending and storage agreements and transportation commitments of $0.6 billion and $2.1 billion respectively with HMLP.
(2) Includes purchase of refined petroleum products, processing services, distribution services, insurance premiums, drilling services and natural gas purchases. (3) Equity investee refers to the Company's investment in Husky-CNOOC Madura Limited and HMLP which is accounted for using the equity method.
The Company has income tax and royalty filings that are subject to audit and potential reassessment. The findings may impact the liabilities of the Company. The final results are not reasonably determinable at this time, and management believes that it has adequately provided for current and deferred income taxes.
The Company is involved in various claims and litigation arising in the normal course of business. While the outcome of these matters is uncertain and there can be no assurance that such matters will be resolved in the Company’s favour, the Company does not currently believe that the outcome of adverse decisions in any pending or threatened proceedings related to these and other matters would have a material adverse impact on its financial position, results of operations or liquidity.
Note 27 Capital Disclosures
The Company’s objectives when managing capital are to maintain a flexible capital structure, which optimizes the cost of capital at acceptable risk, and to maintain investor, creditor and market confidence to sustain the future development of the business. The Company manages its capital structure and makes adjustments as economic conditions and the risk characteristics of its underlying assets change. The Company considers its capital structure to include shareholders’ equity and debt which was $23.0 billion as at December 31, 2016 (December 31, 2015 – $23.3 billion). To maintain or adjust the capital structure, the Company may, from time to time, issue shares, raise debt and/or adjust its capital spending to manage its current and projected debt levels.
The Company monitors its capital structure and financing requirements using, among other things, non-GAAP financial metrics consisting of debt to capital employed and debt to funds from operations. Debt to capital employed is defined as long-term debt, long-term debt due within one year, and short-term debt divided by capital employed which is equal to long-term debt, long-term debt due within one year, short-term debt and shareholders' equity. Debt to funds from operations is defined as long-term debt, long-term debt due within one year and short-term debt divided by funds from operations which is equal to cash flow – operating activities less the settlement of asset retirement obligations, deferred revenue, income taxes received (paid) and change in non-cash working capital.
133Notes to the Consolidated Financial Statements

Consolidated Financial Statements 55
The Company’s objective is to maintain a debt to capital employed target of less than 25 percent and a debt to funds from operations ratio of less than 2.0 times. At December 31, 2016, debt to capital employed was 23.2 percent (December 31, 2015 – 28.9 percent) which was within the Company's target and debt to funds from operations was 2.6 times (December 31, 2015 – 2.0 times). The increase in the Company's debt to funds from operations ratio as at December 31, 2016 reflects the impact of continued operations in the low commodity price environment which resulted in significantly lower funds from operations compared to 2015. The Company has taken measures to strengthen its financial position and navigate through this commodity down cycle which include, but are not limited to, a reduction of budgeted capital spending, the suspension of the quarterly common share dividend, the sale of royalty interests in Western Canada production, the sale of non-core assets in Western Canada, a strategic disposition of select midstream assets and the continued transition to lower sustaining and higher return Lloyd thermal projects. To facilitate the management of these ratios, the Company prepares annual budgets, which are updated depending on varying factors such as general market conditions and successful capital deployment. The annual budget is approved by the Board of Directors.
The Company’s share capital is not subject to external restrictions; however, the syndicated credit facilities include a debt to capital covenant used to assess the Company's financial strength. The Company's leverage covenant under both of its revolving syndicated credit facilities was modified to a debt to capital covenant calculated as total debt (long-term debt including long-term debt due within one year and short-term debt) and certain adjusting items specified in the agreement divided by total debt, shareholders' equity and certain adjusting items specified in the agreement. If the Company does not comply with the covenants under the syndicated credit facilities, there is the risk that repayment could be accelerated. The Company was in compliance with the syndicated credit facility covenants at December 31, 2016 and assesses the risk of non-compliance to be low.
There were no changes in the Company’s approach to capital management from the previous year.
Note 28 Government Grants
The Company has government assistance programs in place where it receives funding based on ethanol production and sales from the Lloydminster and Minnedosa ethanol plants from the Department of Natural Resources and the Government of Manitoba. Applications for funding are submitted quarterly. During 2015, the Company received $21 million under these programs. The programs expired in 2015.
134 Notes to the Consolidated Financial Statements

135Supplemental Financial and Operating Information
Supplementa l Fina nci a l a nd Oper ating Infor m ation
Supplemental Financial and Operating Information1
SUPPLEMENTAL FINANCIAL AND OPERATING INFORMATION
Selected Ten-year Financial and Operating Summary
($ millions, except where indicated) 2016 2015 2014 2013 2012(1) 2011(1) 2010(2)(3) 2009(2)(3) 2008(2)(3) 2007(2)(3)
Financial Highlights
Gross Revenues and Marketing andOther 13,224 16,801 25,122 24,181 22,948 22,829 18,085 15,935 26,744 16,583
Net earnings (loss) 922 (3,850) 1,258 1,829 2,022 2,224 947 1,416 3,751 3,201
Earnings (loss) per share
Basic 0.88 (3.95) 1.26 1.85 2.06 2.40 1.11 1.67 4.42 3.77
Diluted 0.88 (4.01) 1.20 1.85 2.06 2.34 1.05 1.67 4.42 3.77
Capital expenditures(4) 1,705 3,005 5,023 5,028 4,701 4,618 3,571 2,797 4,108 2,974
Total debt(8) 5,339 6,756 5,292 4,119 3,918 3,911 4,187 3,229 1,957 2,814
Debt to capital employed (percent)(5) 23.2 28.9 20.0 17.0 17.0 18.0 22.0 18.0 12.0 19.0
Upstream
Daily production, before royalties
Crude oil & NGLs (mboe/day) 228.6 230.9 236.6 226.5 209.2 211.3 202.6 216.2 256.8 272.7
Natural gas (mmcf/day) 555.9 689.0 621.0 512.7 554.0 607.0 506.8 541.7 594.4 623.3
Total production (mboe/day) 321.2 345.7 340.1 312.0 301.5 312.5 287.1 306.5 355.9 376.6
Total proved reserves, before royalties (mmboe)(6) 1,224 1,324 1,279 1,265 1,192 1,172 1,081 933 896 1,014
Downstream
Upgrading
Synthetic crude oil sales (mbbls/day) 55.2 51.1 53.3 50.5 60.4 55.3 54.1 61.8 58.7 53.1
Upgrading differential ($/bbl) 20.74 18.66 21.80 29.14 22.34 27.34 14.52 11.89 28.77 30.73
Canadian Refined ProductsFuel sales (million of litres/day)(7) 6.6 7.6 8.0 8.1 8.7 9.5 8.2 7.6 7.9 8.7
Refinery throughput
Prince George refinery (mbbls/day) 9.4 10.7 11.7 10.3 11.1 10.6 10.0 10.3 10.1 10.5
Lloydminster refinery (mbbls/day) 27.8 28.1 28.8 26.4 28.3 28.1 27.8 24.1 26.1 25.3
US Refining and MarketingRefinery throughput
Lima Refinery (mbbls/day) 138.2 136.1 141.6 149.4 150.0 144.3 136.6 114.6 136.6 143.8
Toledo Refinery (mbbls/day)(9) 62.2 68.2 63.2 65.0 60.6 63.9 64.4 64.9 60.6 —
Refining Margin (U.S. $/bbl crude throughput) 8.94 10.09 9.37 15.06 17.48 17.60 7.29 11.37 (0.86) 12.42
(1) Gross revenues and U.S. refining margin have been recast for 2012 and 2011 to reflect a change in the classification of certain trading transactions. (2) Results reported for 2010 and previous years have not been adjusted for the change in presentation of the former Midstream.(3) Results are reported in accordance with previous Canadian GAAP. Certain reclassifications have been made to conform with current presentation.(4) Excludes capitalized costs related to asset retirement obligations and capitalized interest incurred during the period. (5) The financial ratios constitute non-GAAP measures. Refer to Section 11.3 of the Management’s Discussion and Analysis for disclosures on non-GAAP measures.(6) Total proved reserves, before royalties for 2010 onwards were prepared in accordance with the Canadian Securities Administrators’ National Instrument 51-101, “Standards of
Disclosure for Oil and Gas Activities.” Prior to 2010, reserves were prepared in accordance with the rules of the United States Securities and Exchange Commission guidelines and the United States Financial Accounting Standards Board. Refer to Section 11.2 of the Management’s Discussion and Analysis for a discussion.
(7) Fuel sales have been recast to exclude non-retail products, results reported for 2010 and previous years have not been adjusted for the change in presentation.(8) Total debt includes long-term debt, long-term debt due within one year and short-term debt.(9) BP-Husky Toledo Refinery throughput was revised in the first quarter of 2016 to reflect total throughput. Prior periods reflected crude throughput only and 2015 has been restated to
conform with current presentation. Results reported for 2014 and prior have not been adjusted for the change in presentation.

136 Supplemental Financial and Operating InformationSupplemental Financial and Operating Information
2
Segmented Financial Information
Upstream Downstream
Exploration and Production Infrastructure and Marketing Upgrading
($ millions) 2016 2015 2014 2013 2012 2016 2015 2014 2013 2012 2016 2015 2014 2013 2012
Year ended December 31
Gross revenues(2)(3) 4,036 5,374 8,634 7,333 6,581 955 1,264 2,202 2,134 2,377 1,324 1,319 2,212 2,023 2,191
Royalties (305) (432) (1,030) (864) (693) — — — — — — — — — —
Marketing – other(2)(3) — — — — — (88) 38 70 312 398 — — — — —
Revenues, net of royalties 3,731 4,942 7,604 6,469 5,888 867 1,302 2,272 2,446 2,775 1,324 1,319 2,212 2,023 2,191
Expenses
Purchase of crude oil and products(2) 32 41 96 91 73 857 1,123 2,056 2,004 2,258 808 922 1,676 1,378 1,636
Production and operating expenses(3) 1,760 2,076 2,172 2,016 1,875 20 37 32 21 12 168 169 180 161 150
Selling, general and administrativeexpenses 232 237 253 240 175 5 7 8 12 21 4 4 9 7 3
Depletion, depreciation,amortization and impairment 1,815 7,993 3,434 2,515 2,121 13 25 25 20 22 103 106 108 96 102
Exploration and evaluation expenses 188 447 214 246 344 — — — — — — — — — —
Loss (gain) on sale of assets (192) (17) (39) (19) (1) (1,439) — — — — — — — — —
Other – net 53 (34) (21) (16) (104) (3) (5) (2) (3) — (1) (11) 11 (27) (17)
Total Expenses 3,888 10,743 6,109 5,073 4,483 (547) 1,187 2,119 2,054 2,313 1,082 1,190 1,984 1,615 1,874
Earnings (loss) from operating activities (157) (5,801) 1,495 1,396 1,405 1,414 115 153 392 462 242 129 228 408 317
Share of equity investment (1) (5) (6) (10) (11) 16 — — — — — — — — —
Net financial items (140) (139) (152) (103) (73) — — — — — (1) (1) (1) (7) (11)
Earnings (loss) before income tax (298) (5,945) 1,337 1,283 1,321 1,430 115 153 392 462 241 128 227 401 306
Current income taxes (100) (41) 386 162 134 — 222 99 222 171 — (17) 47 19 31
Deferred income taxes 19 (1,566) (41) 169 211 122 (191) (60) (122) (55) 66 52 12 85 49
Total income tax provision (recovery) (81) (1,607) 345 331 345 122 31 39 100 116 66 35 59 104 80
Net earnings (loss) (217) (4,338) 992 952 976 1,308 84 114 292 346 175 93 168 297 226
Total assets as at December 31 19,098 21,103 26,035 24,653 22,774 1,582 1,699 1,969 1,670 1,506 1,076 1,141 1,243 1,355 1,242
(1) Eliminations relate to sales and operating revenues between segments recorded at transfer prices based on current market prices.(2) Gross revenues, marketing and other and purchases have been recast for the comparative periods presented above to reflect a change in the classification of certain trading transactions. (3) Results have been restated for the change in presentation of reclassification of processing facilities from Infrastructure and Marketing to Exploration and Production.
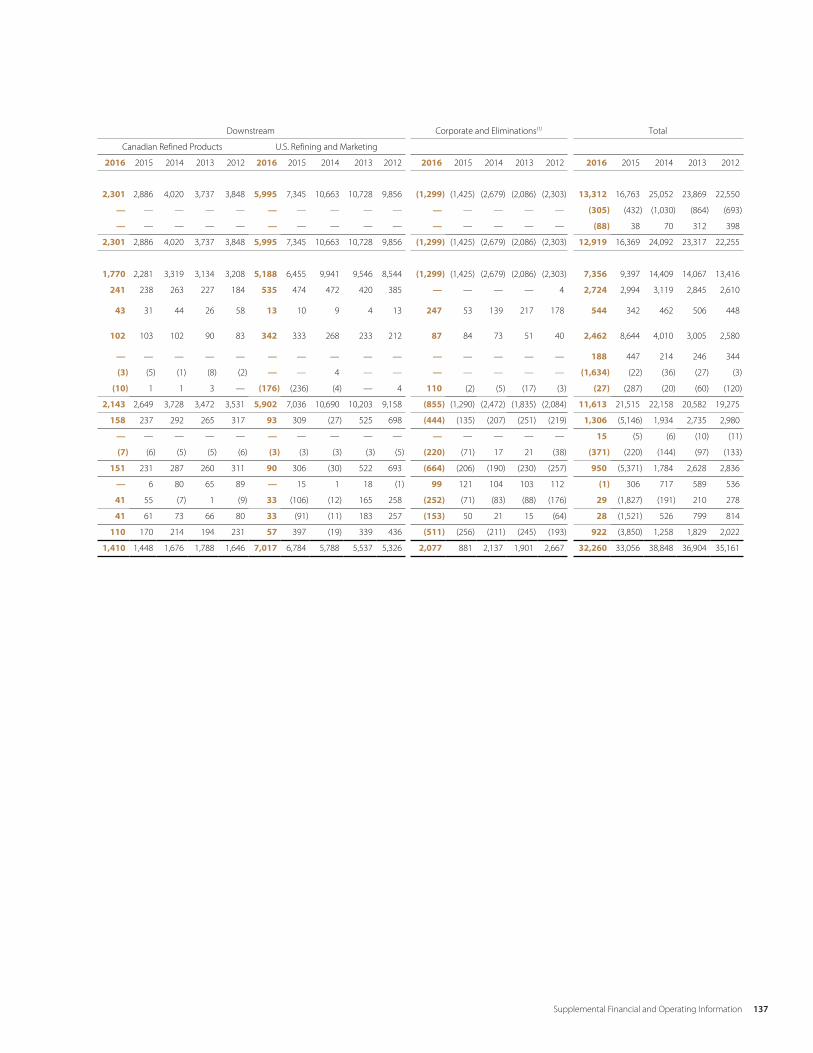
137Supplemental Financial and Operating Information
Supplemental Financial and Operating Information3
Downstream Corporate and Eliminations(1) Total
Canadian Refined Products U.S. Refining and Marketing
2016 2015 2014 2013 2012 2016 2015 2014 2013 2012 2016 2015 2014 2013 2012 2016 2015 2014 2013 2012
2,301 2,886 4,020 3,737 3,848 5,995 7,345 10,663 10,728 9,856 (1,299) (1,425) (2,679) (2,086) (2,303) 13,312 16,763 25,052 23,869 22,550
— — — — — — — — — — — — — — — (305) (432) (1,030) (864) (693)
— — — — — — — — — — — — — — — (88) 38 70 312 398
2,301 2,886 4,020 3,737 3,848 5,995 7,345 10,663 10,728 9,856 (1,299) (1,425) (2,679) (2,086) (2,303) 12,919 16,369 24,092 23,317 22,255
1,770 2,281 3,319 3,134 3,208 5,188 6,455 9,941 9,546 8,544 (1,299) (1,425) (2,679) (2,086) (2,303) 7,356 9,397 14,409 14,067 13,416
241 238 263 227 184 535 474 472 420 385 — — — — 4 2,724 2,994 3,119 2,845 2,610
43 31 44 26 58 13 10 9 4 13 247 53 139 217 178 544 342 462 506 448
102 103 102 90 83 342 333 268 233 212 87 84 73 51 40 2,462 8,644 4,010 3,005 2,580
— — — — — — — — — — — — — — — 188 447 214 246 344
(3) (5) (1) (8) (2) — — 4 — — — — — — — (1,634) (22) (36) (27) (3)
(10) 1 1 3 — (176) (236) (4) — 4 110 (2) (5) (17) (3) (27) (287) (20) (60) (120)
2,143 2,649 3,728 3,472 3,531 5,902 7,036 10,690 10,203 9,158 (855) (1,290) (2,472) (1,835) (2,084) 11,613 21,515 22,158 20,582 19,275
158 237 292 265 317 93 309 (27) 525 698 (444) (135) (207) (251) (219) 1,306 (5,146) 1,934 2,735 2,980
— — — — — — — — — — — — — — — 15 (5) (6) (10) (11)
(7) (6) (5) (5) (6) (3) (3) (3) (3) (5) (220) (71) 17 21 (38) (371) (220) (144) (97) (133)
151 231 287 260 311 90 306 (30) 522 693 (664) (206) (190) (230) (257) 950 (5,371) 1,784 2,628 2,836
— 6 80 65 89 — 15 1 18 (1) 99 121 104 103 112 (1) 306 717 589 536
41 55 (7) 1 (9) 33 (106) (12) 165 258 (252) (71) (83) (88) (176) 29 (1,827) (191) 210 278
41 61 73 66 80 33 (91) (11) 183 257 (153) 50 21 15 (64) 28 (1,521) 526 799 814
110 170 214 194 231 57 397 (19) 339 436 (511) (256) (211) (245) (193) 922 (3,850) 1,258 1,829 2,022
1,410 1,448 1,676 1,788 1,646 7,017 6,784 5,788 5,537 5,326 2,077 881 2,137 1,901 2,667 32,260 33,056 38,848 36,904 35,161

138 Supplemental Financial and Operating InformationSupplemental Financial and Operating Information
4
Upstream Operating Information
2016 2015 2014 2013 2012
Daily Production, before royalties
Light & Medium crude oil (mbbls/day) 63.1 80.5 91.2 95.1 87.5
NGL (mbbls/day) 14.0 18.2 14.0 9.2 8.9
Heavy crude oil (mbbls/day) 54.1 69.1 76.8 74.5 76.9
Bitumen (mbbls/day) 97.4 63.1 54.6 47.7 35.9
228.6 230.9 236.6 226.5 209.2
Natural gas (mmcf/day) 555.9 689.0 621.0 512.7 554.0
Total production (mboe/day) 321.2 345.7 340.1 312.0 301.5
Average sales prices
Light & Medium crude oil ($/bbl) 52.40 57.55 96.59 106.48 103.77
NGL ($/bbl) 38.01 45.88 72.61 70.49 66.96
Heavy crude oil ($/bbl) 30.50 37.16 71.91 63.44 61.91
Bitumen ($/bbl) 27.63 34.47 70.57 61.68 59.49
Natural gas ($/mcf) 4.40 5.80 5.99 3.19 2.60
Operating costs ($/boe) 14.04 15.14 16.12 16.28 15.49
Operating netbacks(1)(2)(3)
Light & Medium crude oil ($/bbl) 23.82 29.40 59.63 65.50 61.39
NGL ($/bbl) 22.99 32.10 50.01 39.60 37.15
Heavy crude oil ($/bbl) 9.25 14.56 41.95 34.61 38.31
Bitumen ($/bbl) 15.20 15.41 51.17 43.92 42.32
Natural gas ($/mcf) 2.51 3.93 3.79 1.06 0.77
(1) The operating netback includes results from Upstream Exploration and Production and excludes results from Upstream Infrastructure and Marketing. Operating netback is a non-GAAP measure. Refer to Section 11.3 of the MD&A .
(2) Operating netbacks are determined as gross revenue less royalties and production, operating and transportation expense on a per unit basis. Production and operating costs exclude accretion, which is included in administrative expenses and other.
(3) Includes associated co-products converted to boe.

139Supplemental Financial and Operating InformationSupplemental Financial and Operating Information
5
Supplemental Upstream Operating Statistics(6)
Operating Netback Analysis(1) 2016 2015 2014
Total UpstreamCrude Oil Equivalent ($/boe)(2)
Sales volume (mboe/day) 321.2 345.7 340.1
Gross revenue ($/boe)(7) 33.08 41.06 67.38
Royalties ($/boe) 2.60 3.43 8.30
Production and operating costs ($/boe)(7) 14.04 15.14 16.12
Transportation ($/boe)(3) 0.25 0.49 0.33
Operating netback ($/boe) 16.19 22.00 42.63
Depletion, depreciation, amortization and impairment ($/boe) 15.45 63.34 27.63
Administration expenses and other ($/boe) 2.62 2.56 3.30
Earnings (loss) before taxes (1.88) (43.90) 11.70
Operating netbacks by commodityCrude Oil & NGL's Total
Sales volume (mboe/day) 228.6 230.9 236.6
Gross revenue ($/boe)(7) 35.78 44.18 81.10
Royalties ($/boe) 3.36 4.48 11.12
Production and operating costs ($/boe)(7) 15.42 17.47 18.18
Transportation ($/boe)(3) 0.36 0.74 0.47
Operating netback ($/boe) 16.64 21.49 51.33
Natural Gas Total(2)
Sales volume (mmcf/day) 555.9 689.0 621.0
Gross revenue ($/mcf) (7) 4.40 5.80 5.99
Royalties ($/mcf) 0.12 0.13 0.30
Production and operating costs ($/mcf) (7) 1.77 1.74 1.90
Operating netback ($/mcf) 2.51 3.93 3.79
Lloydminster Heavy OilThermal Oil
BitumenSales volumes (mbbls/day) 65.5 48.4 43.8
Gross revenue ($/bbl)(7) 30.22 36.29 71.64
Royalties ($/bbl) 1.98 3.60 6.50
Production and operating costs ($/bbl)(7) 8.72 9.00 10.78
Operating netback ($/bbl) 19.52 23.69 54.36
Non Thermal Oil
Medium Oil
Sales volumes (mbbls/day) 2.1 2.1 1.8
Gross revenue ($/bbl)(7) 36.97 41.89 76.83
Royalties ($/bbl) 1.80 1.89 5.88
Heavy Oil
Sales volumes (mbbls/day) 44.9 54.8 61.8
Gross revenue ($/bbl)(7) 31.13 37.71 72.53
Royalties ($/bbl) 2.44 4.28 8.40
Natural Gas
Sales volumes (mmcf/day) 17.7 17.5 17.7
Gross revenue ($/mcf) (7) 1.76 2.26 4.01
Royalties ($/mcf) 0.09 0.19 0.53
Non Thermal Oil Total(2)
Sales volumes (mboe/day) 50.0 59.8 66.6
Gross revenue ($/boe)(7) 30.17 36.69 70.50
Royalties ($/boe) 2.34 4.04 8.10
Production and operating costs ($/boe)(7) 18.52 18.36 21.14
Operating netback ($/boe) 9.31 14.29 41.26
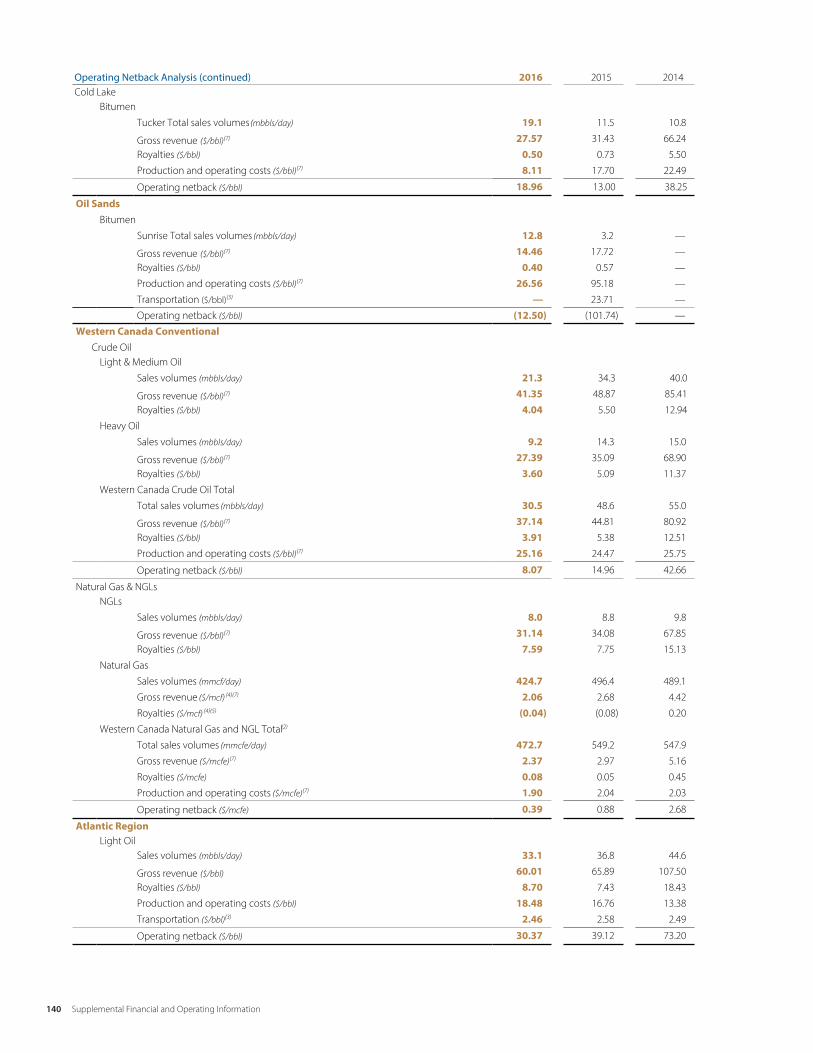
140 Supplemental Financial and Operating InformationSupplemental Financial and Operating Information
6
Operating Netback Analysis (continued) 2016 2015 2014Cold Lake
Bitumen
Tucker Total sales volumes (mbbls/day) 19.1 11.5 10.8
Gross revenue ($/bbl)(7) 27.57 31.43 66.24
Royalties ($/bbl) 0.50 0.73 5.50
Production and operating costs ($/bbl)(7) 8.11 17.70 22.49
Operating netback ($/bbl) 18.96 13.00 38.25
Oil SandsBitumen
Sunrise Total sales volumes (mbbls/day) 12.8 3.2 —
Gross revenue ($/bbl)(7) 14.46 17.72 —
Royalties ($/bbl) 0.40 0.57 —
Production and operating costs ($/bbl)(7) 26.56 95.18 —
Transportation ($/bbl)(3) — 23.71 —
Operating netback ($/bbl) (12.50) (101.74) —
Western Canada ConventionalCrude Oil
Light & Medium Oil
Sales volumes (mbbls/day) 21.3 34.3 40.0
Gross revenue ($/bbl)(7) 41.35 48.87 85.41
Royalties ($/bbl) 4.04 5.50 12.94
Heavy Oil
Sales volumes (mbbls/day) 9.2 14.3 15.0
Gross revenue ($/bbl)(7) 27.39 35.09 68.90
Royalties ($/bbl) 3.60 5.09 11.37
Western Canada Crude Oil Total
Total sales volumes (mbbls/day) 30.5 48.6 55.0
Gross revenue ($/bbl)(7) 37.14 44.81 80.92
Royalties ($/bbl) 3.91 5.38 12.51
Production and operating costs ($/bbl)(7) 25.16 24.47 25.75
Operating netback ($/bbl) 8.07 14.96 42.66
Natural Gas & NGLsNGLs
Sales volumes (mbbls/day) 8.0 8.8 9.8
Gross revenue ($/bbl)(7) 31.14 34.08 67.85
Royalties ($/bbl) 7.59 7.75 15.13
Natural Gas
Sales volumes (mmcf/day) 424.7 496.4 489.1
Gross revenue ($/mcf) (4)(7) 2.06 2.68 4.42
Royalties ($/mcf) (4)(5) (0.04) (0.08) 0.20
Western Canada Natural Gas and NGL Total(2)
Total sales volumes (mmcfe/day) 472.7 549.2 547.9
Gross revenue ($/mcfe)(7) 2.37 2.97 5.16
Royalties ($/mcfe) 0.08 0.05 0.45
Production and operating costs ($/mcfe)(7) 1.90 2.04 2.03
Operating netback ($/mcfe) 0.39 0.88 2.68
Atlantic RegionLight Oil
Sales volumes (mbbls/day) 33.1 36.8 44.6
Gross revenue ($/bbl) 60.01 65.89 107.50
Royalties ($/bbl) 8.70 7.43 18.43
Production and operating costs ($/bbl) 18.48 16.76 13.38
Transportation ($/bbl)(3) 2.46 2.58 2.49
Operating netback ($/bbl) 30.37 39.12 73.20

141Supplemental Financial and Operating InformationSupplemental Financial and Operating Information
7
Operating Netback Analysis (continued) 2016 2015 2014Asia Pacific Region
Light OilSales volumes (mbbls/day) 6.6 7.3 4.8
Gross revenue ($/bbl) 54.98 60.80 95.69
Royalties ($/bbl) 3.68 3.12 18.64
NGLs
Sales volumes (mboe/day) 6.0 9.4 4.2
Gross revenue ($/boe) 47.14 56.99 83.16
Royalties ($/boe) 2.65 3.19 4.4
Natural Gas
Sales volumes (mmcf/day) 113.5 175.1 114.2
Gross revenue ($/mcf) 13.58 14.98 13.03
Royalties ($/mcf) 0.72 0.81 0.64
Asia Pacific Light Oil, NGLs & Natural Gas Total(2)
Total sales volumes (mboe/day) 31.5 45.9 28.0
Gross revenue ($/boe) 69.40 78.49 82.02
Royalties ($/boe) 3.84 4.24 6.47
Production and operating costs ($/boe) 8.01 5.78 8.06
Operating netback ($/boe) 57.55 68.47 67.49
(1) The operating netback includes results from Upstream Exploration and Production and excludes results from Upstream Infrastructure and Marketing. Operating netback is a non-GAAP measure. Refer to Section 11.3 of the MD&A.
(2) Includes associated co-products converted to boe and mcf.(3) Includes offshore transportation costs shown separately from price received. During the first quarter of 2016, the Company reclassified Oil Sands transportation costs to net against
price received. Prior periods have not been restated. (4) Includes sulphur sales revenues/royalties. (5) Alberta Gas Cost Allowance reported exclusively as gas royalties.(6) In the third quarter of 2016, Husky completed the sale of its ownership interest in select midstream assets. These assets are held by HMLP, of which Husky has a 35% investment
in. Husky’s investment is considered a joint venture and is prospectively being accounted for using the equity method.(7) Transportation expenses for Western Canada, Oil Sands and Heavy Oil production has been deducted from both gross revenue and production and operating costs to reflect the
actual price received at the oil and gas lease.

of first production from, and combined nameplate capacities of, the Dee Valley, Spruce Lake North and Spruce Lake Central thermal projects; expected timing of first production from, and nameplate capacity of, the Rush Lake 2 thermal development; and anticipated combined nameplate capacities of identified potential Lloyd thermal developments; and
• with respect to the Company's Downstream operating segment: anticipated timing of completion, outcome, and benefits of the crude oil flexibility project at the Company's Lima Refinery; and timing to consider the sanctioning of a project to double asphalt capacity.
In addition, statements relating to “reserves” are deemed to be forward-looking statements as they involve the implied assessment based on certain estimates and assumptions that the reserves described can be profitably produced in the future. There are numerous uncertainties inherent in estimating quantities of reserves and in projecting future rates of production and the timing of development expenditures. The total amount or timing of actual future production may vary from reserve and production estimates.
Although the Company believes that the expectations reflected by the forward-looking statements presented in this report are reasonable, the Company’s forward-looking statements have been based on assumptions and factors concerning future events that may prove to be inaccurate. Those assumptions and factors are based on information currently available to the Company about itself and the businesses in which it operates. Information used in developing forward-looking statements has been acquired from various sources including third-party consultants, suppliers, regulators and other sources.
Because actual results or outcomes could differ materially from those expressed in any forward-looking statements, investors should not place undue reliance on any such forward-looking statements. By their nature, forward-looking statements involve numerous assumptions, inherent risks and uncertainties, both general and specific, which contribute to the possibility that the predicted outcomes will not occur. Some of these risks, uncertainties and other factors are similar to those faced by other oil and gas companies and some are unique to Husky.
Certain statements in this annual report are forward-looking statements and information (collectively “forward-looking statements”), within the meaning of the applicable Canadian securities legislation, Section 21E of the United States Securities Exchange Act of 1934, as amended, and Section 27A of the United States Securities Act of 1933, as amended. The forward-looking statements contained in this report are forward-looking and not historical facts.
Some of the forward-looking statements may be identified by statements that express, or involve discussions as to, expectations, beliefs, plans, objectives, assumptions or future events or performance (often, but not always, through the use of words or phrases such as “will likely result”, “are expected to”, “will continue”, “is anticipated”, “is targeting”, “estimated”, “intend”, “plan”, “projection”, “forecast”, “guidance”, “could”, “may”, “would”, “aim”, “vision”, “goals”, “objective”, “target”, “schedules” and “outlook”). In particular, forward-looking statements in this annual report include, but are not limited to, references to:• with respect to the business, operations and results of the
Company generally: the Company’s general strategic plans and growth strategies; forecasted total value, rate of return and break-even of identified projects; and the Board being better placed to consider re-establishing an appropriate cash dividend policy;
• with respect to the Company's Asia Pacific region: anticipated volumes of peak combined net sales volumes of gas and NGL from the BD, MDA-MBH and MDK fields; anticipated timing of first production at the MDA-MBH and MDK gas fields; anticipated timing of achieving full sales gas rates at, and volumes of peak net sales volumes of gas and liquids from, the BD field; and anticipated volume of liquids production net to Husky from the Liwan Gas Project;
• with respect to the Company's Atlantic region: anticipated timing of two additional White Rose infill wells; anticipated timing of two exploration wells in the Flemish Pass Basin; and timing to consider sanction of the West White Rose extension project;
• with respect to the Company's Oil Sands properties: anticipated continuation of ramp up at the Company's Sunrise Energy Project through 2017 and 2018;
• with respect to the Company's Heavy Oil properties: expected ramp up through 2017 and 2018 and plant capacity of the Tucker Thermal Project; anticipated timing
A dv isor ies
142 Advisories

Evaluation Handbook, have an effective date of December 31, 2016 and represent Husky's share. Unless otherwise noted, projected and historical production numbers given represent Husky’s share. Unless otherwise noted, historical production numbers are for the year ended December 31, 2016.
The Company uses the terms barrels of oil equivalent (“boe”), which is consistent with other oil and gas companies’ disclosures, and is calculated on an energy equivalence basis applicable at the burner tip whereby one barrel of crude oil is equivalent to six thousand cubic feet of natural gas. The term boe is used to express the sum of the total company products in one unit that can be used for comparisons. Readers are cautioned that the term boe may be misleading, particularly if used in isolation. This measure is used for consistency with other oil and gas companies and does not represent value equivalency at the wellhead.
The Company uses the term reserves replacement ratio, which is consistent with other oil and gas companies’ disclosures. Reserves replacement ratios for a given period are determined by taking the Company's incremental proved reserve additions for that period divided by the Company's upstream gross production for the same period. The reserves replacement ratio measures the amount of reserves added to a company's reserve base during a given period relative to the amount of oil and gas produced during that same period. A company's reserves replacement ratio must be at least 100% for the company to maintain its reserves. The reserves replacement ratio only measures the amount of reserves added to a company's reserve base during a given period.
Note to U.S. ReadersThe Company reports its reserves information in accordance with Canadian practices and specifically in accordance with National Instrument 51-101, “Standards of Disclosure for Oil and Gas Disclosure”, adopted by the Canadian securities regulators. Because the Company is permitted to prepare its reserves information in accordance with Canadian disclosure requirements, it may use certain terms in that disclosure that U.S. oil and gas companies generally do not include or may be prohibited from including in their filings with the SEC.
All currency is expressed in Canadian dollars unless otherwise indicated.
The Company’s Annual Information Form for the year ended December 31, 2016 and other documents filed with securities regulatory authorities (accessible through the SEDAR website www.sedar.com and the EDGAR website www.sec.gov) describe risks, material assumptions and other factors that could influence actual results and are incorporated herein by reference.
Any forward-looking statement speaks only as of the date on which such statement is made, and, except as required by applicable securities laws, the Company undertakes no obligation to update any forward-looking statement to reflect events or circumstances after the date on which such statement is made or to reflect the occurrence of unanticipated events. New factors emerge from time to time, and it is not possible for management to predict all of such factors and to assess in advance the impact of each such factor on the Company’s business or the extent to which any factor, or combination of factors, may cause actual results to differ materially from those contained in any forward-looking statement. The impact of any one factor on a particular forward-looking statement is not determinable with certainty as such factors are dependent upon other factors, and the Company's course of action would depend upon its assessment of the future considering all information then available.
Non-GAAP MeasuresThis report contains certain terms which do not have any standardized meaning prescribed by IFRS and are therefore unlikely to be comparable to similar measures presented by other issuers. The non-GAAP measurements included in this report are: funds from operations, adjusted net earnings, net debt and debt to capital employed. For further details on these non-GAAP measurements, please refer to the Non-GAAP Measures and Additional Reader Advisories contained in sections 11.3 and 11.4, respectively, of the Company’s Management’s Discussion and Analysis for the year ended December 31, 2016, which sections are incorporated by reference herein.
Disclosure of Oil and Gas InformationUnless otherwise stated, reserve estimates in this annual report, have been prepared by internal qualified reserves evaluators in accordance with the Canadian Oil and Gas
143Advisories
144 Corporate Information
Executives
Robert J. PeabodyPresident & Chief Executive Officer
Jonathan M. McKenzieChief Financial Officer
Rob W. P. SymondsChief Operating Officer
Gerald F. AlexanderSenior Vice President, Western Canada Production
Bradley H. AllisonSenior Vice President, Exploration
Robert I. BairdSenior Vice President, Downstream
Edward T. ConnollySenior Vice President, Heavy Oil
Nancy F. FosterSenior Vice President, Human & Corporate Resources
David A. GardnerSenior Vice President, Business Development
James D. GirgulisSenior Vice President, General Counsel & Secretary
Robert M. HinkelChief Operating Officer, Asia Pacific
Malcolm MacleanSenior Vice President, Atlantic Region
Terry J. ManningSenior Vice President, Safety, Engineering & Procurement
John W. G. MyerSenior Vice President, Oil Sands
Board of Directors
Victor T.K. Li, Co-Chairman
Canning K.N. Fok, Co-Chairman(2)
William Shurniak, Deputy Chairman(1)
Robert J. Peabody, President & Chief Executive Officer
Stephen E. Bradley(1)(3)
Asim Ghosh
Martin J.G. Glynn(2)(3)
Poh Chan Koh
Eva L. Kwok(2)(3)
Stanley T.L. Kwok(4)
Frederick S.H. Ma(1)(4)
George C. Magnus(1)
Neil D. McGee(4)
Colin S. Russel(1)(4)
Wayne E. Shaw(3)(4)
Frank J. Sixt(2)
(1) Audit Committee(2) Compensation Committee(3) Corporate Governance Committee(4) Health, Safety & Environment Committee
The Management Information Circular and the Annual Information Form contain additional information regarding the Directors.
Corpor ate Infor m ation
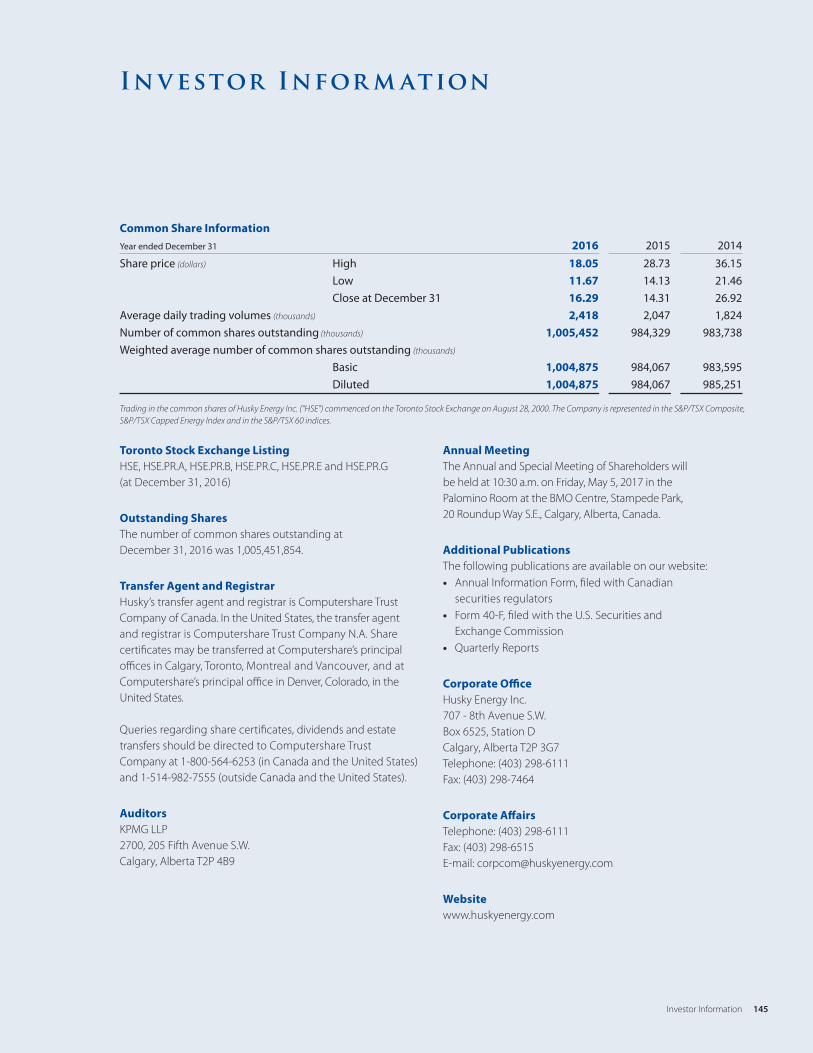
In v estor Infor m ation
Common Share InformationYear ended December 31 2016 2015 2014Share price (dollars) High 18.05 28.73 36.15 Low 11.67 14.13 21.46 Close at December 31 16.29 14.31 26.92Average daily trading volumes (thousands) 2,418 2,047 1,824Number of common shares outstanding (thousands) 1,005,452 984,329 983,738Weighted average number of common shares outstanding (thousands)
Basic 1,004,875 984,067 983,595 Diluted 1,004,875 984,067 985,251
Trading in the common shares of Husky Energy Inc. (“HSE”) commenced on the Toronto Stock Exchange on August 28, 2000. The Company is represented in the S&P/TSX Composite, S&P/TSX Capped Energy Index and in the S&P/TSX 60 indices.
Toronto Stock Exchange ListingHSE, HSE.PR.A, HSE.PR.B, HSE.PR.C, HSE.PR.E and HSE.PR.G (at December 31, 2016)
Outstanding SharesThe number of common shares outstanding at December 31, 2016 was 1,005,451,854.
Transfer Agent and RegistrarHusky’s transfer agent and registrar is Computershare Trust Company of Canada. In the United States, the transfer agent and registrar is Computershare Trust Company N.A. Share certificates may be transferred at Computershare’s principal offices in Calgary, Toronto, Montreal and Vancouver, and at Computershare’s principal office in Denver, Colorado, in the United States.
Queries regarding share certificates, dividends and estate transfers should be directed to Computershare Trust Company at 1-800-564-6253 (in Canada and the United States) and 1-514-982-7555 (outside Canada and the United States).
AuditorsKPMG LLP2700, 205 Fifth Avenue S.W. Calgary, Alberta T2P 4B9
Annual MeetingThe Annual and Special Meeting of Shareholders will be held at 10:30 a.m. on Friday, May 5, 2017 in the Palomino Room at the BMO Centre, Stampede Park, 20 Roundup Way S.E., Calgary, Alberta, Canada.
Additional PublicationsThe following publications are available on our website:• Annual Information Form, filed with Canadian
securities regulators• Form 40-F, filed with the U.S. Securities and
Exchange Commission• Quarterly Reports
Corporate OfficeHusky Energy Inc.707 - 8th Avenue S.W. Box 6525, Station D Calgary, Alberta T2P 3G7 Telephone: (403) 298-6111 Fax: (403) 298-7464
Corporate AffairsTelephone: (403) 298-6111Fax: (403) 298-6515E-mail: [email protected]
Websitewww.huskyenergy.com
145Investor Information

Design and Production: One DesignPrinting: CBN Commercial Solutions
Please recycle.Printed in Canada.
707 - 8th Avenue S.W. Box 6525, Station D Calgary, Alberta T2P 3G7www.huskyenergy.com