provision point mechanisms and field validity …web.uvic.ca/~rondeau/poeeare02.pdf · provision...
TRANSCRIPT

Environmental and Resource Economics 23: 105–131, 2002.© 2002 Kluwer Academic Publishers. Printed in the Netherlands.
105
Provision Point Mechanisms and Field ValidityTests of Contingent Valuation
GREGORY L. POE1, JEREMY E. CLARK2, DANIEL RONDEAU3 andWILLIAM D. SCHULZE4
1Cornell University, Ithaca, NY, USA, and Jackson Environment Institute (JEI) and the Centre forSocial and Economic Research on the Global Environment (CSERGE), University of East Anglia,Norwich, UK (email: [email protected]); 2University of Canterbury, Christ Church, NZ;3University of Victoria, BC, Canada; 4Cornell University, Ithaca, NY, USA
Accepted 5 December 2001
Abstract. Past field validity tests of contingent valuation have relied on voluntary contribution mech-anisms to elicit actual willingness to pay, and may overestimate hypothetical bias because of freeriding in the actual contributions. This paper argues that provision point mechanisms are a preferredalternative for field validity tests of contingent valuation because they increase the proportion ofdemand revealed in cases in which public goods can be provided in a step function. The results ofa contingent valuation validity study of participation in a green electricity pricing program that usesa provision point mechanism are reported, and hypothetical open-ended and dichotomous choiceresponses are compared to actual participation. Calibration of hypothetical responses is also explored.
Key words: contingent valuation, experimental economics, provision point mechanism, validity
JEL classification: Q20, Q26
1. Introduction
A critical issue in environmental economics and public policy is the ability ofcontingent valuation (CV) to measure “actual” willingness to pay (WTP) forenvironmental commodities (Arrow et al. 1993). Early field validity researchcompared hypothetical CV responses with values obtained from auctions and otheractual market transactions for familiar private (e.g., strawberries, Dickie et al.1987) and quasi-public goods (e.g., hunting permits, Bishop and Heberlein 1979).Although subsequent analyses of this data have provided mixed interpretations, thisearly validity research led some prominent CV researchers to conclude that “theoverwhelming weight from simulated market experiments favors the use of contin-gent valuation for estimating willingness to pay” (Bishop and Heberlein 1990).1
More recent efforts have sought to extend the CV/actual market comparisons toless familiar public goods with large nonuse components: Duffield and Patterson(1992) conducted such comparisons for leasing water rights for threatened trout

106 GREGORY L. POE ET AL.
streams, Seip and Strand (1992) evaluated hypothetical and actual sign-ups for anenvironmental organization, Brown et al. (1996) and Champ et al. (1997) comparedhypothetical and real donations for the removal of roads on the north rim ofthe Grand Canyon, Navrud and Veisten (1997) compared hypothetical and actualpayments for old growth forest parcels, and Champ and Bishop (2001) comparedhypothetical and actual contributions for a wind energy project. Together, thesestudies have suggested that there are considerable differences between hypotheticaland actual contributions, which have largely been attributed to biases associatedwith the hypothetical nature of CV. For example, Brown et al. (1996, p. 164)argue that “Hypothetical questions, especially about donations to generally desir-able environmental goods seem to engender overestimates of actual WTP.” Suchconclusions have lent some support to efforts to discredit CV as a public decisiontool. They have also led to efforts to “calibrate” hypothetical CV responses to betterapproximate measures of actual WTP (Diamond and Hausman 1994; Mansfield1998; Champ and Bishop 2001).
Relying on these past field comparisons to reject the use of CV in public policyapplications, or to use these studies to calibrate CV values, is inappropriate, sinceeach of these comparisons relies on a voluntary market contributions mechanism(VCM) as a criterion for conducting the validity test. Theoretical developmentsfollowing Samuelson (1954) and decades of experimental economics researchindicate that these mechanisms are neither incentive compatible in theory nordemand revealing in practice (see Ledyard 1995, for a comprehensive review of theliterature). Free riding is the expected norm. In VCM experiments involving realmoney, individuals typically contribute 40 to 60 percent of the Pareto optimumlevel (Davis and Holt 1993). This tendency of the VCM to reveal only a smallportion of the demand for public goods confirms its ineffectiveness as a public goodfunding mechanism, and makes it a particularly inappropriate market criterion touse as a base for assessing the validity of CV in field tests. Indeed, it remainspossible that the previously observed difference between hypothetical WTP andactual contributions to public goods could largely be explained by free riding ratherthan be a reflection of upward bias in hypothetical answers.2
Building on recent experimental economics research, this paper presents thefirst field study in which a provision point mechanism is used to test hypotheticalbias and possible calibration alternatives in CV. Such a mechanism has been shownto reduce free-riding in large group, single-shot settings (Rondeau et al. 1999; Roseet al. 2002). This paper should be viewed as part of an emerging paradigmaticthrust that brings experimental economics and laboratory contributions to bearon the validity testing of hypothetical values for private (e.g., Cummings et al.1995; Frykblom 1997; List and Shogren 1998; Balistreri et al. 2001) and publicgoods (e.g., Brookshire and Coursey 1987; Brookshire et al. 1990; Cummings et al.1997; Spencer et al. 1998; Cummings and Taylor 1999). However there is a criticaldistinction between this and previous research. Past research on public goods haslargely focused on conducting validity testing completely within an experimental

PROVISION POINT MECHANISMS AND FIELD VALIDITY TESTS 107
laboratory setting (e.g. Brookshire et al. Spencer et al. Cummings and Taylor).Other research has compared hypothetical field values with those obtained from arecruited laboratory sub-sample drawn from the same underlying population (e.g.,Brookshire and Coursey), in what some authors have dubbed “CVM-X” (Foxet al. 1998). Here, we follow a third option of bringing an improved elicitationmechanism to the field.
This paper is organized as follows. The following section provides compar-isons of provision point mechanisms with parallel VCM studies in a single shot,large group situation that mimics the VCM format of the Champ et al. (1997) CVfield validity test. This evidence demonstrates that past CV field validity tests arelikely to be misleading, and identifies provision point mechanisms as an alternativecriterion for validity testing. The third section reports the results from a field test inwhich hypothetical open-ended and dichotomous choice CV responses for “green”electricity are compared to actual participation levels. Importantly, the actual andhypothetical values were collected using a provision point mechanism. Section4 explores possible calibration tools for these CV responses. Conclusions andimplications are provided in the final section.
2. Provision Point Mechanisms (PPM): An Improvement on the VCM
An important finding from decades of experimental economics research is that nopublic goods elicitation mechanism, even if it is theoretically incentive compatible,is perfectly demand revealing in practice (Smith 1979, 1980; Harstead and Marrese1982; Davis and Holt 1993).3 Public goods mechanisms that increase incentivestowards perfect revelation of demand have been developed over the years (e.g.,Groves and Ledyard 1977; Smith 1980; Falkinger et al. 2000), and some havebeen shown to approach aggregate demand revelation in laboratory experiments.Unfortunately, extending these mechanisms to CV field research is problematicbecause they often involve extremely complex incentive structures, are compulsory(e.g., involve a tax), or require unanimity and necessitate an interactive small-groupsituation. Moreover, these mechanisms typically require multiple rounds beforethey approximate group demand revelation, and are therefore not readily applicablein one-shot CV-like field situations. In this context, it is understandable that priorCV public goods field validity studies have relied on the VCM despite its poorperformance at eliciting actual payments that are comparable to public good values.
Experimental economics research conducted over the last three decadessuggests that provision point modifications to the VCM can greatly reduce free-riding in public goods experiments (Brubaker 1976, 1982; Dawes et al. 1986;Isaac et al. 1989; Bagnoli and McKee 1991; Suleiman and Rapoport 1992; Myskeret al. 1996; Marks and Croson 1998, 1999; Cadsby and Maynes 1998, 1999a, b;Rondeau et al. 1999; Rose et al. 2002). A provision point (PP) is a minimum levelof aggregate contributions below which the public good is not provided.4 A money-back guarantee (MBG) can be added to a provision point mechanism (PPM) so

108 GREGORY L. POE ET AL.
that individual contributions are refunded if the PP is not reached by the group. Arebate rule for disposing of contributions in excess of the PP is a second form ofassurance against the potential loss of contributions. As discussed in Marks andCroson (1998) this may take the form of a proportional rebate (PR) rule, in whichall excess contributions are returned to contributors in proportion to the weight ofeach subject’s contribution to the group fund. Extending benefits (EB) by using theexcess money to increase production of the public good is alternative rebate rulemore commonly utilized by fund raisers.
Of particular interest to CV research, Rondeau et al. (1999) and Rose etal. (2001) demonstrate that, even though these mechanisms are not incentivecompatible, a PPM with a MBG and either a PR or EB can greatly reduce freeriding and increase the proportion of demand revealed in large group, single-shot environments.5 Here we extend the Rondeau et al. analysis, and comparePPM/MBG/PR results to those obtained in a laboratory VCM context mimickingthe conditions underlying the well-known Champ et al. (1997) validity study.The research presented in this paper differs from previous research on PPMs intwo important ways. First, we develop an experimental design that allows directexperimental economics comparison between PPM and VCM methods. Second,we employ a PPM in a field validity test of alternative CV elicitation methods.
The Champ et al. (1997) field study (also reported in Brown et al. 1996) elicitedWTP values for road removal on the North Rim of the Grand Canyon, an areatargeted for designation as wilderness. To “establish a clear tie between individualpayments and provision” (Brown et al. p. 155), the public good (road removal) wasmade divisible by assigning a cost (C) per foot of road removal (X). In both hypo-thetical and actual elicitations, respondents of the open-ended (OE) format wereasked “What is the most you would be willing to pay to provide food and suppliesfor volunteer crews. Each $1 you contribute would result in the removal of 8 feet ofroad . . .”. In the actual and hypothetical dichotomous choice (DC) treatments thefollowing question was posed “Are you willing to pay $ to provide food andsupplies for volunteer crews? Your $ would lead to the removal of feet ofroad . . .” (Brown et al. p. 155).6 Despite this divisibility, the essential elements of apublic good are retained. The benefits of the road removal are non-rival. Individualsreceive value from the road removal project regardless of their level of contribution.Contributions provide a non-exclusionary benefit to others. As such, the dominantNash equilibrium is for each individual to free ride.
Making a transformation between dollars and foot of road removal, this valueelicitation field experiment can be framed in a standard induced value labor-atory setting as follows: each individual (i) is assigned an induced value (Vi)for each dollar contributed to a public account and must choose to allocate hisor her personal endowment (ωi) between bids to public (Bi) and private (ωi –Bi) accounts. Consistent with the Champ et al. framework, the payoff per dollarcontributed to the public account is assumed to be a linear function of road removalup to the point where all possible roads could be removed.7 This is equivalent to the

PROVISION POINT MECHANISMS AND FIELD VALIDITY TESTS 109
sum of individual bids to the public good (�Bi) equaling total cost of the project(TC). The Champ et al. questionnaire failed to identify how the dollars would beused if total contributions exceeded total cost, and we adopt a default assumptionthat no additional value accrues to the group when contributions exceed total cost.8
Letting TVi equal the total value of the complete project to individual i (i.e.,TVi = Vi * TC), the laboratory parallel to the Champ et al. collection mechanismcan be characterized as follows:
�Bi < TC i receives Vi for each dollar contributed, pays Bi . (1-1)
�Bi = TC i receives TVi, pays Bi . (1-2)
�Bi > TC i receives TVi, pays Bi . (1-3)
The fact that the last two outcomes differ only in �Bi reflects the discontinuousfirst order relationship between Vi and �Bi at the threshold of the complete project.For total contributions below this threshold, individual returns are a linear func-tion of �Bi with a slope of Vi . Beyond �Bi = TC, additional contributions donot provide additional value: all roads have been removed. From an experimentaleconomics perspective, this kink in the payoff function at �Bi avoids the standardVCM laboratory result that the welfare maximizing outcome is for all participantsto give their entire endowment.
Using this notation, a PP/MBG/PR can be described as follows.
�Bi < TC Money back guarantee, no one pays, no benefits. (2-4)
�Bi = TC i receives TVi, pays Bi . (2-5)
�Bi > TC i receives TVi, pays Bi less proportional rebate. (2-6)
Where, TC is identical to the PP in this instance.With this framework, we conducted a series of induced value experiments. All
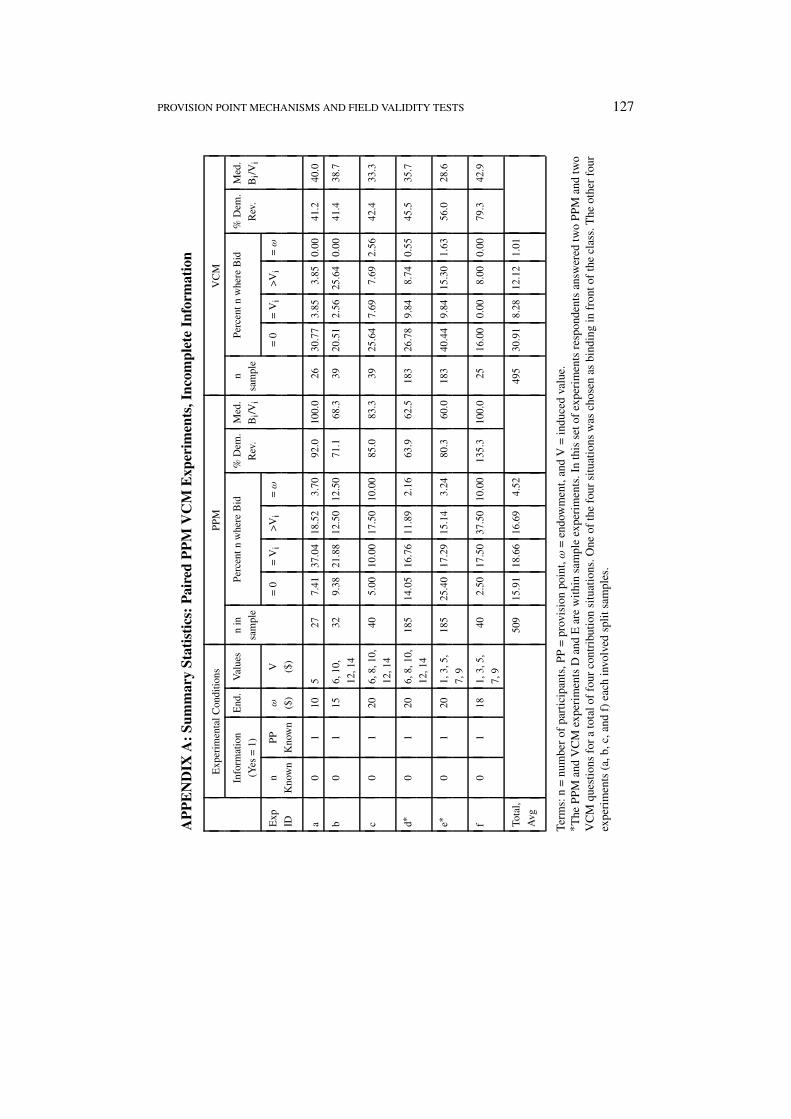
experiments reported here involve pen and paper experiments conducted in largeintroductory economics classrooms. Participation was voluntary and confidential,it was stressed that only money was involved and participation was not related tograde. The experiment was conducted by “guest” faculty members not teaching theclass. Instructions were distributed and a brief presentation followed an individualreading period. Questions were answered individually. Appendix A provides asummary of the endowments, values, and participation data for the experimentsreported below. Experimental instructions are available from the authors.
Figure 1 and Figure 2 provides distributions of central tendencies for classroomexperiments in which PP was known and n was unknown, and thus the dominantcost-share Nash equilibria describe in Bagnoli and Lipman (1989) could not becalculated. The principal features of these experiments are described in Appendix

110 GREGORY L. POE ET AL.
Figure 1. CDF, percent aggregate demand revelation, PPM and VCM experiments.
Figure 2. CDF, Median Bi/Vi, PPM and VCM experiments.
A. Figure 1 depicts the distribution of percent demand revelation across exper-iments, which is of obvious interest from a Kaldor-Hicks perspective. Figure 2focuses on the median of the bid to value ratio, Bi/Vi , which is relevant to amajority-rule voting framework. This ratio also minimizes the effect of extremebids such as those associated with full endowment bidding.
As suggested in these Figures and reiterated in Appendix A, the percent ofdemand revealed in the PPM was substantially higher than that in the VCM, with

PROVISION POINT MECHANISMS AND FIELD VALIDITY TESTS 111
PPM values ranging from 63.9% to 135.3% and VCM values ranging from 41.2%to 79.3%. Treating the mean percent demand revealed as the unit of observation,paired t-tests and the Wilcoxon Matched-Pairs Signed Rank Tests indicate thatthese distributions of values are significantly different (t = 5.99, p < 0.010, n =6; z = 2.20, p = 0.028, n = 6).9 Similarly, the median Bi/Vi ratio ranges from60.0% to 100.0% for the PPM and 28.6% to 42.9% for the VCM. These mean andmedian distributions are significantly different when evaluated using either a pairedt-test or the Wilcoxon Matched-Pairs Signed Rank Test, respectively (t = 6.98, p <0.010, n = 6; z = 2.20, p = 0.028). Thus, even though the percent of demandrevelation varied across experiments, the fraction of value reported is consistentlyand significantly higher in the PPM. To date, such direct comparisons have notbeen provided in the experimental economics literature.
Nevertheless, individual behavior in each of these experiments is noisy incon-sistent with individual demand revelation. A portion of individuals in each mech-anism adopt a strong free-rider approach of zero (or $0.01) contributions. Othersprovide bids equal to their induced values.10 And still others contribute bidsexceeding their values. Importantly, as demonstrated in Appendix A the percentageof free riders in the PPM is about half that of the VCM (VCM = 29.8%, PPM= 15.6%) while the percentage of bids equal to value more than doubles acrossmechanisms (VCM = 8.0%, PPM = 17.7%). A point of concern in comparing themechanisms may be the high percentage of apparently irrational bids exceedingvalues and full endowment bids in the PPM – indicating that some respond-ents may be erroneously trying to capture some portion of the rebate. However,recent experimental economics research demonstrates that warm glow, altruismand other-regarding behavior may play a confounding role in induced value publicgoods experiment (e.g., Andreoni 1995; Palfrey and Prisbey 1997; Ferraro et al.2002). Regardless of cause, it should be noted that the percentage of endowmentbidding across the PPM experiments (4.9%) is lower than the 6.5% reported bySmith (1980) in the final round of the incentive-compatible, unanimity-rule Smithauction. Moreover, the level of over contribution (16.7%) relative to induced valueis of the same order of magnitude as the first round reported in Bagnoli and McKee(12.5%). Thus, the distribution of bids in these experiments is consistent with otherresearch in experimental economics.
In sum, the results of these experiments are suggestive and confirm previousresearch and conjectures. Notably, even though it is not theoretically incentive-compatible, the PPM performs substantially better than the VCM in elicitingcontributions. We now turn to a field test that compares actual participation withhypothetical contributions in a provision point setting.

112 GREGORY L. POE ET AL.
3. The Niagara Mohawk Power Corporation (NMPC) Field Validity Test
3.1. EXPERIMENTAL DESIGN
The mechanism adopted by NMPC employed three of the features discussedpreviously. First, it contained a PP of $864,000 to be raised through customercontributions. This minimum level of funding would provide for the constructionof a renewable energy facility to serve 1,200 homes, and for the planting of 50,000tress in the NMPC service area. Second, NMPC’s funding mechanism offered aMBG to customers which assured them that, if contributions failed to reach thethreshold, all money collected would be refunded. Third, the mechanism offeredthe possibility of EB. Money collected in excess of the provision point would beused to increase the number of homes served with renewable energy or to plantmore trees. However, for NMPC’s GreenChoiceTM program to legally qualify asa rate offering, it could only be offered at a single posted price, rather than acontinuous contribution setting of the previous experiments. Thus, customers couldonly choose to contribute a fixed amount $6.00 per month or not participate at all,rather than contribute a value that more closely reflects their preferences. Note that,despite the posted price, the mechanism does not reduce to a referendum, becausethe only individuals to pay are those who choose to participate.
We applied such a mechanism in a telephone survey comparison of hypothet-ical and real commitments of NMPC’s GreenChoiceTM program. Hypothetical CVresponses were collected using two telephone formats. The first was a DC versiondirectly paralleling the actual solicitation. The second was an OE version askingrespondents the most they would be willing to pay for the program. These twosurvey formats offer extremes on the continuum of continuous to discrete choiceCV. Past experimental economics and CV research have demonstrated that substan-tial procedural variance exists between these formats (see summaries in Brown etal. 1996, and Schulze et al. 1996). A critical question from a policy standpoint iswhich format most closely approximates actual preferences. We will examine thisquestion in the case of a public good offered at a single price.
All survey instruments followed the Dillman Total Design Method adaptedto telephone surveys (Dillman 1978). The program description paralleled theactual NMPC solicitation materials distributed to the public, despite the fact thatthese materials provided substantially less information than state of the art in CVresearch. In order to control for awareness, phone, rather than mail, surveys wereemployed.
Successive pretests of the survey were administered by phone to ensure thatrespondents clearly understood the instrument. The final phone survey was admin-istered by Hagler Bailly Consulting, Inc., using a random sample of householdsin the Buffalo, NY area. Households in the sample were sent a hand-signed coverletter on Cornell University letterhead announcing the survey. The letter informedthem that they had been selected as one of a small sample of customers to partici-pate in the study of a new type of environmental program. The study’s sponsors
PROVISION POINT MECHANISMS AND FIELD VALIDITY TESTS 113
were identified as the National Science Foundation and the Environmental Protec-tion Agency, together with NMPC. A two dollar bill was enclosed as a token ofappreciation for participation.
The phone survey itself ran as follows. Both actual and hypothetical versionsbegan by reaching the person in the household who usually paid the NMPC electricbill. Speaking to that person, the interviewer described the survey’s purpose andsponsors. The individual was then asked to rate NMPC’s service. Next, customerawareness of the program was obtained, and the goals of the program weredescribed. Using a one (“not at all interested”) to 10 (“very interested”) scalerespondents were then asked to indicate their interest in “the goal of replacingfossil energy with renewable energy sources” and “the goal of planting trees onpublic lands in upstate New York”. Depending on the version, the funding planwas then described as follows:
The GreenChoice program would be funded voluntarily. Customers who decideto join the program would pay an additional fixed fee of $6 per month ontheir NMPC bill. This fee would not be tax deductible. Customers could signup or cancel at any time. While customers sign up, NMPC would ask forbids on renewable energy projects. Enough customers would have to becomeGreenChoice partners to pay for the program. For example if 12,000 customersjoined the first year, they would invest $864,000, which would allow NiagaraMohawk to plant 50,000 trees and fund a landfill gas project. The gas projectcould replace all fossil fuel electricity in 1,200 homes. However, if after oneyear, participation were insufficient to fund GreenChoice activities, NiagaraMohawk would cancel the program and refund all the money that was collected.
For the OE format, the underlined section “of $6” was removed. The exact dollaramount of the provision point was hedged somewhat by NMPC so that the renew-able energy project could be sent for competitive bid while the program wasunderway.
The survey then asked respondents whether the program’s funding mechanismmade them more or less interested in the program, again using the one to 10scale of interest. After this, respondents in the actual version were faced with theparticipation question:
So far I’ve described the GreenChoice program, as well as the $6 per monthcost it would add to your household’s electrical bill, if you were to join.You may need a moment to consider the next couple of questions. Given yourhousehold’s income and expenses, I’d like you to think about whether or notyou would be interested in the GreenChoice program. If you decide to signup, we will send your name to Niagara Mohawk, and get you enrolled in theprogram. All your other answers to this survey will remain confidential. Doesyour household want to sign up for the program at a cost of $6.00 per month?
In the hypothetical DC version, the underlined portions were replaced by: “Wouldyour household sign up for the program if it cost you $6 per month?”. In the hypo-

114 GREGORY L. POE ET AL.
thetical OE version, the bold portions were removed and the underlined sectionwas replaced with “What is the highest amount, if anything, that your householdwould pay each month and still sign up for the program?” All surveys endedwith debriefing and socio-economic questions useful for modeling demand.11 Withactual and hypothetical measures of participation identified, we turn next to theresults of the surveys.
3.2. RESULTS AND ANALYSIS
A random sample of 1250 households in the Buffalo, NY area, based on zipcode delineation, was purchased from Geneysis, Inc., a marketing research firm.As adjusted sample of 985 households remained after removing bad addresses,unlisted numbers, non-NMPC customers, language barriers, and three respond-ents who had previously heard of the GreenChoiceTM program. Among these 985households, 206 were in the actual mechanism sample, 393 were in the hypo-thetical OE sample, and 386 were in the hypothetical DC sample.12 Using theseadjusted sample values as a base, conditional response rates were 70.7 percent foractual mechanism sample (145 completed surveys), 71.8 percent for the hypothet-ical DC sample (294 completed surveys) and 75.8 percent for the hypothetical OEsample (275 completed surveys).
Of the actual mechanism sample of 206,179 were reached by phone.13 Ofthese, 34 refused to be surveyed, 2 chose not to answer the participation question,and 1 contact had a language barrier. For the remaining 145 respondents in the“actual” sample, 29 signed up for the program, resulting in a participation rateof 20.4 percent. Participation would fall to 16.2 percent if we assume that the37 people contacted who did not complete the survey would have declined theprogram. Note also, only three people from our entire sample recalled having heardabout the program, reflecting NMPC’s decision not to market the program. Assuch, these data indicate strong potential support for the GreeenChoiceTM programamongst NMPC customers, and suggest that the program could have been funded ifmarketing had been successful in increasing awareness. Rose et al. (2002) provideadditional information on these issues.
The estimated participation rate of 16.2 to 20.4 percent is also substantiallyhigher than that observed in the majority of other green pricing programs reportedin the literature (Baugh et al. 1995; Brynes et al. 1999; Holt 1997; Farhar andHouston 1996). There are, however, substantial differences between this and mostprevious programs. First, program awareness was fully controlled for. In previousprograms, participation rates have typically been defined over the broader baseof total customers or customers targeted with direct mailings. Yet, as our findingsuggest, customer inserts and direct mailings do not guarantee even minimal aware-ness among customers. Secondly, as noted, previous participation program havemostly relied upon voluntary contributions, rather than the PPM used here.

PROVISION POINT MECHANISMS AND FIELD VALIDITY TESTS 115
We use the 16.2 and 20.4 percent sign-up rates as benchmarks for testing thehypothetical bias associated with OE and DC CV questions among survey respond-ents. We do so using two methods of analysis. First we compare participation ratesacross actual and hypothetical versions using simple contingency table analyses(Conover 1980). Second, we model the participation decision and, controlling forsocio-economic and other factors, test the hypothesis that participation rates differbetween actual and hypothetical treatments. To conduct the analysis, OE responsesare converted to participation rates based on whether the values given exceed the$6 threshold.14
The estimated participation rate from the OE responses is 24.3 percent (n =284), or 19 to 50 percent higher than the actual participation rates. The 30.6 percentparticipation rate (n = 258) from the DC responses is 50 to 89 percent higherthan the actual participation rates. These results contrast with the NOAA panelrecommendation that DC values offer conservative, and thus preferable, estimatesof value (Arrow et al. 1993). At the same time, they are consistent with previouscomparisons in CV and laboratory experiments (see Brown et al. 1996 and Schulzeet al. 1996 for reviews). A Chi-Squared contingency table analysis, in which Tindicates the calculated test statistic (Conover, p. 145), cannot reject the hypothesisthat actual and hypothetical OE participation levels are the same at any standardlevel of significance (T = 0.80 < χ1,0.10 = 2.71) when 20.4 percent is used as areference participation rate. A significant T value of 4.81 is estimated when the 16.2percent is used as the criterion. In contrast, the DC sign-up rate of 30.6 percent issignificantly higher than the actual value 16.2 percent (T = 11.81) and 20.4 percent(T = 4.83).
Following established DC valuation techniques, we next assume a logisticdistribution function to model an individual’s participation decision as a functionof covariates elicited in the questionnaire. Using actual, unadjusted responses as abase, we include binary variables to test whether each of the hypothetical patternsis significantly different from the actual response pattern. While other researchershave used regression analyses as a means of calibrating individual values (e.g.Mansfield 1998), our intent here is to simply incorporate individual specific vari-ables as control variables in a test of intercept shifts across survey groups. Assuch, our objective is to assess the conditional proportion (and significance of theproportion) rather than predict which individual would or would not participate.
Three categories of covariates are included when modeling participation. Thefirst concerns respondents’ interest in the particular objectives of the program:replacing fossil fuels and planting trees in upstate New York. Both one to 10scale responses are expected to be positively correlated with participation. Thesecond category of covariates includes demographics, such as gender (male = 1),age (in years), and education (college graduate or higher = 1). Also included hereare recent financial support of environmental groups (Yes = 1), and impressionof the overall service received from NMPC on a one (“very poor”) to 10 (“verypoor”) to 10 (“very good”) scale. These types of variables are widely used as

116 GREGORY L. POE ET AL.
explanatory covariates in the literature modeling environmental valuation.15 Fromthis literature we expected age to be negatively correlated with participation, andeducation, impression of NMPC service, and participation in environmental groupsto be positively correlated with participation. No sign expectation was formed forgender.
The final category of covariates concerns respondents’ views of the program’sfunding mechanism. These variables are unconventional, in the sense that they donot proxy for the value of the program itself. When told of the PP and MBG,respondents were asked whether the fact “that a minimum level of customer partici-pation is required for GreenChoice to operate” (the PP) made the program of lessinterest or more interest. And they were asked if their interest in the program isaffected by “the fact that Niagara Mohawk would refund all the money it collects– if support is insufficient” (the MBG). The PP itself did not arouse greater interestin the program. Over 55 percent responded that its inclusion did not affect theirinterest. Only 17 percent indicated that it increased their interest. In contrast, theMBG increased interest in the program for 47 percent of respondents. Only 9percent said that it reduced their interest. Both questions were recoded as binaryvariables (indicated by a D) for estimation, assigned ‘1’ for “more interest,” and‘0’ otherwise. We expected their coefficients to be positive.
Joint and individually estimated logit models of program participation arereported in Table I, together with sample means, standard deviations, and expectedsigns. The first column of coefficient estimates provides a joint model of participa-tion with binary shifts for hypothetical OE and DC responses. Actual contributiondecisions serve as the baseline. The last three columns of the table provideseparate estimation results for the actual, OE hypothetical, and DC hypotheticalparticipation decisions.
In general, when significant, the sign of the coefficients reflects prior expecta-tions, and the overall models are highly significant. Favorable impressions ofprogram characteristics (Renewables, Trees) tend to be positively correlated withprogram enrollment, although the coefficient on trees is not significant in any ofthe individual equations. Consistent with our expectations from the experimentalprovision point literature, interest in the PP and the MBG are positively correlatedwith, and each is a significant explanatory variable of, participation in both the jointand most individual models. Such a result is consistent with the finding of Champet al. (2001), that PPMs increase the credibility of hypothetical CV scenarios. Thedemographic characteristics are also largely consistent with prior environmentalvaluation research. Participation is negatively correlated with age and positivelycorrelated with being male or a member of an environmental organization. Neithereducation nor rating of service is significant in any of the regressions. Overall,the significance of each of the equations and individual explanatory variablesdemonstrates that responses to the questions vary in a systematic fashion. Afteraccounting for these covariates, the binary variables for hypothetical responses inthe joint model tell a tale similar to the simple Chi-Squared test of independence:

PROVISION POINT MECHANISMS AND FIELD VALIDITY TESTS 117
Table I. Estimated logit models by response category.
Variable Exp. Mean Estimated coefficients (s.e.)
[description] sign (s.d.) Joint Actual OE hypo DC hypo
Constant –4.024 –4.386 –2.471 –5.145
(0.856)*** (2.184)** (1.167)** (1.602)***
D-DC Hypo ? 0.38 0.574
[DC Hypo = 1] (0.49) (0.299)*
D-OE Hypo ? 0.41 0.142
[OE Hypo = 1] (0.49) (0.298)
Renewables + 6.38 0.150 0.233 0.119 0.297
[1 to 10 scale] (2.71) (0.047)*** (0.118)** (0.099) (0.085)***
Trees + 8.44 0.116 0.216 –0.012 0.154
[1 to 10 scale] (2.23) (0.065)* (0.186) (0.073) (0.116)
D-Prov. Pt. + 0.17 1.353 1.416 0.925 1.868
[Interest = 1] (0.38) (0.259)*** (0.588)** (0.411)** (0.479)***
D-MBGuar + 0.48 0.626 –0.098 0.734 0.758
[Interest = 1] (0.50) (0.220)*** (0.550) (0.329)** (0.425)*
Age – 51.9 –0.023 –0.040 –0.039 –0.003
(16.3) (0.007)*** (0.019)** (0.011)*** (0.013)
D-Gender ? 0.46 0.463 0.954 0.432 0.224
[Male = 1] (0.50) (0.213)** (0.517)* (0.323) (0.388)
D-Cgrad + 0.36 0.181 0.002 0.300 0.275
[Cgrad = 1] (0.48) (0.223) (0.997) (0.321) (0.450)
D-Enviro + 0.24 1.108 0.666 0.461 2.474
[Contribute = 1] (0.43) (0.233)*** (0.624) (0.346) (0.451)***
Rate Service + 8.45 0.074 0.082 0.154 –0.087
[1 to 10 scale] (1.65) (0.069) (0.178) (0.102) (0.134)
Chi Sq 148.93 31.10 35.99 117.11
n 620 620 128 255 237
*,**, and *** indicate 10, 5 and 1 percent significance, respectively. Note the number of observa-tions deviates from those in Tables 2 and 4 because of item non-response to individual covariates.See also footnote 17. The results for the actual contributions model are also reported in Rose et al.(2002).

118 GREGORY L. POE ET AL.
the coefficient on the hypothetical OE responses (D-OE Hypo) was not significantat any level (t = 0.48) while that on the hypothetical DC responses (D-DC Hypo)was significant at the 10 percent level (t = 1.91).16 These results suggest thatOE CV provides a more accurate prediction of participation than does DC. Thisresult is also in keeping with Brown et al. (1996), who find, in comparing CV toVCM results, that DC values exceeded OE values, which in turn exceed actualcontributions. Our results, however, suggest that free-riding may explain some ofthe difference between OE willingness to pay and actual contributions found in theBrown et al. (1996) study.17
In assessing CV, Mitchell and Carson (1989) adapt the sociological concepts ofcriterion validity and construct validity. Criterion validity refers to the goodness offit of CV estimates to benchmark values, such as market prices. Construct validityrefers to whether CV estimates are related to explanatory variables as expectedaccording to economic theory. Applying these measures here, OE responses appearto have a higher criterion validity than do DC responses. At the same time, thelogistic analysis suggests that DC responses perform better in terms of constructvalidity. That is, the DC regression exhibits a substantially better fit (as measuredby the likelihood ratio) than the OE response function. This suggests that OEresponses do not vary as systematically with socio-economic characteristics as doDC responses, a result that has been supported elsewhere (e.g., Bohara et al. 1998).
4. Calibration of Hypothetical Responses
The results of our research suggest that hypothetical contributions exceed actualcontribution rates, especially in the case of hypothetical DC responses. Thisresult is consistent with the CV validity literature, motivating policy analysts andresearchers to suggest that a correction factor should be applied to adjust hypo-thetical contribution rates down to better predict actual participation or true publicgood values.
Whether or nor calibration of hypothetical answers should be applied is aninherently difficult question to address since the underlying benefits cannot beobserved. Thus, our aim is not to suggest a precise approach to calibration or toprovide a universal adjustment factor. Rather, we wish to reinterpret the results ofour study in light of the current calibration debate and contribute to it by providingwords of caution.
On the one hand, it could be argued that no correction of the DC responsesis required in order to make them approximate “true” values. Even though thePPM represents an improvement in demand revealed relative to the VCM, it isprobable that actual PPM contributions still under reveal demand because of freeor cheap riding. The mean demand revelation of the six PPM experiments discussedin Section 2 is 87.93 percent (s.e. = 10.31 percent) while the corresponding figurefor the median bid to value ratio is 79.02 percent (s.e. = 7.41 percent). Based onthese highly conditional results, the 95 percent confidence interval for the mean

PROVISION POINT MECHANISMS AND FIELD VALIDITY TESTS 119
value of demand revelation is 67.72 to 108.31 percent. Similarly, the 95 percentconfidence interval for the median bid to value ratios is 64.49 to 93.34 percent.Considering the lower bounds of these ranges, the data admits the possibility thatthe mechanism underestimate true values18 by perhaps as much as much as 35percent, a figure that would likely bring the real sign-up rate much closer to thesign-up rates of 30.6 percent obtained from the DC responses. Viewed in this light,our results would seem favorable to CV’s ability to measure true values, but muchin the way of additional research needs to be conducted before such a positive resultcan be accepted.
On the other hand, it is also possible, based on the experiments reported hereand elsewhere (Rondeau et al. 1999; Rose et al. 2001), that demand revelationwith the PPM approximates 100 percent. If such is the case, it appears sensibleto argue in favor of calibrating CV responses to adjust hypothetical responses tobest predict actual contributions. Whereas we maintain that from a public policyperspective it would be preferable to seek better estimates of values rather than toadjust hypothetical responses to predicted contribution levels, it is useful to analyzeour data in the context of the recent arguments in support of the view that actualcontributions represent a desirable lower bound measure of willingness to pay (e.g.see Champ et al. 1997 and Champ and Bishop 2001).19
Two different calibration methods have appeared in the CV literature. Weinvestigate these methods in turn using the actual sign up rate (20.4 percent) asour upper bound estimate of participation. As before, a lower bound estimate (16.2percent), generated by treating those who refused to participate in the telephonesurvey as “No’s”, is used as an alternative criterion.
For OE responses, Schulze et al. (1998) argue that a “disembedding” questionfollowing the OE question may reduce hypothetical bias by reminding respondentsto only state values for the specific good in question rather than including other“embedded” values such as moral satisfaction. In the NMPC survey, this measure-ment of the level of embedding was accomplished as follows. First, individual wereasked to answer an OE willingness to pay question as previously described. Thefollowing issue is then raised:
Some people say that it’s hard to think about the amount you would pay for aspecific program like GreenChoice, rather than for environmental programs orother good causes in general . . .
and individuals were asked if their bid on the OE question was just for theGreenChoiceTM program or if the stated WTP included values for a wider range ofenvironmental or public causes. If the respondent indicates that, “Yes, may statedvalue included other causes,” then they are asked to estimate the proportion of theirstated value that was for the GreenChoiceTM program. This “disembedded” portionis then multiplied by the original OE value to isolate the value attributed to theprogram. Several studies have used this approach, with self-reported embeddingranging from 20 percent (clean up local groundwater, McClelland et al. 1992) to50 percent (medium size oil spills, Rowe et al. 1991).20

120 GREGORY L. POE ET AL.
Champ et al. (1997, 2001) have suggested an alternative debriefing methodappropriate to DC CV. Reflecting evidence that individual respondents have someuncertainty in their WTP values (Gregory et al. 1995; Ready et al. 1995; Welshand Poe 1998), this approach asks those who responded “Yes” to the C questionthe following debriefing question:
So you think that you would sign up. I’d like to know how sure you are of that.On a scale from 1 to 10, where 1 is “very uncertain” and 10 is “very certain,”how sure are you that you would sign up and pay the extra $6 a month?
Using similar wording in their CV field validity study of donations for roadremoval on the north rim of the Grand Canyon (Champ et al. 1997) found thatestimating model, in which only the “yes” respondents who had a certainty levelof 10 were coded as “yes” responses, was not significantly different from actualcontributions. Champ and Bishop (2001) report that a certainty level of “8 orhigher” provides the best approximation of actual donations for a wind powerprogram. Both studies relied on a VCM for actual contributions. Similar certaintycorrection approaches and degrees of correction have also been used with datafrom laboratory experiments (Blumenschein et al. 1998; Johannesson et al. 1998,1999).
The results of applying these two calibration approaches in the NMPC study arereported in Table II. On average, the OE respondents reported that 23 percent oftheir values were embedded (i.e. that their value for the program was 77 percent oftheir original OE response). This lowered the entire OE WTP distribution, andreduced the estimated percentage of those who would have signed up at $6 to16.4 percent. This value is not significantly lower than the actual contributionlevel of 20.4 percent, and is almost identical to the lower bound estimate of actualparticipation rates. DC respondents reported a wide range of certainty levels. Onlya small percent of “yes” respondents reported that they had a certainty level of 10,with the mode being at 7. Sign-up proportions accounting for different certaintylevel of 10, with the mode being at 7. Sign-up proportions accounting for differentcertainty level thresholds are provided in Table II. Proportions associated withtreating yes responses with subsequent certainty levels of “greater than or equalto 6” and “greater than or equal to 7” as “true” yes responses, are not significantlydifferent from the actual sign-up rate. However, a certainty level of greater thanor equal to 7 most closely corresponds to the actual sign up rate. This degree ofcorrection is less than the Champ et al. (1997) and the Champ and Bishop (2001)findings, a result that is consistent with our basic premise that the VCM used inthese studies provides a smaller fraction of true demand. Alternatively, certaintylevels of “greater than or equal to 7” and “greater than or equal to 8” correspondmost closely with the lower bound estimate of actual contributions.
Calibrating CV responses is fraught with perils. For the purpose of policymaking, calibration will truly matter only in cases where the benefit-cost ratioof a project or policy is relatively close to one. Failure to sufficiently deflate CVresponses would result in the funding of policies that produce a net loss to society,

PROVISION POINT MECHANISMS AND FIELD VALIDITY TESTS 121
Table II. Significance tests of the equality between actual sign-ups, hypotheticalsign-ups and calibrated hypothetical sign-ups.
Response type Percent T valuea T valuea
participation using actual using actual
(observations) participation participation
= 20.4% = 16.2%
(n = 142) (n = 179)
Hypothetical open ended 24.3 0.80 4.31**
(n = 284)
Hypothetical open ended, 16.4 0.94 0.00
revised for embedding (n = 280)
Hypothetical dichotomous choice 30.6 4.83** 11.81***
(n = 258)
Hypothetical dichotomous choice,
revised for certainty
Certainty ≥ 5 29.1 3.56* 9.65***
(n = 258)
≥ 6 24.8 0.99 4.67**
(n = 258)
≥ 7 20.9 0.01 1.54
(n = 258)
≥ 8 14.0 2.82* 0.42
(n = 258)
≥ 9 8.5 11.65*** 6.04**
(n = 258)
= 10 6.6 17.22*** 10.37***
(n = 258)
*,**, and *** indicate that the proportions are significantly different from the “actual”value at the 10, 5, and 1 percent levels, respectively, using a two-tailed test.aCalculated using chi-squared test for difference in probabilities (Conover 1980, p.145). Note that making an adjustment for continuity as suggested in Snedecor andCochrane (1989), but rejected as being overly conservative in Conover, impacts thesignificance assessment of only the DC ≥ 8 v. 20.4 percent participation measure,leading it to not be significantly different at any of the significance levels identified.

122 GREGORY L. POE ET AL.
while over calibration runs the risk of preventing the implementation of sociallydesirable initiatives. Regardless of the position one wishes to take on the degreeof demand revelation elicited by the PPM, the results presented above stronglysuggest that calibration levels (if any) should be lower than those previouslyadvocated.
5. Summary and Discussion
In recent years there has been substantial effort to link experimental economicswith validity testing in contingent valuation. Whereas much of the previousresearch in this area has focused on bringing hypothetical versus actual compar-isons into the laboratory or has centered on using improved auction mechanismsfor private goods, this paper extends these efforts to bring improved mechanism tofield validity testing of contingent values for public goods. In particular, building onprevious experimental economics literature as well as a series of new large groupexperiments, we argue that provision point mechanisms can be readily adoptedfor improved validity testing in the field in cases where a discrete project is to bevalued.
As we show, provision point mechanisms are superior to voluntary contributionmechanisms at providing aggregate contributions that more closely approximateinduced values in single shot, large group, laboratory experiments. Based on thisobservation, we argue that the provision point mechanism offers a much improvedreference criteria for contingent valuation field validity tests.
In a field comparison using provision point mechanism with a money backguarantee and extended benefits, we found that hypothetical values overstatedactual contribution levels. Whereas the difference between open-ended hypothet-ical responses and actual responses are equivocal, depending on how actual sign-uprates were measured, actual contributions and hypothetical dichotomous choiceparticipation rates are significantly different. Given this disparity, we explorealternative levels of calibration. Consistent with the laboratory research that thevoluntary contributions mechanism reveals a smaller portion of demand than theprovision point mechanism, the calibration levels determined in this study for thedichotomous choice mechanism are smaller than those used in previous contingentvaluation validity comparisons. However, because of the likelihood that actualcontributions under-reveal demand even when a provision point mechanism isused, it is entirely possible that the calibration of hypothetical responses introducesan undesirable bias.
This research is intended to complement other research being conducted inthe contingent valuation/experimental economics interface. For contingent valu-ation researchers, it serves as a reminder that voluntary contribution mechanismsfor actual collections are likely to lead to over calibration, and offers the provi-sion point mechanism as an alternative reference point for contingent valuationvalidity test wherein the discontinuity in provision is appropriate for the good

PROVISION POINT MECHANISMS AND FIELD VALIDITY TESTS 123
being valued. This research also raises a challenges experimental economists toexplore the characteristics of single-shot value elicitation mechanism as a meansof better understanding the characteristics of alternative mechanisms for fundingpublic goods.
Acknowledgements
The authors are indebted to Steven Rose and Eleanor Smith for their contributionsto various components of this research. We would also like to thank Theresa Flaim,Janet Dougherty, Mike Kelleher, Pam Ingersoll, and Maria Ucchino at NiagaraMohawk Power Corporation for their assistance and cooperation with this researcheffort. Pam Rathbun and colleagues at Hagler Bailly, Inc., Madison, WI alsogreatly contributed to this study. Funding for this research was provided by Grant#R824688 under the 1995 National Science Foundation/Environmental ProtectionAgency Partnership for Environmental Research grants program, National ScienceFoundation Grant #SBR9727375, and USDA Regional Project W-133. Much ofthis research was conducted while Daniel Rondeau was a doctoral fellow of theSocial Sciences and Humanities Research Council of Canada. Cornell Workingpaper Series in Environmental and Resource Economics 97-05 (revised November1999). This paper was written, in part, while Poe was a Visiting Fellow at theJackson Environmental Institute and the Centre for Social and Economic Researchon the Global Environment at the University of East Anglia.
Notes
* Experimental instructions are available from the authors.1. The quote used here is an attempt to capture the early optimism prevalent among CV researchers
at the time of the 1989 State of Ohio v. U. S. Department of Interior ruling supporting the use ofcontingent valuation as a “best available procedure” for reliably assessing monetary damagesfor injury to public trust resources (see Cummings and Harrison 1994, footnote 17, p. 4).Subsequent reestimation of these early field experiment data provide more mixed assessments:as Smith (1997, p. 176) notes, the conclusions derived from this “research to date depend onthe ‘eyes of the beholder.’ ” For example, with respect to the Dickie et al. (1987) strawberryexperiments, J. A. Hausman and D. K. Leonard concluded that, using a non-parametric approach,“the hypothetical CV responses significantly overstate the actual market responses, both in termsof consumer demand and in terms of consumer surplus” (as cited in Smith 1997, p. 195). Usingdifferent econometric assumptions, Smith (1994) supported the Dickie et al. conclusion that thehypothetical and actual demand functions were derived from the same behavioral processes.Other reevaluations of this early survey research, with mixed results, can be found in Cummingsand Harrison (1994), Carson et al. (1996) and Mansfield (1998). In addition, a body of experi-mental economics literature has recently emerged demonstrating that hypothetical bias remainsa problem even in private goods (e.g., Fox et al. 1998; List and Shogren 1998; Balistreri et al.2001).
2. To their credit, each of the aforementioned authors are apparently aware of the possible biasesassociated with using a VCM as a reference criterion for willingness to pay. For example, Seip

124 GREGORY L. POE ET AL.
and Strand note, “We may have significant free rider problems in voluntary payment” (p. 103).Brown et al. similarly note that “A voluntary payment towards a public good allows for free-riding . . . to the extent that free-riding occurs, it depresses actual payments” (p. 154). Yet,the explicit or implicit justification (e.g., Champ et al. 1997, 2001) in these studies that sucha contribution provides a lower bound of value belies the critical point that such “lower bound”measures do not provide the Hicksian measures appropriate for welfare economic analyses (seeChilton and Hutchinson 1999).
3. We make a clear distinction between the theoretical property of “incentive compatibility” andempirical demand revelation. Neither the PPM nor the VCM provide an incentive structure thatwould lead the theoretician to predict that the mechanisms are conductive to a revelation of truevalue by contributors. They are simply not incentive compatible. However, as we discuss in thispaper, we find that the empirical performance of the PPM is closer to the standard of demandrevelation than the VCM.
4. Theoretically, as shown in Bagnoli and Lipman (1989) and Bagnoli and McKee (1991), theaddition of a discontinuous PP to a standard VCM adds a large number of dominant Nashequilibria wherein the sum of the contributions exactly equals the costs in symmetric, completeinformation games in which the aggregate benefits exceed the PP.
5. Note that using induced demand as the efficiency measure differs from the conventional focusin the PPM literature of defining efficiency in terms of the theoretical Pareto dominant lociof aggregate bids that exactly equal costs (see for example, Bagnoli and Lipman (1989) andBagnoli and McKee (1991)). Along these lines the experimental economics literature has focusedon the frequency of correct funding decisions when aggregate induced values exceed the costsof the project. Our research shifts the orientation towards the proportion of demand revealedin situations wherein the symmetric Nash prediction of Bagnoli and Lipman does not hold,i.e. one-shot situations in which complete information and prior group interactions are notavailable.
6. Although the dollar amount varied across DC surveys in the Champ et al./Brown et al. research,the cost per mile was not varied. Thus there is a direct proportionality between the DC dollarvalue and feet of road removed.
7. The actual curvature of the aggregate benefits function across percent of roads removed is, ofcourse, an open question that cannot be answered from the Champ et al. data because of thedirect linkage between dollars and feet of road removed. Lacking specific information, a linearfunction is adopted here, explicitly assuming that individuals accrue the same incremental valuefor each foot of road removed (dollar contributed). Alternatively, small amounts of road removal(dollars contributed) might not be highly valued relative to the total value of the complete project,implying a convex benefits function. Or benefits might be a concave function of road removal(dollars contributed).
8. This characterization of the funding mechanism was confirmed in personal conversations withPatricia A. Champ (1999).
9. Here the term “pair” refers to the matched PPM and VCM experiments in which values, endow-ment, n, and the provision point/kink were held constant across samples and were conducted inthe same classroom. The only remaining difference is the mechanism and, in the split samplecases, the subject pool, which was randomly assigned to a mechanism within each class. Asnoted in Appendix A, experiments a, b, c, and f were split sample designs, while d and einvolves a within sample experiment. If we examine the difference between PPM and VCMvalues within rows, we find that the average difference between the six PPM and six VCMpercent of demand revealed observations is 39.66 (s.e. = 6.17) and the corresponding averagedifference in median values for Bi/Vi is 42.48 (s.e. = 6.09). For the within sample differences, themean difference in percent demand revealed was 21.35 (s.e. = 2.95) and the corresponding valuefor the split sample experiments was 44.78 (s.e. = 5.73). The values for the difference in median

PROVISION POINT MECHANISMS AND FIELD VALIDITY TESTS 125
Bi/Vi were 29.10 (s.e. = 2.30) and 49.18 (s.e. = 6.85). One-way ANOVA tests for the percentof demand revealed indicates that the null hypothesis of equality between the estimated PPMVCM difference between the split sample designs and the within sample designs is marginallysignificantly different, with p = 0.056 (F = 7.11). A similar test on the Bi/Vi data indicates thatthe null hypothesis of equality between the split sample and within sample differences cannotbe rejected (p = 0.125, F = 3.74). On the basis of these results we would conclude that, ifanything, the addition of the within sample experiments reduced the average difference betweenrelated PPM and VCM values. Yet, even when these additional experiments are included, thedistribution of the two PPM and VCM measures of central tendency remain significantly, andsubstantially, different.
10. We argue that the relatively high proportion of individuals in the PPM who exactly revealed theirdemand is supportive of the idea that the PPM engenders greater demand revelation. However,as pointed out by an anonymous reviewer, this may also reflect an anchoring effect by suggestinga value for individuals who are uncertain of their values or how to play the game. Unfortunately,out experiments do not allow us to distinguish between revelation and confusion.
11. As it turned out, contributions in the actual version were never collected from this sample,because the GreenChoiceTM program itself was canceled. NMPC developed severe financialdifficulties, and, having failed to pay dividends to stockholders, was unable to advertise theGreenChoiceTM program. Consistent with the MBG, those who elected to participate as a resultof our phone survey were sent a cancellation notice, and the funds contributed by the 123 house-holds outside our sample who signed up for the program were returned by NMPC. It is, of course,possible that the customers that we signed up might have reneged by leaving the program duringthe 12 month payment period. However, there is indirect evidence that this is not a large issue inother sign-up-no-pay-later green electricity programs. For example, 95 percent of the residentswho signed up for the Traverse City Wind Power project continued to pay their committed levelmore than one year after the program started. Similarly, about 97 percent of the households thatoriginally signed up for a recent Wisconsin Power and Light green electricity program remainedin the program after 6 months (Personal conversation, Richard C. Bishop (1999)). Note that theseparticipation rates do not distinguish between those households that were disappointed with theprogram and respondents who moved, died, etc.
12. A modified, shortened “Cheap Talk” warning (Cummings and Taylor 1999) was used on a subsample of each of the hypothetical surveys in an effort to “push down” any hypothetical bias.Specifically, the following wording was added to the paragraph preceding the hypothetical valu-ation question “I have one caution though. For programs like this it’s often the case that morepeople say they would sign up than actually do sign-up. Utilities in other parts of the countryhave found that eight times as many people say yes to similar programs as actually take part inthem. With this in mind . . .” This warning apparently did not influence participation decisions,which corresponds with the findings reported by Cummings and Taylor (1999) (in their researcha lengthy version of “Cheap Talk” did, however, lower stated values). The percentage of yesresponses to the DC with warning (30.2 percent, n = 136) was not significantly different fromthe DC without warning (30.8 percent, n = 123). Similarly, neither the mean open-ended ($4.94,n = 153) nor the estimated percent of OE responses that would sign up at $6 (25.5 percent,n = 153) with the warning was significantly different from the mean ($4.95, n = 131) and theestimated percent of OE responses (22.9 percent, n = 131) within the warning. As a result tothis lack of significance across warning groups, our “Cheap Talk” versions were pooled withresponses from surveys without this warning in the analyses in the text.
13. The remainder were classified as unable to contact after a minimum of eight telephone attempts.14. For reference, the mean OE response was $4.94 (s.e. = 0.60), with the following distributions for
the raw and the unembedded (see discussion in paper) responses (mean = 3.63, s.e. = 0.50):

126 GREGORY L. POE ET AL.
Values 0 0 < $ < 1 1 ≤ $ < 2 2 ≤ $ < 3 3 ≤ $ < 4 4 ≤ $ < 5 5 ≤ $ < 6
Raw percent 44.0 0 7.4 5.3 3.2 0.7 15.1
Unembed. percent 44.6 5.8 8.2 7.8 2.9 3.2 11.1
Values 6 ≤ $ < 7 7 ≤ $ < 8 8 ≤ $ < 9 9 ≤ $ < 10 10 ≤ $ < 20 20 ≤ $
Raw percent 3.5 1.1 1.4 0 12.0 6.3
Unembed. percent 3.2 1.1 0.7 0 7.8 3.6
15. The estimation procedure was motivated by a linear random utility difference model. Thusincome is not included in the estimation (Hanemann 1984). Similarly, in contrast to standardDC CV models, price is not included as an explanatory variable of participation, because it isconstant at $6 across all participants.
16. Letting LL denote the log likelihood, a likelihood ration test LR = –2(LLResticted −−LLUnrestricted) was used to test the null hypothesis of equality of all coefficients across equa-tions (with the exception of a binary shift variable for each equation). The test across all threesurvey versions is rejected at the 10 percent level of significance (LR = 40.79 > 25.99 = χ2
0.10,18).Pair wise pooling of the data indicates that the null hypothesis of equality between actual andOE responses (LR = 12.13 < 14.68 = χ2
0.10,9) and actual and DC responses (LR = 7.42 < 14.68
= χ20.10,9) cannot, however, be rejected. As such, rejection of a joint model polling all response
functions appears to be driven by the inequality of OE and DC response functions (LR = 35.24 >14.68 = χ2
0.10,9). Moving to paired actual-hypothetical pooled regressions, the significance of thebinary shifters reflects the significance levels reported in Table II. However, the number of obser-vations in this data are slightly reduced from that reported in Table II, reflecting the fact that onlythose respondents who completed all the covariates used in the logit analyses. Using these data,the actual percent enrolled (21.9 percent) is not significantly different from the hypothetical OE(25.9 percent, χ2 = 1.06 < 2.71 = χ2
0.10,1). The actual participation levels remain significantly
different from the hypothetical DC participation (32.4 percent χ2 = 5.30 > 2.71 = χ20.10,1).
17. Identifying the source of this convergence between the PPM actual and the OE hypotheticalsuffers from confounding influences: i.e., the collection mechanisms differ in two factors, hypo-thetical vs. actual and continuous vs. discrete. Unfortunately, state regulators required a fixedfee for all individual, thus preempting an actual continuous contributions mechanism that wouldallow an isolation of hypothetical and elicitation effects.
18. Such a result has been demonstrated for some data sets for WTP to avoid a private risk inBalistreri et al. (2001) and a related paper by Poe and Vossler (2002).
19. Again, it should be noted that this lower bound interpretation of donations has been challengedby Chilton and Hutchinson (1999).
20. In addition to the notion that individuals are embedding their specific values within a broaderstated value, two other interpretations of these self-reported adjustments have been offered. First,experimental economists have found that in repeated rounds, values tend to fall after the first bid.In other words values tend to be overstated on the first round and tend to approach induced oractual values in subsequent rounds (Davis and Holt 1993). The disembedding question thusallows individuals to at as if they are in a more experienced, second round situation. Second,the disembedding question might act as a reminder that individuals may want to spend theirmoney in other ways, thus providing an additional opportunity to consider budget constraintsand substitutes. The need for emphasizing these constraints in CV questions was highlighted inArrow et al. (1993).
PROVISION POINT MECHANISMS AND FIELD VALIDITY TESTS 127
AP
PE
ND
IXA
:Su
mm
ary
Stat
isti
cs:
Pai
red
PP
MV
CM
Exp
erim
ents
,Inc
ompl
ete
Info
rmat
ion
Exp
erim
enta
lCon
ditio
nsPP
MV
CM
Info
rmat
ion
End
.V
alue
sn
inPe
rcen
tnw
here
Bid
%D
em.
Med
.n
Perc
entn
whe
reB
id%
Dem
.M
ed.
(Yes
=1)
sam
ple
Rev
.B
i/V
isa
mpl
eR
ev.
Bi/
Vi
Exp
nPP
ωV
=0
=V
i>V
i=
ω=
0=
Vi
>Vi
=ω
IDK
now
nK
now
n($
)($
)
a0
110
527
7.41
37.0
418
.52
3.70
92.0
100.
026
30.7
73.
853.
850.
0041
.240
.0
b0
115
6,10
,32
9.38
21.8
812
.50
12.5
071
.168
.339
20.5
12.
5625
.64
0.00
41.4
38.7
12,1
4
c0
120
6,8,
10,
405.
0010
.00
17.5
010
.00
85.0
83.3
3925
.64
7.69
7.69
2.56
42.4
33.3
12,1
4
d∗0
120
6,8,
10,
185
14.0
516
.76
11.8
92.
1663
.962
.518
326
.78
9.84
8.74
0.55
45.5
35.7
12,1
4
e∗0
120
1,3,
5,18
525
.40
17.2
915
.14
3.24
80.3
60.0
183
40.4
49.
8415
.30
1.63
56.0
28.6
7,9
f0
118
1,3,
5,40
2.50
17.5
037
.50
10.0
013
5.3
100.
025
16.0
00.
008.
000.
0079
.342
.9
7,9
Tota
l,50
915
.91
18.6
616
.69
4.52
495
30.9
18.
2812
.12
1.01
Avg
Term
s:n
=nu
mbe
rof
part
icip
ants
,PP
=pr
ovis
ion
poin
t,ω
=en
dow
men
t,an
dV
=in
duce
dva
lue.
∗ The
PP
Man
dV
CM
expe
rim
ents
Dan
dE
are
wit
hin
sam
ple
expe
rim
ents
.In
this
seto
fex
peri
men
tsre
spon
dent
san
swer
edtw
oP
PM
and
two
VC
Mqu
esti
ons
for
ato
talo
ffo
urco
ntri
buti
onsi
tuat
ions
.One
ofth
efo
ursi
tuat
ions
was
chos
enas
bind
ing
infr
onto
fth
ecl
ass.
The
othe
rfo
urex
peri
men
ts(a
,b,c
,and
f)ea
chin
volv
edsp
lits
ampl
es.

128 GREGORY L. POE ET AL.
References
Andreoni, J. (1995), ‘Cooperation in Public-Goods Experiments: Kindness or Confusion?’ AmericanEconomic Review 85(4), 891–904.
Arrow, K., R. Solow, E. Leamer, P. Portney, R. Randner and H. Schuman (15 January 1993), ‘Reportof the NOAA Panel on Contingent Valuation’, Federal Register 58(10), 4601–4614.
Bagnoli, M. and B. Lipman (1989), ‘Provision of Public Goods: Fully Implementing the Corethrough Voluntary Contributions’, Review of Economic Studies 56, 583–601.
Bagnoli, M. and M. McKee (1991), ‘Voluntary Contributions Games: Efficient Private Provision ofPublic Goods’, Economic Inquiry 29, 351–366.
Balistreri, E., G. McClelland, G. L. Poe and W. Schulze (2001), ‘Can Hypothetical Questions RevealTrue Values? A Laboratory Comparison of Dichotomous Choice and Open-Ended ContingentValues with Auction Values’, Environmental and Resource Economics 18, 275–292.
Baugh, K., B. Brynes, C. Jones and M. Rahimzadeh (August 1995), ‘Green Pricing: Removing theGuesswork’, Public Utilities Fortnightly, 26–28.
Bishop, R. C. and T. A. Heberlein (1979), ‘Measuring Values of Extramarket Goods: Are IndirectMeasures Biased?’ American Journal of Agricultural Economics 61, 926–930.
Bishop, R. C. and T. A. Heberlein (1990), ‘The Contingent Valuation Method’, in R. L. Johnson andD. V. Johnson, eds., Economic Valuation of Natural Resources: Issues, Theory and Applications.Boulder, CO: Westview Press, pp. 181–204.
Blumenschein, K., M. Johannesson, G. C. Blomquist, B. Liljas and D. S. O’Conor (1998), ‘Exper-imental Results on Expressed Uncertainty and Hypothetical Bias in Contingent Valuation’,Southern Economic Journal 65(1), 169–177.
Bohara, A. K., M. McKee, R. P. Berrens, H. Jenkins-Smith, C. L. Silva and D. S. Brookshire (1998),‘Effects of Total Costs and Group-Size Information on Willingness to pay Responses: OpenEnded vs. Dichotomous Choice’, Journal of Environmental Economics and Management 35(2),142–163.
Brookshire, D. S. and D. L. Coursey (1987), ‘Measuring the Value of a Public Good: An EmpiricalComparison of Elicitation Procedures’, American Economic Review 77(4), 554–566.
Brookshire, D. S., D. L. Coursey and W. D. Schulze (1990), ‘Experiments in the Solicitation ofPrivate and Public Values, An Overview’, in L. Green and J. Kagel, eds., Advances in BehavioralEconomics, V. 2. Norwood, NJ: Albex.
Brown, T., P. Champ, R. Bishop and D. McCollum (1996), ‘Which Response Format Reveals theTruth About Donations to a Public Good?’ Land Economics 72(2), 152–166.
Brubaker, E. (1976), ‘Free Ride, Free Revelation or Golden Rule’, Journal of Law and Economics18(1), 147–159.
Brubaker, E. (1982), ‘Sixty-eight Percent Free Revelation and Thirty-Two Percent Free Ride?Demand Disclosures Under Varying Conditions of Exclusion’, in V. L. Smith, ed., Researchin Experimental Economics, Vol. 2. Greenwich CT: JAI Press.
Byrnes, B., C. Jones and S. Goodman 1999, ‘Contingent Valuation and Real Economic Commit-ments: Evidence from Electric Utility green Pricing Programs’, Journal of EnvironmentalPlanning and Management 42(2), 149–166.
Cadsby, C. B. and E. Maynes (1998), ‘Choosing Between a Socially Efficient and Free-Riding Equi-librium: Nurses versus Economics and Business Students’, Journal of Economic Behavior andOrganization 37, 183–192.
Cadsby, C. B. and E. Maynes (1999a), ‘Voluntary Provision of Threshold Public Goodswith Continuous Contributions: Experimental Evidence’, Journal of Public Economics 71,53–73.
Cadsby, C. B. and E. Maynes (1999b), ‘Gender and Free Riding in a Threshold Public Goods Game:Experimental Evidence’, Journal of Economic Behavior and Organization 34, 603–620.

PROVISION POINT MECHANISMS AND FIELD VALIDITY TESTS 129
Carson, R. T., N. E. Flores, K. M. Martin and J. L. Wright (1996), ‘Contingent Valuation andRevealed Preference Methodologies: Comparing the Estimates for Quasi-Public Goods’, LandEconomics 72(1): 80–99.
Champ, P. A. and R. C. Bishop (2001) ‘Donation Payment Mechanisms and Contingent Valuation:An Empirical Study of Hypothetical Bias’, Environmental and Resource Economics 19(4), 383–402.
Champ P. A., R. C. Bishop, T. C. Brown and D. W. McCollum, (1997), ‘Using Donation Mechan-isms to Value Nonuse Benefits from Public Goods.’ Journal of Environmental Economics andManagement 33(2), 51–162.
Chilton, S. M. and W. G. Hutchinson (1999), ‘Some Further Implications of Incorporating the WarmGlow of Giving into Welfare Measure: A Comment on the Use of Donation Mechanisms byChamp et al.’, Journal Environmental Economics and Management 37, 202–209.
Conover, W. J. (1980), Practical Non-Parametric Statistics, 2nd Ed. New York: John Wiley and Sons.Cummings, R. G. and G. W. Harrison (1994), ‘Was the Ohio Court Well Informed in its Assessment
of the Accuracy of the Contingent Valuation Method?’ National Resources Journal 34(1), 1–36.Cummings, R. G., G. W. Harrison and E.E. Ruström (1995), ‘Homegrown Values and Hypothet-
ical Surveys: Is the Dichotomous Choice Approach Incentive Compatible?’ American EconomicReview 85(1), 260–266.
Cummings, R. G. and L. O. Taylor (1999), ‘Unbiased Value Estimates for Environmental Goods:A Cheap Talk Design for the Contingent Valuation Method’, American Economic Review 89(3),649–665.
Cummings, R. G., S. Elliott, G. W. Harrison and E. E. Ruström (1997), ‘Are Hypothetical ReferendaIncentive Compatible?’ Journal of Political Economy 105(3), 609–621.
Davis, D. D. and C. A. Holt (1993), Experimental Economics. Princeton: Princeton University Press.Dawes, R., J. Orbell, R. Simmons and A. van de Kragt (1986), ‘Organizing Groups for Collective
Action’, American Political Science Review 8, 1171–1185.Diamond, P. A. and J. A. Hausman (1994), ‘Contingent Valuation, Is Some Number Better Than No
Number?’ Journal of Economic Perspectives 8, 45–64.Dickie, M., A. Fisher and S. Gerking (1987), ‘Market Transactions and Hypothetical Demand Data:
A Comparative Study’, Journal of the American Statistical Society 82, 69–75.Dillman, D. A. (1978), Mail and Telephone Surveys – The Total Design Method. New York: Wiley
& Sons.Duffield, J. W. and D. A. Patterson (1992), ‘Field Testing of Existence Values: An Instream Flow
Trust Fund for Montana Rivers’. Paper presented at the AERE/ASSA meetings, New Orleans.Falkinger, J., E. Fehr, S. Gächter and R. Winter-Ebmer (2000), ‘A Simple Mechanism for the Efficient
Provision of Public Goods: Experimental Evidence’, American Economic Review 90(1), 247–264.
Farhar, B. C. and A. H. Houston (1996), ‘Willingness to Pay for Electricity from Renewable Energy’.Paper presented at the 1996 ACEEE Summer Study on Energy Efficiency in Buildings, August25–31, Pacific Grove, CA.
Ferarro, P. J., D. Rondeau and G. L. Poe (2002), ‘Detecting Other-Regarding Behavior with VirtualPlayers’. Forthcoming in the Journal of Economic Behavior and Organization.
Fox, J. A., J. F. Shogren, D. J. Hayes and J. B. Kliebenstein (1998), ‘CVM-X: Calibrating ContingentValues with Experimental Auction Markets’, American Journal of Agricultural Economics 80,455–465.
Frykolm, P. (1997), ‘Hypothetical Question Modes and Real Willingness to Pay’, Journal ofEnvironmental Economics and Management 34, 275–287.
Gregory, R., S. Lichtenstein, T. C. Brown, G. L. Peterson and P. Slovic (1995), ‘How Precise areMonetary Representations of Environmental Improvements?’ Land Economics 71(4), November,462–473.

130 GREGORY L. POE ET AL.
Groves, T. and J. Ledyard (1977), ‘Optimal Allocation of Public Goods: A Solution to the ‘FreeRider’ Problem’, Econometrica 45, 783–809.
Hanemann, W. M. (1984), ‘Welfare Evaluation in Contingent Valuation Experiments with DiscreteResponses’, American Journal of Agricultural Economics 66, 332–341.
Harstad, R. and M. Marrese (1982) ‘Behavioral Explanations of Efficient Public Good Allocations’,Journal of Public Economics 19, 367–383.
Holt, E. A. (1997), Green Pricing Resource Guide. The Regulatory Assistance Project, February,Gardiner, ME.
Isaac, R. M., D. Schmidtz and J. Walker (1989), ‘The Assurance Problem in Laboratory Markets’,Public Choice 62, 217–236.
Johannesson, M., G. C. Blomquist, K. Blumenschein, P.-O, Johansson, B. Liljas and R. M.O’Conor (1999), ‘Calibrating Hypothetical Willingness to Pay Responses’, Journal of Risk andUncertainty 8, 21–32.
Johannesson, M., B. Liljas and P.-O. Johansson (1998), ‘An Experimental Comparison ofDichotomous Choice Contingent Valuation Questions and Real Purchase Decisions’, AppliedEconomics 30, 643–647.
Ledyard, J. O. (1995), ‘Public Goods: A Survey of Experimental Research’, in J. H. Kagel and A.E. Roth, eds., Handbook of Environmental Economics. Princeton: Princeton University Press,pp. 111–194.
List J. A. and J. F. Shogren (1998), ‘Calibration of the Difference Between Actual and HypotheticalValuations in a Field Experiment’, Journal of Economic Behavior and Organization 37(2), 193–205.
Mansfield, C. (1998), ‘A Consistent Method for Calibrating Contingent Valuation Survey Data’,Southern Economic Journal 64(3), 665–681.
Marks, M. B. and R. T. A. Croson (1998), ‘Alternative Rebate Rules in the Provision of a ThresholdPublic Good: An Experimental Investigation’, Journal of Public Economics 67, 195–220.
Marks, M. B. and R. T. A. Croson (1999), ‘The Effect of Incomplete Information in a ThresholdPublic Goods Experiment’, Public Choice 99, 103–118.
McClelland, G. H., W. D. Schulze, J. K. Lazo, D. M. Waldman, J. K. Doyle, S. R. Elliott andJ. R. Irwin (1992), Methods for measuring non-use values: A contingent valuation study ofgroundwater cleanup. October, Report for the U.S. EPA, Contract #CR-815183.
Mitchell, R. C. and R. T. Carson (1989), Using Surveys to Value Public Goods: The ContingentValuation Method. Washington, D.C.: Resources for the Future.
Mysker, M., P. Olson and A. Williams. ‘The Voluntary Provision of a Threshold Public Good: FurtherExperimental Results’, in M. Isaac, ed., Research in Experimental Economics, Vol. 6. GreenwichCT: JAI Press, pp. 149–163.
Navrud, S. and K. Veisten (1997), ‘Using Contingent Valuation and Actual Donations to Boundthe True Willingness-to-Pay’. Unpublished manuscript, January, Dept. Of Economics and SocialSciences, Agricultural University of Norway.
Palfrey, T. R. and J. R. Prisbey (1997), ‘Anomalous Behavior in Public Goods Experiments: HowMuch and Why?’ American Economic Review 87(5), 827–846.
Poe, G. L. and C. A. Vossler (2002), ‘Monte Carlo Benchmarks for Discrete Response ValuationMethods: Comment’. Forthcoming in Land Economics.
Ready, R. C. J. C. Whitehead and G. C. Blomquist (1995), ‘Contingent Valuation when Respondentsare Ambivalent’, Journal of Environmental Economics and Management 29(2), 181–196.
Rondeau, D., W. D. Schulze and G. L. Poe (1999), ‘Voluntary Revelation in the Demand for PublicGoods Using a Provision Point Mechanism’, Journal of Public Economics 72, 455–470.
Rose, S., J. Clark, G. L. Poe, D. Rondeau and W. D. Schulze (2002), ‘Field and Laboratory Tests ofA Provision Point Mechanism’, Resource and Energy Economics 24, 131–155.
PROVISION POINT MECHANISMS AND FIELD VALIDITY TESTS 131
Rowe, R. D., W. D. Schulze, W. D. Shaw, D. Schenk and L. G. Chestnut (1991), Contingent Valuationof Natural Resource Damages Due to the Nestucca Oil Spill. RCG/Hagler Bailly Report for theDepartment of Wildlife, State of Washington, British Columbia Ministry of the Environment,and Environment Canada, June.
Samuelson, P. A. (1954), ‘The Pure Theory of Public Expenditure’, Review of Economics andStatistics 36, 387–389.
Schulze, W. D., G. McClelland, D. Waldman and J. Lazo (1996), ‘Sources of Bias in ContingentValuation’, in D. Bjornstad and J. Kahn, eds., The Contingent Valuation of EnvironmentalResources: Methodological Issues and Research Needs. Cheltenham, U.K.: Edward ElgarPublishing Ltd., pp. 97–116.
Schulze, W. D., G. McClelland, J. Lazo and R. D. Rowe (1998), ‘Embedding and Calibration inMeasuring Non-Use Values’, Resource and Energy Economics 20, 163–178.
Seip, K. and J. Strand (1992), ‘Willingness to Pay for Environmental Goods in Norway: A ContingentValuation Study with Real Payment’, Environmental and Resource Economics 2, 91–106.
Smith, V. K. (1994) ‘Lighting Rods, Dart Boards, and Contingent Valuation’, National ResourcesJournal 34(1), 121–152.
Smith, V. K. (1997), ‘6. Pricing What is Priceless: A Status Report on Non-Market Valuation ofEnvironmental Resources’, in H. Folmer and T. Tietenberg, eds., The International Yearbook ofEnvironmental and Resource Economics 1997/1998, pp. 156–204.
Smith, V. L. (1979), ‘An Experimental Comparison of Three Public Good Decision Mechanisms’,Scandinavian Journal of Economics 81, 198–215.
Smith, V. L. (1980), ‘Experiments with a Decentralized Mechanism for Public Goods Decision’,American Economic Reviews 70, 584–599.
Snedecor G. W. and W. C. Cochrane (1989), Statistical Methods, Eighth Edition. Ames: Iowa StateUniversity Press.
Spencer, M. A., S. K. Swallow and C. J. Miller (1998), ‘Valuing Water Quality Monitoring: AContingent Valuation Experiment Involving Hypothetical and Real Payments’, Agricultural andResource Economics Review 27(1), 28–42.
Suleiman, R. and A. Rapoport (1992), ‘Provision of Step-Level Public Goods with DiscontinuousContribution’, Journal of Behavioral Decision Making 5, 133–153.
Welsh, M. P. and G. L. Poe (1998), ‘Elicitation Effects in Contingent Valuation: Comparisonsto a Multiple Bounded Discrete Choice Approach’, Journal of Environmental Economics andManagement 36(2), 170–185.
