présentation powerpoint - global agenda of action for sustainable
TRANSCRIPT

Environmental efficiencies & sustainable animal productions
Ph LECOMTE
D. Berre, T Hiep, E Tillard, J Vayssieres, M Vigne
GLOBAL AGENDA OF ACTION IN SUPPORT OF SUSTAINABLE LIVESTOCK DEVELOPMENT
CONSULTATION ON FOCUS AREA NUMBER 1:
CLOSING THE EFFICIENCY GAP IN NATURAL RESOURCE USE
2-4 April, FAO HQ-Rome, Italy
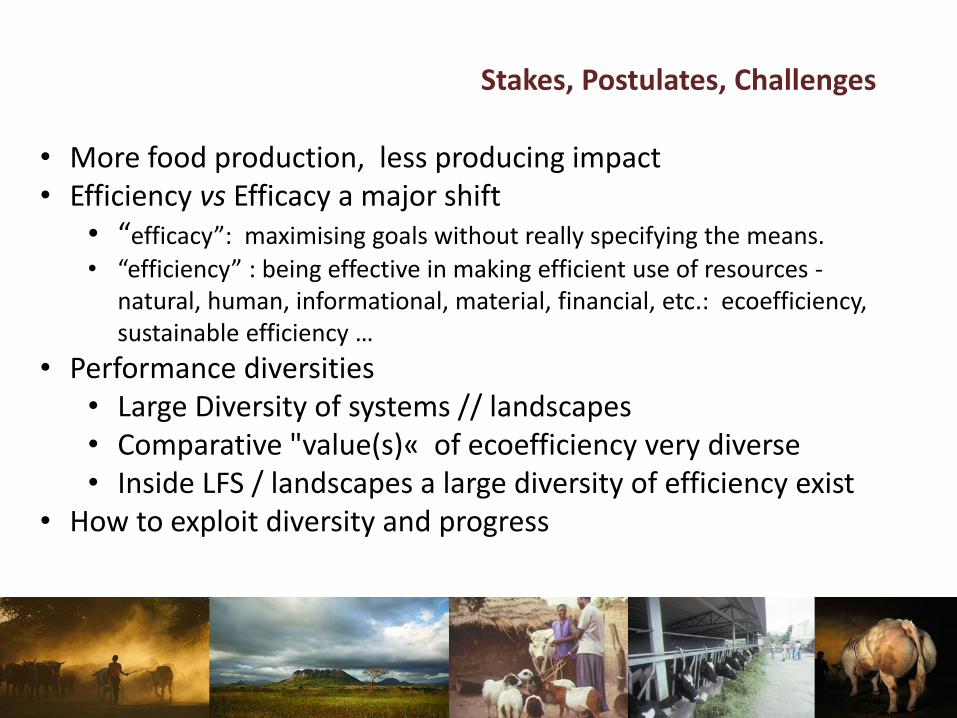
• More food production, less producing impact • Efficiency vs Efficacy a major shift
• “efficacy”: maximising goals without really specifying the means.
• “efficiency” : being effective in making efficient use of resources - natural, human, informational, material, financial, etc.: ecoefficiency, sustainable efficiency …
• Performance diversities • Large Diversity of systems // landscapes • Comparative "value(s)« of ecoefficiency very diverse • Inside LFS / landscapes a large diversity of efficiency exist
• How to exploit diversity and progress
Stakes, Postulates, Challenges

PC 1
PC
2
1 RE 1 VN 2 RE 2 VN 3 VN 4 VN
Groups
G1 G2
G4
G3
0.4 0.0 -0.5
0.50
0.00
-0.50
PC 1
PC 2
PROT Cc
MAT four
STARCH Cc
CELL Cc
CELL for.
HEM Cc
HEM for.
UFL Cc
UFL four
Kg DM Cc
Kg DM for
Diet efficiencies
Hiep et al., 2006

Groupes G1 G2 G3 G4 Diet classes
RE (n=44), % 39 61 0 0
VN (n=70), % 13 17 24 46
Diets
Forage Prot.+, Mj+
Hémic+,
Cell+ Mj- Hémic+
Supplement Prot.+ Starch+ Cell+ Starch+
DM intake total, kg DM/d 18.3 19.5 12.2 15.7
Suppl., kg DM/d 11.1 11.2 5.4 6.6
Forages C4 type, % 66 81 100 98
Animal prod. Efficiencies
Milk 4% fat, kg/d 19.7 19.6 8.3 15.3
Milk/DM intake 1.06 1.00 0.68 0.95
Milk/DM Suppl. 1.8 1.8 1.6 2.3
Environmental Efficiencies
CH4, litre/d 502 552 439 490
CH4/kg DM intake, litre/d 28 29 36 32
CH4/ Milk, litre/d 27 30 61 37
N total excreted, g/d 320 286 130 196
N excrété/N intake, dl 0.72 0.69 0.71 0.66
N excr./Milk, g/kg 16.2 14.6 15.8 12.9
0.0
0.4
0.8
1.2
1.6 Milk4%
Milk/DM int.
Milk/DM suppl.
CH4 total
CH4/kg DM int. CH4/lit. Milk
N total excr.
N excr./N int.
N excr/lit. Milk
G1
G2
G3
G4
Diet efficiencies
• Around mean efficiencies variation coeff. extend 14 - 35 %
• Large progress margins inside groups

Coeff. NR Energies MJ/unité
Coeff. GHG eqCO2
INDIRECT Energies & Emissions (Extraction, Manufacturing, Transport,)
DIRECT Energies & Emissions (Fuel, Electricity, Gaz,…)
FARM
INPUTS Fertilizers, concentrates fuel, water, …: plastics, …
Machinery
Housing
PRODUCTS Litre, kg,
Gross Energy
• Life cycle analysis(LCA) • 31 dairy farms in tropical landscapes
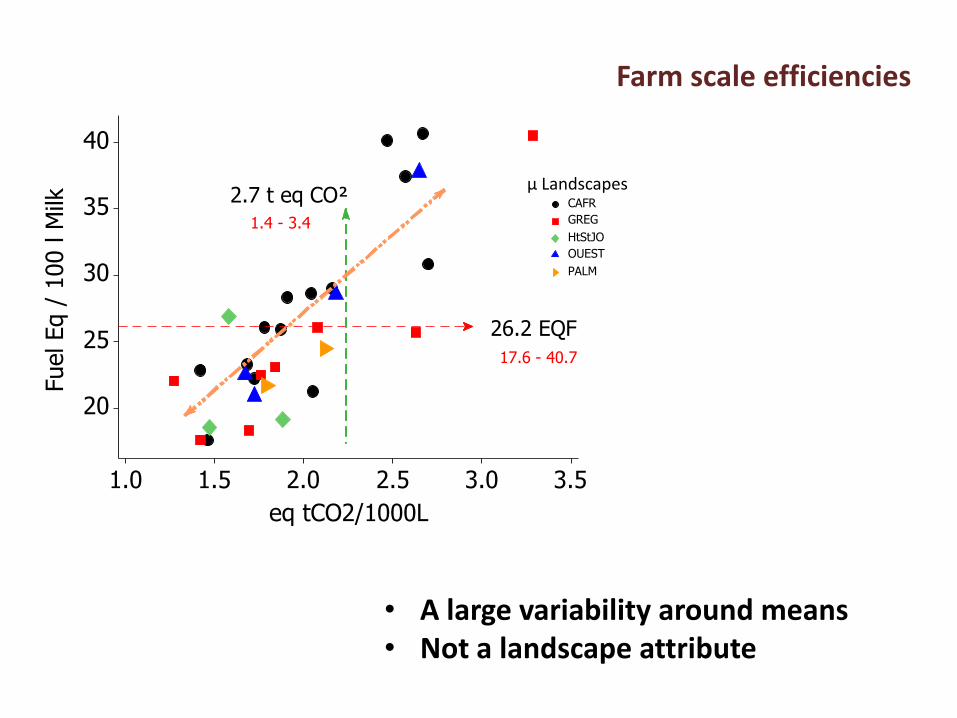
Farm scale efficiencies
3.5 3.0 2.5 2.0 1.5 1.0
40
35
30
25
20
eq tCO2/1000L
Fuel Eq /
100 l M
ilk
CAFR
GREG
HtStJO
OUEST
PALM
17.6 - 40.7
26.2 EQF
1.4 - 3.4
2.7 t eq CO²
Farm scale efficiencies
µ Landscapes
• A large variability around means • Not a landscape attribute
2.5 2.0 1.5 1.0 0.5
+
-
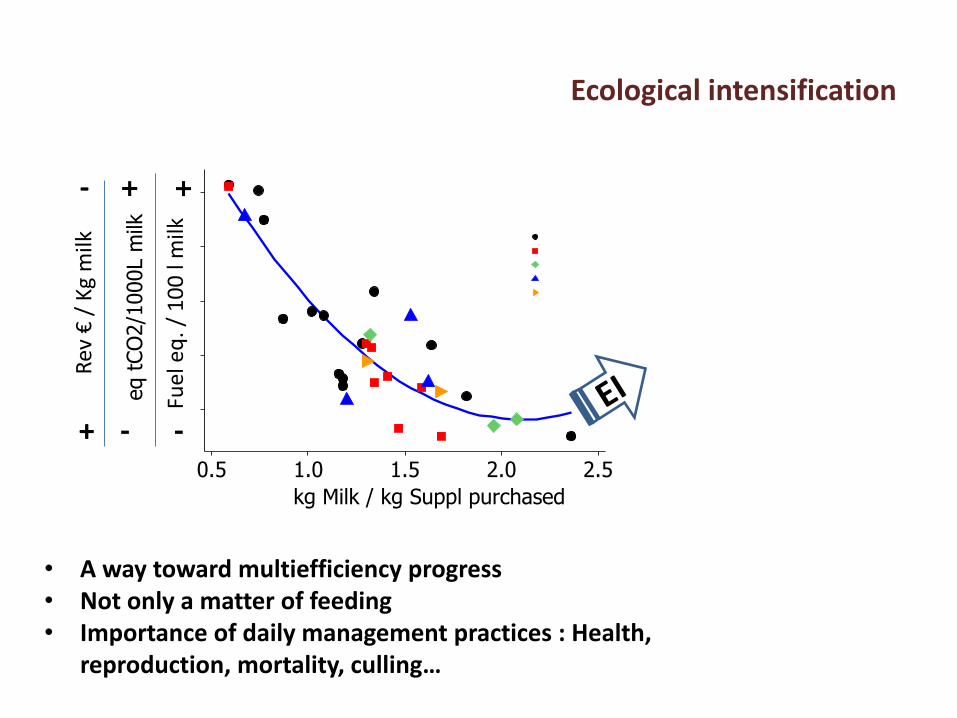
kg Milk / kg Suppl purchased
+
-
eq t
CO
2/1
000L m
ilk
Rev
€ /
Kg
milk
-
+
Fuel
eq
. / 1
00
l m
ilk
Ecological intensification
• A way toward multiefficiency progress • Not only a matter of feeding • Importance of daily management practices : Health,
reproduction, mortality, culling…

BIOGAS production : Hyp. : 1 700 m3 de lisier/an
50 000 kWh electricity . + 85 000 kW heat (to valorise?) Energy efficiency= 0,65 PHOTOVOLTAIC production : Hyp. : 200 m² de capteurs / roofs => 38 000 kWh electricity Energy efficiency= 0,59
Combination: EE = 0,84 vs 0.39
Additional functions on the farm

Environmental and economic efficiency
Toward new markets ?
65 300
11 000
5 600
2 700
46 000
Gain
9,2
-
-
1,1
8,1
Gain
336 14
576 24
672 28
Pot.
Payments Improvements
8 952 373 TOTAL
312 13
? ?
2 880 120
4 176 174
65 300
11 000
5 600
2 700
46 000
Gain
( € )
9,2
-
-
1,1
8,1
Gain
(EQF/100L)
336 14
576 24
672 28
(en € ) (en € )
t eqCO2
8 952 373 TOTAL
312 13
? ?
2 880 120
4 176 174
GHG avoided
CC manufacturing &
transport
Animal CH4
Fert. manufact. &
transport
Pasture CO2
sequestration
Manure GHG avoided
emission
GHG for electricity
avoided
GHG for electricity
avoided
Conc. Use efficiency
Substitute Min./Org. Fertiliser
Biogas production
Photovolt. production

Data Envelopment Analysis (DEA) : non-parametric frontier model
INPUTS (land, labor, forage, feeds …)
OUTPUTS (milk, meat, GHG,
nitrogen…)
Inefficient firm
Production frontier
Efficient firm
Projection on the frontier
Projection direction
• Efficiency of firms assessed by mathematical formulation of a production technology characterized by inputs and outputs
• Allows integration of undesirable outputs (GHG, Nitrogen excess, …)
• Directional distance function characterize path of inefficiency reduction
Adressing diversity of efficiencies
Classical « efficacy » logic

Directions in inefficiency reduction
Good outputs
Bad outputs
Inputs level fixed
• Efficiency can be considered / different projection direction on the frontier
Good outputs
Bad outputs
Farmer’s view : optimize milk production, Society’s view : reduce pollution
Good outputs
Bad outputs level fixed
Inputs
Dairy coop. view : increase inputs to reach the optimal amount of good production

Dataset for Data Envelopment Analysis
Input (x) / Output (y) Units Mean Standard deviation
Min Max
Milk production (MP) : Tons of milk 285.8 140.5 83.7 669.4
Nitrogen surplus (NS) : Kg of nitrogen 6090.8 3673.5 1371.5 21780.4
Greenhouse gases (GHG) : Tons of gas (eq. CO2) 488.4 244.1 148.6 1149.6
Livestock unit (LU) : Livestock unit 61.4 26.3 27 131.2
Feed charges (FC) : Tons of dry matter 231.9 114.1 69.19 525.1
Total labor (L) : Total labor (h)
7414.8
3398.2
2190
18158
land endowment (LE) : Surface (Ha) 22,2 16,0 3 72
gy
1by
2by
1x
2x
3x
4x
• 4 inputs, 1 good output and 2 undesirable outputs are considered :

Eco-efficiency assessment
• Progress margin can be assessed according to difft point of view
Milk production Emissions, Surpluses Inputs
GHG NS Feed
charges Herd Labor
Collective 25,65% 31,19% 31,98% 34,63%
Society -22,79% -24,12%
Farmers 13,04%
• A potential milk production raise of 25.65% is possible if farmers accept to increase their inputs by more than 30%.
• If inefficiency reduction only focus on pollution reduction, GHG and nitrogen surpluses can be reduced by 22.79% and 24.12 % respectively
• Farmers can increase their milk production by 13.04 %, given their current inputs and pollution levels

Compared GHG levels
• Efficiency improvement allow a significant reduction of GHG, below the mean value in France
• With resources reallocation, GHG level is even more reduced, and may become lower than minimal emission rate identified by the FAO
0
0.5
1
1.5
2
2.5
3
3.5
4
Observed level Optimal level optimal levelwith
reallocation
FAO (region min)
PLANETE (mini)
PLANETE (maxi)
PLANETE(mean)
Collective
Farmers
Society
Kg
eq. C
O2/L

Exploring beyond the frontiers the domain of possible efficiencies
Promising approach to measure potential inefficiency reduction in different context by generating large datasets and identifying the optimal amount of production (and pollution) for given levels of inputs
whole-farm dynamic model

Global analytic scheme
P1
-
+
P2
-
+
Pn
-
+
Simulations Input_1 Input_2 Input_3 Output_1 Output_2
Output_3
1 143 1289 35 12908 100 987
2 145 1376 39 13765 122 876
3 156 1298 63 14002 153 765
4 163 1498 29 13788 176 786
4 122 1538 54 12982 263 796
n … … … … … …
Improve efficiency determinant
.
.
.

Conclusions
• Efficiency shift, a real challenge for the future
• Complexity in adressing multiple goals efficiency
• Still a lot to do to observe compare reconsider experiment
• Scaling the efficiencies
• Marginal cost of efficiencies improvements
• Sum of small efficiency increase vs a unique integrated effcicient model
• Multi, (eco) efficiency value chaining

Tank