prudential data report - afme · prudential data report ... 11 1.17 liquidity coverage ... 3 2014...
TRANSCRIPT

Association for Financial Markets in Europe
www.afme.eu
Prudential data report
EU GSIBs prudential capital and liquidity
Q3: 2016
Contents
Prudential data report Page 2
Contents
Highlights ...................................................................................................................................................................................... 3 Fresh capital raised by EU banks (EUR bn) .............................................................................................................................................................................................................. 3 Capital and liquidity ratios and fresh capital raised by EU banks (as at 3Q16) ......................................................................................................................................... 3 Change in CET1 and RWAs by EU GSIB (YtD, %, end-point) .............................................................................................................................................................................. 4
Major upcoming regulatory, legislative and policy initiatives .................................................................................................. 5 1 Capital and liquidity ratios ........................................................................................................................................................................... 6
1.1 CET1 ratio: phased-in ............................................................................................................................................................................................................................................ 6 1.2 Cumulative percentage change of CET1, RWAs and CET1 ratio (phased-in) .................................................................................................................................. 6 1.3 CET1: phased-in (EUR bn) ................................................................................................................................................................................................................................... 6 1.4 RWAs: phased-in (EUR tn) .................................................................................................................................................................................................................................. 7 1.5 CET1 ratio: end-point ............................................................................................................................................................................................................................................ 7 1.6 Change in end-point CET1 by components ................................................................................................................................................................................................... 7 1.7 Difference between current CET1 ratios and 2019 minimum requirement incl. GSIB buffer by bank ................................................................................ 8 1.8 Weighted average of EU GSIBs’ CET1 ratios relative to end-point target assuming a 2.5% countercyclical buffer ........................................................ 8 1.9 Tier 1 ratio: phased-in .......................................................................................................................................................................................................................................... 8 1.10 Cumulative percentage change of T1, RWAs and T1 ratio (phased-in) ............................................................................................................................................. 9 1.11 Tier 1 ratio: end-point ........................................................................................................................................................................................................................................... 9 1.12 RWAs by risks........................................................................................................................................................................................................................................................... 9 1.13 RWAs by risks and EU GSIB ............................................................................................................................................................................................................................. 10 1.14 RWA densities (weighted average) ............................................................................................................................................................................................................... 10 1.15 Leverage ratio: end-point ................................................................................................................................................................................................................................. 10 1.16 Cumulative percentage change of T1 capital, exposure measure and leverage ratio ............................................................................................................... 11 1.17 Liquidity Coverage Ratio (LCR) ...................................................................................................................................................................................................................... 11
Box: EU and US leverage ratios: comparing two financial structures .......................................................................................................... 12 Chart 1: Leverage ratio: EU and US GSIBs (IFRS) ................................................................................................................................................................................................ 12 Chart 2: Home mortgages held on banks’ balance sheets and placed securitisations (2015, EUR bn).......................................................................................... 13 Chart 3: Mortgages held on banks’ balance sheets and leverage ratio (2015) ........................................................................................................................................ 13 Chart 4: Debt financing of non-financial corporates (2015, EUR bn).......................................................................................................................................................... 13
2 Debt securities and contingent convertibles ............................................................................................................................................ 14 2.1 EU GSIBs simple average long-term credit rating ................................................................................................................................................................................... 14 2.2 EU GSIBs debt outstanding by seniority ..................................................................................................................................................................................................... 14 2.3 Maturity profile of EU 28 Banks’ outstanding debt securities (EUR bn, maturity in years)................................................................................................... 14 2.4 CoCos by capital tiering (EUR bn) ................................................................................................................................................................................................................. 15 2.5 CoCos by loss absorbing mechanism (quarterly, EUR bn) ................................................................................................................................................................... 15 2.6 CoCos by loss absorbing mechanism (annual, EUR bn) ........................................................................................................................................................................ 15 2.7 Weighted average coupons of fixed-rate CoCos ....................................................................................................................................................................................... 15 2.8 CoCos by credit rating at date of issuance (EUR bn) .............................................................................................................................................................................. 16 2.9 CoCos by trigger (EUR bn) ................................................................................................................................................................................................................................ 16 2.10 CoCos by maturity at date of issuance (EUR bn) ..................................................................................................................................................................................... 16 2.11 CoCo prices by capital tiering (Jun-14=100) ............................................................................................................................................................................................. 17 2.12 CoCo prices by risk and location (Jun-14=100) ....................................................................................................................................................................................... 17 2.13 CoCo option-adjusted spreads (OAS) (%) .................................................................................................................................................................................................. 17 2.14 Recently issued CoCos by European Banks (2016 as of early November) .................................................................................................................................... 18
Summary of the methodologies adopted in this report........................................................................................................... 19
Annex ........................................................................................................................................................................................... 23

Highlights
Prudential data report Page 3
“EU GSIBs achieved the largest quarterly increase in CET1 ratio since 1Q14, equating to an increase of +48 bps from 11.99% in 2Q16 to 12.47% in 3Q16 (…) explained by a substantial decrease in RWAs”
Fresh capital raised by EU banks
(EUR bn)
Source: Dealogic
Highlights
European systemically important banks (or EU GSIBs1) continued to improve their solvency positions during the quarter.
In 3Q16, EU GSIBs achieved the largest quarterly increase in CET1 ratio since 2014, equating to an increase of c48bps from 11.99% in 2Q16 to 12.47% in 3Q16.
The increase in solvency ratios was largely explained by a substantial decrease in RWAs of 4.1% QoQ. Around 42% of this variation can be attributed to changes in the regulatory treatment of a large foreign operation of one bank (€108bn decrease of a total of €254bn RWA decrease of all EU GSIBs during the quarter). Other factors such as asset disposal, FX variations and balance sheet de-risking also contributed to the RWA decrease during the quarter (see charts 1.4-1.6 in the report for further detail).
The decrease in RWAs illustrate the continued balance sheet restructuring of banks to comply with CRDIV. This, in a volatile macro-environment which has not been favourable for capital raising through markets (see chart in left panel) and as ultra-low interest rates limit a faster accumulation of capital through internal generation.
The improvement in European bank solvency is also illustrated by the main findings of this report:
EU GSIBs have increased their end-point Common Equity Tier 1 Capital ratio (CET1 ratio) to 12.5% in 3Q16, from 10.0% in 2013.
End-point Tier 1 ratios increased to 13.8% in 3Q16, from 10.8% in 2013.
End-point Leverage ratios have improved over the last three years, to 4.8% in 3Q16 from 3.7% in 2013.
Available information indicates the weighted average2 Liquidity Coverage Ratio (LCR) stood at 127.4% in 3Q16, above the minimum required by 1 January 2018 (100%).
Capital and liquidity ratios and fresh capital raised by
EU banks (as at 3Q16)3
Source: EU GSIBs balance sheets, EBA and Dealogic
1 The Banks aggregated in this report are the 14 EU GSIBs as designated by the FSB in 2014, which was in force in 3Q16. In November 2015, the FSB updated the list of systemically important banks, changing the number of EU GSIBs from 14 to 13. The assignment of the GSIBs to the respective buckets will apply from 1 January 2017. In November 2016, the FSB updated the bucket allocation once again; the new bucket allocation will apply from 1 January 2018. 2 Weighted by end-point RWAs with information of 7 of the 14 EU GSIBs that reported LCRs in 2Q16 earnings reports and Pillar 3 disclosure documents. 3 2014 LCR is sourced from the EBA’s September 2015 Basel III monitoring exercise. Ratios are rounded to 1 decimal.
95.7
31.9 33.020.2
41.9 43.635.8
7.9
19.1
3.2 4.9
6.1
13.7
40.0
27.8
16.2
8.7
2.7 1.1
0.7
2.1
0.1
0.0
0.3
0
20
40
60
80
100
120
140
2009 2010 2011 2012 2013 2014 2015 2016YtD(3Q)
Convertibles
CoCos
Follow-ons
2013 2014 2015 3QYtD 2016CET1 ratio (end-point) 10.0% 11.0% 11.8% 12.5%
T1 ratio (end-point) 10.8% 11.8% 12.9% 13.8%
Leverage ratio (end-point) 3.7% 4.3% 4.6% 4.8%
LCR - 127.5% 128.2% 127.4%
Fresh capital raised (€bn) 57.7 83.7 63.6 24.4
of which CoCos (€bn) 13.7 40.0 27.8 16.2
EU GSIBs
EU banks

Highlights
Prudential data report Page 4
Change in CET1 and RWAs by EU
GSIB (YtD, %, end-point)4
Source: EU GSIBs balance sheets
“During 2016, 13 of the 14 EU GSIBs in this report increased their CET1 ratio from the ratios reported at the end of 2015”
“Since 2012, five EUGSIBs have been moved to a lower capital bucket, including one bank that was removed from the list in 2015”
4 The quarterly changes are in the original reporting currencies (USD, EUR or GBP) to isolate for FX effects.
Improvement in CET1 ratio During 2016, 13 of the 14 EU GSIBs in this report have increased their CET1 ratio from the ratios reported at the end of 2015.
By banks, of the 14 EU GSIBs, three banks increased5 their RWAs and CET1 capital from the values reported in 4Q15; four decreased CET1 capital and RWAs; and seven increased CET1 capital and decreased RWAs (see figure on left panel).
Capital raising
During 2016, EU banks have raised a total of €24.4bn in fresh capital in the form of CoCos, follow-on originations and other convertible securities. This brings the tally of total capital raised since the 2009 crisis to €456bn (€333bn since 2010). This estimate does not take into account increases in capital from internal generation or balance sheet restructuring.
European banks6 have issued €18.6bn in CoCos during 2016YtD (€16.2bn by EU banks), below the volume issued during the same period of 2015 (€33.7bn, €27.3bn of which were raised by EU banks). Of these new issues, average coupons increased from 6.6% in 2015 to 7.6% in 2016YtD.
FSB updated GSIB bucket allocation
In mid-November 2016, the FSB updated the list of designated GSIBs, including the buckets each one has been allocated to, which specifies the subsequent additional capital buffer requirement.
Since 2012, five EUGSIBs have been moved to a lower capital bucket, including one bank that was removed from the list in 2015. These changes have signified, on a weighted average basis, lower weighted average GSIB capital surcharges for EU GSIBs. This is in response to the continued effort of banks to restructure their balance sheets to comply with the end-point capital ratio requirements— including through asset disposals and RWA restructuring.
Number of EU GSIBs by bucket allocation and capital
surcharge: 2012-16
Source: FSB. *2014 list in force until 2016EoY
Specifically, the 2014-16 changes in bucket allocation have signified an additional 20bp increase in surplus of CET1 ratio against Pillar I end-point 2019 capital requirements (see further details in chart 1.8 of the report).
5 On the basis of the values reported in the original currencies of the financial statements. 6 Including EU, EFTA, Turkish and other Eastern European Banks.
-8%
-6%
-4%
-2%
0%
2%
4%
6%
8%
10%
-20% -15% -10% -5% 0% 5% 10%
Change in CET1
Change in RWAs
Bucket GSIB surcharge 2012 2013 2014* 2015 2016
5 3.5%
4 2.5% 2 1 1 1 0
3 2.0% 2 3 3 3 3
2 1.5% 1 2 1 0 1
1 1.0% 9 8 9 9 9
14 14 14 13 13Total
Number of EU GSIBs
(Empty)

Major upcoming regulatory, legislative and policy initiatives
Prudential data report Page 5
“In the US, c63% of outstanding home mortgages are securitised in the market and do not count towards banks’ leverage ratios or exposure measure, while in the EU only around 4% of residential mortgages are securitised and placed on markets”
Debt securities and average credit rating
In 3Q 2016 there were no major changes to the credit quality assessment of EU GSIBs. The simple average long-term credit rating of EU GSIBs continued at A (or A2 in the Moody’s scale), with a range from BBB to AA- by banks.
The average maturity of outstanding debt securities of EU banks has increased continuously since the financial crisis. Only over the last three years, the average maturity has increased from 4.3 years in 4Q09 to 5.2 years in 3Q167.
BOX: Leverage ratio - US and the EU (further detail on pages 12-13 of the report)
Historically, there have been differences in the leverage ratios reported by US GSIBs and EU GSIBs, with US GSIBs reporting, on average, higher leverage ratios than EU banks.
As shown in a Box of this report (pages 12-13), the gap between EU and US GSIBs leverage ratios go beyond differences in accounting standards. The US and the EU have different financial structures relating to how companies and individuals raise finance. This is particularly the case in the mortgage market and the role of securitisations.
In the US, c63% of outstanding home mortgages are securitised in the market and do not count towards banks’ leverage ratios or exposure measure (denominator of leverage ratio), while in the EU only around 4% of residential mortgages are securitised and placed on markets (8% securitised but retained on banks’ balance sheets). Furthermore, 82% of fixed income financing of US non-financial corporates is raise through markets, while in the EU is only 18% (72% though bank loans), indicating a substantial difference in the amount of loans that remain on banks’ balance sheets adding further pressure onto EU banks’ exposure measure and leverage ratios.
Major upcoming regulatory, legislative and policy initiatives
There are several regulatory initiatives that are currently being considered at both the international level and at the European level. These will in due course potentially impact the basis of calculations for the metrics covered in this report. Some of the key initiatives are:
Review of the Leverage Ratio Fundamental Review of the Trading Book Credit Valuation Adjustment IRB models, revised Standardised Approaches & capital
floors Interest Rate Risk in the Banking Book
AFME is actively contributing to each initiative.
7 This calculation assumes that bonds with maturities above 10 years (including perpetual) have a weighted average maturity of 15 years.
Capital and liquidity ratios
Prudential data report Page 6
1 Capital and liquidity ratios8
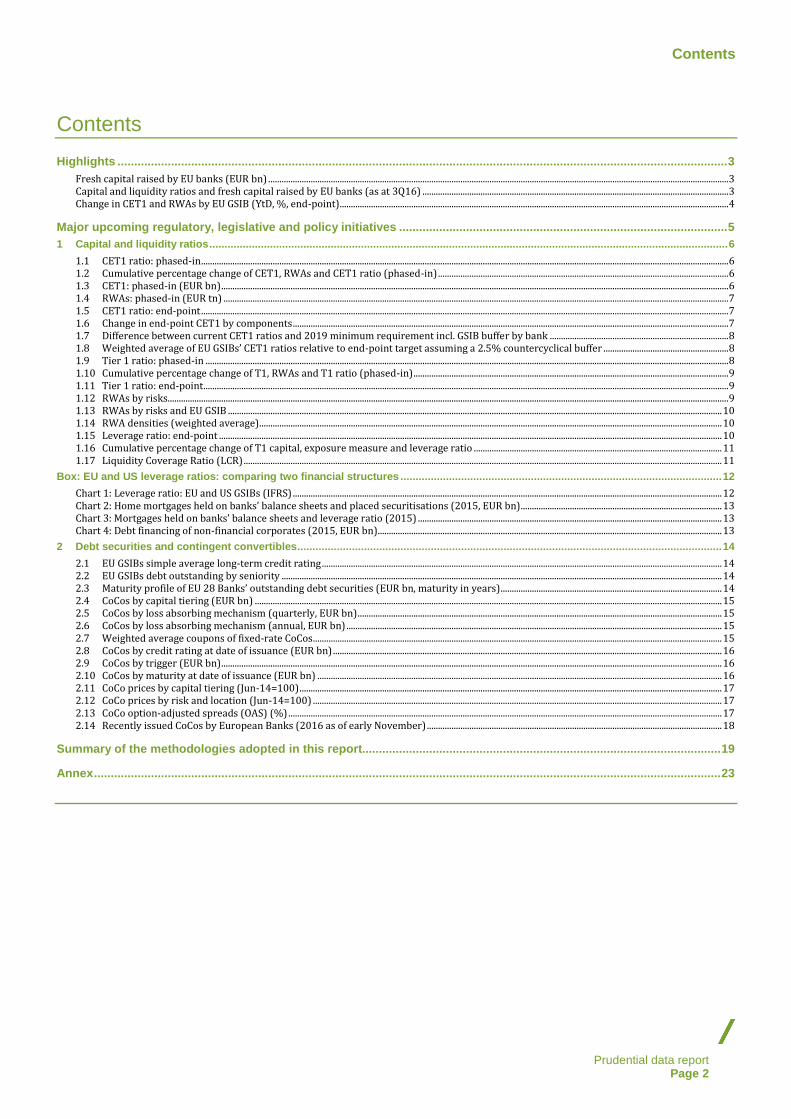
1.1 CET1 ratio: phased-in
Maximum, minimum and 25th-75th percentiles in boxes
Source: EU GSIBs balance sheets
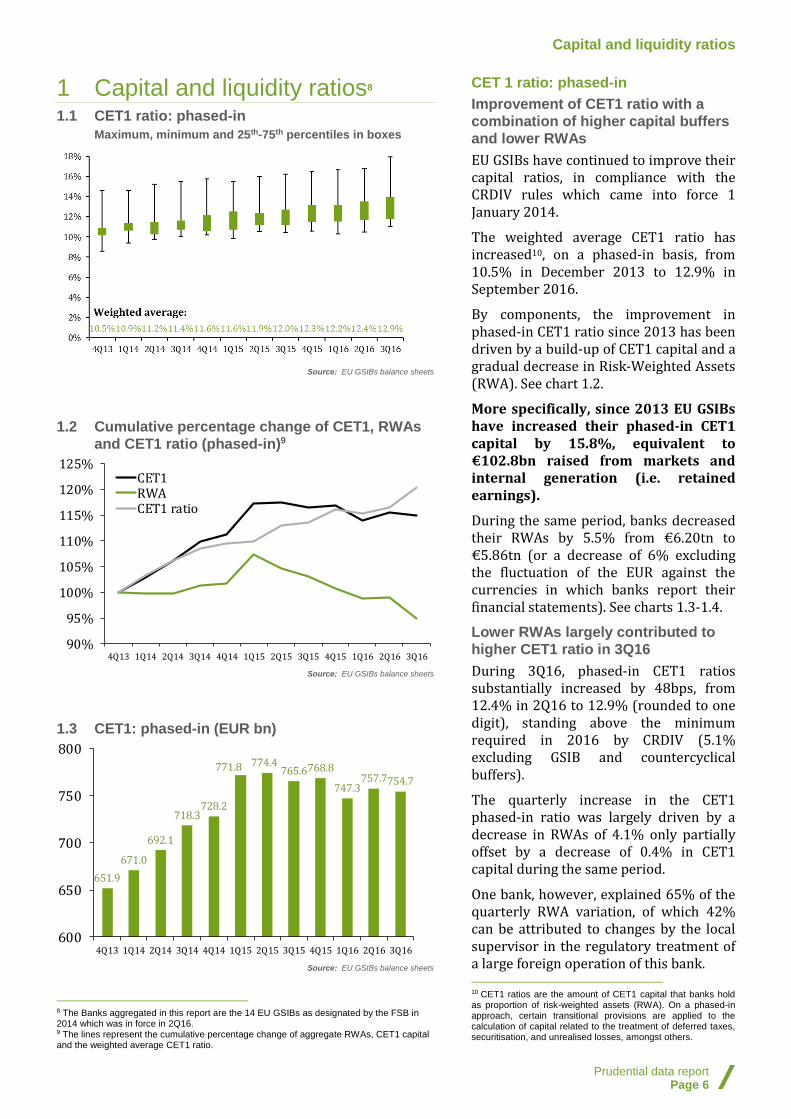
1.2 Cumulative percentage change of CET1, RWAs
and CET1 ratio (phased-in)9
Source: EU GSIBs balance sheets
1.3 CET1: phased-in (EUR bn)
Source: EU GSIBs balance sheets
8 The Banks aggregated in this report are the 14 EU GSIBs as designated by the FSB in 2014 which was in force in 2Q16. 9 The lines represent the cumulative percentage change of aggregate RWAs, CET1 capital and the weighted average CET1 ratio.
CET 1 ratio: phased-in
Improvement of CET1 ratio with a
combination of higher capital buffers
and lower RWAs
EU GSIBs have continued to improve their capital ratios, in compliance with the CRDIV rules which came into force 1 January 2014.
The weighted average CET1 ratio has increased10, on a phased-in basis, from 10.5% in December 2013 to 12.9% in September 2016.
By components, the improvement in phased-in CET1 ratio since 2013 has been driven by a build-up of CET1 capital and a gradual decrease in Risk-Weighted Assets (RWA). See chart 1.2.
More specifically, since 2013 EU GSIBs have increased their phased-in CET1 capital by 15.8%, equivalent to €102.8bn raised from markets and internal generation (i.e. retained earnings).
During the same period, banks decreased their RWAs by 5.5% from €6.20tn to €5.86tn (or a decrease of 6% excluding the fluctuation of the EUR against the currencies in which banks report their financial statements). See charts 1.3-1.4.
Lower RWAs largely contributed to
higher CET1 ratio in 3Q16
During 3Q16, phased-in CET1 ratios substantially increased by 48bps, from 12.4% in 2Q16 to 12.9% (rounded to one digit), standing above the minimum required in 2016 by CRDIV (5.1% excluding GSIB and countercyclical buffers).
The quarterly increase in the CET1 phased-in ratio was largely driven by a decrease in RWAs of 4.1% only partially offset by a decrease of 0.4% in CET1 capital during the same period.
One bank, however, explained 65% of the quarterly RWA variation, of which 42% can be attributed to changes by the local supervisor in the regulatory treatment of a large foreign operation of this bank. 10 CET1 ratios are the amount of CET1 capital that banks hold as proportion of risk-weighted assets (RWA). On a phased-in approach, certain transitional provisions are applied to the calculation of capital related to the treatment of deferred taxes, securitisation, and unrealised losses, amongst others.
90%
95%
100%
105%
110%
115%
120%
125%
4Q13 1Q14 2Q14 3Q14 4Q14 1Q15 2Q15 3Q15 4Q15 1Q16 2Q16 3Q16
CET1RWACET1 ratio
651.9
671.0
692.1
718.3728.2
771.8 774.4765.6768.8
747.3757.7754.7
600
650
700
750
800
4Q13 1Q14 2Q14 3Q14 4Q14 1Q15 2Q15 3Q15 4Q15 1Q16 2Q16 3Q16
Capital and liquidity ratios
Prudential data report Page 7
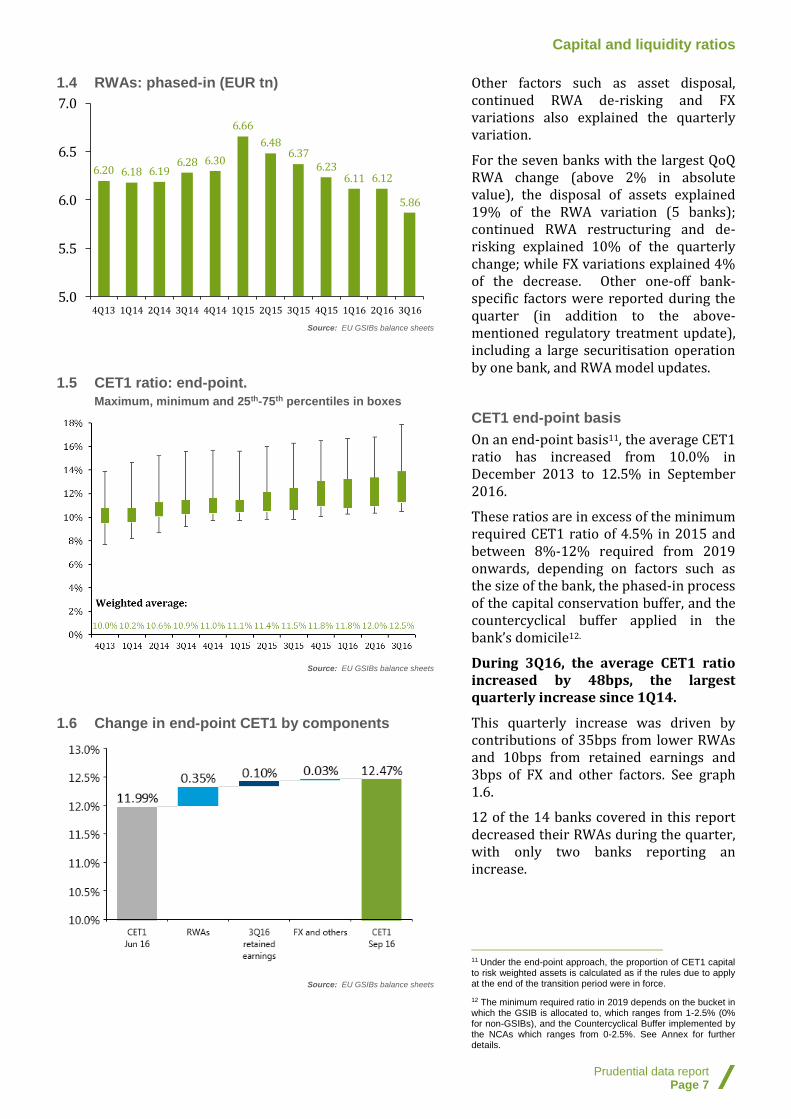
1.4 RWAs: phased-in (EUR tn)
Source: EU GSIBs balance sheets
1.5 CET1 ratio: end-point.
Maximum, minimum and 25th-75th percentiles in boxes
Source: EU GSIBs balance sheets
1.6 Change in end-point CET1 by components
Source: EU GSIBs balance sheets
Other factors such as asset disposal, continued RWA de-risking and FX variations also explained the quarterly variation.
For the seven banks with the largest QoQ RWA change (above 2% in absolute value), the disposal of assets explained 19% of the RWA variation (5 banks); continued RWA restructuring and de-risking explained 10% of the quarterly change; while FX variations explained 4% of the decrease. Other one-off bank-specific factors were reported during the quarter (in addition to the above-mentioned regulatory treatment update), including a large securitisation operation by one bank, and RWA model updates.
CET1 end-point basis
On an end-point basis11, the average CET1 ratio has increased from 10.0% in December 2013 to 12.5% in September 2016.
These ratios are in excess of the minimum required CET1 ratio of 4.5% in 2015 and between 8%-12% required from 2019 onwards, depending on factors such as the size of the bank, the phased-in process of the capital conservation buffer, and the countercyclical buffer applied in the bank’s domicile12.
During 3Q16, the average CET1 ratio increased by 48bps, the largest quarterly increase since 1Q14.
This quarterly increase was driven by contributions of 35bps from lower RWAs and 10bps from retained earnings and 3bps of FX and other factors. See graph 1.6.
12 of the 14 banks covered in this report decreased their RWAs during the quarter, with only two banks reporting an increase.
11 Under the end-point approach, the proportion of CET1 capital to risk weighted assets is calculated as if the rules due to apply at the end of the transition period were in force. 12 The minimum required ratio in 2019 depends on the bucket in which the GSIB is allocated to, which ranges from 1-2.5% (0% for non-GSIBs), and the Countercyclical Buffer implemented by the NCAs which ranges from 0-2.5%. See Annex for further details.
6.20 6.18 6.196.28 6.30
6.66
6.486.37
6.236.11 6.12
5.86
5.0
5.5
6.0
6.5
7.0
4Q13 1Q14 2Q14 3Q14 4Q14 1Q15 2Q15 3Q15 4Q15 1Q16 2Q16 3Q16
Capital and liquidity ratios
Prudential data report Page 8
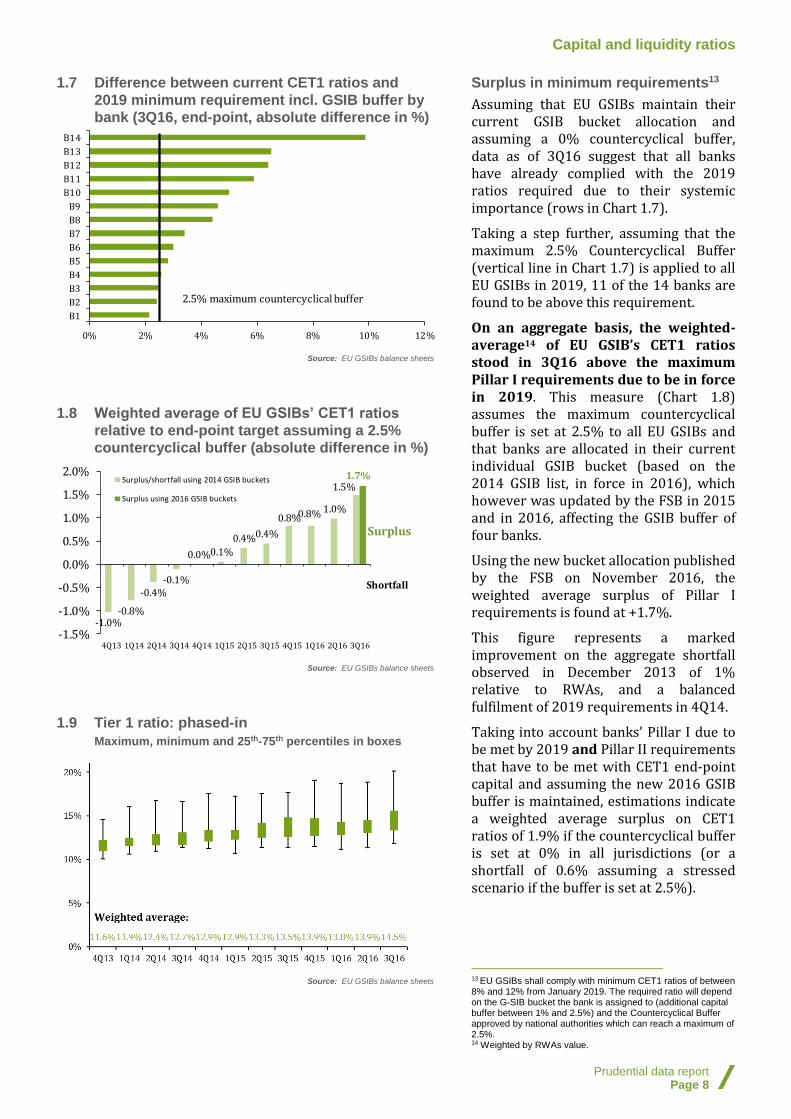
1.7 Difference between current CET1 ratios and
2019 minimum requirement incl. GSIB buffer by
bank (3Q16, end-point, absolute difference in %)
Source: EU GSIBs balance sheets
1.8 Weighted average of EU GSIBs’ CET1 ratios
relative to end-point target assuming a 2.5%
countercyclical buffer (absolute difference in %)
Source: EU GSIBs balance sheets
1.9 Tier 1 ratio: phased-in
Maximum, minimum and 25th-75th percentiles in boxes
Source: EU GSIBs balance sheets
Surplus in minimum requirements13
Assuming that EU GSIBs maintain their current GSIB bucket allocation and assuming a 0% countercyclical buffer, data as of 3Q16 suggest that all banks have already complied with the 2019 ratios required due to their systemic importance (rows in Chart 1.7).
Taking a step further, assuming that the maximum 2.5% Countercyclical Buffer (vertical line in Chart 1.7) is applied to all EU GSIBs in 2019, 11 of the 14 banks are found to be above this requirement.
On an aggregate basis, the weighted-average14 of EU GSIB’s CET1 ratios stood in 3Q16 above the maximum Pillar I requirements due to be in force in 2019. This measure (Chart 1.8) assumes the maximum countercyclical buffer is set at 2.5% to all EU GSIBs and that banks are allocated in their current individual GSIB bucket (based on the 2014 GSIB list, in force in 2016), which however was updated by the FSB in 2015 and in 2016, affecting the GSIB buffer of four banks.
Using the new bucket allocation published by the FSB on November 2016, the weighted average surplus of Pillar I requirements is found at +1.7%.
This figure represents a marked improvement on the aggregate shortfall observed in December 2013 of 1% relative to RWAs, and a balanced fulfilment of 2019 requirements in 4Q14.
Taking into account banks’ Pillar I due to be met by 2019 and Pillar II requirements that have to be met with CET1 end-point capital and assuming the new 2016 GSIB buffer is maintained, estimations indicate a weighted average surplus on CET1 ratios of 1.9% if the countercyclical buffer is set at 0% in all jurisdictions (or a shortfall of 0.6% assuming a stressed scenario if the buffer is set at 2.5%).
13 EU GSIBs shall comply with minimum CET1 ratios of between 8% and 12% from January 2019. The required ratio will depend on the G-SIB bucket the bank is assigned to (additional capital buffer between 1% and 2.5%) and the Countercyclical Buffer approved by national authorities which can reach a maximum of 2.5%. 14 Weighted by RWAs value.
0% 2% 4% 6% 8% 10% 12%
B1
B2
B3
B4
B5
B6
B7
B8
B9
B10
B11
B12
B13
B14
2.5% maximum countercyclical buffer
-1.0%-0.8%
-0.4%-0.1%
0.0%0.1%
0.4%0.4%
0.8%0.8% 1.0%
1.5%1.7%
-1.5%
-1.0%
-0.5%
0.0%
0.5%
1.0%
1.5%
2.0%
4Q13 1Q14 2Q14 3Q14 4Q14 1Q15 2Q15 3Q15 4Q15 1Q16 2Q16 3Q16
Surplus/shortfall using 2014 GSIB buckets
Surplus using 2016 GSIB buckets
Surplus
Shortfall
Capital and liquidity ratios
Prudential data report Page 9
1.10 Cumulative percentage change of T1, RWAs and
T1 ratio (phased-in)15
Source: EU GSIBs balance sheets
1.11 Tier 1 ratio: end-point
Source: EU GSIBs balance sheets
1.12 RWAs by risks
Source: EU GSIBs balance sheets
15 The lines represent the cumulative percentage change of aggregate RWAs, T1 capital and the weighted average T1 ratio.
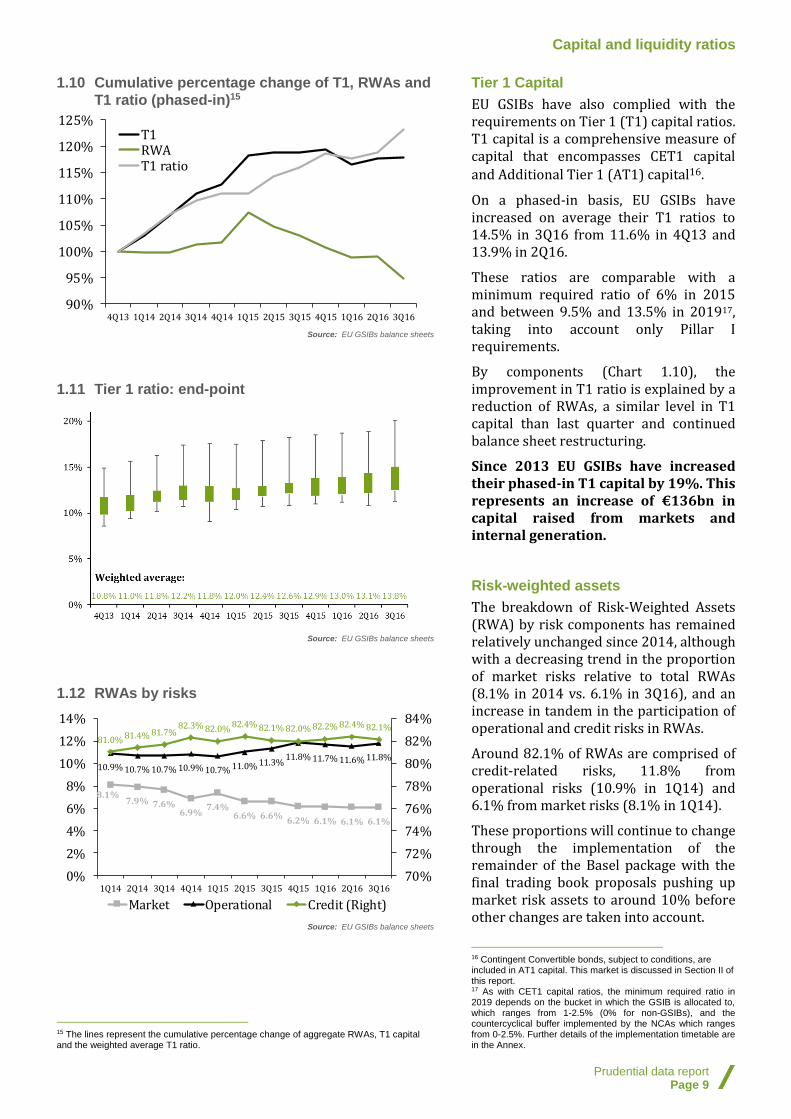
Tier 1 Capital
EU GSIBs have also complied with the requirements on Tier 1 (T1) capital ratios. T1 capital is a comprehensive measure of capital that encompasses CET1 capital and Additional Tier 1 (AT1) capital16.
On a phased-in basis, EU GSIBs have increased on average their T1 ratios to 14.5% in 3Q16 from 11.6% in 4Q13 and 13.9% in 2Q16.
These ratios are comparable with a minimum required ratio of 6% in 2015 and between 9.5% and 13.5% in 201917, taking into account only Pillar I requirements.
By components (Chart 1.10), the improvement in T1 ratio is explained by a reduction of RWAs, a similar level in T1 capital than last quarter and continued balance sheet restructuring.
Since 2013 EU GSIBs have increased their phased-in T1 capital by 19%. This represents an increase of €136bn in capital raised from markets and internal generation.
Risk-weighted assets
The breakdown of Risk-Weighted Assets (RWA) by risk components has remained relatively unchanged since 2014, although with a decreasing trend in the proportion of market risks relative to total RWAs (8.1% in 2014 vs. 6.1% in 3Q16), and an increase in tandem in the participation of operational and credit risks in RWAs.
Around 82.1% of RWAs are comprised of credit-related risks, 11.8% from operational risks (10.9% in 1Q14) and 6.1% from market risks (8.1% in 1Q14).
These proportions will continue to change through the implementation of the remainder of the Basel package with the final trading book proposals pushing up market risk assets to around 10% before other changes are taken into account.
16 Contingent Convertible bonds, subject to conditions, are included in AT1 capital. This market is discussed in Section II of this report. 17 As with CET1 capital ratios, the minimum required ratio in 2019 depends on the bucket in which the GSIB is allocated to, which ranges from 1-2.5% (0% for non-GSIBs), and the countercyclical buffer implemented by the NCAs which ranges from 0-2.5%. Further details of the implementation timetable are in the Annex.
90%
95%
100%
105%
110%
115%
120%
125%
4Q13 1Q14 2Q14 3Q14 4Q14 1Q15 2Q15 3Q15 4Q15 1Q16 2Q16 3Q16
T1RWAT1 ratio
8.1%7.9% 7.6%
6.9%7.4%
6.6% 6.6%6.2% 6.1% 6.1% 6.1%
10.9% 10.7% 10.7% 10.9% 10.7% 11.0% 11.3%11.8% 11.7% 11.6% 11.8%
81.0% 81.4% 81.7%82.3% 82.0%
82.4% 82.1% 82.0% 82.2% 82.4% 82.1%
70%
72%
74%
76%
78%
80%
82%
84%
0%
2%
4%
6%
8%
10%
12%
14%
1Q14 2Q14 3Q14 4Q14 1Q15 2Q15 3Q15 4Q15 1Q16 2Q16 3Q16
Market Operational Credit (Right)

Capital and liquidity ratios
Prudential data report Page 10
1.13 RWAs by risks and EU GSIB18
Source: EU GSIBs balance sheets
1.14 RWA densities (weighted average)19
Source: EU GSIBs balance sheets
1.15 Leverage ratio: end-point
Maximum, minimum and 25th-75th percentiles in boxes
Source: EU GSIBs balance sheets
18 Breakdown as of 3Q16 for 11 of the 14 EU GSIBs. Others are presented as of latest available (2Q16). 19 Phased-in RWAs as proportion of total assets.
By banks, 11 of the 14 EU GSIBs had an exposure to credit risks above 80% of RWAs (with a maximum of 90% and a minimum of 64.7%), while 3 of the 14 EU GSIBs reported an exposure above 10% of RWAs to market risks (range between 13% and 1.4%). In relation to operational risks, 11 of the 14 EU GSIBs reported an exposure at or above 10% of RWAs to operational risks (range between 25% and 8% between banks).
RWA densities
The ratio of RWAs relative to total assets decreased in 3Q16 to 32.4%, from 32.8% in 2Q16.
The 3Q16 average density is also below the figure observed in 4Q13, when it stood at 39.1%.
The decreasing trend can be in part explained by the continued balance sheet restructuring of banks, including during the last quarter, with the de-risking of high risk-weight activities by some banks.
Notwithstanding the decreasing trend in RWA densities, the aggregate ratio is expected to increase with the implementation of new Basel initiatives such as the IRB models, revised Standardised Approaches & capital floors.
Leverage ratio
EU GSIBs have improved their leverage ratios since 2013. Leverage ratios are a measure of Tier 1 capital as a proportion of the bank’s total exposure (on- and off-balance sheet assets.)
On an end-point basis, the weighted average leverage ratio has improved from 3.7% in December 2013 to 4.76% in September 2016. The ratio increased compared to 2Q16, from 4.62% reported a quarter ago, due to an increase of 0.5% in T1 end-point capital and a decrease of 2% in banks’ total exposure measure (see chart 1.16).
These ratios are comparable with a global minimum standard of 3% according to the Basel III accord.
82.1%
6.1%
11.8%
0%
20%
40%
60%
80%
100%B
1
B2
B3
B4
B5
B6
B7
B8
B9
B1
0
B1
1
B1
2
B1
3
B1
4
EU
GS
IBs
Credit Market Operational
39.1% 36.2% 35.9% 34.8% 34.6% 33.4% 34.7% 34.8% 35.2% 33.6% 32.8%
32.4%
0%
10%
20%
30%
40%
50%
60%
70%
4Q13 1Q14 2Q14 3Q14 4Q14 1Q15 2Q15 3Q15 4Q15 1Q16 2Q16 3Q16

Capital and liquidity ratios
Prudential data report Page 11
1.16 Cumulative percentage change of T1 capital,
exposure measure and leverage ratio
Source: EU GSIBs balance sheets
1.17 Liquidity Coverage Ratio (LCR)
Source: EU GSIBs balance sheets
The quarterly decrease of 2% in the exposure measure occurs in tandem with the decrease of 4.1% in RWAs during the quarter, mirroring the balance sheet restructuring of banks and the recent disposal of assets of some banks to continue to comply with the CRDIV requirements (see RWA section for further detail).
Liquidity Coverage Ratio (LCR)
CRDIV requires banks to have a sufficient level of High Quality Liquid Assets (HQLA) to withstand a stressed funding scenario of 30 days20. More specifically, it requires that HQLA relative to total net cash outflows over a 30-day time period are greater than or equal to 100%.
Banks must meet at least 70% of the LCR requirement from from 1 January 2016, 80% from 1 January 2017, and 100% from 1 January 2018 (timescale in Graph 1.17).
Available information21 on the basis of the fully-loaded requirement indicates that the weighted average LCR is already above the 2018 minimum required ratio (100%). The weighted average LCR stood at 127.4% in 3Q16, marginally above the ratio observed in 1Q16 (127.2%)22.
20 See EBA Basel III monitoring exercise here. 21 Information was available for seven of the 14 EU GSIBs. Among the banks not included in this calculation, two reported that their LCRs stood above 110% while three banks reported that their ratios stood above 100%. 22 According to the latest EBA Basel III monitoring exercise, as of June 2015, Group 1 banks reported an LCR ratio of 121.1% of which GSIBs had a ratio of 118.1%. However, only 9 EU GSIBs were covered in the EBA report. In the 2014 Basel III monitoring exercise, the average LCR for GSIBs was reported by the EBA at 127% (see here).
85
90
95
100
105
110
115
4Q14 1Q15 2Q15 3Q15 4Q15 1Q16 2Q16 3Q16
T1
Exposure measure
Leverage Ratio
127.5% 127.2%
127.4%
60%70%
80%
100%
0%
20%
40%
60%
80%
100%
120%
140%
160%
180%
4Q
14
1Q
15
2Q
15
3Q
15
4Q
15
1Q
16
2Q
16
3Q
16
4Q
16
1Q
17
2Q
17
3Q
17
4Q
17
1Q
18
2Q
18
3Q
18
4Q
18
Weighted average
Timeline LCRimplementation

Box: EU and US leverage ratios: comparing two financial structures
Prudential data report Page 12
Box: EU and US leverage ratios: comparing two financial structures
One of the key elements of the Basel III accord is the implementation of a simple leverage ratio (LR) requirement, calculated as T1 capital relative to bank’s balance sheet size including on- and off-balance sheet exposure (known as “exposure measure”).
The ratio is intended to act as a backstop to risk-based capital requirements. It is also meant to be comparable across banks to isolate for possible differences in RWA risk modelling by banks, or heterogeneous risk weightings due to different business models.
Historically, there have been differences in the leverage ratios reported by GSIBs located in the United States (US) and the EU. Some of these differences relate to reporting standards in which banks report their financial statements. For example, US GSIBs report on the basis of US GAAP standards and EU GSIBs report under the “International Financial Reporting Standards (IFRS) as adopted by the EU”.
The main difference between US GAAP and IFRS for purposes of the calculation of the LR relates to netting and offsetting of assets and liabilities, particularly of derivatives positions, which result in significant differences in banks' total exposure measure.
Some of these differences, however, have been recently harmonised as US and EU GSIBs must report most balance sheet items according to universal regulatory standards. These harmonisations include the treatment of derivatives, Securities Financing Transactions (SFTs) and unsettled trades, while other changes are contemplated in future Basel rules.
Comparable accounting
Thomas Hoening of the U.S. Federal Deposit Insurance Corporation (FDIC) has produced since 2013 a semi-annual “Global Capital Index” publication with all GSIBs’ LRs estimated on the basis of IFRS. The figures facilitate the comparison of the leverage positions between banks across jurisdictions. Chart 1 shows the weighted average LR of EU and US GSIBs based on US GAAP accounting standard (for US banks), the IFRS standard, and the end-
point leverage ratio self-reported by EU GSIBs (also aggregated in our data report). Notably, the difference in LRs between EU banks with IFRS and US banks with US GAAP is substantially large and of about 400 bps. Once using the same accounting standard (IFRS, as estimated by the FDIC), the gap between US and EU leverage ratios narrows to less than 200 bps, although the weighted average LR of US GSIBs continue above that of EU GSIBs. This would indicate that other factors apart from accounting standards should explain the gap in average LR between jurisdictions. The weighted average leverage ratio of EU GSIBs under IFRS is virtually identical to the self-reported by banks, although some differences arise on a bank-by-bank basis.
Chart 1: Leverage ratio: EU (IFRS) and US
GSIBs (US GAAP and estimated as per IFRS)
Source: EU banks’ financial statements and US FDIC
A different market structure
The US and the EU have different financial structures relating to how companies and individuals raise finance. This is particularly the case in the mortgage market and the role of securitisations. In the US, the mortgage agencies like “Fannie Mae” and “Freddie Mac” have a significant role in structuring securitisations of mortgages issued by banks, which in turn helps US banks free-up balance sheet capacity that can be used for other productive purposes. Chart 2 compares the size of the residential mortgage market in the US and the EU, broken down by the amount of home mortgages that are securitised and the amount held on banks’ balance sheets (or not securitised).
0
2
4
6
8
10
4Q
13
1Q
14
2Q
14
3Q
14
4Q
14
1Q
15
2Q
15
3Q
15
4Q
15
1Q
16
2Q
16
US GSIBs (GAAP) EUGSIBs (IFRS)
US GSIBs (as estimated under IFRS) EUGSIBs (Self reported)

Box: EU and US leverage ratios: comparing two financial structures
Prudential data report Page 13
According to AFME and SIFMA data, as of 2015 around 4% of home mortgages issued in Europe were securitised and placed on markets (€ 232 bn placed RMBS securitisations of a total of €6.2 Tn outstanding home loans), compared with 88% that were left on banks’ balance sheets (or €5.4 tn)— in addition to 8% securitised but retained on banks’ balance sheets. In the US, as of 2015, 63% of the outstanding home mortgages were securitised in the market (or €5.7tn, of which €5.1tn were securitised by mortgage agencies) and do not count towards banks’ leverage ratios or exposure measure.
Chart 2: Home mortgages held on banks’
balance sheets and placed securitisations
(2015, EUR bn)
Source: AFME, SIFMA, US FED and ECB.For the US, placed RMBS includes agency
MBS but excludes Agency CMOs as the majority of them are resecuritisations of agency
MBS. It also includes non-agency MBS excluding resecuritizations, credit risk transfers,
and single family rental, in non-agency RMBS figures. See SIFMA for further details of
US data.
The securitisation-based structure of the US mortgage market is mirrored by the differences between EU and US banks in the prevalence of non-securitised mortgages on banks’ balance sheets. For example, on a simple average basis, US large banks dedicate around 5% of their balance sheet capacity to home and commercial non-mortgages, compared with 17% by EU banks. Likewise, 36% of US GSIBs’ loans on the balance sheets are held in the form of mortgages, compared with 17% in the largest EU banks.
Chart 3: Mortgages held on banks’ balance
sheets and leverage ratio (2015)
Source: Financial statements and US FDIC. Total assets using IFRS accounting
More broadly, it is possible to ascertain that there are wider differences in the financial structure of both jurisdictions, beyond the mortgage market.
Chart 4 illustrates this point showing how US non-financial corporates raise finance through markets rather than through banks. This would indicate that in absence of a deeper securitisation market in the EU, most of bank loans are held in EU banks’ balance sheets, adding further pressure onto banks’ exposure measure and leverage ratios.
Chart 4: Debt financing of non-financial
corporates (2015, EUR bn)
Source: ECB and US FED
5,453
3,392
517232 5,720.53
0
1,000
2,000
3,000
4,000
5,000
6,000
7,000
8,000
9,000
10,000
Europe US
Non securitised loans Retained RMBS
Placed RMBS
0%
1%
2%
3%
4%
5%
6%
7%
8%
9%
0% 20% 40% 60%
Le
ve
rag
e r
ati
o (
IFR
S)
% mortgages to total loans
0%
1%
2%
3%
4%
5%
6%
7%
8%
9%
0% 10% 20% 30% 40%
Le
ve
rag
e r
ati
o (
IFR
S)
% mortgages to total assets
5,411
1,356
1,771
5,068
-
1,000
2,000
3,000
4,000
5,000
6,000
7,000
8,000
EU US
Bank Loans Debt securities

Debt securities and contingent convertibles
Prudential data report Page 14
2 Debt securities and contingent convertibles
2.1 EU GSIBs simple average long-term credit rating
Source: Thomson Reuters Eikon with information of Moody’s, Fitch and S&P
2.2 EU GSIBs debt outstanding by seniority
Source: Thomson Reuters Eikon
2.3 Maturity profile of EU 28 Banks’ outstanding
debt securities (EUR bn, maturity in years)
Source: ECB
Credit ratings
In 3Q 2016 there were no major changes to the credit quality assessment of EU GSIBs.
One EU GSIB had its long-term foreign currency credit rating upgraded by one credit rating agency (CRA). The remaining 13 banks had no changes to their ratings.
The rationale for the credit upgrade of one the bank was the “material improvements in the financial strength” as well as expectations of further improvements in capitalisation, despite the “difficult and uncertain economic and regulatory environment”.
In 3Q16, the average EU GSIB long-term credit rating continued at A (or A2 in the Moody’s scale).
Debt securities
It is difficult to ascertain if there has been a recent trend in the debt funding mix of EU GSIBs (Chart 2.2).
Since 1Q15, banks have increased their holdings of covered bonds on their debt funding mix, from 8.8% to 10.6%. The proportion of unsecured bonds has decreased from c40% in 1Q15 to c35% in 3Q16, although sr. unsecured claims have remained at c30% during the same period.
Future changes to the debt structure will be driven by the preparation for the implementation of MREL and TLAC, ahead of the finalisation of the legal text of the provisions.
Maturity profile
The average maturity of outstanding debt securities has increased continuously over the last three years, from 4.3 years on average in 4Q09 to 5.2 years in 3Q1623.
The proportion of short-term debt securities (with maturity below 1Y) relative to outstanding debt securities has decreased from 30% in 2009 to 22% in 3Q16. Likewise, the proportion of long-term securities (maturities of 10Y or above) has increased from 11% of the total debt securities outstanding in 2009 to 15% in 3Q16.
23 This calculation assumes that bonds with maturities above 10 years (including perpetual) have a weighted average maturity of 15 years.
0
3
6
9
12
15
1Q
20
07
2Q
20
07
3Q
20
07
4Q
20
07
1Q
20
08
2Q
20
08
3Q
20
08
4Q
20
08
1Q
20
09
2Q
20
09
3Q
20
09
4Q
20
09
1Q
20
10
2Q
20
10
3Q
20
10
4Q
20
10
1Q
20
11
2Q
20
11
3Q
20
11
4Q
20
11
1Q
20
12
2Q
20
12
3Q
20
12
4Q
20
12
1Q
20
13
2Q
20
13
3Q
20
13
4Q
20
13
1Q
20
14
2Q
20
14
3Q
20
14
4Q
20
14
1Q
20
15
2Q
20
15
3Q
20
15
4Q
20
15
1Q
20
16
2Q
20
16
3Q
20
16
AAA
BBB
AA
A
BB
B
0%
5%
10%
15%
20%
25%
30%
35%
40%
45%
Jr o
r Jr
Su
bU
nse
cure
d
Su
b U
nse
cure
d
Sr
Su
bU
nse
cure
d
Un
sec
Sr
Un
sec
Jr S
ec
or
Jr S
ub
Sec
ure
d
Su
b S
ec
Sec
Sr
Sec
Mo
rtg
ages
(Co
vere
d B
on
ds)
1Q 15
3Q 15
2Q 16
3Q 16
0
200
400
600
800
1,000
Au
g-0
9N
ov
-09
Fe
b-1
0M
ay-1
0A
ug-
10
No
v-1
0F
eb
-11
May
-11
Au
g-1
1N
ov
-11
Fe
b-1
2M
ay-1
2A
ug-
12
No
v-1
2F
eb
-13
May
-13
Au
g-1
3N
ov
-13
Fe
b-1
4M
ay-1
4A
ug-
14
No
v-1
4F
eb
-15
May
-15
Au
g-1
5N
ov
-15
Fe
b-1
6M
ay-1
6A
ug-
16
<1 1-2 2-3 3-4 4-5 5-10 10+
Debt securities and contingent convertibles
Prudential data report Page 15
2.4 CoCos by capital tiering (EUR bn)
Source: Dealogic and Thomson Reuters Eikon
2.5 CoCos by loss absorbing mechanism (quarterly,
EUR bn)
Source: Dealogic and Thomson Reuters Eikon
2.6 CoCos by loss absorbing mechanism (annual,
EUR bn)
Source: Dealogic
2.7 Weighted average coupons of fixed-rate CoCos
Source: AFME with Dealogic data
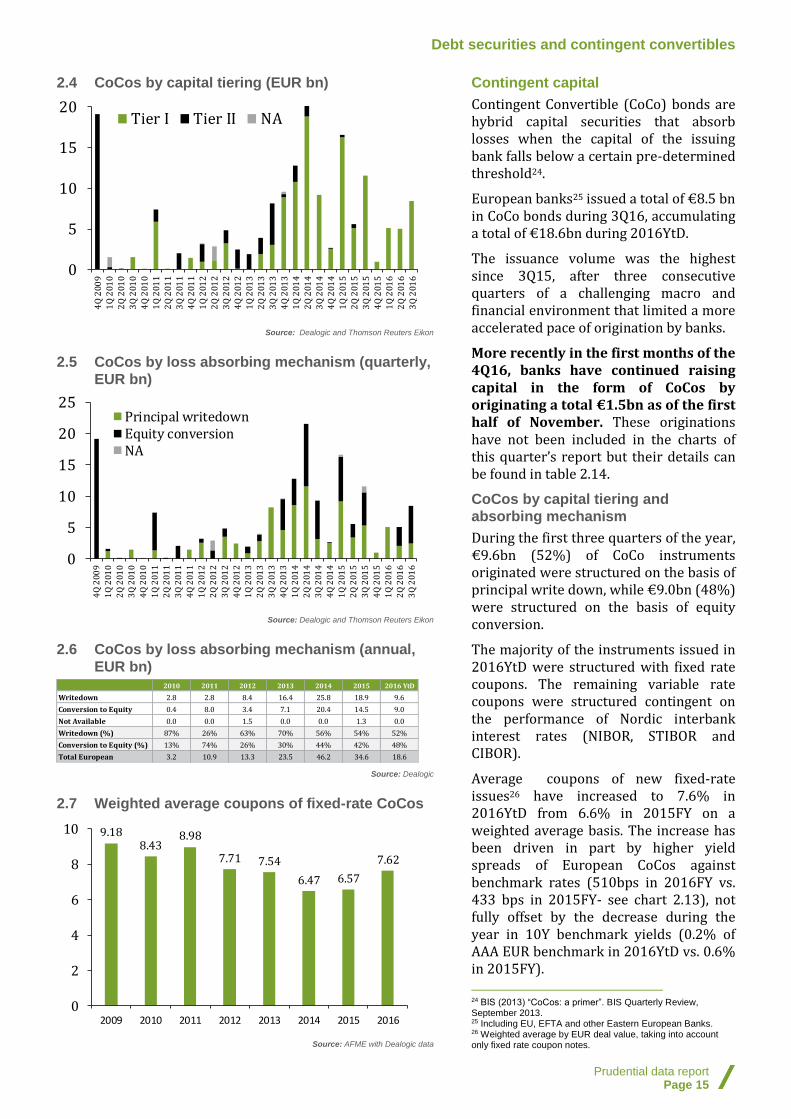
Contingent capital
Contingent Convertible (CoCo) bonds are hybrid capital securities that absorb losses when the capital of the issuing bank falls below a certain pre-determined threshold24.
European banks25 issued a total of €8.5 bn in CoCo bonds during 3Q16, accumulating a total of €18.6bn during 2016YtD.
The issuance volume was the highest since 3Q15, after three consecutive quarters of a challenging macro and financial environment that limited a more accelerated pace of origination by banks.
More recently in the first months of the 4Q16, banks have continued raising capital in the form of CoCos by originating a total €1.5bn as of the first half of November. These originations have not been included in the charts of this quarter’s report but their details can be found in table 2.14.
CoCos by capital tiering and
absorbing mechanism
During the first three quarters of the year, €9.6bn (52%) of CoCo instruments originated were structured on the basis of principal write down, while €9.0bn (48%) were structured on the basis of equity conversion.
The majority of the instruments issued in 2016YtD were structured with fixed rate coupons. The remaining variable rate coupons were structured contingent on the performance of Nordic interbank interest rates (NIBOR, STIBOR and CIBOR).
Average coupons of new fixed-rate issues26 have increased to 7.6% in 2016YtD from 6.6% in 2015FY on a weighted average basis. The increase has been driven in part by higher yield spreads of European CoCos against benchmark rates (510bps in 2016FY vs. 433 bps in 2015FY- see chart 2.13), not fully offset by the decrease during the year in 10Y benchmark yields (0.2% of AAA EUR benchmark in 2016YtD vs. 0.6% in 2015FY).
24 BIS (2013) “CoCos: a primer”. BIS Quarterly Review, September 2013. 25 Including EU, EFTA and other Eastern European Banks. 26 Weighted average by EUR deal value, taking into account only fixed rate coupon notes.
0
5
10
15
204
Q 2
00
9
1Q
20
10
2Q
20
10
3Q
20
10
4Q
20
10
1Q
20
11
2Q
20
11
3Q
20
11
4Q
20
11
1Q
20
12
2Q
20
12
3Q
20
12
4Q
20
12
1Q
20
13
2Q
20
13
3Q
20
13
4Q
20
13
1Q
20
14
2Q
20
14
3Q
20
14
4Q
20
14
1Q
20
15
2Q
20
15
3Q
20
15
4Q
20
15
1Q
20
16
2Q
20
16
3Q
20
16
Tier I Tier II NA
0
5
10
15
20
25
4Q
20
09
1Q
20
10
2Q
20
10
3Q
20
10
4Q
20
10
1Q
20
11
2Q
20
11
3Q
20
11
4Q
20
11
1Q
20
12
2Q
20
12
3Q
20
12
4Q
20
12
1Q
20
13
2Q
20
13
3Q
20
13
4Q
20
13
1Q
20
14
2Q
20
14
3Q
20
14
4Q
20
14
1Q
20
15
2Q
20
15
3Q
20
15
4Q
20
15
1Q
20
16
2Q
20
16
3Q
20
16
Principal writedownEquity conversionNA
2010 2011 2012 2013 2014 2015 2016 YtD
Writedown 2.8 2.8 8.4 16.4 25.8 18.9 9.6
Conversion to Equity 0.4 8.0 3.4 7.1 20.4 14.5 9.0
Not Available 0.0 0.0 1.5 0.0 0.0 1.3 0.0
Writedown (%) 87% 26% 63% 70% 56% 54% 52%
Conversion to Equity (%) 13% 74% 26% 30% 44% 42% 48%
Total European 3.2 10.9 13.3 23.5 46.2 34.6 18.6
9.188.43
8.98
7.71 7.54
6.47 6.57
7.62
0
2
4
6
8
10
2009 2010 2011 2012 2013 2014 2015 2016

Debt securities and contingent convertibles
Prudential data report Page 16
2.8 CoCos by credit rating at date of issuance (EUR
bn) 27
Source: Dealogic
2.9 CoCos by trigger (EUR bn)
Source: Dealogic and Thomson Reuters Eikon. * 5.125% of the bank or 7.0% of the Group
2.10 CoCos by maturity at date of issuance (EUR bn)
Source: Dealogic
27 Total figures may appear not to add up due to rounding.
The increase in CoCo spreads has been mirrored by a decrease in average credit ratings of the new orriginated instruments. The weighted average credit rating (of the rated instruments) stood at BB+ in 2015FY compared with BB in 2016YtD.
CoCos by credit rating
CoCo securities issued during the first three quarters of the year were assessed at issuance date with credit ratings of between A and B+.
€4.6 bn of the equivalent value of issued instruments were rated at an investment grade rating of BBB- or above (25% of the total issuance value), while €14.0 bn were rated BB+ or below (75% of the issuance value). The breakdown is comparable with the credit ratings observed in 2015, when 41% (€14.1 bn) of issued CoCos were rated between AA- and BBB- and 56% (€19.4 bn) at BB+ and below, with 3% (€1.2 bn) unrated or having an unavailable rating.
Average trigger
CoCo instruments contingent on Tier 1 performance are typically structured with triggers of 5.125% and 7%.
During 2016YtD, 12 instruments representing 45% of the YtD issuance value (or €8.4bn) were structured with a 5.125% trigger contingent on Tier 1 performance. Nine instruments representing €10.2bn in volume were structured with a trigger of 7%, also contingent on Tier 1 performance.
Average maturity
All CoCo instruments issued during the year have been structured in the form of perpetual bonds.
This is broadly consistent with the typical maturity of new issues structured in recent years. For example, in 2015 98% of issued CoCos were structured in the form of perpetual bond instruments and 90% in 2014.
2009 2010 2011 2012 2013 2014 2015 2016 YtD
AAA 1.3
AA- 6.1 0.05
A 1.4 0.5 0.04
A- 0.1 1.4 0.1 0.8 0.03
BBB+ 1.0 1.5 3.0 0.8
BBB 0.5 4.9 7.0 7.0 1.9
BBB- 6.1 4.3 0.9 5.8 2.6
BB+ 1.4 2.2 10.2 8.2 5.7
BB 12.7 0.3 6.4 13.6 6.0 4.0
BB- 5.6 3.6 4.7 1.0 1.5
B+ 0.3 2.9 2.9
B 0.9 0.7
B- 0.5
NA/Not rated 0.01 0.5 5.8 2.0 5.8 1.2
Total 19.1 3.2 10.9 13.3 23.5 46.2 34.6 18.6
Investment Grade 0.0 2.9 10.4 6.1 9.3 11.6 14.1 4.6
High Yield 19.1 0.3 0.0 1.4 12.2 28.8 19.4 14.0
0
5
10
15
20
25
30
5.0
%
5.1
25
%
6.0
%
7.0
%
7.1
25
%
8.0
%
5.1
25
%(7
% o
f th
e G
rou
p)
NA
2%
5%
5.1
25
%
7%
8.2
50
% NA
Tier I capital Tier II capital
2012
2013
2014
2015
2016 YtD
0
10
20
30
40
50
0-5 6-10 11-20 21-30 Perpetual
2011
2012
2013
2014
2015
2016 YtD

Debt securities and contingent convertibles
Prudential data report Page 17
2.11 CoCo prices by capital tiering (Jun-14=100)
Source: Barclays
2.12 CoCo prices by risk and location (Jun-14=100)
Source: Barclays
2.13 CoCo option-adjusted spreads (OAS) (%)
Source: Barclays
Valuations
CoCo prices have partially recovered after the market volatility episode of 1Q16 and the market reaction in the immediate aftermath of the UK referendum result.
European CoCo prices at the end of 3Q16 stood 3.7% below the level of the beginning of the year, although 10% above the minimum reached during the market volatlity episode of 1Q16 and 7% above the price reached in the immediate aftermath of the UK referendum result.
By capital tiering, T1 instruments have fallen by 3.6% against the level of the start of the year, while T2 instruments have fallen by 0.4% over the same period.
T2 investors take losses on their instruments only after T1 investors, which explains why the valuations of T1 instruments are hardest hit during times of stress.
Option-adjusted spreads (OAS)
In tandem with the recent increase in CoCo prices, OAS against benchmark risk-free rates fell as of 3Q16 by an average of 161 bps against the highest level reached during 1Q16 and 72 bps compared with the level reached after the UK referendum result.
T1 instruments at the end of 3Q16 were 84 bps above the OAS of the start of the year, compared with a maximum difference of 261 bps reached during 1Q16.
80
85
90
95
100
105Ju
n-1
4Ju
l-1
4A
ug-
14
Sep
-14
Oct
-14
No
v-1
4D
ec-1
4Ja
n-1
5F
eb
-15
Mar
-15
Ap
r-1
5M
ay-1
5Ju
n-1
5Ju
l-1
5A
ug-
15
Sep
-15
Oct
-15
No
v-1
5D
ec-1
5Ja
n-1
6F
eb
-16
Mar
-16
Ap
r-1
6M
ay-1
6Ju
n-1
6Ju
l-1
6A
ug-
16
Sep
-16
Oct
-16
European Banks CoCo
European Banks Tier 1
European Banks Tier 2
75
80
85
90
95
100
105
Jun
-14
Jul-
14
Au
g-1
4S
ep-1
4O
ct-1
4N
ov
-14
Dec
-14
Jan
-15
Fe
b-1
5M
ar-1
5A
pr-
15
May
-15
Jun
-15
Jul-
15
Au
g-1
5S
ep-1
5O
ct-1
5N
ov
-15
Dec
-15
Jan
-16
Fe
b-1
6M
ar-1
6A
pr-
16
May
-16
Jun
-16
Jul-
16
Au
g-1
6S
ep-1
6O
ct-1
6
Global CoCo banking
European Banks CoCo
Global CoCo IG
Global CoCo HY
0
1
2
3
4
5
6
7
8
9
Jun
-14
Jul-
14
Aug
-14
Sep
-14
Oct
-14
No
v-1
4
Dec
-14
Jan
-15
Feb
-15
Mar
-15
Ap
r-1
5
May
-15
Jun
-15
Jul-
15
Aug
-15
Sep
-15
Oct
-15
No
v-1
5
De
c-1
5
Jan
-16
Feb
-16
Mar
-16
Ap
r-1
6
May
-16
Jun
-16
Jul-
16
Aug
-16
Sep
-16
Oct
-16
Global CoCo banking European Banks CoCo
Global CoCo IG European Banks Tier 1
Global CoCo HY European Banks Tier 2
Debt securities and contingent convertibles
Prudential data report Page 18
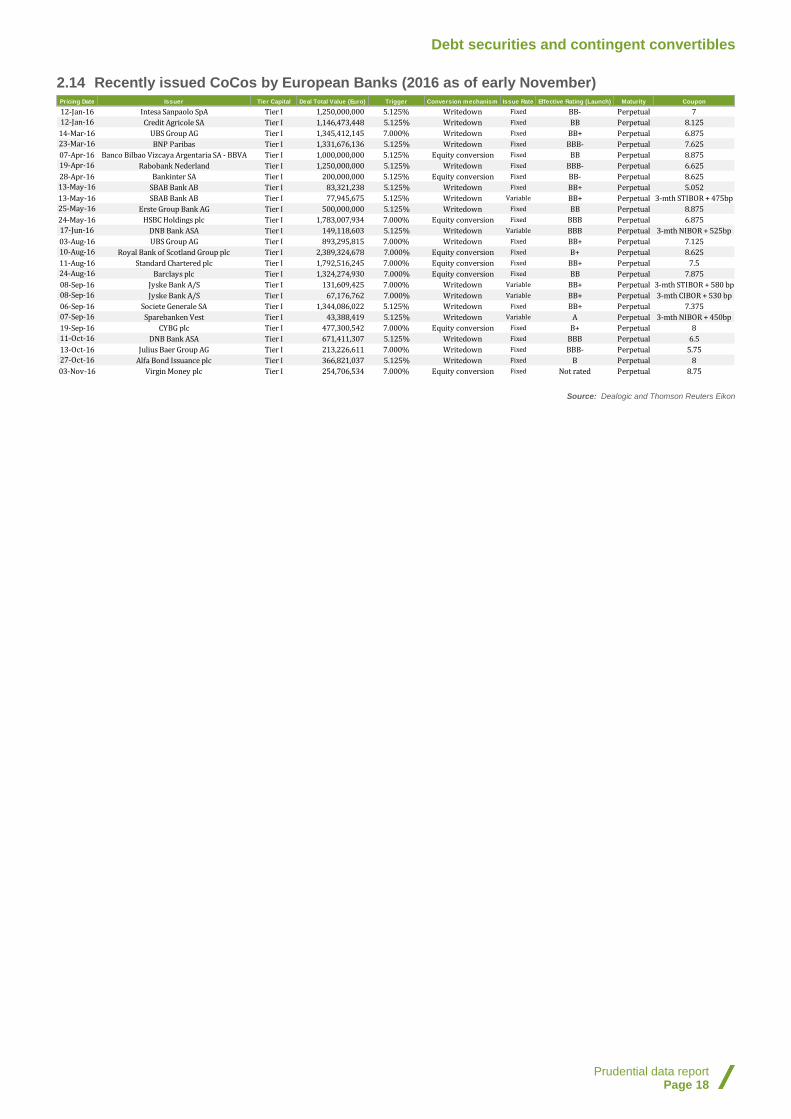
2.14 Recently issued CoCos by European Banks (2016 as of early November)
Source: Dealogic and Thomson Reuters Eikon
Pricing Date Issuer Tier Capital Deal Total Value (Euro) Trigger Conversion mechanism Issue Rate Effective Rating (Launch) Maturity Coupon
12-Jan-16 Intesa Sanpaolo SpA Tier I 1,250,000,000 5.125% Writedown Fixed BB- Perpetual 7
12-Jan-16 Credit Agricole SA Tier I 1,146,473,448 5.125% Writedown Fixed BB Perpetual 8.125
14-Mar-16 UBS Group AG Tier I 1,345,412,145 7.000% Writedown Fixed BB+ Perpetual 6.875
23-Mar-16 BNP Paribas Tier I 1,331,676,136 5.125% Writedown Fixed BBB- Perpetual 7.625
07-Apr-16 Banco Bilbao Vizcaya Argentaria SA - BBVA Tier I 1,000,000,000 5.125% Equity conversion Fixed BB Perpetual 8.875
19-Apr-16 Rabobank Nederland Tier I 1,250,000,000 5.125% Writedown Fixed BBB- Perpetual 6.625
28-Apr-16 Bankinter SA Tier I 200,000,000 5.125% Equity conversion Fixed BB- Perpetual 8.625
13-May-16 SBAB Bank AB Tier I 83,321,238 5.125% Writedown Fixed BB+ Perpetual 5.052
13-May-16 SBAB Bank AB Tier I 77,945,675 5.125% Writedown Variable BB+ Perpetual 3-mth STIBOR + 475bp
25-May-16 Erste Group Bank AG Tier I 500,000,000 5.125% Writedown Fixed BB Perpetual 8.875
24-May-16 HSBC Holdings plc Tier I 1,783,007,934 7.000% Equity conversion Fixed BBB Perpetual 6.875
17-Jun-16 DNB Bank ASA Tier I 149,118,603 5.125% Writedown Variable BBB Perpetual 3-mth NIBOR + 525bp
03-Aug-16 UBS Group AG Tier I 893,295,815 7.000% Writedown Fixed BB+ Perpetual 7.125
10-Aug-16 Royal Bank of Scotland Group plc Tier I 2,389,324,678 7.000% Equity conversion Fixed B+ Perpetual 8.625
11-Aug-16 Standard Chartered plc Tier I 1,792,516,245 7.000% Equity conversion Fixed BB+ Perpetual 7.5
24-Aug-16 Barclays plc Tier I 1,324,274,930 7.000% Equity conversion Fixed BB Perpetual 7.875
08-Sep-16 Jyske Bank A/S Tier I 131,609,425 7.000% Writedown Variable BB+ Perpetual 3-mth STIBOR + 580 bp
08-Sep-16 Jyske Bank A/S Tier I 67,176,762 7.000% Writedown Variable BB+ Perpetual 3-mth CIBOR + 530 bp
06-Sep-16 Societe Generale SA Tier I 1,344,086,022 5.125% Writedown Fixed BB+ Perpetual 7.375
07-Sep-16 Sparebanken Vest Tier I 43,388,419 5.125% Writedown Variable A Perpetual 3-mth NIBOR + 450bp
19-Sep-16 CYBG plc Tier I 477,300,542 7.000% Equity conversion Fixed B+ Perpetual 8
11-Oct-16 DNB Bank ASA Tier I 671,411,307 5.125% Writedown Fixed BBB Perpetual 6.5
13-Oct-16 Julius Baer Group AG Tier I 213,226,611 7.000% Writedown Fixed BBB- Perpetual 5.75
27-Oct-16 Alfa Bond Issuance plc Tier I 366,821,037 5.125% Writedown Fixed B Perpetual 8
03-Nov-16 Virgin Money plc Tier I 254,706,534 7.000% Equity conversion Fixed Not rated Perpetual 8.75

Summary of the methodologies adopted in this report
Prudential data report Page 19
Summary of the methodologies adopted in this report
1. Balance Sheets – Overview
In 2013 the European Union adopted the CRDIV legislation, implementing the Basel III accord in the EU. The CRDIV includes a number of transitional measures, which facilitate financial markets and the real economy in adjusting smoothly to the new regulatory landscape. The charts in the first part of the report illustrate the capital and leverage ratios under the phased-in (transitional) and the end-point (fully loaded) approaches, as reported by the EU GSIBs.
During the transition period (2014-2019), certain deductions are applied to the calculation of CET1 capital, Tier 1 capital and Tier 2 capital. For CET1 capital, the regulatory deductions vary by year from 20% in 2014 to 100% from 2018 onwards, with increases of 20% per year. These deductions are related to the treatment of deferred taxes, securitisation, and unrealised losses, among others.
In addition to the abovementioned deductions, the CRDIV also establishes a timetable for the compliance with minimum capital requirements and buffers. The ratio of minimum regulatory capital to risk-weighted assets (RWA) is illustrated in the chart below.
Minimum Capital Requirements & Buffers Implementation
Timetable (% of RWAs)
Source: : AFME
The GSIB buffer ranges from 1% to 2.5% for GSIBs. The GSIB buffer varies by bank depending on the bucket where the firm is allocated to as per the FSB’s/BIS methodology, which takes into account features such as size; interconnectedness;
complexity; financial infrastructure; and cross-jurisdictional activity of the institution. The required countercyclical buffer ranges from 0%-2.5% depending on the assessment of each NCA.
1.1. – 1.5, 1.9 and 1.11. Capital Ratios
The Capital Ratios charts illustrate the implementation of the CRDIV requirements by the 14 EU GSIBs as designated by the FSB in 2014. Such banks are: HSBC; Barclays; BNP Paribas; Deutsche Bank; Royal Bank of Scotland; BBVA; Groupe BPCE; Group Crédit Agricole; ING Bank; Nordea; Santander; Société Générale; Standard Chartered; and UniCredit Group.
The number of reporting banks for each chart varies depending on the availability of information. The table below illustrates the number of banks that are included in each of the charts in Section 1. All figures were compiled on a best efforts basis.
1.1
1.2, 1.3,
1.4, 1.10
1.5,
1.7,
1.8 1.9 1.11
1.12,
1.13 1.14 1.15
1.16*
4Q13 14 14 14 7 9
10
1Q14 14 14 12 11 8 7 14 10
2Q14 14 14 13 12 9 11 14 11
3Q14 14 14 12 10 8 9 14 11
4Q14 14 14 14 13 14 14 14 14 6 (7)
1Q15 14 14 13 11 14 11 14 14 3
2Q15 14 14 14 13 14 12 14 14 3 (9)
3Q15 14 14 14 12 14 10 14 14 3
4Q15 14 14 14 12 14 14 14 14 8
1Q16 14 14 14 11 14 11 14 14 6
2Q16 14 14 14 13 14 14 14 14 7
3Q16 14 14 14 14 14 11 13 14 6
*The weighted averages for 4Q14 and 2Q15 are sourced from EBA’s monitoring
exercise reports which is based in the number of banks in parenthesis.
The CET1 Capital ratio is the share of Core Tier 1 (CET1) capital as percentage of Risk Weighted Assets (RWAs); Tier 1 Ratio is the share of Tier 1 capital as percentage of RWAs. Each ratio is shown on a phased-in (transitional) and fully loaded (end-point) approach as per the CRDIV legislation and as reported by the EU GSIBs.
The capital ratios data are sourced from EU GSIBs balance sheets and publicly available information disclosed in periodic financial reports and prudential data reports published by the above mentioned banks (i.e. interim earnings reports, annual reports, results presentations, Pillar III disclosure reports or financial data disclosed as part of interim earnings results). When not
Phase-in of regulatory deductions (% of deductions to be applied)
20% 40% 60% 80% 100%
Phase-out of non-compliant non-common Tier 1 and Tier 2 capital (up to 100% in 2022) issued before 12-Sep-2010(% of ineligible)
10% 20% 30% 40% 50% 60% 70%
Phase-out of non-compliant public sector capital injections (% of ineligible)
0% 0% 100% 100%
2.0% 2.0%3.5% 4.0% 4.5% 4.5% 4.5% 4.5% 4.5%
0.6%1.3% 1.9% 2.5%
0-0.6%
0-1.3%0-1.9%
0-2.5%
0-0.6%
0-1.3%
0-1.9%
0-2.5%
2.0% 2.0%
1.0%1.5%
1.5%
1.5%
1.5%
1.5%
1.5%
4.0% 4.0% 3.5%2.5% 2.0%
2.0%
2.0%
2.0%
2.0%
Basel II 2012 2013 2014 2015 2016 2017 2018 2019
CET1 Capital Capital Conservation Buffer
Countercyclical Capital Buffer G-SIBs Buffer
AT1 Capital Tier 2 Capital
Common Equity Tier 1 Capital
8% 8% 8% 8% 8%
9.9%
11.8%
13.6%
15.5%

Summary of the methodologies adopted in this report
Prudential data report Page 20
available in the EU GSIBs’ financial results and publicly available information, 4Q14 CET1 and RWAs were sourced from the EBA’s 2013 stress tests for the transitional approach.
For charts 1.3 and 1.4, for purposes of aggregation in EUR currency, the balance sheets items reported in USD and GBP were converted to EUR terms using the end-of-quarter exchange rate as certified by the ECB. The specific exchange rates are the following:
EUR/USD EUR/GBP
4Q13 1.3791 0.8337
1Q14 1.3788 0.8282
2Q14 1.3658 0.8015
3Q14 1.2583 0.7773
4Q14 1.2141 0.7789
1Q15 1.0759 0.7273
2Q15 1.1189 0.7114
3Q15 1.1203 0.7385
4Q15 1.0887 0.73395
1Q16 1.1385 0.79155
2Q16 1.1102 0.8265
3Q16 1.1161 0.86103 Source: ECB
1.6. Change in CET1 by components
Chart 1.6 illustrates the contribution of RWAs, profits and other factors to the quarterly change of CET1 ratio on an end point approach. The figures are aggregated by banks on a weighted average basis. The individual contributions are sourced from banks’ presentations of the quarterly financial results and quarterly financial statements, when available in the granularity presented. When the figure is not available at the same level of granularity, a linear decomposition is performed: the quarterly percentage change of the CET1 ratio is approximated as the quarterly percentage change in CET1 capital, minus the quarterly percentage change in RWAs.
Accordingly, the contribution of RWAs to the change is calculated as the percentage change of RWAs multiplied by the CET1 ratio in the past quarter. The contribution of profits is calculated as the quarterly profits, divided by the amount of RWAs in the past quarter. The remaining “FX and other” factor is calculated as residual.
1.7. – 1.8. Difference between CET1 ratios and
2019 ratios on an end-point basis
Chart 1.7 illustrates the difference between the individual EU GSIBs CET1 ratios on an end-point basis, and the regulatory ratio due to apply from
2019 assuming that banks are to comply with the GSIB buffer they are currently assigned (between 1% and 2.5%). The additional countercyclical buffer is represented with a horizontal line at 2.5%, to illustrate the maximum buffer that EU GSIBs would have to comply with, should all NCAs implement the maximum buffer at 2.5%. The countercyclical buffer is yet to be implemented by the European NCAs.
Chart 1.8 illustrates the difference between EU GSIBs weighted-average CET1 ratio on an end-point basis, and a stressed maximum regulatory ratio that banks would have to comply with assuming that NCAs implement the maximum countercyclical buffer at 2.5%. That is, a requirement of 4.5% (Minimum CET1 ratio) + 2.5% (Capital conservation buffer) + 1%-2.5% (according to the bucket where the GSIB is currently located) + 0%-2.5% (countercyclical buffer). To estimate the weighted-average CET1 ratio, individual RWAs were used.
One of the 14 EU GSIBs reports its financial results on a semi-annual basis. Chart 1.8 uses the latest CET1 ratio reported for this bank.
1.10. Cumulative change of T1, RWA and T1
ratio
This chart illustrates the cumulative percentage change of each of the components of the Tier 1 ratio on a phased-in basis. As with previous charts, T1 and RWAs are sourced from EU GSIBs’ financial reports and publicly available material (see reference to charts 1.1-1.4).
Data is aggregated for banks where information is available. In contrast to chart 1.8, the ratio and its subsequent cumulative percentage change, is calculated as total T1 capital as proportion of total RWAs (and not simple average of ratios).
1.12. – 1.13. Risk-Weighted Assets (RWAs)
The breakdown of RWAs by risk is sourced from financial reports published by the EU GSIBs as referenced in 1.1-1.4
Chart 1.12 illustrates the breakdown by risk component for each EU GSIB as of 1Q16 or the latest publicly available breakdown.
The credit risk category represents other risks different from market and operational risk as disclosed by the EU GSIBs.
The figures are in EUR terms which are converted from the currencies used by banks to report their financial results, using the ECB’s official FX rate for the corresponding end of period.

Summary of the methodologies adopted in this report
Prudential data report Page 21
1.14. RWA densities
The densities are calculated as the ratio of RWAs to total assets by bank. The amounts of RWAs are phased-in values as reported by banks and are consistent with the figures reported in chart 1.4.
Total assets are sourced from Thomson Reuters EIKON and Banks’ financial statements when not available in Reuters.
1.15. Leverage Ratios (fully loaded)
The leverage ratio represents the share of Tier 1 capital as a percentage of eligible assets under the fully loaded approach.
The leverage ratios are sourced from financial reports published by the EU GSIBs referenced in 1.1-1.5 (i.e. interim earnings reports, annual reports, results presentations, Pillar III disclosure reports, or other financial data disclosed as part of earnings results).
All figures were compiled on a best efforts basis.
1.16. Leverage ratio by components
This chart illustrates the cumulative percentage change of each of the components of the Leverage ratio. As with previous charts, T1 and the exposure measure are sourced from EU GSIBs’ financial reports and publicly available material (see reference to charts 1.1-1.4).
1.17. Liquidity Coverage Ratio (LCR)
The LCR represents the share of High Quality Liquid Assets (HQLA) relative to total net cash outflows over a 30 day time period.
LCRs are sourced from financial reports published by the EU GSIBs (i.e. interim earnings reports, annual reports, results presentations, Pillar III disclosure reports, and other financial data disclosed by banks).
Some banks disclosed in their reports that their LCR ratios were above a certain level without disclosing the actual ratio (e.g. “above 100%” or “above 110%”). This information was not added in the graph.
All figures were compiled on a best efforts basis.
2. Debt securities and Contingent
Convertibles
2.1. Average EU GSIBs credit rating
This chart presents the simple average of the EU GSIBs long-term foreign credit ratings. The rating of each bank is estimated as the simple average of the individual long-term foreign credit ratings assigned by Moody’s, Fitch and S&P. To calculate
the average by bank, a value between 0 and 17 is assigned to each rating, where 0 represents DDD (or C in Moody’s scale and D in S&P scale) and 17 is equivalent to AAA (or Aaa in Moody’s scale). When a Credit Rating Agency (CRA) has not rated the long-term foreign performance of an EU GSIB, the average is calculated with the available credit ratings.
The information is sourced from Thomson Reuters EIKON.
2.2. Debt outstanding by seniority
The data is sourced from Thomson Reuters EIKON. The data corresponds to debt issued by the 14 EU GSIBs, which does not take account of holdings by subsidiaries/branches within the same group.
The “Mortgages” category includes mortgage covered bonds.
2.3. EU 28 bank’s debt outstanding by
maturity
The data is sourced from the ECB and Dealogic DCM. The figures correspond to the outstanding amounts of debt securities other than shares issued by European Union (EU28) banks at the end of reference period broken down by maturity in years.
All securities issued in all currencies are included and converted into EUR terms by the ECB.
2.4. CoCos by capital tiering
CoCo securities included are those issued by banks whose parent company is located in Europe. It does not include securities issued in Europe by banks whose parent company is non-European. Europe is defined as per Dealogic’s classification, which includes European Union nations, Eastern European countries (e.g. Russia, Azerbaijan, and Kazakhstan), EFTA countries, old Soviet Union countries, and Turkey.
All securities issued in all currencies are included and converted into EUR terms by Dealogic.
The capital tiering is sourced from Dealogic DCM for each of the securities covered.
2.5- 2.6. CoCos issued by absorbing
mechanism
CoCo securities included are those issued by banks whose parent company is located in Europe as defined by Dealogic, which encompasses European Union member states, Eastern European countries (e.g. Russia, Azerbaijan, and Kazakhstan), EFTA countries, old Soviet Union countries, and Turkey.

Summary of the methodologies adopted in this report
Prudential data report Page 22
The absorbing mechanism is sourced from Thomson Reuters EIKON for each of the securities covered.
2.7 Coupons of fixed-rate CoCos
Weighted average coupons of fixed-rate CoCo originations weighted by size of issuance in EUR. Weighted average at date of issuance.
2.8 CoCos issued by credit rating
CoCo securities included are those issued by banks whose parent company is located in Europe as defined by Dealogic.
The credit rating is based on the classification by Dealogic of “Effective rating at launch”. This rating is calculated as an average of available ratings from S&P, Moody's and Fitch at the time of issuance. If an issue is rated by just one CRA, such rating is displayed.
The category “High Yield” aggregates issuance volumes of instruments rated at date of launch at BB+ or below. Investment Grade instruments relate to issues rated at BBB- or above at date of launch.
2.9. CoCos issued by maturity
CoCo securities included are those issued by banks whose parent company is located in Europe as defined by Dealogic. All securities issued in all currencies are included and converted into EUR terms by Dealogic.
Maturity is classified on the basis of the number of years from settlement date to legal maturity date. Perpetual bonds are classified under their own category.
2.10. CoCos issued by trigger
The chart aggregates the value of CoCo instruments issued by European banks (in EUR billions), classified by the underlying trigger and the capital tiering in which the instruments are contingent on (T1 or T2 capital performance).
The data are sourced from Dealogic.
2.11. - 2.13 CoCo prices and option-adjusted
spreads (OAS)
The indices in 2.10 and 2.12 are compiled by Barclays according to the capital tiering, location (Global vs. European) and risk of the security (High Yield vs. Investment Grade). The indices in 2.10-2.11 are unhedged and in nominal USD terms.

Prudential data report Page 23
Annex
Disclaimer
Your receipt of this document is subject to paragraphs 3, 4, 5, 9, 10, 11 and 13 of the Terms of Use which are applicable to AFME’s website (available at http://www.afme.eu/Legal/Terms-of-Use.aspx) and, for the purposes of such Terms of Use, this document shall be considered a “Material” (regardless of whether you have received or accessed it via AFME’s website or otherwise).

Prudential data report Page 24
London Office
39th Floor 25 Canada Square London E14 5LQ United Kingdom
Brussels Office
Rue de la Loi, 82 1040 Brussels Belgium
AFME
Julio Suarez - Manager, Research Michael Lever - Managing Director, Prudential Sahir Akbar - Director, Prudential
Switchboard: +44 (0)20 3828 2700
Switchboard: +32 (0) 2 788 3971
www.afme.eu
AFME is registered on the EU Transparency Register, registration number 65110063986-76