ps 188% higher
TRANSCRIPT

TEST REPORT FEBRUARY 2006
ESRP performance comparison:
Solid-state drives vs. hard disk drives
TEST REPORT JANUARY 2009
KEY FINDINGS
Three SSDs delivered up to 188 percent higher IOPS performance and as much as 172 percent higher megabytes per second throughput in our Exchange tests than a full 24-disk enclosure of HDDs. (See Figures 1 and 2.)
The SSD enclosure and drives used nearly 60 percent less power when active and approximately 59 percent less power when idle than the HDD enclosure and drives. (See Figures 3 and 4.)
The SSD enclosure and drives delivered up to 623 percent more performance per watt than the HDD enclosure and drives. (See Figure 5.)
Executive summary Intel Corporation (Intel) commissioned Principled Technologies (PT) to compare the performance and power usage for Microsoft Exchange 2007 storage of two types of disk drives:
Intel X25-E Extreme SATA solid-state drives (SSDs)
standard 15K RPM SAS hard disk drives (HDDs) We used the Primary Storage performance tests in the Microsoft Exchange Solution Reviewed Program (ESRP) test framework. These tests employ the Microsoft Exchange Server Jetstress tool and report the transactional input/output (I/O) load each storage solution delivers while maintaining satisfactory responsiveness. Results include I/O per second (IOPS) and megabytes per second throughput. We also measured power consumption during the test and while the systems were idle. We tested a shelf of 3 Intel X25-E Extreme SATA 32GB SSDs and 24 Seagate Savvio 15K SAS 73GB HDDs. In both cases, we used a Newisys NDS-2240 enclosure. We tested with the same size database on the two types of disk drives. We constrained usable space, normally 1,752 GB, to 96 GB (5.5 percent of usable storage) on the HDDs so that they had the same usable space as the 32GB SSDs. We tested with 200 mailboxes averaging 250 MB each, the same number and size that we tested with on the SSDs. Three Intel X25-E Extreme SATA 32GB SSDs delivered up to 188 percent higher IOPS performance and as much as 172 percent higher throughput than 24 Seagate Savvio 15K SAS 73GB HDDs while delivering
satisfactory responsiveness. The SSDs also consumed nearly 60 percent less power when active, consumed approximately 59 percent less power when idle, and delivered as much as 623 percent more performance per watt. (We measured power at the enclosure, so measurements include power usage of both the enclosure and the drives.) Figure 1 shows the IOPS results for the 24 HDDs and the 3 SSDs. These results are the sum of the Jetstress performance results for database reads and writes and log writes. We report the median of three test results.
The 3 Intel X25-E Extreme SATA 32GB SSDs delivered up to 188 percent more IOPS than the 24
188% higher3,994
11,497
0
2,000
4,000
6,000
8,000
10,000
12,000
14,000
24 Seagate Savvio 15KSAS HDDs
3 Intel X25-E ExtremeSATA SSDs
IOP
S
Jetstress resultsHigher results are better
Figure 1: Jetstress performance results in IOPS for the two storage configurations. A higher number of IOPS is better.

2
Principled Technologies, Inc.: ESRP performance comparison: Solid-state drives vs. hard disk drives
Seagate Savvio 15K SAS 73GB HDDs: 11,497 IOPS for the SSDs vs. 3,994 IOPS for the HDDs. Therefore, each SSD delivered on average approximately the same IOPS as all 24 HDDs combined.
Figure 2 shows the throughput (in megabytes per second) for the two storage solutions. Three SSDs delivered approximately 172 percent higher throughput than 24 HDDs: 100.8 MB of disk transfers per second for the SSDs vs. 37.1 MB of disk transfers per second for the HDDs. Therefore, each SSD delivered on average approximately 10 percent lower throughput than all 24 HDDs combined.
We used power analyzers to log power consumption (in watts) at 1-second intervals during the tests.
Figure 3 shows the active power consumption of the storage arrays during the median run for each storage configuration. This is the same run whose results we show in Figures 1 and 2. The active power measurements include the power usage of both the enclosure and the drives. We measured the power consumption of the empty enclosure while idle, and then subtracted that power measurement from the active power measurement. We attribute the remaining power, 7.8 watts for the SSDs and 183.8 watts for the HDDs, to the drives. We also logged power consumption (in watts) for 2 minutes while the server and storage arrays were idle, or near
idle, at the beginning of the test. Figure 4 presents those results. Three SSDs, including the enclosure, consumed nearly 59 percent less power than 24 HDDs while idle: 112 watts for the SSDs vs. 276 watts for the HDDs. The three SSDs draw low power when both active and idle, averaging 116 watts when active and 112 watts when idle. The 24 HDD drives draw an average of 276 watts when idle and 292 when active.
Figure 2: Average throughput in MB per second for the two storage configurations. Higher throughput is better.
Enclosure: 108.2
Enclosure: 108.2
Drives: 183.8
Drives: 7.8
Total active power: 292.0
Total active power: 116.0
0
50
100
150
200
250
300
350
24 Seagate Savvio 15KSAS HDDs
3 Intel X25-E ExtremeSATA SSDs
Watt
s
Active power in wattsLower power consumption is better
SSDs consumed nearly 96% less power for drives alone and
approximately60% less power for both enclosure
and drives.
Figure 3: Active power consumption in watts for the two storage configurations. Lower active power consumption is better.
172% higher37.1
100.8
0
25
50
75
100
125
24 Seagate Savvio 15KSAS HDDs
3 Intel X25-E ExtremeSATA SSDs
Meg
ab
yte
s p
er
seco
nd
Throughput Higher results are better

3
Principled Technologies, Inc.: ESRP performance comparison: Solid-state drives vs. hard disk drives
Figure 5 shows the performance per watt for the two configurations, which we calculated by dividing performance in IOPS (Figure 1) by average watts of active power consumption for the array. Three SSDs delivered up to 623 percent greater performance per watt than 24 HDDs while active: 99.1 IOPS per watt for the SSDs vs. 13.7 IOPS per watt for the HDDs. Higher performance per watt is better. The Test results section provides more details.
Figure 4: Idle power consumption in watts for the two storage configurations. Lower power consumption is better.
We also measured processor utilization during the peak testing time, the period of steady activity and maximum I/O. The three SSDs drove the processors up to 235.0 percent more than the 24 HDDs; 6.7 percent for the SSDs and 2.0 percent for the HDDs.
Enclosure: 108.2
Enclosure: 108.2
Drives: 167.8
Drives: 3.8
Total idle power: 276.0
Total idle power: 112.0
0
50
100
150
200
250
300
350
24 Seagate Savvio 15KSAS HDDs
3 Intel X25-E ExtremeSATA SSDs
Watt
s
Idle power inwattsLower power consumption is better
SSDs consumed nearly 98%less power for drives alone and approximately 59% less power for both enclosure and drives.
623% higher13.7
99.1
0
25
50
75
100
125
24 Seagate Savvio 15KSAS HDDs
3 Intel X25-E ExtremeSATA SSDs
IOP
S p
er
watt
Performance per watt Higher numbers are better
Figure 5: Performance per watt results. Higher performance per watt is better.

4
Principled Technologies, Inc.: ESRP performance comparison: Solid-state drives vs. hard disk drives
Workload Jetstress 2007 (Jetstress) is a tool that Microsoft developed to help administrators verify the performance and stability of the disk subsystem, the subsystem that Exchange most stresses, before putting their Exchange server in a production environment. Jetstress simulates the Exchange database and log file loads that a specific number of users produce, thus allowing administrators to verify the performance and stability of their disk subsystem before putting their server into a production environment. Jetstress tests both responsiveness and throughput, giving a Pass/Fail rating for responsiveness and reporting throughput in IOPS. Jetstress uses read and write latency as its primary measure of responsiveness. Results also report these latency values.
Jetstress includes reliability tests that test the reliability of the storage array over a 24-hour period, primary storage performance, and streaming backup/recovery performance. We ran the primary storage performance tests only. The primary storage performance testing identifies the maximum sustainable Exchange I/O which the storage system can handle over a 2hour period while providing acceptable responsiveness.
Microsoft uses the Jetstress tests in the Exchange Solution Reviewed Program (ESRP) – Storage v2.1 program. ESRP is a Microsoft Exchange Server program Microsoft designed to facilitate third-party storage testing and solution publishing for Exchange Server. The program combines Jetstress results with solution publishing guidelines. Microsoft Gold Certified or Certified Storage Partners (storage original equipment manufacturers [OEMs] who are part of the Microsoft Certified Partner Program) can use the ESRP framework to test their storage solutions that they target for Microsoft Exchange deployment. For more information on ESRP, see http://technet.microsoft.com/en-us/exchange/bb412164.aspx
The Jetstress primary storage performance tests exercise the storage systems using maximum sustainable I/O similar to what an Exchange server might have to deliver. The tests run for 2 hours and produce results that show how long it takes for the storage to respond to I/O requests while it is under load. Jetstress parameters define aspects of the Simulated Exchange configuration and the number of threads:
Targeted IOPS per user. We based our testing profile for this report on the Microsoft profile for very heavy Exchange 2007 cached mode users. These users average 30 sent and 120 received messages per day. This load averages 0.5 database IOPS for each user (0.42, which is typical of a very heavy user profile, plus 20 percent headroom). We used this average as our targeted IOPS per user.
Average mailbox size. We assumed an average mailbox size of 250 MB, a relatively small size but one that would maximize the number of mailboxes against which to measure IOPS. We configured each array as RAID 0 and created a log and database partition.
Number of mailboxes. We calculated the mailbox count for each storage solution by determining the number of 250MB mailboxes that would use 60 percent of the drive space we formatted; we selected this capacity to provide a production-sized database that left room for log files and growth. We then rounded down the mailbox count to the nearest multiple of 50.
Number of storage groups. One storage group was adequate for the 200 mailboxes in our test.
Thread count. We repeated the test with different thread counts, with the goal of finding the maximum IOPS each platform could deliver while providing an acceptable user experience.
Values for all of these settings except thread count were the same for both the SSDs and HDDs because we constrained usable space for the HDDs to 96 GB, 5 percent of their normal usable space of 1,752 GB, so that they used the same space as the SSDs. Jetstress performance tests fail tests when they exceed latency limits that indicate the lowest acceptable user experience. We first ran the Jetstress disk subsystem test with automatic tuning to identify a thread count and then ran the initial performance test using that thread count. If the system passed the initial performance test run, we continued to retest using higher thread counts to push IOPS to its maximum, stopping when Jetstress reported a failing rating. If the first run failed, we retested using lower thread counts until Jetstress reported a passing rating. If the test failed using just a single thread, we reduced the number of mailboxes until Jetstress gave a passing rating.

5
Principled Technologies, Inc.: ESRP performance comparison: Solid-state drives vs. hard disk drives
We repeated the test two more times using the thread count from the run that gave the highest IOPS score and a passing rating. We report the median IOPS result from those three runs.
Simulated Exchange configuration Figure 6 summarizes our Simulated Exchange configuration.
Item Value
Number of Exchange mailboxes we simulated using Jetstress 200
Number of hosts 1
Mailbox size (MB) 250
Number of storage groups 1
Number of mailbox stores/storage group 1
Number of threads 73 for HDDs 17 for SSDs
Number of mailboxes/mailbox store 200
Simulated profile: IOPS per mailbox 0.5
Mode Cached
Initial total database size for performance testing (GB) 49
Figure 6: Simulated Exchange configuration.
Simplifications Additional factors affect mailbox server configuration for Exchange 2007. These include Exchange 2007 features such as Local Continuous Replication (LCR) and Clustered Continuous Replication (CCR), Virus Scanning or other applications, third-party mobile devices (such as Blackberry), server roles, Microsoft Outlook client version, Online vs. Cached Exchange Mode, as well as the percentage of the total number of users who are connected concurrently and using the server at a time. Administrators need to take into account these and other factors about their user population and needs when configuring an Exchange solution; however, because our goal was to find maximum IOPS rather than to size a solution, we made the following assumptions about our users and their needs:
Our configurations did not include replication or clustering such as LCR or CCR, which add additional processing and storage overhead to a solution.
We considered only the Microsoft Exchange load and did not include virus scanning or other applications whose presence would increase processor utilization, consume drive space, and decrease throughput and responsiveness.
We assumed Cached Exchange mode access only, not Online mode. With cached mode, much of the processing occurs on the client. Moving it to the server for Online mode affects server sizing calculations.
Test results Figure 7 shows IOPS, throughput, and power results for the two test configurations. Results are from the run that produced the median IOPS result. This IOPS result is the sum of the Jetstress performance results for database reads and writes and log writes. Appendix A shows additional results details, and Appendix D shows the Jetstress results files.
24 Seagate Savvio 15K SAS hard-disk
drives
3 Intel X25-E Extreme SATA solid-state
Drives
IOPS 3,994 11,497
Average disk transfers MB per second 37.1 100.8
Active power (enclosure and drives) 292 116

6
Principled Technologies, Inc.: ESRP performance comparison: Solid-state drives vs. hard disk drives
Idle power (enclosure and drives) 276 112
Idle power (enclosure only) 108.2 108.2
Performance per watt 14 99
Figure 7: Test results. The idle and active power measurement includes the power of the enclosure in addition to the power of the drives. We also measured the power consumption of the empty enclosure when idle, 108.2 watts.
Test methodology We created a test bed that included the server whose configuration Figure 8 shows. Appendix B provides detailed configuration information for that server, which we don’t name because it is part of the anonymous test bed and not the systems under test. We installed either the 3 SSDs or the 24 HDDs into the Newisys NDS-2240 enclosure, which we connected to a server via an LSI Logic MegaRAID SAS 8888ELP RAID Controller. We loaded the ESRP v2.1 Jetstress software onto the server and ran the Jetstress storage performance tests from the server. Intel selected and provided the storage array, HDDs, and SSDs. PT provided the server.
Test server
Processors Two Quad-Core Intel Xeon E5460 processors at 3.16 GHz
Memory 8 GB of FB-DDR2 PC5300 memory
Internal disk One 160GB, 7200RPM Deskstar T7K250 SATA 3.0 Gb/s drive
NIC Intel Pro1000 EB NIC
OS Windows Server 2003 Enterprise x64 Edition SP2
Test software ESRP v2.1, Jetstress 08.02.0060, and Ese .08.01.0240.005
Figure 8: Test server configuration.
We configured the storage arrays using the following guidelines:
We configured each array as RAID 0 with disk cache enabled.
We used all drives for database and log files.
We used Diskpart to align all Exchange-related drives on a 4KB boundary.
We tested each array after it completed background operations for initial configuration, RAID expansion, RAID-level change, group expansion, and disk failure recovery.
We conducted testing in a climate-controlled room.
We used one SAS connection from the server to the storage array. Figure 9 presents the drives we tested. In all cases, we installed the drives in a Newisys NDS-2240 enclosure.
Seagate Savvio 15K SAS hard
disk drives
Intel X25-E Extreme SATA
solid-state drives
Vendor and model number Seagate ST973451SS Intel SSDSA2SH032G1GN
Number of drives in system 24 3
Size (GB) 73 32
RPM 15,000 N/A
Type SAS 3.0 Gb/s SATA 3.0 Gb/s

7
Principled Technologies, Inc.: ESRP performance comparison: Solid-state drives vs. hard disk drives
Controller LSI Logic MegaRAID SAS
8888ELP RAID Controller
LSI Logic MegaRAID SAS
8888ELP RAID Controller
Controller driver LSI 3.8.0.64 (08/12/2008) LSI 3.8.0.64 (08/12/2008)
Figure 9: The drives we tested.
Appendix C provides more detailed information on the storage configuration. We followed the steps listed in the rest of this section to setup and run the tests.
Setting up the storage disks We installed either the 3 SSDs or the 24 HDDs into the Newisys NDS-2240 enclosure, which we connected to a server via an LSI Logic MegaRAID SAS 8888ELP RAID Controller. Before we ran the tests, we configured each of the storage disks as RAID 0, enabled the disk cache, ran Iometer on the SSDs to season them, and used Diskpart to align all drives on a 4KB boundary.
1. Install the LSI Logic MegaRAID SAS 8888ELP RAID controller card on the server. 2. Connect the Newisys NDS-2240 enclosure to the server via the controller card. 3. Install the 24 HDDs (or 3 SSDs) into the Newisys enclosure.
The rest of this section provides instructions for each of those steps.
Setting up the RAID (SSDs and HDDs)
1. Enter the MegaRAID BIOS Configuration Utility. 2. Select your adapter, and click Next. 3. Click Configuration Wizard. 4. Select New Configuration, and click Next. 5. At the This is a Destructive Operation! screen, click Yes. 6. Select Custom Configuration, and click Next. 7. Assign all of the drives in your array to your RAID, and click Accept DG. 8. Click Next. 9. Click Add to SPAN. 10. Click Next. 11. Set the RAID level to RAID 0, set Disk Cache to enabled, and change Select Size to the suggested RAID
0 size on the right. 12. Click Next. 13. Click Accept. 14. Click Yes. 15. Click Yes. 16. Click Home. 17. Click Exit.
Seasoning the drives (SSDs only) Note: We preconditioned the SSDs so that our tests would deliver accurate sustained performance values. Without preconditioning, tests could deliver highly variable performance.
1. Plug in an SSD that you have securely erased or freshly performed a low-level format on. 2. Initialize the disk, and format it as NTFS. 3. Using IOMeter, run a 1-second 128k sequential read test to the entire logical block addressing (LBA)
space of the RAID. This enables all LBAs to have some content in them so the SSD does not have an artificially high reserve space. Note: We used Iometer 2008-06-22-rc1, available from http://sourceforge.net/projects/iometer.
4. Delete the IOBW.tst file from the RAID. 5. Using IOMeter, run a 5,700-second 128k sequential read test (with alignment on 4K sector boundaries)
on 100 percent of the RAID. This preconditions the RAID.
Formatting the drive array with Diskpart (SSDs and HDDs)

8
Principled Technologies, Inc.: ESRP performance comparison: Solid-state drives vs. hard disk drives
1. Open a command prompt.
2. Type cd c:\windows\system32
3. Type diskpart.exe
4. Type List Disk to determine the name of your RAID array.
5. Type Select Disk # where Disk # is the name of your RAID array.
6. Type Create partition primary size=# align=4 where # is the .8 * total size of the RAID array
in megabytes. This designates 80 percent of your RAID array’s total drive space to a new partition intended for ESRP database files.
7. Type Assign Letter=E to assign this new partition the letter E.
8. Repeat steps 6 and 7 with .2 * total size of the RAID array in megabytes as your # for step 6 and F for
your letter in step 7. This designates 20 percent of your RAID array’s total drive space to a new partition intended for ESRP log files.
9. Type Exit
10. In Windows, click Start, right-click My Computer, and select Manage. 11. Click Disk Management. 12. Right-click each of your two new partitions, and select Format.
13. Name the larger drive Drive Array DBs and the smaller drive Drive Array Logs, and format the
drives as NTFS.
Connecting the Extech Power Analyzer/Datalogger To record power consumption for the server and drive array during each test, we used two Extech Instruments (www.extech.com) 380803 Power Analyzer/Dataloggers. We connected the power cord from the server under test to the Power Analyzer’s output load power outlet. We then plugged the power cord from the Power Analyzer’s input voltage connection into a power outlet. We used a second Extech Power Analyzer to measure the power draw of the drive array. Because the drive array has two power supplies, we used a splitter cable to connect both of them to the Extech simultaneously. We used the Power Analyzer’s Data Acquisition Software (version 2.11) to capture all recordings. We installed the software on a PC, to which we connected all Power Analyzers via a separated RS-232 cable for each Extech instrument. We captured power consumption at 1-second intervals.
Installing Microsoft Windows 2003 Server x64 Enterprise Edition Service Pack 2 on the server We began our testing by installing a fresh copy of Microsoft Windows 2003 Server Enterprise x64 Edition Service Pack 2 on the test server. We followed this process for each installation:
1. Assign a computer name of Server
2. For the licensing mode, use the default setting of five concurrent connections. 3. Enter a password for the administrator logon. 4. Select Eastern Time Zone. 5. Use typical settings for the Network installation.
6. Type Testbed for the workgroup.
Note: We used default BIOS settings on the server.
Installing Jetstress 1. Download the Microsoft .Net Framework Version 2.0 Redistributable Package (x64) from
http://www.microsoft.com/DOWNLOADS/details.aspx?familyid=B44A0000-ACF8-4FA1-AFFB-40E78D788B00&displaylang=en.
2. Run NetFx64.exe. 3. Click Next. 4. Accept the terms of the License Agreement, and click Next. 5. Click Finish.

9
Principled Technologies, Inc.: ESRP performance comparison: Solid-state drives vs. hard disk drives
6. Download the Microsoft Exchange Server Jetstress Tool (64-bit) v. 08.02.0060 from http://www.microsoft.com/downloads/details.aspx?FamilyID=73dfe056-0900-4dbb-b14a-0932338cecac&DisplayLang=en.
7. Run Jetstress.msi. 8. Click Next. 9. Accept the terms of the License Agreement, and click Next. 10. Click Next. 11. Click Next. 12. Click Close. 13. Copy the following files from an Exchange 2007 SP1 64-bit installation disk:
ese.dll
eseperf.dll
eseperf.hxx
eseperf.ini 14. Paste the files in C:\Program Files\Exchange Jetstress. 15. Run JetstressWin.exe. 16. Click Start new test. 17. Click Exit.
Preparing for the test To prepare for the test, we first ran a Jetstress disk subsystem throughput test to find a starting point for tuning the mailbox profile test.
1. Run JetstressWin.exe. 2. Click Start new Test. 3. Click Next. 4. Select Create a new test configuration file.
5. Name the file ArrayName_Initial_Run.xml
6. Click Next. 7. Select Test disk subsystem throughput. 8. Click Next. 9. At the Size the database storage capacity percentage box, change the value to 60. (We reserved 60
percent of formatted storage capacity for mailboxes, 20 percent for database file growth, and the remaining 20 percent for log files.)
10. At the Target IOPS using throughput capacity percentage box, leave the default value of 100. 11. Click Next. 12. Select Performance. 13. Click Next. 14. Set the test duration to 2 hours. 15. Click Next. 16. Set the number of storage groups to 1. 17. Leave the number of databases set to 1. 18. Click Next. 19. Select Create new databases. 20. Click Execute Test. 21. Once the test has finished, record the thread count from the disk subsystem throughput. You will use this
value as the thread count for your first Jetstress test run in step 14 below.
Running the test 1. Run JetstressWin.exe. 2. Click Start new Test. 3. Click Next. 4. Select Create a new test configuration file.
5. Name the file ArrayName_Run#.xml
6. Click Next. 7. Select Test an Exchange mailbox profile.

10
Principled Technologies, Inc.: ESRP performance comparison: Solid-state drives vs. hard disk drives
8. Enter a description in the text box. 9. Click Next. 10. Set the number of mailboxes using the following formula (rounding the result down to the nearest 50):
(60 percent database files capacity utilization goal) x (formatted capacity) x (1,024 MB) (250MB Mailbox size)
11. Type .5 for IOPS/mailbox.
12. Set the Mailbox size to 250 MB. 13. Check the Suppress tuning checkbox. 14. For the first run, enter the number of threads that the automatic tuning from the Disk subsystem
throughput test chose. For subsequent runs, use the thread count you calculate in step 24. 15. Click Next. 16. Select the Performance test type. 17. Click Next. 18. Set the test duration to 2 hours. 19. Set the number of storage groups to the amount you calculated in the Test calculations table. 20. Click Next. 21. Select Create new databases. 22. Click Next. 23. Begin measuring power and wait 2 minutes measure idle power. 24. Click Execute Test. 25. Wait for the test to finish; stop measuring power, then check the output files to see if the run reported
errors or failed by exceeding the Jetstress latency thresholds for the log or database files. a. If the run had errors or the latency exceeded the thresholds, proceed based on whether the run
prior to this run passed or also failed: i. If your previous run was successful, record that previous run as your maximum IOPS
score. ii. If your previous run also had errors or exceeded the latency thresholds, decrease the
number of threads by 1, and perform another run. b. If the run succeeds, perform the following steps:
i. Save the following files:
Application event log from each server as servername_application.evt and include in result package.
System event log from each server as servername_system.evt and include in result package.
The Jetstresswin configuration file you used (e.g. ServerName_Run#.xml).
Performance_(TimeStamp).html
Performance_(TimeStamp).blg
DBChecksum_(TimeStamp).html
DBChecksum_(TimeStamp).blg ii. Average the power usage for the enclosure during the entire benchmark run. iii. Average the power usage during the 2-minute idle period prior to the run. iv. Record the items shown in the tables in this report. v. Check the results for the run prior to this run, and proceed based on whether that run
passed or failed. 1. If your previous run was successful, increase the number of threads by 1, and
perform another run. 2. If your previous run had errors or exceeded the latency thresholds, save your
current run as your maximum IOPS score.
11
Principled Technologies, Inc.: ESRP performance comparison: Solid-state drives vs. hard disk drives
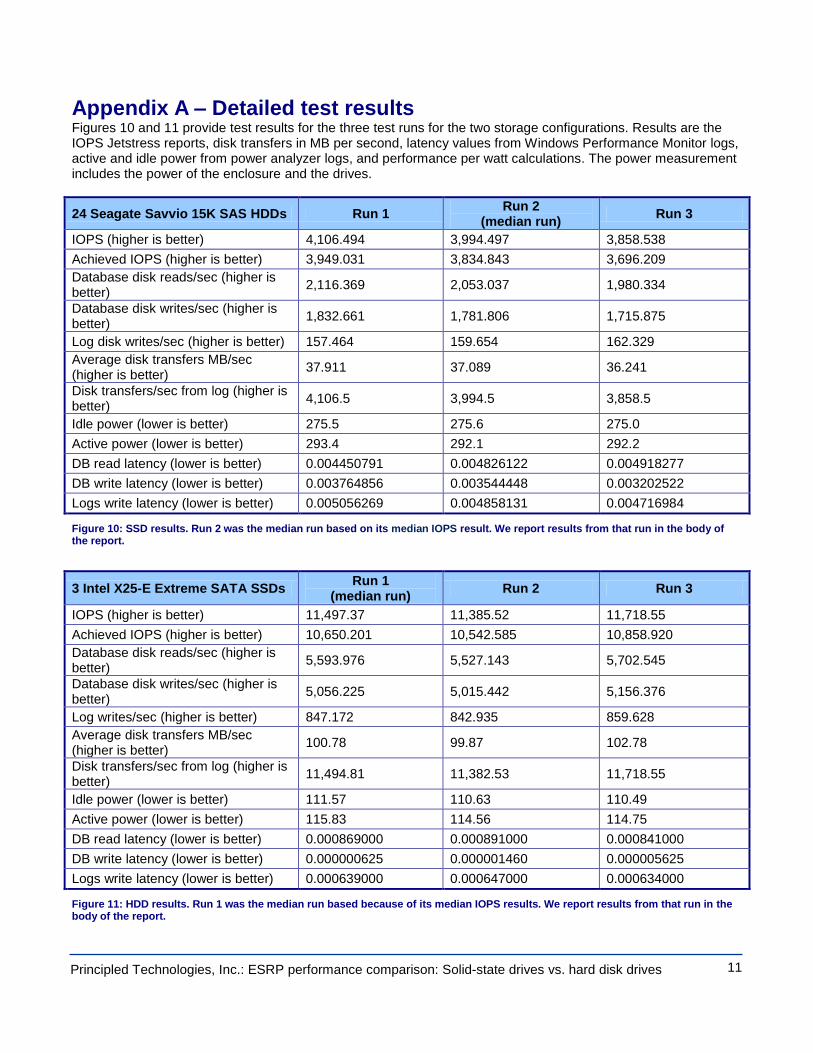
Appendix A – Detailed test results Figures 10 and 11 provide test results for the three test runs for the two storage configurations. Results are the IOPS Jetstress reports, disk transfers in MB per second, latency values from Windows Performance Monitor logs, active and idle power from power analyzer logs, and performance per watt calculations. The power measurement includes the power of the enclosure and the drives.
24 Seagate Savvio 15K SAS HDDs Run 1 Run 2
(median run) Run 3
IOPS (higher is better) 4,106.494 3,994.497 3,858.538
Achieved IOPS (higher is better) 3,949.031 3,834.843 3,696.209
Database disk reads/sec (higher is better)
2,116.369 2,053.037 1,980.334
Database disk writes/sec (higher is better)
1,832.661 1,781.806 1,715.875
Log disk writes/sec (higher is better) 157.464 159.654 162.329
Average disk transfers MB/sec (higher is better)
37.911 37.089 36.241
Disk transfers/sec from log (higher is better)
4,106.5 3,994.5 3,858.5
Idle power (lower is better) 275.5 275.6 275.0
Active power (lower is better) 293.4 292.1 292.2
DB read latency (lower is better) 0.004450791 0.004826122 0.004918277
DB write latency (lower is better) 0.003764856 0.003544448 0.003202522
Logs write latency (lower is better) 0.005056269 0.004858131 0.004716984
Figure 10: SSD results. Run 2 was the median run based on its median IOPS result. We report results from that run in the body of the report.
3 Intel X25-E Extreme SATA SSDs Run 1
(median run) Run 2 Run 3
IOPS (higher is better) 11,497.37 11,385.52 11,718.55
Achieved IOPS (higher is better) 10,650.201 10,542.585 10,858.920
Database disk reads/sec (higher is better)
5,593.976 5,527.143 5,702.545
Database disk writes/sec (higher is better)
5,056.225 5,015.442 5,156.376
Log writes/sec (higher is better) 847.172 842.935 859.628
Average disk transfers MB/sec (higher is better)
100.78 99.87 102.78
Disk transfers/sec from log (higher is better)
11,494.81 11,382.53 11,718.55
Idle power (lower is better) 111.57 110.63 110.49
Active power (lower is better) 115.83 114.56 114.75
DB read latency (lower is better) 0.000869000 0.000891000 0.000841000
DB write latency (lower is better) 0.000000625 0.000001460 0.000005625
Logs write latency (lower is better) 0.000639000 0.000647000 0.000634000
Figure 11: HDD results. Run 1 was the median run based because of its median IOPS results. We report results from that run in the body of the report.

12
Principled Technologies, Inc.: ESRP performance comparison: Solid-state drives vs. hard disk drives
Jetstress results Jetstress reports IOPS results. We ran the Jetstress primary storage performance test three times for each test system. We calculated the median of those IOPS values for the three runs. We report results from that run. The Achieved IOPS that Jetstress uses as its primary IOPS score includes database writes per second and reads per second. Our IOPS result is that result plus log writes per second.
Performance monitor results Performance logs we recorded during the Jetstress run provide average disk transfers in MB per second.
Jetstress monitors key performance counters. A passing Jetstress score requires acceptable values for log writes per second, database reads per second, and database writes per second. We logged these values, all of which passed Jetstress requirements, at 1-second intervals and calculated the average during the 2-hour test. We report those values for the median run.
Power analyzer results We captured idle and active power with power analyzers connected to the server and storage array. Idle power is the average power consumption during 2 minutes while the server and drives were idle before Jetstress runs. Active power is the average power consumption during the median run. We report the active and idle power consumption for the storage arrays only.
Performance per watt We calculated performance per watt by dividing IOPS by active power for the median run.

13
Principled Technologies, Inc.: ESRP performance comparison: Solid-state drives vs. hard disk drives
Appendix B – Test environment We connected each storage solution to a single server. Figure 12 provides detailed configuration information for that server, which we don’t name because it is part of the anonymous test bed and not the systems under test.
Test server
General
Number of processor packages 2
Number of cores per processor package 4
Number of hardware threads per core 1
System Power Management Policy Always On
CPU
Vendor Intel
Name Xeon E5460
Stepping 6
Socket type Socket 771-LGA
Core frequency (GHz) 3.16
Front-side bus frequency (MHz) 1,333
L1 cache 32 KB + 32 KB (per core)
L2 cache 12 MB (2 x 6 MB shared)
Platform
Motherboard model number X7DB8+
Motherboard chipset Intel 5000P
Motherboard revision number 92
BIOS name and version Phoenix Technologies 2.1
BIOS settings Default
Chipset INF driver Intel 9.0.0.1008
Memory module(s)
Vendor and model number Samsung M395T5750CZ4-CE66
Type FB-DDR2 PC-5300
Speed (MHz) 667
Speed in the system currently running @ (MHz) 667
Timing/latency (tCL-tRCD-iRP-tRASmin) 5-5-5-15
Size (MB) 8,192
Number of RAM modules 4 x 2,048 MB
Chip organization Double-sided
Channel Dual
Hard disk
Vendor and model number Deskstar T7K250
Number of disks in system 1
Size (GB) 160
Buffer size (MB) 8
RPM 7,200
Type SATA 3.0 Gb/s
Controller Intel 6321ESB
Controller driver Intel 8.2.0.1011 (10/15/2006)

14
Principled Technologies, Inc.: ESRP performance comparison: Solid-state drives vs. hard disk drives
Test server
Operating system
Name Windows Server 2003 Enterprise x64 Edition
Build number 3790
Service Pack SP2
File system NTFS
Language English
Microsoft DirectX version 9.0c
Graphics
Vendor and model number ATI Rage XL PCI
Chipset ATI Rage XL
BIOS version GR-xlints3y.09a-4.332
Type Integrated
Memory size (MB) 8
Resolution 1,280 x 1,024 x 32-bit
Driver ATI 6.14.10.6025 (12/3/2004)
Network card/subsystem
Vendor and model number Intel PRO/1000 EB Server Adapter
Type Integrated
Driver 9.12.13.0 (12/11/2007)
Optical drive
Vendor and model number LITE-ON COMBO SOHC-5236V
Type CD/DVD-ROM
Interface SATA
Dual/single layer Dual
USB ports
Number of ports 4
Type of ports (USB 1.1, USB 2.0) 2.0
Figure 12: Detailed system configuration information for the test server.

15
Principled Technologies, Inc.: ESRP performance comparison: Solid-state drives vs. hard disk drives
Appendix C – Storage configuration Figures 13 and 14 provide detailed information about the primary storage hardware and the storage drive configuration we used in our tests.
Primary storage hardware
System 24 HDDs 3 SSDs
Storage connectivity (Fibre Channel, SAS, SATA, iSCSI) SAS SAS
Storage model and OS/firmware revision Newisys NDS-2240 Newisys NDS-2240
Number of storage controllers 1 1
HBA model and firmware MegaRAID SAS 8888ELP 1.20.32-0512
MegaRAID SAS 8888ELP 1.20.32-0512
Number of HBAs/host 1 1
Total number of drives we tested in solution 24 3
Maximum number of drives the storage can host 24 24
Figure 13: Primary storage hardware.
Primary storage drive configuration (mailbox store and transactional log drives)
System 24 HDDs 3 SSDs
Drive type, speed SAS, 15K RPM SSD
Drive Firmware SM04 8620
Raw capacity per drive (GB) 73 32
Number of physical drives in test 24 3
Total raw storage capacity (GB) 1,752 96
RAID level RAID 0 RAID 0
Total formatted capacity (GB)* 96 96
Percentage formatted capacity used by Exchange database 51% 51%
Percentage raw storage capacity used by Exchange database 3% 51%
Figure 14: Primary storage drive configuration (mailbox store and transactional log drive).
*We constrained usable space for the HDDs to 96 GB, 5 percent of their normal usable space of 1,752 GB, to use same space as the SSDs.

16
Principled Technologies, Inc.: ESRP performance comparison: Solid-state drives vs. hard disk drives
Appendix D – Jetstress results files
24 Seagate Savvio 15K SAS hard disk drives
Microsoft Exchange Server Jetstress
Performance Test Result Report Test Summary
Overall Test Result Pass
Machine Name SERVER
Test Description
Test Start Time 10/21/2008 4:05:25 PM
Test End Time 10/21/2008 6:49:53 PM
Jetstress Version 08.02.0060.000
Ese Version 08.01.0240.005
Operating System Microsoft Windows Server 2003 Service Pack 2 (5.2.3790.131072)
Performance Log C:\Program Files\Exchange Jetstress\Performance_2008_10_21_16_24_35.blg C:\Program Files\Exchange Jetstress\DBChecksum_2008_10_21_18_49_53.blg
Database Sizing and Throughput
Achieved I/O per Second 3834.843
Target I/O per Second 100
Initial database size 52431306752
Final database size 62529224704
Database files (count) 1
Jetstress System Parameters
Thread count 73 (per-storage group)
Log buffers 9000
Minimum database cache 32.0 MB
Maximum database cache 256.0 MB
Insert operations 40%
Delete operations 30%
Replace operations 5%
Read operations 25%
Lazy commits 55%
Disk Subsystem Performance
LogicalDisk Avg. Disk
sec/Read
Avg. Disk
sec/Write
Disk
Reads/sec
Disk
Writes/sec
Avg. Disk
Bytes/Write
Database
(E:)
0.005 0.004 2053.037 1781.806 (n/a)
Log (F:) 0.000 0.005 0.000 159.654 32661.411
Host System Performance
Counter Average Minimum Maximum

17
Principled Technologies, Inc.: ESRP performance comparison: Solid-state drives vs. hard disk drives
% Processor Time 2.724 1.042 5.299
Available MBytes 7081.548 6891.000 7127.000
Free System Page Table Entries 16759728.438 16759721.000 16760001.000
Transition Pages RePurposed/sec 0.000 0.000 0.000
Pool Nonpaged Bytes 33262890.667 32428032.000 33689600.000
Pool Paged Bytes 32659763.200 32575488.000 33484800.000
Database Page Fault Stalls/sec 0.035 0.000 0.667
Test Log10/21/2008 4:05:25 PM -- Jetstress testing begins ...
10/21/2008 4:05:25 PM -- Prepare testing begins ... 10/21/2008 4:05:25 PM -- Creating E:\DB1\Jetstress1.edb. 10/21/2008 4:05:26 PM -- Database cache settings: (minimum: 32.0 MB, maximum: 256.0 MB) 10/21/2008 4:05:26 PM -- Database flush thresholds: (start: 2.6 MB, stop: 5.1 MB) 10/21/2008 4:16:19 PM -- 60.0% of 48.8 GB complete (5962021 records inserted).
10/21/2008 4:24:31 PM -- 100.0% of 48.8 GB complete (9276963 records inserted). 10/21/2008 4:24:34 PM -- Attaching databases ...
10/21/2008 4:24:34 PM -- Prepare testing ends. 10/21/2008 4:24:34 PM -- Dispatching transactions begins ... 10/21/2008 4:24:34 PM -- Database cache settings: (minimum: 32.0 MB, maximum: 256.0 MB) 10/21/2008 4:24:34 PM -- Database flush thresholds: (start: 2.6 MB, stop: 5.1 MB) 10/21/2008 4:24:35 PM -- Database read latency thresholds: (average: 0.02 seconds/read, maximum: 0.05 seconds/read).
10/21/2008 4:24:35 PM -- Log write latency thresholds: (average: 0.01 seconds/write, maximum: 0.05 seconds/write). 10/21/2008 4:24:35 PM -- Operation mix: Sessions 73, Inserts 40%, Deletes 30%, Replaces 5%, Reads 25%, Lazy Commits 55%. 10/21/2008 4:24:35 PM -- Performance logging begins (interval: 15000 ms). 10/21/2008 4:24:35 PM -- Attaining prerequisites: 10/21/2008 4:25:36 PM -- \MSExchange Database(JetstressWin)\Database Cache Size, Last:
244572200.0 (lower bound: 241591900.0, upper bound: none)
10/21/2008 6:25:37 PM -- Performance logging ends. 10/21/2008 6:25:37 PM -- JetInterop batch transaction stats: 366477. 10/21/2008 6:25:37 PM -- Dispatching transactions ends. 10/21/2008 6:25:37 PM -- Shutting down databases ... 10/21/2008 6:49:53 PM -- Instance2640.1 (complete) 10/21/2008 6:49:53 PM -- Performance logging begins (interval: 7500 ms).
10/21/2008 6:49:53 PM -- Verifying database checksums ... 10/21/2008 6:50:52 PM -- E: (100% processed) 10/21/2008 6:50:53 PM -- Performance logging ends. 10/21/2008 6:50:53 PM -- C:\Program Files\Exchange Jetstress\DBChecksum_2008_10_21_18_49_53.blg has 7 samples. 10/21/2008 6:50:54 PM -- C:\Program Files\Exchange
Jetstress\DBChecksum_2008_10_21_18_49_53.html is saved. 10/21/2008 6:50:54 PM -- Verifying log checksums ... 10/21/2008 6:50:54 PM -- F:\Log1 (2 logs passed) 10/21/2008 6:50:54 PM -- C:\Program Files\Exchange
Jetstress\Performance_2008_10_21_16_24_35.blg has 484 samples. 10/21/2008 6:50:54 PM -- Creating test report ... 10/21/2008 6:50:56 PM -- Volume E: has 0.0048 for Avg. Disk sec/Read.
10/21/2008 6:50:56 PM -- Volume F: has 0.0049 for Avg. Disk sec/Write. 10/21/2008 6:50:56 PM -- Volume F: has 0.0000 for Avg. Disk sec/Read. 10/21/2008 6:50:56 PM -- Test has 0.666756594509691 Maximum Database Page Fault Stalls/sec. 10/21/2008 6:50:56 PM -- Test has 0 Database Page Fault Stalls/sec samples higher than 0. 10/21/2008 6:50:57 PM -- C:\Program Files\Exchange Jetstress\Performance_2008_10_21_16_24_35.xml has 479 samples queried.

18
Principled Technologies, Inc.: ESRP performance comparison: Solid-state drives vs. hard disk drives
Three Intel X25-E Extreme SATA solid-state drives
Microsoft Exchange Server Jetstress
Performance Test Result Report
Test Summary
Overall Test
Result
Pass
Machine Name SERVER
Test Description
Test Start Time 10/5/2008 9:14:21 PM
Test End Time 10/5/2008 11:32:49 PM
Jetstress Version 08.02.0060.000
Ese Version 08.01.0240.005
Operating
System
Microsoft Windows Server 2003 Service Pack 2 (5.2.3790.131072)
Performance Log C:\Program Files\Exchange
Jetstress\Performance_2008_10_5_21_32_32.blg
C:\Program Files\Exchange
Jetstress\DBChecksum_2008_10_5_23_32_49.blg
Database Sizing and Throughput
Achieved I/O per Second 10650.201
Target I/O per Second 100
Initial database size 52433403904
Final database size 71467286528
Database files (count) 1
Jetstress System Parameters
Thread count 17 (per-storage group)
Log buffers 9000
Minimum database cache 32.0 MB
Maximum database cache 256.0 MB
Insert operations 40%
Delete operations 30%
Replace operations 5%
Read operations 25%
Lazy commits 55%
Disk Subsystem Performance
LogicalDisk Avg. Disk Avg. Disk Disk Disk Avg. Disk

19
Principled Technologies, Inc.: ESRP performance comparison: Solid-state drives vs. hard disk drives
sec/Read sec/Write Reads/sec Writes/sec Bytes/Write
Database
(E:)
0.001 0.004 5593.976 5056.225 (n/a)
Log (F:) 0.000 0.001 0.000 847.172 15548.843
Host System Performance
Counter Average Minimum Maximum
% Processor Time 6.637 5.195 8.789
Available MBytes 7155.944 7150.000 7159.000
Free System Page Table Entries 16760203.000 16760203.000 16760203.000
Transition Pages RePurposed/sec 0.000 0.000 0.000
Pool Nonpaged Bytes 33023863.467 32157696.000 33423360.000
Pool Paged Bytes 27823018.667 27721728.000 28770304.000
Database Page Fault Stalls/sec 0.875 0.000 3.534
Test Log10/5/2008 9:14:21 PM -- Jetstress testing begins ...
10/5/2008 9:14:21 PM -- Prepare testing begins ...
10/5/2008 9:14:21 PM -- Creating E:\DB1\Jetstress1.edb.
10/5/2008 9:14:21 PM -- Database cache settings: (minimum: 32.0 MB, maximum: 256.0 MB)
10/5/2008 9:14:21 PM -- Database flush thresholds: (start: 2.6 MB, stop: 5.1 MB)
10/5/2008 9:26:11 PM -- 60.0% of 48.8 GB complete (5961622 records inserted).
10/5/2008 9:32:28 PM -- 100.0% of 48.8 GB complete (9274855 records inserted).
10/5/2008 9:32:31 PM -- Attaching databases ...
10/5/2008 9:32:31 PM -- Prepare testing ends.
10/5/2008 9:32:31 PM -- Dispatching transactions begins ...
10/5/2008 9:32:31 PM -- Database cache settings: (minimum: 32.0 MB, maximum: 256.0 MB)
10/5/2008 9:32:31 PM -- Database flush thresholds: (start: 2.6 MB, stop: 5.1 MB)
10/5/2008 9:32:32 PM -- Database read latency thresholds: (average: 0.02 seconds/read,
maximum: 0.05 seconds/read).
10/5/2008 9:32:32 PM -- Log write latency thresholds: (average: 0.01 seconds/write,
maximum: 0.05 seconds/write).
10/5/2008 9:32:33 PM -- Operation mix: Sessions 17, Inserts 40%, Deletes 30%, Replaces
5%, Reads 25%, Lazy Commits 55%.
10/5/2008 9:32:33 PM -- Performance logging begins (interval: 15000 ms).
10/5/2008 9:32:33 PM -- Attaining prerequisites:
10/5/2008 9:32:48 PM -- \MSExchange Database(JetstressWin)\Database Cache Size, Last:
268435500.0 (lower bound: 241591900.0, upper bound: none)
10/5/2008 11:32:49 PM -- Performance logging ends.
10/5/2008 11:32:49 PM -- JetInterop batch transaction stats: 946710.
10/5/2008 11:32:49 PM -- Dispatching transactions ends.
10/5/2008 11:32:49 PM -- Shutting down databases ...
10/5/2008 11:32:49 PM -- Instance2396.1 (complete)
10/5/2008 11:32:50 PM -- Performance logging begins (interval: 7500 ms).
10/5/2008 11:32:50 PM -- Verifying database checksums ...
10/5/2008 11:34:54 PM -- E: (100% processed)
10/5/2008 11:34:55 PM -- Performance logging ends.
10/5/2008 11:34:55 PM -- C:\Program Files\Exchange
Jetstress\DBChecksum_2008_10_5_23_32_49.blg has 16 samples.
10/5/2008 11:34:57 PM -- C:\Program Files\Exchange
Jetstress\DBChecksum_2008_10_5_23_32_49.html is saved.
10/5/2008 11:34:57 PM -- Verifying log checksums ...
10/5/2008 11:34:57 PM -- F:\Log1 (2 logs passed)
10/5/2008 11:34:57 PM -- C:\Program Files\Exchange
Jetstress\Performance_2008_10_5_21_32_32.blg has 481 samples.
10/5/2008 11:34:57 PM -- Creating test report ...

20
Principled Technologies, Inc.: ESRP performance comparison: Solid-state drives vs. hard disk drives
10/5/2008 11:35:00 PM -- Volume E: has 0.0009 for Avg. Disk sec/Read.
10/5/2008 11:35:00 PM -- Volume F: has 0.0006 for Avg. Disk sec/Write.
10/5/2008 11:35:00 PM -- Volume F: has 0.0000 for Avg. Disk sec/Read.
10/5/2008 11:35:00 PM -- Test has 3.53377446718355 Maximum Database Page Fault
Stalls/sec.
10/5/2008 11:35:00 PM -- Test has 0 Database Page Fault Stalls/sec samples higher than
0.
10/5/2008 11:35:00 PM -- C:\Program Files\Exchange
Jetstress\Performance_2008_10_5_21_32_32.xml has 479 samples queried.

21
Principled Technologies, Inc.: ESRP performance comparison: Solid-state drives vs. hard disk drives
About Principled Technologies We provide industry-leading technology assessment and fact-based marketing services. We bring to every assignment extensive experience with and expertise in all aspects of technology testing and analysis, from researching new technologies, to developing new methodologies, to testing with existing and new tools. When the assessment is complete, we know how to present the results to a broad range of target audiences. We provide our clients with the materials they need, from market-focused data to use in their own collateral to custom sales aids, such as test reports, performance assessments, and white papers. Every document reflects the results of our trusted independent analysis. We provide customized services that focus on our clients’ individual requirements. Whether the technology involves hardware, software, Web sites, or services, we offer the experience, expertise, and tools to help you assess how it will fare against its competition, its performance, whether it’s ready to go to market, and its quality and reliability. Our founders, Mark L. Van Name and Bill Catchings, have worked together in technology assessment for over 20 years. As journalists, they published over a thousand articles on a wide array of technology subjects. They created and led the Ziff-Davis Benchmark Operation, which developed such industry-standard benchmarks as Ziff Davis Media’s Winstone and WebBench. They founded and led eTesting Labs, and after the acquisition of that company by Lionbridge Technologies were the head and CTO of VeriTest.
Disclaimer of Warranties; Limitation of Liability: PRINCIPLED TECHNOLOGIES, INC. HAS MADE REASONABLE EFFORTS TO ENSURE THE ACCURACY AND VALIDITY OF ITS TESTING, HOWEVER, PRINCIPLED TECHNOLOGIES, INC. SPECIFICALLY DISCLAIMS ANY WARRANTY, EXPRESSED OR IMPLIED, RELATING TO THE TEST RESULTS AND ANALYSIS, THEIR ACCURACY, COMPLETENESS OR QUALITY, INCLUDING ANY IMPLIED WARRANTY OF FITNESS FOR ANY PARTICULAR PURPOSE. ALL PERSONS OR ENTITIES RELYING ON THE RESULTS OF ANY TESTING DO SO AT THEIR OWN RISK, AND AGREE THAT PRINCIPLED TECHNOLOGIES, INC., ITS EMPLOYEES AND ITS SUBCONTRACTORS SHALL HAVE NO LIABILITY WHATSOEVER FROM ANY CLAIM OF LOSS OR DAMAGE ON ACCOUNT OF ANY ALLEGED ERROR OR DEFECT IN ANY TESTING PROCEDURE OR RESULT. IN NO EVENT SHALL PRINCIPLED TECHNOLOGIES, INC. BE LIABLE FOR INDIRECT, SPECIAL, INCIDENTAL, OR CONSEQUENTIAL DAMAGES IN CONNECTION WITH ITS TESTING, EVEN IF ADVISED OF THE POSSIBILITY OF SUCH DAMAGES. IN NO EVENT SHALL PRINCIPLED TECHNOLOGIES, INC.’S LIABILITY, INCLUDING FOR DIRECT DAMAGES, EXCEED THE AMOUNTS PAID IN CONNECTION WITH PRINCIPLED TECHNOLOGIES, INC.’S TESTING. CUSTOMER’S SOLE AND EXCLUSIVE REMEDIES ARE AS SET FORTH HEREIN.
Principled Technologies, Inc. 1007 Slater Road, Suite 250
Durham, NC 27703 www.principledtechnologies.com [email protected]
Principled Technologies is a registered trademark of Principled Technologies, Inc. Intel, Xeon, and Pentium are registered trademarks of Intel Corporation or its subsidiaries in the United States and other countries.*All other product names are the trademarks of their respective owners.