pseudo-indicator behaviour of platinum electrode explored for the potentiometric estimation of...
TRANSCRIPT

Talanta 101 (2012) 246–252
Contents lists available at SciVerse ScienceDirect
Talanta
0039-91
http://d
n Corr
E-m
journal homepage: www.elsevier.com/locate/talanta
Pseudo-indicator behaviour of platinum electrode exploredfor the potentiometric estimation of non-redox systems
Syed Raashid n, Oyais Ahmad Chat, Masood A. Rizvi, Mohsin Ahmad Bhat, Badruddin Khan
Department of Chemistry, University of Kashmir, Srinagar 190006, India
a r t i c l e i n f o
Available online 23 September 2012
Keywords:
Platinum
Pseudo-indicator
Potentiometry
Non-redox
Spectroelectrochmical
40/$ - see front matter & 2012 Elsevier B.V. A
x.doi.org/10.1016/j.talanta.2012.09.020
esponding author. Tel.: þ91 99067 59925; fa
ail address: [email protected] (S. Raashid).
a b s t r a c t
A pseudo-indicator electrode based potentiometric method for estimation of non-redox metal ions is
presented. In the proposed method, nature and concentration specific impact of analyte over the redox
potential of ideally polarisable Pt/pregenerated-redox-couple interface forms the basis of quantifica-
tion. Utility of the method in estimation of six non-redox metal ions viz. Zn2þ , Cu2þ , Ni2þ , Cd2þ , Pb2þ ,
Al3þ in the concentration range of 10�1–10�3 moldm�3, individually and as binary mixtures is also
presented. Three types of potentiometric behaviours, which we ascribe to the nature specific
thermodynamic and kinetic aspects of metal-EDTA binding, were observed. While Cu2þ , Ni2þ , Pb2þ
and Al3þ were found to bind EDTA efficiently, without exchanging Fe3þ; Zn2þ and Cd2þ were observed
to replace Fe3þ from EDTA. In contrast, Ca2þ and Mg2þ were found to show no binding affinity to EDTA
in the pH range employed in the present work. The proposed method was also used to explore the
reversibility and the Nernestian behaviour of ferricyanide/ferrocyanide redox couple through spectro-
electrochemical titration of Zn2þ with ferrocyanide. The presented method is presaged to be a reliable
and low cost future replacement for costly and delicate ion selective electrodes (ISE) in the estimation
of non-redox species like Zn2þ , Cu2þ , etc.
& 2012 Elsevier B.V. All rights reserved.
1. Introduction
Potentiometric quantification of analyte concentration is basedon the Nernstian type dependence of electromotive force (EMF)over the concentration of oxidised and reduced forms of analyte.Thus electron transfer is a prerequisite for such type of analysis[1,2]. This strategy has been explored for analytical monitoring ofmany industrial, pharmaceutical, biological and environmentalsamples [3–7]. In such methods, the electrode actually sensingthe changes in the analyte concentration is regarded as indicatorelectrode and many a times, a simple redox electrode in thepotentiometric setup acts as reliable and sensitive indicatorelectrode. Even after eighty years of its first reported use,platinum continues to be the most commonly used redox-indicator electrode, owing to its good surface characteristics,quick equilibration, well Nernstian behaviour, modest cost, easystorage and longer life [8–10]. However, there are a number ofbiologically [11,12] and environmentally [13,14] importantspecies like Zn2þ , Cu2þ , Ni2þ , Cd2þ , Pb2þ ,Al3þ , I� , Cl� , and Br�
which being non-redox fail to generate a redox couple in vicinity ofplatinum contact in potentiometric cells and hence cannot be sensedthrough use of this metal contact in redox electrode. It is in this
ll rights reserved.
x: þ91 194 2421357.
context that a good quantum of analytical work in recent past hasbeen devoted to the development of alternate methods forestimation of such ionic species which include chemosensorbased ion selective electrodes (ISE) [15–22] spectroflorescentprobes (SFP) [23–25] and coated wire electrodes (CWE) [26–28].ISE consist of macrocyclic and porphyrin type Schiff base adductsadsorbed over polyvinyl chloride material, with an appropriatepore size to bind a specific metal ion. SEP are made up offlorescent type ligands which show change in spectral or fluor-escent properties on interaction with specific metal ions. CWE arethe modified electrodes obtained by the electrodeposition of achemosensor material over a bare platinum electrode. All thesereported analytical techniques for the estimation of these impor-tant ionic species involve either a sophisticated instrumentationor costly ion selective electrodes. Moreover, poor shelf life andless chemical stability in various media associated to ISE havelimited their general application in analytical chemistry. As ofnow to the best of our knowledge, there has been no attempt tomake use of platinum electrode for the estimation of non-redoxions. The work presented in this report describes a novel indirectmethod for estimation of non-redox species like Zn2þ , Cu2þ , Ni2þ
and Cd2þ over platinum by exploring their impact on redoxpotential of a pregenerated redox couple within the analytesolution. The non-redox cell reaction changes concentration ofone of the two forms in the redox couple allowing potential tochange and hence allows the quantitative monitoring of the

S. Raashid et al. / Talanta 101 (2012) 246–252 247
analyte concentrations. Three redox couples viz I�/I2, [Fe(CN)6]�4/[Fe(CN)6]�3 and [Fe(EDTA)]�1/[Fe(EDTA)]�2 were usedto estimate: I� with Agþ1, Znþ2 with [Fe(CN)6]�4 and Cu2þ ,Ni2þ , Zn2þ , Pb2þ , Cd2þ and Al3þ both individually and as binarymixtures with [Fe(EDTA)]�1 over a platinum electrode. Use ofsuch redox systems for indirect estimation of non-redox speciesthrough a non-redox reaction has been referred as the pseudo-indicator method. The presented method owes its speciality tosense changing the Nernstian ratio through precipitation orcomplexation without involvement of an actual electron transfer.In addition, the work presented describes validation of the Nernstequation and determination of standard electrode potential for[Fe(CN)6]�4/[Fe(CN)6]�3 redox couple in spectroelectrochmicaltitration of Zn2þ with ferrocyanide.
2. Experimental
2.1. Reagents
Metal ion salts, acetic acid, sulphuric acid, disodium ethyle-nediaaminetetraacetic acid (EDTA) were purchased from MerckIndia. Metal ion and EDTA solutions were standardized byappropriate chemical methods. Sodium acetate, potassiumferrocyanide, potassium ferricyanide, potassium iodide werealso obtained from Merck India and used without furthertreatment. Solutions were prepared in triple distilled water.Fe2þ
(aq), Fe3þ(aq), ferrocyanide and ferricyanide solutions were pre-
pared in 10�4 moldm�3 H2SO4 solution.
Table 1Potentiometric estimation of I- over platinum
in five lab made samples.
Sampleno.
I� in sample(mmol)
I� estimated(mmol)
1 0 No pot. break
2 100 10070.50
3 150 15070.50
4 200 20070.50
5 250 25070.50
2.2. Equipment
The potentiometric measurements were carried at 25 1C(70.2 1C) over Eutech PC5500 ion analyser using a platinumelectrode and saturated calomel electrode assembly over athermostatic magnetic stirrer. Spectrophotometric measurementswere done using UV–visible spectrophotometer (Schimadzu1650PC). Supernatant liquid of Zn2þ ferrocyanide titrationmixture was centrifuged using Eppendrof minispin centrifuge at500 rpm prior to absorbance measurement. Data were analysedusing Micocal Origin 8.5.
-1 0 1 2 3 4 5 6 7 8
200
300
400
500
600
700
800
Pote
ntia
l (m
V)
Volume of 0.05M AgNO3 added (mL)
Iodide (mM)0100 150 200 250
Fig. 1. Potentiometric estimation of five iodide solutions of different concentra-
tions with Agþ in presence of iodine over platinum electrode.
2.3. Procedure
I/I2 redox couple was set by adding 2–3 drops of methanolicsolution of I2 to iodide solution before titration with Ag1þ .[Fe(CN)6]�4/[Fe(CN)6]�3 redox couple was generated by adding2 ml of ferricyanide to ferrocyanide solution before titrating itwith Zn2þ . [Fe(EDTA)]�2/[Fe(EDTA)]�1 redox couple was gener-ated by adding 1 ml of Fe2þ
(aq) to standardised EDTA solution priorto titration with Fe3þ
(aq). The titrations were carried over concen-tration range of 10�1–10�3 moldm�3. Titrations involving[Fe(EDTA)]�2/[Fe(EDTA)]�1 redox couple were carried undercontrolled pH using acetate buffer. Titrations carried over a pHrange, revealed pH¼4.2 to be the optimum pH value for suchtitrations. Spectroelectrochemical titration was carried in eight100 mL beakers, which virtually represented the different stagesof a titration. A fixed number of millimoles of ferricyanide andferrocyanide were taken and an increasing volume of Zn2þ
(aq) wasadded sequentially. After an initial development time of 05 min,the potential of solution in each beaker was recorded followedby absorbance measurements of supernatant liquid from eachtitration stage.
3. Results and discussion
The proposed pseudo-indicator model enabled the analyticalmonitoring of non-redox systems through use of platinum asindicator electrode in a simple and low cost potentiometric assem-bly. Preliminary iodide estimation results (Table 1) obtained usingthe proposed model were found to be in good agreement with theactual analyte concentrations. These results served as a motivationto explore the workability of the proposed model for analyticalmonitoring of other non-redox systems.
3.1. Iodine–iodide system
The potentiometric titrations of iodide ions with Agþ (inpresence of I2) over platinum were carried over the range of 10–3–10–1 moldm�3 iodide concentration. As depicted in Fig. 1, withgradual addition of Agþ the potential first increases slowly and thenabruptly near the equivalence point and finally reaching a plateauregion wherein the potential is insensitive to the addition of titrand.The analytical results summarised in Table 1 correspond well withthe amounts taken for analysis.
The addition of Agþ ions to I� solution results in precipitationof I� as AgI, thereby decreasing the available I� ions. As aconsequence accordingly there is a rise in EMF of the system aspredicted by the Nernst equation.
EPt ¼ EI2=2I��RT
2F2:303log
½I��2
½I2�ð1Þ

250 300 350 400 4500.0
0.5
1.0
1.5
2.0
2.5
Abs
orba
nce
(a.u
.)
Wavelength (nm)
Zn+2 (mM)0
10203040506070
Fig.3. Absorbance spectra of supernatant liquid at various stages of Zn2þ–
ferrocyanide titration.
S. Raashid et al. / Talanta 101 (2012) 246–252248
3.2. Zinc-ferrocyanide system
The proposed pseudo-indicator model was also tested for theestimation of non-redox Zn2þ ions over platinum by employing[Fe(CN)6]�4/[Fe(CN)6]�3 redox couple. The couple was pregener-ated in a titration beaker to which Zn2þ solution was added insmall increments. Initially the EMF increases slowly and thenabruptly near the equivalence point. On reversing the titration anexactly opposite trend was observed in variation of potential(Fig. 2), thus indicating that titration can be monitored potentio-metrically by either adding Zn2þ to ferrocyanide or vice-versa. Itis apposite to mention here that same stoichiometry was estab-lished under both the cases. The potentiometric titrations of Zn2þ
ions with ferrocyanide in presence of ferricyanide over platinumelectrode were carried over a range of 10–3–10�1 moldm�3. Theamount of Zn2þ ions estimated was in good agreement with theamount taken for analysis.
It is reported that Zn2þ in neutral or slightly acidic mediumreacts with ferrocyanide to form a white coloured complexK2Zn3[Fe(CN)6]2 [29]
3Zn2þ2K4½FeðCNÞ6�-K2Zn3½FeðCNÞ6�2þ6Kþ
The gradual addition of Zn2þ causes the precipitation offerrocyanide as Zn-ferrocyanide complex which results indecrease in available ferrocyanide with a concomitant increasein potential as predicted by Eq. (2).
EPt ¼ E½FeðCNÞ6 �
4�=½FeðCNÞ6 �3��
RT
nF2:303 log
½FeðCNÞ6�4�
½FeðCNÞ6�3�
ð2Þ
The Nernstian behaviour for [Fe (CN)6]�4/[Fe(CN)6]�3redoxcouple over platinum electrode was verified by performing aspectroelectrochmical titration. The spectra of eight differentstages of the titration are presented in Fig. 3. The concentrationsof ferricyanide and ferrocyanide at each stage were calculatedfrom their absorbance values at 442 nm and 312 nm correspond-ing to their lmax respectively. As is evident from the figure, theabsorbance corresponding to ferrocyanide (l¼312 nm) decreaseswith addition of Zn2þ , which is due to complexation of formerwith later. On the other hand absorbance corresponding toferricyanide (l¼442 nm) remained constant initially anddecreases abnormally near the equivalence point. The abnormaldecrease was explained on the basis complexation of Zn2þ withferricyanide after the entire ferrocyanide had complexed.
0 2 4 6 8 10250
300
350
400
450
500
550
600
650
700
Pot
enti
al (
mV
)
Volume of titrant added (mL)
0.3M Zn2+ as titrant
0.2M Ferrocyanide as titrant
Fig. 2. Potentiometric estimations of Zn2þ and ferrocyanide solutions in presence
of ferricyanide over platinum electrode.
Ferricyanide, ferrocyanide concentrations and correspondingEMF values corresponding to different stages of titration are pre-sented in Table 2. The observed cell EMF vs. ln[Fe(CN)6]�4/[Fe(CN)6]�3, follows a linear relation line (Fig. 4) with a regressioncoefficient of 0.98, with the slope �RT/nF¼44.14 and intercept(E1�Eref)¼0.181 V.Since the electrode assembly consists of saturatedcalomel as reference, a value of 0.242 V (E1 calomel) was added to theintercept that leads to E1¼0.423 V for [Fe (CN)6]�4/[Fe(CN)6]�3 redoxcouple. The calculated value is in good agreement with the reportedvalue of 0.430 V [30] for the said couple. These results imply thatabove mentioned novel spectroelectrochemical titration can be usedfor evaluation standard electrode potential of similar redox systems.
3.3. Ferri-EDTA/ferro-EDTA system
The proposed model was further extended to the estimation ofeight non-redox metal ions, both individually as well as binarymixtures. The estimation is based on the principle of monitoringpotential changes with [Fe(EDTA)]�2/[Fe(EDTA)]�1 redox couplein presence of different analyte metal ions. The analysed metalions exhibited three types of potentiometric behaviours as evidentfrom Fig. 5. The nature of potentiometric profiles was correlatedwith complexing ability i.e. the value of binding constant with EDTAin comparison to Fe3þ . Erstwhile to the estimation experiments, theeffect of pH, initial concentration of Fe2þ and concentration ofanalyte metal ion was also investigated.
3.3.1. Effect of pH
The effect of pH on the titration curves of [Fe(EDTA)]�2/[Fe(EDTA)]�1 redox couple was examined in the range of 3–5(Fig. 6) The results reveal that the pH has a prominent effect onthe shape of the titration curve, the potential measured, theheight of inflection point and volume corresponding to equiva-lence. The dependence of potential profiles on pH is attributed toits impact on conditional formation constant of [Fe(EDTA)]�2 and[Fe(EDTA)]�1 complexes. Below pH 3.0 the stability constants arevery low and above pH 6.0 Fe3þ hydrolyse to [Fe(OH)n](3�n)�
even in presence of EDTA. Moreover, the conditional formationconstant of [M2þEDTA](n�4)� also varies with pH. The estimationstudies at pH 3.5, 4.2 and 5.0 imply pH of 4.2 as optimum for theestimation studies. This is further supported by the stabilityconstant data for metal-EDTA complexes at changing pH [31].
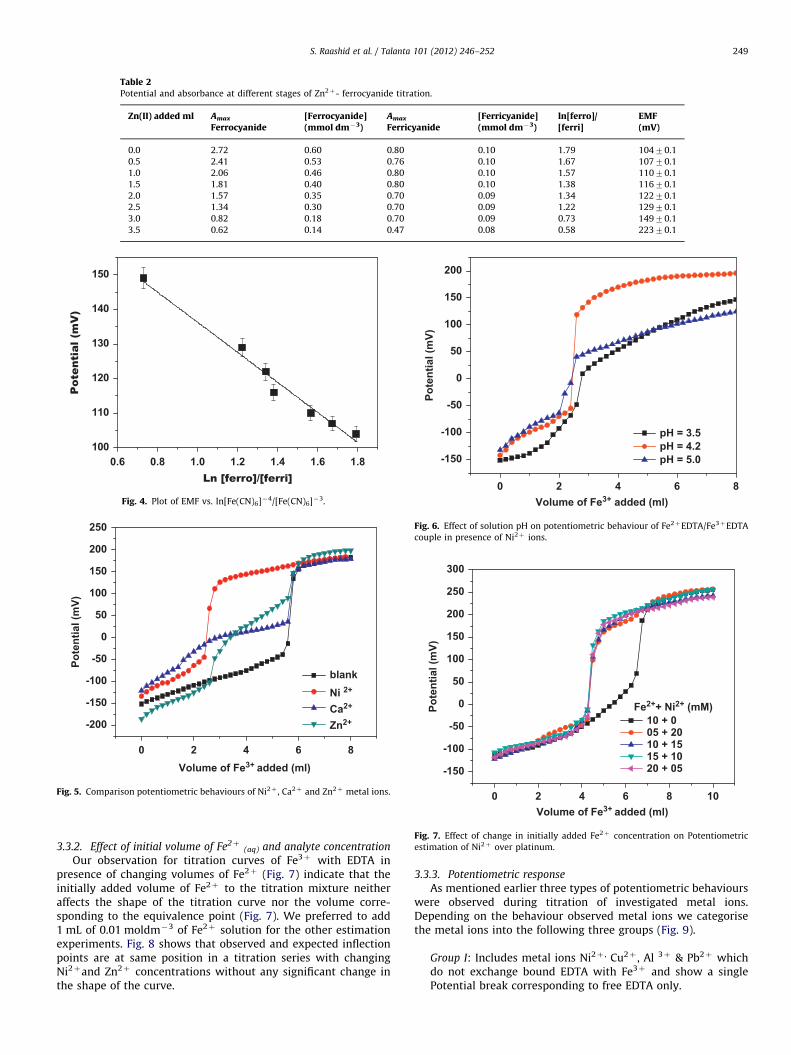
Table 2Potential and absorbance at different stages of Zn2þ- ferrocyanide titration.
Zn(II) added ml Amax
Ferrocyanide[Ferrocyanide](mmol dm�3)
Amax
Ferricyanide[Ferricyanide](mmol dm�3)
ln[ferro]/[ferri]
EMF(mV)
0.0 2.72 0.60 0.80 0.10 1.79 10470.1
0.5 2.41 0.53 0.76 0.10 1.67 10770.1
1.0 2.06 0.46 0.80 0.10 1.57 11070.1
1.5 1.81 0.40 0.80 0.10 1.38 11670.1
2.0 1.57 0.35 0.70 0.09 1.34 12270.1
2.5 1.34 0.30 0.70 0.09 1.22 12970.1
3.0 0.82 0.18 0.70 0.09 0.73 14970.1
3.5 0.62 0.14 0.47 0.08 0.58 22370.1
0.6 0.8 1.0 1.2 1.4 1.6 1.8100
110
120
130
140
150
Pot
enti
al (
mV
)
Ln [ferro]/[ferri]
Fig. 4. Plot of EMF vs. ln[Fe(CN)6]�4/[Fe(CN)6]�3.
0 2 4 6 8
-200
-150
-100
-50
0
50
100
150
200
250
Pote
ntia
l (m
V)
Volume of Fe3+ added (ml)
blank Ni 2+
Ca2+
Zn2+
Fig. 5. Comparison potentiometric behaviours of Ni2þ , Ca2þ and Zn2þ metal ions.
0 2 4 6 8
-150
-100
-50
0
50
100
150
200
Pote
ntia
l (m
V)
Volume of Fe3+ added (ml)
pH = 3.5 pH = 4.2 pH = 5.0
Fig. 6. Effect of solution pH on potentiometric behaviour of Fe2þEDTA/Fe3þEDTA
couple in presence of Ni2þ ions.
0 2 4 6 8 10
-150
-100
-50
0
50
100
150
200
250
300
Pote
ntia
l (m
V)
Volume of Fe3+ added (ml)
10 + 0 05 + 20 10 + 15 15 + 10 20 + 05
Fe2++ Ni2+ (mM)
Fig. 7. Effect of change in initially added Fe2þ concentration on Potentiometric
estimation of Ni2þ over platinum.
S. Raashid et al. / Talanta 101 (2012) 246–252 249
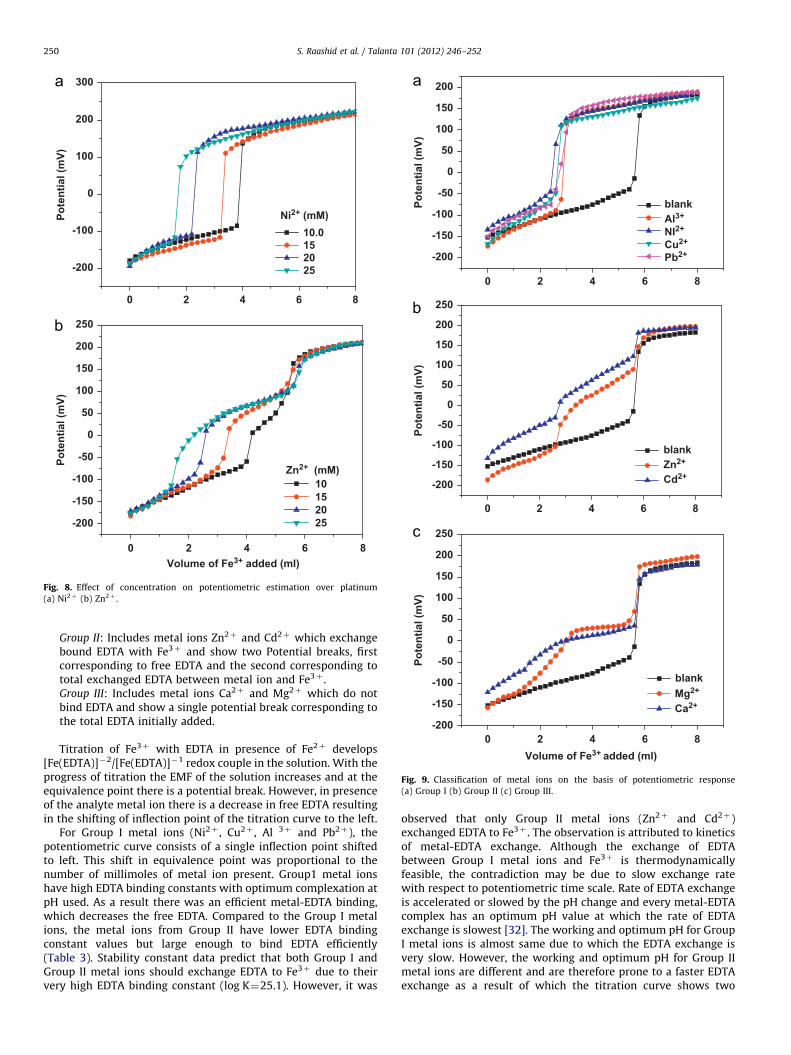
3.3.2. Effect of initial volume of Fe2þ(aq) and analyte concentration
Our observation for titration curves of Fe3þ with EDTA inpresence of changing volumes of Fe2þ (Fig. 7) indicate that theinitially added volume of Fe2þ to the titration mixture neitheraffects the shape of the titration curve nor the volume corre-sponding to the equivalence point (Fig. 7). We preferred to add1 mL of 0.01 moldm�3 of Fe2þ solution for the other estimationexperiments. Fig. 8 shows that observed and expected inflectionpoints are at same position in a titration series with changingNi2þand Zn2þ concentrations without any significant change inthe shape of the curve.
3.3.3. Potentiometric response
As mentioned earlier three types of potentiometric behaviourswere observed during titration of investigated metal ions.Depending on the behaviour observed metal ions we categorisethe metal ions into the following three groups (Fig. 9).
Group I: Includes metal ions Ni2þ , Cu2þ , Al 3þ & Pb2þ whichdo not exchange bound EDTA with Fe3þ and show a singlePotential break corresponding to free EDTA only.
0 2 4 6 8
-200
-100
0
100
200
300
Pote
ntia
l (m
V)
10.0 15 20 25
Ni2+ (mM)
0 2 4 6 8
-200
-150
-100
-50
0
50
100
150
200
250
Pote
ntia
l (m
V)
Volume of Fe3+ added (ml)
10 15 20 25
Zn2+ (mM)
Fig. 8. Effect of concentration on potentiometric estimation over platinum
(a) Ni2þ (b) Zn2þ .
0 2 4 6 8
-200
-150
-100
-50
0
50
100
150
200
250
Pote
ntia
l (m
V)
blankZn2+
Cd2+
0 2 4 6 8-200
-150
-100
-50
0
50
100
150
200
250
Pote
ntia
l (m
V)
Volume of Fe3+ added (ml)
blankMg2+
Ca2+
0 2 4 6 8
-200
-150
-100
-50
0
50
100
150
200
Pote
ntia
l (m
V)
blank Al3+
NI2+
Cu2+
Pb2+
Fig. 9. Classification of metal ions on the basis of potentiometric response
(a) Group I (b) Group II (c) Group III.
S. Raashid et al. / Talanta 101 (2012) 246–252250
Group II: Includes metal ions Zn2þ and Cd2þ which exchangebound EDTA with Fe3þ and show two Potential breaks, firstcorresponding to free EDTA and the second corresponding tototal exchanged EDTA between metal ion and Fe3þ .Group III: Includes metal ions Ca2þ and Mg2þ which do notbind EDTA and show a single potential break corresponding tothe total EDTA initially added.
Titration of Fe3þ with EDTA in presence of Fe2þ develops[Fe(EDTA)]�2/[Fe(EDTA)]�1 redox couple in the solution. With theprogress of titration the EMF of the solution increases and at theequivalence point there is a potential break. However, in presenceof the analyte metal ion there is a decrease in free EDTA resultingin the shifting of inflection point of the titration curve to the left.
For Group I metal ions (Ni2þ , Cu2þ , Al 3þ and Pb2þ), thepotentiometric curve consists of a single inflection point shiftedto left. This shift in equivalence point was proportional to thenumber of millimoles of metal ion present. Group1 metal ionshave high EDTA binding constants with optimum complexation atpH used. As a result there was an efficient metal-EDTA binding,which decreases the free EDTA. Compared to the Group I metalions, the metal ions from Group II have lower EDTA bindingconstant values but large enough to bind EDTA efficiently(Table 3). Stability constant data predict that both Group I andGroup II metal ions should exchange EDTA to Fe3þ due to theirvery high EDTA binding constant (log K¼25.1). However, it was
observed that only Group II metal ions (Zn2þ and Cd2þ)exchanged EDTA to Fe3þ . The observation is attributed to kineticsof metal-EDTA exchange. Although the exchange of EDTAbetween Group I metal ions and Fe3þ is thermodynamicallyfeasible, the contradiction may be due to slow exchange ratewith respect to potentiometric time scale. Rate of EDTA exchangeis accelerated or slowed by the pH change and every metal-EDTAcomplex has an optimum pH value at which the rate of EDTAexchange is slowest [32]. The working and optimum pH for GroupI metal ions is almost same due to which the EDTA exchange isvery slow. However, the working and optimum pH for Group IImetal ions are different and are therefore prone to a faster EDTAexchange as a result of which the titration curve shows two

Table 3Potentiometric response, optimum complexation pH, and stability constant data of three metal ion groups.
Group Metal ion log K pH Potentiometric response
I Cu2þ 18.80 4–5 Single potential break corresponding to excess EDTA
Ni2þ 18.63
Pb2þ 18.04
Al 3þ 16.30
II Zn2þ 16.50 7–8 Two potential breaks corresponding to free and exchanged EDTA
Cd2þ 16.46
III Ca2þ 10.69 8–9 No prominent potential break
Mg2þ 08.79 9–10
0 2 4 6 8
-200
-150
-100
-50
0
50
100
150
200
Pote
ntia
l (m
V)
05 + 20 10 + 15 15 + 10 20 + 05
Zn+2 + Ni+2(mM)
0 2 4 6 8
-200
-150
-100
-50
0
50
100
150
200
250
05 + 20 10 + 15 15 + 10 20 + 05
Pote
ntia
l (m
V)
Volume of Fe3+ added (ml)
Zn+2 + Cu+2 (mM)
Fig. 10. Estimation of bimetallic solutions using pseudo-indicator method
(a) Zn2þ and Ni2þ (b) Zn2þ and Cu2þ .
S. Raashid et al. / Talanta 101 (2012) 246–252 251
inflection points first corresponding to free EDTA and secondcorresponding to exchanged EDTA. The presence of an activationbarrier was further validated by performing the titration at highertemperatures (upto 45 1C). Some deformation in post equivalenceregion of the titration curve was observed with increase intemperature. However, this temperature induced deformationdid not shape as clear second potential break even at 45 1C.Compared to Group I and II, the metal ions of Group III did notshow a clear potential break. The observation is attributed to verylow EDTA binding constants for Group III metal ions on account oflarge difference between working and optimum pH for EDTAbinding.
The model was further explored for the simultaneous estima-tion of two non-redox metal ions, in which one exchanged EDTAwith Fe3þ while the other did not. Two equivalence pointscorresponding to free EDTA and to the total exchange of EDTAbetween metal ion and Fe3þ were observed for these titrations. Inaddition, simultaneous estimation of two mixed binary systemsof Group I and Group II was also investigated (Fig. 10). For the twobinary mixtures relative amounts of both the metal ions werevaried keeping the total amount constant. Since free EDTA in allthe cases would be same, as a result first potential break intitration curves was observed at the same position in all cases.However a shift in the second equivalence point proportionate tothe number of millimoles of Zn2þ was observed. The Zn2þ ions inthe two binary mixtures exchanged EDTA with Fe3þ and hencethe shift observed in the second potential break in accordancewith the amount of Zn2þ in the mixture. Out of the two studiedmixed binary systems Ni2þ/Zn2þ showed more prominent inflec-tion points compared to Cu2þ/Zn2þ . This is because Ni2þ is moreinert than Cu2þ for the exchange of bound EDTA to Fe3þ . Worthto mention the stoichiometric positioning of potential breaks wasobtained in both the cases.
4. Conclusion
A pseudo-indicator method for the estimation of non-redoxmetal ions like Zn2þ ,Cd2þ , Cu2þ and Ni2þ potentiometricallyusing platinum as indicator electrode is presented. The model hasa novelty of changing the ratio of oxidised or reduced states in atypical Nernstian fashion through precipitation or complexationwithout an actual electron transfer. The work also explores theSpectrophotometric validation of the Nernst equation and deter-mination of the standard electrode potentials through spectro-electrochemical titration.
Acknowledgements
SR would like to thank CSIR-New Delhi for financial assistancein the form of Junior Research Fellowship and Head Departmentof Chemistry, University of Kashmir, for his constant encourage-ment and inspiration.
References
[1] D. Harvey, Modern Analytical Chemistry, first ed., McGraw Hill, USA, 1976,pp. 461–543.
[2] J.M. Schlegel, Daniel Uhr, Inorg. Chem. 12 (1973) 595–597.[3] S.B. Adeloju, D. Jagner, L. Renman, Anal. Chim. Acta. 338 (1997) 199–207.[4] M. Pesavento, G. Alberti, R. Blesuz, Anal. Chim. Acta 631 (2009) 129–131.[5] M. Burguera, J.L. Burguera, Talanta 44 (1997) 1581–1604.[6] D. Sancho, L. DebaAn, I. Campos, R. Pardo, M. Vega, Food Chem. 71 (2000)
139–145.[7] S.B. Adeloju, T.M. Young, Anal. Chim. Acta 296 (1994) 69–76.

S. Raashid et al. / Talanta 101 (2012) 246–252252
[8] E.J. Agazzi, T.D. Parks, H.A. Iefebra, L. Lykhem, Anal. Chem. 24 (1952) 1688.[9] J.D. Voorhies, J.S. Parsons, Anal. Chem. 31 (1959) 516–519.
[10] R. Kumar, S. Patil, A. Vinay, Ind. Eng. Chem. Res. 50 (2011) 12946–12959.[11] I. Bertini, H.B. Gray, S.J. Lippard, J.S. Valentine, Bioinorganic Chemistry,
University Science Books, California, 1994.[12] M. Rosette, R. Malone, Bioinorganic Chemistry, A Short Course, Wiley
Interscience, New York, 2003.[13] W.S. WanNgah, S. Fatinathan, J. Environ. Manage. 91 (2010) 958–969.[14] D.L. Vignati, M. Camusso, J. Dominika, Ecol. Modell. 184 (2005) 125–139.[15] V.K. Gupta, M.A. Khayat, A.K. Minocha, P. Kumar, Anal. Chim. Acta 532 (2005)
153–158.[16] V.K. Gupta, S. Agarwal, A. Jakob, H. Lang, Sens. Actuator B 114 (2006) 812–818.[17] V.K. Gupta, A. Kumar, R. Mangla, Sens. Actuator B 76 (2001) 617–623.[18] V.K. Gupta, Sens. Actuator B 55 (1999) 195–200.[19] V.K. Gupta, R.N. Goyal, M.A. Khayat, P. Kumar, N. Bachheti, Talanta 69 (2006)
1149–1155.[20] A.K. Jain, V.K. Gupta, P.A. Ganeshpure, J.R. Raisoni, Anal. Chim. Acta 553 (2005)
177–184.[21] M. Trojanowicza, P.W. Alexander, D.B. Hibbert, Anal. Chim. Acta 370 (1998)
267–278.
[22] S. Chandra, D.R. Singh, J. Saudi Chem. Soc. 14 (2010) 55–60.[23] B.K. Paul, S. Kar, N. Guchhait, J. Photochem. Photobiol. A 220 (2011) 153–163.[24] M. Hosseini, Z. Vaezi, M.R. Ganjali, F. Faridbod, S.D. Abkenar, K. Alizadeh,
M.S. Niasari, Spectrochim. Acta A 75 (2010) 978–982.[25] P. Singh, A.K. Singh, A.K. Jain, Electrochim. Acta 56 (2011) 5386–5395.[26] M.A. El Mhammedi, M. Achak, M. Hbid, M. Bakasse, T. Hbid, A. Chtaini,
J. Hazard. Mater. 170 (2009) 590–594.[27] A. Abbaspoura, M. Refahi, A. Khalafi-nezhad, M.N. Soltani Rad, S. Behrouz,
Anal. Chim. Acta 662 (2010) 76–81.[28] A. Shokrollahi, A. Abbaspour, M. Ghaedi, A. Naghashian Haghighi, A.H. Kianfar,
M. Ranjbar, Talanta 84 (2011) 34–41.[29] A.L. Woodson, B.H. Johnson, S.R. Cooper, Anal. Chem. 24 (1952) 1198–1199.[30] A.J. Bard, R. Parsons, J. Jordan, Standard Potentials in Aqueous Solutions,
Marcel Dekker, New York, 1985.[31] C. Daniel, Harris, Quantitative Chemical Analysis, seventh ed., W.H. Freeman
and Company, San Franciasco, 2006, pp. 234–256.[32] C.N. Reilley, R.W. Schmid, Anal. Chem. 30 (1958) 947–950.