psychological distress among refugees in germany – a
TRANSCRIPT

econstorMake Your Publications Visible.
A Service of
zbwLeibniz-InformationszentrumWirtschaftLeibniz Information Centrefor Economics
Walther, Lena et al.
Working PaperPsychological distress among refugees in Germany - A representative study on individual andcontextual risk factors and the potential consequences of poor mental health for integration inthe host country
SOEPpapers on Multidisciplinary Panel Data Research, No. 1053
Provided in Cooperation with:German Institute for Economic Research (DIW Berlin)
Suggested Citation: Walther, Lena et al. (2019) : Psychological distress among refugees inGermany - A representative study on individual and contextual risk factors and the potentialconsequences of poor mental health for integration in the host country, SOEPpapers onMultidisciplinary Panel Data Research, No. 1053, Deutsches Institut für Wirtschaftsforschung(DIW), Berlin
This Version is available at:http://hdl.handle.net/10419/204593
Standard-Nutzungsbedingungen:
Die Dokumente auf EconStor dürfen zu eigenen wissenschaftlichenZwecken und zum Privatgebrauch gespeichert und kopiert werden.
Sie dürfen die Dokumente nicht für öffentliche oder kommerzielleZwecke vervielfältigen, öffentlich ausstellen, öffentlich zugänglichmachen, vertreiben oder anderweitig nutzen.
Sofern die Verfasser die Dokumente unter Open-Content-Lizenzen(insbesondere CC-Lizenzen) zur Verfügung gestellt haben sollten,gelten abweichend von diesen Nutzungsbedingungen die in der dortgenannten Lizenz gewährten Nutzungsrechte.
Terms of use:
Documents in EconStor may be saved and copied for yourpersonal and scholarly purposes.
You are not to copy documents for public or commercialpurposes, to exhibit the documents publicly, to make thempublicly available on the internet, or to distribute or otherwiseuse the documents in public.
If the documents have been made available under an OpenContent Licence (especially Creative Commons Licences), youmay exercise further usage rights as specified in the indicatedlicence.
www.econstor.eu

SOEPpaperson Multidisciplinary Panel Data Research
1053 2019
SOEP — The German Socio-Economic Panel at DIW Berlin 1053-2019
Psychological distress among refugees inGermany – A representative study onindividual and contextual risk factors andthe potential consequences of poor mentalhealth for integration in the host countryLena Walther, Hannes Kröger, Ana Nanette Tibubos, Thi Minh Tam Ta, Christian von Scheve, Jürgen Schupp,Eric Hahn, Malek Bajbouj

SOEPpapers on Multidisciplinary Panel Data Research at DIW Berlin This series presents research findings based either directly on data from the German Socio-Economic Panel (SOEP) or using SOEP data as part of an internationally comparable data set (e.g. CNEF, ECHP, LIS, LWS, CHER/PACO). SOEP is a truly multidisciplinary household panel study covering a wide range of social and behavioral sciences: economics, sociology, psychology, survey methodology, econometrics and applied statistics, educational science, political science, public health, behavioral genetics, demography, geography, and sport science. The decision to publish a submission in SOEPpapers is made by a board of editors chosen by the DIW Berlin to represent the wide range of disciplines covered by SOEP. There is no external referee process and papers are either accepted or rejected without revision. Papers appear in this series as works in progress and may also appear elsewhere. They often represent preliminary studies and are circulated to encourage discussion. Citation of such a paper should account for its provisional character. A revised version may be requested from the author directly. Any opinions expressed in this series are those of the author(s) and not those of DIW Berlin. Research disseminated by DIW Berlin may include views on public policy issues, but the institute itself takes no institutional policy positions. The SOEPpapers are available at http://www.diw.de/soeppapers Editors: Jan Goebel (Spatial Economics) Stefan Liebig (Sociology) David Richter (Psychology) Carsten Schröder (Public Economics) Jürgen Schupp (Sociology) Sabine Zinn (Statistics) Conchita D’Ambrosio (Public Economics, DIW Research Fellow) Denis Gerstorf (Psychology, DIW Research Fellow) Katharina Wrohlich (Gender Studies) Martin Kroh (Political Science, Survey Methodology) Jörg-Peter Schräpler (Survey Methodology, DIW Research Fellow) Thomas Siedler (Empirical Economics, DIW Research Fellow) C. Katharina Spieß (Education and Family Economics) Gert G. Wagner (Social Sciences)
ISSN: 1864-6689 (online)
German Socio-Economic Panel (SOEP) DIW Berlin Mohrenstrasse 58 10117 Berlin, Germany Contact: [email protected]

Psychological distress among refugees in Germany–
A representative study on individual and contextual risk factors and the potential consequences of poor mental health for integra-
tion in the host country
Corresponding Author: Lena Walther*, MSc, Charité – Universitätsmedizin Berlin, corporate mem-ber of Freie Universität Berlin, Humboldt-Universität zu Berlin, and Berlin Institute of Health, De-partment of Psychiatry, Hindenburgdamm 30, 12203 Berlin, Germany, Email: [email protected], Tel.: +49 152 341 63638, Fax: +49 30 450 517942
Hannes Kröger*, PhD, German Institute for Economic Research (DIW), Berlin, Germany
Ana Nanette Tibubos, PhD, University Medical Center of the Johannes Gutenberg University Mainz, Department of Psychosomatic Medicine and Psychotherapy, Mainz, Germany
Thi Minh Tam Ta, MD, Charité – Universitätsmedizin Berlin, corporate member of Freie Universität Berlin, Humboldt-Universität zu Berlin, and Berlin Institute of Health, Department of Psychiatry, Berlin, Germany
Christian von Scheve, PhD, Freie Universität Berlin, Institute of Sociology, Berlin, Germany
Dr. Jürgen Schupp, PhD, Freie Universität Berlin, Institute of Sociology, and Socioeconomic Panel at the German Economic Research Institute, Berlin, Germany.
Eric Hahn, MD, Charité – Universitätsmedizin Berlin, corporate member of Freie Universität Berlin, Humboldt-Universität zu Berlin, and Berlin Institute of Health, Department of Psychiatry, Berlin, Germany
Malek Bajbouj, MD, Charité – Universitätsmedizin Berlin, corporate member of Freie Universität Berlin, Humboldt-Universität zu Berlin, and Berlin Institute of Health, Department of Psychiatry, Berlin, Germany
*made equal contributions
!1

ABSTRACT
Background: Responding to the mental health needs of refugees remains a pressing challenge world-
wide. We estimated the prevalence of psychological distress in a large refugee population in Germany
and assessed its association with host country factors amenable to policy intervention and integration
indicators.
Method: We analysed the second wave of the IAB-BAMF-SOEP, a representative Germany-wide
survey of 2,639 adult refugees who arrived between 2013 and 2016, which included the Refugee
Health Screener.
Results: Almost half of the population surveyed (41.3%[95%-CI:37.9%-44.6%]) was affected by psy-
chological distress. 10.9%(8.3%-13.4%) of the population screened positive for severe distress. Risk
of distress was particularly high for women (53%[47.1%-58.9%]), older refugees (aged ≥55:70.4%
[58.5%-82.2%]), Afghan nationals (61.2%[53.2%-69.2%]), individuals under threat of deportation
(RR:1.54[1.13-2.1]), single males (1.41[1.09-1.82]), and those in collective housing (1.2[1.02-1.42]).
Distressed males had a lower likelihood of employment (0.66[0.51-0.84]) and reduced participation in
integration courses (0.9[0.81-1.01]). Affected females were less often in education (0.43[0.18-1.04]).
Conclusions: The finding that a large minority of refugees in Germany exhibits distress calls for an
expansion of mental health services for this population. Service providers and policy-makers should
consider the increased risk among female, older and Afghan refugees, as well as among single men,
residents in collective housing and those under threat of deportation. The associations between mental
health and integration processes like labour market, educational program and integration course parti-
cipation also warrant consideration.
!2

INTRODUCTION
The development of public health policies and programs that address the needs of refugees is a press-
ing challenge for host societies worldwide. This group has repeatedly been found to be at a particular
risk of mental ill health.[1-4] Meta-analyses indicate that depression and anxiety are at least as com-
mon as PTSD[5, 6] and suggest that one or a combination of these conditions affects at least one in
three refugees.[6, 7]
However, a considerable heterogeneity of prevalence rates is reported.[4-6] Reasons for this hetero-
geneity likely include methodological differences, such as the use of different scales (with varying
levels of cultural sensitivity) and sampling procedures, or methodological short-comings such as small
and non-representative samples.[7] There are also substantive differences between the refugee popula-
tions studied – such as their cultural and national origins, their living conditions in their host countries
and varying lengths of stay since arrival.
These complications underscore the need for host country-specific, duration of stay-specific, large-
scale and representative epidemiological studies, not just to estimate prevalence rates, but also to in-
vestigate how mental health relates to other factors. So far, to our knowledge, only a few such studies
exist, including one from Sweden[8] and one from Australia.[9] The present study estimates the preva-
lence of psychological distress indicative of mental ill health using a large-scale, representative survey
of refugees who arrived in Germany between 2013 and 2016, and identifies sociodemographic charac-
teristics and postmigratory factors that put members of this population at risk. Importantly, we also
examine the relationship between psychological distress and integration, which has received limited
attention in empirical research.[10, 11]
!3

METHODS
Sample. The data analyzed in this study comes mostly from the second wave (Socio-Economic Panel
(SOEP)[12], data for years 1984-2017, version 34, SOEP, 2019,doi: 10.5684/soep.v34; partly from the
first wave also contained in v.34) of the IAB-BAMF-SOEP refugee survey, a representative total of
adults who arrived in Germany between January 1, 2013 and January 31, 2016 and applied for asylum
by June 30, 2016 and adult members of their household. As explained in detail elsewhere,[13, 14]
these central respondents were drawn from the German Central Register of Foreign Nationals (AZR),
Table 1: Population Sociodemographic Characteristics 95% Confidence Intervals (CIs) in paren-
theses. Proportions and CIs were pooled from ten multiply imputed datasets and weighted.
Sociodemographic Characteristic (Sample N)
Proportion in % (95%-CI)
Gender
Male (1630) 74.6 (72.1-77.2)
Female (939) 25.4 (22.8-27.9)
Age
Ages 18-24 (434) 28.1 (24.9-31.3)
Ages 25-34 (890) 39.7 (36.6-42.9)
Ages 35-44 (792) 20 (17.5-22.4)
Ages 45-54 (347) 7.9 (6.5-9.2)
Over 55 years old (105) 4.3 (3-5.6)
Nationality
Syrian (1372) 44.2 (41.1-47.3)
Afghan (323) 13.6 (11.4-15.9)
Iraqi (311) 8.5 (7-9.9)
Eritrean (167) 6.2 (4.9-7.5)
Other (396) 27.5 (24.1-31)
Level of education
Low level of education (1434) 58.8 (55.5-62.1)
Medium level of education (503) 23 (20.1-25.9)
High level of education (466) 18.2 (15.9-20.6)
!4

with different sampling probabilities applied based on factors such as country of origin, age, gender
and legal status to ensure the representation of different individual characteristics. Weights are provid-
ed with the survey to adjust for over- and underrepresentations.[13, 14] The first wave of the survey
comprised 4,527 adults; the response rate was 48.7%. From the total second wave sample of N =
2,639, we retained the 2,569 participants who arrived in Germany from 2013.
Respondents completed the questionnaire in computer-assisted face-to-face interviews with profes-
sional interviewers aided by audio files in seven different languages: English, German, Arabic, Farsi,
Pashtu, Urdu and Kurmanji.
The main sociodemographic characteristics of the sample (absolute values) and the population (per-
centages) under study are summarised in Table 1.
Mental health measure. We measured psychological distress encompassing symptoms of depression,
anxiety and post-traumatic stress disorder using the 13-item version of the Refugee Health Screener
(RHS).[15, 16] Its reliability and validity in a sample representative of the refugees who arrived in
Germany at the end of 2015 or the beginning of 2016 were confirmed in recent studies.[17] The binary
version of the scale has its cut-off at 11 or more points in total,[16] but also includes cut-offs for mod-
erate and severe symptom levels (18 and 25 points).[18]
Sociodemographic characteristics. We analyzed gender, age, nationality and level of education as
potential risk factors for psychological distress based on the current literature. We categorised age as
10-year bins, with all those aged 55 or older grouped into a single category due to the limited number
of older respondents. Out of the 51 nationalities represented among respondents, only nationalities
represented by at least 100 respondents were included individually in the analysis; the remaining na-
tionalities were grouped into an ‘Other’ category. Level of education was ascertained based on the In-
ternational Standard Classification of Education of 2011, grouped into ‘low’, ‘middle’ and ‘high’.
Post-migration factors. We focused on three aspects of post-migration: legal status, family constella-
tion in Germany and housing situation. We chose these factors for their potential to inform integration
policy. Legal status was divided into ‘Protected since 2016’ and ‘Protected since 2017’. The remaining
categories of the legal status categories are ‘Applicant’, ‘Suspension of Deportation’ and ‘Other’. We
created a 3-category family constellation variable from first wave data (the location of children was
!5

not ascertained again in 2017) with the following levels: all minor children and partner are in Ger-
many; at least one partner or minor child overseas; unattached (no partner or minor children). In order
to contrast residency in large collective accommodations with residency in private accommodation, we
included a bivariate housing variable.
Integration measures. We chose employment and participation in education programs and integration
courses as measures of integration, as they are essential indicators of functional integration into the
host society.[19] Our employment status variable includes any form of employment reported. Educa-
tional programs include any form of in-person education. Course participation is assessed as a binary
of having participated in at least one language or integration course.
Statistical analysis. All analyses were carried out in R (version 3.5.1). We applied survey weights
multiplied by a longitudinal weight provided with the survey data[14] in all calculations to account for
informative non-response and stratification as well as dropout between survey waves in the random
sample. Due to a small percentage of missing responses in our primary outcome variable and some
independent variables, we imputed our data using multivariate imputation using chained equations[20]
(for details of our imputation and missing proportion per variable, see the Methods and Table 1 in the
Supplementary Materials). All analyses were pooled across our ten imputed datasets using Rubin’s
Rule.[21]
In addition to the bivariate calculation of risk of psychological distress (and 95%-CIs), we estimated
risk ratios and Wald-type confidence intervals from gender-stratified multivariable Poisson regression
models, predicting the binary RHS score at the 11-point cut-off from each of the host country contex-
tual factors outlined above, adjusting for sociodemographic characteristics and year of arrival. Finally,
we estimated the risk ratios of psychological distress (binary RHS score category at the 11-point cut-
off ) as a predictor of current employment status (yes = 1 or no = 0), participation in education pro-
grams (yes = 1 or no = 0) and participation in integration courses (yes = 1 or no = 0) from gender-
stratified Poisson regression models, adjusting for sociodemographic characteristics and year of ar-
rival. All regression estimates were log-transformed to produce risk ratios (RRs). Statistical signifi-
cance in the regression models was assessed at a 0.05 P-value threshold. Please see Tables 6-11 in the
Supplementary Materials for regression results tables. The Supplementary Materials also includes the
!6

proportions of the population that falls under each variable subcategory (Table 2) and positive RHS
screening prevalences per variable subcategory (Table 3).
!7

RESULTS
Outcome variable scale reliability. The RHS-13 exhibits excellent internal reliability in our sample
(Cronbach’s alpha = 0.91). Our parallel analysis suggests a one-factor solution for the RHS-13.
Table 2: Prevalence of Different Levels of Psychological Distress by Sociodemographic Charac-
teristic in Percent 95% Confidence Intervals (CIs) in parentheses. Prevalences and CIs were pooled
from ten multiply imputed datasets and weighted. Prevalences are unadjusted. Refugee Health Screen-
er-13 cut-off scores of 11 (‘Mild’), 18 (‘Moderate’), and 25 (‘Severe’) were used.
None Mild Moderate Severe
Overall 58.7 (55.4-62.1) 19.7 (17-22.4) 10.7 (8.6-12.8) 10.9 (8.3-13.4)
Gender
Female 47 (41.1-52.9) 22.6 (17.5-27.6) 13.2 (9.3-17.1) 17.2 (11.6-22.9)
Male 62.7 (58.7-66.7) 18.7 (15.5-21.9) 9.9 (7.4-12.3) 8.7 (6-11.4)
Age
Ages 18-24 62.3 (54.9-69.7) 19 (13.2-24.7) 8.4 (4.7-12) 10.4 (4.5-16.3)
Ages 25-34 64.8 (59.9-69.7) 17.8 (13.7-21.8) 11.3 (7.7-14.9) 6.2 (3.8-8.5)
Ages 35-44 53 (46.1-59.9) 21.5 (15.6-27.4) 9.6 (5.2-14) 15.9 (9.2-22.7)
Ages 45-54 45.8 (37.5-54.2) 18.9 (12.8-25) 12.6 (7.9-17.2) 22.7 (14.8-30.6)
Over 55 years old
29.6 (17.8-41.5) 35.1 (18.8-51.4) 23 (9.1-36.8) 12.3 (0-24.7)
Nationality
Syrian 64.8 (60.8-68.8) 19.2 (16-22.4) 9.5 (6.9-12.1) 6.6 (4.5-8.6)
Afghan 38.8 (30.8-46.8) 22.5 (15.4-29.6) 19.2 (11.5-26.9) 19.6 (11.3-27.9)
Iraqi 64.8 (56.8-72.7) 16.5 (10.2-22.8) 8.2 (4.2-12.2) 10.5 (5.3-15.7)
Eritrean 75.1 (66.2-83.9) 16.5 (8.5-24.5) 6 (1.7-10.2) 2.5 (-0.1-5)
Other 53.5 (45.1-61.9) 20.8 (13.9-27.7) 10.3 (5.6-15) 15.5 (8.5-22.4)
Level of Education
Low level of education
56.7 (52.3-61.2) 20 (16.2-23.8) 11.4 (8.6-14.2) 11.9 (8.5-15.2)
Medium level of education
61.3 (53.7-68.8) 19.2 (13.4-25) 8.2 (4-12.4) 11.3 (5.8-16.9)
High level of education
62 (55.1-68.9) 19.3 (13.9-24.7) 11.7 (6.8-16.6) 7 (1.6-12.3)
!8

Prevalence of different levels of psychological distress. As shown in Table 2, overall 19.7%
(17%-22.4%) of refugees who arrived in Germany between 2013 and 2016 exhibit mild psychological
distress indicative of a need for further assessment, 10.7% (8.6%-12.8%) exhibit moderate levels of
psychological distress indicative of a need for treatment, and 10.9% (8.3%-13.4%) are estimated to be
severely distressed, indicative of an acute need for advanced care. In total, 41.3% (37.9%-44.6%)
screen positive for psychological distress, comprising symptoms of depression, anxiety and PTSD ac-
cording to the original 11-point scale cut-off for the RHS-13.
Table 2 shows that females experience more distress than males and more often require acute and ad-
vanced care for severe levels of distress (17.2% [11.6%–22.9%]). Those aged 35 or older are far more
likely than younger refugees to exhibit severe psychological distress (in 35-44 category: 47% [40.1%–
53.9%] no distress). A distinction by nationality shows that Afghans experience the most distress.
While mild distress is, broadly speaking, equally present between nationality categories, moderate and
severe distress appear to be more prevalent among Afghans, with a noteworthy 19.6% (11.3%–27.9%)
prevalence of severe distress, and in the combined category of other nations. See the Supplementary
Materials (Table 5) for a regression analysis showing that the prevalence of distress among Afghans is
not due to legal status concerns alone: this analysis was stratified to include only those fully recog-
nised as refugees, and Afghan nationality is still a risk factor. There also seems to be a trend of lower
levels of moderate and severe distress among Eritreans, with a relatively high proportion of Eritreans
in the no-distress category (75.1% [66.2%-83.9%]). The levels of distress are equally represented
among refugees of different levels of education. Table 4 of the Supplementary Materials shows the
RRs of these sociodemographic factors adjusted for one another.
Post-migration risk factors for psychological distress. Figure 1 shows the RRs of legal status, fami-
ly constellation and accommodation on psychological distress. A highly uncertain legal status, namely,
suspension of deportation, is related to an elevated risk of psychological distress (RR = 1.5 [1.13-2.1]).
For males, having been granted protection status more recently is also linked to greater distress (1.42
[1.1-1.83]).
Furthermore, males who are unattached are at an approximately 1.4 times higher risk of psychological
distress than those refugees who have their complete nuclear family in Germany ([1.1-1.8]). Living in
collective accommodation is also associated with an increase in psychological distress (1.2
!9

[1.02-1.42]). It is noteworthy that all sizeable post-migration factors are stronger for men than for
women, especially for the differences in legal status.
Psychological distress and integration. Figure 2 shows the RRs for those who screened positive on
the RHS for three indicators of integration. Values below 1 indicate that psychological distress is asso-
ciated with reduced chances of integration in the different dimensions. Psychological distress is asso-
ciated with a strongly reduced probability of being in employment in men (0.66 [0.5-0.84]). Reduc-
!10
Lega
l Sta
tus
ref:
Prot
ecte
d si
nce
2016
Nuc
lear
Fam
ily
ref:
All
in G
erm
any
Hou
sing
re
f: C
omm
unal
Figure 1: The Association Between Post-migration Factors and Psychological Distress. Risk ratio (RR) estimates and 95%-Confidence Intervals from three separate Poisson regression models predicting positive screens for psychological distress (cut-off used: 11 points on the Refugee Health Screener-13) from legal status (reference category: “Protected since 2016”), nuclear family situation (reference category: “All nuclear family members in Germany”; data from 2016, since there was no information on children in second wave), and accommodation type (reference category: “Private accommodation”), respectively, stratified and non-stratified by gender, adjusted for age, nationality, level of education and year of arrival in Germany. For the legal status regression, we omitted the non-significant results for the “Other” category, whose legal meaning is unknown, for the sake of clarity. Results are pooled from ten multiply imputed datasets and weighted. For complete regression results, please see Tables 6-8 in the Supplementary Materials.
●●●
●●
●
●●●
●●
●
●●
●
●●
●
Collective accommodation
Unattached
Nuclear family member abroad
Suspension of Deportation
Applicant
Protected since 2017
0.8 1 1.2 1.4 1.6 1.8 2 2.2RR (log scale)
●●●
AllMaleFemale
Positive Screen for Psychological Distress
Figure 2: The Association Between Psychological Distress and Indicators of Integration. Risk ratio (RR) estimates and 95%-Confidence Intervals from three separate Poisson regression models predicting current employment (binary), currently being in education (binary) and course participation (binary) from psychological distress screening status (reference category: “Negative screen”, cut-off used: 11 points on the Refugee Health Screener-13), stratified and non-stratified by gender, adjusted for age, nationality, level of education and year of arrival in Germany. Results are pooled from ten multiply imputed datasets and weighted. For complete regression results, please see Tables 9-11 in the Supplementary Materials.
●
●
●
●
●
●
●
●
●
0.2 0.4 0.6 0.8 1 1.21.4 0.2 0.4 0.6 0.8 1 1.21.4 0.2 0.4 0.6 0.8 1 1.21.4RR (log scale) RR (log scale) RR (log scale)
Posi
tive
Scre
en
●●●
AllMaleFemale
Currently in Education Participated in one or more integration coursesCurrently Employed

tions in probability in being in the educational system can also be found, especially for women (0.43
[0.18-1.04]), although the statistical uncertainty is high in this case. The participation in integration
courses is only associated with psychological distress to a lesser degree; we find no effect for women
and just a small, non-significant association for men (0.9 [0.8-1.01]).
!11

DISCUSSION
Our results provide policy makers with representative estimates of the prevalence of psychological
distress related to depression, anxiety and PTSD among refugees who arrived in Germany between
2013 and 2016. Almost half (41.3%) of the population is affected by psychological distress. More than
every tenth refugee (10.9%) exhibits severe levels of distress indicative of a need for advanced care.
Our study also identifies a risk pattern including risk factors such as female gender, older age and
Afghan nationality. We further find that post-migration factors such as insecure legal status, residing in
Germany without partner and children and living in collective accommodation are associated with
psychological distress. Finally, we show that those male refugees who are distressed are less likely to
be employed, participate in integration courses and in the education system.
Our findings indicate a disease burden similar to that established by the only comparable European
representative study on Syrian refugees in Sweden[8] that reports prevalences of depression and PTSD
of 40.2% and 29.9% , respectively. This burden is slightly higher than previously expected by German
experts, who predicted that 30% are affected by symptoms of PTSD,[22] and slightly higher than a
recent meta-analysis estimating the prevalence of depression and PTSD at between 32% and 35% each
among refugees,[7] Our estimates of the prevalence of the different levels of psychological distress
defined by Bjärtå and colleagues[18] suggest that the following treatment capacities have to be pro-
vided by the German health care system: Every tenth refugee is likely in need of acute and advanced
care, slightly more than one in ten further refugees is likely to require standard care, and one in five
have lower levels of distress that might best be remedied through lower threshold psychosocial inter-
ventions.[22, 23]
Our findings additionally provide information for a useful stratification of interventions, e.g. towards
gender-sensitive intervention: females are more often affected by mental health problems than males,
particularly by severe levels of distress. This result corroborates many previous studies on refugee[1,2]
as well as non-migrant populations.[24] In the case of refugees, gender-based violence before or dur-
ing flight and changing gender roles in the host society are likely to contribute to distress.[25] In addi-
!12

tion, the likelihood of becoming a refugee in the country of origin also varies by gender and could be
related to higher ex-ante vulnerability among women.
The role of age in refugee mental health is a twofold story in the literature. Some studies, like ours,
find older age to be a risk factor.[8] Many previous studies may not have had a sufficiently large sam-
ple size to detect the risk in this minority within most refugee populations. Beyond usual risk factors
for older populations, such as physical health problems, elevated acculturation stress due to a reduced
ability to adapt to a new environment[35] might explain these age effects. On the other hand, the liter-
ature emphasises the particular vulnerabilities of (unaccompanied) underage refugees,[10] which
could not be examined in our adult sample.
The particular risk of poor mental health among Afghan refugees, especially of moderate and severe
levels of distress, is likely related at least in part to the uncertainty Afghans have faced in Germany
since Afghanistan was classified as a safe country of origin by the German government. However, our
post-hoc analysis including only those granted full refugee status reveals that Afghans with secure sta-
tuses are still particularly at risk of distress, indicating that struggles for legal recognition may not be
the only explanation. Previous studies have highlighted the prevalence of traumatic experiences
among Afghan refugees, having come from a country in severe unrest for over three decades.[26, 27]
Looking at post-migration contextual factors, our finding that an insecure legal status is linked to
poorer mental health is in keeping with the literature. Several studies report that the process of seeking
asylum could even lead to retraumatization or hinder the process of overcoming flight-related trauma.
[28, 29] In addition to the stress of uncertainty, the reduced access to services and institutions that
comes with less secure statuses might underlie this association.[30] Importantly, we find that men who
received a protection status more recently exhibit greater distress than those who reported protection
in 2016, in the first survey wave. This might be due to longer exposure to uncertainty, but perhaps also
to stressors associated with the transition into a more permanent residence in the host country. Many
with insecure statuses will remain in the host society for long periods of time, so the psychological
burden of insecure legal statuses should be carefully considered.[31]
!13

Surprisingly, we did not find a relationship between having a nuclear family member overseas in 2016
and the psychological distress screening score in 2017. A previous study using the first wave of the
IAB-BAMF-SOEP survey did identify family separation as a stressor.[32] We do not know whether
there are some individual cases in which family members have moved to Germany between 2016 and
2017. A process of adjustment to family separation may also have occurred. Our finding that male
refugees without partners or children exhibit increased distress resonates with studies identifying so-
cial isolation as a major risk factor.[29]
We also find an association between greater distress and living in collective accommodation, as has
been previously shown.[28] Collective accommodation often means living in crowded quarters with
limited privacy, restricted autonomy and isolation from the local community. It may also come with
safety concerns in light of the frequency of attacks on refugee accommodation in many host countries.
[33]
Finally, the associations we find between a positive screen for psychological distress and employment
and, to a lesser degree, participation in education and integration courses lend support to the putative
deleterious effects of poor mental health on integration.[11] The association between unemployment
and poor mental health has been reported previously for refugees.[34] Khoo and colleagues[35] have
already argued that this association underscores the shortsightedness of failing to prioritise mental
health in immigrant and refugee communities. The potential of a vicious cycle between postmigratory
stressors, poor mental health and difficulties in integration should be taken seriously.[10, 36]
Our data do not allow us to explain why most of the associations we find between mental health and
other factors are only present for male refugees. In some cases, the statistical power is lower for
women due to the smaller number of observations, but in many cases the effect size for women is
smaller and even close to zero. Gender role expectations may render certain circumstances, such as
unemployment, more stressful for men.[37] Finally, differences in the experience of pre-migratory
traumatic experiences may also relate to differences in the impacts of stressors and functional impair-
ments.
!14

Limitations
This study’s primary limitation is its correlational nature. Due to the survey design, we are unable to
draw conclusions about causality or direction of effects. Another caveat is that our mental health mea-
sure is a diagnostic proxy, not a diagnostic tool, and does not allow for distinctions between the condi-
tions whose symptoms it comprises. Furthermore, the RHS also has not been validated in all nationali-
ties represented in our sample. While Kaltenbach and colleagues[17] validated the instrument in a
general refugee sample, their study did not examine different major refugee groups independently. A
selection bias favouring those with better mental health is likely to have been at work in the IAB-
BAMF-SOEP survey sampling procedure, as is generally to be expected in population-based surveys.
[38] Finally, whether our findings hold for other host countries and other refugee populations is un-
clear, considering the vast differences in circumstances even between Western European countries.
However, Germany is a highly relevant case because it has adopted the largest number of refugees in
the European Union.
!15

STATEMENTS
Competing Interests
None declared.
Funding
This work was supported by the German Federal Ministry of Education and Research (LW,
grant number 01UM1812BY) and the German Science Foundation, (HK and ANT, grant
number 415809395).
Data Availability
The authors have on-going full access to the IAB-BAMF-SOEP refugee survey wave v.34.,
DOI: 10.5684/soep.v34. Anyone looking to use this data for research purposes only can apply
for access by contacting the Research Data Center of the Socioeconomic Panel at the German
Economic Research Institute.
!16

REFERENCES
1. Fazel M, Wheeler J, Danesh, J. Prevalence of serious mental disorder in 7000 refugees reset-tled in western countries: a systematic review. Lancet 2005;365(9467):1309–1314. Available from: DOI:10.1016/S0140-6736(05)61027-6
2. Porter M, Haslam N. Predisplacement and postdisplacement factors associated with mental health of refugees and internally displaced persons: a meta-analysis. JAMA 2005;294(5):602–612. Available from: DOI:10.1001/jama.294.5.602
3. Steel Z, Chey T, Silove D, et al. Association of torture and other potentially traumatic events with mental health outcomes among populations exposed to mass conflict and displacement: a systematic review and meta-analysis. JAMA 2009;302(5):537–549. Available from: DOI:10.1001/jama.2009.1132
4. Bogic M, Njoku A, Priebe S. Long-term mental health of war-refugees: a systematic literature review. BMC Int Health Hum Rights 2015;15(1):29. Available from: DOI:10.1186/s12914-015-0064-9
5. Morina N, Akhtar A, Barth J, et al. Psychiatric disorders in refugees and internally displaced persons after forced displacement: a systematic review. Front Psychiatry 2018;9. Available from: DOI: 10.3389/fpsyt.2018.00433
6. Turrini G, Purgato M, Ballette F, et al. Common mental disorders in asylum seekers and refugees: umbrella review of prevalence and intervention studies. Int J Ment Health Syst 2017;11(1):51. Available from: DOI:10.1186/s13033-017-0156-0
7. Lindert J, Wehrwein A, Brähler E, et al. Anxiety, depression and posttraumatic stress disorder in refugees-a systematic review. Psychother Psychosom Med Psychol 2018;68(1):22–29. Avail-able from: DOI:10.1055/s-0043-103344
8. Tinghög P, Malm A, Arwidson C, et al. Prevalence of mental ill health, traumas and postmigra-tion stress among refugees from Syria resettled in Sweden after 2011: a population-based sur-vey. BMJ open 2017;7(12):e018899. Available from: DOI:10.1136/bmjopen-2017-018899
9. Chen W, Hall BJ, Ling L, et al. Pre-migration and post-migration factors associated with men-tal health in humanitarian migrants in Australia and the moderation effect of post-migration stressors: findings from the first wave data of the BNLA cohort study. Lancet Psychiatry 2017;4(3),218-229. Available from: DOI:10.1016/S2215-0366(17)30032-9
10. Schick M, Zumwald A, Knöpfli B, et al. Challenging future, challenging past: The relationship of social integration and psychological impairment in traumatized refugees. Eur J Psychotrau-matol 2016;7(1):28057. Available from: DOI:10.3402/ejpt.v7.28057
11. Beiser M, Goodwill AM, Albanese P, et al. Predictors of the integration of Sri Lankan Tamil refugees in Canada: pre-migration adversity, mental health, personal attributes, and post-migra-tion experience. IJHMS 2015;11(1):29–44. Available from: DOI:10.1108/IJMHSC-02-2014-0008
12. Giesselmann M, Bohmann S, Goebel J, et al. The Individual in Context(s): Research Potentials of the Socio-Economic Panel Study (SOEP) in Sociology. European Sociological Review 2019. Available from: DOI: 10.1093/esr/jcz029.
13. Kühne S, Jacobsen J, Kroh M. Sampling in Times of High Immigration: The Survey Process of the IAB-BAMF-SOEP Survey of Refugees. Survey Methods: Insights from the Field. 2019. Available from: DOI:10.13094/SMIF-2019-00005
!17

14. Kroh M, Kühne S, Jacobsen J, et al. Sampling, nonresponse, and integrated weighting of the 2016 IAB-BAMF-SOEP Survey of Refugees (M3/M4) – revised version. Berlin: DIW Berlin; 2017. 34 p. Report No.: 477. Available from: https://www.diw.de/documents/publikationen/73/diw_01.c.572346.de/diw_ssp0477.pdf.
15. Hollifield M, Verbillis-Kolp S, Farmer B, et al. The Refugee Health Screener-15 (RHS-15): development and validation of an instrument for anxiety, depression, and PTSD in refugees. Gen Hosp Psychiatry 2013;35(2):202–209. Available from: DOI:10.1016/j.genhosppsych.2012.12.002
16. Hollifield M, Toolson EC, Verbillis-Kolp S, et al. Effective screening for emotional distress in refugees: the refugee health screener. J Nerv Ment Dis 2016;204(4):247–253. Available from: DOI:10.1097/NMD.0000000000000469
17. Kaltenbach E, Härdtner E, Hermenau K, et al. Efficient identification of mental health prob-lems in refugees in Germany: the Refugee Health Screener. Eur J Psychotraumatol 2017;8(sup2):1389205. Available from: DOI:10.1080/20008198.2017.1389205
18. Bjärtå A, Leiler A, Ekdahl J, et al. Assessing Severity of Psychological Distress Among Refugees With the Refugee Health Screener, 13-Item Version. J Nerv Ment Dis 2018;206(11):834. Available from: DOI:10.1097/NMD.0000000000000886
19. Ager A, Strang A. Understanding Integration: A Conceptual Framework. J Refug Stud 2008;21:166–91. Available from: DOI:10.1093/jrs/fen016
20. van Buuren S, Groothuis-Oudshoorn K. mice: Multivariate imputation by chained equations in R. J Stat Softw 2011;45(3):1–68. Available from: DOI:10.18637/jss.v045.i03
21. Rubin, DB. Multiple Imputation for Nonresponse in Surveys. New York: John Wiley and Sons; 1987.
22. Nationale Akademie der Wissenschaften Leopoldina. Traumatisierte Flüchtlinge–schnelle Hil-fe ist jetzt nötig. Halle, Saale: Deutsche Akademie der Naturforscher Leopoldina e.V.; 2018. Available from: https://www.leopoldina.org/uploads/tx_leopublication/2018_Stellungnahme_-traumatisierte_Fluechtlinge.pdf.
23. Böge K, Karnouk C, Hahn E, et al. Mental health in refugees and asylum seekers (MEHIRA): study design and methodology of a prospective multicentre randomized controlled trail inves-tigating the effects of a stepped and collabourative care model. Eur Arch Psy Clin N 2019;22:1-2. Available from: DOI:10.1007/s00406-019-00991-5
24. Alonso J, Angermeyer JM, Bernert S, et al. Prevalence of mental disorders in Europe: results from the European Study of the Epidemiology of Mental Disorders (ESEMeD) project. Acta Psychiatr Scand 2004;109:21–27. Available from: DOI:10.1111/j.1600-0047.2004.00327.x
25. Duckles A, Barden-Maja A, Caplow J. The Medical Evaluation of the Newly Resettled Female Refugee: A Narrative Review. JRGH 2018;1(2):5. Available from: DOI:10.18297/rgh/vol1/iss2/5
26. Alemi Q, James S, Siddiq H, et al. Correlates and predictors of psychological distress among Afghan refugees in San Diego County. Int J Cult Ment Health 2015;8(3):274–288. Available from: DOI:10.1080/17542863.2015.1006647
27. Slewa-Younan S, Guajardo MGU, Yaser A, et al. Causes of and risk factors for posttraumatic stress disorder: the beliefs of Iraqi and Afghan refugees resettled in Australia. IJMHS 2017;11(1):4. Available from: DOI:10.1186/s13033-016-0109-z
!18

28. Li SS, Liddell BJ, Nickerson A. The relationship between post-migration stress and psycholog-ical disorders in refugees and asylum seekers. Current psychiatry reports 2016;18(9):82. Available from: DOI:10.1007/s11920-016-0723-0
29. Hynie M. The social determinants of refugee mental health in the post-migration context: A critical review. Can J Psychiatry 2018May;63(5):297–303. Available from: DOI:10.1177/0706743717746666
30. Nickerson A, Steel Z, Bryant R, et al. Change in visa status amongst Mandaean refugees: Re-lationship to psychological symptoms and living difficulties. Psychiatry Res 2011;187(1-2):267–274. Available from: DOI:10.1016/j.psychres.2010.12.015
31. Muižnieks N. Migrant and refugee children in Europe: Violence and detention must stop. In: United Nations. Celebrating Childhood: A Journey to end Violence Against Children. New York: UN; 2017. p. 32–35. Available from: DOI: 10.18356/9b912b1a-en
32. Walther L, Fuchs LM, Schupp J, et al. Living conditions and the mental health and well-being of refugees: Evidence from a large-scale German panel study. Berlin: DIW Berlin; 2019. 36 p. Report No.: 1029. Available from: https://www.econstor.eu/handle/10419/195293
33. Jäckle S, König PD. The dark side of the German ‘welcome culture’: Investigating the causes behind attacks on refugees in 2015. West Eur Polit 2017;40(2):223–251. Available from: DOI:10.1080/01402382.2016.1215614
34. Wright AM, Dhalimi A, Lumley MA, et al. Unemployment in Iraqi refugees: The interaction of pre and post-displacement trauma. Scand J Psychol 2016;57(6):564–570. Available from: DOI:10.1111/sjop.12320
35. Khoo SE. Health and humanitarian migrants’ economic participation. J Immigr Minor Health 2007Nov;12(3):327–339. Available from: DOI:10.1007/s10903-007-9098-y
36. Bakker L, Dagevos J, Engbersen G. The importance of resources and security in the socio-eco-nomic integration of refugees. A study on the impact of length of stay in asylum accommoda-tion and residence status on socio-economic integration for the four largest refugee groups in the Netherlands. J Int Migr Integr 2013;15(3):431–448. Available from: DOI:10.1007/s12134-013-0296-2
37. Vitale A, Ryde J. Promoting male refugees’ mental health after they have been granted leave to remain (refugee status). IJMHP 2016;18(2):106–125. Available from: DOI:10.1080/14623730.2016.1167102
38. Lundberg I, Thakker KD, Hällström T, et al. Determinants of non-participation, and the effects of non-participation on potential cause-effect relationships, in the PART study on mental disor-ders. Soc Psychiatry Psychiatr Epidemiol 2005;40(6):475-483. Available from: DOI:10.1007/s00127-005-0911-4
!19

1 Supplementary Materials: Psychological distress among refugees in Germany – A representative study on individual and contextual risk factors and the potential consequences of poor mental health for integration in the host country
Contents Methods: Imputation details Table 1: Percent Missing Values per Variable Table 2: Proportion of Population per Variable Subcategory Table 3: Positive Screening Prevalences per Variable Subcategory Table 4: Gender-stratified Poisson Regressions Predicting RHS Screening Score from Sociodemographic Factors and Year of Arrival in Germany Table 5: Legal status-stratified Poisson Regressions Predicting RHS Screening Score from Legal Status Adjusting for Sociodemographic Factors and Year of Arrival in Germany - Those with Refugee Status Only Table 6: Non-gender-stratified and Gender-stratified Poisson Regressions Predicting RHS Screening Score from Legal Status Adjusting for Sociodemographic Factors and Year of Arrival in Germany Table 7: Non-gender-stratified and Gender-stratified Poisson Regressions Predicting RHS Screening Score from Family Situation Adjusting for Sociodemographic Factors and Year of Arrival in Germany Table 8: Non-gender-stratified and Gender-stratified Poisson Regressions Predicting RHS Screening Score from Housing Situation Adjusting for Sociodemographic Factors and Year of Arrival in Germany Table 9: Non-gender-stratified and Gender-stratified Poisson Regressions Predicting RHS Screening Score from Employment Situation Adjusting for Sociodemographic Factors and Year of Arrival in Germany Table 10: Non-gender-stratified and Gender-stratified Poisson Regressions Predicting RHS Screening Score from Current Education Situation Adjusting for Sociodemographic Factors and Year of Arrival in Germany Table 11: Non-gender-stratified and Gender-stratified Poisson Regressions Predicting RHS Screening Score from Integration Course Participation Adjusting for Sociodemographic Factors and Year of Arrival in Germany

2
Methods
Imputation Details. We imputed missing data in all of the variables used for analysis through multi- variate imputation using chained equations using the mice R package (ten imputed datasets created, ten iterations, seed = 41).1
All of our analysis variables were included in the imputation. To improve its accuracy, we used several auxiliary variables selected for their theoretical relatedness to the to-be-imputed variables. Only those variables that had a minimum correlation of r = 0.1 with to-be-imputed variables were used in the imputation of these variables.2 Our auxiliary variables included: all items from the 4-item Personal Health Questionnaire from Wave 1 (two depression symptoms, two anxiety symptoms, measured on a frequency scale of 0-4), a single-item global life satisfaction scale (measured on a scale of 1-10), eight items asking respondent to what extent they worry about different things (financial situation, health, xenophobia, outcome of asylum process, having to leave Germany, not being able to return home, having to return, losing their job, measured on a scale of 1-3), self-rated German language ability (an average of self-rated German reading, writing, and speaking ability, measured on a scale of 1-5), and negative experiences during flight (any? yes/no). The sampling weights were not used as imputers. References
1. van Buuren S, Groothuis-Oudshoorn K. mice: Multivariate imputation by chained equations in R. J Stat Softw
2011;45(3):1–68. DOI:10.18637/jss.v045.i03
2. Hardt J, Herke M, Leonhart R. Auxiliary variables in multiple imputation in regression with missing X: a warning against including too many in small sample research. BMC Med Res Methodol 2012;12(1):184. DOI: 10.1186/1471-2288-12-184

Table 1: Percent Missing Values per Variable. ‘RHS’ stands for ‘Refugee Health Screener’.
Percent missing
RHS screening score 5.37
RHS four-cut-offs scores 8.56
Gender 0.00
Age 0.04
Nationality 0.00
Level of Education 6.46
Year of arrival in Germany 0.43
Legal Status 1.32
Family constellation 1.40
Housing 0.00
Employment 0.00
Currently in education 0.31
Course participation 5.22

Table 2: Proportion of Population per Variable Subcategory. Proportions and 95%-Confidence Intervals (CIs) calculated from ten multiply imputed datasets pooled using Rubin’s Rules. Weighted. Proportions are unadjusted.
All Women Men
Variable Subcategory (Sample N) Proportion in % (95% - CI)
Proportion in % (95% - CI)
Proportion in % (95% - CI)
Protected since 2016 (1371) 43.4 ( 40.4 - 46.5 ) 38 ( 32.9 - 43 ) 45.3 ( 41.5 - 49 )
Protected since 2017 (553) 24.2 ( 21.2 - 27.3 ) 31.5 ( 25.7 - 37.3 ) 21.7 ( 18.2 - 25.3 )
Applicant (390) 21.8 ( 18.8 - 24.8 ) 21.3 ( 16.2 - 26.5 ) 22 ( 18.4 - 25.6 )
Suspension of Deportation (115) 6.2 ( 4.4 - 8.1 ) 4.8 ( 2.1 - 7.5 ) 6.7 ( 4.4 - 9 )
Other (106) 4.3 ( 3.1 - 5.5 ) 4.4 ( 2.5 - 6.3 ) 4.2 ( 2.7 - 5.7 )
Private accommodation (2064) 67.1 ( 63.8 - 70.5 ) 80.1 ( 74.6 - 85.6 ) 62.7 ( 58.7 - 66.7 )
Collective accommodation (505) 32.9 ( 29.5 - 36.2 ) 19.9 ( 14.4 - 25.4 ) 37.3 ( 33.3 - 41.3 )
All in Germany (1614) 36.1 ( 33.3 - 38.9 ) 68.2 ( 62.3 - 74.2 ) 25.2 ( 22.5 - 27.9 )
Someone abroad (296) 16.9 ( 14.4 - 19.4 ) 14 ( 9.9 - 18.1 ) 17.9 ( 14.9 - 20.9 )
Unattached (629) 47 ( 43.7 - 50.3 ) 17.7 ( 12.2 - 23.3 ) 56.9 ( 53.2 - 60.6 )
Unemployed (2001) 72.6 ( 69.6 - 75.5 ) 92.1 ( 89.4 - 94.7 ) 66 ( 62.2 - 69.7 )
Employed (568) 27.4 ( 24.5 - 30.4 ) 7.9 ( 5.3 - 10.6 ) 34 ( 30.3 - 37.8 )
Currently not in education (2343) 88.7 ( 86.6 - 90.7 ) 93.9 ( 91.4 - 96.4 ) 86.9 ( 84.3 - 89.5 )
Currently in education (218) 11.3 ( 9.3 - 13.4 ) 6.1 ( 3.6 - 8.6 ) 13.1 ( 10.5 - 15.7 )
No course participation (594) 25.6 ( 22.5 - 28.7 ) 35.5 ( 29.5 - 41.4 ) 22.3 ( 18.7 - 25.9 )
At least one course attended (1841) 74.4 ( 71.3 - 77.5 ) 64.5 ( 58.6 - 70.5 ) 77.7 ( 74.1 - 81.3 )
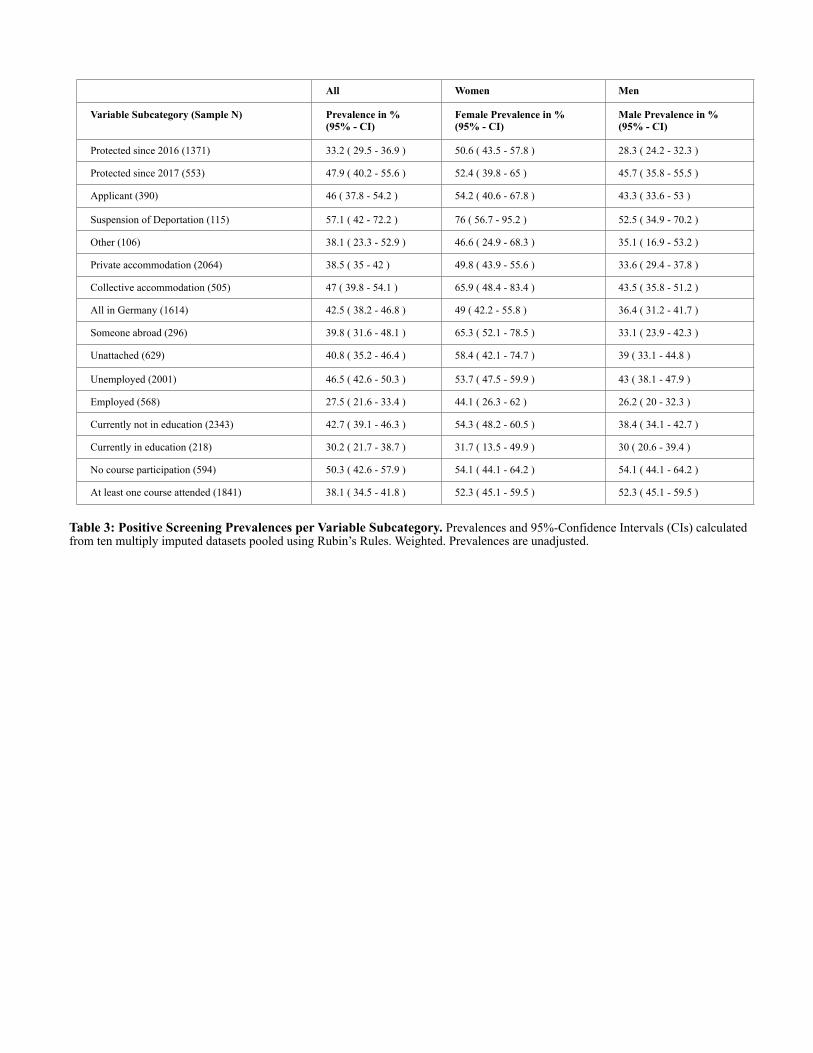
Table 3: Positive Screening Prevalences per Variable Subcategory. Prevalences and 95%-Confidence Intervals (CIs) calculated from ten multiply imputed datasets pooled using Rubin’s Rules. Weighted. Prevalences are unadjusted.
All Women Men
Variable Subcategory (Sample N) Prevalence in % (95% - CI)
Female Prevalence in % (95% - CI)
Male Prevalence in % (95% - CI)
Protected since 2016 (1371) 33.2 ( 29.5 - 36.9 ) 50.6 ( 43.5 - 57.8 ) 28.3 ( 24.2 - 32.3 )
Protected since 2017 (553) 47.9 ( 40.2 - 55.6 ) 52.4 ( 39.8 - 65 ) 45.7 ( 35.8 - 55.5 )
Applicant (390) 46 ( 37.8 - 54.2 ) 54.2 ( 40.6 - 67.8 ) 43.3 ( 33.6 - 53 )
Suspension of Deportation (115) 57.1 ( 42 - 72.2 ) 76 ( 56.7 - 95.2 ) 52.5 ( 34.9 - 70.2 )
Other (106) 38.1 ( 23.3 - 52.9 ) 46.6 ( 24.9 - 68.3 ) 35.1 ( 16.9 - 53.2 )
Private accommodation (2064) 38.5 ( 35 - 42 ) 49.8 ( 43.9 - 55.6 ) 33.6 ( 29.4 - 37.8 )
Collective accommodation (505) 47 ( 39.8 - 54.1 ) 65.9 ( 48.4 - 83.4 ) 43.5 ( 35.8 - 51.2 )
All in Germany (1614) 42.5 ( 38.2 - 46.8 ) 49 ( 42.2 - 55.8 ) 36.4 ( 31.2 - 41.7 )
Someone abroad (296) 39.8 ( 31.6 - 48.1 ) 65.3 ( 52.1 - 78.5 ) 33.1 ( 23.9 - 42.3 )
Unattached (629) 40.8 ( 35.2 - 46.4 ) 58.4 ( 42.1 - 74.7 ) 39 ( 33.1 - 44.8 )
Unemployed (2001) 46.5 ( 42.6 - 50.3 ) 53.7 ( 47.5 - 59.9 ) 43 ( 38.1 - 47.9 )
Employed (568) 27.5 ( 21.6 - 33.4 ) 44.1 ( 26.3 - 62 ) 26.2 ( 20 - 32.3 )
Currently not in education (2343) 42.7 ( 39.1 - 46.3 ) 54.3 ( 48.2 - 60.5 ) 38.4 ( 34.1 - 42.7 )
Currently in education (218) 30.2 ( 21.7 - 38.7 ) 31.7 ( 13.5 - 49.9 ) 30 ( 20.6 - 39.4 )
No course participation (594) 50.3 ( 42.6 - 57.9 ) 54.1 ( 44.1 - 64.2 ) 54.1 ( 44.1 - 64.2 )
At least one course attended (1841) 38.1 ( 34.5 - 41.8 ) 52.3 ( 45.1 - 59.5 ) 52.3 ( 45.1 - 59.5 )

Women Men
RR estimates (95%-CI) P-values RR estimates (95%-CI) P-values
Intercept 0.339 ( 0.198 - 0.582 ) < 0.0001 0.269 ( 0.17 - 0.427 ) < 0.0001Ref: Ages 18-24
Ages 25-34 1.047 ( 0.664 - 1.651 ) 0.841 0.95 ( 0.733 - 1.232 ) 0.699
Ages 35-44 1.399 ( 0.865 - 2.264 ) 0.163 1.183 ( 0.906 - 1.543 ) 0.217Ages 45-54 1.875 ( 1.197 - 2.936 ) 0.005 1.358 ( 1.001 - 1.841 ) 0.049
Over 55 years old 2.093 ( 1.302 - 3.367 ) 0.002 1.718 ( 1.16 - 2.545 ) 0.007
Ref: SyrianAfghan 1.527 ( 1.188 - 1.964 ) 0.001 1.874 ( 1.488 - 2.361 ) < 0.0001
Iraqi 1.007 ( 0.731 - 1.387 ) 0.966 1.007 ( 0.712 - 1.423 ) 0.970
Eritrean 1.162 ( 0.755 - 1.787 ) 0.495 0.683 ( 0.394 - 1.185 ) 0.175Other 1.431 ( 1.099 - 1.862 ) 0.007 1.325 ( 1.001 - 1.753 ) 0.049
Ref: Medium level of education
Low level of education 1.033 ( 0.805 - 1.326 ) 0.800 0.864 ( 0.647 - 1.153 ) 0.318High level of education 0.994 ( 0.746 - 1.323 ) 0.965 0.921 ( 0.71 - 1.194 ) 0.534
Ref: Arrived in 2013
Arrived in 2014 0.911 ( 0.652 - 1.273 ) 0.586 1.106 ( 0.716 - 1.707 ) 0.650Arrived in 2015 0.982 ( 0.696 - 1.385 ) 0.916 1.149 ( 0.763 - 1.731 ) 0.506
Arrived in 2016 1.164 ( 0.743 - 1.823 ) 0.507 1.488 ( 0.877 - 2.524 ) 0.141
Table 4: Gender-stratified Poisson Regressions Predicting RHS Screening Score from Sociodemographic Factors and Year of Arrival in Germany. Risk ratios (RR), 95%-Confidence Intervals (CIs), and P-values estimated from ten multiply imputed datasets pooled using Rubin’s Rules. Weighted. ‘Ref.’ stands for ‘Reference Category’.

Table 5: Legal status-stratified Poisson Regressions Predicting RHS Screening Score from Sociodemographic Factors and Year of Arrival in Germany- Those with Refugee Status Only. Risk ratios (RR), 95%-Confidence Intervals (CIs), and P-values estimated from ten multiply imputed datasets pooled using Rubin’s Rules. Weighted. ‘Ref.’ stands for ‘Reference Category’.
RR estimates (95%-CI) P-values
Intercept 0.182 ( 0.106 - 0.31 ) < 0.0001Ref: Male
Female 1.414 ( 1.163 - 1.718 ) 0.001
Ref: Ages 18-24
Ages 25-34 0.987 ( 0.708 - 1.375 ) 0.937
Ages 35-44 1.267 ( 0.911 - 1.762 ) 0.158
Ages 45-54 1.857 ( 1.366 - 2.526 ) < 0.0001
Over 55 years old 2.125 ( 1.512 - 2.985 ) < 0.0001
Ref: Syrian
Afghan 1.751 ( 1.321 - 2.32 ) 0.0001
Iraqi 0.903 ( 0.638 - 1.279 ) 0.566
Eritrean 0.668 ( 0.405 - 1.103 ) 0.114
Other 1.332 ( 0.96 - 1.847 ) 0.085
Ref: Medium level of education
Low level of education 1.11 ( 0.866 - 1.422 ) 0.411
High level of education 1.067 ( 0.849 - 1.342 ) 0.578
Ref: Arrived in 2013
Arrived in 2014 1.137 ( 0.66 - 1.958 ) 0.644
Arrived in 2015 1.396 ( 0.851 - 2.291 ) 0.187
Arrived in 2016 1.64 ( 0.878 - 3.064 ) 0.120

Table 6: Non-gender-stratified and Gender-stratified Poisson Regressions Predicting RHS Screening Score from Legal Status Adjusting for Sociode- mographic Factors and Year of Arrival in Germany. Risk ratios (RR), 95%-Confidence Intervals (CIs), and P-values estimated from ten multiply imputed datasets pooled using Rubin’s Rules. Weighted. ‘Ref.’ stands for ‘Reference Category’.
All Women MenRR estimates (95%-CI) P-values RR estimates (95%-CI) P-values RR estimates (95%-CI) P-values
Intercept 0.257 ( 0.181 - 0.365 ) < 0.0001 0.326 ( 0.187 - 0.57 ) < 0.0001 0.249 ( 0.155 - 0.399 ) < 0.0001
Female 1.304 ( 1.128 - 1.507 ) 0.0003
Ages 25-34 0.969 ( 0.773 - 1.213 ) 0.781 1.043 ( 0.666 - 1.633 ) 0.853 0.956 ( 0.739 - 1.237 ) 0.733
Ages 35-44 1.273 ( 1.01 - 1.605 ) 0.040 1.429 ( 0.888 - 2.301 ) 0.133 1.188 ( 0.911 - 1.549 ) 0.203
Ages 45-54 1.498 ( 1.176 - 1.908 ) 0.001 1.848 ( 1.184 - 2.886 ) 0.006 1.848 ( 1.184 - 2.886 ) 0.045
Over 55 years old 1.846 ( 1.435 - 2.374 ) < 0.0001 2.127 ( 1.324 - 3.416 ) 0.001 1.675 ( 1.171 - 2.395 ) 0.005
Afghan 1.602 ( 1.309 - 1.96 ) < 0.0001 1.552 ( 1.202 - 2.005 ) 0.001 1.57 ( 1.169 - 2.108 ) 0.003
Iraqi 0.93 ( 0.718 - 1.204 ) 0.581 1.009 ( 0.733 - 1.388 ) 0.965 0.881 ( 0.62 - 1.252 ) 0.481
Eritrean 0.783 ( 0.529 - 1.157 ) 0.219 1.171 ( 0.762 - 1.799 ) 0.471 0.63 ( 0.361 - 1.098 ) 0.103
Other 1.194 ( 0.939 - 1.52 ) 0.148 1.39 ( 1.054 - 1.832 ) 0.019 1.074 ( 0.76 - 1.519 ) 0.685
Low level of education 0.922 ( 0.751 - 1.132 ) 0.438 1.032 ( 0.804 - 1.325 ) 0.802 0.894 ( 0.669 - 1.193 ) 0.444
High level of education 0.956 ( 0.785 - 1.164 ) 0.651 1.003 ( 0.753 - 1.337 ) 0.981 0.951 ( 0.737 - 1.228 ) 0.701
Arrived in 2014 1.021 ( 0.753 - 1.384 ) 0.896 0.937 ( 0.668 - 1.315 ) 0.707 1.095 ( 0.707 - 1.696 ) 0.684
Arrived in 2015 1.074 ( 0.801 - 1.44 ) 0.633 1.021 ( 0.718 - 1.452 ) 0.907 1.117 ( 0.737 - 1.695 ) 0.601
Arrived in 2016 1.294 ( 0.875 - 1.915 ) 0.196 1.247 ( 0.787 - 1.974 ) 0.348 1.376 ( 0.815 - 2.324 ) 0.233
Protected since 2017 1.233 ( 1.031 - 1.474 ) 0.022 0.987 ( 0.802 - 1.216 ) 0.905 1.437 ( 1.113 - 1.854 ) 0.005
Applicant 1.169 ( 0.928 - 1.474 ) 0.185 0.97 ( 0.746 - 1.261 ) 0.818 1.285 ( 0.913 - 1.809 ) 0.151
Suspension of Deportation 1.535 ( 1.12 - 2.103 ) 0.008 1.405 ( 1.008 - 1.958 ) 0.045 1.639 ( 1.066 - 2.52 ) 0.024
Other status 1.001 ( 0.693 - 1.447 ) 0.994 0.833 ( 0.516 - 1.344 ) 0.452 1.131 ( 0.688 - 1.858 ) 0.627

Table 7: Non-gender-stratified and Gender-stratified Poisson Regressions Predicting RHS Screening Score from Family Situation Adjusting for Sociodemographic Factors and Year of Arrival. Risk ratios (RR), 95%-Confidence Intervals (CIs), and P-values estimated from ten multiply imputed datasets pooled using Rubin’s Rules. Weighted. ‘Ref.’ stands for ‘Reference Category’.
All Women Men
RR estimates (95%-CI) P-values RR estimates (95%-CI) P-values RR estimates (95%-CI) P-values
Intercept 0.22 ( 0.152 - 0.317 ) < 0.0001 0.328 ( 0.189 - 0.568 ) < 0.0001 0.198 ( 0.119 - 0.332 ) < 0.0001Ref: Male
Female 1.417 ( 1.234 - 1.627 ) < 0.0001
Ref: Ages 18-24
Ages 25-34 1.061 ( 0.834 - 1.35 ) 0.627 1.093 ( 0.674 - 1.772 ) 0.714 1.074 ( 0.816 - 1.415 ) 0.610
Ages 35-44 1.444 ( 1.116 - 1.867 ) 0.005 1.425 ( 0.874 - 2.326 ) 0.147 1.486 ( 1.08 - 2.044 ) 0.015
Ages 45-54 1.808 ( 1.366 - 2.392 ) 0.0003 1.902 ( 1.209 - 2.99 ) 0.005 1.856 ( 1.261 - 2.732 ) 0.002
Over 55 years old 2.069 ( 1.566 - 2.733 ) < 0.0001 2.106 ( 1.308 - 3.39 ) 0.002 2.188 ( 1.444 - 3.316 ) 0.0002
Ref: Syrian
Afghan 1.756 ( 1.464 - 2.106 ) < 0.0001 1.504 ( 1.17 - 1.932 ) 0.001 1.89 ( 1.496 - 2.389 ) < 0.0001
Iraqi 0.977 ( 0.757 - 1.261 ) 0.860 0.972 ( 0.703 - 1.343 ) 0.864 0.994 ( 0.711 - 1.392 ) 0.974
Eritrean 0.773 ( 0.525 - 1.14 ) 0.194 1.11 ( 0.727 - 1.695 ) 0.628 0.666 ( 0.383 - 1.156 ) 0.148
Other 1.318 ( 1.068 - 1.627 ) 0.010 1.401 ( 1.06 - 1.851 ) 0.017 1.278 ( 0.962 - 1.696 ) 0.090
Ref: Medium level of education
Low level of education 0.897 ( 0.733 - 1.098 ) 0.291 1.019 ( 0.794 - 1.309 ) 0.880 0.851 ( 0.642 - 1.127 ) 0.259
High level of education 0.915 ( 0.755 - 1.11 ) 0.369 0.968 ( 0.739 - 1.267 ) 0.810 0.908 ( 0.699 - 1.18 ) 0.472
Ref: Arrived in 2013
Arrived in 2014 1.009 ( 0.744 - 1.368 ) 0.953 0.904 ( 0.651 - 1.255 ) 0.546 1.088 ( 0.703 - 1.683 ) 0.706
Arrived in 2015 1.073 ( 0.803 - 1.435 ) 0.633 0.972 ( 0.693 - 1.363 ) 0.869 1.15 ( 0.761 - 1.738 ) 0.506
Arrived in 2016 1.313 ( 0.899 - 1.919 ) 0.159 1.153 ( 0.737 - 1.804 ) 0.534 1.424 ( 0.847 - 2.395 ) 0.182
Ref: All in Germany
Someone abroad 1.033 ( 0.836 - 1.277 ) 0.762 1.082 ( 0.85 - 1.378 ) 0.519 1.021 ( 0.752 - 1.386 ) 0.895
Unattached 1.333 ( 1.107 - 1.605 ) 0.002 1.182 ( 0.893 - 1.564 ) 0.241 1.409 ( 1.09 - 1.821 ) 0.009
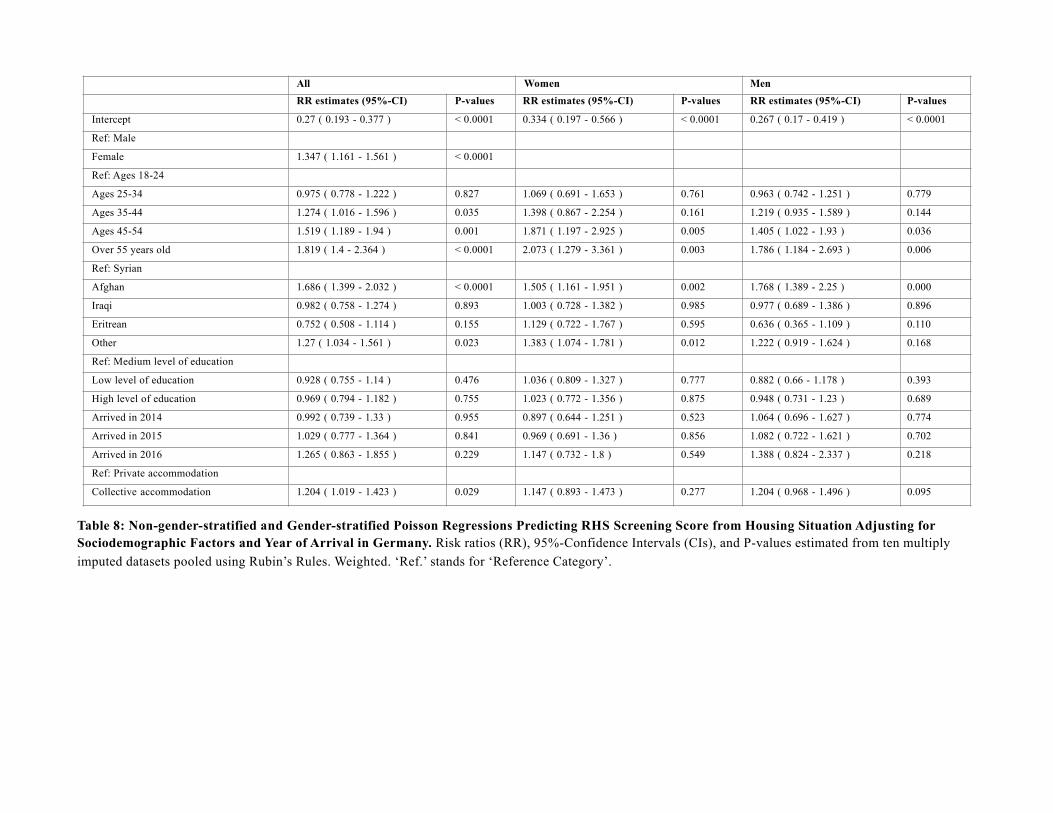
Table 8: Non-gender-stratified and Gender-stratified Poisson Regressions Predicting RHS Screening Score from Housing Situation Adjusting for Sociodemographic Factors and Year of Arrival in Germany. Risk ratios (RR), 95%-Confidence Intervals (CIs), and P-values estimated from ten multiply imputed datasets pooled using Rubin’s Rules. Weighted. ‘Ref.’ stands for ‘Reference Category’.
All Women MenRR estimates (95%-CI) P-values RR estimates (95%-CI) P-values RR estimates (95%-CI) P-values
Intercept 0.27 ( 0.193 - 0.377 ) < 0.0001 0.334 ( 0.197 - 0.566 ) < 0.0001 0.267 ( 0.17 - 0.419 ) < 0.0001
Ref: Male
Female 1.347 ( 1.161 - 1.561 ) < 0.0001
Ref: Ages 18-24
Ages 25-34 0.975 ( 0.778 - 1.222 ) 0.827 1.069 ( 0.691 - 1.653 ) 0.761 0.963 ( 0.742 - 1.251 ) 0.779
Ages 35-44 1.274 ( 1.016 - 1.596 ) 0.035 1.398 ( 0.867 - 2.254 ) 0.161 1.219 ( 0.935 - 1.589 ) 0.144
Ages 45-54 1.519 ( 1.189 - 1.94 ) 0.001 1.871 ( 1.197 - 2.925 ) 0.005 1.405 ( 1.022 - 1.93 ) 0.036
Over 55 years old 1.819 ( 1.4 - 2.364 ) < 0.0001 2.073 ( 1.279 - 3.361 ) 0.003 1.786 ( 1.184 - 2.693 ) 0.006
Ref: Syrian
Afghan 1.686 ( 1.399 - 2.032 ) < 0.0001 1.505 ( 1.161 - 1.951 ) 0.002 1.768 ( 1.389 - 2.25 ) 0.000
Iraqi 0.982 ( 0.758 - 1.274 ) 0.893 1.003 ( 0.728 - 1.382 ) 0.985 0.977 ( 0.689 - 1.386 ) 0.896
Eritrean 0.752 ( 0.508 - 1.114 ) 0.155 1.129 ( 0.722 - 1.767 ) 0.595 0.636 ( 0.365 - 1.109 ) 0.110
Other 1.27 ( 1.034 - 1.561 ) 0.023 1.383 ( 1.074 - 1.781 ) 0.012 1.222 ( 0.919 - 1.624 ) 0.168
Ref: Medium level of education
Low level of education 0.928 ( 0.755 - 1.14 ) 0.476 1.036 ( 0.809 - 1.327 ) 0.777 0.882 ( 0.66 - 1.178 ) 0.393
High level of education 0.969 ( 0.794 - 1.182 ) 0.755 1.023 ( 0.772 - 1.356 ) 0.875 0.948 ( 0.731 - 1.23 ) 0.689
Arrived in 2014 0.992 ( 0.739 - 1.33 ) 0.955 0.897 ( 0.644 - 1.251 ) 0.523 1.064 ( 0.696 - 1.627 ) 0.774
Arrived in 2015 1.029 ( 0.777 - 1.364 ) 0.841 0.969 ( 0.691 - 1.36 ) 0.856 1.082 ( 0.722 - 1.621 ) 0.702
Arrived in 2016 1.265 ( 0.863 - 1.855 ) 0.229 1.147 ( 0.732 - 1.8 ) 0.549 1.388 ( 0.824 - 2.337 ) 0.218
Ref: Private accommodation
Collective accommodation 1.204 ( 1.019 - 1.423 ) 0.029 1.147 ( 0.893 - 1.473 ) 0.277 1.204 ( 0.968 - 1.496 ) 0.095

Table 9: Non-gender-stratified and Gender-stratified Poisson Regressions Predicting RHS Screening Score from Employment Situation Adjusting for Sociodemographic Factors and Year of Arrival in Germany. Risk ratios (RR), 95%-Confidence Intervals (CIs), and P-values estimated from ten multiply imputed datasets pooled using Rubin’s Rules. Weighted. ‘Ref.’ stands for ‘Reference Category’.
All Women Men
RR estimates (95%-CI) P-values RR estimates (95%-CI) P-values RR estimates (95%-CI) P-values
Intercept 0.508 ( 0.342 - 0.753 ) 0.001 0.078 ( 0.022 - 0.274 ) < 0.0001 0.504 ( 0.332 - 0.766 ) 0.001Ref: Male
Female 0.276 ( 0.196 - 0.387 ) < 0.0001
Ref: Ages 18-24
Ages 25-34 1.005 ( 0.799 - 1.265 ) 0.964 1.847 ( 0.743 - 4.589 ) 0.187 1.005 ( 0.794 - 1.273 ) 0.964
Ages 35-44 0.646 ( 0.485 - 0.861 ) 0.003 2.331 ( 0.833 - 6.529 ) 0.107 0.573 ( 0.429 - 0.767 ) 0.0002
Ages 45-54 0.409 ( 0.269 - 0.623 ) < 0.0001 2.076 ( 0.656 - 6.572 ) 0.214 0.349 ( 0.219 - 0.558 ) < 0.0001
Over 55 years old 0.141 ( 0.054 - 0.372 ) < 0.0001 1.875 ( 0.479 - 7.342 ) 0.367 0.022 ( 0.005 - 0.102 ) < 0.0001
Ref: Syrian
Afghan 1.041 ( 0.754 - 1.437 ) 0.807 0.2 ( 0.064 - 0.62 ) 0.005 1.115 ( 0.803 - 1.547 ) 0.517
Iraqi 0.806 ( 0.557 - 1.165 ) 0.251 0.523 ( 0.203 - 1.35 ) 0.181 0.824 ( 0.563 - 1.206 ) 0.320
Eritrean 0.984 ( 0.727 - 1.332 ) 0.916 1.53 ( 0.584 - 4.007 ) 0.387 0.955 ( 0.695 - 1.311 ) 0.775
Other 1.176 ( 0.911 - 1.518 ) 0.215 1.495 ( 0.697 - 3.206 ) 0.301 1.135 ( 0.866 - 1.487 ) 0.360
Ref: Medium level of education
Low level of education 1.372 ( 1.088 - 1.729 ) 0.007 1.323 ( 0.549 - 3.191 ) 0.533 1.372 ( 1.081 - 1.74 ) 0.009
High level of education 1.127 ( 0.869 - 1.462 ) 0.366 1.239 ( 0.481 - 3.186 ) 0.656 1.106 ( 0.844 - 1.449 ) 0.465
Ref: Arrived in 2013
Arrived in 2014 1.01 ( 0.729 - 1.4 ) 0.953 0.889 ( 0.444 - 1.782 ) 0.741 1.045 ( 0.73 - 1.496 ) 0.811
Arrived in 2015 0.699 ( 0.498 - 0.981 ) 0.038 0.475 ( 0.204 - 1.104 ) 0.084 0.735 ( 0.508 - 1.064 ) 0.103
Arrived in 2016 0.301 ( 0.134 - 0.673 ) 0.004 0.117 ( 0.014 - 0.977 ) 0.048 0.34 ( 0.147 - 0.787 ) 0.012
Ref: Not employed
Employed 0.674 ( 0.533 - 0.852 ) 0.001 0.613 ( 0.277 - 1.36 ) 0.229 0.659 ( 0.514 - 0.844 ) 0.001
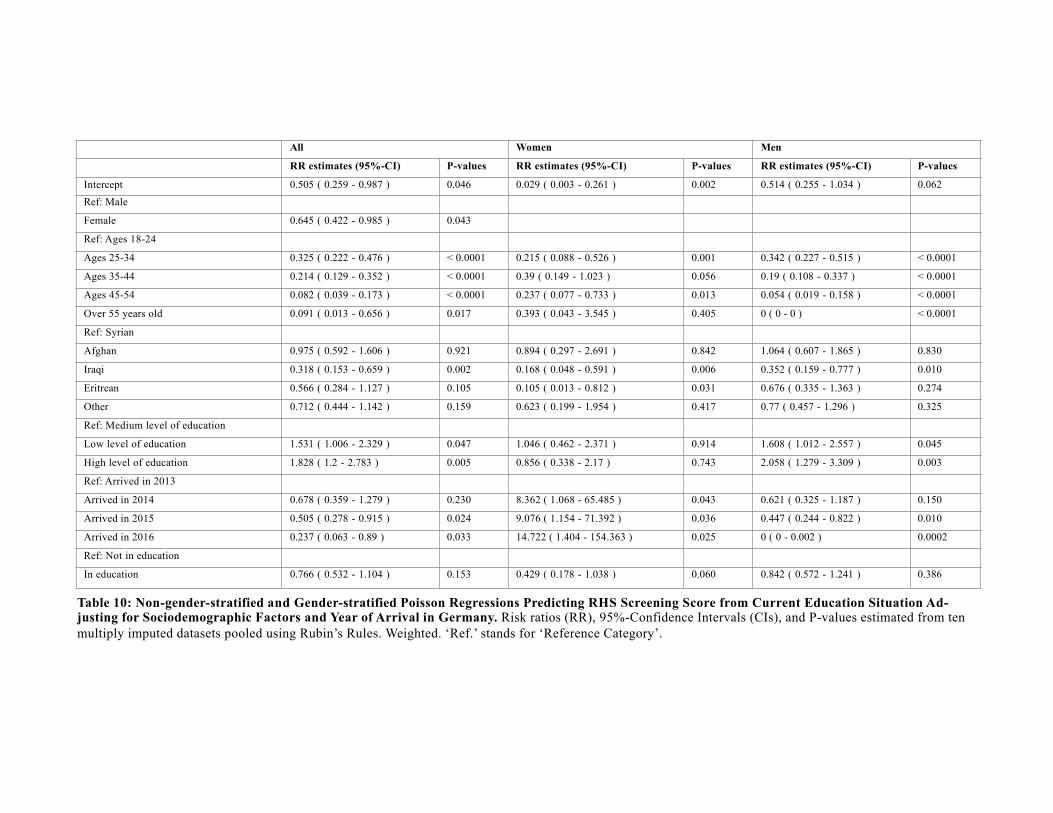
Table 10: Non-gender-stratified and Gender-stratified Poisson Regressions Predicting RHS Screening Score from Current Education Situation Ad- justing for Sociodemographic Factors and Year of Arrival in Germany. Risk ratios (RR), 95%-Confidence Intervals (CIs), and P-values estimated from ten multiply imputed datasets pooled using Rubin’s Rules. Weighted. ‘Ref.’ stands for ‘Reference Category’.
All Women Men
RR estimates (95%-CI) P-values RR estimates (95%-CI) P-values RR estimates (95%-CI) P-values
Intercept 0.505 ( 0.259 - 0.987 ) 0.046 0.029 ( 0.003 - 0.261 ) 0.002 0.514 ( 0.255 - 1.034 ) 0.062Ref: Male
Female 0.645 ( 0.422 - 0.985 ) 0.043
Ref: Ages 18-24
Ages 25-34 0.325 ( 0.222 - 0.476 ) < 0.0001 0.215 ( 0.088 - 0.526 ) 0.001 0.342 ( 0.227 - 0.515 ) < 0.0001
Ages 35-44 0.214 ( 0.129 - 0.352 ) < 0.0001 0.39 ( 0.149 - 1.023 ) 0.056 0.19 ( 0.108 - 0.337 ) < 0.0001
Ages 45-54 0.082 ( 0.039 - 0.173 ) < 0.0001 0.237 ( 0.077 - 0.733 ) 0.013 0.054 ( 0.019 - 0.158 ) < 0.0001
Over 55 years old 0.091 ( 0.013 - 0.656 ) 0.017 0.393 ( 0.043 - 3.545 ) 0.405 0 ( 0 - 0 ) < 0.0001
Ref: Syrian
Afghan 0.975 ( 0.592 - 1.606 ) 0.921 0.894 ( 0.297 - 2.691 ) 0.842 1.064 ( 0.607 - 1.865 ) 0.830
Iraqi 0.318 ( 0.153 - 0.659 ) 0.002 0.168 ( 0.048 - 0.591 ) 0.006 0.352 ( 0.159 - 0.777 ) 0.010
Eritrean 0.566 ( 0.284 - 1.127 ) 0.105 0.105 ( 0.013 - 0.812 ) 0.031 0.676 ( 0.335 - 1.363 ) 0.274
Other 0.712 ( 0.444 - 1.142 ) 0.159 0.623 ( 0.199 - 1.954 ) 0.417 0.77 ( 0.457 - 1.296 ) 0.325
Ref: Medium level of education
Low level of education 1.531 ( 1.006 - 2.329 ) 0.047 1.046 ( 0.462 - 2.371 ) 0.914 1.608 ( 1.012 - 2.557 ) 0.045
High level of education 1.828 ( 1.2 - 2.783 ) 0.005 0.856 ( 0.338 - 2.17 ) 0.743 2.058 ( 1.279 - 3.309 ) 0.003
Ref: Arrived in 2013
Arrived in 2014 0.678 ( 0.359 - 1.279 ) 0.230 8.362 ( 1.068 - 65.485 ) 0.043 0.621 ( 0.325 - 1.187 ) 0.150
Arrived in 2015 0.505 ( 0.278 - 0.915 ) 0.024 9.076 ( 1.154 - 71.392 ) 0.036 0.447 ( 0.244 - 0.822 ) 0.010
Arrived in 2016 0.237 ( 0.063 - 0.89 ) 0.033 14.722 ( 1.404 - 154.363 ) 0.025 0 ( 0 - 0.002 ) 0.0002
Ref: Not in education
In education 0.766 ( 0.532 - 1.104 ) 0.153 0.429 ( 0.178 - 1.038 ) 0.060 0.842 ( 0.572 - 1.241 ) 0.386
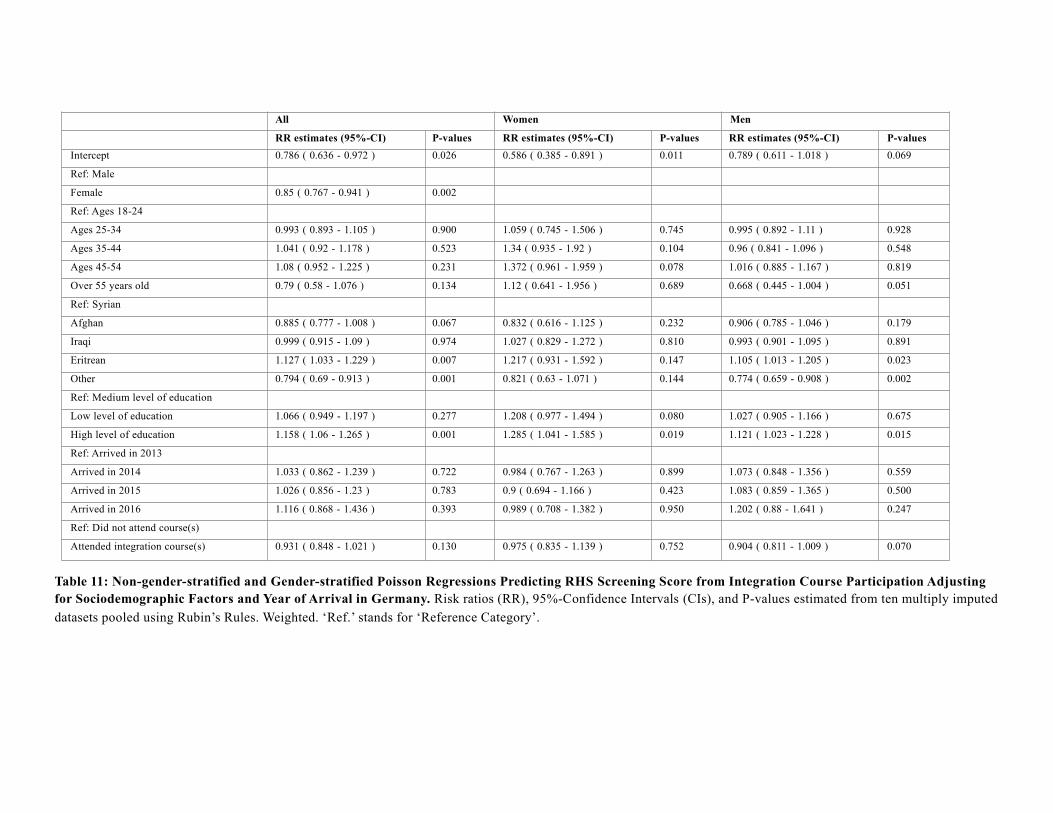
Table 11: Non-gender-stratified and Gender-stratified Poisson Regressions Predicting RHS Screening Score from Integration Course Participation Adjusting for Sociodemographic Factors and Year of Arrival in Germany. Risk ratios (RR), 95%-Confidence Intervals (CIs), and P-values estimated from ten multiply imputed datasets pooled using Rubin’s Rules. Weighted. ‘Ref.’ stands for ‘Reference Category’.
All Women Men
RR estimates (95%-CI) P-values RR estimates (95%-CI) P-values RR estimates (95%-CI) P-valuesIntercept 0.786 ( 0.636 - 0.972 ) 0.026 0.586 ( 0.385 - 0.891 ) 0.011 0.789 ( 0.611 - 1.018 ) 0.069
Ref: Male
Female 0.85 ( 0.767 - 0.941 ) 0.002
Ref: Ages 18-24
Ages 25-34 0.993 ( 0.893 - 1.105 ) 0.900 1.059 ( 0.745 - 1.506 ) 0.745 0.995 ( 0.892 - 1.11 ) 0.928
Ages 35-44 1.041 ( 0.92 - 1.178 ) 0.523 1.34 ( 0.935 - 1.92 ) 0.104 0.96 ( 0.841 - 1.096 ) 0.548
Ages 45-54 1.08 ( 0.952 - 1.225 ) 0.231 1.372 ( 0.961 - 1.959 ) 0.078 1.016 ( 0.885 - 1.167 ) 0.819
Over 55 years old 0.79 ( 0.58 - 1.076 ) 0.134 1.12 ( 0.641 - 1.956 ) 0.689 0.668 ( 0.445 - 1.004 ) 0.051
Ref: Syrian
Afghan 0.885 ( 0.777 - 1.008 ) 0.067 0.832 ( 0.616 - 1.125 ) 0.232 0.906 ( 0.785 - 1.046 ) 0.179
Iraqi 0.999 ( 0.915 - 1.09 ) 0.974 1.027 ( 0.829 - 1.272 ) 0.810 0.993 ( 0.901 - 1.095 ) 0.891
Eritrean 1.127 ( 1.033 - 1.229 ) 0.007 1.217 ( 0.931 - 1.592 ) 0.147 1.105 ( 1.013 - 1.205 ) 0.023
Other 0.794 ( 0.69 - 0.913 ) 0.001 0.821 ( 0.63 - 1.071 ) 0.144 0.774 ( 0.659 - 0.908 ) 0.002
Ref: Medium level of education
Low level of education 1.066 ( 0.949 - 1.197 ) 0.277 1.208 ( 0.977 - 1.494 ) 0.080 1.027 ( 0.905 - 1.166 ) 0.675
High level of education 1.158 ( 1.06 - 1.265 ) 0.001 1.285 ( 1.041 - 1.585 ) 0.019 1.121 ( 1.023 - 1.228 ) 0.015
Ref: Arrived in 2013
Arrived in 2014 1.033 ( 0.862 - 1.239 ) 0.722 0.984 ( 0.767 - 1.263 ) 0.899 1.073 ( 0.848 - 1.356 ) 0.559
Arrived in 2015 1.026 ( 0.856 - 1.23 ) 0.783 0.9 ( 0.694 - 1.166 ) 0.423 1.083 ( 0.859 - 1.365 ) 0.500
Arrived in 2016 1.116 ( 0.868 - 1.436 ) 0.393 0.989 ( 0.708 - 1.382 ) 0.950 1.202 ( 0.88 - 1.641 ) 0.247
Ref: Did not attend course(s)
Attended integration course(s) 0.931 ( 0.848 - 1.021 ) 0.130 0.975 ( 0.835 - 1.139 ) 0.752 0.904 ( 0.811 - 1.009 ) 0.070