psychophysical assessment of visual function as an o.d. you will measure (assess) vision. how well...
TRANSCRIPT
Psychophysical Assessment
of Visual Function
As an O.D. you will measure (assess) vision.
How well does the person see?
Results depend on how you make the measurement
You: Any problems with your vision?
Pt: Don’t seem to see so well, Doc.
What do you do (how do you learn how well the patient sees)?

You measure the patient’s vision.
This course is about the science that stands behind why you measure vision certain ways in the clinic.

Which chart to use? How many letters per line? How far apart are the
letters and lines? How much smaller are the
letters on the next line? Which letters to use? How far down the chart
must the patient try to read?
How score the result?
There are many different eye charts
The acuity you get will differ depending these factors

It is a matter of judgment that determines how the visual system is tested and what constitutes normal variation in sensory processes.
The clinician must understand the scientific basis on which these judgments are made and how they can be made in the future as new tests of visual function are developed. That’s what this course is about
and why it is clinically relevant

Dr. Tom Norton
606 Worrell Building
934-6742
Graduate Student Teaching Assistant:
Jason Wilson

Class – Mon- 9-10:50
Tues, 9-10:50
Wed, 11:00–11:50
Lab on 4 Thursdays
Check the schedule for your day and time
(Schedule will be distributed tomorrow)
This week: Group C 1-3; gp A 3-5

Exams #1 Wed. Jan. 19 (100 pts) Ch 1-3
#2 Tues. Feb. 8 (100 pts) Ch 4-5
Final during Final Exam Period (130 pts)
(110 pts new, 20 pts cumulative)
Labs (4 x 10 pts)
Possible pop quizzes (up to 30 pts total)
Total possible points, 370 (up to 400)
Letter grade determined @ end of course

LabsAttend at the assigned day and time
(unless you make other arrangements with Dr. Norton in advance)
Lab Reports due at Monday class after your lab
Accurately recording and graphing your data is an important part of your lab grade

Student-submitted exam questions
A way to control your own future!
Procedure:
Due several days before exam (email or Word files preferred)
Norton reviews, corrects, photocopies
Distributed to class (can use as a study guide)
Some of the questions will be used on the exam

Three main purposes of course
1) Learn how vision is measured (scientific basis)
2) Basic facts about monocular visual function
What is normal?
3) Neural basis of visual function
Why does the visual system respond as it does?

Textbook
The Psychophysical Measurement of Visual Function
Norton*, Corliss, Bailey
Richmond Products, Inc
(*TTN’s author royalties [$2420.41 so far] donated to the UABSO)

We will cover 9 Chapters
1) Principles of Psychophysical Measurement
2) Absolute Threshold of Vision
3) Intensity Discrimination
4) Adaptation to Light and Dark
5) Spatial Acuity
6) Spatial Vision
7) Temporal Factors in Vision
Skip Chapter 8 (color)
8) Postnatal Human Vision Development
9) The Aging Visual System

Overview
At the beginning of each chapter.
Contains a summary of the content of the chapter.
Declarative section headings summarize the section they precede
“In the Method of Constant Stimuli the examiner randomly presents a set of stimuli with fixed, predetermined values”
“Correct for guessing by incorporating catch trials”

Study Guide
Questions at the end of each chapter intended to help you clarify your knowledge – (not as useful as I had hoped)
Lecture overlaps with the book a lot
… but questions also come from the book on topics I don’t cover in class!

Glossary – intended to help you know what terms mean for exam
Definitions given in the text – definite full credit if you know them verbatim
Equations – must tell what the variables mean

Equations – must tell what the variables mean
“What is the Stevens Power Function?”
where (psi) is the sensory magnitude, (kappa) is an arbitrary constant determining the scale unit, (phi) is the stimulus magnitude, and (alpha) is an exponent that is characteristic of the stimulus used.

Graphs – The hardest part of this class
(because they tend to all look alike)
… but important because they show the relationship between stimuli and responses

Graphs – how to dissect and learn them
What is on the X-axis? (& approx. scale)
Physical Stimulus on X-axis (Independent Variable)
Usual arrangement:

Graphs – how to dissect and learn them
What is on the X-axis? (& approx. scale)
What is on the Y-axis? (& approx. scale)
Response on Y-axis
What you are measuring(Dependent Variable)
Usual arrangement:
Physical Stimulus on X-axis (Independent Variable)

Graphs – how to dissect and learn them
What is on the X-axis? (& approx. scale)
What is on the Y-axis? (& approx. scale)
How plot a data point?
Physical Stimulus on X-axis
(Independent Variable)
Usual arrangement:
Response on Y-axis
What you are measuring(Dependent Variable)

Graphs
What is different in each graph in a “family” of curves?
Flash Duration (s)
0.001 0.01 0.1 1 10 100
4
5
6
7
8
9
Log Threshold Luminance(quanta/s/deg2)
Stimulus area = 0.011 deg2
Log Background Intensity
7.83 5.94 4.96 3.65 No Background

Lots of details to learn.
Philosophy: better to have learned and forgotten than to not have learned in the first place.
example

“Joke break”
Break the monotony
… but remember that the course has a serious purpose, and the exams can be difficult.
Student Response System
Test to see if it works Will use for feedback Will not look at who responds
Set to room code (23)

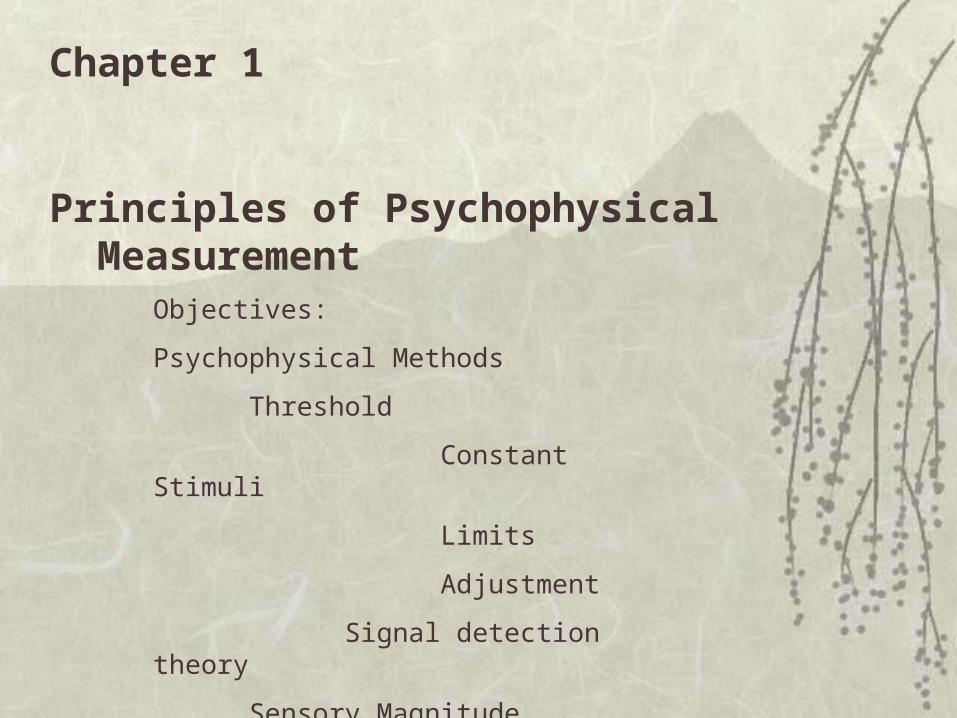
Chapter 1
Principles of Psychophysical Measurement
Objectives:
Psychophysical Methods
Threshold
Constant Stimuli
Limits
Adjustment
Signal detection theory
Sensory Magnitude
Definition:
Psychophysics is the study
of the relationship
between physical stimuli
and perceptual responses
We study visual psychophysics, but there also is auditory psychophysics, somatosensory psychophysics, etc.
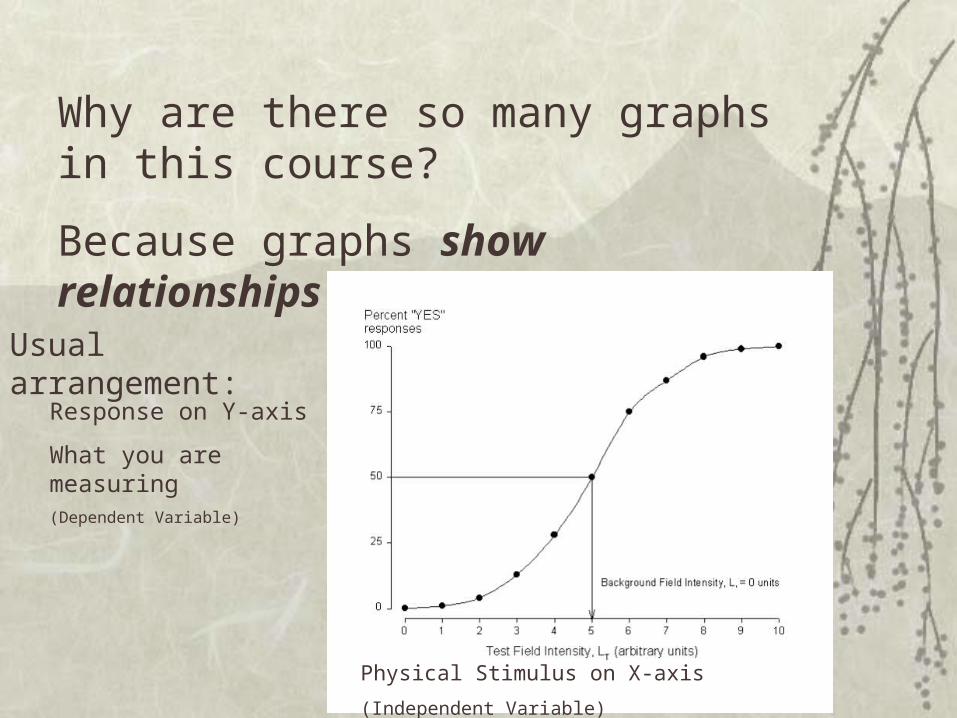
Why are there so many graphs in this course?
Because graphs show relationships
Physical Stimulus on X-axis
(Independent Variable)
Usual arrangement:
Response on Y-axis
What you are measuring(Dependent Variable)

Two basic types
of psychophysical measures
1) Threshold measures (Do you see it”)
2) Sensory Magnitude measures
(“What does it look like”)

Threshold measure:
Psychophysics is the study of the relationship
between physical stimuli and perceptual responses
Do you see the light?
Physical stimulus – light intensity
Perceptual response – Seeing the light

How far down an eye chart can you read?
Physical stimulus – Letter size
Perceptual response – Identifying letters
Threshold measure:
Psychophysics is the study of the relationship
between physical stimuli and perceptual responses

letter size is the stimulus identifying letters is
response
We use psychophysical tools to find the threshold – the letter size you can see 50% of the time

Sensory Magnitude:
Psychophysics is the study of the relationship
between physical stimuli and perceptual responses
Which is better, 1 or 2?
Physical stimulus – Lens power
Perceptual response – Clarity of the image

Why study psychophysics?Psychophysical measurements are
fundamental in clinical practice
Need to know the scientific basis for measuring vision
The results you get depend on the way you measure vision
New clinical tools will be developed after you graduate – you need the knowledge base to understand how they work and evaluate whether they are useful in your practice.
Psychophysics questions have been plentiful on the boards

Psychophysical measurements
are used for descriptive and for analytical purposes
and to follow the course of treatment

Visual thresholds are the most common psychophysical measurement

Definition
Threshold is defined as the minimum value of a
stimulus required to elicit a perceptual response or an
altered perceptual response.
Two types of threshold measurement:
absolute threshold (in vision) is the minimum value of
a stimulus required to detect the presence of light
under ideal conditions. (Ch. 2)
A difference (or increment) threshold is defined as
the minimum change in stimulus value that must be
added or subtracted to a stimulus to elicit an altered
perceptual response. (Ch. 3)

The task required of a patient or subject during threshold
measurements varies in complexity
detection task – (in vision) does the subject or patient see
something?
discrimination task – (in vision) distinguishing between two
stimuli with regard to some stimulus characteristic when each
stimulus is visible by itself.
recognition task. – providing a name or category of a test object
that is visible.
The distinctions among these various types of tasks are not sharp,
but are hierarchical.

Important Stimulus Dimensions
intensity
wavelength
size
exposure duration
frequency
shape
relative locations of elements of the stimulus
cognitive meaning
In addition,(NOT stimulus Dimensions!)
location on the subject’s retina
light adaptation of the subject’s visual system

Key in measuring thresholds: Try to keep all dimensions unchanged except the one being measured
Stimulus Configurations
Spot on an adapting field (increment thresholds)
Bipartite field
Bipartite field with an adapting field
Spatially separated stimuli (difference thresholds)


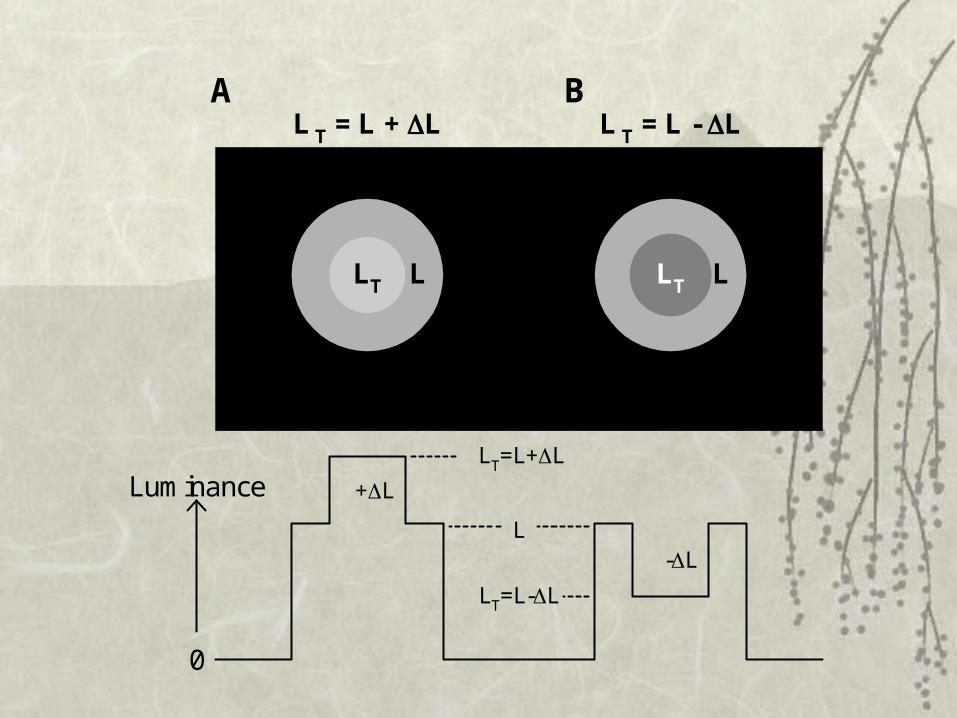
LLTLLT
L T = L + L L T = L - L
L
LT=L+L
LT=L-L
+L
-L
0
A B
Luminance

There are many possible values of L,
But only 1 value (theoretically) for
threshold L
(demo)

Definition
Threshold is defined as the minimum value of a
stimulus required to elicit a perceptual response or an
altered perceptual response.
LLTLLT
L T = L + L L T = L - L
L
LT=L+L
LT=L-L
+L
-L
0
A B
Luminance

Definition
Threshold is defined as the minimum value of a
stimulus required to elicit a perceptual response or an
altered perceptual response.
But threshold can vary over time (somewhat)
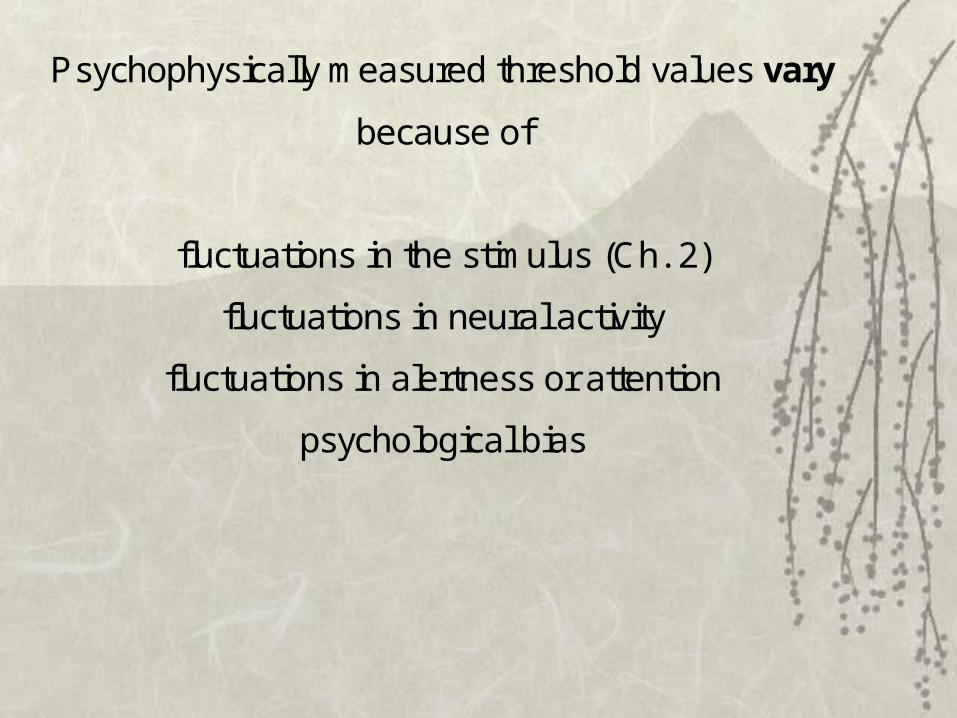
Psychophysically measured threshold values vary
because of
fluctuations in the stimulus (Ch. 2)
fluctuations in neural activity
fluctuations in alertness or attention
psychological bias

Fluctuations in neural activity

For us to see, neural signals must leave the retina and travel to central brain structures.
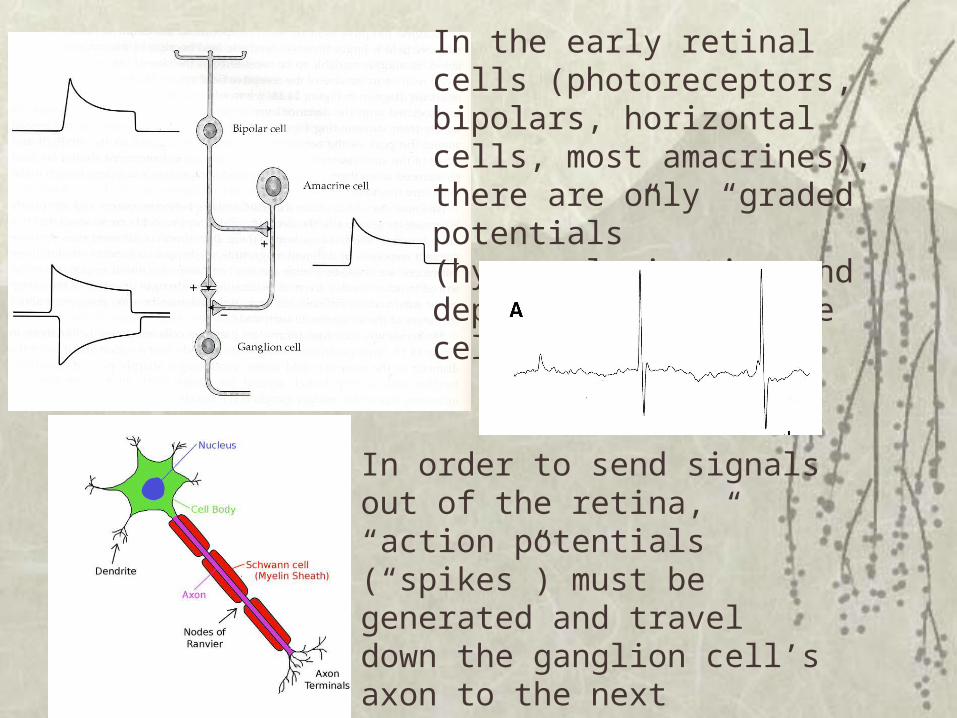
In the early retinal cells (photoreceptors, bipolars, horizontal cells, most amacrines), there are only “graded potentials” (hyperpolarization and depolarization of the cell)
In order to send signals out of the retina, “action potentials” (“spikes”) must be generated and travel down the ganglion cell’s axon to the next location (lateral geniculate nucleus, then to visual cortex)

Graded potentials
The signal changes from graded potentials (voltage changes) into a “digital signal” in which the number of action potentials per second (firing rate) carries the visual signal.

We can “eavesdrop” on the neurons in the visual pathway with a microelectrode, nestled up against a neuron or its axon and record the responses (number of spikes per second) in response to visual stimuli.
B: Action potentials recorded from a single LGN neuron. The same stimulus (a spot of light positioned in the “receptive field” was presented many 20 times. A: a “histogram” of the cell’s responses

0 . 0 0 . 5 1 . 0 1 . 5 2 . 0 2 . 5 3 . 0O n O f fT i m e ( s )
R e s p o n s e s o f a n e u r o n i n t h e l a t e r a l g e n i c u l a t e n u c l e u s o f a n a n e s t h e t i z e d c a t t o t h r e e s e p a r a t e p r e s e n t a t i o n s o f a n e a r - t h r e s h o l d v i s u a l s t i m u l u s . E a c h s m a l l v e r t i c a l l i n e r e p r e s e n t s a n a c t i o n p o t e n t i a l p r o d u c e d b y t h e n e u r o n . E a c h r o w s h o w s t h e r e s p o n s e s o f t h e n e u r o n i n a 3 s p e r i o d . F r o m 0 u n t i l 2 . 5 s a b a c k g r o u n d l u m i n a n c e w a s p r e s e n t . T h e s t i m u l u s ( a l i g h t ) w a s t u r n e d o n a t 2 . 5 s a n d t u r n e d o f f a t 3 . 0 s , s o t h e s t i m u l u s w a s o n f o r o n l y 0 . 5 s . ( U n p u b l i s h e d d a t a f r o m D . W . G o d w i n a n d T . T . N o r t o n , . )
Action potentials recorded from a single LGN neuron
Neural fluctuations: the neuron sometimes responds more, sometimes less, to the same stimulus.
Also, the neuron has variable background (“maintained”) activity that makes it hard for the neuron to detect when the stimulus is present.

Psychophysically measured threshold values vary
because of
fluctuations in the stimulus
fluctuations in neural activity
fluctuations in alertness or attention
psychological bias
This leads us to consider threshold as a probability that a stimulus is detected and to find the stimulus value that is detected 50% of the time (or some other criterion value)

Threshold Determination Methods
Method of Constant Stimuli
Method of Limits
-Staircase
-Tracking
Method of Adjustment
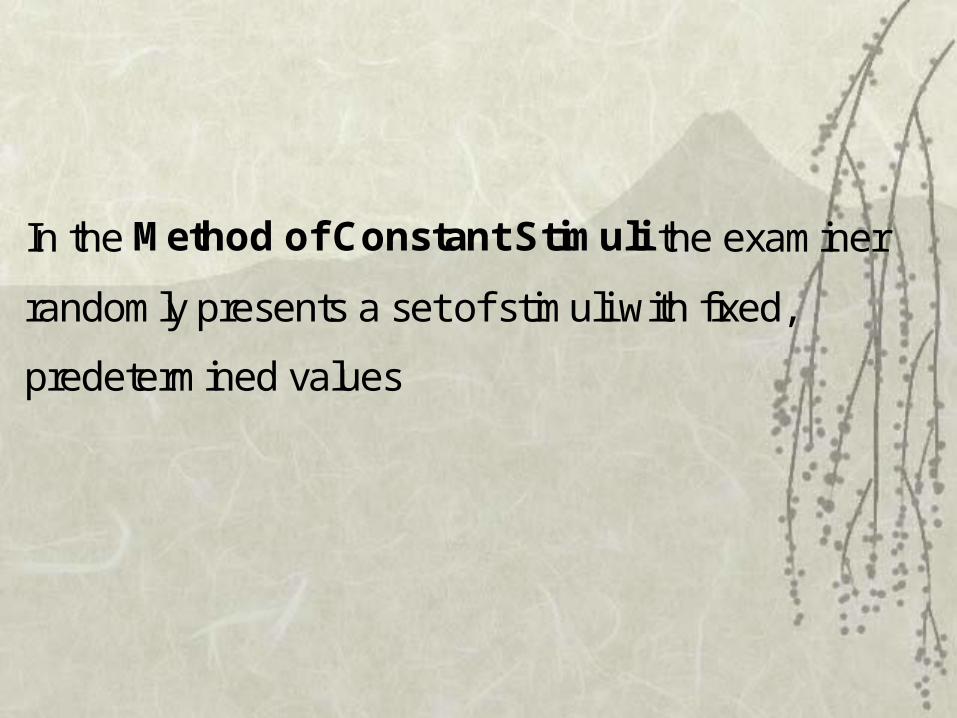
In the Method of Constant Stimuli the examiner
randomly presents a set of stimuli with fixed,
predetermined values

Test Field Intensity, LT (arbitrary units)
0 1 2 3 4 5 6 7 8 9 10
Percent "YES" responses
0
25
50
75
100
Background Field IntensityL = 0 units
Figure 1-4. Idealized psychometric function for a threshold detection task using the Method of Constant Stimuli. The threshold stimulus value is obtained by drawing a horizontal line from the 50% value on the response axis to the psychometric function and then dropping a vertical line from the function to the test field intensity axis.

In Class Demo

Rule: Plot straight lines between data points

“Silliest Plotting Error”
Plot data points from left to right

“Silliest Plotting Error”
Plot data points from left to right

“Most Interesting Curves”

Test Field Intensity, LT (arbitrary units)
0 1 2 3 4 5 6 7 8 9 10
Percent "YES" responses
0
25
50
75
100
Background Field IntensityL = 0 units
Figure 1-4. Idealized psychometric function for a threshold detection task using the Method of Constant Stimuli. The threshold stimulus value is obtained by drawing a horizontal line from the 50% value on the response axis to the psychometric function and then dropping a vertical line from the function to the test field intensity axis.
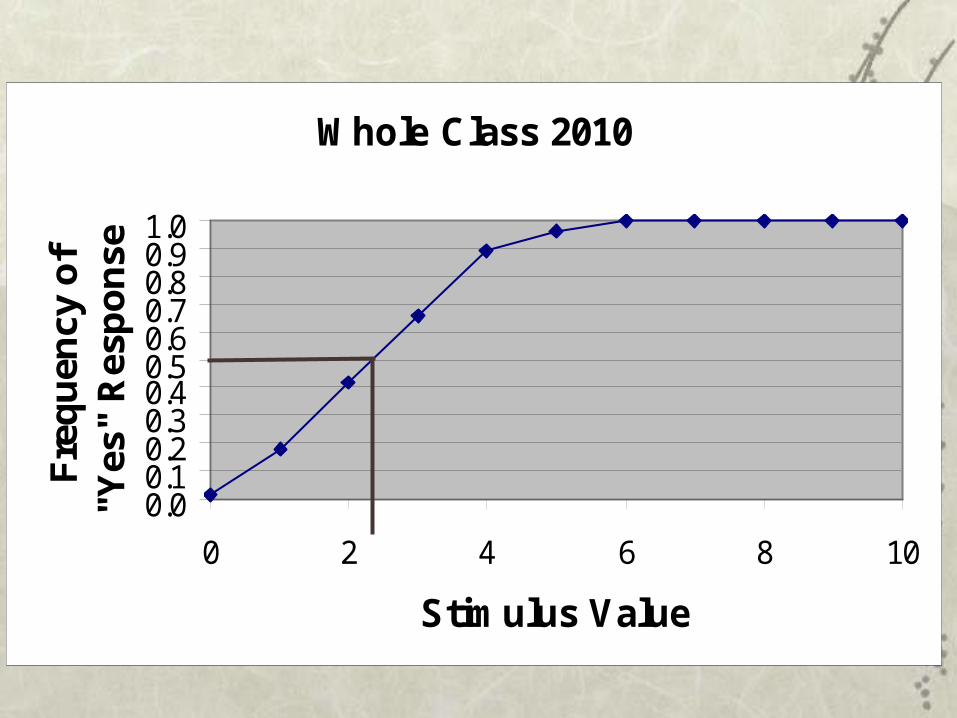
Whole Class 2010
0.00.10.20.30.40.50.60.70.80.91.0
0 2 4 6 8 10
Stimulus Value
Fre
qu
ency
of
"Yes
" R
esp
on
se

Front Rows (1-3)
0.00.10.20.30.40.50.60.70.80.91.0
0 1 2 3 4 5 6 7 8 9 10
Stimulus Value
Fre
qu
en
cy
of
"Ye
s"
Re
sp
on
se

Back Rows (4-6)
0.00.10.20.30.40.50.60.70.80.91.0
0 1 2 3 4 5 6 7 8 9 10
Stimulus Value
Fra
ctio
n o
f "Y
es"
Res
po
nse
s

One point (added to the exam #1 grade) to the first
person to correctly tell me:
Why might the threshold be lower for the front half of
the room?
Hint: think about a stimulus parameter that might
change from the front to the back of the room.

The Importance of Using Straight Lines to Connect Data Points
1) The data points are the only evidence we have of threshold
2) We assume a linear progression from one data point to the next
3) Can use linear interpolation to determine the threshold accurately
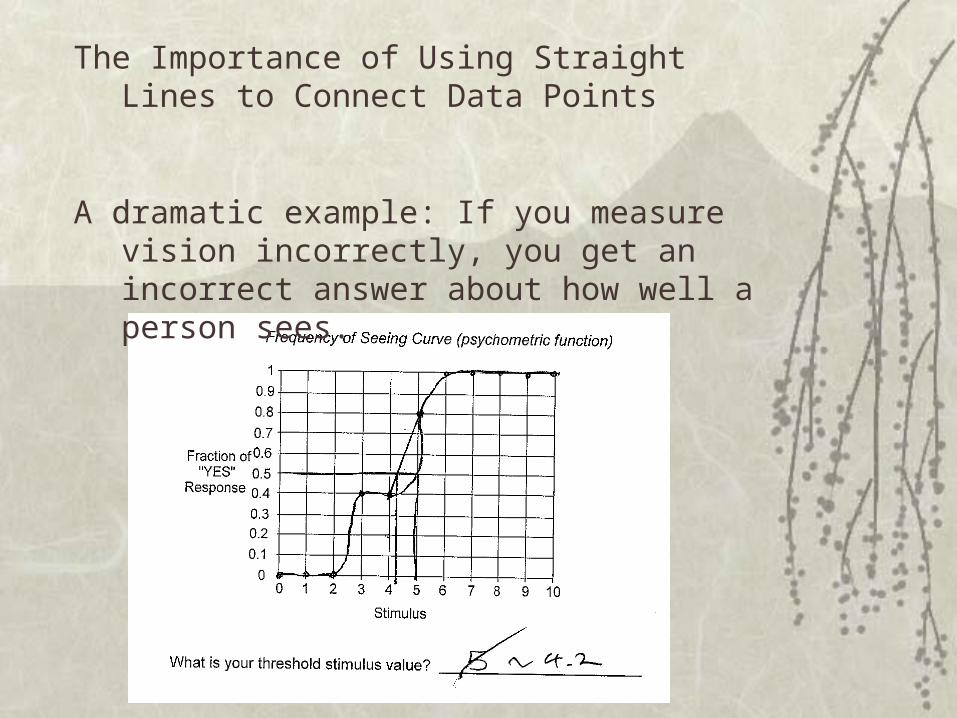
The Importance of Using Straight Lines to Connect Data Points
A dramatic example: If you measure vision incorrectly, you get an incorrect answer about how well a person sees.

Another way to mis-estimate threshold
We are looking for the 50% point, not the closest data point, so we use linear interpolation

We want to measure threshold as accurately as possible. Why be satisfied with “6” when 5.8 is more accurate?
The Method of Constant Stimuli is the most precise
method for determining threshold (the “Gold
Standard”).
But, this method is cumbersome and time-consuming
so it is rarely, if ever, used in clinical practice.

Threshold Determination Methods
Method of Constant Stimuli
Method of Limits
-Staircase
-Tracking
Method of Adjustment

What is another name for the psychometric function?
1. Threshold line
2. Frequency-of-seeing curve
3. Method of Constant Stimuli
4. Power function

In the Method of Limits the examiner sequentially
presents a set of stimuli with fixed values
Trial Number (Stimulus Presentation Direction)Stimulus Value 1
(Ascending)2
(Descending)3
(Ascending)4
(Descending)5
(Ascending)1 N N N2 N N N N3 Y N N Y4 N Y Y N Y5 N Y Y N6 Y Y Y7 Y Y N8 Y Y9 Y10 Y Average
Transition 5.5 3.5 3.5 5.5 2.5 4.1
Table 1- 1. Example of subject’s responses over five trials using themethod of limits.

In Class Demo

The Method of Limits is more efficient than the
Method of Constant Stimuli because fewer trials are
presented.
Two potential problems:
anticipation
perseveration

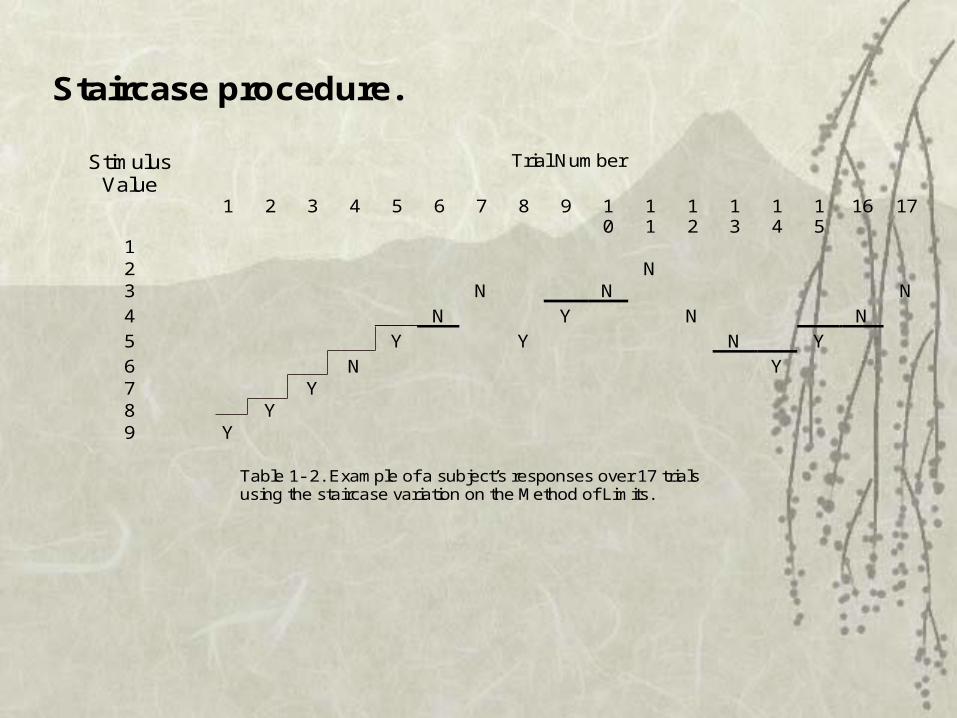
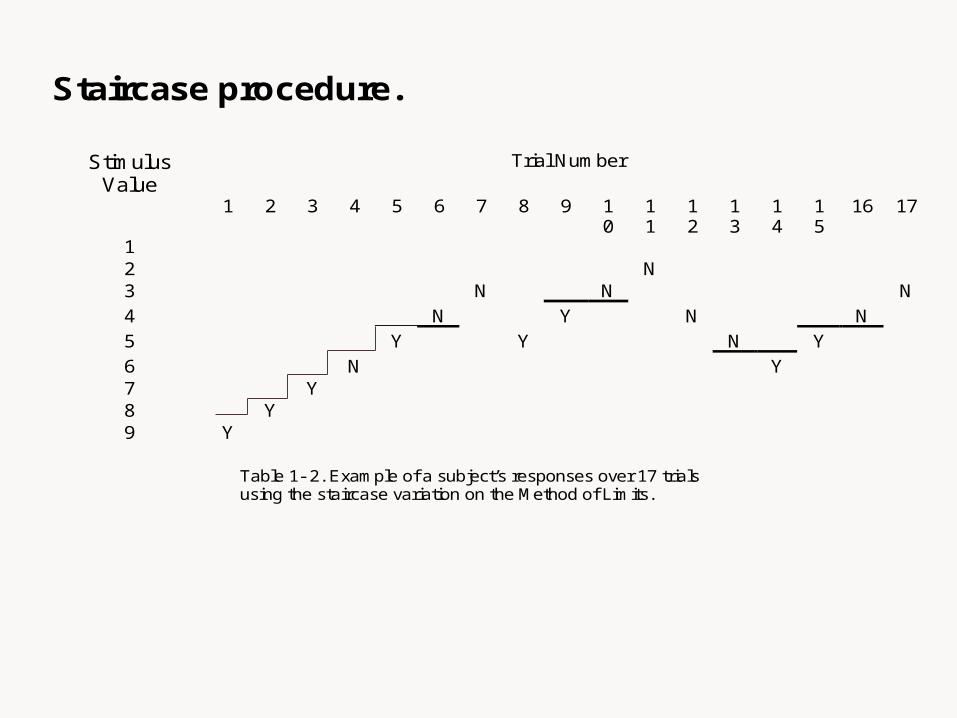
Staircase procedure.
Developed during WWII to test bomb detonators

Staircase procedure.
Stimulus Value
Trial Number
1 2 3 4 5 6 7 8 9 10
11
12
13
14
15
16 17
1 2 N 3 N N N
4 N Y N N
5 Y Y N Y
6 N Y 7 Y 8 Y 9 Y
Table 1- 2. Example of a subject’s responses over 17 trials using the staircase variation on the Method of Limits.
Staircase procedure.
Stimulus Value
Trial Number
1 2 3 4 5 6 7 8 9 10
11
12
13
14
15
16 17
1 2 N 3 N N N
4 N Y N N
5 Y Y N Y
6 N Y 7 Y 8 Y 9 Y
Table 1- 2. Example of a subject’s responses over 17 trials using the staircase variation on the Method of Limits.
Staircase procedure.
Stimulus Value
Trial Number
1 2 3 4 5 6 7 8 9 10
11
12
13
14
15
16 17
1 2 N 3 N N N
4 N Y N N
5 Y Y N Y
6 N Y 7 Y 8 Y 9 Y
Table 1- 2. Example of a subject’s responses over 17 trials using the staircase variation on the Method of Limits.

Staircase procedure.
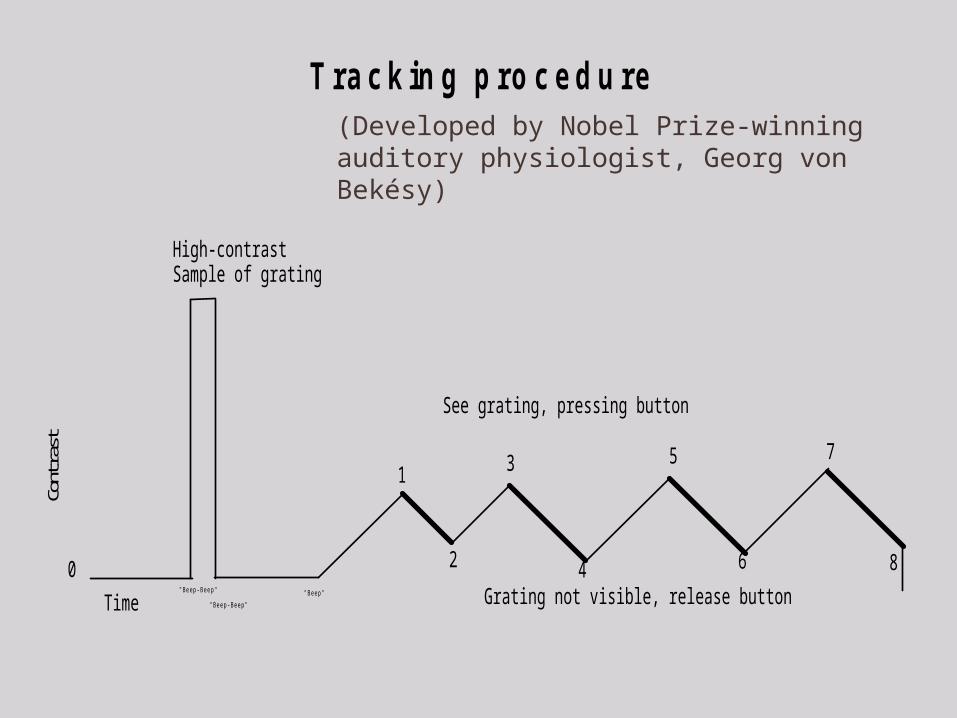
T r a c k i n g p r o c e d u r e
"Beep-Beep"
"Beep-Beep"
"Beep"
1
2
3
4
5
6
7
8
Contr
ast
0
See grating, pressing button
Grating not visible, release button
High-contrast Sample of grating
Time
(Developed by Nobel Prize-winning auditory physiologist, Georg von Bekésy)

Threshold Determination Methods
Method of Constant Stimuli
Method of Limits
-Staircase
-Tracking
Method of Adjustment

In the Method of Adjustment
the subject controls the stimulus values

LLTLLT
L T = L + L L T = L - L
L
LT=L+L
LT=L-L
+L
-L
0
A B
Luminance

In Class Demo

LT<L Intensity Difference, LT-L (arbitrary units) LT>L
-3 -2 -1 0 1 2 3
Probability of seeing LT
as equal to L +0.68 SDMean-0.68 SD
The distribution of values of LT that a subject decides are equal to Lforms a normal distribution if enough trials are used. The mean ofthe distribution will be very close to L. The threshold is taken as thevalue of LT that, when added to or subtracted from L gives an LT
that is detectable on 50% of the trials. This occurs 0.68 standarddeviations above and below the mean.
Frequency with which LT is seen as equal to L

The Method of Adjustment is most easily used when
the stimulus can be changed in a continuous manner,
rather than in steps.
Subjects generally enjoy the Method of Adjustment
because they actively participate.
Boredom and inattention are less of a problem with the
Method of Adjustment than with the other methods.

Potential problem with the Method of Adjustment
subjects may use the position of the dial as a cue to
where threshold "ought" to be.
This strategy can by foiled by using a dial that has no
numbers and has a variable amount of slip.

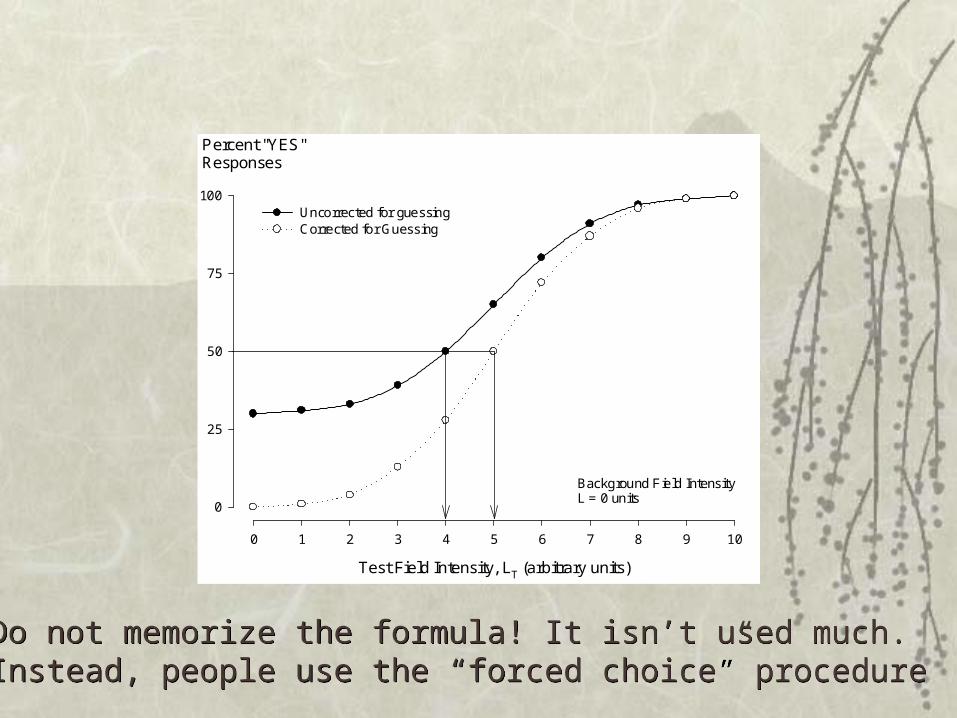
Controlling response bias and guessing
Correct for guessing by incorporating “catch” trials
Establish the guessing rate by forcing the subject to
make choices (“forced choice” technique)

Test Field Intensity, LT (arbitrary units)
0 1 2 3 4 5 6 7 8 9 10
Percent "YES"Responses
0
25
50
75
100Uncorrected for guessingCorrected for Guessing
Background Field IntensityL = 0 units
What do you do if the psychometric function doesn’t drop down
to 0% “Yes” responses for low stimulus values?
Assume subject/patient has a bias to guess “Yes.”

Correct for guessing by incorporating “catch” trials
where the stimulus is not presented at all. This gives the
guessing rate.

Test Field Intensity, LT (arbitrary units)
0 1 2 3 4 5 6 7 8 9 10
Percent "YES"Responses
0
25
50
75
100Uncorrected for guessingCorrected for Guessing
Background Field IntensityL = 0 units
Correct for guessing by incorporating “catch” trials. In this
case no stimulus at all was presented for a value of “0”, so
this was a “catch trial.”
The catch trial gives the guessing rate. Then subtract the guessing rate from the data to get the “True percent of ‘Yes’ responses”

T h e c o r r e c t i o n f a c t o r i s :
100Rate Guessing1
Rate GuessingResponses YES ofFraction ObservedResponses YES ofPercent True X
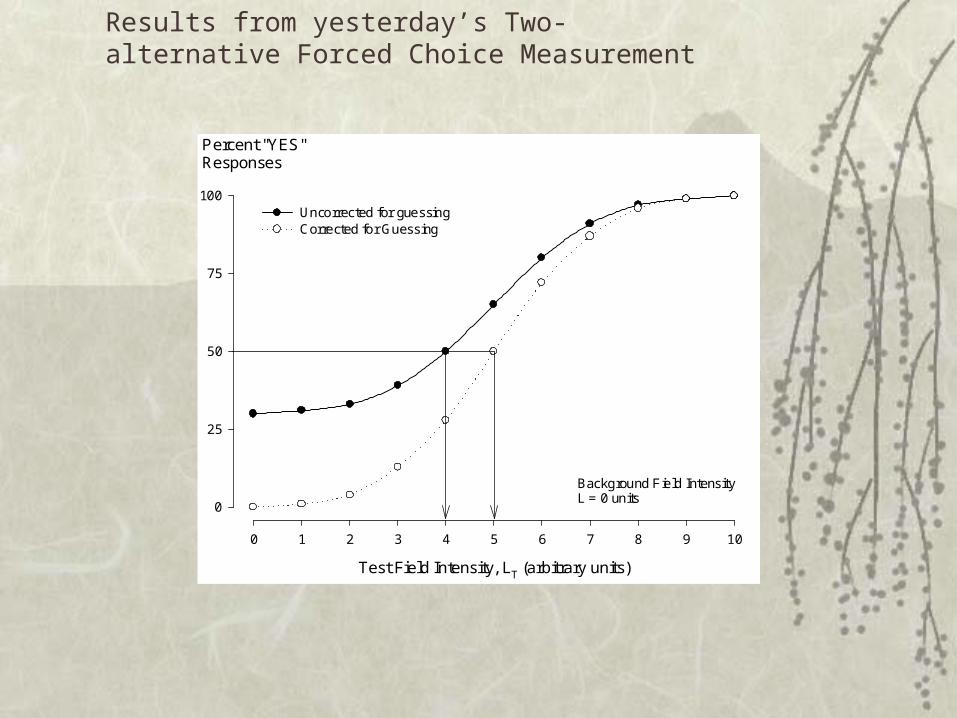
Test Field Intensity, LT (arbitrary units)
0 1 2 3 4 5 6 7 8 9 10
Percent "YES"Responses
0
25
50
75
100Uncorrected for guessingCorrected for Guessing
Background Field IntensityL = 0 units
Do not memorize the formula! It isn’t used much. Instead, people use the “forced choice” procedureDo not memorize the formula! It isn’t used much. Instead, people use the “forced choice” procedure

Establish the guessing rate by forcing the subject
to make choices
The Forced Choice procedure

In Class Demo
Two-alternative forced choiceTwo-alternative forced choice

The correction factor is still:
100Rate Guessing1
Rate GuessingResponses YES ofFraction ObservedResponses YES ofPercent True X
But if there are two alternatives (two-alternative forced-choice) you know the guessing rate is 0.5

Test Field Intensity, LT (arbitrary units)
0 1 2 3 4 5 6 7 8 9 10
Percent "YES" responses
0
25
50
75
100
Background Field IntensityL = 0 units
Figure 1-4. Idealized psychometric function for a threshold detection task using the Method of Constant Stimuli. The threshold stimulus value is obtained by drawing a horizontal line from the 50% value on the response axis to the psychometric function and then dropping a vertical line from the function to the test field intensity axis.
Results from yesterday’s Method of Constant Stimuli Threshold Measurement

Whole Class, 2009
0.000.100.200.300.400.500.600.700.800.901.00
0 1 2 3 4 5 6 7 8 9 10
Stimulus Value
Fra
ctio
n o
f "Y
es"
Res
po
nse
s
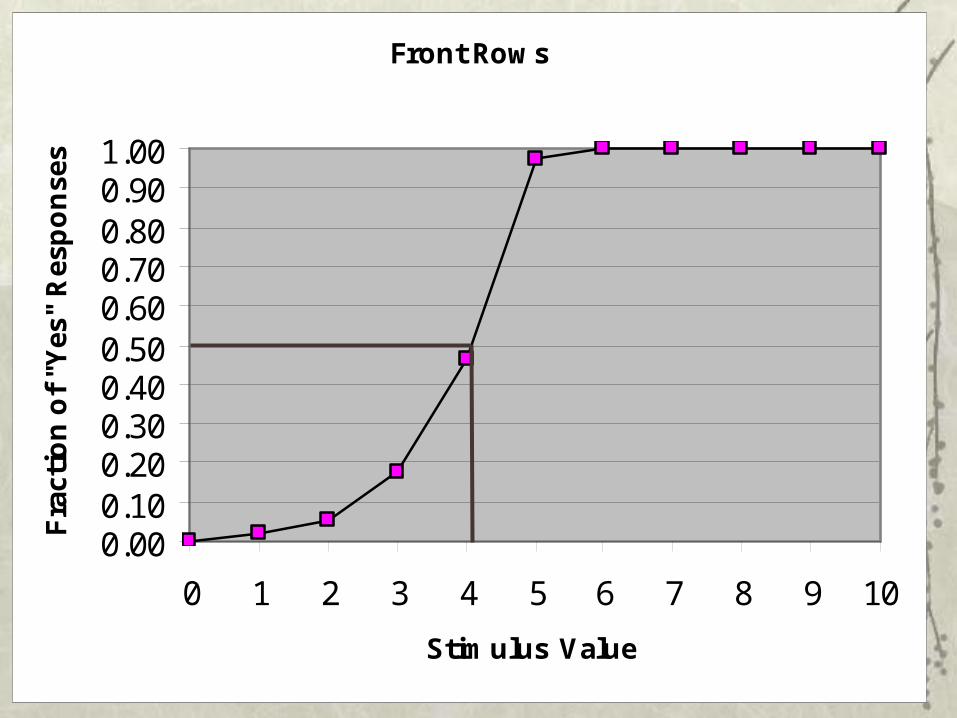
Front Rows
0.000.100.200.300.400.500.600.700.800.901.00
0 1 2 3 4 5 6 7 8 9 10
Stimulus Value
Fra
ctio
n o
f "Y
es"
Res
po
nse
s

Back Rows
0.00
0.10
0.20
0.30
0.40
0.50
0.60
0.70
0.80
0.90
1.00
0 1 2 3 4 5 6 7 8 9 10
Stimulus Value
Fra
ctio
n o
f "Y
es"
Res
po
nse
s
Test Field Intensity, LT (arbitrary units)
0 1 2 3 4 5 6 7 8 9 10
Percent "YES"Responses
0
25
50
75
100Uncorrected for guessingCorrected for Guessing
Background Field IntensityL = 0 units
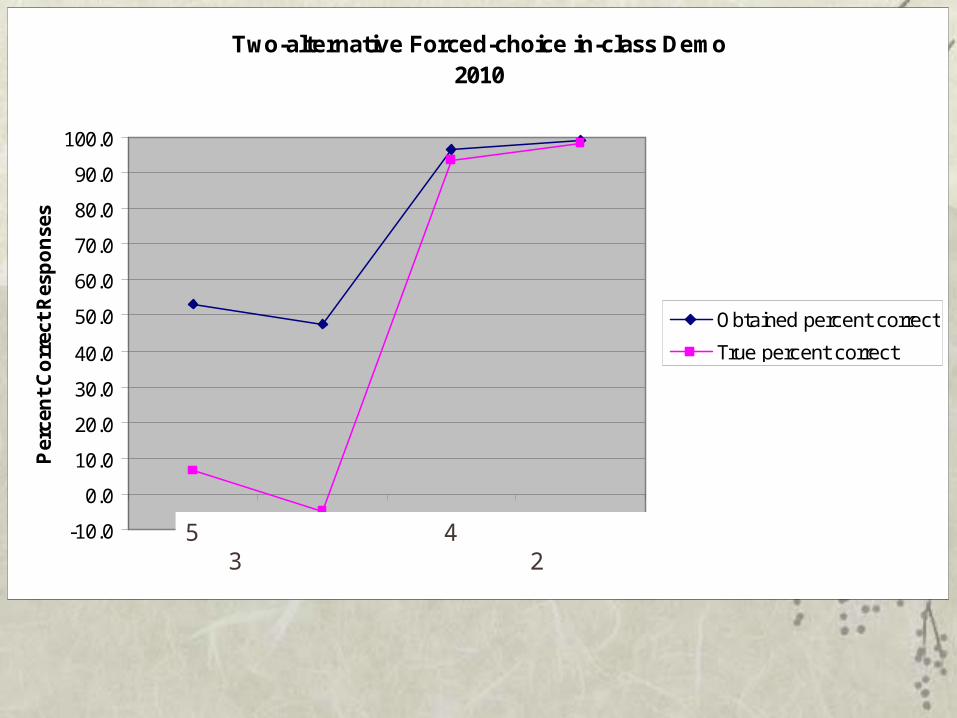
Results from yesterday’s Two-alternative Forced Choice Measurement
Intensity Discrimination Lab tomorrow
Groups C (1 – 3) and A (3 – 5)– List posted on bulletin board
Planning to have the lab unless UAB cancels classes due to snow
Snow amount is predicted to be small
2009
Two-alternative Forced-choice in-class Demo2010
-10.0
0.0
10.0
20.0
30.0
40.0
50.0
60.0
70.0
80.0
90.0
100.0
1 2 3 4
Stimulus
Per
cen
t C
orr
ect
Res
po
nse
s
Obtained percent correct
True percent correct
5 4 3 2

Two-alternative Forced-choice in-class Demo2010
-10.0
0.0
10.0
20.0
30.0
40.0
50.0
60.0
70.0
80.0
90.0
100.0
1 2 3 4
Stimulus
Per
cen
t C
orr
ect
Res
po
nse
s
Obtained percent correct
True percent correct
5 4 3 2

Two-alternative Forced-choice in-class Demo2010
-10.0
0.0
10.0
20.0
30.0
40.0
50.0
60.0
70.0
80.0
90.0
100.0
1 2 3 4
Stimulus
Per
cen
t C
orr
ect
Res
po
nse
s
Obtained percent correct
True percent correct
5 4 3 2
Either way gives the same threshold, but it is easier to use a 75% threshold and not bother to correct

http://www.opt.uab.edu/nortonpsychophysics/
Chapter 1
Principles of Psychophysical Measurement
Objectives:
Psychophysical Methods
Threshold
Constant Stimuli
Limits
Adjustment
Signal detection theory
Sensory Magnitude
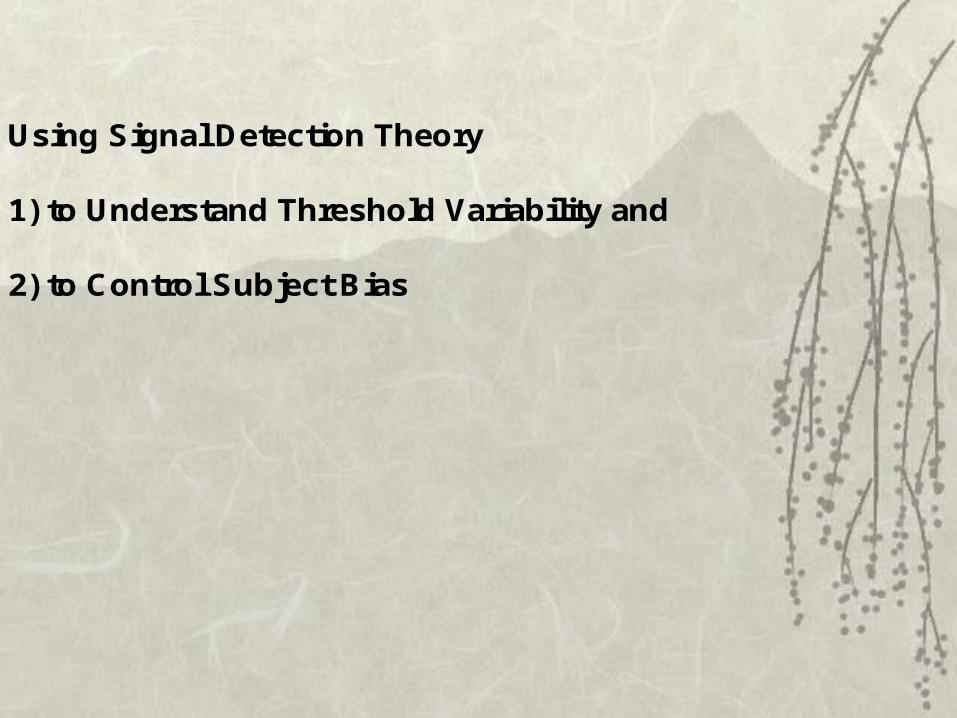
Using Signal Detection Theory
1) to Understand Threshold Variability and
2) to Control Subject Bias

Using Signal Detection Theory
1) to Understand Threshold Variability and
2) to Control Subject Bias
Big point!!
Lesser point

At threshold, neurons must “decide” whether a
stimulus is present against a background of
“noise”
Stimuli that are near threshold always are difficult to see! Did I see that, or didn’t I?
The brain (comprised of neurons) must “decide” if a stimulus was present against a background of neural “noise”.

Your brain causes perception. Cells in the brain do not respond to light. They respond because they are activated by a chain of cells that start with photoreceptors, which do “see” light.

We can “eavesdrop” on the neurons in the visual pathway with a microelectrode, nestled up against a neuron or its axon and record the responses (number of spikes per second) in response to visual stimuli.
B: Action potentials recorded from a single LGN neuron. The same stimulus (a spot of light positioned in the “receptive field” was presented many 20 times. A: a “histogram” of the cell’s responses
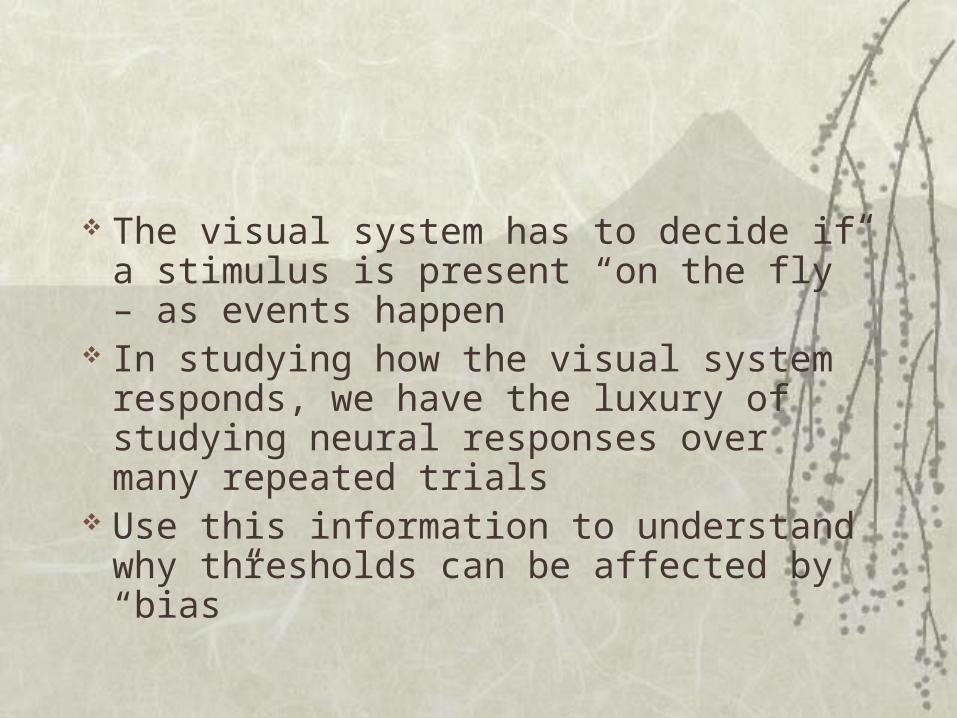
The visual system has to decide if a stimulus is present “on the fly” – as events happen
In studying how the visual system responds, we have the luxury of studying neural responses over many repeated trials
Use this information to understand why thresholds can be affected by “bias”

0 . 0 0 . 5 1 . 0 1 . 5 2 . 0 2 . 5 3 . 0O n O f fT i m e ( s )
R e s p o n s e s o f a n e u r o n i n t h e l a t e r a l g e n i c u l a t e n u c l e u s o f a na n e s t h e t i z e d c a t t o t h r e e p r e s e n t a t i o n s o f a n e a r - t h r e s h o l d v i s u a ls t i m u l u s . E a c h s m a l l v e r t i c a l l i n e r e p r e s e n t s a n a c t i o n p o t e n t i a lp r o d u c e d b y t h e n e u r o n . E a c h r o w s h o w s t h e r e s p o n s e s o f t h en e u r o n i n a 3 s p e r i o d . F r o m 0 u n t i l 2 . 5 s a b a c k g r o u n d l u m i n a n c ew a s p r e s e n t . T h e s t i m u l u s ( a l i g h t ) w a s t u r n e d o n a t 2 . 5 s a n d t u r n e do ff a t 3 . 0 s , s o t h e s t i m u l u s w a s o n f o r o n l y 0 . 5 s . ( U n p u b l i s h e d d a t af r o m D . W . G o d w i n a n d T . T . N o r t o n , . )
NoiseNoise
Signal + Noise
Signal + Noise

0 . 0 0 . 5 1 . 0 1 . 5 2 . 0 2 . 5 3 . 0O n O f fT i m e ( s )
R e s p o n s e s o f a n e u r o n i n t h e l a t e r a l g e n i c u l a t e n u c l e u s o f a na n e s t h e t i z e d c a t t o t h r e e p r e s e n t a t i o n s o f a n e a r - t h r e s h o l d v i s u a ls t i m u l u s . E a c h s m a l l v e r t i c a l l i n e r e p r e s e n t s a n a c t i o n p o t e n t i a lp r o d u c e d b y t h e n e u r o n . E a c h r o w s h o w s t h e r e s p o n s e s o f t h en e u r o n i n a 3 s p e r i o d . F r o m 0 u n t i l 2 . 5 s a b a c k g r o u n d l u m i n a n c ew a s p r e s e n t . T h e s t i m u l u s ( a l i g h t ) w a s t u r n e d o n a t 2 . 5 s a n d t u r n e do ff a t 3 . 0 s , s o t h e s t i m u l u s w a s o n f o r o n l y 0 . 5 s . ( U n p u b l i s h e d d a t af r o m D . W . G o d w i n a n d T . T . N o r t o n , . )
Below is a “peristimulus” histogram made from the responses to 30 stimulus repetitions like the three lines shown above.
We want to compare responses during
“noise” and “signal + Noise”

0 . 0 0 . 5 1 . 0 1 . 5 2 . 0 2 . 5 3 . 0O n O f fT i m e ( s )
R e s p o n s e s o f a n e u r o n i n t h e l a t e r a l g e n i c u l a t e n u c l e u s o f a na n e s t h e t i z e d c a t t o t h r e e p r e s e n t a t i o n s o f a n e a r - t h r e s h o l d v i s u a ls t i m u l u s . E a c h s m a l l v e r t i c a l l i n e r e p r e s e n t s a n a c t i o n p o t e n t i a lp r o d u c e d b y t h e n e u r o n . E a c h r o w s h o w s t h e r e s p o n s e s o f t h en e u r o n i n a 3 s p e r i o d . F r o m 0 u n t i l 2 . 5 s a b a c k g r o u n d l u m i n a n c ew a s p r e s e n t . T h e s t i m u l u s ( a l i g h t ) w a s t u r n e d o n a t 2 . 5 s a n d t u r n e do ff a t 3 . 0 s , s o t h e s t i m u l u s w a s o n f o r o n l y 0 . 5 s . ( U n p u b l i s h e d d a t af r o m D . W . G o d w i n a n d T . T . N o r t o n , . )
We are interested in how many action potentials are generated, over many stimulus presentations, during a 50 msec period when there is no stimulus (maintained discharge) and a 50 msec period when the stimulus is present.
Why 50 msec? Arbitrary, but it is about the amount of time the CNS seems to use.

0.0 0.5 1.0 1.5 2.0 2.5 3.0On OffTime (s)
2
83
0 3
2 15
Making a frequency distribution of neural responses during “noise” and “signal + noise”
50 ms “bins”
Number of action potentials in each bin
“noise” Stimulus + noise
During “noise”, 0 spikes occur 1 time, 3 spikes occur 1 time, 2 occur 1 time
During “signal + noise”, 3 spikes occur 1 time, 8 spikes occur 1 time, 15 occur 1 time
Do this across 30 stimulus presentations to get a distribution of the frequency with which a certain number of spikes occurs

Frequency ofOccurence
0
1
2
3
4
5
6
7
Mean of Noise
Number of Action Potentials in 50 msec Period
0 1 2 3 4 5 6 7 8 9 10 11 12 13 14 15
0
1
2
3
4
5
6
7
Mean of Noise + Signal
Overlap: PossibleConfusion
Maintained Discharge (Noise)Distribution
Maintained Discharge (Noise) +Response to Flash (Signal)
Distribution
A
B

There is no single “optimal” criterion number of action
potentials that the nervous system (such as a cell in
the visual cortex) should use to decide whether to
respond as though a stimulus was present, or to
respond as though a stimulus was not present.
How can the brain “decide” if a near-threshold stimulus is present?
If a strong stimulus is presented, it produces many more action potentials during the “signal + noise” than are produced during the “noise”. But when a stimulus is near threshold, there is overlap between the number of spikes produced during “noise” and “signal + noise”

One can try various criteria –
Changing the criterion (the threshold one adopts) affects the pattern of hits, misses, false alarms and correct rejections
“The saga of the snake in the grass”
This changing threshold is partly responsible for fluctuations in threshold.

Imagine the situation faced by a mouse, needing to forage for food, but worrying that a snake might be hanging around and eat the mouse when the mouse goes out to eat
Imagine the situation faced by a mouse, needing to forage for food, but worrying that a snake might be hanging around and eat the mouse when the mouse goes out to eat

Frequency ofOccurence
0
1
2
3
4
5
6
7
Mean of Noise
Number of Action Potentials in 50 msec Period
0 1 2 3 4 5 6 7 8 9 10 11 12 13 14 15
0
1
2
3
4
5
6
7
Mean of Noise + Signal
Overlap: PossibleConfusion
Maintained Discharge (Noise)Distribution
Maintained Discharge (Noise) +Response to Flash (Signal)
Distribution
A
B
Set criterion low, to always detect the snake
If 6 or more action potentials, decide “snake!!”
Problem: will also “see” snake some times when it is just the noise of the visual system

Out of the four possible outcomes there are two ways
to be correct:
by deciding the stimulus is there when it is present (a
Hit)
and by deciding that it is not there when it is absent (a
Correct Rejection).
There are also two ways to be wrong:
by deciding the stimulus is present when it is absent (a
False Alarm)
and by deciding it is not present when it is (a Miss).

Frequency ofOccurence
0
1
2
3
4
5
6
7
Mean of Noise
Number of Action Potentials in 50 msec Period
0 1 2 3 4 5 6 7 8 9 10 11 12 13 14 15
0
1
2
3
4
5
6
7
Mean of Noise + Signal
Overlap: PossibleConfusion
Maintained Discharge (Noise)Distribution
Maintained Discharge (Noise) +Response to Flash (Signal)
Distribution
A
B
Many false alarmsMany false alarms
If set a low criterion (threshold), hit rate is perfect, but
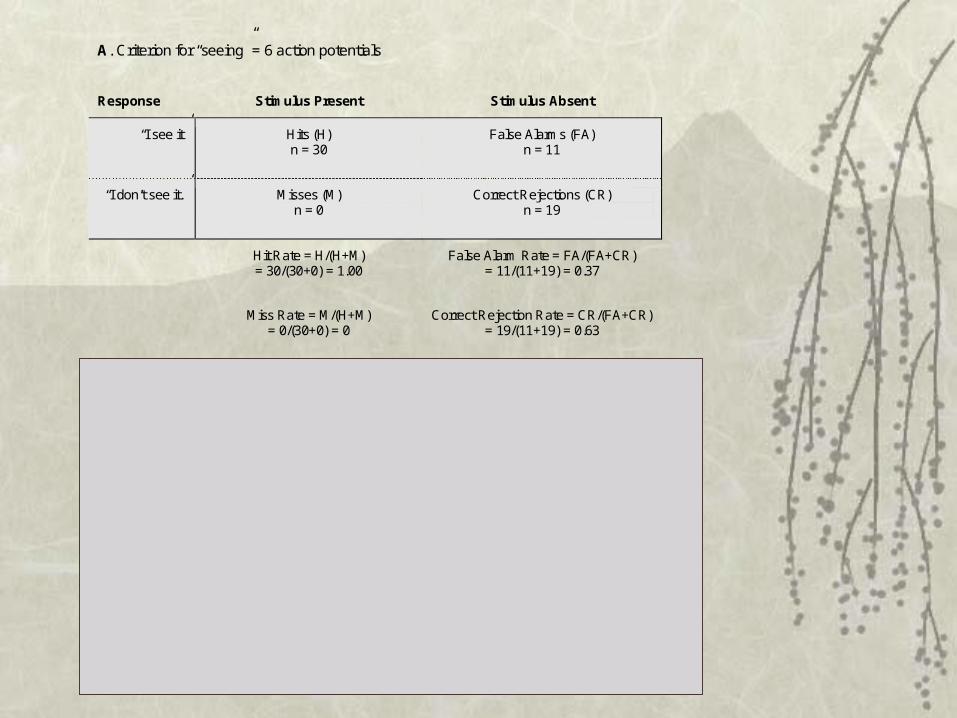
A. Criterion for “seeing” = 6 action potentials
Response Stimulus Present Stimulus Absent
“I see it” Hits (H) n = 30
False Alarms (FA) n = 11
“I don’t see it.” Misses (M) n = 0
Correct Rejections (CR) n = 19
Hit Rate = H/(H+M) = 30/(30+0) = 1.00
False Alarm Rate = FA/(FA+CR) = 11/(11+19) = 0.37
Miss Rate = M/(H+M) = 0/(30+0) = 0
Correct Rejection Rate = CR/(FA+CR) = 19/(11+19) = 0.63
B. Criterion for “seeing” = 9 action potentials
Response Stimulus Present Stimulus Absent
“I see it” Hits (H) n = 19
False Alarms (FA) n = 0
“I don’t see it.” Misses (M) n = 11
Correct Rejections (CR) n = 30
Hit Rate = H/(H+M) = 19/(19+11) = 0.63
False Alarm Rate = FA/(FA+CR) = 0/(0+30) = 0.00
Miss Rate = M/(H+M) = 11/(19+11) = 0.37
Correct Rejection Rate = CR/(FA+CR) = 30/(0+30) = 1.00
10

Frequency ofOccurence
0
1
2
3
4
5
6
7
Mean of Noise
Number of Action Potentials in 50 msec Period
0 1 2 3 4 5 6 7 8 9 10 11 12 13 14 15
0
1
2
3
4
5
6
7
Mean of Noise + Signal
Overlap: PossibleConfusion
Maintained Discharge (Noise)Distribution
Maintained Discharge (Noise) +Response to Flash (Signal)
Distribution
A
B
So, try changing the criterion – mouse gets hungrier, willing to “take a chance”
If set a high criterion (threshold) have no false alarms but also fewer hits (more misses)

A. Criterion for “seeing” = 6 action potentials
Response Stimulus Present Stimulus Absent
“I see it” Hits (H) n = 30
False Alarms (FA) n = 11
“I don’t see it.” Misses (M) n = 0
Correct Rejections (CR) n = 19
Hit Rate = H/(H+M) = 30/(30+0) = 1.00
False Alarm Rate = FA/(FA+CR) = 11/(11+19) = 0.37
Miss Rate = M/(H+M) = 0/(30+0) = 0
Correct Rejection Rate = CR/(FA+CR) = 19/(11+19) = 0.63
B. Criterion for “seeing” = 9 action potentials
Response Stimulus Present Stimulus Absent
“I see it” Hits (H) n = 19
False Alarms (FA) n = 0
“I don’t see it.” Misses (M) n = 11
Correct Rejections (CR) n = 30
Hit Rate = H/(H+M) = 19/(19+11) = 0.63
False Alarm Rate = FA/(FA+CR) = 0/(0+30) = 0.00
Miss Rate = M/(H+M) = 11/(19+11) = 0.37
Correct Rejection Rate = CR/(FA+CR) = 30/(0+30) = 1.00
10

Frequency ofOccurence
0
1
2
3
4
5
6
7
Mean of Noise
Number of Action Potentials in 50 msec Period
0 1 2 3 4 5 6 7 8 9 10 11 12 13 14 15
0
1
2
3
4
5
6
7
Mean of Noise + Signal
Overlap: PossibleConfusion
Maintained Discharge (Noise)Distribution
Maintained Discharge (Noise) +Response to Flash (Signal)
Distribution
A
B
Can calculate hit rate and false alarm rate for ANY criterion

Receiver Operating Characteristic (ROC) curve for the responses shown in the previous figure. If the threshold isset at 15 action potentials, there are 0 Hits and 0 False Alarms. If it is set at 14, there will be a few Hits, but 0 FalseAlarms. As the threshold is decreased further, the P(Hit) increases but the P(False Alarm) remains at 0 until thethreshold reaches 9, at which point False Alarms begin to increase. As the threshold is further lowered, throughthe overlap region in the previous figure, the probability of both Hits and False Alarms increase. For thresholdsbelow 6, there is no further increase in hit rate, but the false alarm rate climbs toward 1.0.
False Alarm Rate
0.0 0.1 0.2 0.3 0.4 0.5 0.6 0.7 0.8 0.9 1.0
Hit Rate
0.0
0.1
0.2
0.3
0.4
0.5
0.6
0.7
0.8
0.9
1.0
14
13
12
11
10
9
87 6 5 4 321
15
Receiver Operating Characteristic (ROC) curve

Frequency ofOccurence
0
1
2
3
4
5
6
7
Mean of Noise
Number of Action Potentials in 50 msec Period
0 1 2 3 4 5 6 7 8 9 10 11 12 13 14 15
0
1
2
3
4
5
6
7
Mean of Noise + Signal
Overlap: PossibleConfusion
Maintained Discharge (Noise)Distribution
Maintained Discharge (Noise) +Response to Flash (Signal)
Distribution
A
B
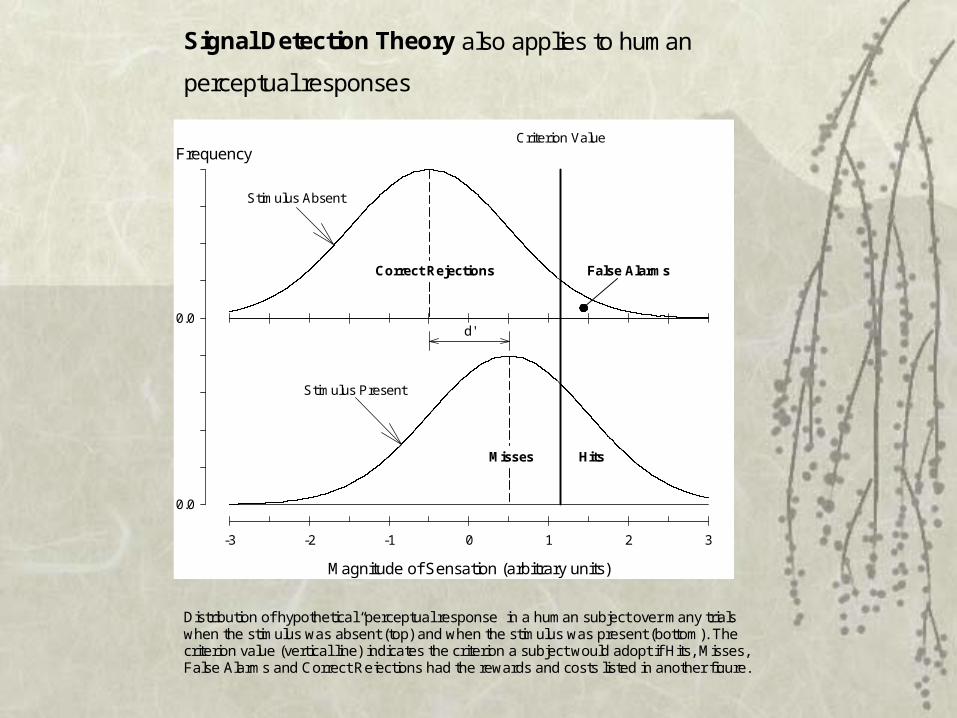
Signal Detection Theory also applies to human
perceptual responses
Distribution of hypothetical “perceptual response” in a human subject over many trialswhen the stimulus was absent (top) and when the stimulus was present (bottom). Thecriterion value (vertical line) indicates the criterion a subject would adopt if Hits, Misses,False Alarms and Correct Rejections had the rewards and costs listed in another figure.
Magnitude of Sensation (arbitrary units)
-3 -2 -1 0 1 2 3
Frequency
0.0
0.0
Criterion Value
d'
False Alarms
Hits
Correct Rejections
Misses
Stimulus Absent
Stimulus Present

False Alarm Rate
0.0 0.2 0.4 0.6 0.8 1.0
Hit Rate
0.0
0.2
0.4
0.6
0.8
1.0 Receiver Operating Characteristic(ROC) Curve
The distributions on the previous slide would produce this

d’ (“d prime”) is a measure of the separation of two normal distributions.
d’ = the difference between the means of the “noise” and “signal plus noise” distributions divided by the common standard deviation of the two distributions.
d’ quantifies the detectability of the signal (small d’ = signal is hard to detect)

Srimulus AbsentStimulus Present
d'=1.5d'=1.0d'=0.5
A
B
C
ROC Curve

Can Use Signal Detection Theory to control bias
when measuring threshold (This is the “minor
point”)
Big point: Where a neuron, or an entire creature (human or animal) sets its criterion depends on circumstances (fear vs. hunger which causes a change in “bias”). This contributes to threshold variability.

To control a subject’s criterion, the examiner
provides the subject, in advance, with:
the payoff amounts
and
information on the frequency of stimulus presentation
Use the “Payoff Game”

To control a subject’s criterion, the examiner
provides the subject, in advance, with:
the payoff amounts
and
information on the frequency of stimulus presentation
Use the “Payoff Game”

Skip the text on pages 24, 26, 27 and top of 28
“Signal detection theory can be used to control bias when measuring threshold”
Skip the text on pages 24, 26, 27 and top of 28
“Signal detection theory can be used to control bias when measuring threshold”
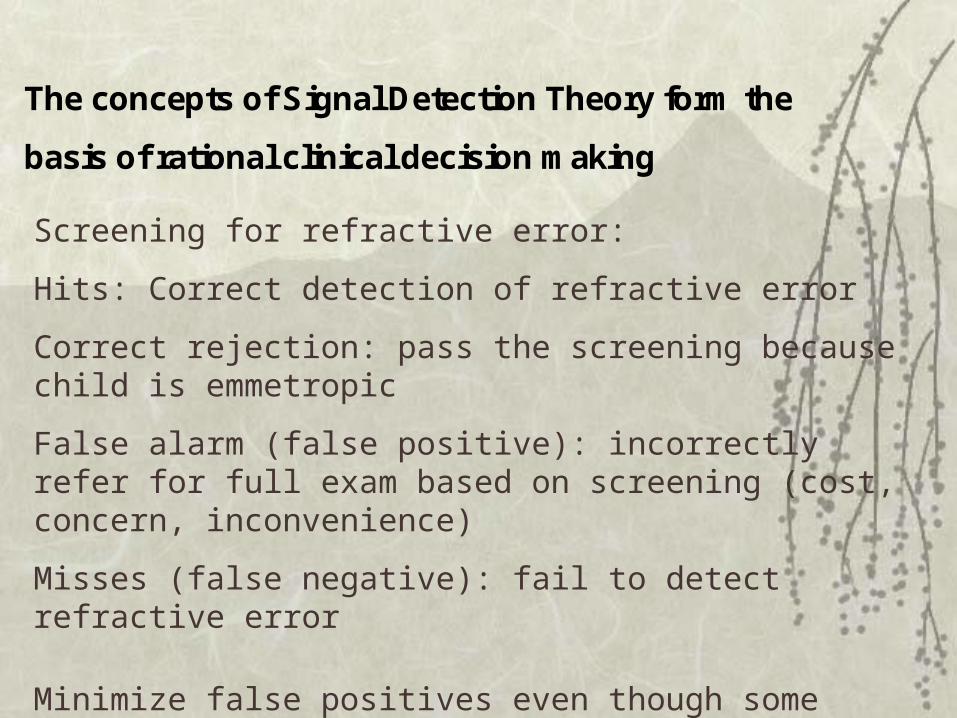
The concepts of Signal Detection Theory form the
basis of rational clinical decision making
Screening for refractive error:
Hits: Correct detection of refractive error
Correct rejection: pass the screening because child is emmetropic
False alarm (false positive): incorrectly refer for full exam based on screening (cost, concern, inconvenience)
Misses (false negative): fail to detect refractive error
Minimize false positives even though some refractive error is missed

The concepts of Signal Detection Theory form the
basis of rational clinical decision making
Detecting ocular melanoma:
Hits: Correct detection of melanoma (refer for possible surgery)
Correct rejection: pass because no melanoma
False positive – incorrectly refer based on screening (alarm, cost, inconvenience)
Misses (false negatives): fail to detect melanoma (possible death)
Minimize false negatives even though some false positives occur
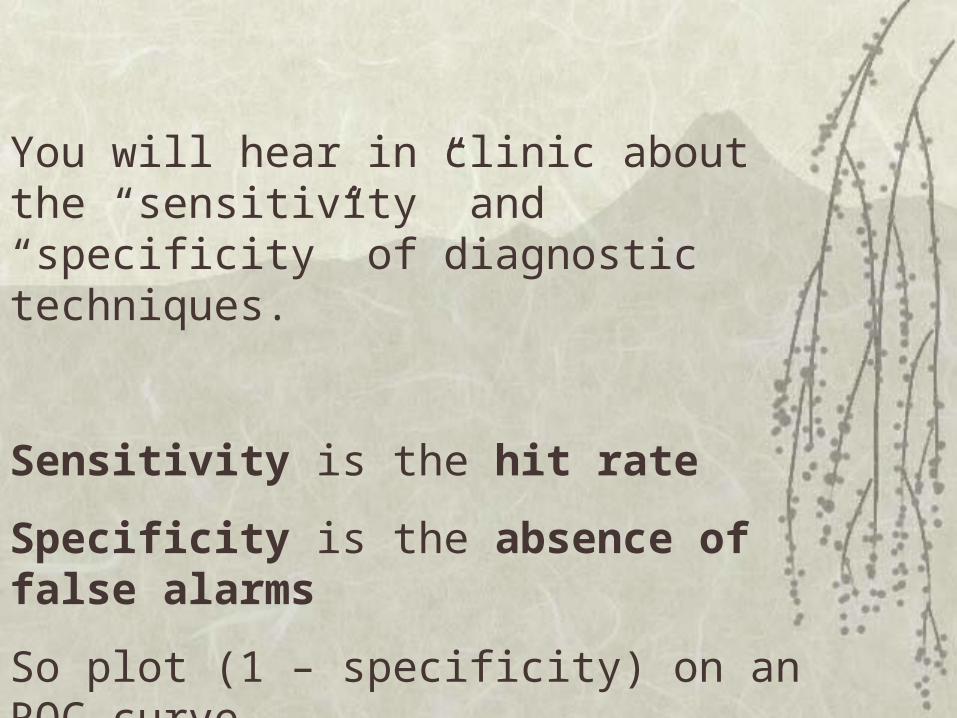
You will hear in clinic about the “sensitivity” and “specificity” of diagnostic techniques.
Sensitivity is the hit rate
Specificity is the absence of false alarms
So plot (1 – specificity) on an ROC curve
Want a diagnostic tool that has high sensitivity and high specificity

“Do you see it?”
As was said the first day of class
Visual thresholds are the most common psychophysical measurement

The other major type of
psychophysical measurement:
Measuring the magnitude of sensations
“What does it look like?”

Perceptual responses (sensations) have
magnitude but no obvious scale or units
Increased light intensity is “brighter” but how much brighter?
Increased spot size is “larger”, but how much larger?

To measure sensory magnitude above threshold,
use scales that do not rely on any particular units
of measurement

1) Ratio Production - the subject is presented with a
reference stimulus and is asked to adjust the intensity
of a test stimulus so that it appears to be some fraction
or multiple of the reference stimulus.
2) Ratio Estimation - the examiner sets the physical
intensities of a reference and test stimulus and asks
the subject to estimate the ratio of the test to the
reference stimulus.

3) Magnitude Estimation (two variants)
a) an observer is presented with a reference stimulus
and told that it has a certain value (10, 100 etc.) A
series of test stimuli are then presented and the
observer assigns a number to these stimuli to
indicate their perceived magnitude relative to the
reference stimulus
b) (don’t bother with this)
4) Magnitude Production – a subject is presented
with a reference stimulus and is asked to adjust a
test stimulus so that is appears to be some fraction
or multiple of the reference stimulus.

Stevens' Pow er Law relates sensory m agnitude to the m agnitude of the stim ulus:
where (psi) is the sensory m agnitude, (kappa) is an arbitrary constant determ ining
the scale unit, (phi) is the stim ulus m agnitude, and (alpha) is an exponent that
is characteristic of the stim ulus used.
Sensory magnitude is proportional to the stimulus magnitude raised to some power
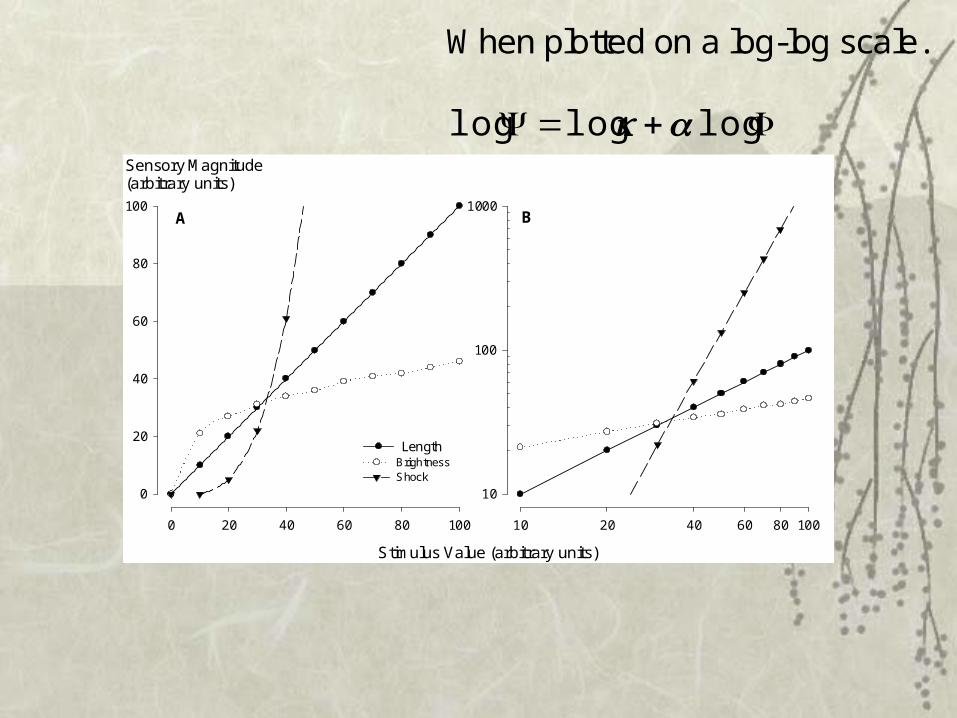
Stimulus Value (arbitrary units)
0 20 40 60 80 100
Sensory Magnitude(arbitrary units)
0
20
40
60
80
100
Length Brightness Shock
10 20 40 60 80 100
10
100
1000A B
When plotted on a log-log scale.
log log log
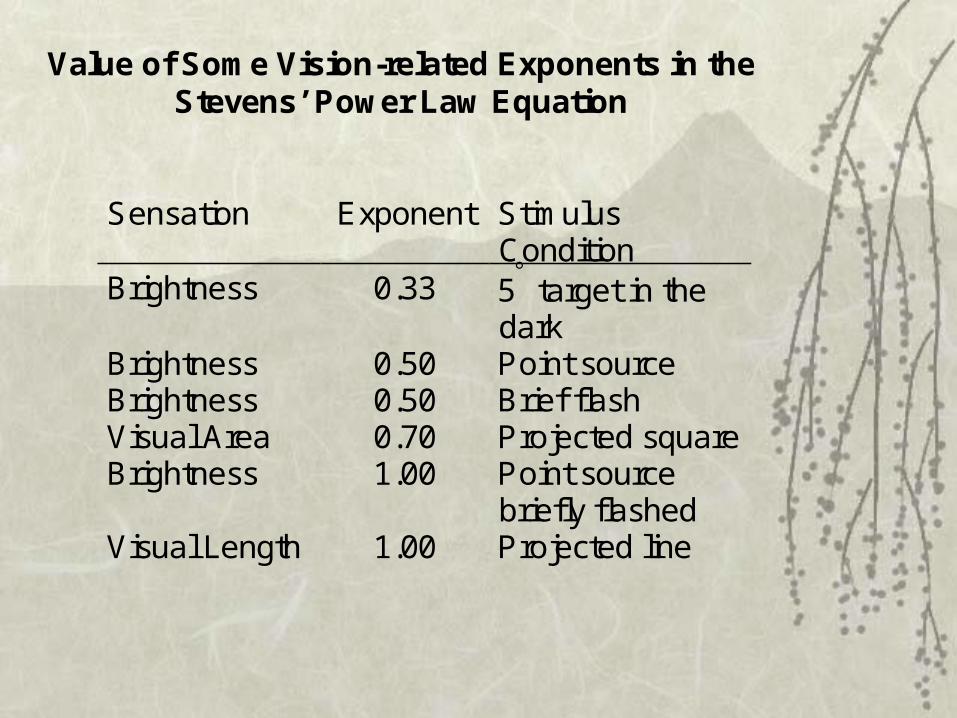
Value of Some Vision-related Exponents in the Stevens’ Power Law Equation
Sensation Exponent Stimulus Condition
Brightness 0.33 5 target in the dark
Brightness 0.50 Point source Brightness 0.50 Brief flash Visual Area 0.70 Projected square Brightness 1.00 Point source
briefly flashed Visual Length 1.00 Projected line

Clinicians rely on sensory magnitudes
to make judgments about pathologies


Measuring the magnitude of sensations
“What does it look like?”

Chapter 1
Principles of Psychophysical Measurement
Objectives:
Psychophysical Methods
Threshold
Constant Stimuli
Limits
Adjustment
Signal detection theory
Sensory Magnitude