pt. 136, app. a, meth. 608 40 cfr ch. i (71 01 edition)
TRANSCRIPT

112
40 CFR Ch. I (7–1–01 Edition)Pt. 136, App. A, Meth. 608
METHOD 608—ORGANOCHLORINE PESTICIDESAND PCBS
1. Scope and Application
1.1 This method covers the determinationof certain organochlorine pesticides andPCBs. The following parameters can be de-termined by this method:
Parameter STORET No. CAS No.
Aldrin ...................................... 39330 309–00–2α–BHC ................................... 39337 319–84–6β–BHC ................................... 39338 319–85–7δ–BHC ................................... 34259 319–86–8γ–BHC .................................... 39340 58–89–9Chlordane .............................. 39350 57–74–94,4′–DDD ............................... 39310 72–54–84,4′–DDE ............................... 39320 72–55–94,4′–DDT ............................... 39300 50–29–3Dieldrin ................................... 39380 60–57–1Endosulfan I .......................... 34361 959–98–8Endosulfan II ......................... 34356 33212–65–9Endosulfan sulfate ................. 34351 1031–07–8Eldrin ...................................... 39390 72–20–8Endrin aldehyde ..................... 34366 7421–93–4Heptachlor ............................. 39410 76–44–8Heptachlor epoxide ................ 39420 1024–57–3Toxaphene ............................. 39400 8001–35–2PCB–1016 ............................. 34671 12674–11–2PCB–1221 ............................. 39488 1104–28–2PCB–1232 ............................. 39492 11141–16–5PCB–1242 ............................. 39496 53469–21–9PCB–1248 ............................. 39500 12672–29–6PCB–1254 ............................. 39504 11097–69–1PCB–1260 ............................. 39508 11096–82–5
1.2 This is a gas chromatographic (GC)method applicable to the determination ofthe compounds listed above in municipal andindustrial discharges as provided under 40CFR 136.1. When this method is used to ana-lyze unfamiliar samples for any or all of thecompounds above, compound identificationsshould be supported by at least one addi-tional qualitative technique. This methoddescribes analytical conditions for a secondgas chromatographic column that can beused to confirm measurements made withthe primary column. Method 625 provides gaschromatograph/mass spectrometer (GC/MS)conditions appropriate for the qualitativeand quantitative confirmation of results forall of the parameters listed above, using theextract produced by this method.
1.3 The method detection limit (MDL, de-fined in Section 14.1)1 for each parameter islisted in Table 1. The MDL for a specificwastewater may differ from those listed, de-pending upon the nature of interferences inthe sample matrix.
1.4 The sample extraction and concentra-tion steps in this method are essentially thesame as in Methods 606, 609, 611, and 612.Thus, a single sample may be extracted tomeasure the parameters included in thescope of each of these methods. When clean-up is required, the concentration levels mustbe high enough to permit selecting aliquots,as necessary, to apply appropriate cleanup
procedures. The analyst is allowed the lati-tude, under Section 12, to selectchromatographic conditions appropriate forthe simultaneous measurement of combina-tions of these parameters.
1.5 Any modification of this method, be-yond those expressly permitted, shall be con-sidered as a major modification subject toapplication and approval of alternate testprocedures under 40 CFR 136.4 and 136.5.
1.6 This method is restricted to use by orunder the supervision of analysts experi-enced in the use of a gas chromatograph andin the interpretation of gas chromatograms.Each analyst must demonstrate the abilityto generate acceptable results with thismethod using the procedure described in Sec-tion 8.2.
2. Summary of Method
2.1 A measured volume of sample, ap-proximately 1–L, is extracted with meth-ylene chloride using a separatory funnel. Themethylene chloride extract is dried and ex-changed to hexane during concentration to avolume of 10 mL or less. The extract is sepa-rated by gas chromatography and the param-eters are then measured with an electroncapture detector.2
2.2 The method provides a Florisil columncleanup procedure and an elemental sulfurremoval procedure to aid in the eliminationof interferences that may be encountered.
3. Interferences
3.1 Method interferences may be causedby contaminants in solvents, reagents, glass-ware, and other sample processing hardwarethat lead to discrete artifacts and/or ele-vated baselines in gas chromatograms. All ofthese materials must be routinely dem-onstrated to be free from interferences underthe conditions of the analysis by runninglaboratory reagent blanks as described inSection 8.1.3.
3.1.1 Glassware must be scrupulouslycleaned.3 Clean all glassware as soon as pos-sible after use by rinsing with the last sol-vent used in it. Solvent rinsing should be fol-lowed by detergent washing with hot water,and rinses with tap water and distilledwater. The glassware should then be draineddry, and heated in a muffle furnace at 400 °Cfor 15 to 30 min. Some thermally stable ma-terials, such as PCBs, may not be eliminatedby this treatment. Solvent rinses with ace-tone and pesticide quality hexane may besubstituted for the muffle furnace heating.Thorough rinsing with such solvents usuallyeliminates PCB interference. Volumetricware should not be heated in a muffle fur-nace. After drying and cooling, glasswareshould be sealed and stored in a clean envi-ronment to prevent any accumulation ofdust or other contaminants. Store invertedor capped with aluminum foil.
VerDate 11<MAY>2000 01:52 Jul 20, 2001 Jkt 194155 PO 00000 Frm 00112 Fmt 8010 Sfmt 8002 Y:\SGML\194155T.XXX pfrm12 PsN: 194155T

113
Environmental Protection Agency Pt. 136, App. A, Meth. 608
3.1.2 The use of high purity reagents andsolvents helps to minimize interference prob-lems. Purification of solvents by distillationin all-glass systems may be required.
3.2 Interferences by phthalate esters canpose a major problem in pesticide analysiswhen using the electron capture detector.These compounds generally appear in thechromatogram as large late eluting peaks,especially in the 15 and 50% fractions fromFlorisil. Common flexible plastics containvarying amounts of phthalates. Thesephthalates are easily extracted or leachedfrom such materials during laboratory oper-ations. Cross contamination of clean glass-ware routinely occurs when plastics are han-dled during extraction steps, especially whensolvent-wetted surfaces are handled. Inter-ferences from phthalates can best be mini-mized by avoiding the use of plastics in thelaboratory. Exhaustive cleanup of reagentsand glassware may be required to eliminatebackground phthalate contamination.4, 5 Theinterferences from phthalate esters can beavoided by using a microcoulometric or elec-trolytic conductivity detector.
3.3 Matrix interferences may be caused bycontaminants that are co-extracted from thesample. The extent of matrix interferenceswill vary considerably from source to source,depending upon the nature and diversity ofthe industrial complex or municipality beingsampled. The cleanup procedures in Section11 can be used to overcome many of theseinterferences, but unique samples may re-quire additional cleanup approaches toachieve the MDL listed in Table 1.
4. Safety
4.1 The toxicity or carcinogenicity ofeach reagent used in this method has notbeen precisely defined; however, each chem-ical compound should be treated as a poten-tial health hazard. From this viewpoint, ex-posure to these chemicals must be reduced tothe lowest possible level by whatever meansavailable. The laboratory is responsible formaintaining a current awareness file ofOSHA regulations regarding the safe han-dling of the chemicals specified in this meth-od. A reference file of material data handlingsheets should also be made available to allpersonnel involved in the chemical analysis.Additional references to laboratory safetyare available and have been identified 6–8 forthe information of the analyst.
4.2 The following parameters covered bythis method have been tentatively classifiedas known or suspected, human or mamma-lian carcinogens: 4,4′-DDT, 4,4′–DDD, theBHCs, and the PCBs. Primary standards ofthese toxic compounds should be prepared ina hood. A NIOSH/MESA approved toxic gasrespirator should be worn when the analysthandles high concentrations of these toxiccompounds.
5. Apparatus and Materials
5.1 Sampling equipment, for discrete orcomposite sampling.
5.1.1 Grab sample bottle—1–L or 1-qt,amber glass, fitted with a screw cap linedwith Teflon. Foil may be substituted for Tef-lon if the sample is not corrosive. If amberbottles are not available, protect samplesfrom light. The bottle and cap liner must bewashed, rinsed with acetone or methylenechloride, and dried before use to minimizecontamination.
5.1.2 Automatic sampler (optional)—Thesampler must incorporate glass sample con-tainers for the collection of a minimum of250 mL of sample. Sample containers must bekept refrigerated at 4 °C and protected fromlight during composting. If the sampler usesa peristaltic pump, a minimum length ofcompressible silicone rubber tubing may beused. Before use, however, the compressibletubing should be thoroughly rinsed withmethanol, followed by repeated rinsings withdistilled water to minimize the potential forcontamination of the sample. An integratingflow meter is required to collect flow propor-tional composites.
5.2. Glassware (All specifications are sug-gested. Catalog numbers are included for il-lustration only.):
5.2.1 Separatory funnel—2–L, with Teflonstopcock.
5.2.2 Drying column—Chromatographiccolumn, approximately 400 mm long × 19 mmID, with coarse frit filter disc.
5.2.3 Chromatographic column—400 mmlong × 22 mm ID, with Teflon stopcock andcoarse frit filter disc (Kontes K–42054 orequivalent).
5.2.4 Concentrator tube, Kuderna-Dan-ish—10–mL, graduated (Kontes K–570050–1025or equivalent). Calibration must be checkedat the volumes employed in the test. Groundglass stopper is used to prevent evaporationof extracts.
5.2.5 Evaporative flask, Kuderna-Danish—500–mL (Kontes K–570001–0500 or equivalent).Attach to concentrator tube with springs.
5.2.6 Snyder column, Kuderna/Danish—Three-ball macro (Kontes K–503000–0121 orequivalent).
5.2.7 Vials—10 to 15–mL, amber glass, withTeflon-lined screw cap.
5.3 Boiling chips—Approximately 10/40mesh. Heat to 400 °C for 30 min or Soxhlet ex-tract with methylene chloride.
5.4 Water bath—Heated, with concentricring cover, capable of temperature control(±2 °C). The bath should be used in a hood.
5.5 Balance—Analytical, capable of accu-rately weighing 0.0001 g.
5.6 Gas chromatograph—An analyticalsystem complete with gas chromatographsuitable for on-column injection and all re-quired accessories including syringes, ana-lytical columns, gases, detector, and strip-
VerDate 11<MAY>2000 01:52 Jul 20, 2001 Jkt 194155 PO 00000 Frm 00113 Fmt 8010 Sfmt 8002 Y:\SGML\194155T.XXX pfrm12 PsN: 194155T

114
40 CFR Ch. I (7–1–01 Edition)Pt. 136, App. A, Meth. 608
chart recorder. A data system is rec-ommended for measuring peak areas.
5.6.1 Column 1—1.8 m long × 4 mm IDglass, packed with 1.5% SP–2250/1.95% SP–2401 on Supelcoport (100/120 mesh) or equiva-lent. This column was used to develop themethod performance statements in Section14. Guidelines for the use of alternate col-umn packings are provided in Section 12.1.
5.6.2 Column 2—1.8 m long × 4 mm IDglass, packed with 3% OV–1 on Supelcoport(100/120 mesh) or equivalent.
5.6.3 Detector—Electron capture detector.This detector has proven effective in theanalysis of wastewaters for the parameterslisted in the scope (Section 1.1), and was usedto develop the method performance state-ments in Section 14. Guidelines for the use ofalternate detectors are provided in Section12.1.
6. Reagents
6.1 Reagent water—Reagent water is de-fined as a water in which an interferent isnot observed at the MDL of the parametersof interest.
6.2 Sodium hydroxide solution (10 N)—Dissolve 40 g of NaOH (ACS) in reagent waterand dilute to 100 mL.
6.3 Sodium thiosulfate—(ACS) Granular.6.4 Sulfuric acid (1+1)—Slowly, add 50 mL
to H2SO4 (ACS, sp. gr. 1.84) to 50 mL of rea-gent water.
6.5 Acetone, hexane, isooctane, methylenechloride—Pesticide quality or equivalent.
6.6 Ethyl ether—Nanograde, redistilled inglass if necessary.
6.6.1 Ethyl ether must be shown to be freeof peroxides before it is used as indicated byEM Laboratories Quant test strips. (Avail-able from Scientific Products Co., Cat. No.P1126–8, and other suppliers.)
6.6.2 Procedures recommended for re-moval of peroxides are provided with the teststrips. After cleanup, 20 mL of ethyl alcoholpreservative must be added to each liter ofether.
6.7 Sodium sulfate—(ACS) Granular, an-hydrous. Purify by heating at 400 °C for 4 hin a shallow tray.
6.8 Florisil—PR grade (60/100 mesh). Pur-chase activated at 1250 °F and store in thedark in glass containers with ground glassstoppers or foil-lined screw caps. Before use,activate each batch at least 16 h at 130 °C ina foil-covered glass container and allow tocool.
6.9 Mercury—Triple distilled.6.10 Copper powder—Activated.6.11 Stock standard solutions (1.00 µg/
µL)—Stock standard solutions can be pre-pared from pure standard materials or pur-chased as certified solutions.
6.11.1 Prepare stock standard solutions byaccurately weighing about 0.0100 g of purematerial. Dissolve the material in isooctaneand dilute to volume in a 10-mL volumetric
flask. Larger volumes can be used at the con-venience of the analyst. When compound pu-rity is assayed to be 96% or greater, theweight can be used without correction to cal-culate the concentration of the stock stand-ard. Commercially prepared stock standardscan be used at any concentration if they arecertified by the manufacturer or by an inde-pendent source.
6.11.2 Transfer the stock standard solu-tions into Teflon-sealed screw-cap bottles.Store at 4 °C and protect from light. Stockstandard solutions should be checked fre-quently for signs of degradation or evapo-ration, especially just prior to preparingcalibration standards from them.
6.11.3 Stock standard solutions must bereplaced after six months, or sooner if com-parison with check standards indicates aproblem.
6.12 Quality control check sample con-centrate—See Section 8.2.1.
7. Calibration
7.1 Establish gas chromatographic oper-ating conditions equivalent to those given inTable 1. The gas chromatographic systemcan be calibrated using the external standardtechnique (Section 7.2) or the internal stand-ard technique (Section 7.3).
7.2 External standard calibration proce-dure:
7.2.1 Prepare calibration standards at aminimum of three concentration levels foreach parameter of interest by adding vol-umes of one or more stock standards to avolumetric flask and diluting to volume withisooctane. One of the external standardsshould be at a concentration near, but above,the MDL (Table 1) and the other concentra-tions should correspond to the expectedrange of concentrations found in real sam-ples or should define the working range ofthe detector.
7.2.2 Using injections of 2 to 5 µL, analyzeeach calibration standard according to Sec-tion 12 and tabulate peak height or area re-sponses against the mass injected. The re-sults can be used to prepare a calibrationcurve for each compound. Alternatively, ifthe ratio of response to amount injected(calibration factor) is a constant over theworking range (<10% relative standard devi-ation, RSD), linearity through the origin canbe assumed and the average ratio or calibra-tion factor can be used in place of a calibra-tion curve.
7.3 Internal standard calibration proce-dure—To use this approach, the analyst mustselect one or more internal standards thatare similar in analytical behavior to thecompounds of interest. The analyst must fur-ther demonstrate that the measurement ofthe internal standard is not affected bymethod or matrix interferences. Because ofthese limitations, no internal standard can
VerDate 11<MAY>2000 01:52 Jul 20, 2001 Jkt 194155 PO 00000 Frm 00114 Fmt 8010 Sfmt 8002 Y:\SGML\194155T.XXX pfrm12 PsN: 194155T

115
Environmental Protection Agency Pt. 136, App. A, Meth. 608
be suggested that is applicable to all sam-ples.
7.3.1 Prepare calibration standards at aminimum of three concentration levels foreach parameter of interest by adding vol-umes of one or more stock standards to avolumetric flask. To each calibration stand-ard, add a known constant amount of one ormore internal standards, and dilute to vol-ume with isooctane. One of the standardsshould be at a concentration near, but above,the MDL and the other concentrationsshould correspond to the expected range ofconcentrations found in real samples orshould define the working range of the detec-tor.
7.3.2 Using injections of 2 to 5 µL, analyzeeach calibration standard according to Sec-tion 12 and tabulate peak height or area re-sponses against concentration for each com-pound and internal standard. Calculate re-sponse factors (RF) for each compound usingEquation 1.
RF =( )( )( )( )A C
A Cs is
is s
Equation 1where:As=Response for the parameter to be meas-
ured.Ais=Response for the internal standard.Cis=Concentration of the internal standard
(µg/L).Cs=Concentraton of the parameter to be
measured (µg/L).If the RF value over the working range is
a constant (<10% RSD), the RF can be as-sumed to be invariant and the average RFcan be used for calculations. Alternatively,the results can be used to plot a calibrationcurve of response ratios, As/Ais, vs. RF.
7.4 The working calibration curve, cali-bration factor, or RF must be verified oneach working day by the measurement of oneor more calibration standards. If the re-sponse for any parameter varies from thepredicted response by more than ±15%, thetest must be repeated using a fresh calibra-tion standard. Alternatively, a new calibra-tion curve must be prepared for that com-pound.
7.5 The cleanup procedure in Section 11utilizes Florisil column chromatography.Florisil from different batches or sourcesmay vary in adsorptive capacity. To stand-ardize the amount of Florisil which is used,the use of lauric acid value 9 is suggested.The referenced procedure determines the ad-sorption from hexane solution of lauric acid(mg) per g of Florisil. The amount of Florisilto be used for each column is calculated bydividing 110 by this ratio and multiplying by20 g.
7.6 Before using any cleanup procedure,the analyst must process a series of calibra-
tion standards through the procedure to vali-date elution patterns and the absence ofinterferences from the reagents.
8. Quality Control
8.1 Each laboratory that uses this methodis required to operate a formal quality con-trol program. The minimum requirements ofthis program consist of an initial demonstra-tion of laboratory capability and an ongoinganalysis of spiked samples to evaluate anddocument data quality. The laboratory mustmaintain records to document the quality ofdata that is generated. Ongoing data qualitychecks are compared with established per-formance criteria to determine if the resultsof analyses meet the performance character-istics of the method. When results of samplespikes indicate atypical method perform-ance, a quality control check standard mustbe analyzed to confirm that the measure-ments were performed in an in-control modeof operation.
8.1.1 The analyst must make an initial,one-time, demonstration of the ability togenerate acceptable accuracy and precisionwith this method. This ability is establishedas described in Section 8.2.
8.1.2 In recognition of advances that areoccurring in chromatography, the analyst ispermitted certain options (detailed in Sec-tions 10.4, 11.1, and 12.1) to improve the sepa-rations or lower the cost of measurements.Each time such a modification is made tothe method, the analyst is required to repeatthe procedure in Section 8.2.
8.1.3 Before processing any samples, theanalyst must analyze a reagent water blankto demonstrate that interferences from theanalytical system and glassware are undercontrol. Each time a set of samples is ex-tracted or reagents are changed, a reagentwater blank must be processed as a safe-guard against laboratory contamination.
8.1.4 The laboratory must, on an ongoingbasis, spike and analyze a minimum of 10%of all samples to monitor and evaluate lab-oratory data quality. This procedure is de-scribed in Section 8.3.
8.1.5 The laboratory must, on an ongoingbasis, demonstrate through the analyses ofquality control check standards that the op-eration of the measurement system is in con-trol. This procedure is described in Section8.4. The frequency of the check standardanalyses is equivalent to 10% of all samplesanalyzed but may be reduced if spike recov-eries from samples (Section 8.3) meet allspecified quality control criteria.
8.1.6 The laboratory must maintain per-formance records to document the quality ofdata that is generated. This procedure is de-scribed in Section 8.5.
8.2 To establish the ability to generateacceptable accuracy and precision, the ana-lyst must perform the following operations.
VerDate 11<MAY>2000 01:52 Jul 20, 2001 Jkt 194155 PO 00000 Frm 00115 Fmt 8010 Sfmt 8002 Y:\SGML\194155T.XXX pfrm12 PsN: 194155T

116
40 CFR Ch. I (7–1–01 Edition)Pt. 136, App. A, Meth. 608
8.2.1 A quality control (QC) check sampleconcentrate is required containing each sin-gle-component parameter of interest at thefollowing concentrations in acetone: 4,4′–DDD, 10 µg/mL; 4,4′–DDT, 10 µg/mL;endosulfan II, 10 µg/mL; endosulfan sulfate,10 µg/mL; endrin, 10 µg/mL; any other single-component pesticide, 2 µg/mL. If this methodis only to be used to analyze for PCBs,chlordane, or toxaphene, the QC check sam-ple concentrate should contain the most rep-resentative multicomponent parameter at aconcentration of 50 µg/mL in acetone. The QCcheck sample concentrate must be obtainedfrom the U.S. Environmental ProtectionAgency, Environmental Monitoring and Sup-port Laboratory in Cincinnati, Ohio, if avail-able. If not available from that source, theQC check sample concentrate must be ob-tained from another external source. If notavailable from either source above, the QCcheck sample concentrate must be preparedby the laboratory using stock standards pre-pared independently from those used for cali-bration.
8.2.2 Using a pipet, prepare QC check sam-ples at the test concentrations shown inTable 3 by adding 1.00 mL of QC check sam-ple concentrate to each of four 1–L aliquotsof reagent water.
8.2.3 Analyze the well-mixed QC checksamples according to the method beginningin Section 10.
8.2.4 Calculate the average recovery (X̄) inµg/mL; and the standard deviation of the re-covery (s) in µg/mL, for each parameterusing the four results.
8.2.5 For each parameter compare s and X̄with the corresponding acceptance criteriafor precision and accuracy, respectively,found in Table 3. If s and X̄ for all param-eters of interest meet the acceptance cri-teria, the system performance is acceptableand analysis of actual samples can begin. Ifany individual s exceeds the precision limitor any individual X̄ falls outside the rangefor accuracy, the system performance is un-acceptable for that parameter.
NOTE: The large number of parameters inTable 3 present a substantial probabilitythat one or more will fail at least one of theacceptance criteria when all parameters areanalyzed.
8.2.6 When one or more of the parameterstested fail at least one of the acceptance cri-teria, the analyst must proceed according toSection 8.2.6.1 or 8.2.6.2.
8.2.6.1 Locate and correct the source ofthe problem and repeat the test for all pa-rameters of interest beginning with Section8.2.2.
8.2.6.2 Beginning with Section 8.2.2, repeatthe test only for those parameters thatfailed to meet criteria. Repeated failure,however, will confirm a general problemwith the measurement system. If this occurs,locate and correct the source of the problem
and repeat the test for all compmunds of in-terest beginning with Section 8.2.2.
8.3 The laboratory must, on an ongoingbasis, spike at least 10% of the samples fromeach sample site being monitored to assessaccuracy. For laboratories analyzing one toten samples per month, at least one spikedsample per month is required.
8.3.1 The concentration of the spike in thesample should be determined as follows:
8.3.1.1 If, as in compliance monitoring,the concentration of a specific parameter inthe sample is being checked against a regu-latory concentration limit, the spike shouldbe at that limit or 1 to 5 times higher thanthe background concentration determined inSection 8.3.2, whichever concentration wouldbe larger.
8.3.1.2 If the concentration of a specificparameter in the sample is not beingchecked against a limit specific to that pa-rameter, the spike should be at the test con-centration in Section 8.2.2 or 1 to 5 timeshigher than the background concentrationdetermined in Section 8.3.2, whichever con-centration would be larger.
8.3.1.3 If it is impractical to determinebackground levels before spiking (e.g., max-imum holding times will be exceeded), thespike concentration should be (1) the regu-latory concentration limit, if any; or, if none(2) the larger of either 5 times higher thanthe expected background concentration orthe test concentration in Section 8.2.2.
8.3.2 Analyze one sample aliquot to deter-mine the background concentration (B) ofeach parameter. If necessary, prepare a newQC check sample concentrate (Section 8.2.1)appropriate for the background concentra-tions in the sample. Spike a second samplealiquot with 1.0 mL of the QC check sampleconcentrate and analyze it to determine theconcentration after spiking (A) of each pa-rameter. Calculate each percent recovery (P)as 100(A–B)%/T, where T is the known truevalue of the spike.
8.3.3 Compare the percent recovery (P) foreach parameter with the corresponding QCacceptance criteria found in Table 3. Theseacceptance criteria were calculated to in-clude an allowance for error in measurementof both the background and spike concentra-tions, assuming a spike to background ratioof 5:1. This error will be accounted for to theextent that the analyst’s spike to back-ground ratio approaches 5:1.10 If spiking wasperformed at a concentration lower than thetest concentration in Section 8.2.2, the ana-lyst must use either the QC acceptance cri-teria in Table 3, or optional QC acceptancecriteria calculated for the specific spike con-centration. To calculate optional acceptancecriteria for the recovery of a parameter: (1)Calculate accuracy (X′) using the equation inTable 4, substituting the spike concentration(T) for C; (2) calculate overall precision (S′)using the equation in Table 4, substituting X′
VerDate 11<MAY>2000 01:52 Jul 20, 2001 Jkt 194155 PO 00000 Frm 00116 Fmt 8010 Sfmt 8002 Y:\SGML\194155T.XXX pfrm12 PsN: 194155T

117
Environmental Protection Agency Pt. 136, App. A, Meth. 608
for X̄; (3) calculate the range for recovery atthe spike concentration as (100 X′/T)±2.44(100S′/T)%.10
8.3.4 If any individual P falls outside thedesignated range for recovery, that param-eter has failed the acceptance criteria. Acheck standard containing each parameterthat failed the criteria must be analyzed asdescribed in Section 8.4.
8.4 If any parameter fails the acceptancecriteria for recovery in Section 8.3, a QCcheck standard containing each parameterthat failed must be prepared and analyzed.
NOTE: The frequency for the required anal-ysis of a QC check standard will depend uponthe number of parameters being simulta-neously tested, the complexity of the samplematrix, and the performance of the labora-tory. If the entire list of parameters in Table3 must be measured in the sample in Section8.3, the probability that the analysis of a QCcheck standard will be required is high. Inthis case the QC check standard should beroutinely analyzed with the spike sample.
8.4.1 Prepare the QC check standard byadding 1.0 mL of QC check sample con-centrate (Section 8.2.1 or 8.3.2) to 1 L of rea-gent water. The QC check standard needsonly to contain the parameters that failedcriteria in the test in Section 8.3.
8.4.2 Analyze the QC check standards todetermine the concentration measured (A) ofeach parameter. Calculate each percent re-covery (Ps) as 100 (A/T)%, where T is the truevalue of the standard concentration.
8.4.3 Compare the percent recovery (Ps)for each parameter with the correspondingQC acceptance criteria found in Table 3. Onlyparameters that failed the test in Section 8.3need to be compared with these criteria. Ifthe recovery of any such parameter falls out-side the designated range, the laboratoryperformance for that parameter is judged tobe out of control, and the problem must beimmediately identified and corrected. Theanalytical result for that parameter in theunspiked sample is suspect and may not bereported for regulatory compliance purposes.
8.5 As part of the QC program for the lab-oratory, method accuracy for wastewatersamples must be assessed and records mustbe maintained. After the analysis of fivespiked wastewater samples as in Section 8.3,calculate the average percent recovery (P̄)and the standard deviation of the percent re-covery (sp). Express the accuracy assessmentas a percent recovery interval from P̄¥2 sp
to P̄+2 sp. If P̄=90% and sp=10%, for example,the accuracy interval is expressed as 70–110%. Update the accuracy assessment foreach parameter on a regular basis (e.g. aftereach five to ten new accuracy measure-ments).
8.6 It is recommended that the laboratoryadopt additional quality assurance practicesfor use with this method. The specific prac-tices that are most productive depend upon
the needs of the laboratory and the nature ofthe samples. Field duplicates may be ana-lyzed to assess the precision of the environ-mental measurements. When doubt existsover the identification of a peak on the chro-matogram, confirmatory techniques such asgas chromatography with a dissimilar col-umn, specific element detector, or massspectrometer must be used. Whenever pos-sible, the laboratory should analyze standardreference materials and participate in rel-evant performance evaluation studies.
9. Sample Collection, Preservation, andHandling
9.1 Grab samples must be collected inglass containers. Conventional samplingpractices 11 should be followed, except thatthe bottle must not be prerinsed with samplebefore collection. Composite samples shouldbe collected in refrigerated glass containersin accordance with the requirements of theprogram. Automatic sampling equipmentmust be as free as possible of Tygon tubingand other potential sources of contamina-tion.
9.2 All samples must be iced or refrig-erated at 4 °C from the time of collectionuntil extraction. If the samples will not beextracted within 72 h of collection, the sam-ple should be adjusted to a pH range of 5.0 to9.0 with sodium hydroxide solution or sul-furic acid. Record the volume of acid or baseused. If aldrin is to be determined, add so-dium thiosulfate when residual chlorine ispresent. EPA Methods 330.4 and 330.5 may beused for measurement of residual chlorine.12
Field test kits are available for this purpose.9.3 All samples must be extracted within 7
days of collection and completely analyzedwithin 40 days of extraction.2
10. Sample Extraction
10.1 Mark the water meniscus on the sideof the sample bottle for later determinationof sample volume. Pour the entire sampleinto a 2–L separatory funnel.
10.2 Add 60 mL of methylene chloride tothe sample bottle, seal, and shake 30 s torinse the inner surface. Transfer the solventto the separatory funnel and extract thesample by shaking the funnel for 2 min. withperiodic venting to release excess pressure.Allow the organic layer to separate from thewater phase for a minimum of 10 min. If theemulsion interface between layers is morethan one-third the volume of the solventlayer, the analyst must employ mechanicaltechniques to complete the phase separation.The optium technique depends upon the sam-ple, but may include stirring, filtration ofthe emulsion through glass wool, centrifuga-tion, or other physical methods. Collect themethylene chloride extract in a 250–mL Er-lenmeyer flask.
VerDate 11<MAY>2000 01:52 Jul 20, 2001 Jkt 194155 PO 00000 Frm 00117 Fmt 8010 Sfmt 8002 Y:\SGML\194155T.XXX pfrm12 PsN: 194155T

118
40 CFR Ch. I (7–1–01 Edition)Pt. 136, App. A, Meth. 608
10.3 Add a second 60-mL volume of meth-ylene chloride to the sample bottle and re-peat the extraction procedure a second time,combining the extracts in the Erlenmeyerflask. Perform a third extraction in the samemanner.
10.4 Assemble a Kuderna-Danish (K–D)concentrator by attaching a 10-mL concen-trator tube to a 500-mL evaporative flask.Other concentration devices or techniquesmay be used in place of the K–D concen-trator if the requirements of Section 8.2 aremet.
10.5 Pour the combined extract through asolvent-rinsed drying column containingabout 10 cm of anhydrous sodium sulfate,and collect the extract in the K–D concen-trator. Rinse the Erlenmeyer flask and col-umn with 20 to 30 mL of methylene chlorideto complete the quantitative transfer.
10.6 Add one or two clean boiling chips tothe evaporative flask and attach a three-ballSnyder column. Prewet the Snyder columnby adding about 1 mL of methylene chlorideto the top. Place the K–D apparatus on a hotwater bath (60 to 65 °C) so that the concen-trator tube is partially immersed in the hotwater, and the entire lower rounded surfaceof the flask is bathed with hot vapor. Adjustthe vertical position of the apparatus andthe water temperature as required to com-plete the concentration in 15 to 20 min. Atthe proper rate of distillation the balls of thecolumn will actively chatter but the cham-bers will not flood with condensed solvent.When the apparent volume of liquid reaches1 mL, remove the K–D apparatus and allow itto drain and cool for at least 10 min.
10.7 Increase the temperature of the hotwater bath to about 80 °C. Momeltarily re-move the Snyder column, add 50 mL ofhexane and a new boiling chip, and reattachthe Snyder column. Concentrate the extractas in Section 10.6, except use hexane toprewet the column. The elapsed time of con-centration should be 5 to 10 min.
10.8 Remove the Snyder column and rinsethe flask and its lower joint into the concen-trator tube with 1 to 2 mL of hexane. A 5-mLsyringe is recommended for this operation.Stopper the concentrator tube and store re-frigerated if further processing will not beperformed immediately. If the extract willbe stored longer than two days, it should betransferred to a Teflon-sealed screw-cap vial.If the sample extract requires no furthercleanup, proceed with gas chromatographicanalysis (Section 12). If the sample requiresfurther cleanup, proceed to Section 11.
10.9 Determine the original sample vol-ume by refilling the sample bottle to themark and transferring the liquid to a 1000-mL graduated cylinder. Record the samplevolume to the nearest 5 mL.
11. Cleanup and Separation
11.1 Cleanup procedures may not be nec-essary for a relatively clean sample matrix.If particular circumstances demand the useof a cleanup procedure, the analyst may useeither procedure below or any other appro-priate procedure. However, the analyst firstmust demonstrate that the requirements ofSection 8.2 can be met using the method asrevised to incorporate the cleanup proce-dure. The Florisil column allows for a selectfractionation of the compounds and willeliminate polar interferences. Elemental sul-fur, which interferes with the electron cap-ture gas chromatography of certain pes-ticides, can be removed by the technique de-scribed in Section 11.3.
11.2 Florisil column cleanup:11.2.1 Place a weight of Florisil (nomi-
nally 20 g) predetermined by calibration(Section 7.5), into a chromatographic col-umn. Tap the column to settle the Florisiland add 1 to 2 cm of anhydrous sodium sul-fate to the top.
11.2.2 Add 60 mL of hexane to wet andrinse the sodium sulfate and Florisil. Justprior to exposure of the sodium sulfate layerto the air, stop the elution of the hexane byclosing the stopcock on the chromatographiccolumn. Discard the eluate.
11.2.3 Adjust the sample extract volumeto 10 mL with hexane and transfer it fromthe K–D concentrator tube onto the column.Rinse the tube twice with 1 to 2 mL ofhexane, adding each rinse to the column.
11.2.4 Place a 500-mL K–D flask and cleanconcentrator tube under the chroma-tographic column. Drain the column into theflask until the sodium sulfate layer is nearlyexposed. Elute the column with 200 mL of 6%ethyl ether in hexane (V/V) (Fraction 1) at arate of about 5 mL/min. Remove the K–Dflask and set it aside for later concentration.Elute the column again, using 200 mL of 15%ethyl ether in hexane (V/V) (Fraction 2), intoa second K–D flask. Perform the thirdelution using 200 mL of 50% ethyl ether inhexane (V/V) (Fraction 3). The elution pat-terns for the pesticides and PCBs are shownin Table 2.
11.2.5 Concentrate the fractions as in Sec-tion 10.6, except use hexane to prewet thecolumn and set the water bath at about 85°C. When the apparatus is cool, remove theSnyder column and rinse the flask and itslower joint into the concentrator tube withhexane. Adjust the volume of each fractionto 10 mL with hexane and analyze by gaschromatography (Section 12).
11.3 Elemental sulfur will usually eluteentirely in Fraction 1 of the Florisil columncleanup. To remove sulfur interference fromthis fraction or the original extract, pipet1.00 mL of the concentrated extract into aclean concentrator tube or Teflon-sealedvial. Add one to three drops of mercury and
VerDate 11<MAY>2000 01:52 Jul 20, 2001 Jkt 194155 PO 00000 Frm 00118 Fmt 8010 Sfmt 8002 Y:\SGML\194155T.XXX pfrm12 PsN: 194155T

119
Environmental Protection Agency Pt. 136, App. A, Meth. 608
seal.13 Agitate the contents of the vial for 15to 30 s. Prolonged shaking (2 h) may be re-quired. If so, this may be accomplished witha reciprocal shaker. Alternatively, activatedcopper powder may be used for sulfur re-moval.14 Analyze by gas chromatography.
12. Gas Chromatography
12.1 Table 1 summarizes the recommendedoperating conditions for the gas chro-matograph. Included in this table are reten-tion times and MDL that can be achievedunder these conditions. Examples of the sep-arations achieved by Column 1 are shown inFigures 1 to 10. Other packed or capillary(open-tubular) columns, chromatographicconditions, or detectors may be used if therequirements of Section 8.2 are met.
12.2 Calibrate the system daily as de-scribed in Section 7.
12.3 If the internal standard calibrationprocedure is being used, the internal stand-ard must be added to the sample extract andmixed thoroughly immediately before injec-tion into the gas chromatograph.
12.4 Inject 2 to 5 µL of the sample extractor standard into the gas chromatographusing the solvent-flush technique.15 Smaller(1.0 uL) volumes may be injected if auto-matic devices are employed. Record the vol-ume injected to the nearest 0.05 µL, the totalextract volume, and the resulting peak sizein area or peak height units.
12.5 Identify the parameters in the sampleby comparing the retention times of thepeaks in the sample chromatogram withthose of the peaks in standardchromatograms. The width of the retentiontime window used to make identificationsshould be based upon measurements of ac-tual retention time variations of standardsover the course of a day. Three times thestandard deviation of a retention time for acompound can be used to calculate a sug-gested window size; however, the experienceof the analyst should weigh heavily in theinterpretation of chromatograms.
12.6 If the response for a peak exceeds theworking range of the system, dilute the ex-tract and reanalyze.
12.7 If the measurement of the peak re-sponse is prevented by the presence of inter-ferences, further cleanup is required.
13. Calculations
13.1 Determine the concentration of indi-vidual compounds in the sample.
13.1.1 If the external standard calibrationprocedure is used, calculate the amount ofmaterial injected from the peak responseusing the calibration curve or calibrationfactor determined in Section 7.2.2. The con-centration in the sample can be calculatedfrom Equation 2.
Concentration ( g/L)µ =( )( )( )( )
A V
V Vt
i s
Equation 2
where:A=Amount of material injected (ng).Vi=Volume of extract injected (µL).Vt=Volume of total extract (µL).Vs=Volume of water extracted (mL).
13.1.2 If the internal standard calibrationprocedure is used, calculate the concentra-tion in the sample using the response factor(RF) determined in Section 7.3.2 and Equa-tion 3.
Concentration ( g/L)µ =( )( )
( )( )( )A I
A RF Vs s
is o
Equation 3
where:As=Response for the parameter to be meas-
ured.Ais=Response for the internal standard.Is=Amount of internal standard added to
each extract (µg).Vo=Volume of water extracted (L).
13.2 When it is apparent that two or morePCB (Aroclor) mixtures are present, theWebb and McCall procedure 16 may be used toidentify and quantify the Aroclors.
13.3 For multicomponent mixtures(chlordane, toxaphene, and PCBs) match re-tention times of peaks in the standards withpeaks in the sample. Quantitate every iden-tifiable peak unless interference with indi-vidual peaks persist after cleanup. Add peakheight or peak area of each identified peakin the chromatogram. Calculate as total re-sponse in the sample versus total response inthe standard.
13.4 Report results in µg/L without correc-tion for recovery data. All QC data obtainedshould be reported with the sample results.
14. Method Performance
14.1 The method detection limit (MDL) isdefined as the minimum concentration of asubstance that can be measured and reportedwith 99% confidence that the value is abovezero.1 The MDL concentrations listed inTable 1 were obtained using reagent water.17
Similar results were achieved using rep-resentative wastewaters. The MDL actuallyachieved in a given analysis will vary de-pending on instrument sensitivity and ma-trix effects.
14.2 This method has been tested for lin-earity of spike recovery from reagent waterand has been demonstrated to be applicableover the concentration range from 4×MDL to1000×MDL with the following exceptions:Chlordane recovery at 4×MDL was low (60%);
VerDate 11<MAY>2000 01:52 Jul 20, 2001 Jkt 194155 PO 00000 Frm 00119 Fmt 8010 Sfmt 8002 Y:\SGML\194155T.XXX pfrm12 PsN: 194155T

120
40 CFR Ch. I (7–1–01 Edition)Pt. 136, App. A, Meth. 608
Toxaphene recovery was demonstrated linearover the range of 10×MDL to 1000×MDL.17
14.3 This method was tested by 20 labora-tories using reagent water, drinking water,surface water, and three industrialwastewaters spiked at six concentrations.18
Concentrations used in the study rangedfrom 0.5 to 30 µg/L for single-component pes-ticides and from 8.5 to 400 µg/L for multi-component parameters. Single operator pre-cision, overall precision, and method accu-racy were found to be directly related to theconcentration of the parameter and essen-tially independent of the sample matrix.Linear equations to describe these relation-ships are presented in Table 4.
REFERENCES
1. 40 CFR part 136, appendix B.2. ‘‘Determination of Pesticides and PCBs
in Industrial and Municipal Wastewaters,’’EPA 600/4–82–023, National Technical Infor-mation Service, PB82–214222, Springfield,Virginia 22161, April 1982.
3. ASTM Annual Book of Standards, Part31, D3694–78. ‘‘Standard Practices for Prepa-ration of Sample Containers and for Preser-vation of Organic Constituents,’’ AmericanSociety for Testing and Materials, Philadel-phia.
4. Giam, C.S., Chan, H.S., and Nef, G.S.,‘‘Sensitive Method for Determination ofPhthalate Ester Plasticizers in Open-OceanBiota Samples,’’ Analytical Chemistry, 47, 2225(1975).
5. Giam, C.S., Chan, H.S. ‘‘Control ofBlanks in the Analysis of Phthalates in Airand Ocean Biota Samples,’’ U.S. NationalBureau of Standards, Special Publication442, pp. 701–708, 1976.
6. ‘‘Carcinogens—Working With Carcino-gens,’’ Department of Health, Education, andWelfare, Public Health Service, Center forDisease Control, National Institute for Occu-pational Safety and Health, Publication No.77–206, August 1977.
7. ‘‘OSHA Safety and Health Standards,General Industry,’’ (29 CFR part 1910), Occu-pational Safety and Health Administration,OSHA 2206 (Revised, January 1976).
8. ‘‘Safety in Academic Chemistry Labora-tories,’’ American Chemical Society Publica-tion, Committee on Chemical Safety, 3rdEdition, 1979.
9. Mills, P.A. ‘‘Variation of Florisil Activ-ity: Simple Method for Measuring AbsorbentCapacity and Its Use in StandardizingFlorisil Columns,’’ Journal of the Associationof Official Analytical Chemists, 51, 29, (1968).
10. Provost, L.P., and Elder, R.S. ‘‘Inter-pretation of Percent Recovery Data,’’ Amer-ican Laboratory, 15, 58–63 (1983). (The value2.44 used in the equation in Section 8.3.3 istwo times the value 1.22 derived in this re-port.)
11. ASTM Annual Book of Standards, Part31, D3370–76. ‘‘Standard Practices for Sam-pling Water,’’ American Society for Testingand Materials, Philadelphia.
12. ‘‘Methods 330.4 (Titrimetric, DPD–FAS)and 330.5 (Spectrophotometric, DPD) forChlorine, Total Residual,’’ Methods forChemical Analysis of Water and Wastes,EPA–600/4–79–020, U.S. Environmental Pro-tection Agency, Environmental Monitoringand Support Laboratory, Cincinnati, Ohio45268, March 1979.
13. Goerlitz, D.F., and Law, L.M. Bulletinfor Environmental Contamination and Toxi-cology, 6, 9 (1971).
14. ‘‘Manual of Analytical Methods for theAnalysis of Pesticides in Human and Envi-ronmental Samples,’’ EPA–600/8–80–038, U.S.Environmental Protection Agency, HealthEffects Research Laboratory, Research Tri-angle Park, North Carolina.
15. Burke, J.A. ‘‘Gas Chromatography forPesticide Residue Analysis; Some PracticalAspects,’’ Journal of the Association of OfficialAnalytical Chemists, 48, 1037 (1965).
16. Webb, R.G., and McCall, A.C. ‘‘Quan-titative PCB Standards for Election CaptureGas Chromatography,’’ Journal ofChromatographic Science, 11, 366 (1973).
17. ‘‘Method Detection Limit and Analyt-ical Curve Studies, EPA Methods 606, 607,and 608,’’ Special letter report for EPA Con-tract 68–03–2606, U.S. Environmental Protec-tion Agency, Environmental Monitoring andSupport Laboratory, Cincinnati, Ohio 45268,June 1980.
18. ‘‘EPA Method Study 18 Method 608—Organochlorine Pesticides and PCBs,’’ EPA600/4–84–061, National Technical InformationService, PB84–211358, Springfield, Virginia22161, June 1984.
TABLE 1—CHROMATOGRAPHIC CONDITIONS AND METHOD DETECTION LIMITS
ParameterRetention time (min) Method detec-
tion limit(µg/L)Col. 1 Col. 2
α-BHC ....................................................................................................................... 1.35 1.82 0.003γ-BHC ........................................................................................................................ 1.70 2.13 0.004β-BHC ........................................................................................................................ 1.90 1.97 0.006Heptachlor ................................................................................................................. 2.00 3.35 0.003δ-BHC ........................................................................................................................ 2.15 2.20 0.009Aldrin ......................................................................................................................... 2.40 4.10 0.004Heptachlor epoxide ................................................................................................... 3.50 5.00 0.083Endosulfan I .............................................................................................................. 4.50 6.20 0.014
VerDate 11<MAY>2000 01:52 Jul 20, 2001 Jkt 194155 PO 00000 Frm 00120 Fmt 8010 Sfmt 8002 Y:\SGML\194155T.XXX pfrm12 PsN: 194155T

121
Environmental Protection Agency Pt. 136, App. A, Meth. 608
TABLE 1—CHROMATOGRAPHIC CONDITIONS AND METHOD DETECTION LIMITS—Continued
ParameterRetention time (min) Method detec-
tion limit(µg/L)Col. 1 Col. 2
4,4′-DDE .................................................................................................................... 5.13 7.15 0.004Dieldrin ...................................................................................................................... 5.45 7.23 0.002Endrin ........................................................................................................................ 6.55 8.10 0.0064,4′-DDD .................................................................................................................... 7.83 9.08 0.011Endosulfan II ............................................................................................................. 8.00 8.28 0.0044,4′-DDT .................................................................................................................... 9.40 11.75 0.012Endrin aldehyde ........................................................................................................ 11.82 9.30 0.023Endosulfan sulfate ..................................................................................................... 14.22 10.70 0.066Chlordane .................................................................................................................. mr mr 0.014Toxaphene ................................................................................................................. mr mr 0.24PCB–1016 ................................................................................................................. mr mr ndPCB–1221 ................................................................................................................. mr mr ndPCB–1232 ................................................................................................................. mt mr ndPCB–1242 ................................................................................................................. mr mr 0.065PCB–1248 ................................................................................................................. mr mr ndPCB–1254 ................................................................................................................. mr mr ndPCB–1260 ................................................................................................................. mr mr nd
AColumn 1 conditions: Supelcoport (100/120 mesh) coated with 1.5% SP–2250/1.95% SP–2401 packed in a 1.8 m long × 4mm ID glass column with 5% methane/95% argon carrier gas at 60 mL/min flow rate. Column temperature held isothermal at200 °C, except for PCB–1016 through PCB–1248, should be measured at 160 °C.
AColumn 2 conditions: Supelcoport (100/120 mesh) coated with 3% OV–1 packed in a 1.8 m long × 4 mm ID glass columnwith 5% methane/95% argon carrier gas at 60 mL/min flow rate. Column temperature held isothermal at 200 °C for the pes-ticides; at 140 °C for PCB–1221 and 1232; and at 170 °C for PCB–1016 and 1242 to 1268.
Amr=Multiple peak response. See Figures 2 thru 10.And=Not determined.
TABLE 2—DISTRIBUTION OF CHLORINATED PESTICIDES AND PCBS INTO FLORISIL COLUMNFRACTIONS 2
ParameterPercent recovery by fraction a
1 2 3
Aldrin ............................................................................................................................. 100 .................... ....................α-BHC ........................................................................................................................... 100 .................... ....................β-BHC ............................................................................................................................ 97 .................... ....................δ-BHC ............................................................................................................................ 98 .................... ....................γ-BHC ............................................................................................................................ 100 .................... ....................Chlordane ...................................................................................................................... 100 .................... ....................4,4′–DDD ....................................................................................................................... 99 .................... ....................4,4′–DDE ....................................................................................................................... 98 .................... ....................4,4′–DDT ....................................................................................................................... 100 .................... ....................Dieldrin .......................................................................................................................... 0 100 ....................Endosulfan I .................................................................................................................. 37 64 ....................Endosulfan II ................................................................................................................. 0 7 91Endosulfan sulfate ......................................................................................................... 0 0 106Endrin ............................................................................................................................ 4 96 ....................Endrin aldehyde ............................................................................................................ 0 68 26Heptachlor ..................................................................................................................... 100 .................... ....................Heptachlor epoxide ....................................................................................................... 100 .................... ....................Toxaphene ..................................................................................................................... 96 .................... ....................PCB–1016 ..................................................................................................................... 97 .................... ....................PCB–1221 ..................................................................................................................... 97 .................... ....................PCB–1232 ..................................................................................................................... 95 4 ....................PCB–1242 ..................................................................................................................... 97 .................... ....................PCB–1248 ..................................................................................................................... 103 .................... ....................PCB–1254 ..................................................................................................................... 90 .................... ....................PCB–1260 ..................................................................................................................... 95 .................... ....................
a Eluant composition:Fraction 1–6% ethyl ether in hexane.Fraction 2–15% ethyl ether in hexane.Fraction 3–50% ethyl ether in hexane.
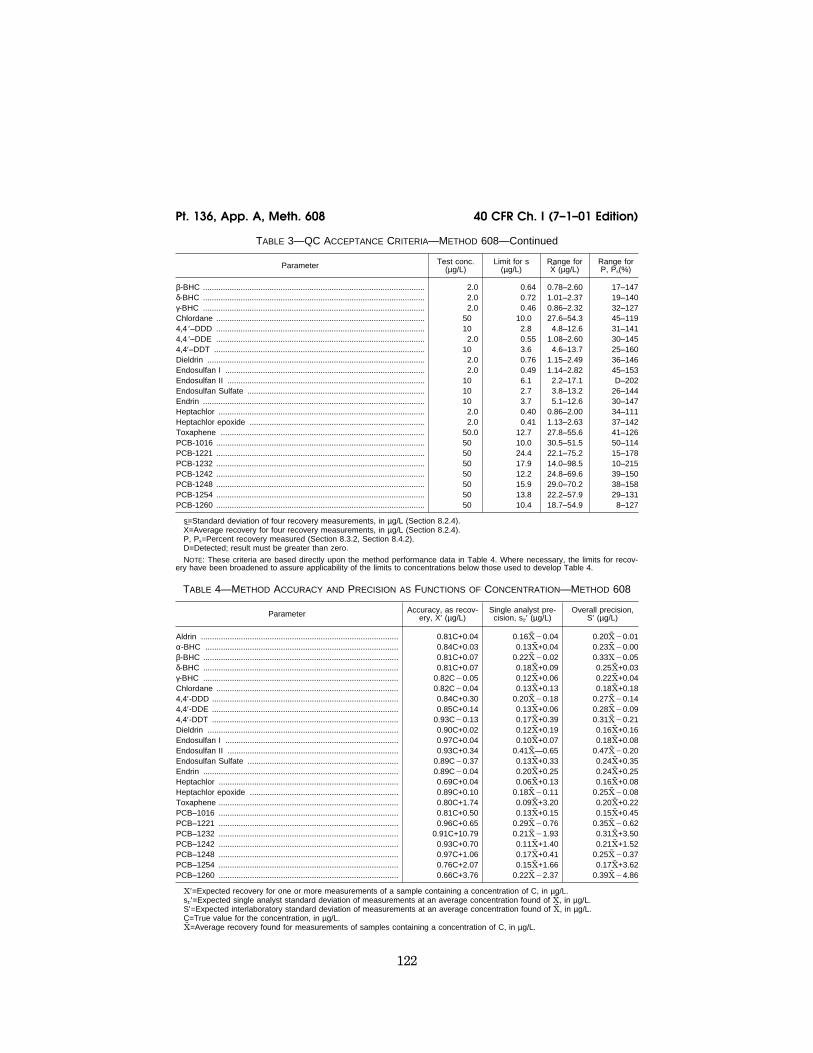
TABLE 3—QC ACCEPTANCE CRITERIA—METHOD 608
Parameter Test conc.(µg/L)
Limit for s(µg/L)
Range forX̄ (µg/L)
Range forP, Ps(%)
Aldrin ..................................................................................................... 2.0 0.42 1.08–2.24 42–122α-BHC ................................................................................................... 2.0 0.48 0.98–2.44 37–134
VerDate 11<MAY>2000 01:52 Jul 20, 2001 Jkt 194155 PO 00000 Frm 00121 Fmt 8010 Sfmt 8002 Y:\SGML\194155T.XXX pfrm12 PsN: 194155T
122
40 CFR Ch. I (7–1–01 Edition)Pt. 136, App. A, Meth. 608
TABLE 3—QC ACCEPTANCE CRITERIA—METHOD 608—Continued
Parameter Test conc.(µg/L)
Limit for s(µg/L)
Range forX̄ (µg/L)
Range forP, Ps(%)
β-BHC .................................................................................................... 2.0 0.64 0.78–2.60 17–147δ-BHC .................................................................................................... 2.0 0.72 1.01–2.37 19–140γ-BHC .................................................................................................... 2.0 0.46 0.86–2.32 32–127Chlordane .............................................................................................. 50 10.0 27.6–54.3 45–1194,4 ′–DDD .............................................................................................. 10 2.8 4.8–12.6 31–1414,4 ′–DDE .............................................................................................. 2.0 0.55 1.08–2.60 30–1454,4′–DDT ............................................................................................... 10 3.6 4.6–13.7 25–160Dieldrin .................................................................................................. 2.0 0.76 1.15–2.49 36–146Endosulfan I .......................................................................................... 2.0 0.49 1.14–2.82 45–153Endosulfan II ......................................................................................... 10 6.1 2.2–17.1 D–202Endosulfan Sulfate ................................................................................ 10 2.7 3.8–13.2 26–144Endrin .................................................................................................... 10 3.7 5.1–12.6 30–147Heptachlor ............................................................................................. 2.0 0.40 0.86–2.00 34–111Heptachlor epoxide ............................................................................... 2.0 0.41 1.13–2.63 37–142Toxaphene ............................................................................................ 50.0 12.7 27.8–55.6 41–126PCB-1016 .............................................................................................. 50 10.0 30.5–51.5 50–114PCB-1221 .............................................................................................. 50 24.4 22.1–75.2 15–178PCB-1232 .............................................................................................. 50 17.9 14.0–98.5 10–215PCB-1242 .............................................................................................. 50 12.2 24.8–69.6 39–150PCB-1248 .............................................................................................. 50 15.9 29.0–70.2 38–158PCB-1254 .............................................................................................. 50 13.8 22.2–57.9 29–131PCB-1260 .............................................................................................. 50 10.4 18.7–54.9 8–127
s=Standard deviation of four recovery measurements, in µg/L (Section 8.2.4).X̄=Average recovery for four recovery measurements, in µg/L (Section 8.2.4).P, Ps=Percent recovery measured (Section 8.3.2, Section 8.4.2).D=Detected; result must be greater than zero.
NOTE: These criteria are based directly upon the method performance data in Table 4. Where necessary, the limits for recov-ery have been broadened to assure applicability of the limits to concentrations below those used to develop Table 4.
TABLE 4—METHOD ACCURACY AND PRECISION AS FUNCTIONS OF CONCENTRATION—METHOD 608
Parameter Accuracy, as recov-ery, X′ (µg/L)
Single analyst pre-cision, sr′ (µg/L)
Overall precision,S′ (µg/L)
Aldrin ......................................................................................... 0.81C+0.04 0.16X̄¥0.04 0.20X̄¥0.01α-BHC ....................................................................................... 0.84C+0.03 0.13X̄+0.04 0.23X̄¥0.00β-BHC ........................................................................................ 0.81C+0.07 0.22X̄¥0.02 0.33X¥0.05δ-BHC ........................................................................................ 0.81C+0.07 0.18X̄+0.09 0.25X̄+0.03γ-BHC ........................................................................................ 0.82C¥0.05 0.12X̄+0.06 0.22X̄+0.04Chlordane .................................................................................. 0.82C¥0.04 0.13X̄+0.13 0.18X̄+0.184,4′-DDD .................................................................................... 0.84C+0.30 0.20X̄¥0.18 0.27X̄¥0.144,4′-DDE .................................................................................... 0.85C+0.14 0.13X̄+0.06 0.28X̄¥0.094,4′-DDT .................................................................................... 0.93C¥0.13 0.17X̄+0.39 0.31X̄¥0.21Dieldrin ...................................................................................... 0.90C+0.02 0.12X̄+0.19 0.16X̄+0.16Endosulfan I .............................................................................. 0.97C+0.04 0.10X̄+0.07 0.18X̄+0.08Endosulfan II ............................................................................. 0.93C+0.34 0.41X̄—0.65 0.47X̄¥0.20Endosulfan Sulfate .................................................................... 0.89C¥0.37 0.13X̄+0.33 0.24X̄+0.35Endrin ........................................................................................ 0.89C¥0.04 0.20X̄+0.25 0.24X̄+0.25Heptachlor ................................................................................. 0.69C+0.04 0.06X̄+0.13 0.16X̄+0.08Heptachlor epoxide ................................................................... 0.89C+0.10 0.18X̄¥0.11 0.25X̄¥0.08Toxaphene ................................................................................. 0.80C+1.74 0.09X̄+3.20 0.20X̄+0.22PCB–1016 ................................................................................. 0.81C+0.50 0.13X̄+0.15 0.15X̄+0.45PCB–1221 ................................................................................. 0.96C+0.65 0.29X̄¥0.76 0.35X̄¥0.62PCB–1232 ................................................................................. 0.91C+10.79 0.21X̄¥1.93 0.31X̄+3.50PCB–1242 ................................................................................. 0.93C+0.70 0.11X̄+1.40 0.21X̄+1.52PCB–1248 ................................................................................. 0.97C+1.06 0.17X̄+0.41 0.25X̄¥0.37PCB–1254 ................................................................................. 0.76C+2.07 0.15X̄+1.66 0.17X̄+3.62PCB–1260 ................................................................................. 0.66C+3.76 0.22X̄¥2.37 0.39X̄¥4.86
X′=Expected recovery for one or more measurements of a sample containing a concentration of C, in µg/L.sr′=Expected single analyst standard deviation of measurements at an average concentration found of X̄, in µg/L.S′=Expected interlaboratory standard deviation of measurements at an average concentration found of X̄, in µg/L.C=True value for the concentration, in µg/L.X̄=Average recovery found for measurements of samples containing a concentration of C, in µg/L.
VerDate 11<MAY>2000 01:52 Jul 20, 2001 Jkt 194155 PO 00000 Frm 00122 Fmt 8010 Sfmt 8002 Y:\SGML\194155T.XXX pfrm12 PsN: 194155T

123
Environmental Protection Agency Pt. 136, App. A, Meth. 608
VerDate 11<MAY>2000 01:52 Jul 20, 2001 Jkt 194155 PO 00000 Frm 00123 Fmt 8010 Sfmt 8006 Y:\SGML\194155T.XXX pfrm12 PsN: 194155T

124
40 CFR Ch. I (7–1–01 Edition)Pt. 136, App. A, Meth. 608
VerDate 11<MAY>2000 01:52 Jul 20, 2001 Jkt 194155 PO 00000 Frm 00124 Fmt 8010 Sfmt 8006 Y:\SGML\194155T.XXX pfrm12 PsN: 194155T

125
Environmental Protection Agency Pt. 136, App. A, Meth. 608
VerDate 11<MAY>2000 01:52 Jul 20, 2001 Jkt 194155 PO 00000 Frm 00125 Fmt 8010 Sfmt 8006 Y:\SGML\194155T.XXX pfrm12 PsN: 194155T

126
40 CFR Ch. I (7–1–01 Edition)Pt. 136, App. A, Meth. 608
VerDate 11<MAY>2000 01:52 Jul 20, 2001 Jkt 194155 PO 00000 Frm 00126 Fmt 8010 Sfmt 8006 Y:\SGML\194155T.XXX pfrm12 PsN: 194155T

127
Environmental Protection Agency Pt. 136, App. A, Meth. 608
VerDate 11<MAY>2000 01:52 Jul 20, 2001 Jkt 194155 PO 00000 Frm 00127 Fmt 8010 Sfmt 8006 Y:\SGML\194155T.XXX pfrm12 PsN: 194155T

128
40 CFR Ch. I (7–1–01 Edition)Pt. 136, App. A, Meth. 608
VerDate 11<MAY>2000 01:52 Jul 20, 2001 Jkt 194155 PO 00000 Frm 00128 Fmt 8010 Sfmt 8006 Y:\SGML\194155T.XXX pfrm12 PsN: 194155T
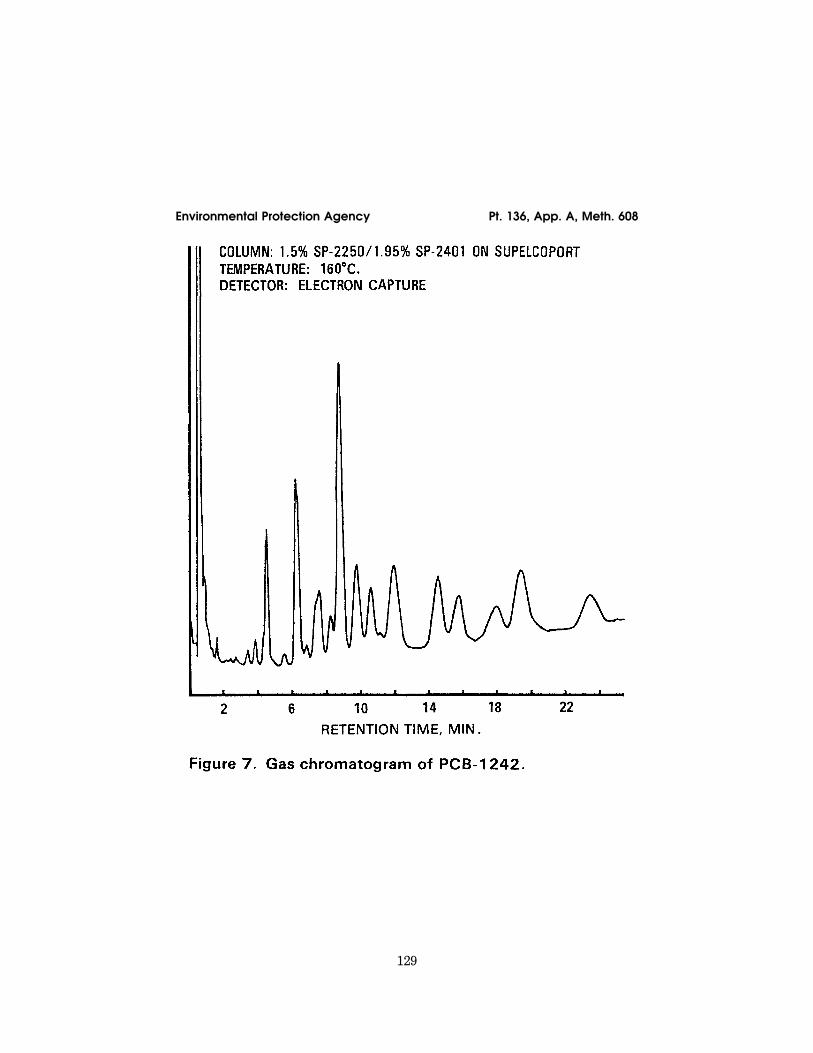
129
Environmental Protection Agency Pt. 136, App. A, Meth. 608
VerDate 11<MAY>2000 01:52 Jul 20, 2001 Jkt 194155 PO 00000 Frm 00129 Fmt 8010 Sfmt 8006 Y:\SGML\194155T.XXX pfrm12 PsN: 194155T
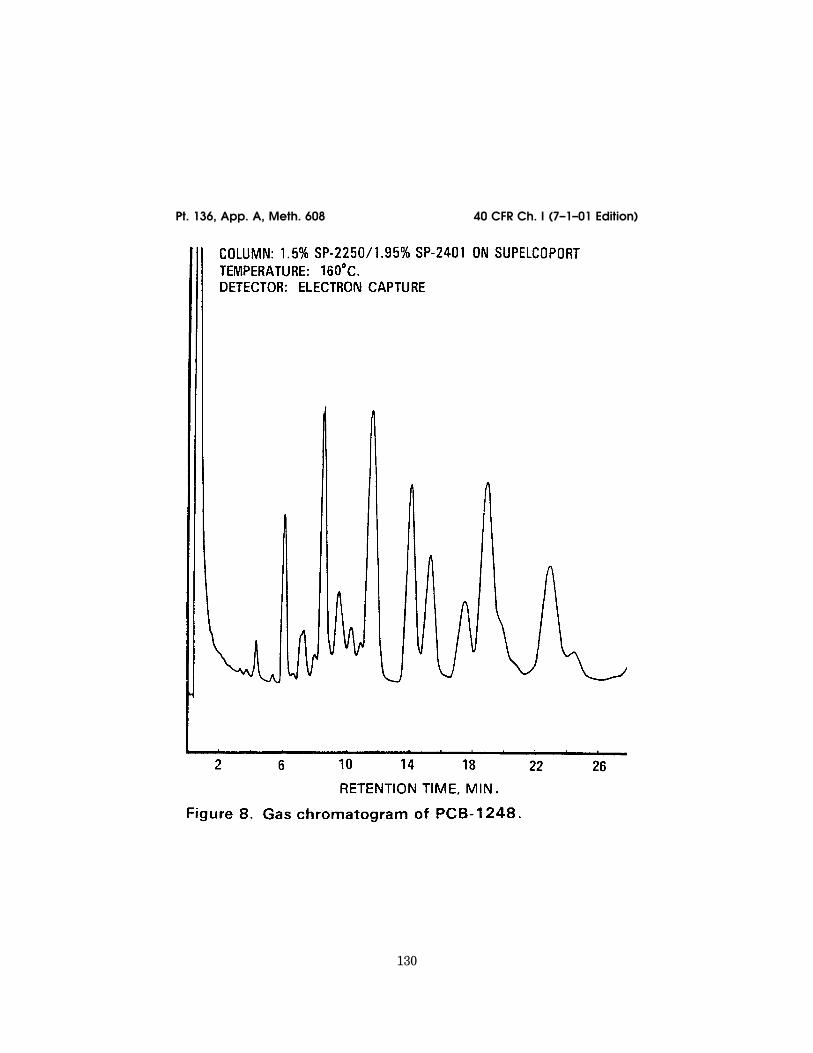
130
40 CFR Ch. I (7–1–01 Edition)Pt. 136, App. A, Meth. 608
VerDate 11<MAY>2000 01:52 Jul 20, 2001 Jkt 194155 PO 00000 Frm 00130 Fmt 8010 Sfmt 8006 Y:\SGML\194155T.XXX pfrm12 PsN: 194155T

131
Environmental Protection Agency Pt. 136, App. A, Meth. 608
VerDate 11<MAY>2000 01:52 Jul 20, 2001 Jkt 194155 PO 00000 Frm 00131 Fmt 8010 Sfmt 8006 Y:\SGML\194155T.XXX pfrm12 PsN: 194155T

132
40 CFR Ch. I (7–1–01 Edition)Pt. 136, App. A, Meth. 609
METHOD 609—NITROAROMATICS AND
ISOPHORONE
1. Scope and Application
1.1 This method covers the determinationof certain nitroaromatics and isophorone.The following parameters may be deter-mined by this method:
Parameter STORETNo. CAS No.
2,4-Dinitrotoluene ...................... 34611 121–14–22,6-Dinitrotoluene ...................... 34626 606–20–2Isophorone ................................. 34408 78–59–1Nitrobenzene ............................. 34447 98–95–3
1.2 This is a gas chromatographic (GC)method applicable to the determination of
VerDate 11<MAY>2000 01:52 Jul 20, 2001 Jkt 194155 PO 00000 Frm 00132 Fmt 8010 Sfmt 8002 Y:\SGML\194155T.XXX pfrm12 PsN: 194155T