pt astra international tbk full year 2017 - results ... · •pelabuhan penajam banua taka...
TRANSCRIPT
PT ASTRA INTERNATIONAL TBK Full Year 2017 - Results Presentation

The materials in this presentation have been prepared by PT Astra International Tbk (Astra) and are generalbackground information about Astra Group business performances current as at the date of this presentation andare subject to change without prior notice.
This information is given in summary form and does not purport to be complete. Information in this presentation,including forecast financial information, should not be considered as advice or a recommendation to investors orpotential investors in relation to holding, purchasing or selling securities or other financial products or instrumentsand does not take into account their particular investment objectives, financial situation or needs. Before acting onany information, readers should consider the appropriateness of the information having regard to these matters,any relevant offer document and in particular, readers should seek independent financial advice.
This presentation may contain forward looking statements including statements regarding our intent, belief orcurrent expectations with respect to Astra businesses and operations, market conditions, results of operation andfinancial condition, capital adequacy, specific provisions and risk management practices. Readers are cautioned notto place undue reliance on these forward looking statements; past performance is not a reliable indication offuture performance. Astra does not undertake any obligation to publicly release the result of any revisions to theseforward looking statements to reflect events or circumstances after the date hereof to reflect the occurrence ofunanticipated events.
We disclaim any responsibility or liability whatsoever arising which may be brought or suffered by any person as aresult of acting in reliance upon the whole or any part of the contents of this report and neither Astra and/or itsaffiliated companies and/or their respective employees and/or agents accepts liability for any errors, omissions,negligent or otherwise, in this report and any inaccuracy herein or omission here from which might otherwisearise.
Disclaimer
1

2
Group ResultsFor the year ended 31st December
2017 2016 Change
Net revenue (Rp bn) 206,057 181,084 14%
Net income (Rp bn)* 18,881 15,156 25%
Net earnings per share (Rp) 466 374 25%
As at 31st
December 2017As at 31st
December 2016Change
Shareholders’ funds (Rp bn)** 123,645 111,951 10%
Net asset value per share (Rp)** 3,054 2,765 10%
* Net income is profit attributable to owners of the parent, i.e. Astra International shareholders. ** Shareholders' funds and net asset value per share are based on equity attributable to owners of the parent.The financial results for the year ended 31st December 2017 and 2016 as well as the financial position as at 31st December 2017 and 2016 have been prepared in accordance with Indonesian Financial Accounting Standards and are audited in accordance with the auditing standards established by the Indonesian Institute of Certified Public Accountants.
Return to profitability
atPermata Bank
Net earnings per shareRp466
25% 54% 75%
Auto Market ShareSustained higher commodity
prices benefited heavy equipment and mining businesses, as well as
agribusiness
Highlights
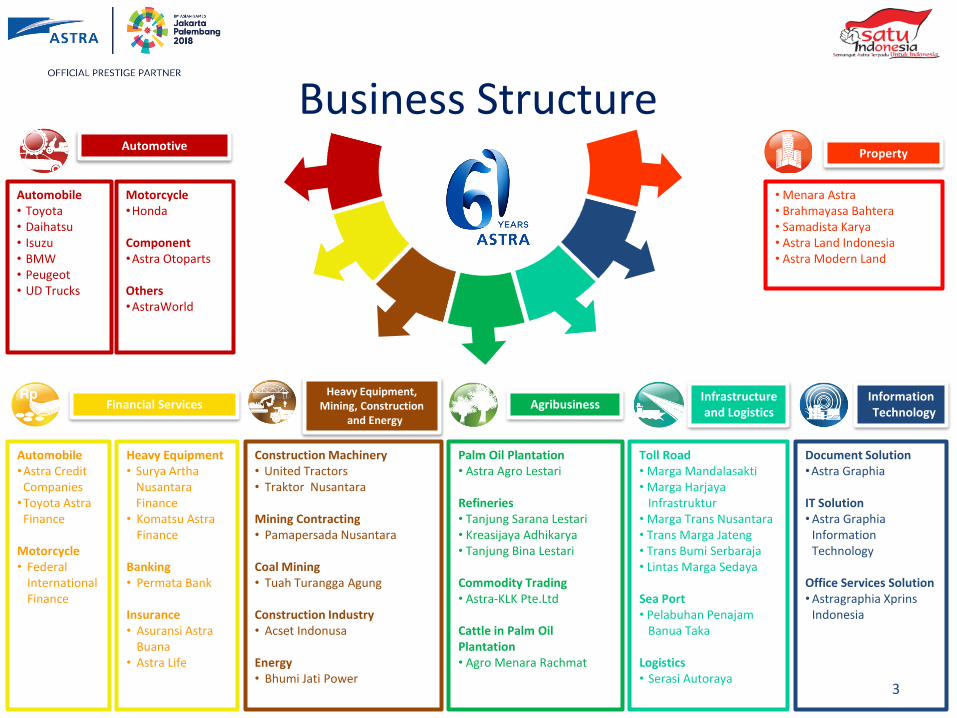
Business Structure
Automobile• Toyota• Daihatsu• Isuzu• BMW• Peugeot• UD Trucks
Other
Motorcycle•Honda
Component•Astra Otoparts
Others•AstraWorld
Automobile•Astra Credit
Companies•Toyota Astra
Finance
Motorcycle• Federal
InternationalFinance
Heavy Equipment • Surya Artha
Nusantara Finance
• Komatsu Astra Finance
Banking• Permata Bank
Insurance• Asuransi Astra
Buana• Astra Life
Construction Machinery• United Tractors• Traktor Nusantara
Mining Contracting• Pamapersada Nusantara
Coal Mining • Tuah Turangga Agung
Construction Industry• Acset Indonusa
Energy• Bhumi Jati Power
Palm Oil Plantation• Astra Agro Lestari
Refineries • Tanjung Sarana Lestari• Kreasijaya Adhikarya• Tanjung Bina Lestari
Commodity Trading• Astra-KLK Pte.Ltd
Cattle in Palm Oil Plantation• Agro Menara Rachmat
Toll Road• Marga Mandalasakti• Marga Harjaya
Infrastruktur• Marga Trans Nusantara• Trans Marga Jateng• Trans Bumi Serbaraja• Lintas Marga Sedaya
Sea Port• Pelabuhan Penajam
Banua Taka
Logistics• Serasi Autoraya
Document Solution•Astra Graphia
IT Solution• Astra Graphia
Information Technology
Office Services Solution• Astragraphia Xprins
Indonesia
• Menara Astra• Brahmayasa Bahtera• Samadista Karya• Astra Land Indonesia• Astra Modern Land
3
Financial ServicesHeavy Equipment,
Mining, Construction and Energy
AgribusinessInfrastructure and Logistics
Information Technology
AutomotiveProperty

Toyota35%
Daihatsu 17%Isuzu
2%
Others46%
Car
• Astra’s car market share decreased from 55% to 54%.• Astra’s motorcycle market share increased from 74% to 75%.• Komatsu market share increased from 32% to 35%.
Source : Gaikindo
Honda75%
Yamaha23%
Suzuki1%
Kawasaki1%
Motorcycle
Source : AISI
Source: United Tractors – Internal Market Research
Heavy Equipment
4
Komatsu 35%
Caterpillar18%
Hitachi 15%
Kobelco15%
Others 17%
Market Position as at 31 December 2017

Mar‘17 • United Tractors’ 25%-owned Bhumi Jati Power, which will develop and operatetwo 1,000 MW thermal power plants in Central Java, completed its projectfinancing agreement with lenders. This build, operate and transfer project isexpected to cost approximately US$4.2 billion and is scheduled to startcommercial operation in 2021. Bhumi Jati Power is a joint venture withSumitomo Power Corporation and Kansai Electric Power.
Mar‘17
Jan ‘17 • Astratel Nusantara completed the acquisition of an initial 40% interest in PTBaskhara Utama Sedaya, which owns 45% of Lintas Marga Sedaya, theoperator of the newly operational 116.8km Cikopo-Palimanan toll road, andsubsequently conditionally agreed to acquire the remaining 60% interest.
• United Tractors through its subsidiary Tuah Turangga Agung, completed theacquisition of an 80.1% stake in PT Suprabari Mapanindo Mineral, a cokingcoal company in Central Kalimantan.
5
Corporate Actions
6
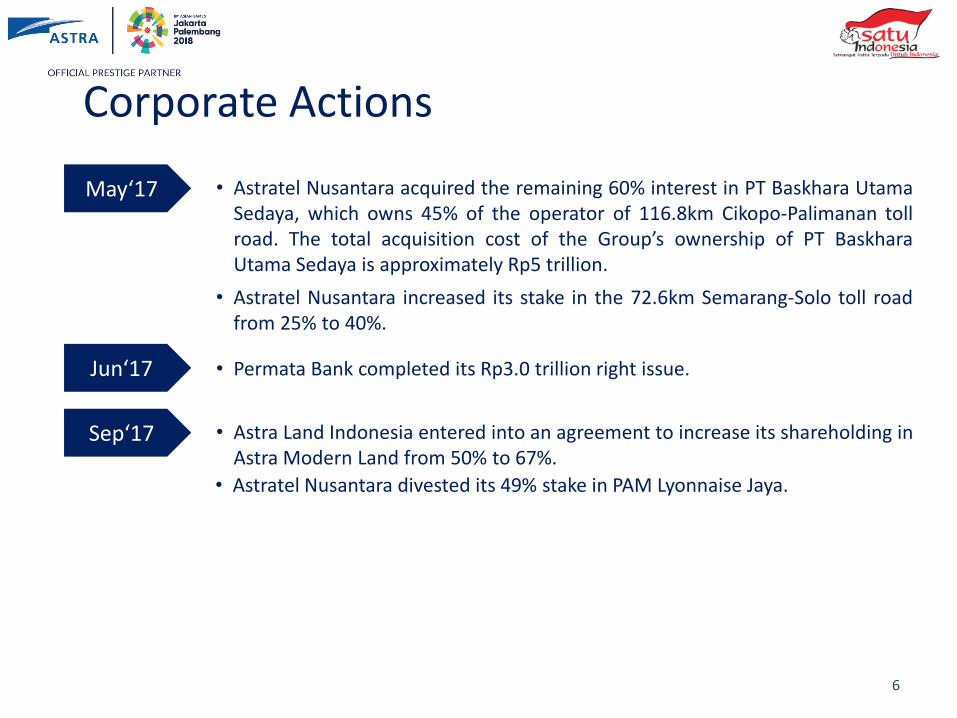
Jun‘17 • Permata Bank completed its Rp3.0 trillion right issue.
Sep‘17 • Astra Land Indonesia entered into an agreement to increase its shareholding inAstra Modern Land from 50% to 67%.
Corporate Actions
May‘17 • Astratel Nusantara acquired the remaining 60% interest in PT Baskhara UtamaSedaya, which owns 45% of the operator of 116.8km Cikopo-Palimanan tollroad. The total acquisition cost of the Group’s ownership of PT BaskharaUtama Sedaya is approximately Rp5 trillion.
• Astratel Nusantara increased its stake in the 72.6km Semarang-Solo toll roadfrom 25% to 40%.
• Astratel Nusantara divested its 49% stake in PAM Lyonnaise Jaya.

Financial Performance
7
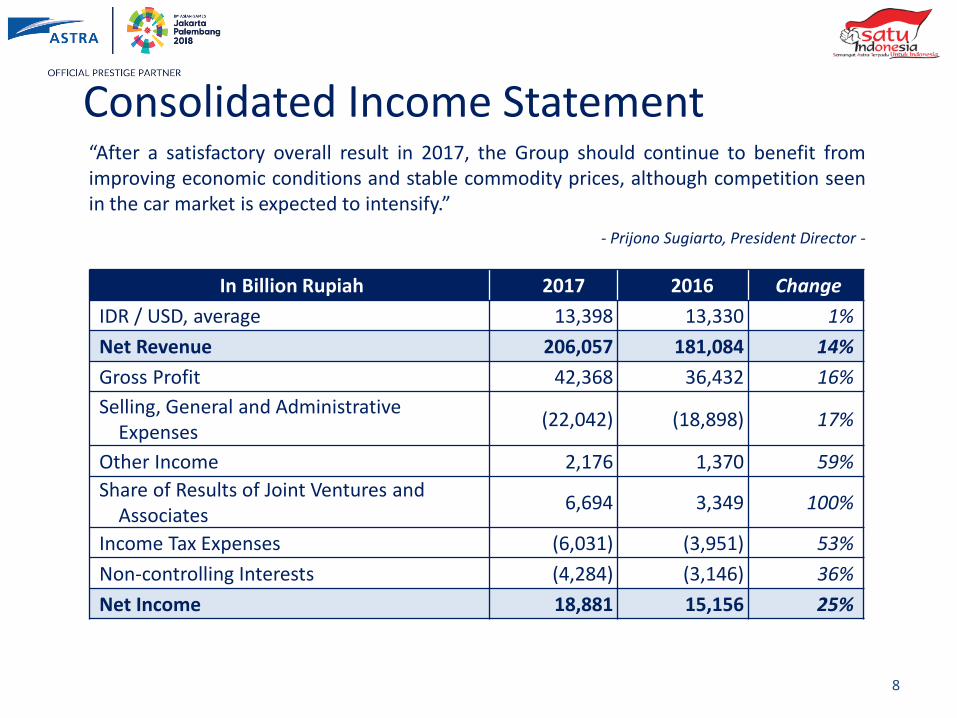
In Billion Rupiah 2017 2016 Change
IDR / USD, average 13,398 13,330 1%
Net Revenue 206,057 181,084 14%
Gross Profit 42,368 36,432 16%
Selling, General and Administrative Expenses
(22,042) (18,898) 17%
Other Income 2,176 1,370 59%
Share of Results of Joint Ventures andAssociates
6,694 3,349 100%
Income Tax Expenses (6,031) (3,951) 53%
Non-controlling Interests (4,284) (3,146) 36%
Net Income 18,881 15,156 25%
“After a satisfactory overall result in 2017, the Group should continue to benefit fromimproving economic conditions and stable commodity prices, although competition seenin the car market is expected to intensify.”
- Prijono Sugiarto, President Director -
8
Consolidated Income Statement
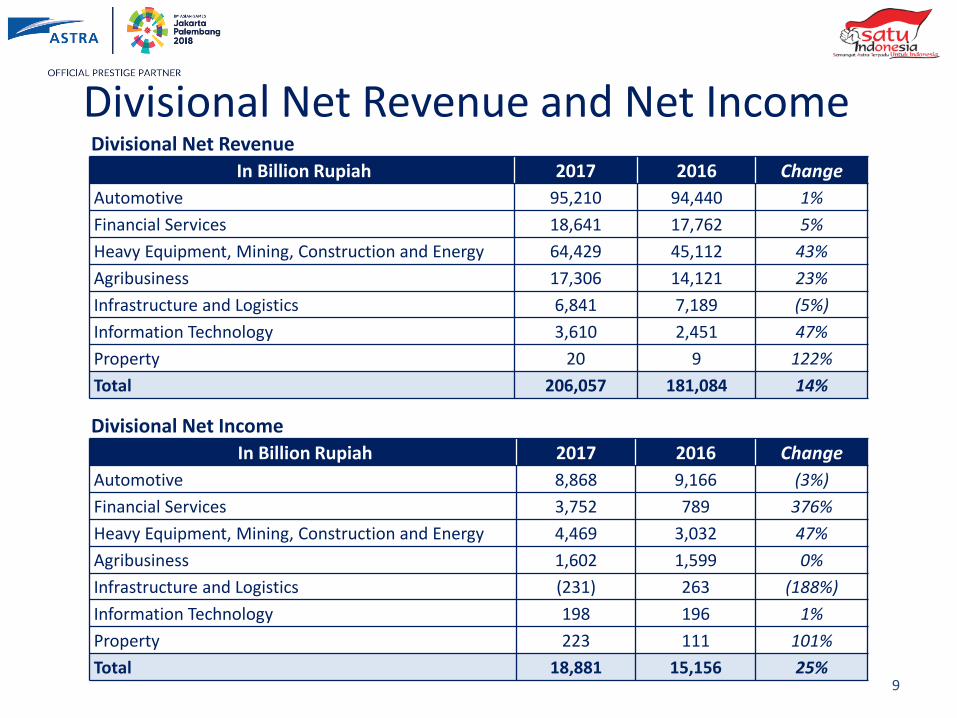
In Billion Rupiah 2017 2016 Change
Automotive 95,210 94,440 1%
Financial Services 18,641 17,762 5%
Heavy Equipment, Mining, Construction and Energy 64,429 45,112 43%
Agribusiness 17,306 14,121 23%
Infrastructure and Logistics 6,841 7,189 (5%)
Information Technology 3,610 2,451 47%
Property 20 9 122%
Total 206,057 181,084 14%
Divisional Net Income
In Billion Rupiah 2017 2016 Change
Automotive 8,868 9,166 (3%)
Financial Services 3,752 789 376%
Heavy Equipment, Mining, Construction and Energy 4,469 3,032 47%
Agribusiness 1,602 1,599 0%
Infrastructure and Logistics (231) 263 (188%)
Information Technology 198 196 1%
Property 223 111 101%
Total 18,881 15,156 25%
Divisional Net Revenue
9
Divisional Net Revenue and Net Income
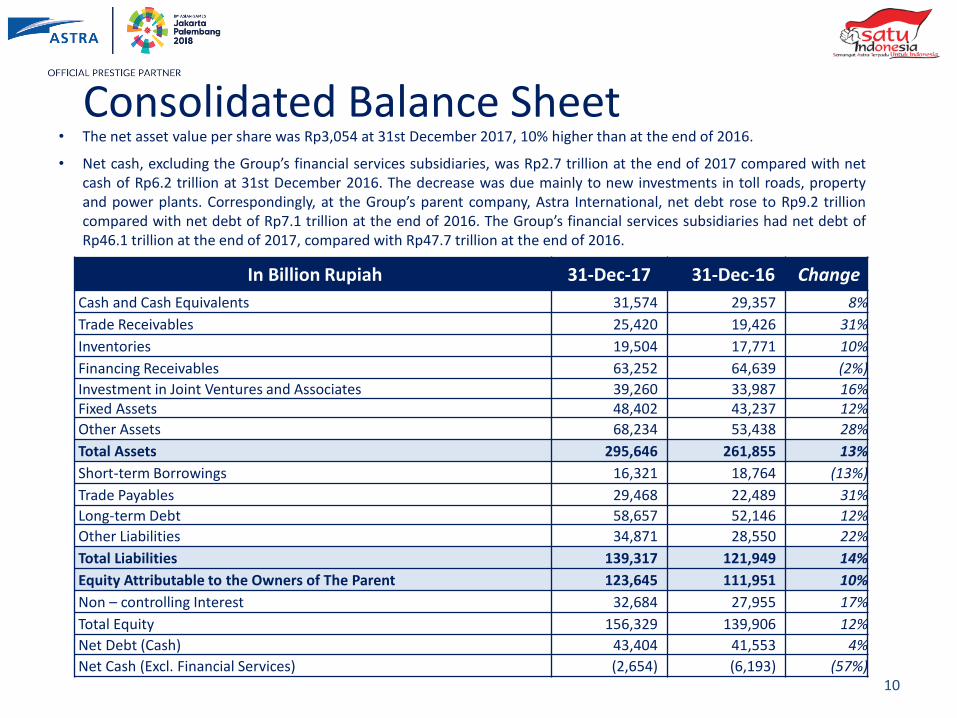
• The net asset value per share was Rp3,054 at 31st December 2017, 10% higher than at the end of 2016.
• Net cash, excluding the Group’s financial services subsidiaries, was Rp2.7 trillion at the end of 2017 compared with netcash of Rp6.2 trillion at 31st December 2016. The decrease was due mainly to new investments in toll roads, propertyand power plants. Correspondingly, at the Group’s parent company, Astra International, net debt rose to Rp9.2 trillioncompared with net debt of Rp7.1 trillion at the end of 2016. The Group’s financial services subsidiaries had net debt ofRp46.1 trillion at the end of 2017, compared with Rp47.7 trillion at the end of 2016.
In Billion Rupiah 31-Dec-17 31-Dec-16 Change
Cash and Cash Equivalents 31,574 29,357 8%
Trade Receivables 25,420 19,426 31%
Inventories 19,504 17,771 10%
Financing Receivables 63,252 64,639 (2%)
Investment in Joint Ventures and Associates 39,260 33,987 16%Fixed Assets 48,402 43,237 12%
Other Assets 68,234 53,438 28%
Total Assets 295,646 261,855 13%
Short-term Borrowings 16,321 18,764 (13%)
Trade Payables 29,468 22,489 31%
Long-term Debt 58,657 52,146 12%
Other Liabilities 34,871 28,550 22%
Total Liabilities 139,317 121,949 14%
Equity Attributable to the Owners of The Parent 123,645 111,951 10%
Non – controlling Interest 32,684 27,955 17%
Total Equity 156,329 139,906 12%
Net Debt (Cash) 43,404 41,553 4%
Net Cash (Excl. Financial Services) (2,654) (6,193) (57%)10
Consolidated Balance Sheet
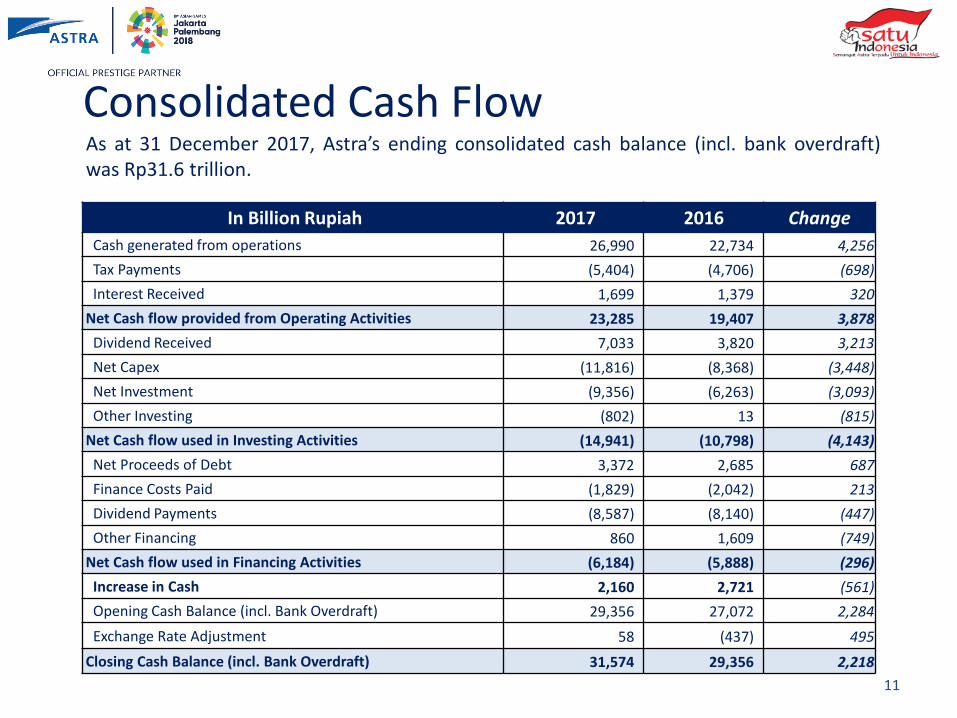
In Billion Rupiah 2017 2016 Change
Cash generated from operations 26,990 22,734 4,256
Tax Payments (5,404) (4,706) (698)
Interest Received 1,699 1,379 320
Net Cash flow provided from Operating Activities 23,285 19,407 3,878
Dividend Received 7,033 3,820 3,213
Net Capex (11,816) (8,368) (3,448)
Net Investment (9,356) (6,263) (3,093)
Other Investing (802) 13 (815)
Net Cash flow used in Investing Activities (14,941) (10,798) (4,143)
Net Proceeds of Debt 3,372 2,685 687
Finance Costs Paid (1,829) (2,042) 213
Dividend Payments (8,587) (8,140) (447)
Other Financing 860 1,609 (749)
Net Cash flow used in Financing Activities (6,184) (5,888) (296)
Increase in Cash 2,160 2,721 (561)
Opening Cash Balance (incl. Bank Overdraft) 29,356 27,072 2,284
Exchange Rate Adjustment 58 (437) 495
Closing Cash Balance (incl. Bank Overdraft) 31,574 29,356 2,218
As at 31 December 2017, Astra’s ending consolidated cash balance (incl. bank overdraft)was Rp31.6 trillion.
11
Consolidated Cash Flow
Business Updates
12
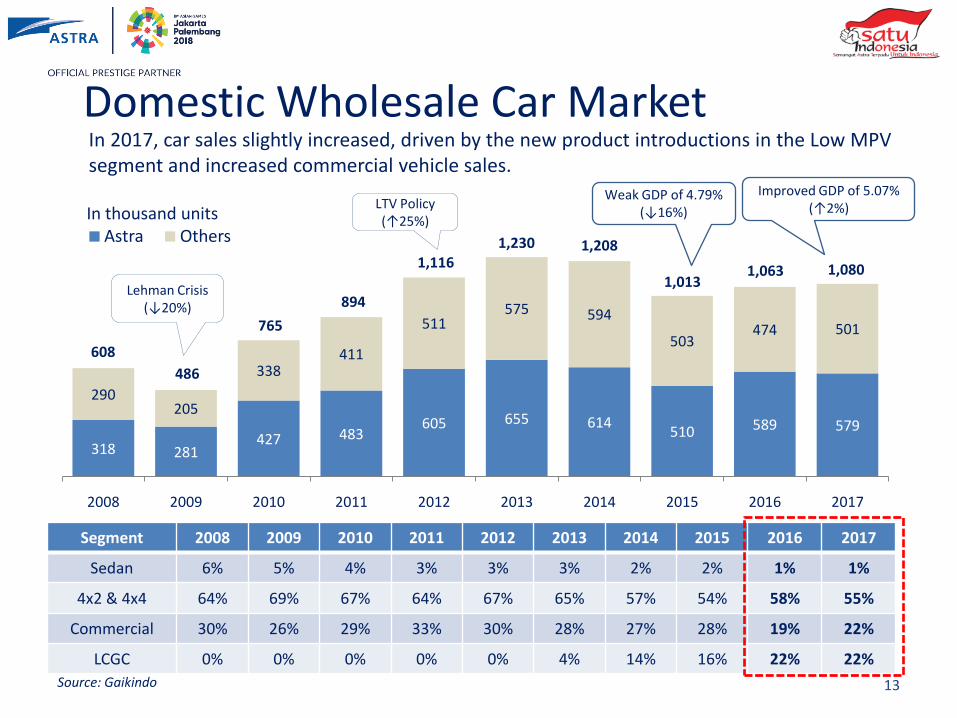
Segment 2008 2009 2010 2011 2012 2013 2014 2015 2016 2017
Sedan 6% 5% 4% 3% 3% 3% 2% 2% 1% 1%
4x2 & 4x4 64% 69% 67% 64% 67% 65% 57% 54% 58% 55%
Commercial 30% 26% 29% 33% 30% 28% 27% 28% 19% 22%
LCGC 0% 0% 0% 0% 0% 4% 14% 16% 22% 22%
318 281427 483
605 655 614510 589 579
290205
338411
511575 594
503474 501
2008 2009 2010 2011 2012 2013 2014 2015 2016 2017
Astra Others
Lehman Crisis(↓20%)
LTV Policy(↑25%)In thousand units
In 2017, car sales slightly increased, driven by the new product introductions in the Low MPVsegment and increased commercial vehicle sales.
13
1,116
894
765
486
608
Source: Gaikindo
1,230 1,208
1,013
Weak GDP of 4.79% (↓16%)
1,063 1,080
Domestic Wholesale Car Market
Improved GDP of 5.07%(↑2%)

Astra’s car sales were 10% higher at 421,000 units, resulting in an increase in market sharefrom 50% to 54%.
Astra579,114 / 53.6%
Astra 589,054/ 55.4%
Others500,772/ 46.4%
Others 473,634/ 44.6%
4x2 & 4x4 596,002 / 55.4%
4x2 & 4x4609,667 / 57.4%
Commercial238,163 / 22.1%
Commercial,204,249/ 19.2%
LCGC 234,554 / 21.7%
LCGC235,171/ 22.1%
Toyota372,614 / 34.5%
Toyota382,606/ 36.0%
Daihatsu 186,381 / 17.3%
Daihatsu 189,683/ 17.8%
Isuzu, 20,085 / 1.9% Isuzu, 16,724/ 1.6%
Other Brands500,772 / 46.4%
Other Brands473,634/ 44.6%
M/S2017
Market Segment Brand M/S2016
Market Segment Brand
Sedan13,601/ 1.3%
Sedan9,167 / 0.8%
2017 2016
The wholesale market for cars was little changed at 1.1 million units. Astra’s car sales were2% lower at 579,000 units, with its market share decreasing from 55% to 54%
2%
Source: Gaikindo14
Automotive – Wholesale Car Market
1,062,6881,079,886

BMW 530i (NEW)August 2017
Lexus RX 200t F Sport (NEW)January 2017
In 2017 , Astra launched 11 new model and 11 revamped models.
Astra Daihatsu AylaApril 2017
15
Isuzu NLR (NEW)August 2017
Toyota Rush (NEW)November 2017
Daihatsu Terios (NEW)November 2017
Automotive – Car Product Launches
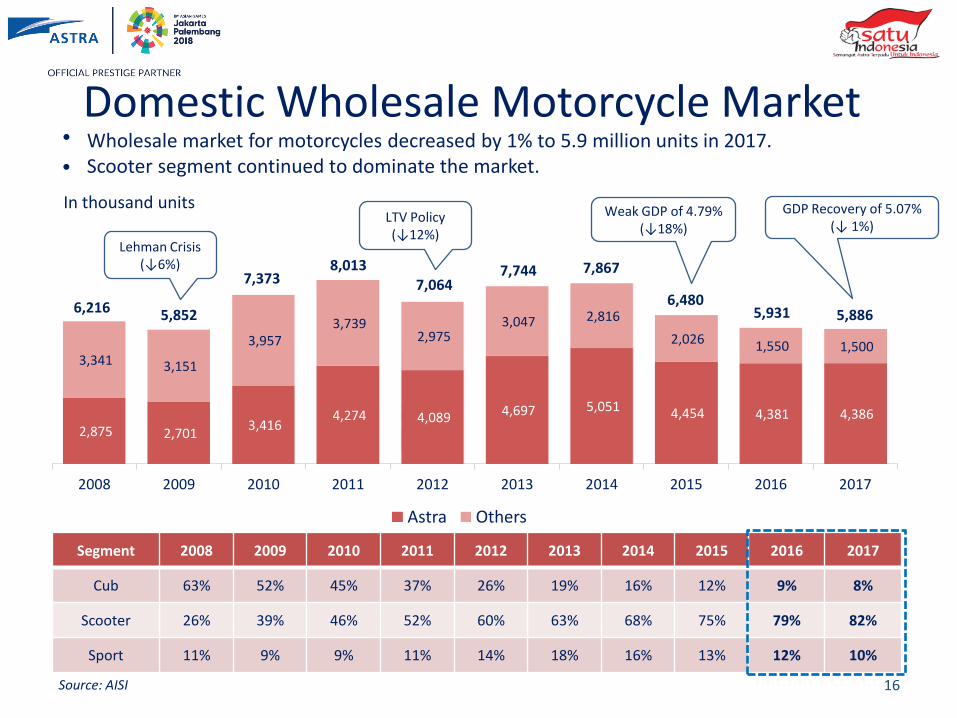
2,875 2,701 3,416
4,274 4,089 4,697 5,051 4,454 4,381 4,386
3,341 3,151
3,957 3,739
2,975 3,047 2,816
2,026 1,550 1,500
2008 2009 2010 2011 2012 2013 2014 2015 2016 2017
Astra Others
In thousand units
Segment 2008 2009 2010 2011 2012 2013 2014 2015 2016 2017
Cub 63% 52% 45% 37% 26% 19% 16% 12% 9% 8%
Scooter 26% 39% 46% 52% 60% 63% 68% 75% 79% 82%
Sport 11% 9% 9% 11% 14% 18% 16% 13% 12% 10%
Wholesale market for motorcycles decreased by 1% to 5.9 million units in 2017.Scooter segment continued to dominate the market.
16
7,373
5,8526,216
8,0137,064
Lehman Crisis(↓6%)
Source: AISI
7,8677,744
LTV Policy(↓12%)
6,480
Weak GDP of 4.79% (↓18%)
5,931
•
•
5,886
Domestic Wholesale Motorcycle Market
GDP Recovery of 5.07%(↓ 1%)
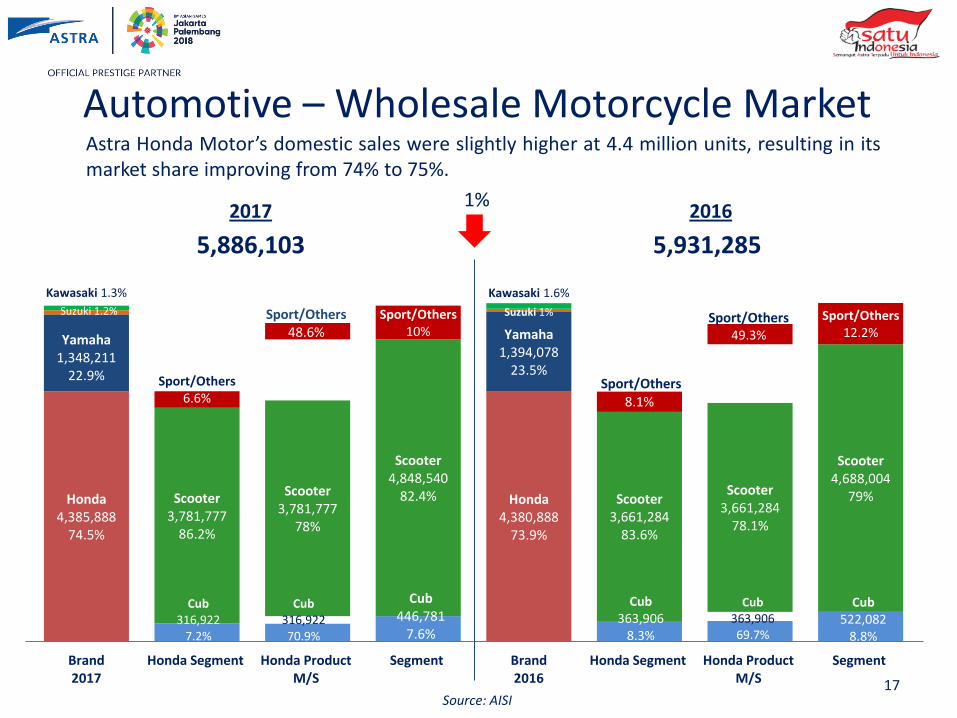
Honda4,385,888
74.5%
Honda 4,380,888
73.9%
Yamaha1,348,211
22.9%
Yamaha1,394,078
23.5%
Kawasaki 1.3%
Suzuki 1%Suzuki 1.2%
Kawasaki 1.6%
Cub316,922
7.2%
Cub363,906
8.3%
Scooter3,781,777
86.2%
Scooter3,661,284
83.6%
Sport/Others6.6%
Sport/Others8.1%
Cub316,92270.9%
Cub363,90669.7%
Scooter3,781,777
78%
Scooter3,661,284
78.1%
Sport/Others48.6%
Sport/Others49.3%
Cub446,781
7.6%
Cub522,082
8.8%
Scooter4,848,540
82.4%
Scooter4,688,004
79%
Sport/Others10%
Sport/Others12.2%
Brand2017
Honda Segment Honda Product M/S
Segment Brand2016
Honda Segment Honda Product M/S
Segment
Source: AISI
2017 2016
5,931,2855,886,103
Astra Honda Motor’s domestic sales were slightly higher at 4.4 million units, resulting in itsmarket share improving from 74% to 75%.
1%
17
Automotive – Wholesale Motorcycle Market

Honda CMX 500 RebelMarch 2017
Honda SH 150i (NEW)April 2017
In 2017, Astra Honda Motor launched 8 new models and 18 revamped models.
18
Honda CRF 150 (New)November 2017
Honda PCX 150 (NEW)December 2017
Honda RevoOctober 2017
Honda CBR 250 RRAugust 2017
Honda Scoopy (New)March 2017
Automotive – Motorcycle Product Launches

335
230
FY17 FY16
551
418
FY17 FY16
Astra Otoparts, the Group’s components business, reported net income up 32% to Rp551billion, due mainly to an increase in revenues arising from higher replacement market salesand improved contributions from its joint venture and associate companies.
19
Net Income (Rp bio)Revenue (Rp bio)
6% 32%
Share of Results of Joint Ventures and Associates (Rp bio)
46%
13,550
12,807
FY17 FY162017 2016 2017 2016 2017 2016
Automotive – Components

Net income from the Group’s financial services division increased to Rp3.8 trillion from Rp789 billionin the prior year due to a return to profitability at Permata Bank and improved earnings contributionsfrom Astra Sedaya Finance, Federal International Finance and Asuransi Astra Buana.
20
Financial Services
Unit Financed 2017 2016 %
Auto
ACC 178,327 185,188 (4)
TAF 107,971 112,914 (4)
Total ACC & TAF 286,298 298,102 (4)
FIF (Incl.Electronics)’000 3,569 3,475 3
HE
SANF 975 504 93
KAF 578 291 99
Total HE 1,553 795 95
Amount Financed (Rp bio) 2017 2016 %
Auto
ACC 27,275 27,475 (1)
TAF 19,831 19,559 1
Total ACC & TAF 47,106 47,034 0
FIF (Incl.Electronics) 34,622 32,621 6
Total Auto 81,728 79,655 3
HE
SANF 3,004 3,056 (2)
KAF* 2,855 1,643 74
Total HE 5,859 4,699 25
• FY17 consolidated net income Rp748 billion
(FY16: consolidated net loss Rp6.5 trillion).
• Loan book decreased by 7% YoY to Rp98 trillion.
• LDR rose from 80% to 88%; CAR rose from 15.6% to18.1%
• Gross NPL ratio fell from 8.8% to 4.6%; Net NPL ratiofell from 2.2% to 1.7%.
Permata Bank
* Average exchange rate USD/IDR: 13,398 (FY17) & 13,330 (FY16)**Tentative figure, waiting confirmation from OJK
Asuransi Astra Buana
• Higher net income by 9% to Rp1.0 trillion.
• FY17 Gross Written Premium up by 4% YoY to Rp4.4 trillion.
• RBC: 288%** vs regulatory minimum of 120%.
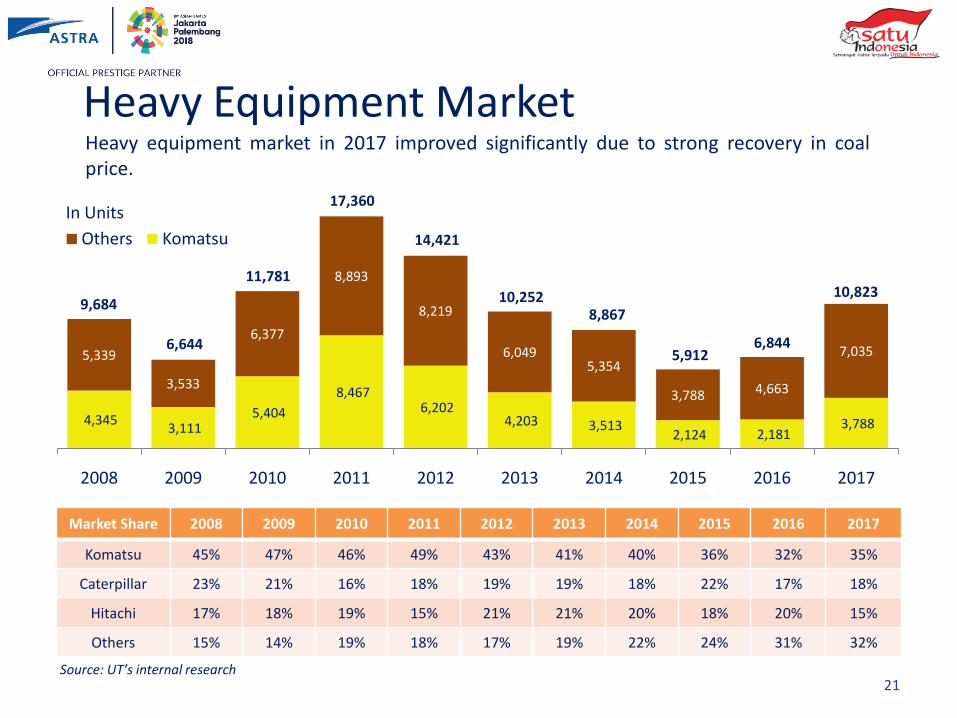
4,345 3,111
5,404
8,467 6,202
4,203 3,513 2,124 2,181
3,788
5,339
3,533
6,377
8,893
8,219
6,049 5,354
3,788 4,663
7,035
2008 2009 2010 2011 2012 2013 2014 2015 2016 2017
Others Komatsu
6,844
9,684
6,644
11,781
17,360
14,421
Market Share 2008 2009 2010 2011 2012 2013 2014 2015 2016 2017
Komatsu 45% 47% 46% 49% 43% 41% 40% 36% 32% 35%
Caterpillar 23% 21% 16% 18% 19% 19% 18% 22% 17% 18%
Hitachi 17% 18% 19% 15% 21% 21% 20% 18% 20% 15%
Others 15% 14% 19% 18% 17% 19% 22% 24% 31% 32%
21
Heavy equipment market in 2017 improved significantly due to strong recovery in coalprice.
In Units
Source: UT’s internal research
10,2528,867
5,912
10,823
Heavy Equipment Market

8.4
3.8
New Contracts Secured (Rp tn)22
6,336 6,866
Total Coal Sales (all in thousand tonnes)
112.6 109.2
Coal (mn tonnes)
798.7 701.5
Overburden (mn bcm)
24,711 14,618
29,637
24,003
7,181
5,124
3,030
1,794
Construction Machinery Mining Contracting
Mining Construction Industry
50%
30%
11%
14%
24%
46%
15%
10%
Mining Forestry Construction Agro
Mining Contracting
Coal Sales (incl. Trading)Komatsu Unit Sales
2,181
Revenue (Rp bio)
2017 2016 2017 2016
2017 2016 2017 2016
42%
Coal Production
3%
OB Removal
14%
7%74%
United Tractors, which is 59.5%-owned, reported net income 48% higher at Rp7.4 trillion. The increasewas mainly due to significantly stronger coal prices that led to improved performances in itsconstruction machinery and mining contracting businesses, as well as its mining operations.
64,559
45,539
3,788
General Contractor New Contracts
2017 2016
124%
Heavy Equipment, Mining, Construction and Energy

1,741
1,557
CPO & Derivatives Sales
23
1,634 1,554
CPO Production
3.96 3.84 12,426 9,873
4,880
4,249 Export
Local
Revenue (Rp bio)
CPO Production (‘K tonnes)
CPO Yield (tonne/Ha)
14,122
2017 2016
23% 3%
5%
17,306
2017 2016
2017 2016 2017 2016
12%
Astra Agro Lestari, which is 79.7%-owned, reported net income of Rp2.0 trillion. Despite improvedrevenue from higher crude palm oil prices and sales volumes, the result was little changed from2016, which had benefited from significant foreign exchange translation gains. Excluding theimpact of foreign exchange in both years, net income would have been 8% higher.
CPO & Derivatives Sales (‘K tonnes)
2017 2016
Agribusiness
Average CPO Price (Rp/Kg)
6%
8,271 7,768
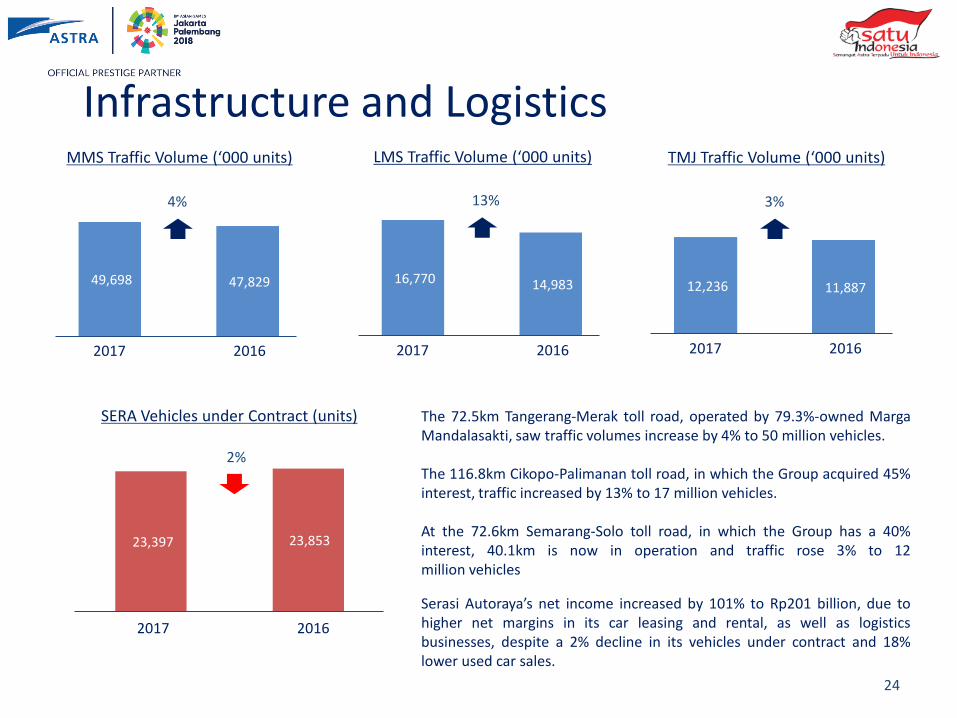
49,698 47,829
23,397 23,853
SERA Vehicles under Contract (units)
MMS Traffic Volume (‘000 units)
2017 2016
2017 2016
2%
4%
24
Infrastructure and Logistics
The 72.5km Tangerang-Merak toll road, operated by 79.3%-owned MargaMandalasakti, saw traffic volumes increase by 4% to 50 million vehicles.
The 116.8km Cikopo-Palimanan toll road, in which the Group acquired 45%interest, traffic increased by 13% to 17 million vehicles.
At the 72.6km Semarang-Solo toll road, in which the Group has a 40%interest, 40.1km is now in operation and traffic rose 3% to 12million vehicles
Serasi Autoraya’s net income increased by 101% to Rp201 billion, due tohigher net margins in its car leasing and rental, as well as logisticsbusinesses, despite a 2% decline in its vehicles under contract and 18%lower used car sales.
16,770 14,983
LMS Traffic Volume (‘000 units)
2017 2016
12,236 11,887
TMJ Traffic Volume (‘000 units)
2017 2016
3%13%

37% 1,543
25% 1,134
38%113
AGDS AGIT AXI
38% 55%
25% 41%
37%
4%
Astra Graphia Revenue (Rp bio)
2017 2016
3,918
2,713
44%
257 255
Astra Graphia Net Income (Rp bio)
2017 2016
1%
Astra Graphia, which is 76.9%-owned, reported net income 1% higher at Rp257 billion,mainly due to increased revenues from its office services business.
25
Information Technology

223
111
Net Income (Rp bio)
2017 2016
50%-owned Astra Land Indonesia, which owns67% of Astra Modern Land, is in the process ofdeveloping a 67-hectare site in East Jakarta.
101%
Net income from the Group’s property divisionwas up 101% at Rp223 billion, primarily due tohigher development earnings recognised on itsAnandamaya Residences project. AnandamayaResidences and Menara Astra are scheduled forcompletion in 2018.
26
Property
Appendices
27
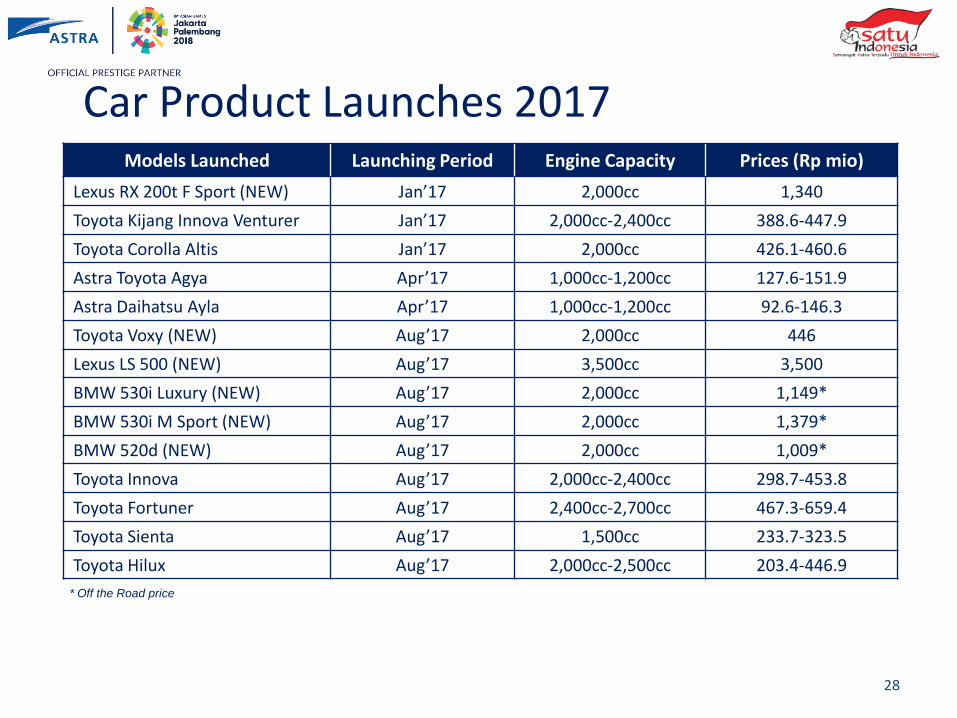
Models Launched Launching Period Engine Capacity Prices (Rp mio)
Lexus RX 200t F Sport (NEW) Jan’17 2,000cc 1,340
Toyota Kijang Innova Venturer Jan’17 2,000cc-2,400cc 388.6-447.9
Toyota Corolla Altis Jan’17 2,000cc 426.1-460.6
Astra Toyota Agya Apr’17 1,000cc-1,200cc 127.6-151.9
Astra Daihatsu Ayla Apr’17 1,000cc-1,200cc 92.6-146.3
Toyota Voxy (NEW) Aug’17 2,000cc 446
Lexus LS 500 (NEW) Aug’17 3,500cc 3,500
BMW 530i Luxury (NEW) Aug’17 2,000cc 1,149*
BMW 530i M Sport (NEW) Aug’17 2,000cc 1,379*
BMW 520d (NEW) Aug’17 2,000cc 1,009*
Toyota Innova Aug’17 2,000cc-2,400cc 298.7-453.8
Toyota Fortuner Aug’17 2,400cc-2,700cc 467.3-659.4
Toyota Sienta Aug’17 1,500cc 233.7-323.5
Toyota Hilux Aug’17 2,000cc-2,500cc 203.4-446.9
28
Car Product Launches 2017
* Off the Road price

Models Launched Launching Period Engine Capacity Prices (Rp mio)
Lexus NX Aug’17 2,000cc 1,005
Isuzu MU-X 4x4 (NEW) Aug’17 2,500cc 468
Isuzu MU-X Aug’17 2,500cc 485-498
Isuzu NLR 55 (NEW) Aug’17 2,800cc - 100ps 244.7-257
Isuzu NLR 71 (NEW) Aug’17 4,600cc -125ps 264.7-274.3
Toyota Rush (NEW) Nov’17 1,500cc 239.9-261.3
Daihatsu Terios (NEW) Nov’17 1,500cc 195.2-247.9
Daihatsu Xenia Custom Nov’17 1,300cc 202.4-213.3
29
Car Product Launches 2017
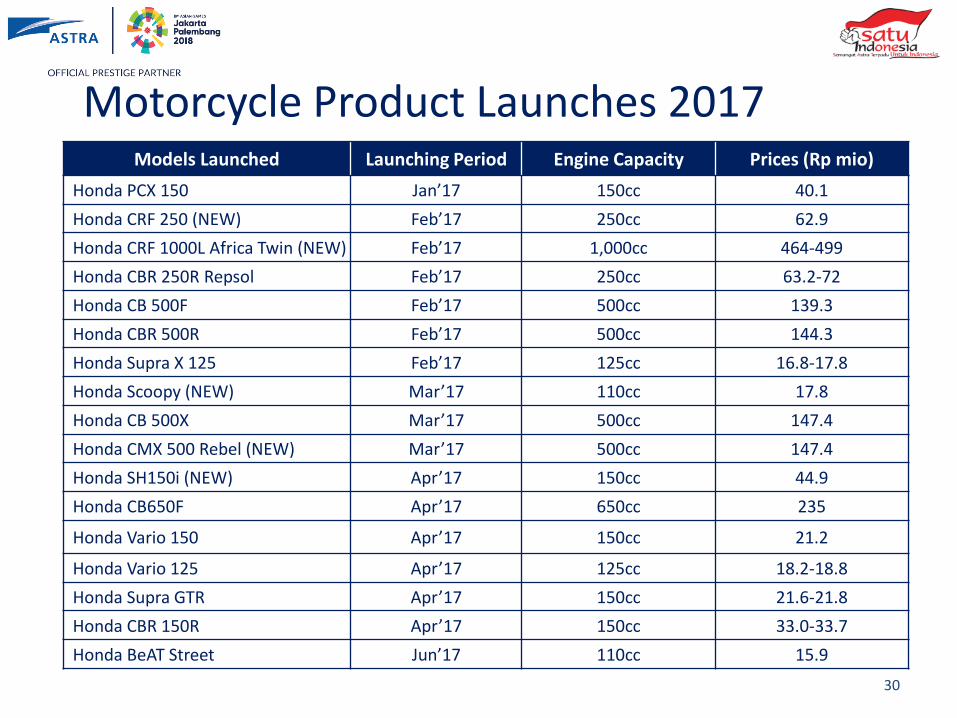
Models Launched Launching Period Engine Capacity Prices (Rp mio)
Honda PCX 150 Jan’17 150cc 40.1
Honda CRF 250 (NEW) Feb’17 250cc 62.9
Honda CRF 1000L Africa Twin (NEW) Feb’17 1,000cc 464-499
Honda CBR 250R Repsol Feb’17 250cc 63.2-72
Honda CB 500F Feb’17 500cc 139.3
Honda CBR 500R Feb’17 500cc 144.3
Honda Supra X 125 Feb’17 125cc 16.8-17.8
Honda Scoopy (NEW) Mar’17 110cc 17.8
Honda CB 500X Mar’17 500cc 147.4
Honda CMX 500 Rebel (NEW) Mar’17 500cc 147.4
Honda SH150i (NEW) Apr’17 150cc 44.9
Honda CB650F Apr’17 650cc 235
Honda Vario 150 Apr’17 150cc 21.2
Honda Vario 125 Apr’17 125cc 18.2-18.8
Honda Supra GTR Apr’17 150cc 21.6-21.8
Honda CBR 150R Apr’17 150cc 33.0-33.7
Honda BeAT Street Jun’17 110cc 15.9
30
Motorcycle Product Launches 2017
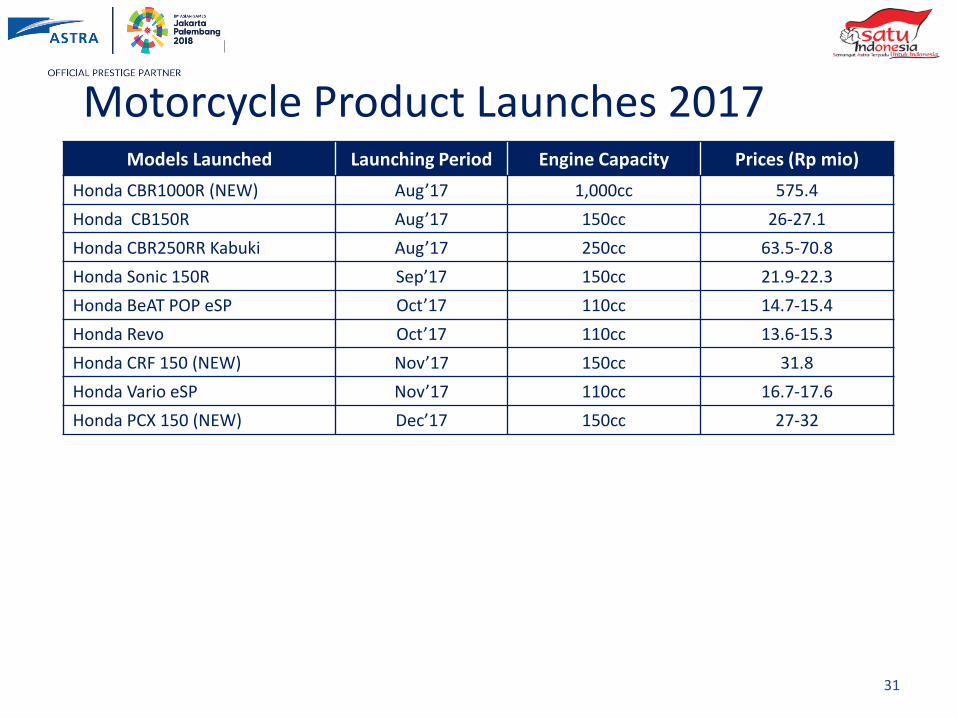
Models Launched Launching Period Engine Capacity Prices (Rp mio)
Honda CBR1000R (NEW) Aug’17 1,000cc 575.4
Honda CB150R Aug’17 150cc 26-27.1
Honda CBR250RR Kabuki Aug’17 250cc 63.5-70.8
Honda Sonic 150R Sep’17 150cc 21.9-22.3
Honda BeAT POP eSP Oct’17 110cc 14.7-15.4
Honda Revo Oct’17 110cc 13.6-15.3
Honda CRF 150 (NEW) Nov’17 150cc 31.8
Honda Vario eSP Nov’17 110cc 16.7-17.6
Honda PCX 150 (NEW) Dec’17 150cc 27-32
31
Motorcycle Product Launches 2017
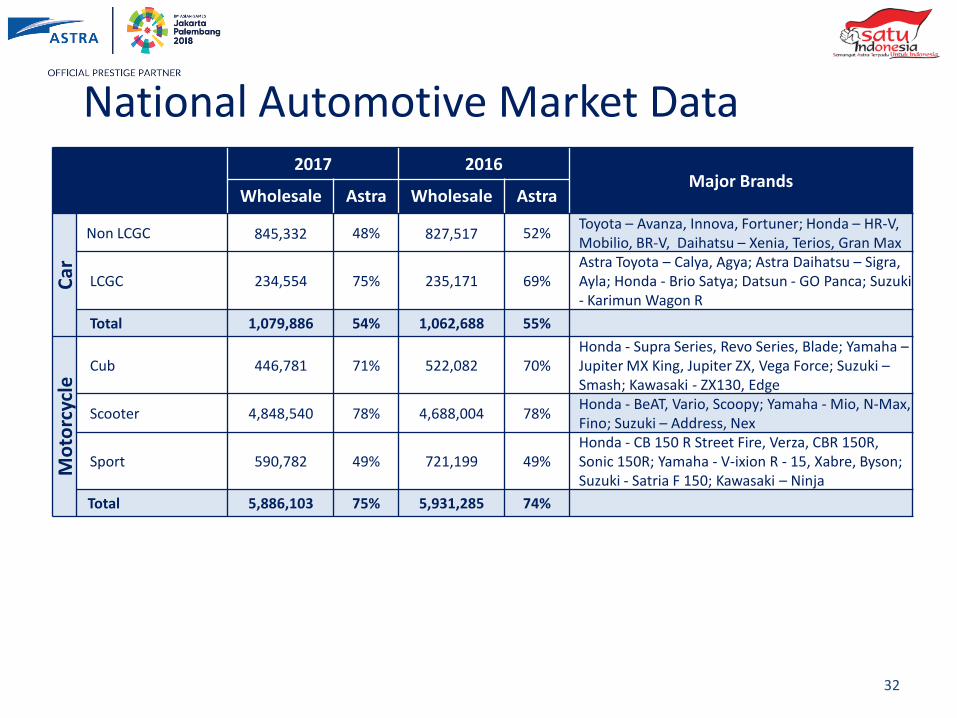
2017 2016Major Brands
Wholesale Astra Wholesale Astra
Car
Non LCGC 845,332 48% 827,517 52%Toyota – Avanza, Innova, Fortuner; Honda – HR-V, Mobilio, BR-V, Daihatsu – Xenia, Terios, Gran Max
LCGC 234,554 75% 235,171 69%Astra Toyota – Calya, Agya; Astra Daihatsu – Sigra, Ayla; Honda - Brio Satya; Datsun - GO Panca; Suzuki - Karimun Wagon R
Total 1,079,886 54% 1,062,688 55%
Mo
torc
ycle
Cub 446,781 71% 522,082 70%Honda - Supra Series, Revo Series, Blade; Yamaha –Jupiter MX King, Jupiter ZX, Vega Force; Suzuki –Smash; Kawasaki - ZX130, Edge
Scooter 4,848,540 78% 4,688,004 78%Honda - BeAT, Vario, Scoopy; Yamaha - Mio, N-Max,Fino; Suzuki – Address, Nex
Sport 590,782 49% 721,199 49%Honda - CB 150 R Street Fire, Verza, CBR 150R, Sonic 150R; Yamaha - V-ixion R - 15, Xabre, Byson; Suzuki - Satria F 150; Kawasaki – Ninja
Total 5,886,103 75% 5,931,285 74%
32
National Automotive Market Data

33
No Brokerage House Analyst Name Contact Number Email Address
1 Bahana Sekuritas Andri Ngaserin +62 21 250 5735 [email protected] BCA Sekuritas Pandu Anugrah +62 21 23587222 [email protected] CIMB Sekuritas Indonesia Erindra Krisnawan +62 21 30061732 [email protected] Ciptadana Sekuritas Asia Arief Budiman +62 21 2557 4800 [email protected] Citigroup Investment Research Ferry Wong +62 21 2924 9213 [email protected] CLSA Indonesia Sarina Lesmina +62 21 2554 8820 [email protected] Credit Suisse Sekuritas Indonesia Jahanzeb Naseer +62 21 2553 7977 [email protected] Danareksa Sekuritas Stefanus Darmagiri +62 21 2955 5831 [email protected] DBS Vickers Maynard Priajaya Arif +62 21 3003 4900 [email protected]
10 Deutsche Verdhana Securities Joko Sogie +62 21 2964 4543 [email protected] Goldman Sachs Pramod Kumar +91 22 6616 9043 [email protected] HSBC Global Research Tarun Bhatnagar +65 6658 0614 [email protected] Indo Premier Sekuritas Chandra Pasaribu +62 21 5793 1168 [email protected] J.P. Morgan Securities Indonesia Aditya Srinath +65 6882 7138 [email protected] Kresna Securities Robertus Yanuar Hardy +62 21 2939 1900 [email protected] Mandiri Sekuritas Ariyanto Kurniawan +62 21 5296 9682 [email protected] Maybank Kim Eng Securities Isnaputra Iskandar +62 21 2557 1129 [email protected] BoA Merrill Lynch Swati Chopra +65 6678 0405 [email protected] Mirae Asset Sekuritas Indonesia Franky Rivan +62 21 515 1140 [email protected] NH Korindo Sekuritas Arnold Sampeliling +62 21 797 6202 [email protected] Nomura Indonesia Elvira Tjandrawinata +62 21 2991 3341 [email protected] Onix Capital Bagus Hananto +62 21 3190 1777 [email protected] RHB Sekuritas Indonesia Andrey Wijaya +62 21 2598 6888 [email protected] Samuel Sekuritas Akhmad Nurcahyadi +62 21 2854 8144 [email protected] Sinarmas Sekuritas Evan Lie Hadiwidjaja +62 21 392 5550 [email protected] Sucor Sekuritas Raditya Immanzah +62 21 8067 3164 [email protected] Trimegah Securities Willinoy Sitorus +62 21 2924 9088 [email protected] UBS Securities Indonesia Ronald Liem +62 21 2554 7032 [email protected] UOB Kay Hian Securities Stevanus Juanda +62 21 2993 3845 [email protected] Valbury Asia Securities Budi Rustanto +62 21 2553 3600 [email protected] Yuanta Securities Indonesia Yusuf Ade Winoto +62 21 515 5890 [email protected]
Equity Research Contact Details

For further information please contact:
PT Astra International Tbk
Corporate Investor Relations
P: (+62 21) 652 2555
F: (+62 21) 6530 4953
34