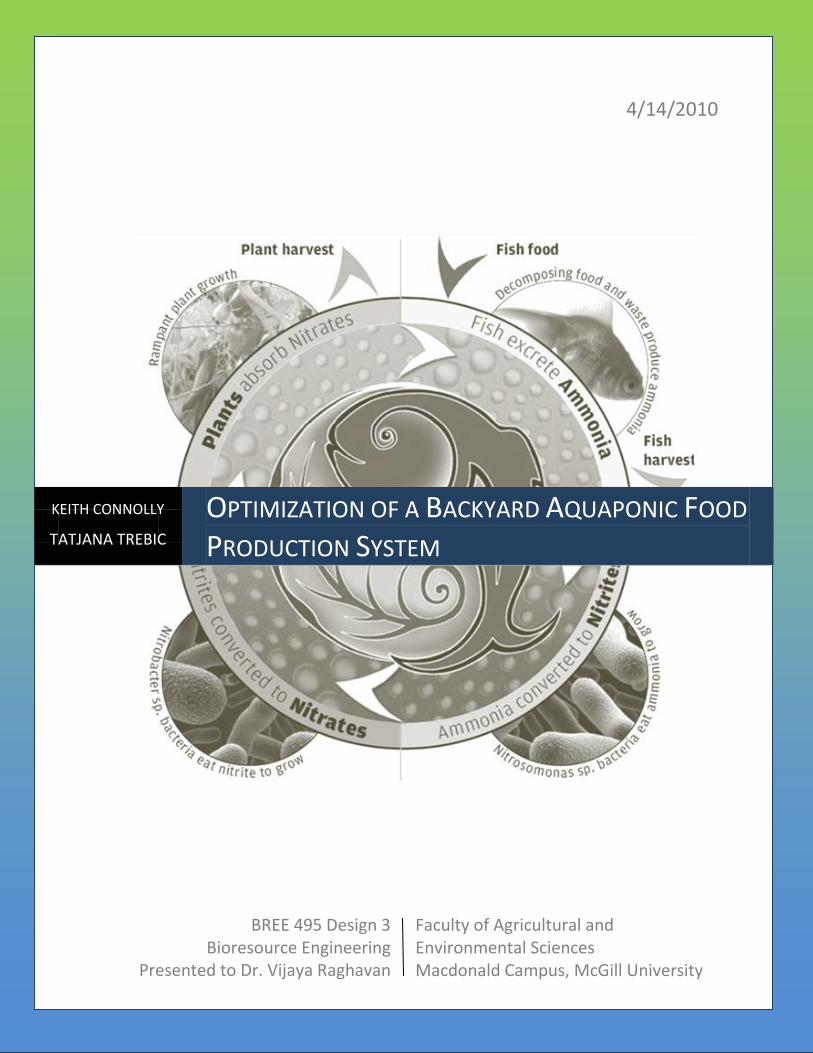
ptimization of a ackyard quaponic roduction ystem
TRANSCRIPT
4/14/2010
OPTIMIZATION OF A BACKYARD AQUAPONIC FOOD
PRODUCTION SYSTEM
BREE 495 Design 3 Bioresource Engineering
Presented to Dr. Vijaya Raghavan
Faculty of Agricultural and Environmental Sciences Macdonald Campus, McGill University
KEITH CONNOLLY
TATJANA TREBIC

Acknowledgements
We extend our warmest thanks to the following people for their inspiration, guidance and support:
Mr. Damian HInkson, Chairman (Baird’s Village Aquaponic Association)
Susan Mahon, Internship Coordinator
(Barbados Field Study Semester)
Inter-American Institute for the Cooperation on Agriculture (Barbados Branch)
Dr. Inteaz Alli, Director
(Barbados Field Study Semester)
Dr. James Rakocy (University of the Virgin Islands Agricultural Experiment Station)
Dr. Suzelle Barrington, Dr. Vijaya Raghavan and the Bioresource Engineering Department
(McGill University)

Table of Contents Acknowledgements ....................................................................................................................................... 2
Executive Summary ....................................................................................................................................... 6
1. Introduction .......................................................................................................................................... 8
1.1 Food Security ...................................................................................................................................... 8
1.2 Small-Scale Agriculture ....................................................................................................................... 9
1.3 Objective of Project .......................................................................................................................... 10
2. Background ......................................................................................................................................... 11
2.1 Agriculture in Barbados .................................................................................................................... 11
2.1.1 Economy and Human Resources ............................................................................................... 11
2.1.2 Natural Resources ...................................................................................................................... 11
2.1.3 Climate ....................................................................................................................................... 12
2.1.4 Terrain ........................................................................................................................................ 13
2.1.5 Crop Production in Barbados ..................................................................................................... 13
2.2 Food Production Methods ................................................................................................................ 14
2.2.1 Aquaculture ................................................................................................................................ 14
2.2.2 Hydroponics ............................................................................................................................... 15
2.2.3 Aquaponics ................................................................................................................................. 16
2.2.4 Comparison of Food Production Methods................................................................................. 19
3. Aquaponic Systems ............................................................................................................................. 21
3.1 System Designs ................................................................................................................................. 21
3.1.1 Media Filled Systems ................................................................................................................. 21
3.1.2 Flood and Drain .......................................................................................................................... 21
3.1.3 Nutrient Film Technique (NFT) ................................................................................................... 22
3.1.4 Floating Raft System .................................................................................................................. 23
3.2 Fish .................................................................................................................................................... 24
3.2.1 Fish Selection ............................................................................................................................. 24
3.2.2 Culturing Conditions for Tilapia ................................................................................................. 25
3.2.2.1 Water Quality .......................................................................................................................... 25
3.2.2.2 Feed ......................................................................................................................................... 28
3.3 Plant Crops ........................................................................................................................................ 29
3.3.1 Nutritional Requirements .......................................................................................................... 29

3.3.2 Crop Selection ............................................................................................................................ 30
3.4 Bacteria ............................................................................................................................................. 31
4. The Design ........................................................................................................................................... 33
4.1 System Stocking Density ................................................................................................................... 34
4.1.1 Growing Area ............................................................................................................................. 34
4.1.2 Basil, Okra and Coconut Husk .................................................................................................... 34
4.1.3 Component Ratios ......................................................................................................................... 36
4.1.4 Feed Rate Ratio and Annual Fish Feed Mass. ............................................................................ 36
4.1.5 Feed Conversion Ratio ............................................................................................................... 37
4.1.6 Fish Biomass Production ............................................................................................................ 37
4.1.7 Fish Stocking and Harvest .......................................................................................................... 37
4.1.8 Plant Stocking and Harvest ........................................................................................................ 39
4.2 Water Flow Rate ............................................................................................................................... 40
4.2.1 Hydraulic Loading Rate .............................................................................................................. 41
4.2.2 Hydraulic Retention Time .......................................................................................................... 42
4.3 System Components ......................................................................................................................... 42
4.3.1 System Configuration ................................................................................................................. 42
4.3.2 Fish Tank .................................................................................................................................... 46
4.3.3 Grow Bed.................................................................................................................................... 48
4.3.4 Sump Tank .................................................................................................................................. 49
4.3.5 Aeration System ......................................................................................................................... 49
5. Other Considerations .......................................................................................................................... 55
5.1 Temperature Regulation ................................................................................................................... 55
5.2 pH Regulation .................................................................................................................................... 56
5.3 Water Quality Testing and Debris Control ........................................................................................ 56
6. Cost Benefit Analysis ............................................................................................................................... 57
6.1 Costs .................................................................................................................................................. 57
6.1.1 Initial Material Costs .................................................................................................................. 57
6.1.2 Annual Costs............................................................................................................................... 58
6.2 Outputs ............................................................................................................................................. 59
6.2.1 Fish Production .......................................................................................................................... 59
6.2.2 Vegetable Production ................................................................................................................ 59
6.3 Summary of Analysis ......................................................................................................................... 60
7. Conclusions ......................................................................................................................................... 61
Bibliography ................................................................................................................................................ 62
Appendices .................................................................................................................................................. 67
Appendix A: Barbados Background Information .................................................................................... 67
Appendix B: Water Quality Experiment Results from Barbados System ................................................ 68
Appendix C: Fish Growth Estimations ..................................................................................................... 71
Appendix D: Air Pump Specifications ...................................................................................................... 73

Executive Summary
The current and escalating extent of soil degradation, water scarcity and climate-related challenges
plaguing agricultural productivity in every corner of the world and particularly in the most
underdeveloped and resource-scarce regions demands for a re-evaluation of the way we produce the
foods that keep us alive and seems to beg for what could be referred to as another green revolution.
The need for the development of innovative, resource efficient and locally appropriate agricultural
solutions is immense and this need is greatest in densely populated, resource-poor nations with small
economies. Tropical island nations face increasing confrontations by climate change and obstacles to
the sound stewardship of their natural resources and environment and trends in land use allocation
indicate the deteriorating status of agricultural activities as lucrative compared to industries such as
tourism, real estate and off-shore financing. The end results are the massive rates of food importations
from distant locations, the decline of regional agricultural autonomy and a loss of connection between
consumers and the origin, nutritional value and safety of their food.
The small eastern Caribbean nation of Barbados faces many of these challenges, yet with a highly
educated workforce and a climate conducive to year-round food production, it has the potential to
transform its agricultural industry by employing new food production technologies that can be applied
to the local context while placing minimal stress on the country’s already scarce water and
agriculturally-productive soil resources.
Aquaponics is a concept relatively new to modern food production methods and provides answers to
many of the above-mentioned problems. The technology combines the two well-established practices
of aquaculture and hydroponics to yield a method of food growing that greatly reduces the use of water
resources, demands no soil at all, and produces high yields of fresh, nutritious crops in the form of
vegetables, fruits, herbs and fish.
Aquaponics on a small scale can serve as a family’s solution to the need for an inexpensive, nutritious
and reliable food source that has the capacity to provide a full meal (vegetables and protein) without
many inputs. The optimization of one such small-scale, backyard aquaponic food production system is
the subject of this report whereby an improved design is delivered in response to practical experience
gained during an internship with the Baird’s Village Aquaponic Association in Barbados over the Fall of
2009.
This report details the improvements in the configuration and overall health of the backyard aquaponic
systems seen in Barbados through the inclusion of an effective aeration system, a method of water-level
regulation, a different and more efficient system of water pumping/distribution, as well as measures for
the assurance of high system water quality and increased crop yields. The importance and
appropriateness of aquaponics as a solution in Barbados is explored along with the key parameters
required for a high-performance aquaponic food production system.

1. Introduction
1.1 Food Security
Populations around the world face questions of food security today on a scale that has not been seen in
recent human history. The evolution of how we feed our populations and the technologies we use to do
it have created a unique set of circumstances that bring with them unique challenges, and despite
significant advances in food production and our knowledge of food nutrition and food safety, hunger
continues to plague millions of people around the world. It is thought that over a billion people in the
world are currently undernourished (World Food Programme, 2010). Many factors contribute to
hunger and decreasing food security in the world today including conflict, poverty, poor agricultural
infrastructure and over-exploitation of the environment.
The concept of food security is defined by the Food and Agriculture Organization of the United Nations
(FAO) in the following way:
“Food security exists when all people, at all times, have physical, social and economic access to sufficient,
safe and nutritious food which meets their dietary needs and food preferences for an active and healthy
life. Household food security is the application of this concept to the family level, with individuals within
households as the focus of concern.”
Key among the issues that threaten food security are the intensive resources needed for agricultural
activities. Agriculture is by far the largest strain on the world’s precious freshwater resources, currently
accounting for 70% of the world’s freshwater consumption (Pimentel, Berger, Filberto, & Newton,
2004). Some predictions have human consumption of the world’s freshwater resources at over 90% by
2025 (2003 International Year of Freshwater, 2003). Increasing water scarcity has given rise to an
unprecedented water conservation movement, although consumption levels remain at all time highs.
Agriculture’s dependence on healthy soil presents another problem in food production, as current
estimates are that 38% of global agricultural land is degraded. Soil degradation is the change induced
by the natural decrease in the soils’ potential for productive use, and normally results in reduced yields
due to lack of or insufficient nutrients or water availability. Improper land use and poor land
management have been singled out as the most important factors leading to soil degradation (The
World Bank, 2010). To add value to the soils’ nutrient stock, agricultural trends have been to add

increasing amounts of fertilizer, which, along with herbicides and pesticides, has contributed to
significant and disquieting environmental problems.
Access to food is another obstacle that families and countries face when considering food security.
Often it is difficult or unfeasible to grow food locally and a global trend for many has been to obtain
food that has been grown far from the point of purchase. However, many developing countries lack the
infrastructure such as roads or storage facilities to make this scenario effective and sustainable. In
addition, this situation makes millions of people vulnerable to market related supply problems
associated with distant producers.
1.2 Small-Scale Agriculture
Modern agriculture has slowly evolved to fit a capitalist, industrial model where farming is done on large
scales by relatively few farmers. Multi-national corporations now control such a large portion of the
food production process that the people they feed have become increasingly dependent and vulnerable
to their abilities and philosophies. Industrialization of any process theoretically is the most efficient use
of our resources, however the allocation of our food production to a few powerful institutions has
resulted in the development of significant food security and environmental problems. Decreasing
genetic diversity in our food production, genetically altered food, and the large energy requirements to
package, preserve, and transport food are just some of the issues brought on by the industrialization of
our food system.
Given the problems associated with intensive farm practices, and given the global scarcity in soil and
water resources along with the problems associated with under-developed regions where hunger
prevails, there has been a large push toward more sustainable farming practices in an effort to feed
more people with increasing efficiency while reducing our impact on the environment. Small scale
farming is an alternative to intensive farming. It acknowledges agriculture’s dependence on finite
resources.
Urban agriculture is defined as the practice of cultivating, processing, and distributing food, in or around
(peri-urban), a village, town or city (Bailkey & Nasr, 2000). It is being recognized as one of the activities
that has the potential to contribute toward socio-economic development in urban areas of the
developing world and has the capacity to contribute to alleviating food insecurity and poverty. Studies
show that urban agriculture contributes significantly to household income and gives families access to
inexpensive food, consequently reducing poverty (Hampwaye, Nel, & Ingombe, 2009).
Such an agricultural method is the subject of the design project that follows. Aquaponics is the
combination of hydroponic and aquaculture systems, whereby fish tank water that has become nutrient
rich by the excretion of fish is circulated into a growing area where the nutrients are absorbed by plants
that are cultured hydroponically. At the same time the grow bed acts as a biofilter and cleans the water
so it can be recirculated back to the fish tank. The closed system uses a fraction of the water, no soil,
and produces two food sources for consumption; the crops grown in the bed, and the fish reared in the
tank. Aquaponics is garnering growing attention around the world because of its efficient use of
resources. It provides a simple and practical solution to the food security issues previously discussed
and has the potential to increase the health and stability of families by feeding them and helping them
become financially secure.
1.3 Objective of Project
In the Fall of 2009, Keith Connolly and Tatjana Trebic, the authors of this project, took part in the
Barbados Field Study Semester where they were partnered with the Baird’s Village Aquaponic
Association (BVAA), which had just received a United Nations Development Fund grant to develop a
community sized aquaponics operation in the community of Baird’s Village. During the internship, Keith
and Tatjana did promotional work with the organization and helped in the construction of several
systems, including one that they housed at McGill University’s Bellairs Research Institute on which they
conducted water quality tests. Tilapia were used in all these systems and in the McGill system okra and
basil were grown.
Mr. Hinkson, the founder of the Baird’s Village Aquaponic Association, had been working with
aquaponics for several years, but didn’t have a very scientific approach to minimizing his inputs and
maximizing his outputs. Thus was born the objective of this project:
To design an improved aquaponics system and make management recommendations with the goal of
optimizing fish and plant biomass outputs.
2. Background
2.1 Agriculture in Barbados
2.1.1 Economy and Human Resources
The easternmost Caribbean island nation of Barbados (see Figure 39 in Appendix A) is considered to be
the most developed of the Caribbean states, having one of the highest per capita incomes in the region.
Its political stability, relative proximity to North American markets and exceptional natural
beauty/biodiversity make it a desirable market for foreign investment. Foreign exchange includes
offshore financing and information services as well as significant trading with the United States, Canada
and other Caribbean states, with services making up 80% of national exports. Tourism and the light
industry make up 75% of the national GDP while agriculture contributes a mere 6% (Central Intelligence
Agency, 2010).
Barbados has economic strengths in that it shares the same time zone as the eastern United States and
Canadian financial centers, has English as its official language, making communications with Canada, the
United States and the United Kingdom seamless, and a has a highly educated workforce with a literacy
rate of 99.7% (Central Intelligence Agency, 2010).
The small size of Barbados and other nations in the region does not allow for economies of scale,
however, regional cooperation through entities such as The Caribbean Community (CARICOM) allows for
the free movement of labour and capital, the coordination of agricultural, industrial and foreign policies
as well as access to a Common Market. Such collaboration among Caribbean states strives to improve
standards of living in its member countries, enhance international competitiveness and increase
productivity among other goals for the development and prosperity of the region (CARICOM, 2009).
2.1.2 Natural Resources
The densely populated island nation of Barbados (627 people/km2) has limited resources required for a
prosperous agricultural industry (Central Intelligence Agency, 2010). This high population density and
seasonal influx of foreign tourists - over 570,000 tourists stayed in Barbados in 2007 and over 600,000
cruise ship passengers visited the country that same year – places stress on the country’s key national
resources (Totally Barbados, 2010).
Barbados is known as the 15th most water scarce country in the world and freshwater withdrawal per
capita is 333 m3/year (Central Intelligence Agency, 2010). Internal Renewable Water Resources are on

the scale of 0.082 km3/year, groundwater from infiltrated rainfall supplies 0.074 km3/year, while surface
waters make up 5.8 million m3/year (FAO, 2000). Average daily water use by the agricultural sector
amounts to approximately 10.4 ML/day (or 10, 400 m3/day) and an estimated 1026 ha are irrigated by
potable water (UN, 2004). This makes up 5.9% of the country’s total cropland (EarthTrends, 2003). Total
renewable water resources amount to 0.1 km3 (Central Intelligence Agency, 2010).
The land surface of the island is composed mostly (~83%) of coralline limestone, while the remaining
17% is made up of shales, sands and clays (FAO, 2000). The limestone that covers most of the nation is
highly porous and allows for very rapid infiltration of rainwater, meaning that its capacity to retain water
in the root zone is quite low ( Ministry of Agriculture and Rural Development). The northeastern region
of the island, called the Scotland District is made up of layers of shales, sands and clays. It is quite rugged
and is characterized by high overland runoff, frequent landslides and surface soil erosion problems (FAO,
2000).
The long history of intensive plantation-style monoculture production over the past 300 years in
Barbados has made extensive contributions to soil quality problems in Barbados. These include the
erosion of topsoil, a decrease in soil fertility, and the consequent application of large amounts of
fertilizer and pesticides in order to maintain productivity (Homer, 1998).
2.1.3 Climate
Barbados has a tropical oceanic climate with little variation in temperatures due to the cooling easterly
trade winds from the Atlantic Ocean. The rainy season lasts from June to December, but the island is
considered to be relatively arid in comparison to other Caribbean nations. (FAO, 2000) The country is
part of the hurricane belt, however, the frequency of hurricanes hitting Barbados is extremely low.
Average temperatures during the day reach about 27 oC (see Figure 40 in Appendix A for data on
temperature, wind speed, humidity, rainfall, and other weather parameters typical to Barbados) and
range approximately from 20 to 32oC.
In a typical year, an average rainfall of 760 mm along the coastal areas to 2000 mm in the
central parts of the island are common (Economic and Social Development Department (FAO), 2005),
but rainfall amounts may be lower than 25 mm per month during the dry season (FAO, 2000).

On average throughout the year, Barbados receives 8 to 9 hours of sunshine each day (see Figure 40 in
Appendix A).
2.1.4 Terrain
The island of Barbados is mostly flat with a gentle upwards slope from the coast towards the inland
(Central Intelligence Agency, 2010). The predominant coralline limestone regions are divided into three
terraces rising towards the interior of the island with a peak elevation of 343 m above sea level (AXSES
Systems Caribbean Inc.), and are lined with deep gullies running from high elevations at the Scotland
District to the coast (FAO, 2000).
2.1.5 Crop Production in Barbados
The colonial history of Barbados has left behind a reliance on monocrop, plantation-style agriculture
which focuses on the production of a single cash crop in large amounts. The agricultural industry in
Barbados therefore still consists primarily of sugar cane cultivation and the sugar, rum and molasses
production industry. In the 2007/2008 growing season, 31.7 thousand tonnes of cane were harvested on
5.9 thousand hectares of land (IICA, 2009). Sugar, a cash crop, most of which is exported, is however on
the decline and its future as a significant sector of the country’s economy is in peril due to poor quality
soils, high cultivation costs, sporadic droughts and low global sugar prices (FAO, 2008). The proportion
of land in the country that is arable is 37% (about 22, 472 ha), while only 2.3% of the land is used to
grow permanent crops (FAO, 1999).
Other crops include cotton, root crops, corn, onions, other vegetables, bananas, plantains, figs, other
fruits, cut-flowers and foliage (Homer, 1998).
Production of food crops in the country is quite low as Barbados imports around 80% of its food (IICA,
2009), including large amounts of fruits and vegetables (Závodská & Dolly, 2009). Only 10% of the
labour force in Barbados is involved in agricultural activities as agriculture must compete with more
profitable industries and forms of land use such as the growing tourism and real-estate sector (CIA
World Factbook, 2009).
The reliance on outside factors and world markets associated with such high levels of food importation
place the country in a position of dependency and hinders progress towards self-sufficiency in terms of
food production. Barbados’ agricultural trade deficit in 2004 was US $67.5 million (FAO, 2008).

Future plans for the promotion of small-scale farming by the Ministry of Agriculture and Rural
Development will encourage local production of food crops and small livestock, which will give
Barbadians increased food security and greater independence in the generation of their household
incomes (Závodská & Dolly, 2009).
Traditionally, small-scale farming faces challenges regarding the necessity to incorporate high-input
technologies into their production in order to be able to compete on the global market. These
technologies involve high costs and significant initial investments that cannot be afforded by all rural
food producers and which increase production costs and therefore the cost of locally produced crops.
This makes small farmers uncompetitive against cheaper imported items (Závodská & Dolly, 2009).
There is a great local need for innovative agricultural solutions that can be applied to the Barbadian
context and which ensure the feasible, small scale production of food by average Barbadian families. An
appropriate and accepted solution will therefore contribute to decreased dependency on foreign
imports which involve transportation across great distances and are generally highly unsustainable.
Aquaponics has the potential to lessen the challenges associated with small scale farming in Barbados
and generally in the Caribbean. The system requires minimal land and water resources, and no soil
resources, which is desirable for highly populated and arid regions such as Barbados. Aquaponic systems
provide a source of protein as well as fresh fruits, vegetables or herbs. As meat on the island is relatively
expensive, protein in the form of freshwater fish would provide a healthy alternative and reduce stress
on dwindling saltwater and freshwater fish supplies.
2.2 Food Production Methods
2.2.1 Aquaculture
Aquaculture is the cultivation and rearing of aquatic plants and animals in a fully or semi-controlled
environment. Many species are produced around the world by means of aquaculture including both
freshwater and saltwater fish, crustaceans, and molluscs, along with plants such as seaweed. The
origins of aquaculture date back thousands of years. There are different theories as to how the practice
came about but it is generally thought to have developed independently in several parts of the world,
usually by a low-lying area of land being flooded and stocked with fish during high tide or rainy season
and the surrounding human population implementing preliminary aquacultural practices to maintain the
fish in order to have a reliable food source (Herminio, 1988).
Freshwater finfish, particularly Chinese and Indian carp species, account for the greatest share of total
aquaculture production, followed by molluscs. Although low in production quantity, some of the minor
product groups, such as shrimp and marine fish, have a disproportionate economic importance because
of their high unit value. The most harvested species in recent years have been the Pacific cupped oyster
and the silver carp. By 2006 aquaculture was provided nearly 50 percent -- or 51.7 million tonnes -- of all
world fisheries production (Aquaculture resources, 2010).
The latter half of the 19th century saw the capacity of commercial fishing increase at unprecedented
rates. The result was the plummeting of fish stocks around the world forcing some fisheries, such as
the North Atlantic cod fishery, to be completely shut down to recover. The state of the world’s oceans is
in dire circumstances, whereas demand and consumption for seafood is at an all time high. Aquaculture
will be a powerful tool to reconcile this paradox. Current predictions are that aquaculture production
will need to reach 80 million tonnes by 2050 to keep pace with seafood consumption. (Aquaculture
resources, 2010).
Many different forms of aquaculture take place at varying levels of intensity and scale. In mariculture,
organisms are usually cultured in sheltered marine environments, whereas integrated multi-trophic
aquaculture combines multiple organisms in a tank attempting to use the waste from one, such as fish,
for the input of another, such as seaweed.
Many significant issues are present within the world of aquaculture. Decreasing genetic variation
associated with fish farming, competition between wild and farmed animals, propagation of diseases
associated with aquaculture’s high stocking densities, and waste management are but to name a few.
In-shore aquaculture requires massive amounts of water exchange to keep water quality at non-toxic
levels. Finding uses for the wastewater produced in aquaculture has proved to be a laborious and
cumbersome endeavour.
2.2.2 Hydroponics
The word hydroponics is taken from the Greek words hydro, meaning water, and ponos, meaning
labour. It is a method of growing plants using a mineral nutrient solution in water, without soil. In
traditional agricultural methods soil is used as the medium whereby nutrients are dissolved in water,
which can then be taken up by the plant roots, although the soil itself is not necessary. If nutrients are
added to the water in which the plants are grown, then the soil medium is not needed. Although the
technique is thought to be a technologically advanced manner to grow plants, hydroponic methods, or

at least ones with their roots in hydroponics, have been used for centuries and are quite simple to
employ. The hanging gardens of Babylon, the floating gardens of the Aztecs of Mexico and those of the
Chinese are all precursors to modern day hydroponic cultures.
For the purposes of this paper the term hydroponics is applied to systems using growing media, in our
case coconut husk, as will be discussed later. Systems using some form of growing media that is not soil
are designated as simply ‘soilless culture’. Both soilless culture methods and hydroponics methods use
a nutrient solution but hydroponics is generally thought of as a subset of soilless culture since it does
not employ media to support the root structure of the plants.
The ability to grow plants in areas where soil is not conducive for in-ground agriculture is the great
advantage of hydroponics. Also, it is much more efficient in its water use as water stays in the system
and can be reused, as opposed to it percolating through the soil and ultimately replenishing the
groundwater reserves. Having greater control over nutrient levels results in healthier crops, fertilizers
which often contribute to pollution are not used, pesticides are not needed to deal with pests, and
ultimately, much higher and more stable crop yields are achieved.
Hydroponic methods have been the subject of much research during the last century as more focus has
been put on our agricultural methods. As a result, many advances have been made in the field and
current hydroponic methods take many forms. The types of systems possible will be further discussed
while outlining the hydroponic component of aquaponics systems, however as noted above, whether
the system uses a media or not is a primary distinction. If there is no media employed in an aquaponic
system, the plant roots are exposed to the nutrient solution directly. Among these types of systems are
the nutrient film technique (NFT), flood and drain technique, deep water culture technique and raft
technique.
2.2.3 Aquaponics
Aquaponic systems combine the two forms of agricultural production mentioned above, recirculating
aquaculture and hydroponics. Aquaponics provides a solution to the main issues these two systems
face; the need for sustainable ways of filtering or disposing of nutrient-rich fish waste in aquaculture
and the need for nutrient-rich water to act as a fertilizer with all of the nutrients and minerals needed
for plants grown through hydroponics (Nelson, 2008). Combining these two systems provides an all-
natural nutrient solution for plant growth while eliminating a waste product which is often disposed of
as wastewater.
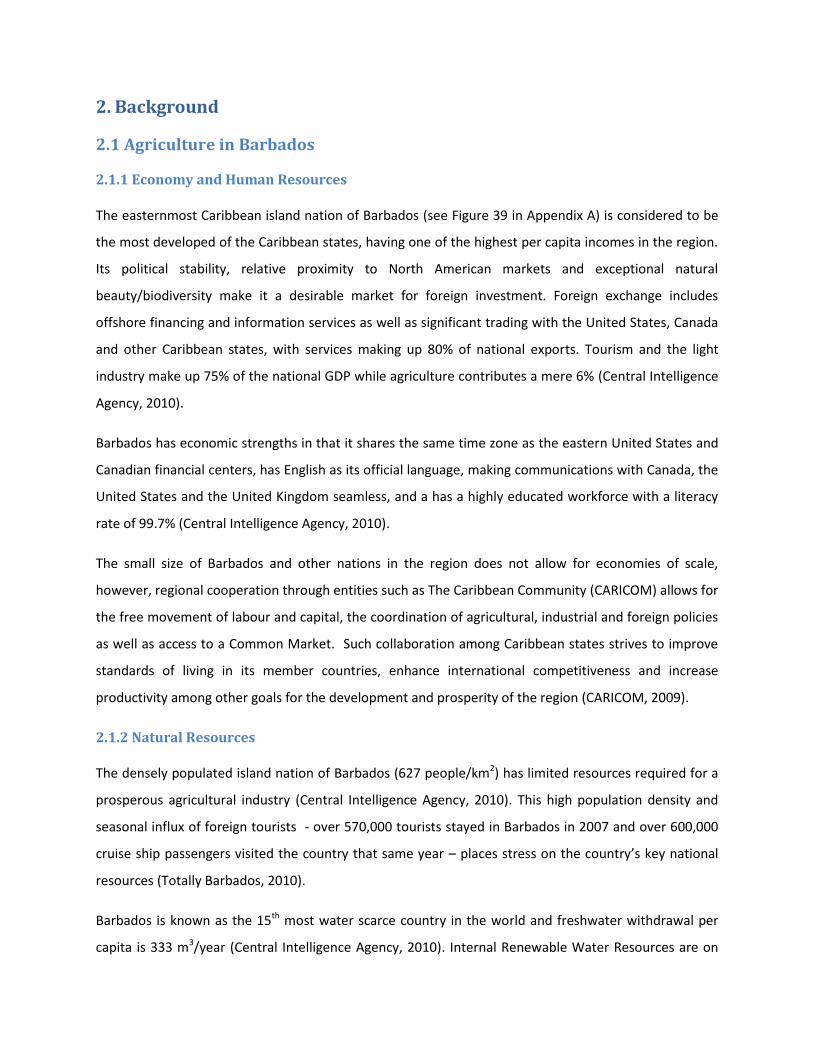
Clean, filtered water
Nutrient-rich fish
waste effluent
In these systems, the fish grown in a freshwater tank secrete wastes through urine and through their
gills into their surrounding tank water. Over time, these waste compounds, which are toxic to the fish
accumulate and compromise fish health, but can be used as an organic fertilizer for plants (Nelson,
2008). This nutrient-rich effluent is used to irrigate a connected hydroponic bed while fertilizing its plant
crops at the same time. The nutrients, largely in the form of ammonia are converted by denitrifying
bacteria in the hydroponic grow bed into forms readily uptaken by plants for energy and growth.
Essentially, the hydroponic bed and its crops serve as a biofilter for the fish waste water before it is
returned, cleaned back into the fish tank. Thus, the waste of one biological system becomes nutrients
for another biological system (Diver, 2006). See Figure 1 for a conceptual diagram of the nutrient/water
flows in a general aquaponic system.
Figure 1: Conceptual diagram of nutrient recycling in aquaponic systems (Adapted from (Suits, 2010))
Aquaponics allows for the growth of a full meal (protein from fish and fibre, nutrients and minerals from
vegetable, fruit, or herb production) in one closed-loop system, where the cultivation of two types of
crops (fish and plants) is accomplished using only one body of water and one infrastructure. Crops are
grown in a concentrated manner without compromising the health of the system and while greatly
reducing the required input of water resources (Nelson, 2008) and increasing the value gained from the
continuously cleaned and recycled water (Considine, 2007).
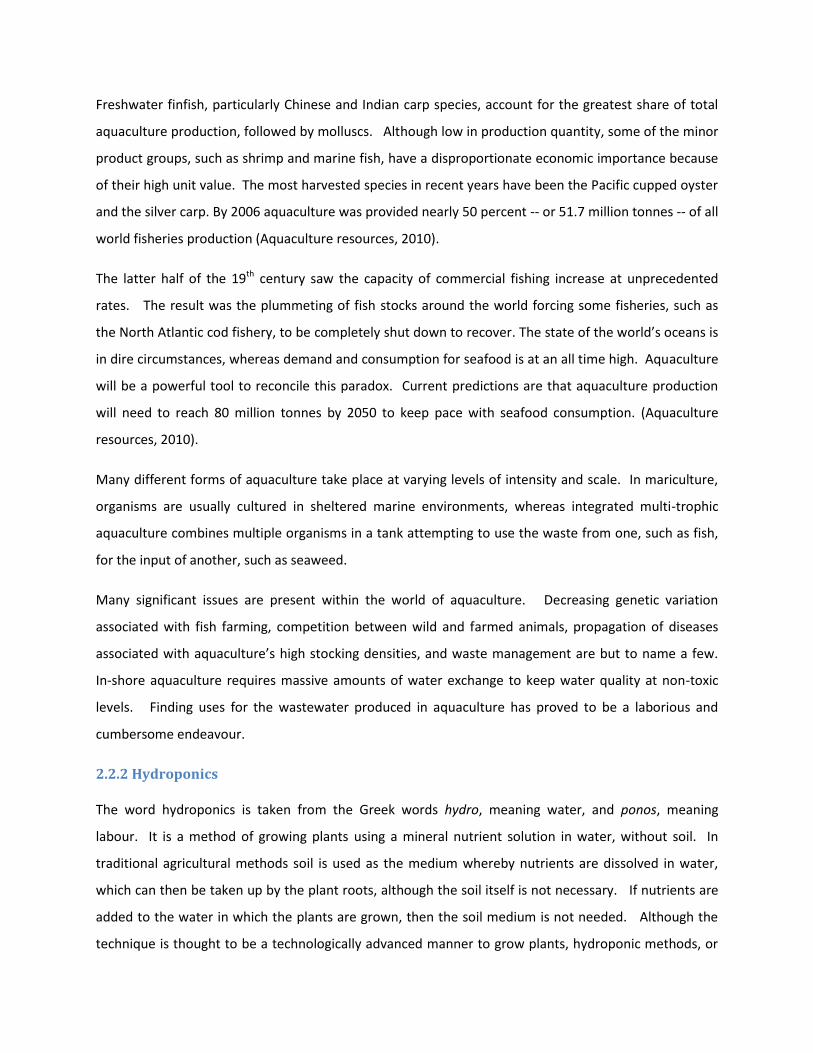
Aquaponics is an extremely resource-efficient and sustainable method of producing crops on any scale
(Suits, 2010) that imitates the plant-fish interactions found in a natural waterway. See Figures 2 and 3
for various sizes of aquaponic systems.
Figure 2: A small system, built using recycled barrels Figure 3: A commercial-sized raft aquaponics (Hughey, 2005). system (Rakocy, Masser, & Losordo, 2006)
When the system is in balance, high production of fish and plant crops at high stocking densities can be
obtained without the use of chemical fertilizers, herbicides or pesticides (Nelson, 2008). A small
aquaponic system in the backyard of a Barbadian family could go a long way in providing exceptionally
fresh food daily and promoting local food production as well as supporting the local economy (Diver,
2006). This type of backyard agriculture allows for the production of various plant crops in a small space
that can be used in the home kitchen or can be sold on the local market.
Aquaponic systems can provide food year-round (even during the dry season) in arid regions where
water and soil resources may be scarce and can act as the key to self-sustenance for communities living
in developing regions of the world and normally depending on world food markets (Hughey, 2005). The
lack of a need for soil in these systems implies that they can be used in urban regions and in places with
poor soil quality (Nelson, 2008).
In order to feed the world’s growing population, there will be a great need for highly productive, urban
and sustainable food production systems (Nelson, 2008). Increasing health consciousness and world
demands for fish supplies require a solution such as aquaponics which integrates two separate systems
which individually can meet these needs partially, but combined can provide an answer to the greater

picture with increased resource-efficiency and at a lower cost (Diver, S., 2000), all while giving
individuals and families greater control over the quality, safety and origin of their food.
2.2.4 Comparison of Food Production Methods
Aquaponic food production is very versatile in that it can be used on a commercial scale or at the level of
home food production. It combines many of the advantages of other methods of food production (such
as aquaculture and hydroponics) with additional advantages unique to aquaponics.
In comparison to hydroponics, aquaponics also does not require soil for the abundant, year-round
growth of food and provides the elements minerals and nutrients as well as the structural support that
traditionally is provided by soil. Both systems also allow for high crop densities and the conservation of
water. No water is lost in these systems to soil outside of the root zones or to weeds which populate soil
systems. Additionally, the risk of soil-borne disease is not present (Nelson, 2008).
The large amounts of time and resources that hydroponic growers spend mixing the perfect fertilizer
solution from manufactured or mined compounds in order to meet all of the nutritional requirements of
the plants are reduced simply and significantly in aquaponics (Nelson, 2008). Aquaponics does not
require the addition of synthetic, chemical fertilizer as the fish waste from the rearing tank provides
adequate amounts of the essential ammonia, nitrate, nitrite, phosphorus, potassium and micronutrients
as well as some secondary nutrients for the healthy growth of hydroponic plants (Diver, 2006). The use
of synthetic herbicides and pesticides is also unnecessary and would greatly compromise the health of
the fish who are highly sensitive to water quality. Aquaponics is therefore essentially an organic form of
hydroponics (Nelson, 2008) whose only fertility input is fish feed containing about 32% protein.
Aquaponics also provides an entirely separate crop in addition to plant crops – the fish (Spade, 2009).
In comparison to aquaculture, an aquaponic system can house fish at a high stocking density provided
that the water is regularly filtered and aeration is regularly performed along with the monitoring of all
water quality parameters relevant to the health of the fish. Both systems can be housed nearly
anywhere due to the small amount of space they require and can therefore provide fresh fish to a
community on a regular basis.
Recirculating aquaculture, however has been criticized for its high rate of failure as the high stocking of
fish leaves little room for error in terms of water quality and therefore of fish health. Water in these
systems must be mechanically or biologically filtered with extreme care and all parameters must be

carefully maintained. A large waste stream of fish waste is also produced in aquaculture and it needs to
be disposed of somehow. Additional water inputs are needed to ensure water quality. An aquaponic
system provides solids removal and biofiltration of the fish waste effluent as well as additional cleaning
by the assimilation of nutrients into plant biomass. The waste stream from aquaculture is eliminated
and an additional type of crop (plants) is obtained (Nelson, 2008). In terms of resource efficiency,
aquaponic systems use 1% of the water required in pond aquaculture to raise the same yield of tilapia
fish – a species commonly used in recirculating aquaponic systems (Diver, 2006).
Aquaponics combines the advantages of both hydroponics and aquaculture, while eliminating the
disadvantages of both systems. It also reduces operating costs in comparison to either of these methods
alone. A comparison of the above mentioned systems along with comparison to organic farming is
summarized in Table 1 below.
Table 1: Comparison of various forms of food production (adapted from “Comparison of Methods” table in Nelson, 2008).
Advantages Disadvantages
Organic
Farming
- Presumed as a healthier method of growing
food than commercial farming and thus has
become popularized.
- Uses organic wastes as fertilizer.
- Uses natural pest control.
- Tends to produce better tasting and at times
more nutritional crops.
- Requires more land than
conventional farming.
- Often higher costs to grow and
certify crops.
- Agribusiness is quickly replacing
small-scale organic operations.
Inorganic
Hydroponics
- High volumes of food are produced in a small
space.
- Has potential for year-round production if
controlled.
- Highly dependent on costly
manufactured/mined fertilizers.
Recirculating
Aquaculture
- High biomass of fish produced in a small
space.
- High rate of failure due to small
margin for error.
- Large waste stream produced.
Aquaponics - All of the advantages of the other methods
and additionally:
- Reuse of fish waste as nutrients for plants.
- Fish don’t carry the pathogens (e.g. E.coli and
Salmonella) found in warm-blooded animals.
- Imitates a natural cycle and is the most
sustainable of the four methods.
- Consistent fish biomass in the fish tanks lets
plant growth thrive.
- Operator must have knowledge
of both fish and plant
production.
- Major fluctuations in fish stocks
in the tank can disrupt plant
growth.

3. Aquaponic Systems
3.1 System Designs
There exist several system designs for recirculating aquaponics systems. The designs are based on
hydroponic systems, the difference being that the water source for the aquaponics system come from
the fish tank and is eventually returned to its source of origin.
3.1.1 Media Filled Systems
The hydroponic component is first distinguished by whether it employs a media or not. This becomes
very important in aquaponic systems because the presence of a media that plant roots are grown in can
possibly eliminate the need for a separate settling tank and biofilter. Sludge and solid from the fish tank
get caught in the media and are processed by bacterial communities that develop in the media, thereby
acting as a biofilter and eliminating the need to remove the solids in a separate system. If the system
does not employ a media and plant roots are exposed directly to the water, then a settling tank and
biofilter are necessary to return the water quality to sufficient levels in which fish can live (Rakocy,
Masser, & Losordo, 2006).
Figure 4: Various grow media in media-filled systems (Hydroponics: Andrew Smith, 2006)
3.1.2 Flood and Drain (also known as Ebb and Flow)
In flood and drain systems, plant roots are exposed to a static nutrient solution for hours at a time
before the solution is drained away, which could happen several times a day. The technique can be
used regardless of whether a media is used in the system, and plant roots could either be completely
submerged, or partially submerged, leaving a portion exposed to the atmosphere. Flood and drain
systems are noted for their simplicity, reliability and user-friendliness.

Figure 5: Different stages of a flood and drain system (Types of Hydroponics Systems: Dave's Hydroponics Experiment, 2010)
3.1.3 Nutrient Film Technique (NFT)
Nutrient film technique consists of the plant roots being exposed to a thin layer of nutrient water than
runs through most often a PVC pipe. The idea is that the shallow flow of water only reaches the
bottom of the thick layer of roots that develops in the trough while the top of the root mass is exposed
to the air, thereby receiving an adequate oxygen supply. Channel slope, length, and flow rate must all
be calculated to make sure the plants receive sufficient water, oxygen, and nutrients. If properly
constructed, NFT can sustain very high plant densities. In aquaponic NFT systems, the biofilter becomes
crucial as there is no large surface area whereby bacteria communities can develop (Nelson, 2008).
Figure 6: A pipe NFT system Figure 7: A trough NFT system (What is Aquaponics: The Fish Farm, 2010) (About Hydroponics: Get up and Grow, 2007)
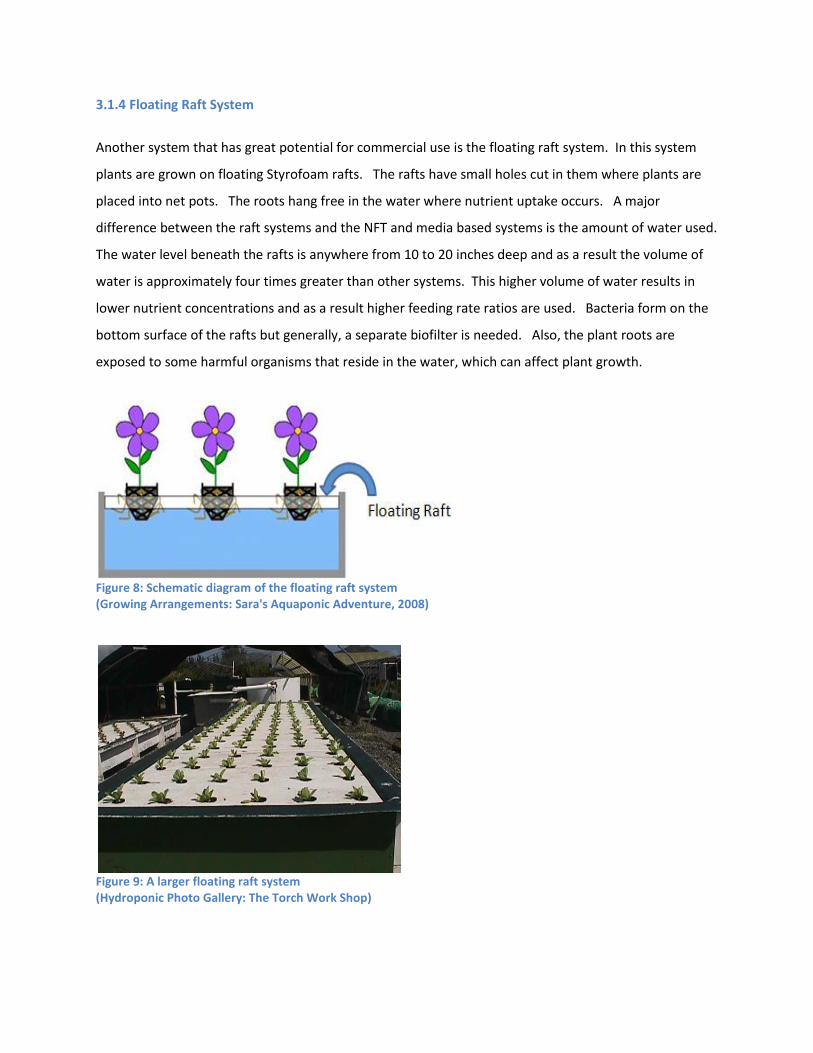
3.1.4 Floating Raft System
Another system that has great potential for commercial use is the floating raft system. In this system
plants are grown on floating Styrofoam rafts. The rafts have small holes cut in them where plants are
placed into net pots. The roots hang free in the water where nutrient uptake occurs. A major
difference between the raft systems and the NFT and media based systems is the amount of water used.
The water level beneath the rafts is anywhere from 10 to 20 inches deep and as a result the volume of
water is approximately four times greater than other systems. This higher volume of water results in
lower nutrient concentrations and as a result higher feeding rate ratios are used. Bacteria form on the
bottom surface of the rafts but generally, a separate biofilter is needed. Also, the plant roots are
exposed to some harmful organisms that reside in the water, which can affect plant growth.
Figure 8: Schematic diagram of the floating raft system (Growing Arrangements: Sara's Aquaponic Adventure, 2008)
Figure 9: A larger floating raft system (Hydroponic Photo Gallery: The Torch Work Shop)

3.2 Fish
3.2.1 Fish Selection
The type of fish used in an aquaponic system depends on the climate which will surround the aquaponic
system and therefore the temperature the grower is able to maintain, the kinds of fish that the local
fisheries department has specified as legal (there are sometimes restrictions on the cultivation of fish
that are not native to the region), the type of fish desirable for consumption by consumers and the type
of fish feed available to the grower (Nelson, 2008).
There are a number of freshwater fish – both warm-water and cold-water species – that can be adapted
for cultivation in recirculating aquaculture systems. These include tilapia, trout, perch, Arctic char (Diver,
2006), blue gill, largemouth bass, channel catfish, koi carp, goldfish, barramundi, murray cod, jade perch
(Nelson, 2008), crappies, rainbow trout, pacu, common carp and Asian sea bass (Rakocy, Masser, &
Losordo, 2006). Others beyond this list include warm-water fish that are hardy and can adapt to
commercial fish feed and high levels of crowding (Nelson, 2008), including some ornamental fish
(Rakocy, Masser, & Losordo, 2006). The hybrid striped bass is one species that reportedly does not
perform well in aquaponic systems as it cannot tolerate high potassium levels – a common supplement
used for plant growth (Rakocy, Masser, & Losordo, 2006).
Most commercial systems, however, culture tilapia. Tilapia is a tropical fish originating from the Near
East and Africa (Nelson, 2008) that can be well adapted to recirculating tank aquaculture and is
exceptionally resilient against fluctuations in dissolved oxygen levels, temperature, pH and dissolved
solids (Diver, 2006). Figure 10 below shows a typical tilapia species used in aquaculture.
Figure 10: Red Tilapia fish at harvest (My Mom-Friday, 2009)

The temperature range that tilapia enjoy also correlates to ideal temperatures for the growth of
aquaponic plants. Tilapia are the fastest growing of the species used in aquaponic systems (Nelson,
2008) and due to their resilience, their use and therefore the literature available on their cultural
procedures is much more developed and thorough (Diver, 2006). The white-fleshed meat of tilapia is
popular due to its desirable culinary properties of taste and texture. Virtually unknown in the US in the
1990’s, tilapia is now the 6th most consumed seafood product in the country and its popularity continues
to grow (Nelson, 2008).
A member of the cichlid family, tilapia is the most widely cultured fish in tropical and subtropical areas
of the world and has also been introduced to Japan, India and throughout Asia, Russia, Europe and also
the Americas (Nelson, 2008).
3.2.2 Culturing Conditions for Tilapia
Although very dependable and resilient to changing conditions, tilapia – like all other fish species – have
certain conditions at which they grow best.
3.2.2.1 Water Quality
Good water quality must be maintained at all times in a recirculating fish tank to maintain optimal
growth conditions and health of the fish. Regular water quality testing is essential and can be
performed using water quality testing kits obtained from aquacultural supply companies. The most
critical water quality parameters to monitor are dissolved oxygen concentrations, temperature, pH, and
nitrogen from ammonia, nitrate and nitrite. Nitrogen in the form of nitrate and nitrite usually does not
present a water quality problem in aquaponic fish tanks as nitrite is quite quickly converted to nitrate
and nitrate itself is only seriously toxic to fish at very high levels (300-400 mg/L). The biofiltration
mechanism in aquaponic systems also removes nitrates quite well and can keep their concentration at
much lower levels than this (DeLong, Losordo, & Rakocy, 2009). Thus the most important water quality
parameters to design and make practice recommendations for are temperature, dissolved oxygen and
ammonia. Other important parameters include salinity, phosphate, chlorine and carbon dioxide. Other
factors that influence the quality of fish tank water include the stocking density of the fish, their growth
rate, the rate at which they are fed, the volume of water in the system and environmental conditions
(Diver, 2006). The ideal values for tilapia water quality parameter requirements critical for the design of
aquaponic systems (which are explained below) are summarized in Table 2.
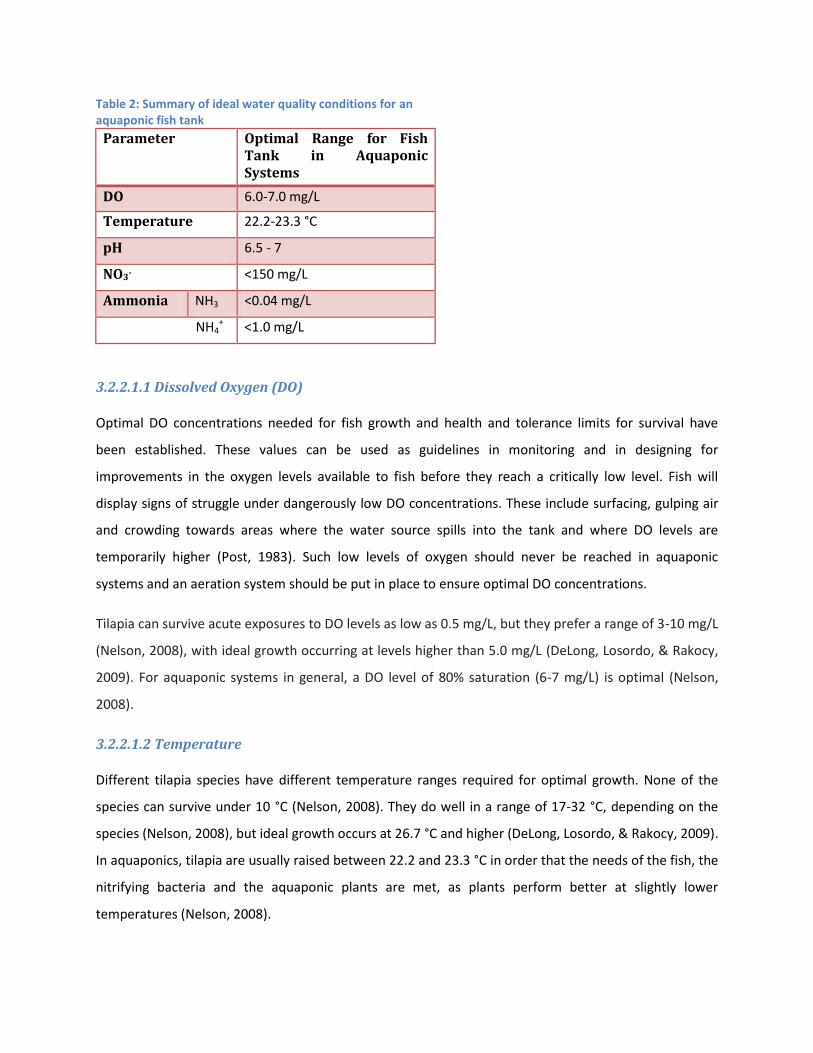
Table 2: Summary of ideal water quality conditions for an aquaponic fish tank
Parameter Optimal Range for Fish Tank in Aquaponic Systems
DO 6.0-7.0 mg/L
Temperature 22.2-23.3 °C
pH 6.5 - 7
NO3- <150 mg/L
Ammonia NH3 <0.04 mg/L
NH4+ <1.0 mg/L
3.2.2.1.1 Dissolved Oxygen (DO)
Optimal DO concentrations needed for fish growth and health and tolerance limits for survival have
been established. These values can be used as guidelines in monitoring and in designing for
improvements in the oxygen levels available to fish before they reach a critically low level. Fish will
display signs of struggle under dangerously low DO concentrations. These include surfacing, gulping air
and crowding towards areas where the water source spills into the tank and where DO levels are
temporarily higher (Post, 1983). Such low levels of oxygen should never be reached in aquaponic
systems and an aeration system should be put in place to ensure optimal DO concentrations.
Tilapia can survive acute exposures to DO levels as low as 0.5 mg/L, but they prefer a range of 3-10 mg/L
(Nelson, 2008), with ideal growth occurring at levels higher than 5.0 mg/L (DeLong, Losordo, & Rakocy,
2009). For aquaponic systems in general, a DO level of 80% saturation (6-7 mg/L) is optimal (Nelson,
2008).
3.2.2.1.2 Temperature
Different tilapia species have different temperature ranges required for optimal growth. None of the
species can survive under 10 °C (Nelson, 2008). They do well in a range of 17-32 °C, depending on the
species (Nelson, 2008), but ideal growth occurs at 26.7 °C and higher (DeLong, Losordo, & Rakocy, 2009).
In aquaponics, tilapia are usually raised between 22.2 and 23.3 °C in order that the needs of the fish, the
nitrifying bacteria and the aquaponic plants are met, as plants perform better at slightly lower
temperatures (Nelson, 2008).
These slightly lower temperatures also allow for a higher dissolved oxygen content, as the solubility of
oxygen in water decreases with increasing temperature (DeLong, Losordo, & Rakocy, 2009).
Rapid changes in fish tank water temperature may cause thermal trauma in fish and will lead to possible
disruptions of the cardiovascular and nervous systems, the reduction of their enzymatic activities, the
permanent impairment of bodily functions or in death (Post, 1983).
3.2.2.1.3 pH
Most fish grow best at a pH of 7.5-8.0. Tilapia can tolerate a large pH range (from 5 to 10), with ideal
functioning occurring between pH 6 and 9. In a recirculating aquaculture system that involves filtration
through a biofilter (such as a hydroponic, media-filled grow bed), the pH of the fish tank water must
agree with the pH suitable for the survival of the nitrifying bacteria growing in the biofilter. Plants in
aquaponic systems do best at pH 6.0-6.5 and the nitrifying bacteria perform best at pH 6.8-9.0. Thus, a
degree of compromise must be made to satisfy all three systems. Often in aquaponic systems a water
pH of 6.5 to 7 is maintained (Nelson, 2008).
Excessively high or low pH values result in stresses and damage to fish skin and gills, the inability to
absorb oxygen, and the rupturing of capillaries on fins and skin among other negative side effects (Post,
1983). It is important to note that the pH of the tank water also affects the solubility of other
substances in the fish environment and some of these (e.g. ammonia) are toxic to fish. At very high or
very low values of pH, the toxicity of some of these substances to fish increases greatly, but at a neutral
pH of 7, the less toxic forms of these compounds dominate (Droste, 1996).
In aquaponic systems, since the process of nitrification by the bacteria in the biofilter is an acid-
producing process, base needs to be periodically added at some point in the system in order to maintain
a pH of 7. Potassium hydroxide (KOH) and calcium hydroxide (Ca(OH)2) are often used for this purpose.
Adding bases of K and Ca also supplements these essential nutrients that may otherwise be insufficient
in fish waste effluent (Rakocy, Masser, & Losordo, 2006).
3.2.2.1.4 Ammonia
Ammonia is a product of the fish waste and can be highly toxic to fish when it accumulates in their
culture water. The unionized form of ammonia (NH3) is highly toxic to fish and other aquatic life, while
the ammonium ion (NH4+) is much less so (DeLong, Losordo, & Rakocy, 2009). In the aquaponic system
pH of 7, the majority of ammonia nitrogen is in the ammonium ion form. High pH values increase the
proportion of ammonia nitrogen that is in the toxic unionized ammonia form (Droste, 1996).
Regular exposure to NH3 concentrations exceeding 1 mg/L will lead to gill disease and fish will begin to
die at levels as low as 0.2 mg/L, with other functions ceasing to operate at even lower values (Popma &
Masser, 1999). Thus, one should strive for a concentration of NH3 that is as close to zero as possible in
aquaculture systems (Graber & Junge, 2009). Tilapia can maintain their health at an ammonia
concentration range of 0.00-0.04 mg/L (Nelson, 2008). Concentrations of the ionized form of ammonia
should be maintained below 1 mg/L NH4+ (Graber & Junge, 2009).
3.2.2.1.5 Water Quality in BVAA Systems
Water quality experiments on the fish tank water in the aquaponic systems of the BVAA in Barbados
were performed between November 16th and December 3rd, 2009. The experiments included tests of
the following parameters: temperature, pH, salinity, nitrate, ammonia, phosphate and dissolved oxygen.
The only parameter which was problematic and showed consistent values out of the acceptable range
for tilapia cultivation was dissolved oxygen concentration. See Table 11 and Figures 41 to 46 in
Appendix B for the results of these water quality tests.
3.2.2.2 Feed
Tilapia fish are largely omnivores and respond well to commercial fish feed. Their diets need to be well
balanced in terms of amino acids, proteins, fats, vitamins, minerals and carbohydrates. Expertly
formulated feeds that provide all of these components for tilapia are quite common. In natural
environments, wild tilapia may feed on algae (low in protein) and small animals such as worms (high in
protein)and small-scale aquaponic growers may choose to feed their fish with a mixture of these
materials, however optimum tilapia growth will be obtained by the use of commercial feed pellets. Fish
in culture require less food than wild fish as they need less energy to survive and obtain food, thus the
controlled use of fish feed pellets gives the grower complete control of the nutrient inputs into the
aquaponic system (Riche & Garling, 2003).
In recirculating aquaculture, feeding rates for tilapia will vary with fish size. Food to be given is
measured as a percentage of the average body weight of the fish in the tank. Also, as the average fish
weight increases, the percent body weight fed to the fish decreases. The daily feed ratio should
therefore be adjusted to account for fish growth. Table 3 gives an example of this type of feeding
schedule.

Table 3: Example of daily feeding allowances for different sizes of tilapia. (Source: National Research Council (1993) Nutrient Requirements of Fish. National Academy Press, Washington, D.C.)
In aquaponic systems, tilapia fish grow best when fed three times daily ad libitum (the amount of food
that they will eat in 30 minutes) (Rakocy, Bailey, Shultz, & Thoman, 2004), where the feed is composed
of 32% protein (Spade, 2009). Determining amounts of fish feed per tank per day over the growing
period of the tilapia based on average fish weight is considered an over-complication by aquaponics
experts. Instead, empirical values have been established for the amount of daily fish feed per area of
hydroponic grow bed. This allows for the calculation of the number of fish the system can grow and
consequently the volume of water needed to stock the fish. Overfeeding fish will result in uneaten food
(will compromise water quality), lower feed efficiency, reduced health of fish and increased costs (Riche
& Garling, 2003).
3.3 Plant Crops
3.3.1 Nutritional Requirements
All plants may have different nutritional requirements; for instance leafy green vegetable require more
nitrates than fruiting plants. However all plants in aquaponic systems need 16 essential nutrients for
maximum growth. These come in the form of macronutrients, which in addition to carbon, hydrogen,
and oxygen, which are supplied by water, carbon dioxide, and atmospheric air, include nitrogen (N),
potassium (K), calcium (Ca), magnesium (Mg), phosphorous (P), and sulphur (S). There are seven
micronutrients necessary as well and they are chlorine (Cl), iron (Fe), magnesium (Mn), boron (B), zinc
(Zn), copper (Cu), and molybdenum (Mo). These nutrients have to be balanced, as an excess of one
may interfere with the uptake of another, as is the case when potassium affects the bioavailability of
magnesium or calcium. Iron concentrations in aquaponic wastewater are insufficient for plant growth
and therefore iron has to be supplemented to a concentration of 2 mg/L. (Rakocy, Masser, & Losordo,
2006).

3.3.2 Crop Selection
Many types of plants can grow successfully in aquaponic systems. The Crop Diversification Center in
Brooks, Alberta has reported growing over 60 different food crops in their aquaponics trials (Nelson,
2008). Originally it was thought that only leafy green vegetable and herb crops could be grown, but it
has since been proven that a wide variety of fruiting crops, beans, and flowers can be grown effectively.
Although many crops can be grown in an aquaponic system, some are more suitable than others. When
choosing a crop to cultivate, the grower’s objective should be taken into account first and foremost. If
the objective of the venture is to turn a profit, as it is with commercial scale systems, then crops that
have a high market value and short harvesting time will be more appropriate. These include herbs such
as basil, chives, cilantro, and parsley whose harvest times are between 25 and 40 days (Rakocy, Masser,
& Losordo, 2006). Lettuce is the most grown crop in aquaponics due to both its short harvesting time
(3-4 weeks) and high demand in western diets; because a large portion of its final mass is harvestable
and edible, it is a very lucrative crop. Another reason these crops do well is because the lack of a
fruiting stage keeps nutrient requirements consistent, resulting in a more reliable harvest. Other leafy
green vegetable of this nature are Swiss chard, Pak Choi, Chinese cabbage, collard and watercress,
which in addition to the aforementioned advantages, also experience less pest problems than fruiting
plants (Rakocy J. E., 1988-89).
Figure 11: Vibrantly coloured leafy vegetables and extensive root systems in aquaponic systems (Somma, 2008) and (Wilson, 2010)
While fruiting crops of all kinds are successfully grown in aquaponic systems, they are mostly cultivated
by hobbyists growing for consumption or by researchers. Because these plants have longer harvesting
times, they are better suited to growth in areas that have a longer growing season such as the tropics
where growing can be carried out all year long. Melons, tomatoes, okra, peppers and corn are all
popular fruiting crops crown in aquaponic systems (Nelson, 2008)
3.4 Bacteria
Autotrophic bacteria that convert fish waste into nutrients for plant uptake are crucial and without
them, an aquaponic system will not function. Appropriate environmental conditions must be
maintained to ensure the abundant growth of microbial populations in the biofilter. Nitrifying bacteria
growing on the large surface of the biofilter media and in association with the plant roots will perform
all of the necessary nutrient conversions for the feeding of plants and for the filtration of fish tank
effluent. The grow bed media in media-filled aquaponic systems functions as a fluidized bed bioreactor -
it removes dissolved solids and houses nitrifying bacteria involved in the conversion of nutrients (Diver,
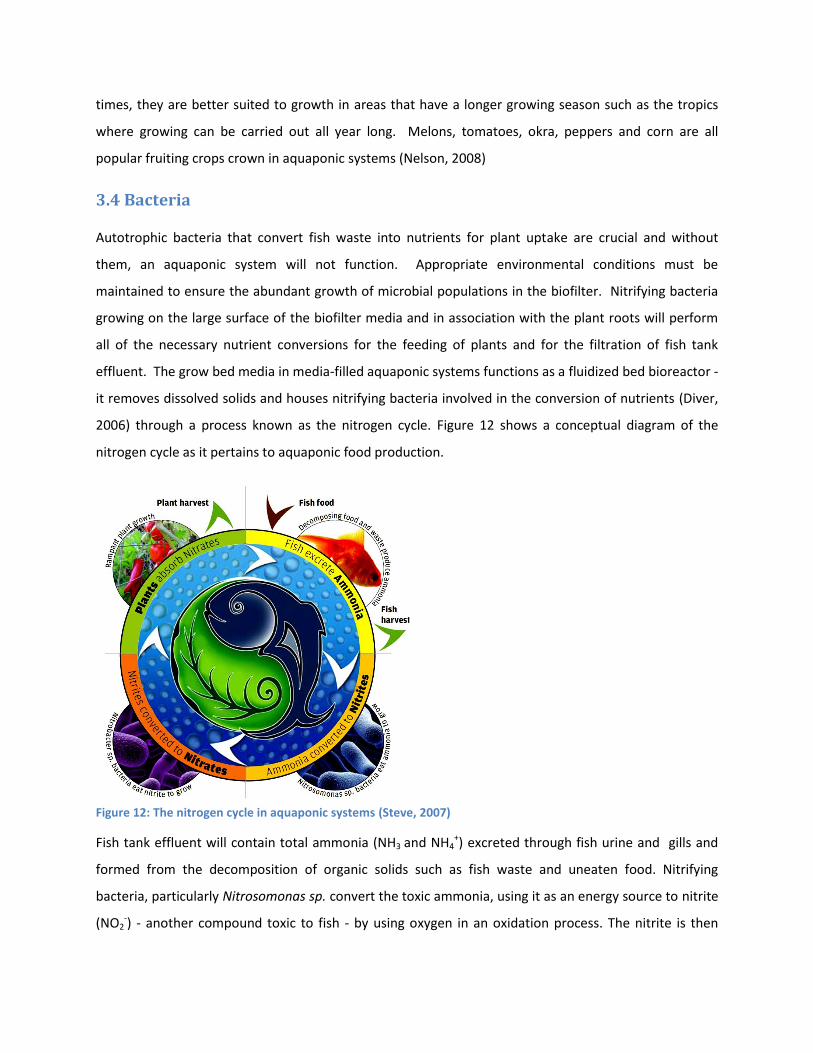
2006) through a process known as the nitrogen cycle. Figure 12 shows a conceptual diagram of the
nitrogen cycle as it pertains to aquaponic food production.
Figure 12: The nitrogen cycle in aquaponic systems (Steve, 2007)
Fish tank effluent will contain total ammonia (NH3 and NH4+) excreted through fish urine and gills and
formed from the decomposition of organic solids such as fish waste and uneaten food. Nitrifying
bacteria, particularly Nitrosomonas sp. convert the toxic ammonia, using it as an energy source to nitrite
(NO2-) - another compound toxic to fish - by using oxygen in an oxidation process. The nitrite is then
quickly oxidized by another type of nitrifying bacteria, namely Nitrobacter sp. to form nitrate (NO3-), the
preferred form of nitrogen for plant uptake (Losordo, Masser, & Rakocy, 1998).
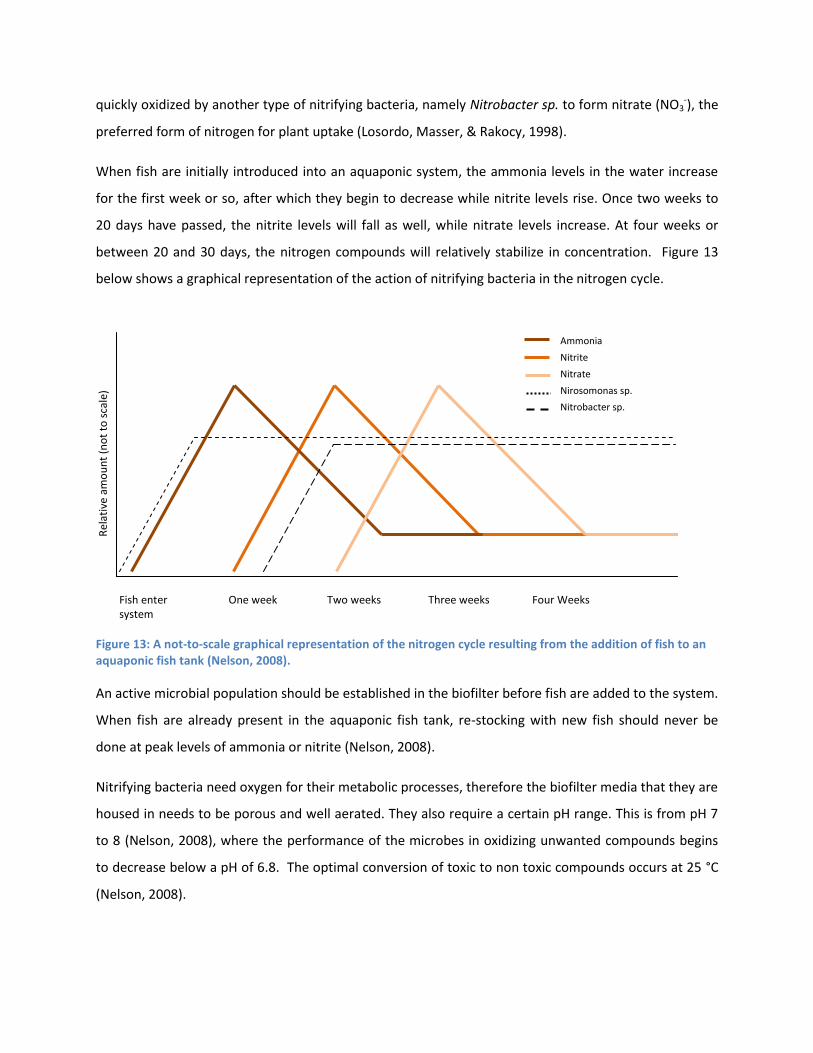
When fish are initially introduced into an aquaponic system, the ammonia levels in the water increase
for the first week or so, after which they begin to decrease while nitrite levels rise. Once two weeks to
20 days have passed, the nitrite levels will fall as well, while nitrate levels increase. At four weeks or
between 20 and 30 days, the nitrogen compounds will relatively stabilize in concentration. Figure 13
below shows a graphical representation of the action of nitrifying bacteria in the nitrogen cycle.
Figure 13: A not-to-scale graphical representation of the nitrogen cycle resulting from the addition of fish to an aquaponic fish tank (Nelson, 2008).
An active microbial population should be established in the biofilter before fish are added to the system.
When fish are already present in the aquaponic fish tank, re-stocking with new fish should never be
done at peak levels of ammonia or nitrite (Nelson, 2008).
Nitrifying bacteria need oxygen for their metabolic processes, therefore the biofilter media that they are
housed in needs to be porous and well aerated. They also require a certain pH range. This is from pH 7
to 8 (Nelson, 2008), where the performance of the microbes in oxidizing unwanted compounds begins
to decrease below a pH of 6.8. The optimal conversion of toxic to non toxic compounds occurs at 25 °C
(Nelson, 2008).
Rel
ativ
e am
ou
nt
(no
t to
sca
le)
Fish enter One week Two weeks Three weeks Four Weeks system
Ammonia
Nitrite
Nitrate Nirosomonas sp.
Nitrobacter sp.

The microbial populations found in aquaponic systems are virtually never pathogenic. The pathogens
that are carried by warm-blooded animals and which have recently created numerous upsets in the food
industry due to contamination in food processing and packaging plants are not present in fish or fish
waste (Nelson, 2008). “From the perspective of food safety in aquaponic systems, there seems to be
much less likelihood of contamination of vegetable and other aquaponic crops, and fish, with
pathogenic bacteria of domestic animal origin, and with microscopic parasites such as Cyclospora sp. of
human origin, and Cryptosporidium sp. of domestic animal origin, in aquaponic systems, especially in
indoor systems, compared with the potential of such contamination in the traditional field methods of
growing such crops.” (Chalmers, 2004)
4. The Design
The design process varies greatly from and is highly dependent on the nature of the project and how it
came about, the person or people who encounter the need to design something and the situation they
find themselves in. Despite this varying nature, a framework for the design process can be put forth
that encompasses some key elements commonly encountered.
Problem Identification:
On a global scale, the problem that this project addresses is food security, as stated previously. On a
much smaller scale, the problem that was being addressed by the project was the inefficiency and
unscientific approach that was encountered while being exposed to aquaponics in Barbados.
Analysis and Research:
Upon returning from Barbados, the aquaponics systems that were now somewhat familiar, were
analysed with renewed scrutiny. It was evident that the system could be improved and there were
suspicions towards what might achieve this improvement. Some research, both formal and informal
had already been conducted, but to accomplish the objective of optimizing the system, a significantly
more detailed literature review was conducted. Parameters such as the feeding rate ratio, fish stocking
densities, system aeration, and the sizing of the system along with the harvesting of fish and vegetables
were explored, and several experts were consulted, including Dr. James Rakocy, who is considered the
world’s foremost expert in the optimization of food production from aquaponic systems and who
teaches at the University of the Virgin Islands, as well as several professors in the McGill University Plant
Science Department.

Specification:
Satisfied that sufficient research was done, key parameters, such as the ones discussed previously, were
identified within the scope of the projected design. Decisions were made in regards to the qualitative
and quantitative nature of these parameters, which will be discussed in subsequent sections.
Presentation:
The present report is the fruit of months of labour, whereby all the ideas, decision, and work are being
manifested in a final design.
4.1 System Stocking Density
4.1.1 Growing Area
The growing area is the starting point for a system design because other parameters are based on the
area over which plants can be grown. A growing area of 6 m2 was chosen for the design arbitrarily, with
dimensions of 2 m in width by 3 m in length. It was chosen because it was thought to be an
appropriately sized area for families to maintain in a backyard.
4.1.2 Basil, Okra and Coconut Husk
Basil and okra were chosen as the crops in the systems design. They were chosen arbitrarily simply
because it was known that they were appropriate for tropical climates and there was a large amount of
available literature from previous aquaponics and hydroponics studies. Coconut husk was chosen due
to its availability and previous use in the systems in Barbados.
4.1.2.1 Okra
Okra is an annual tropical vegetable which is cultivated in the Southern United States, the Caribbean and
Africa. The fruits (picture in Figure 14 below) are harvested when immature and eaten as a vegetable.
The plant does not grow in cool areas or high altitudes, but it is extremely heat and drought resistant
and is therefore grown in many countries with difficult growing conditions (Sionit, 1981). Okra plants
can grown to be over 4 feet tall or can be topped and grown shorter and wider. The plant can survive
between temperatures of 200 – 30 °C and pH levels of between 6.5 and 7.5. Palatability of the fruit
decreases if the plant is left to grow to maturity, which takes about 90 days (Gardening: About.com,
2010).

Figure 14: Harvested okra pods (Pesto: Salt and Pepper Blog)
4.1.2.2 Basil
Basil is one of the most popular herbs in the spice cabinets of North and South America as well as the
Caribbean. It is sold fresh-cut (Figure 15) and dried in both supermarkets and farmers’ markets. Over 40
different cultivars are known, but the most commercial cultivar belongs to the species O. basilicum. Basil
is not just used for culinary needs; it can also be used as an ornamental herb, and the extracts are used
in traditional medicines and essential oils. The range of average temperatures that basil can survive in is
between 20 – 24 °C and the preferred pH range is 5.5 to 7.0 (Gardening: About.com, 2010).
Figure 15: Freshly-cut basil leaves (Okra Varieties: Diet, Desert and Dogs Blog)
4.1.2.3 Coconut Husk
This system is one that is media based, as opposed to a raft or NFT system, which use nothing to support
the root structure of the plants. The grow media can be thought of as a direct structural replacement
for soil.

The system design uses coconut husk as media. The choice of coconut husk is somewhat unorthodox as
most media systems utilize sand, gravel, perlite, or expanded clay pebbles. Coconut husk is used
because it is a readily available and cheap material that can be found all over the Caribbean. It also is
easier to manipulate as it is much lighter than its alternatives.
Figure 16: Coconut husk fibres (Block, 2009) Figure 17: Coconut husk chips (Loren, 2010)
In reality, because the coconut husk is organic in origin, as it degrades it will contribute nutritionally to
the system. This allows for abundant microbial communities to exist in the grown bed, which is also
acting as a biofilter. Husk comes in the form of chipped pieces, which vary in size, and fibrous stands.
The variation of the media sizes and forms, along with its gradual degradation, results in a variation of
the material’s porosity. Water moves through the media quite easily, however as the material
degrades, some anaerobic zones may form. Aerating the grow bed helps with this aspect, however,
because the solid waste from the fish tank is transferred to the media, as it and the husk degrade, the
system will gradually clog and the media will need to be replaced every few years.
4.1.3 Component Ratios
The feed conversion ratio, feed rate ratio, and critical standing crop are co-dependent parameters,
meaning that they are linked, and altering one, will necessitate changes in the other two. This design
uses values for these parameters based on research done by Dr. James Rakocy at the University of the
Virgin Islands and which are widely used around the world in aquaponic systems. A feeding rate ratio of
25 g/m2 per day, a conversion ratio (FCR) of 1.7, and a critical standing crop of 60 kg/m3 are used.
4.1.4 Feed Rate Ratio and Annual Fish Feed Mass.
A feed rate ratio of 25 g/m2 grow bed area per day is used. The UVI system uses the analogous ratio of
100 g/m2 per day for a floating raft system, which has four times the amount of water. Using this feed
rate ratio, we are able to calculate the annual amount of fish feed used in the system:
𝐴𝑛𝑛𝑢𝑎𝑙 𝐹𝑒𝑒𝑑 𝑊𝑒𝑖𝑔𝑡 = 25 𝑔
𝑚2 ∗ 𝑑∗
365 𝑑
𝑦𝑟∗
6 𝑚2
𝑔𝑟𝑜𝑤𝑏𝑒𝑑∗
1 𝑘𝑔
1000 𝑔 = 54.75 𝑘𝑔/𝑦𝑒𝑎𝑟
4.1.5 Feed Conversion Ratio
A feed conversion ratio (FCR) of 1.7 is used, meaning that for every kilogram of fish biomass growth
desired, 1.7 kg of feed is needed. A FCR of 1.7 corresponds to a feeding rate efficiency of 0.59 (1.7-1),
meaning that for every kg of fish feed used, 0.59 kg of fish biomass is produced.
4.1.6 Fish Biomass Production
Using the feeding rate efficiency and the amount of fish feed used in the system, the system’s net
biomass production is calculated as follows:
𝐴𝑛𝑛𝑢𝑎𝑙 𝐵𝑖𝑜𝑚𝑎𝑠𝑠 𝑃𝑟𝑜𝑑𝑢𝑐𝑡𝑖𝑜𝑛 = 54.75 𝑘𝑔 𝑓𝑖𝑠 𝑓𝑒𝑒𝑑
𝑦𝑟∗
0.59 𝑘𝑔 𝑏𝑖𝑜𝑚𝑎𝑠𝑠
𝑘𝑔 𝑓𝑖𝑠 𝑓𝑒𝑒𝑑= 32.3 𝑘𝑔 𝑏𝑖𝑜𝑚𝑎𝑠𝑠
Finally, to arrive at the number of fish the system will be able to produce in a year, we use the net
biomass gain each fish will experience. Fingerlings will enter the system at 20 g and will be harvested at
a market weight of 450 g, meaning there is a net weight gain of 0.430 kg/fish.
𝑁𝑢𝑚𝑏𝑒𝑟 𝑜𝑓 𝐹𝑖𝑠 𝑝𝑒𝑟 𝑦𝑒𝑎𝑟 =32.3 𝑘𝑔 𝑜𝑓 𝑏𝑖𝑜𝑚𝑎𝑠𝑠
0.430 𝑘𝑔 𝑏𝑖𝑜𝑚𝑎𝑠𝑠/𝑓𝑖𝑠= 75.1 = 76 𝑓𝑖𝑠
4.1.7 Fish Stocking and Harvest
Stocking density in a fish tank is measured in units of fish biomass per volume of water; kilograms per
meter cubed in our case. The stocking density is an important aspect for fish growth for several reasons.
Water quality decreases proportionally when stocking densities are increased, in part due to a higher
production of waste, increasing the levels of potentially toxic substances, such as ammonia and nitrite.
Another reason fish health is compromised when stocking densities are increased is because higher
stocking densities result in more consumption of oxygen and a lack of oxygen will result in stunted
growth and reduced fish health. Understocking the system however will result in a lower feed
conversion ratio and reduce the efficiency of the system.
4.1.7.1 Critical Standing Crop
The critical standing crop is the maximum biomass of fish a system can support without restricting fish
growth. Operating a system near its critical standing crop uses space efficiently, maximizes production

and reduces variation in the daily feed input to the system, which is an important factor in sizing the
growing area (Rakocy, Masser, & Losordo, 2006).
A critical standing crop of 60 kg/m3 is used in this design. This is a generally accepted value among
aquaponic systems and, as previously discussed, correlates to the desired feed rate ratio and feed
conversion ratio.
4.1.7.2 Fish Harvesting -Multiple Rearing Tanks
To keep the stocking density in our system near the critical standing crop, a multiple rearing tank
method will be employed. Under this system, several ages of fish will be raised simultaneously. The
design will have four different cohorts of fish. As previously mentioned, the fish fingerlings will enter
the system at 20 g and will be harvested at 450 g. This growth takes approximately 170 days, meaning
that fish will be raised in each cohort 42 days, or six weeks, apart (170/4 = 42.5 days). Every six weeks,
the largest cohort will be harvested, and the smallest cohort will be restocked. The number of fish in
each cohort is found in the following way:
𝑁𝑢𝑚𝑏𝑒𝑟 𝑜𝑓 𝑓𝑖𝑠 𝑝𝑒𝑟 𝑎𝑟𝑣𝑒𝑠𝑡 = 76 𝑓𝑖𝑠
𝑦𝑒𝑎𝑟∗
6 𝑤𝑒𝑒𝑘𝑠
𝑎𝑟𝑣𝑒𝑠𝑡∗
1 𝑦𝑒𝑎𝑟
52 𝑤𝑒𝑒𝑘𝑠= 8.77 = 9 𝑓𝑖𝑠/𝑎𝑟𝑣𝑒𝑠𝑡
The volumes of water needed for the desired stocking density were calculated at the end of the 42 day
period, when each cohort is at its heaviest. Table 4 summarizes this information.
Table 4: Mass of fish in each cohort at the end of each six week period and volume of water required per cohort at maximum stocking density
Cohort Final mass/fish (kg) Total mass (kg) Stocking Density (kg/L) Volume of Water (L)
1 0.07 0.63 0.06 10.5
2 0.170 1.53 0.06 25.5
3 0.300 2.70 0.06 45.0
4 0.450 4.05 0.06 67.5
Total Volume of Tank 148.5
However, in the beginning of the rearing period the stocking density is quite a bit less, as Table 5
demonstrates.

Table 5: Stocking densities of each cohort at the beginning of each six week cycle
Initial Weight/Fish (g) Net Weight (kg) Cohort Water Volume (L) Density (kg/L)
Cohort 1 20 0.18 10.5 0.017143
Cohort 2 70 0.63 25.5 0.024706
Cohort 3 170 1.53 45 0.034
Cohort 4 300 2.7 67.5 0.04
Total
5.04 148.5 0.033939
4.1.8 Plant Stocking and Harvest
Higher plant densities often mean that the yield per plant will be lower while producing a higher yield
per area. Plant densities used for okra and basil have large variation. Based on experience, a density of
12 plants/m2 will be used for both basil and okra. This is believed to be on the lower end of acceptable
ranges for basil and on the higher end for okra. The 6 m2 growing area will be split evenly between the
two plant species with 3 m2 being used to grow 36 okra plants and the other 3 m2 growing 36 basil
plants. Based on previous hydroponic and aquaponic studies, it is assumed basil can be harvested 12
times a year and okra 3 times a year.
Nutrient requirements will be more consistent in the grow bed if staggered harvesting techniques are
used, with groups of plants being simultaneously cultivated at different periods in their life cycle. The
following calculations are used to determine harvesting schedules:
𝐵𝑎𝑠𝑖𝑙 𝐻𝑎𝑟𝑣𝑒𝑠𝑡 = 36 𝑝𝑙𝑎𝑛𝑡𝑠 ∗ 12 𝑎𝑟𝑣𝑒𝑠𝑡𝑠
𝑦𝑒𝑎𝑟∗
𝑦𝑒𝑎𝑟
52 𝑤𝑒𝑒𝑘𝑠 = 8.3 = 9 𝑝𝑙𝑎𝑛𝑡𝑠/𝑤𝑒𝑒𝑘
𝑂𝑘𝑟𝑎 𝐻𝑎𝑟𝑣𝑒𝑠𝑡 = 36 𝑝𝑙𝑎𝑛𝑡𝑠 ∗ 4 𝑎𝑟𝑣𝑒𝑠𝑡𝑠
𝑦𝑒𝑎𝑟∗
𝑦𝑒𝑎𝑟
52 𝑤𝑒𝑒𝑘𝑠 = 2.8 = 3 𝑝𝑙𝑎𝑛𝑡𝑠/𝑤𝑒𝑒𝑘

The configuration of plants in the grow bed could take several forms. The easiest is a simple 12 x 6
configuration, with each plant being separated by 0.23 m on the long axis and 0.29 m on the short axis.
The following diagram provides a schematic of the grow bed. The harvesting schedule is represented by
boxes around the plants, okra plants in groups of three and basil plants in groups of nine.
Figure 18: Crop planting distribution and harvest schedule
4.2 Water Flow Rate
The rate of water turnover should be designed to ensure good water quality. Water should be passed
through the hydroponic grow media enough times per day to be adequately filtered and therefore to
ensure appropriate removal of waste compounds that are toxic to fish. Excessively high flow rates,
however will reduce to too great of an extent the amount of time toxic wastes in fish tank effluent
spend in contact with microbes in the biofilter. This will cause some of these compounds to be flushed
back into the fish tank before they are converted to safer forms or assimilated by the hydroponic plants.
In a backyard-sized media-filled aquaponic system, the water flow rate (Qw) should be such that a
volume of water equal to the fish tank volume goes through the biofilter twice in an hour.
In this design, the volume of water in the fish tank is 150 L. This would therefore correspond to a 300
L/hr or 0.30 m3/hr flow rate.
Thus, 𝑸𝒘 = 𝟎.𝟑𝟎 𝒎𝟑 𝒉𝒓
Increasing water flow rates tends to increase the removal of BOD5, TSS, NH3-N and NO2
- - N, while
decreasing flow rate increases the removal of PTOT, NO3- - N (Endut, Jusoh, Ali, Wan-Nik, & Hassan, 2009).
Water flow rates may need to be adjusted if water quality tests show that greater removal of any
nutrients is required to meet water quality requirements for the tilapia. There may always be a
compromise between fish tank water quality and optimal nutrient delivery to the plant crops.
4.2.1 Hydraulic Loading Rate
The hydraulic loading rate (HLR) of the fish tank effluent onto the surface of the grow media will
determine the rate at which fish wastewater enters the coconut husk grow medium. Although hydraulic
loading rates have shown to have no significant effect on fish production performance, the specific
growth rates of fish or the efficiency with which fish utilize food for biomass growth (feed conversion
ratio), research experiments in Malaysia have concluded that plant growth is significantly affected by
the rate at which water is supplied to the surface of the grow bed in recirculating aquaponic systems
(Endut, Jusoh, Ali, Wan-Nik, & Hassan, 2010). Since the largest proportion of the capital a backyard
aquaponic grower can earn comes in the form of plant outputs, designing for plant growth is
recommended and this includes having an appropriate HLR.
Overly high hydraulic loading rates decrease the contact time between microbes in the grow bed and
the nutrients they are supposed to convert. Therefore plant growth decreases significantly with very
high HLR. The hydraulic loading rate at which optimal plant growth occurred was 1.28 m/day. At this
HLR, the highest fish production and highest overall percentage of nutrient removal was observed as
well (Endut, Jusoh, Ali, Wan-Nik, & Hassan, 2010).
Hydraulic loading rate of a system is calculated by dividing the flow rate of water, Qw through the system
by the surface area of the grow bed, Agrow bed. In this design, the flow rate of water is 0.3 m3/hr and the
grow bed surface area is 6 m2.
𝑯𝑳𝑹 = 𝑸𝒘
𝑨𝒈𝒓𝒐𝒘 𝒃𝒆𝒅=
𝟎.𝟑 𝒎𝟑 𝒉𝒓
𝟔𝒎𝟐∗ 𝟐𝟒 𝒉𝒓
𝒅𝒂𝒚= 𝟏.𝟐 𝒎 𝒅𝒂𝒚
This gives a HLR very close to the ideal for recirculating aquaponic systems.

4.2.2 Hydraulic Retention Time
The amount of time that the fish tank effluent water spends in the grow bed medium defines the
amount of time compounds in that water have to be converted and removed from solution by the
hydroponic biofilter. Very high hydraulic retention times (HRTs) would reduce the rate at which water
and therefore air gets pushed through the pore space in the grow media. This could result in the
formation of anaerobic zones where denitrification would occur, converting valuable plant nutrients in
the form of NO3- into atmospheric nitrogen (Endut, Jusoh, Ali, Wan-Nik, & Hassan, 2010). Very low
hydraulic retention times would reduce removal efficiency by reducing filtration time.
In an earlier experiment by Endut et al., it was concluded that the removal of nutrients occurred most
efficiently when the water flow rate was 1.6 L/min, which for their system corresponded to a HRT of
0.575 hr or 34.5 minutes per grow bed (Endut, Jusoh, Ali, Wan-Nik, & Hassan, 2009).
Hydraulic retention can be calculated by dividing the product of the surface area of the grow bed (As),
the depth of water in the grow bed (hw) and the porosity of the grow bed media (ϕ) by the water flow
rate.
In this design, the grow bed surface area is 6 m2, the depth of water is 5 cm (just below the plant root
zone), the average porosity of coconut husk chips is 0.47 (Colombo Quality Coir Products, 2010), and the
water flow rate is 0.300 m3/hr.
Thus;
𝑯𝑹𝑻 = 𝑨𝒔 ∗ 𝒉𝒘 ∗ 𝝓
𝑸𝒘=
𝟔𝒎𝟐 ∗ 𝟎.𝟎𝟓𝒎𝟐 ∗ 𝟎.𝟒𝟕
𝟎.𝟑𝟎 𝒎𝟑 𝒉𝒓 ∗ 𝟔𝟎 𝒎𝒊𝒏
𝟏 𝒉𝒓= 𝟐𝟖.𝟐 𝒎𝒊𝒏
The fish effluent water will remain in the coconut husk for just under half an hour. This is a suitable HRT
for the conversion of fish waste compounds.
4.3 System Components
4.3.1 System Configuration
The individual components of the aquaponic system will be connected and oriented with respect to
each other in such a way as to ensure the desired water and air flow rates and optimize efficiency within
limits reasonable and practical for a backyard installation.
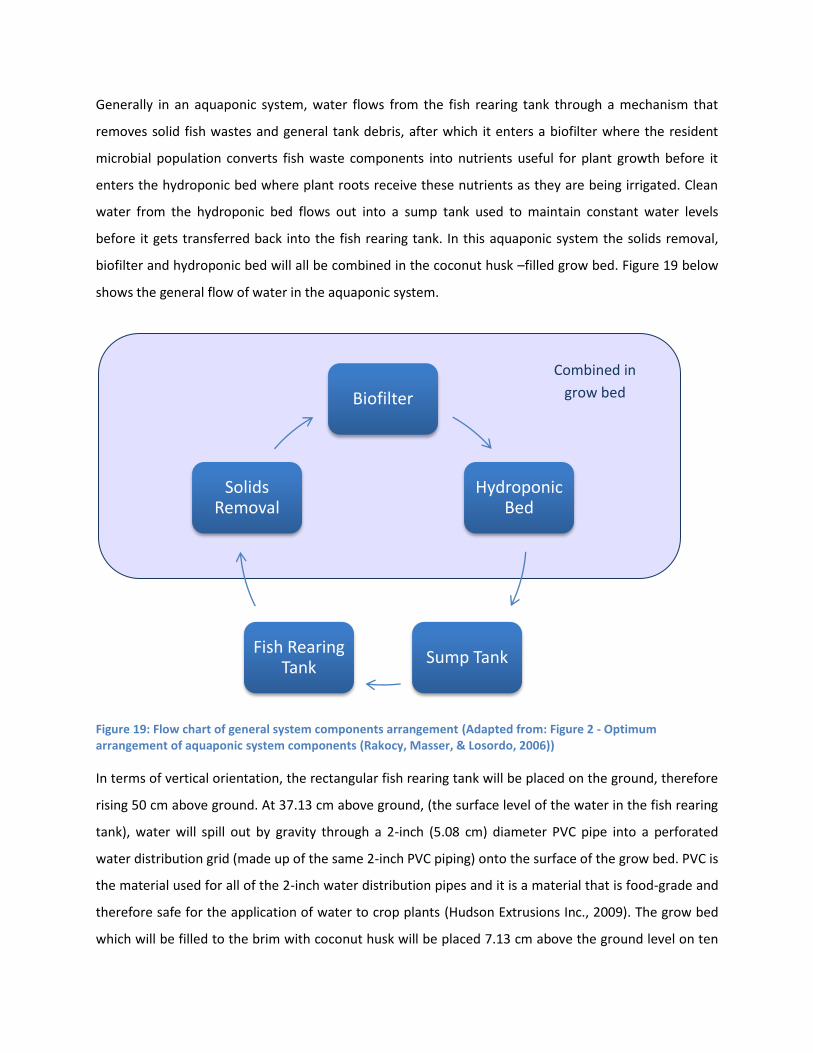
Generally in an aquaponic system, water flows from the fish rearing tank through a mechanism that
removes solid fish wastes and general tank debris, after which it enters a biofilter where the resident
microbial population converts fish waste components into nutrients useful for plant growth before it
enters the hydroponic bed where plant roots receive these nutrients as they are being irrigated. Clean
water from the hydroponic bed flows out into a sump tank used to maintain constant water levels
before it gets transferred back into the fish rearing tank. In this aquaponic system the solids removal,
biofilter and hydroponic bed will all be combined in the coconut husk –filled grow bed. Figure 19 below
shows the general flow of water in the aquaponic system.
Figure 19: Flow chart of general system components arrangement (Adapted from: Figure 2 - Optimum arrangement of aquaponic system components (Rakocy, Masser, & Losordo, 2006))
In terms of vertical orientation, the rectangular fish rearing tank will be placed on the ground, therefore
rising 50 cm above ground. At 37.13 cm above ground, (the surface level of the water in the fish rearing
tank), water will spill out by gravity through a 2-inch (5.08 cm) diameter PVC pipe into a perforated
water distribution grid (made up of the same 2-inch PVC piping) onto the surface of the grow bed. PVC is
the material used for all of the 2-inch water distribution pipes and it is a material that is food-grade and
therefore safe for the application of water to crop plants (Hudson Extrusions Inc., 2009). The grow bed
which will be filled to the brim with coconut husk will be placed 7.13 cm above the ground level on ten
Biofilter
Hydroponic Bed
Sump TankFish Rearing
Tank
Solids Removal
Combined in
grow bed

cinder blocks (the grow bed itself being 30 cm deep) so that its top lines up with the bottom of the
water pipe system.
As water fills the grow bed, it will reach a certain height (5 cm from the bottom of the grow bed), where
it will spill out through a short piece of 2-inch PVC pipe and pour into the sump tank. The 112 cm long,
50 cm in diameter sump tank will be inserted into a hole dug into the ground so that its top edge will
vertically be in line with the bottom of the pipe ejecting water from the grow bed. Water height in the
sump tank will on average be 107 cm – the same height off the ground level as the bottom of the grow
bed (~7 cm).
Water from the sump tank will be pumped by an airlift pump from the bottom of the sump to the top of
the fish rearing tank (a total height of 149.87 m). In the system, only water from the sump tank to the
fish rearing tank is pumped, the rest of the water transfers are driven by gravity. See Figure 20 below for
a side view of the system configuration in terms of the components discussed above. Fish rearing tank
screens and the air distribution network are omitted for clarity.
Figure 20: Aquaponic system side view (grow bed, fish rearing tank, sump tank and water distribution pipes) with heights in centimetres.
Horizontally, the main system components are oriented to save space, with the fish rearing tank and
sump tank along the shorter side of the rectangular grow bed. See Figure 21 for the bird’s eye view of
the assembled main system components. Figure 22 shows an isometric view of all of the system
components in place. Water distribution lines are drawn in purple.
Ground level
7. 13
cm
12. 13
cm
50
37. 13
cm
99.87 Grow bed
Fish rearing tank
Sump tank
Water pipes

Figure 21: Aquaponic system top view (grow bed, fish rearing tank, sump tank and water distribution pipes)
Figure 22: Aquaponic system isometric view (all components)
Grow bed
Fish rearing tank
Sump tank
Water pipes

0.015 0.015
0.07
1.00
0.455 0.303 0.172
0.40
0.01
0.01
4.3.2 Fish Tank
The final fish tank design (Figure 23) incorporates a modified multiple rearing tank theme. This was
necessary to enable the fish biomass to remain near the critical standing crop.
Figure 23: 3D Isometric view of fish tank design
A single rectangular tank with dimensions of 1 m in length, 0.4 m in width, and 0.5 m in height (Figures
24 and 26) is separated in to four rearing areas, each holding a separate fish cohort.
Figure 24: Top view of fish rearing tank with dimensions and cohort spacing with dimensions in meters

0.0508
0.01
These areas are analogous to the separate tanks in the multiple rearing tank approach discussed earlier.
Each area is separated by a screen that fits between two slots placed on the tank walls. Every six
weeks, when the largest cohort is harvested, the screen is lifted and the smaller cohort is moved along
to the next largest compartment. The smallest compartment is then restocked with tilapia fingerlings.
This system reduces the stress on both fish and grower as fish do not have to be physically moved from
one tank to another. The screens (Figure 25) allow for water to pass between compartments so that
the outflow, which leaves the tank in the largest compartment, is of homogeneous quality.
Figure 25: Cohort-separating screens with dimensions in meters
The side view (Figure 26) shows an outlet at a height of about 37 cm from the bottom of tank, where a
distribution pipe will carry the water to the growing area. With a water height of 37 cm, a width of 40
cm, and the known water volume necessary to give a final stocking density of 60 kg/m3 in each cohort,
the compartment length and position of the screens was calculated.
Figure 26: Side view of fish tank with dimensions in meters
0.45
0.01
0.015
0.3713 0.45
0.50
0.3713 0.45

The fish tank is made from polyethylene materials. This provides good structural support to hold the
large volume of water that the system requires to house the fish. Polyethylene is also chemically inert
which means over time, its chemicals will not be transferred to the system water and because the
mould is made from one piece, there will be no loss of water due to leakage. Ideally, a tank with a
conical bottom would have been chosen for efficient collection of solid waste, however the cost of
custom shaped tanks such as this are too high. Scavenger fish can alternately be placed in
compartments to remove the solid waste that accumulates there.
4.3.3 Grow Bed
Figure 27: 3D isometric view of grow bed
The grow bed is made from the same polyethylene materials as the fish tank for the same reasons as the
fish tank. As previously discussed, it has a growing area of 6 m3 and dimensions of 2 m in width, 3 m in
length, and 0.3 m in height (Fig. 28 and 29). It also has an outlet hole 5 cm from the bottom where a
water distribution pipe will attach and allow water to flow by gravity to the sump tank. The 30 cm depth
will allow for sufficient and healthy root growth for most plants.
Figure 28: Top view of grow bed with Figure 29: Side view of grow bed with dimensions in meters dimensions in meters (not to scale)
2.0
2.0
2.0
2.0
0.30

4.3.4 Sump Tank
The sump tank has a diameter of 0.50 m and a height of 1.12 m (Figures 30 and 31). The purpose of the
sump tank is to regulate any fluctuations in the system’s water volume. The idea is to have these
fluctuations occur in the sump tank and not the fish tank. It is the only place in the system where water
is pumped from one spot to another. The pipe that is placed in it must be mostly submerged which
necessitates having a deep tank in relation to the distance that water must be lifted, as opposed to
having a tank with a larger diameter. The sump tank is also a good place to adjust he pH of the system
by adding an acid or base.
Figure 30: 3D view of sump tank Figure 31: Sump tank with dimensions in meters
4.3.5 Aeration System
An aeration system will be put in place in order to maintain adequate oxygen levels throughout the
system. The water tests performed on the backyard aquaponic system in Barbados showed consistently
low dissolved oxygen levels - far below acceptable concentrations for the health of the fish, plants and
bacteria. The gradual compaction of grow bed media (and its decomposition if the media is organic in
nature) in media-filled aquaponic systems combined with its constant submergence in water creates
anaerobic zones in the grow bed which interfere with the aerobic activities of the nitrifying bacteria and
potentially causes the destruction of plant roots.
In the systems of the BVVA, there was no aeration other than what was obtained by water spilling from
one component of the system into another due to a height difference. In those systems, the only fluid
1.12
1.12

movement was that of water being pumped from the fish tank onto the hydroponic grow bed by a water
pump and falling back into the fish tank by gravity.
4.3.5.1 Air Pump
In this design, an air pump will be used instead of a water pump. The air pump will use much less
energy than the water pump previously used (Nelson, 2008)– about ¼ of the energy in this design, in
comparison to the system in Barbados. Aeration will be provided for the fish tank water, the water
being applied to the grow bed and for the grow bed medium itself. The compressed air coming out of
the air pump will be distributed to supply air to the following components by about 50 ft of rubber
silicone tubing and the flow to the individual components will be controlled by air valves:
1) Airlift
2) Air diffusers in the fish tank
3) Air distribution grid in the grow bed
4.3.5.2 Airlift
The primary purpose of the air blower will be to drive the air lift pumping system that will circulate
water through the system. Secondary purposes will be to aerate water in the fish tank and supply air to
the grow bed media.
Air lift pumps are innovative and easily designed. They are a low cost alternative to a water pump and
they manage to lift water and aerate it at the same time (Nelson, 2008). Airlift pumps are known well
among aquaculturists. The basic principle of an airlift is the injection of air into the bottom of a
submerged water pipe, from where the air bubbles will rise to the top, lifting with them the water in the
submerged pipe. The increased oxygen level of the water in the pipe makes it less dense than the water
in the surrounding tank. Thus this aerated water will rise by buoyancy, creating a net upwards
displacement of water (Wurts, McNeill, & Overhults, 1994). This lifting of water by compressed air is
very low in energy requirements. The only energy needed is for acceleration and to overcome friction
(Nelson, 2008). The diagram in Figure 32 illustrates the simple premise of the system.

Figure 32: Conceptual diagram of an air lift pump (dela-Cruz, 1982)
Air lift pumps work very well when the height that the water has to be lifted is small in comparison to
the height of submergence (h1/hm << hs/hm). The airlift pump is located in the sump tank and the height
differences between the three components; the sump tank, fish tank, and grow bed, were in part
designed to minimize the height necessary to pump water from the sump tank to the fish tank. To
maintain the efficiency of the airlift, the water pipe should not exceed 3 inches in diameter (Nelson,
2008). In this design, water piping is 2 inches in diameter.
The vertical arrangement of the height of water in the sump tank and the height of the lift (from the
sump tank water level to the top of the fish tank) is pictured in Figure 33. These heights can be
compared to the vertical arrangement of the rest of the system in Figure 20 under System
Configuration.
Where:
h1 = Height of the water lift
hm = Total height
hs = Height of submergence

Figure 33: Heights of submergence and lift for airlift pump calculations
The ratio of these heights, referred to as the submergence ratio is important in calculating the flow of air
required by the pump to lift water at a certain flow rate. The submergence ratio is given by:
4.3.5.2.1 Air Flow Requirement
The desired water flow rate of the system is 0.30 m3/hr as determined previously. Two methods were
used to calculate the air flow rate required to move water at 0.30 m3/hr. The first using the following
formula (La-Wniczak, Francois, Scrivener, Kastrinakis, & Nychas, 1999):
𝑄𝑎 = 𝑄𝑤 (𝜌𝑤 − 𝜌𝑤𝑎𝑠)
𝐹(𝜌𝑤𝑎𝑠 − 𝜌𝑎)+ 𝑄𝑎𝑚𝑖𝑛
Where :
𝑄𝑎 = air flow rate
𝑄𝑎𝑚𝑖𝑛 = minimum air rate to obtain water lift at chosen pipe diameter and submergence ratio (1.351
m3/hr, from Table 1 (La-Wniczak, Francois, Scrivener, Kastrinakis, & Nychas, 1999))
𝑄𝑤 = water flow rate (0.30 m3/hr)
𝜌𝑤 = density of water (1000 kg/m3)

𝜌𝑎 = density of air (1.2 kg/m3)
𝑎𝑠 = submergence ratio (0.71)
𝐹 = dimensionless coefficient assuming negligible losses (1)
Gives;
𝑄𝑎 = 0.3
m3
hr(1000
kgm3 − 1000
𝑘𝑔m3 ∗ 0.6)
1(1000𝑘𝑔m3 ∗ 0.6 − 1.2
𝑘𝑔m3)
+ 1.351 m3
hr= 1.551
m3
hr
A second method was used to find the airflow rate as well for verification purposes. This method used
an excel spreadsheet template from an airlift pump company website to input key parameters (see
Table 13 in Appendix D). This method produced a slightly higher airflow rate at 2.07 m3/hr, but the
numbers were sufficiently close.
Hi-Blow USA Inc has a line of air blowers for different uses. The blower that will be used in this system is
the Hi-Blow HP 40. Appendix D shows the performance chart for the blower. At the given water
pressure of approximately 1.5 psi (107cm water height);
P = Ls ∗ sg
2.31=
107 cm ∗ 1
2.31∗
1 in
2.54 cm∗
1 ft
12 in= 1.52 psi
the pump has a capacity of 2.9 m3/hr air. This airflow rate will sufficiently supply the airlift pump and
have enough capacity to aerate the fish tank and grow bed as well.
The pump will be positioned outside of the sump tank with one air distribution tube leaving it. The tube
will then split in to three tubes, two being of smaller diameters and feeding the fish tank and grow beds,
and a third main tube that feeds the air lift pump. The primary air distribution tube is split once more
and inserted into two symmetrical holes drilled at the same height into the sides of the sump tank water
pipe as close to the bottom as possible. The sump tank water pipe is cut at an angle (see Figure 33
above) to allow for less turbulent water flow into the pipe. Figure34 shows the configuration of the air
distribution system in green.
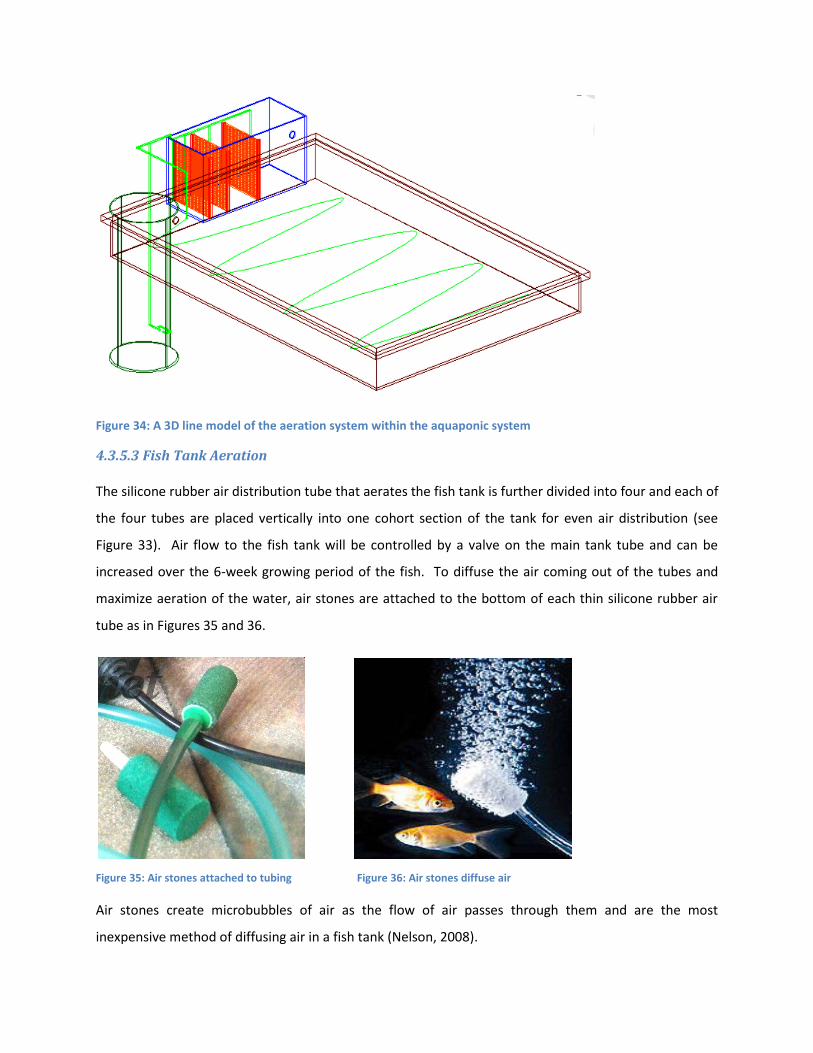
Figure 34: A 3D line model of the aeration system within the aquaponic system
4.3.5.3 Fish Tank Aeration
The silicone rubber air distribution tube that aerates the fish tank is further divided into four and each of
the four tubes are placed vertically into one cohort section of the tank for even air distribution (see
Figure 33). Air flow to the fish tank will be controlled by a valve on the main tank tube and can be
increased over the 6-week growing period of the fish. To diffuse the air coming out of the tubes and
maximize aeration of the water, air stones are attached to the bottom of each thin silicone rubber air
tube as in Figures 35 and 36.
Figure 35: Air stones attached to tubing Figure 36: Air stones diffuse air
Air stones create microbubbles of air as the flow of air passes through them and are the most
inexpensive method of diffusing air in a fish tank (Nelson, 2008).

4.3.5.4 Grow Bed Aeration
The silicone rubber air tube feeding the grow bed will be placed within the grow bed media 20 cm below
the surface of the coconut husk. The perforated tube will wind throughout the grow bed to provide
even aeration of the media and the plant roots (see Figures 37 and 38 below). Air flow to the grow bed
will be controlled by a valve and can be increased as the coconut husk compacts over time or decreased
when the compacted husk is replaced occasionally by new husk.
Figure 37: Side view of aeration system showing level of Figure 38: Top view of aeration system showing even aeration tube placement at 20 cm below grow bed surface distribution of winding perforated air tube
5. Other Considerations
5.1 Temperature Regulation
Fortunately, the climate in Barbados allows for year-round production in a backyard aquaponic food
production system. Tilapia being a tropical fish finds average temperatures in the south Caribbean quite
favourable to growth and health. Average daily temperatures for each month of the year are plotted in
Figure 40 in Appendix A. Average daily low temperatures do not usually go below 21 °C. As daytime
temperatures, particularly during the dry season can get quite high (~ 32 °C), a minimal degree of
temperature control for the water in the system will be needed.
Tilapia prefer temperatures of 25.5-26.6 °C, bacteria perform nutrient conversions best at ~ 25 °C and
aquaponic plants grow best at ~ 21 °C. As a compromise, average temperatures of the water in an
aquaponic system should be maintained at around 22.2 – 23.3 °C (Nelson R. L., 2008).
When choosing the location of the backyard aquaponic system, care should be made to place the
components containing just water (fish tank and sump tank) in as much shade as possible, while the
grow bed should be placed in a location that will allow it to receive as much sun as possible. In this
design, the sump tank is almost 1 m underground which will help keep the water in the system cooler by
preventing it from heating too much during the day. The sump tank and the fish tank can be sheltered
for shade but not covered completely to avoid reduction of water aeration.
5.2 pH Regulation
The acid-producing nitrifying activities of the bacteria in the coconut husk medium tend to lower the
water pH as it passes through the biofilter, which is not ideal for the fish. Base should be added in the
sump tank and not in the fish tank as to avoid pH shocks in the fish.
The pH should be maintained close to 7 and this can be achieved with the additions of bases such as
calcium hydroxide (Ca(OH)2) and potassium hydroxide (KOH). These bases should be applied several
times weekly on an alternating basis. The frequency with which they are to be added can be determined
by monitoring water pH to see how quickly it changes. The amount of base to be added can be
determined by performing acid-base titrations on the fish tank water and seeing what quantity of base
will produce the desired increase in pH. These tests are provided in water quality testing kits available
for sale from aquacultural supply companies.
One base that should never be used for pH control in these systems is sodium bicarbonate (NaHCO3) as
a high concentration of sodium ion (Na+) in the presence of chloride ions (Cl-) forms salt (NaCl). Sodium
concentrations above 50 mg/L are toxic to fish and they interfere with the uptake of several nutrients by
plants (Rakocy, Masser, & Losordo, 2006). The exposure of backyard aquaponic systems to Barbadian
rainstorms will also act as a source of dilution of accumulating compounds.
5.3 Water Quality Testing and Debris Control
Additional management recommendations for the maintenance of overall system health include
cleanliness (in order to reduce the risk of pathogen introduction to the system) and regular upkeep of
system components. Air diffusion tubes in the fish tank should be regularly cleaned to remove
accumulated biofilms and air stones should be occasionally replaced if they become clogged from the
outside by biofilms. Coconut husk should be replaced with an attempt at minimal disturbance to the
plant crops if waterlogging in the grow bed is observed. The most important indicator of overall system
health is the quality of the water in the fish tank. It is highly recommended that the installation of a
backyard aquaponic food production system be accompanied by the acquisition of a water quality

testing kit that allows for the regular measurement of the following critical parameters; pH, phosphates,
nitrogen (in the forms of nitrite, nitrate, ammonia), temperature, dissolved oxygen and salinity.
Debris accumulation in the fish tank and sump tank can negatively impact water quality and should be
reduced by the use of screens or netting placed on top of both tanks. Scavenger fish that do not
interfere with tilapia cultivation can be kept in the fish tank to consume excess fish food and other
organic debris that collects on the bottom over time.
6. Cost Benefit Analysis
6.1 Costs
To assess the viability of housing a system, a cost benefit analysis was performed. Cost benefit analyses
are useful tools for determining the financial feasibility of a venture. The cost of all inputs to the system
are tallied and weighed against the value of the system’s outputs. In this case, there are several inputs,
including initial material costs, electricity, and fish feed. The outputs are in the form of vegetable and
tilapia production. Many assumptions must be made in order to make reasonable estimations for many
of the inputs and outputs. A thorough explanation of the system components will be explored in this
section. Because an initial design took place in Barbados and the optimized design is for tropical
Caribbean climates, prices will be displayed in both Canadian and Barbadian dollars.
6.1.1 Initial Material Costs
Table 6: Initial costs of backyard aquaponic system
Materials Cost (BDS $) Cost (CND $)
HDPE Grow Bed 795.00 397.50
HDPE Fish Tank 240.00 120.00
HDPE Sump Tank 220.00 110.00
Pump 578.00 289.00
Distribution Network 270.00 135.00
Air Diffusion Hose 150.00 75.00
Cinder Blocks (10) 50.00 25.00
Air Stone 10.00 5.00
Air Valves 20.00 10.00
Extension Cord 50.00 25.00
Grow Media 15.00 7.50
Seedlings 20.00 10.00
Tilapia fish 80.00 40.00
Total 2,498.00 1,249.00
Assumptions and notes:
Grow beds of the exact dimensions could not be found and priced, so for pricing purposes, the
price of three 2 m2 grow beds were used.
10 cinder blocks at $2.50/ea were used in place of stands to adjust the levels of the
components.
50 ft of air hose was used at a price of $1.50/ft.
Growing media (coconut husk) was priced at a cost of $30/tonne. 1 tonne occupies
approximately 7.3 m3.
72 Seedlings were used at a cost of approximately $0.15/seedling.
Tilapia fingerlings were purchased at approximately $1.00/fish.
It should be noted that over 50% of initial set up costs are due to the grow bed, fish tank, and sump
tank. These costs could be greatly reduced by a grower with a little ingenuity. The grow bed, at a cost
of $397, is the single biggest expense of the system, however this cost is mostly attributed to the high
cost of fabricating the mould to make the bed. The only necessity of the bed is that it be able to hold
the grow media that the plants grow in and that the water not leak out of it. This type of structure can
easily be constructed by creating an area bordered by walls made from cinder blocks or even soil for
example. The area would then have to be lined with an impermeable polyethylene liner, which
generally retails for around $5/m2. A 6 m2 by 0.3 m deep grow area could be lined for less than $40.
Similar logic could be used for the sump tank. The tank’s only design characteristic is that its depth be as
large as possible compared to the height that the water is lifted to the fish tank. A hole dug in the
ground could even be lined with the polyethylene liner. Polyethylene liner is however discouraged in
fish tank use because fish tend to bite holes causing leaks in the tank. If liner is used in the grow area,
care is needed to ensure that the seal between the liner and effluent pipe is tight to avoid leaks as water
exits the grow bed area.
6.1.2 Annual Costs
An additional input to the system is the cost of electricity used to run the air blower that circulates the
water throughout the system and aerates the fish tank and grow bed. The cost of electricity is assumed
to be $0.21/kWh, which falls in line with what Barbados Light & Power charges (Barbados Light and
Power). The Hi-Blow HP 40 pump’s power consumption is rated at 0.8 amps, using 120 V (0.096 kW).
The annual electricity costs then become:

𝐴𝑛𝑛𝑢𝑎𝑙 𝐸𝑙𝑒𝑐𝑡𝑟𝑖𝑐𝑖𝑡𝑦 𝐶𝑜𝑠𝑡: $0.21
𝑘𝑊∗
8760 𝑟
𝑦𝑟∗ 0.096 𝑘𝑊 = $ 𝟏𝟕𝟔.𝟔𝟎/𝒚𝒆𝒂𝒓
The final annual cost for the system is the fish feed given to the tilapia each day. A fish feed rate ratio of
25 g/m2d is used in media filled systems and it is assumed that a 22.5 kg bag of fish feed could be
purchased for approximately $26. The cost of annual fish feed used is as follows:
𝐴𝑛𝑛𝑢𝑎𝑙 𝐹𝑖𝑠 𝐹𝑒𝑒𝑑 𝐶𝑜𝑠𝑡: 0.025 𝑘𝑔
𝑚2 ∗ 𝑑𝑎𝑦∗
6𝑚2
𝑔𝑟𝑜𝑤 𝑏𝑒𝑑∗
365 𝑑𝑎𝑦𝑠
𝑦𝑒𝑎𝑟∗
𝑏𝑎𝑔
22.5 𝑘𝑔∗
$26
𝑏𝑎𝑔= $𝟔𝟑.𝟐𝟕 /𝒚𝒆𝒂𝒓
6.2 Outputs
6.2.1 Fish Production
There are 8.67 fish harvests per year; one every 6 weeks. For simplicity, we assume that there will be 9
harvests. With 9 fish in each harvest, a total of 81 fish will be produced annually by the system.
Monetary values for tilapia fish were ascertained by surveying local supermarkets in Barbados. Whole
fish prices, as opposed to fillet prices, were used; $10/kg. Harvest weight per fish is predicted to be
0.450 kg. The value of annual fish production will therefore be as follows:
𝑉𝑎𝑙𝑢𝑒 𝑜𝑓 𝐹𝑖𝑠 𝑃𝑟𝑜𝑑𝑢𝑐𝑡𝑖𝑜𝑛 = 9 𝑎𝑣𝑒𝑠𝑡𝑠
𝑦𝑒𝑎𝑟∗
9 𝑓𝑖𝑠
𝑎𝑟𝑣𝑒𝑠𝑡∗
0.450 𝑘𝑔
𝑓𝑖𝑠∗
$10
𝑘𝑔= $364.50/𝑦𝑒𝑎𝑟
6.2.2 Vegetable Production
To estimate vegetable production it was assumed that a plant density of 12 plants/m2 will be used. This
is an empirical figure determined from practical experience with aquaponics. For the sake of the cost
benefit exercise, it is assumed that a system uses half of its area to grow okra and the other half to grow
basil. In reality, systems can be used to grow a number of different crops, all with different yields and
market prices, but for the sake of simplicity, and because of the information available, okra and basil are
used as representative crops. Again, prices for okra and basil were determined by looking at Barbadian
supermarket prices and were found to be $ 3.40/kg for okra and $ 26.75/kg for basil. A growing area of
6 m2 will be assumed to hold 36 basil plants and 36 okra plants. Per plant final production values, which
were taken from Dr. James E. Rakocy’s work with aquaponics at the University of the Virgin Islands,
were found to be on average 700 g for okra and 250 g for basil. According to the UVI study, okra is
harvested once every 3 months and basil, once a month. Table 7 summarizes the annual financial gains
from the two crops.

Table 7: Summary of annual outputs from okra and basil
Crop # of Plants Harvests/Year Weight/Plant
(kg) Total Weight
(kg) Market Price
($BDS) Annual Value
($CND) Annual Value
($BDS)
Okra 36.00 4.00 0.70 100.80 3.40 342.72 685.44
Basil 36.00 12.00 0.25 108.00 26.75 2889.00 5778.00
The large difference between the values of the two crops demonstrates how much more profitable it is
to grow herbs and leafy green vegetables as opposed to fruiting crops, as previously discussed.
6.3 Summary of Analysis
Tables 8 to 10 summarize the cost benefit analysis.
Table 8: Summary of first year costs and outputs
1st Year Inputs Cost (BDS) Cost (CND) Outputs Value (BDS) Value (CND)
Startup Materials 2498.00 1249.00 Okra 1370.88 685.44
Electricity 353.20 176.60 Basil 11556 5778
Fish Food 126.54 63.87 Tilapia 729 364.5
Total 2977.74 1489.87 13655.88 6827.94
Table 9: Summary of second year costs and outputs
2nd Year Inputs Cost (BDS) Cost (CND) Outputs Value (BDS) Value (CND)
Electricity 353.20 176.60 Okra 1370.88 685.44
Fish Food 126.54 63.87 Basil 11556 5778
Tilapia 729 364.5
Total 479.74 240.47 13655.88 6827.94
Table 10: Summary of profits for the first two years
Profits BDS CND
1st Year 10678.14 5338.47
2nd Year 13176.14 6587.47
These tables show the distinction between the first and second year of production because initial start-
up costs, which are quite significant, are only incurred in the first year. For this reason, financial gains
subsequent to the first year ($6587.47) are significantly higher than those experienced in the initial year
of production ($5338.47).

At this point it should be reiterated how much this analysis relies on the stated assumptions. Basil is
obviously much more profitable than okra, which makes the system highly lucrative. If a family were to
simply use the system to produce food for their own consumption, not much of the area would be
devoted to herbs, which are much more profitable. Planting densities, production plant weights, and
material costs are all values that can vary and will affect a cost benefit analysis. Nevertheless, the
system appears to be quite financially worthwhile.
7. Conclusions
Re-examining our objective provides a good framework to conclude the project. Starting the project
the goal was to scrutinize an aquaponics system so we could identify exactly where key design decisions
could be made in order to increase the efficiency of the system and maximize the output. All design
decisions were inevitably compared to the familiar systems that had been encountered in Barbados.
The final design included elements that were not considered in previous systems, most notably the
replacement of the water pump with and air pump that has the capabilities to aerate the fish tank
water, the grow bed, and circulate the water throughout the system. The elevation levels of the grow
bed, fish tank and sump tank were also meticulously set to minimize the power requirements to
circulate the water. And finally, the sequential harvesting of both the fish and plants is expected to
make a considerable augmentation to the system’s output as it regulates system parameters such as the
stocking density of the fish and the nutritional needs of the plants. The additional design decision are
expected considerably improve water quality, thereby positively affecting fish growth and production.
Food security poses a very real and serious threat in the world today. What makes aquaponic food
production so attractive is its ability to address these issues of resource conservation and access to a
reliable and quality food source. In addition to this, the simplicity of an aquaponic system makes it
accessible and user friendly so it has the potential to help families who are most in need of it. Although
Barbados is the most developed of the Caribbean nations and the quality of living is generally
considered very good, mean income is still only around $7,500 (USD) (Barbados Vital Statistic, 2007),
and therefore the addition of a few thousand dollars in the form of food or revenue has the ability to
significantly impact the lives of families. It has been shown time and again that it can be a profitable
endeavour and, if desired, a lucrative vegetable and fish production company can be developed using
aquaponic methods. The potential is high for this type of agriculture and it will likely gain notoriety as
global circumstances continue to necessitate an increasing amount of innovation, conservation, and
consciousness.
Bibliography
Ministry of Agriculture and Rural Development. (n.d.). Geology of Scotland District - Barbados. Retrieved
March 18, 2010, from Scotland District Development:
http://www.agriculture.gov.bb/default.asp?V_DOC_ID=1489
(2003). Retrieved April 7, 2010, from 2003 International Year of Freshwater:
http://www.wateryear2003.org
(2010). Retrieved April 7, 2010, from World Food Programme: www.wfp.org
About Hydroponics: Get up and Grow. (2007). Retrieved April 10, 2010, from Get up and Grow Web Site:
http://www.getupandgrow.ie/acatalog/about_hydroponics.html
Aquaculture resources. (2010). Retrieved April 9, 2010, from Food and Agriculture Organization Web
site: http://www.fao.org/fishery/topic/13530/en
AXSES Systems Caribbean Inc. (n.d.). Barbados Attractions: Mount Hillaby. Retrieved March 13, 2010,
from Barbados Tourism Encyclopedia: http://www.barbados.org/hillaby.htm
Bailkey, M., & Nasr, J. (2000). From Brownfields to Greenfields: Producing Food in North American Cities.
Community Food Security News , 1-8.
Barbados Vital Statistic. (2007). Retrieved April 14, 2010, from Barbados Central Bank :
http://www.centralbank.org.bb/country_info.shtml
Block, L. (2009, March 2). Coconut Fibers Replace Synthetic Polyester Fibers in Cars. Retrieved March 30,
2010, from Elephant: http://www.elephantjournal.com/2009/03/coconut-fibers-replace-synthetic-
polyester-fibers-in-cars/
CARICOM. (2009). The Caribbean Community. Retrieved April 7, 2010, from The Caribbean Community
Secretariat: http://www.caricom.org/jsp/community/community_index.jsp?menu=community
Central Intelligence Agency, U. S. (2010, March 18). Central America and Caribbean: Barbados. Retrieved
April 7, 2010, from The World Fact Book: https://www.cia.gov/library/publications/the-world-
factbook/geos/bb.html
Chalmers, G. A. (2004). Aquaponics and Food Safety. Crop Diversification Center, Alberta, Canada , 1-
114.
Colombo Quality Coir Products. (2010). Coco Peat (Coir Pith). Retrieved April 8, 2010, from Colombo
Quality Coir Products: http://www.coconutcoirsrilanka.com/products_horti.html
Considine, M. (2007, Aug-Sept). Plant crops to clean up aquaculture waste. ECOS Magazine , p. 34.
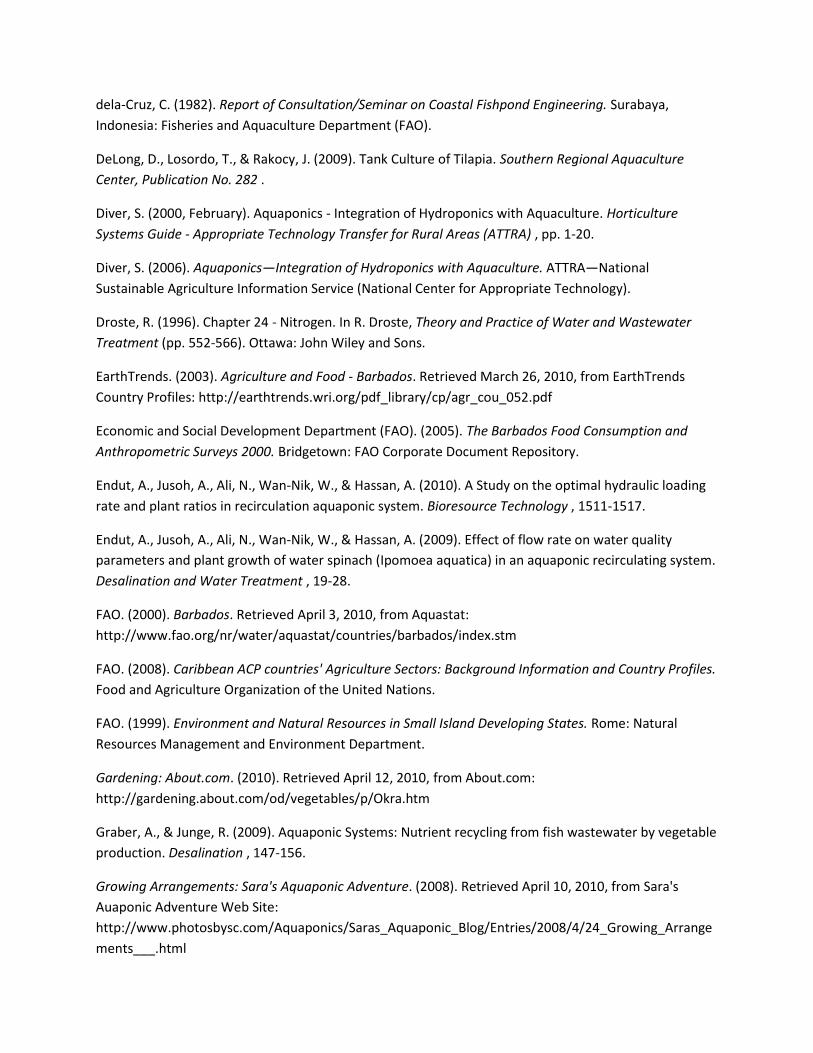
dela-Cruz, C. (1982). Report of Consultation/Seminar on Coastal Fishpond Engineering. Surabaya,
Indonesia: Fisheries and Aquaculture Department (FAO).
DeLong, D., Losordo, T., & Rakocy, J. (2009). Tank Culture of Tilapia. Southern Regional Aquaculture
Center, Publication No. 282 .
Diver, S. (2000, February). Aquaponics - Integration of Hydroponics with Aquaculture. Horticulture
Systems Guide - Appropriate Technology Transfer for Rural Areas (ATTRA) , pp. 1-20.
Diver, S. (2006). Aquaponics—Integration of Hydroponics with Aquaculture. ATTRA—National
Sustainable Agriculture Information Service (National Center for Appropriate Technology).
Droste, R. (1996). Chapter 24 - Nitrogen. In R. Droste, Theory and Practice of Water and Wastewater
Treatment (pp. 552-566). Ottawa: John Wiley and Sons.
EarthTrends. (2003). Agriculture and Food - Barbados. Retrieved March 26, 2010, from EarthTrends
Country Profiles: http://earthtrends.wri.org/pdf_library/cp/agr_cou_052.pdf
Economic and Social Development Department (FAO). (2005). The Barbados Food Consumption and
Anthropometric Surveys 2000. Bridgetown: FAO Corporate Document Repository.
Endut, A., Jusoh, A., Ali, N., Wan-Nik, W., & Hassan, A. (2010). A Study on the optimal hydraulic loading
rate and plant ratios in recirculation aquaponic system. Bioresource Technology , 1511-1517.
Endut, A., Jusoh, A., Ali, N., Wan-Nik, W., & Hassan, A. (2009). Effect of flow rate on water quality
parameters and plant growth of water spinach (Ipomoea aquatica) in an aquaponic recirculating system.
Desalination and Water Treatment , 19-28.
FAO. (2000). Barbados. Retrieved April 3, 2010, from Aquastat:
http://www.fao.org/nr/water/aquastat/countries/barbados/index.stm
FAO. (2008). Caribbean ACP countries' Agriculture Sectors: Background Information and Country Profiles.
Food and Agriculture Organization of the United Nations.
FAO. (1999). Environment and Natural Resources in Small Island Developing States. Rome: Natural
Resources Management and Environment Department.
Gardening: About.com. (2010). Retrieved April 12, 2010, from About.com:
http://gardening.about.com/od/vegetables/p/Okra.htm
Graber, A., & Junge, R. (2009). Aquaponic Systems: Nutrient recycling from fish wastewater by vegetable
production. Desalination , 147-156.
Growing Arrangements: Sara's Aquaponic Adventure. (2008). Retrieved April 10, 2010, from Sara's
Auaponic Adventure Web Site:
http://www.photosbysc.com/Aquaponics/Saras_Aquaponic_Blog/Entries/2008/4/24_Growing_Arrange
ments___.html

Hampwaye, G., Nel, E., & Ingombe, L. (2009). The role of urban agriculture in addressing household
poverty and food security: the case of Zambia. India: Global Development Network.
Herminio, R. R. (1988). History of Aquaculture. Manila: ASEAN/UNDP/FAO.
Homer, F. (1998). A Rapid Assessment of Agriculture in Barbados. Bridgetown: Barbados National
Biodiversity Strategy and Action Plan.
Hudson Extrusions Inc. (2009). Food Grade Flexible Vinyl Plastic Tubing - Flexible PVC. Retrieved April 9,
2010, from Hudson Extrusions Inc.: http://www.hudsonextrusions.com/food_grade_vinyl_tubing.htm
Hughey, T. (2005). Aquaponics for Developing Countries. Aquaponics Journal, Issue 38 , pp. 16-18.
Hydroponic Photo Gallery: The Torch Work Shop. (n.d.). Retrieved April 10, 2010, from The Torch Work
Shop Web Site: http://www.stx.k12.vi/torch99/mainpg/coverpg.htm
Hydroponics: Andrew Smith. (2006). Retrieved April 10, 2010, from Andrew Smith Web Site:
http://asmith.id.au/index.html
IICA. (2009). 2008 Annual Report: IICA-Barbados' contribution to agriculture and the development of the
rural communities in the Americas. Costa Rica: Inter-American Institute for the Cooperation on
Agriculture.
La-Wniczak, F., Francois, P., Scrivener, O., Kastrinakis, E. G., & Nychas, S. G. (1999). The Efficiency of
Short Airlift Pumps Operating at Low Submergence Ratios. The Canadian Journal of Chemical
Engineering, Volume 77, Issue 1 , 3-10.
Loren. (2010, March 31). Cocochips. Retrieved April 2, 2010, from Casa de las Orquideas:
http://www.orquideas.com/growing/potting/cocochips.jpg
Losordo, T. M., Masser, M. P., & Rakocy, J. E. (1998). Recirculating Aquaculture Tank Production Systems
- An Overview of Critical Considerations. SOuthern Regional Aquaculture Center, Publication No. 451 , 1-
6.
My Mom-Friday. (2009, November 13). Steamed 'King Fish' in Light Soy. Retrieved April 6, 2010, from
My Mom-Friday: http://www.mymomfriday.com/2009/11/steamed-king-fish-in-light-soy.html
Nelson, R. L. (2008). Aquaponic Food Production - Raising fish and plants for food and profit. Montello,
WI: Nelson and Pade, Inc.
Nelson, R. L. (2008). Aquaponics Food Production: Raising fish and plants for food and profit. Montello:
Nelson and Pade Inc.
Okra Varieties: Diet, Desert and Dogs Blog. (n.d.). Retrieved April 12, 2010, from Diet, Desert and Dogs
Web Site: http://dietdessertndogs.wordpress.com/2009/03/14/a-double-ode-to-okra-two-ways-to-love-
it/

Pesto: Salt and Pepper Blog. (n.d.). Retrieved April 10, 2010, from Salt and Pepper Web Site:
http://giniann.wordpress.com/2007/06/22/handmade-basil-pesto-for-gbp-summer-07/
Pimentel, D., Berger, D., Filberto, D., & Newton, M. (2004). Water Resources: Agricultural and
Environmental Issues. Bioscience , 54: 909-918.
Popma, T., & Masser, M. (1999). Tilapia - Life History and Biology. Southern Regional Aquaculture Center,
Publication No.283 .
Post, G. (1983). Textbook of Fish Health. Neptune City: T.F.H. Publications, Inc.
Rakocy, J. E. (1988-89). Hydroponic Lettuce Production in a Recirculating Fish Culture System. Island
Perspectives 3 , pp. 5-10.
Rakocy, J. E., Bailey, D. S., Shultz, R. C., & Thoman, E. S. (2004). Update on Tilapia and Vegetable
Production in the UVI Aquaponic System. Proc. 6th Intl. Symposium on Tilapia in Aquaculture, Manila,
Philippines, 12-16 September , 676-698.
Rakocy, J. E., Masser, M. P., & Losordo, T. M. (2006). Recirculating Aquaculture Tank Production
Systems: Aquaponics - Integrating Fish and Plant Culture. Southern Regional Aquaculture Center,
Publication No. 454 , 1-16.
Rakocy, J. E., Masser, M. P., & Losordo, T. M. (2006). Recirculating Aquaculture Tank Production
Systems: Aquaponics—Integrating Fish and Plant Culture. Southern Regional Aquaculture Center,
Publication No. 454 , 1-16.
Riche, M., & Garling, D. (2003, August). Feeding Tilapia in Intensive Recirculating Systems. North Central
Regional Aquaculture Center, Fact Sheet Series #114 , pp. 1-4.
Somma, R. (2008, June 4). Vibrantly Colored Plants. Retrieved April 9, 2010, from Flickr:
http://www.flickr.com/photos/14405058@N08/2551774109/
Spade, J. S. (2009). Village Aquaponics. Aquaponics Journal .
Steve, C. (2007, Summer). Up the Garden Path - The Nitrogen Cycle. Backyard Aquaponics , pp. 6-7.
Suits, B. (2010). Access to Personal Agriculture. The Aquaponics Guidebook, Volume 1, 2nd Edition , pp.
1-12.
The Geyser Pump. (2010). Geyser Pump. Retrieved March 25, 2010, from The Geyser Pump:
http://airliftpump.com/
The World Bank. (2010). Retrieved April 7, 2010, from Agriculture and Rural Development:
http://web.worldbank.org
Totally Barbados. (2010). Barbados Tourism. Retrieved April 6, 2010, from Totally Barbados - Brecal Inc.:
http://www.totallybarbados.com/barbados/Business/Economy/Tourism/
Types of Hydroponics Systems: Dave's Hydroponics Experiment. (2010). Retrieved April 10, 2010, from
Dave's Hydroponics Experiment: http://www.dbcourt.co.uk/hydroponics/System%20_types.html
UN. (2004). Freshwater Country Profile - Barbados. Retrieved April 7, 2010, from Freshwater2004 -
Barbados: http://www.un.org/esa/agenda21/natlinfo/countr/barbados/freshwater.pdf
What is Aquaponics: The Fish Farm. (2010). Retrieved April 10, 2010, from The Fish Farm:
http://www.aquamist.com/hydroponics/
Wilson, G. (2010). Aquaponics Network Australia . Retrieved April 10, 2010, from BuildingGreen:
http://www.buildinggreen.com/auth/image.cfm?imageName=images/1802/raft.jpg&fileName=180201a
.xml
Wurts, W. A., McNeill, S. G., & Overhults, D. G. (1994). Performance and design characteristics of airlift
pumps for field applications. World Aquaculture 25(4) , 51-55.
Závodská, A., & Dolly, D. (2009). A Comparison of Small Scale Farming in Barbados, Dominica, and
Trinidad and Tobago. San Juan: Association for International Agricultural and Extension Education
(AIAEE).
Appendices
Appendix A: Barbados Background Information
Figure 39: Location of Barbados in the Caribbean (From: http://www.travelguide2barbados.com/p1_maps.php)
Figure 40: Barbados Climate Graph (Metric) (From: http://www.climatetemp.info/barbados/)
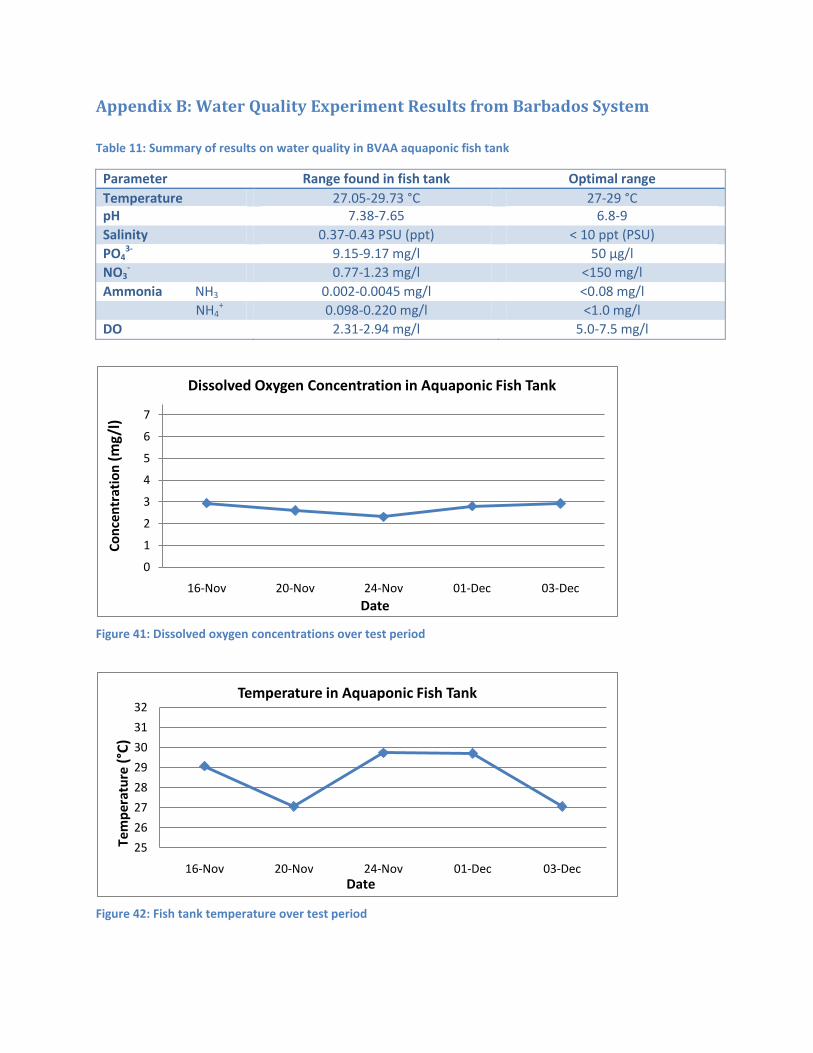
Appendix B: Water Quality Experiment Results from Barbados System
Table 11: Summary of results on water quality in BVAA aquaponic fish tank
Parameter Range found in fish tank Optimal range
Temperature 27.05-29.73 °C 27-29 °C pH 7.38-7.65 6.8-9
Salinity 0.37-0.43 PSU (ppt) < 10 ppt (PSU)
PO43- 9.15-9.17 mg/l 50 μg/l
NO3- 0.77-1.23 mg/l <150 mg/l
Ammonia NH3 0.002-0.0045 mg/l <0.08 mg/l
NH4+ 0.098-0.220 mg/l <1.0 mg/l
DO 2.31-2.94 mg/l 5.0-7.5 mg/l
Figure 41: Dissolved oxygen concentrations over test period
Figure 42: Fish tank temperature over test period
0
1
2
3
4
5
6
7
16-Nov 20-Nov 24-Nov 01-Dec 03-Dec
Co
nce
ntr
atio
n(m
g/l)
Date
Dissolved Oxygen Concentration in Aquaponic Fish Tank
25
26
27
28
29
30
31
32
16-Nov 20-Nov 24-Nov 01-Dec 03-Dec
Tem
per
atu
re(°
C)
Date
Temperature in Aquaponic Fish Tank

Figure 43: Fish tank pH over test period
Figure 44: Fish tank salinity over test period
Figure 45: Nitrate concentrations over test period
0
2
4
6
8
10
12
14
16-Nov 20-Nov 24-Nov 01-Dec 03-Dec Avg
pH
Date
pH in Aquaponic Fish Tank
0
0.1
0.2
0.3
0.4
0.5
16-Nov 20-Nov 24-Nov 01-Dec 03-Dec
Val
ue
(P
SU)
Date
Salinity in Aquaponic Fish Tank
0.00
0.20
0.40
0.60
0.80
1.00
1.20
1.40
16-Nov 20-Nov 24-Nov 01-Dec 03-Dec Avg
Co
nce
ntr
atio
n (
mg/
l)
Date
Nitrate Concentration in Aquaponic Fish Tank
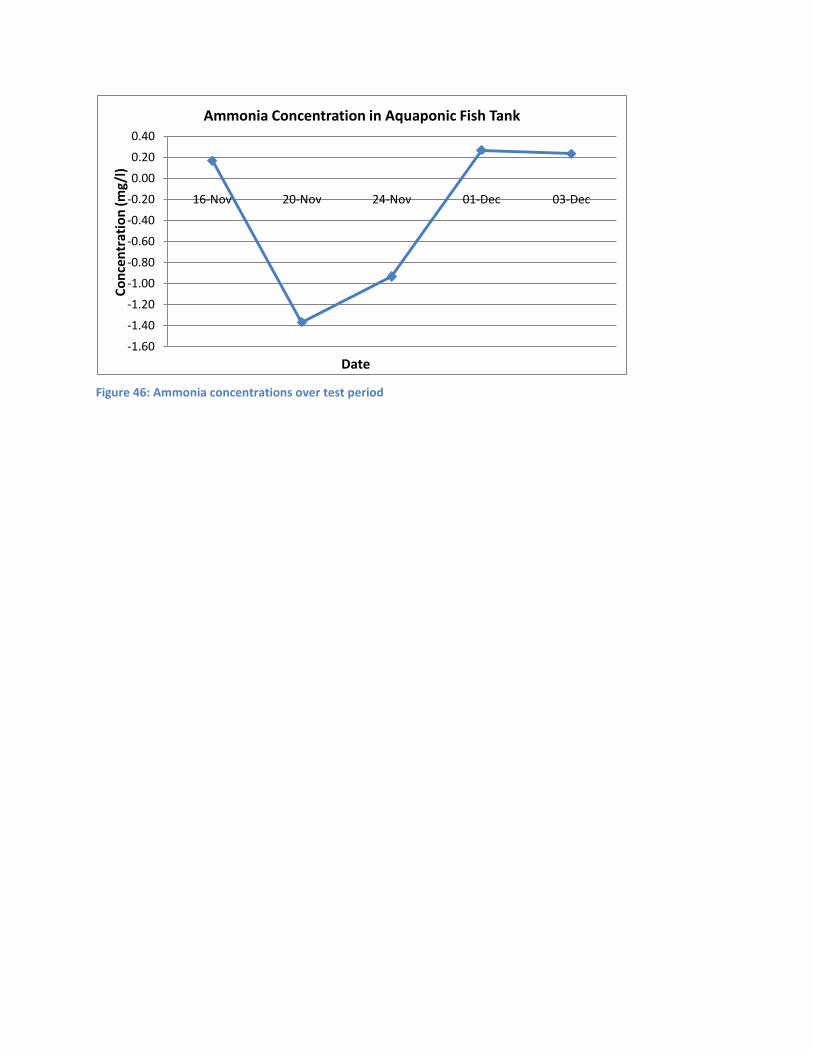
Figure 46: Ammonia concentrations over test period
-1.60
-1.40
-1.20
-1.00
-0.80
-0.60
-0.40
-0.20
0.00
0.20
0.40
16-Nov 20-Nov 24-Nov 01-Dec 03-Dec
Co
nce
ntr
atio
n (
mg/
l)
Date
Ammonia Concentration in Aquaponic Fish Tank

Appendix C: Fish Growth Estimations Table 12: Fish Growth Estimations (based on SRAC-282: Tank Culture of Tilapia
Growth Period
Day 1-30
Day 31-60
Day 61-110
Day 111 - 170
Initial/Final Weight (g) 20/50 50/100 100/250 250/450
Growth Rate (g/day) 1 1.75 3 3.25
Cohort 1 Cohort 2 Cohort 3 Cohort 4
Day Weight (g) Day
Weight (g) Day Weight (g) Day Weight (g)
1 20 1 71 1 172 1 302
2 21 2 72.75 2 175 2 305.6
3 22 3 74.5 3 178 3 309.2
4 23 4 76.25 4 181 4 312.8
5 24 5 78 5 184 5 316.4
6 25 6 79.75 6 187 6 320
7 26 7 81.5 7 190 7 323.6
8 27 8 83.25 8 193 8 327.2
9 28 9 85 9 196 9 330.8
10 29 10 86.75 10 199 10 334.4
11 30 11 88.5 11 202 11 338
12 31 12 90.25 12 205 12 341.6
13 32 13 92 13 208 13 345.2
14 33 14 93.75 14 211 14 348.8
15 34 15 95.5 15 214 15 352.4
16 35 16 97.25 16 217 16 356
17 36 17 99 17 220 17 359.6
18 37 18 100.75 18 223 18 363.2
19 38 19 100 19 226 19 366.8
20 39 20 103 20 229 20 370.4
21 40 21 106 21 232 21 374
22 41 22 109 22 235 22 377.6
23 42 23 112 23 238 23 381.2
24 43 24 115 24 241 24 384.8
25 44 25 118 25 244 25 388.4
26 45 26 121 26 247 26 392
27 46 27 124 27 250 27 395.6
28 47 28 127 28 253.25 28 399.2
29 48 29 130 29 256.5 29 402.8
30 49 30 133 30 259.75 30 406.4

31 50 31 136 31 263 31 410
32 51.75 32 139 32 266.25 32 413.6
33 53.5 33 142 33 269.5 33 417.2
34 55.25 34 145 34 272.75 34 420.8
35 57 35 148 35 276 35 424.4
36 58.75 36 151 36 279.25 36 428
37 60.5 37 154 37 282.5 37 431.6
38 62.25 38 157 38 285.75 38 435.2
39 64 39 160 39 289 39 438.8
40 65.75 40 163 40 292.25 40 442.4
41 67.5 41 166 41 295.5 41 446
42 69.25 42 169 42 298.75 42 449.6

Appendix D: Air Pump Specifications
Figure 47: Performance chart for Hi-Blow HP 40 pump

Table 13: Alternate method for air flow calculations (The Geyser Pump, 2010)
Pumping rate 1,904 gallon/day
Pipe diameter 2.00 inch submergence 3.5 ft lift 4.9 ft
cross-sectional area of pipe 0.022 ft2
Pipe volume 0.08 ft3
Pipe volume 7.48 gallon
Vl (Flow rate) 1 GPM
A (Pipe area) 0.022 ft2
L (Lift) 4.9 ft
D (Pipe diameter) 2 inch
Lf (density of fluid) 100
S (submergence) 3.51 ft
Lg (Gas density) 0.0765
Value of Ordinate 24,697 2.47E+04
Value of Abscissa 100<Y<10,225 3.55
10,225<Y<73,637 3.42
73,637<Y<117,690 3.34
117,690<Y<123.645 0.00
123,645<Y<128,308 0.00
128,308<Y<99,018 3.21
Graph reading 3.42
Vg (Gas flow) 1.22 ft3/min
Pressure 1.52 psi