ptl holdings p.l.c. - 1923 investments · ptl holdings plc financial analysis summary 1 table of...
TRANSCRIPT
PTL Holdings
p.l.c.
Financial Analysis
Summary
19 August 2015
The Directors
PTL Holdings p.l.c.
Nineteen Twenty Three
Valletta Road
Marsa MRS 3000
19 August 2015
Dear Sirs
PTL Holdings p.l.c. Financial Analysis Summary
In accordance with your instructions, and in line with the requirements of the Listing Authority
Policies, we have compiled the 2015 Financial Analysis Summary set out on the following pages and
which is being forwarded to you together with this letter.
The purpose of the financial analysis is that of summarising key financial data appertaining to PTL
Holdings p.l.c. (the “Group” or the “Company”). The data is derived from various sources or is based
on our own computations as follows:
(a) Historical financial data for the period 23 December 2013 to 31 December 2014 has been
extracted from the audited consolidated financial statements of PTL Holdings p.l.c.
(b) Historical financial data for the latest four years has been extracted from the audited financial
statements of each of the operating companies forming part of the Group (PTL, SAD and APCO).
(c) The forecast data of the Group for the years ending 31 December 2015 and 31 December 2016
has been provided by management of the Company.
(d) Our commentary on the results of the Group and on its financial position is based on the
explanations provided by the Company.
(e) The ratios quoted in the Financial Analysis Summary have been computed by us applying the
definitions set out in Part 4 of the Analysis.
(f) Relevant financial data in respect of the companies included in Part 3 has been extracted from
public sources such as websites of the companies concerned, financial statements filed with the
Registrar of Companies or websites providing financial data.
The Analysis is meant to assist investors in the Company’s securities and potential investors by
summarising the more important financial data of the Group. The Analysis does not contain all data
that is relevant to investors or potential investors. The Analysis does not constitute an endorsement
by our firm of any securities of the Company and should not be interpreted as a recommendation to
invest in any of the Company’s securities. We shall not accept any liability for any loss or damage
arising out of the use of the Analysis. As with all investments, potential investors are encouraged to
seek professional advice before investing in the Company’s securities.
Yours faithfully,
Wilfred Mallia
Director
PTL HOLDINGS PLC FINANCIAL ANALYSIS SUMMARY 1
TABLE OF CONTENTS
PART 1
1. Company’s Key Activities ....................................................................................................... 3
2. Directors and Key Employees ................................................................................................. 4
3. PTL Group ............................................................................................................................. 5
3.1 Organisational Structure .......................................................................................... 5
4. Group Operating Businesses .................................................................................................. 6
4.1 PTL .......................................................................................................................... 6
4.1.1 Business Overview ........................................................................................................... 6
4.1.2 The Information Technology (IT) Sector.......................................................................... 7
4.1.3 Competition and Trends .................................................................................................. 9
4.1.4 Operational performance .............................................................................................. 10
4.2 SAD ....................................................................................................................... 12
4.2.1 Business Overview ......................................................................................................... 12
4.2.2 The Market for Mobiles in Poland ................................................................................. 12
4.2.3 Competition and Trends ................................................................................................ 14
4.2.4 Operational performance .............................................................................................. 14
4.3 APCO .................................................................................................................... 16
4.3.1 Business Overview ......................................................................................................... 16
4.3.2 The E-payments and M-payments Market ................................................................... 16
4.3.3 Competition and Trends ................................................................................................ 17
PTL HOLDINGS PLC FINANCIAL ANALYSIS SUMMARY 2
4.3.4 Operational performance .............................................................................................. 17
5. Business Development Strategy ........................................................................................... 21
PART 2
6. Company Performance Review ............................................................................................ 22
6.1 Financial Information ............................................................................................ 22
6.1.1 Group Income Statement .............................................................................................. 23
6.1.2 Group Balance Sheet ..................................................................................................... 26
6.1.3 Group Cash Flow Statement ......................................................................................... 29
6.2 Related Party Debt Securities ................................................................................ 30
PART 3
7. Comparables ....................................................................................................................... 31
PART 4
8. Explanatory Definitions ....................................................................................................... 33
PTL HOLDINGS PLC FINANCIAL ANALYSIS SUMMARY 3
PART 1
1. COMPANY’S KEY ACTIVITIES
The principal activity of PTL Holdings p.l.c. (the “Company”, “Issuer” or the “Group”) is to carry on the
business of a holding and finance company.
The Company was registered on 23 December 2013 as a private limited liability company for the
purpose of developing and managing the technology business of Hili Ventures Limited (C 57902), the
parent company of the Issuer. Upon incorporation, the Company acquired a 100% shareholding in PTL
International Limited (C 63276) which was set up on the same day. Subsequently, by virtue of a number
of share transfer instruments the latter company acquired the Group companies highlighted in section
3.1 of this document, other than (i) PTL Company B.V. (28889541) and Ipsyon Limited (C 65394) which
were incorporated after the said transactions; and (ii) SAD (collectively, PTL Poland Sp. z o.o. and SAD
Sp. z o.o.) and APCO (collectively, APCO Limited and APCO Systems Limited) which were acquired from
third parties in 2014. On the 4 October 2014, The Company changed its status from a private limited
company to a public limited liability company. In December 2014, the Company issued 360,000 5.1%
unsecured bonds of a nominal value of €100 per bond, redeemable at their nominal value on 4
December 2014. These bonds are listed on the Official List of the Malta Stock Exchange.
PTL Limited (“PTL”), a company incorporated on 16 November 1976 under the name ‘Philip Toledo
Limited’ and registered in Malta with registration number C 3545, was acquired by the Hili group on 9
February 2012 pursuant to the subscription of all of PTL’s ordinary shares by Motherwell Bridge Limited
(C 49248) and Motherwell Bridge Estates Limited (C 54894), as to 49,999 ordinary shares and 1
ordinary share respectively of €2.329373 each share. The shares held by Motherwell Bridge Limited
were subsequently transferred to Hili Company Limited (C 57955) on 28 July 2013, and the 1 ordinary
share held by Motherwell Bridge Estates Limited was transferred to Hili Ventures Limited on 25
October 2013. PTL issued a further 150,255 ordinary shares on 11 December 2013 to Hili Company
Limited, and on 30 December 2013 transferred its shareholding in PTL to PTL International Limited (C
63276).
On 30 June 2014 and 1 August 2014, the Group acquired SAD and APCO respectively.
PTL HOLDINGS PLC FINANCIAL ANALYSIS SUMMARY 4
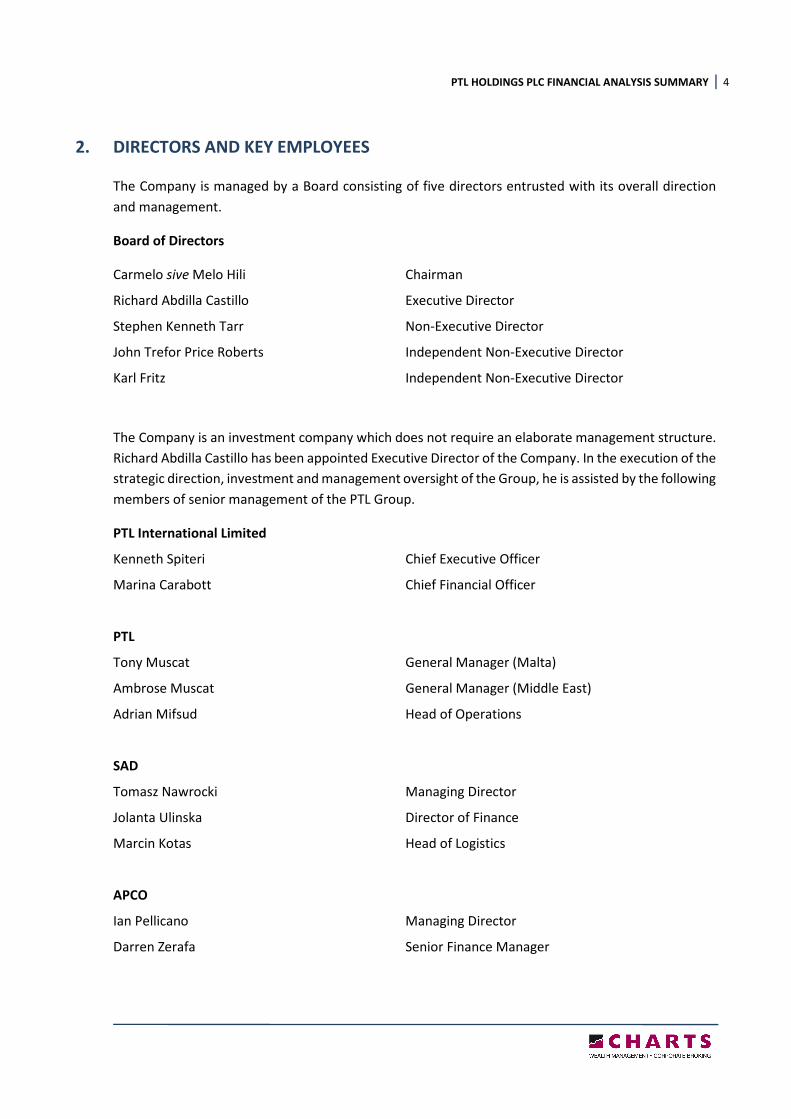
2. DIRECTORS AND KEY EMPLOYEES
The Company is managed by a Board consisting of five directors entrusted with its overall direction
and management.
Board of Directors
Carmelo sive Melo Hili Chairman
Richard Abdilla Castillo Executive Director
Stephen Kenneth Tarr Non-Executive Director
John Trefor Price Roberts Independent Non-Executive Director
Karl Fritz Independent Non-Executive Director
The Company is an investment company which does not require an elaborate management structure.
Richard Abdilla Castillo has been appointed Executive Director of the Company. In the execution of the
strategic direction, investment and management oversight of the Group, he is assisted by the following
members of senior management of the PTL Group.
PTL International Limited
Kenneth Spiteri Chief Executive Officer
Marina Carabott Chief Financial Officer
PTL
Tony Muscat General Manager (Malta)
Ambrose Muscat General Manager (Middle East)
Adrian Mifsud Head of Operations
SAD
Tomasz Nawrocki Managing Director
Jolanta Ulinska Director of Finance
Marcin Kotas Head of Logistics
APCO
Ian Pellicano Managing Director
Darren Zerafa Senior Finance Manager
PTL HOLDINGS PLC FINANCIAL ANALYSIS SUMMARY 5
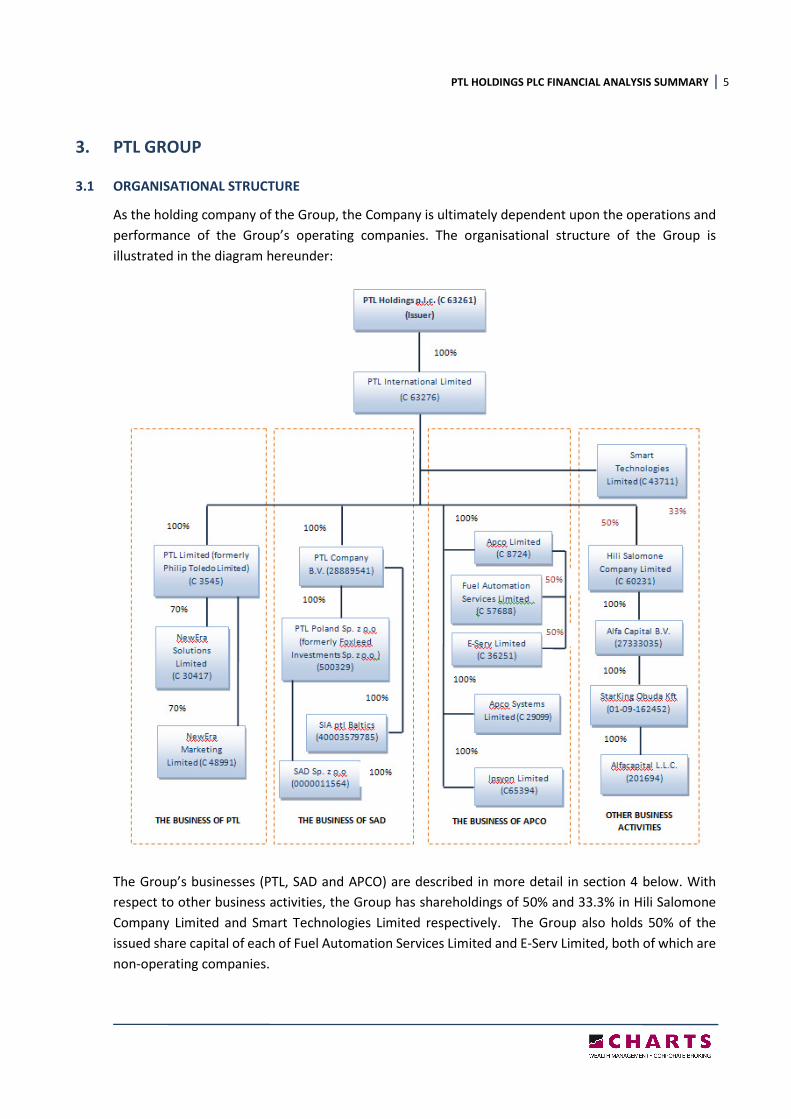
3. PTL GROUP
3.1 ORGANISATIONAL STRUCTURE
As the holding company of the Group, the Company is ultimately dependent upon the operations and
performance of the Group’s operating companies. The organisational structure of the Group is
illustrated in the diagram hereunder:
The Group’s businesses (PTL, SAD and APCO) are described in more detail in section 4 below. With
respect to other business activities, the Group has shareholdings of 50% and 33.3% in Hili Salomone
Company Limited and Smart Technologies Limited respectively. The Group also holds 50% of the
issued share capital of each of Fuel Automation Services Limited and E-Serv Limited, both of which are
non-operating companies.
PTL HOLDINGS PLC FINANCIAL ANALYSIS SUMMARY 6
Hili Salomone Company Limited was incorporated to operate Apple stores, as an Apple Premium
Reseller, in Hungary and Romania. Under the brand name ‘iCentre’, the company operates 3 stores in
Hungary and 1 outlet in Romania. Subsequently Hili Salomone Company Limited was placed into
liquidation and the shareholding in Starking Obuda Kft and Alfacapital L.L.C. will in due course be
transferred to PTL Company B.V. and VJ Salomone Limited in equal portions.
Smart Technologies Limited is principally engaged in information technology outsourcing services and
rental of equipment including desktops, laptops and netbooks. The company also manages and
supports portfolios of IT assets for corporate clients through leasing packages.
4. GROUP OPERATING BUSINESSES
4.1 PTL
4.1.1 Business Overview
PTL is a multi-brand information technology solutions provider to businesses and the public sector
primarily in Malta and to a lesser extent in the Middle East. PTL provides comprehensive and integrated
solutions for its customers’ technology needs through the company’s extensive hardware, software
and value-added service offerings. The breadth of offerings allows customers to streamline their
procurement processes by partnering with PTL as a complete technology solutions provider. The
company’s hardware offerings include products with leading brands across multiple categories such as
network communications, notebooks/mobile devices, data storage, video monitors, printers, desktops,
servers, ATMs and security systems among others. Software offerings include licensing, licensing
management and software solutions and services that help customers to optimise their software
investments. PTL offers a full suite of value-added services, which typically are delivered as part of a
technology solution, to help customers meet their specific needs.
Solutions range from configuration services for computer devices to fully integrated solutions such as
virtualisation, collaboration, security, application integration and migration, mobility and cloud
computing. With broad technical scope and capabilities, PTL offers a single source for its clients’ diverse
IT requirements, which involves assessing, designing, deploying and managing IT solutions to help
customers enable, manage and secure their IT environments.
PTL’s business is well-diversified across customers, products and service offerings and vendors from
whom it purchases products and software for resale. The company has aligned its sales and marketing
functions around customer channels to retain and increase sales to existing customers and to acquire
new customers. The direct selling personnel are supported by a team of technology specialists who
design solutions and provide recommendations in the selection and procurement processes. Products
are purchased for resale from original equipment manufacturers (OEMs) and distributors.
Management maintains that effective purchasing from a diverse vendor base is a key element of the
company’s business strategy. PTL is authorised by OEMs to sell all or selected products offered by the
manufacturer, and operate as a reseller for major software publishers that allows the end-user
customer to acquire packaged software or licensed products and services.
PTL HOLDINGS PLC FINANCIAL ANALYSIS SUMMARY 7
PTL offers its end-to-end services to entities from various industry sectors, but predominantly operates
within a set of industry vertical markets where the Group has developed extensive knowledge and
expertise. Such vertical markets include the following:
• Retail and Distribution – PTL provides a variety of solutions to businesses in Malta and the
Middle East ranging from point-of-sale devices, merchandising infrastructure and supply chain
systems to customer loyalty programmes, security products and services.
• Banking – PTL primarily supplies the banking industry in Malta with NCR deposit ATMs and also
offers ancillary support services.
• Public sector – PTL supplies IT products (hardware and software) and provides support services
to a number of government entities and public sector organisations in Malta.
4.1.2 The Information Technology (IT) Sector
IT sector worldwide
According to research, global IT spending will shrink by 5.5% to $3.5 trillion in 2015, as a strong U.S.
dollar pressures vendors, CIOs delay hardware upgrades and companies embrace more software-as-a-
service offerings. In constant-currency terms, the IT market is projected to grow 2.5% this year.
The strong dollar may cause some vendors to raise prices in order to protect their margins. While CIOs
are not noticeably cutting budgets, higher prices might lead companies to buy from local vendors or
purchase cheaper hardware.
Global spending on devices is expected to bring in $654 billion this year (2015), down from $693 billion
last year (2014). Mobile phones lead the pack, boosted by Apple Inc. smartphone sales in China. Going
forward, it is predicted that smartphone unit growth will start to flatten.
PC and tablet sales continue to weaken, and companies in areas hit by currency moves and higher PC
prices have delayed purchases more than expected. Western Europe, for example, still has extra PC
inventory to clear, which could delay Windows 10 inventory.
Enterprise software spending is expected to fall 1.2% to $310 billion this year, from $314 billion in 2014.
Software-as-a-Service providers may opt not to raise prices in order to retain market share in a
competitive environment.
The data centre systems market, which includes storage and network markets among others, is
expected to dip 3.8% this year. One bright spot is the server market, where companies are spending
more on mainframe updates and hyperscale servers used to support large data centres.
PTL HOLDINGS PLC FINANCIAL ANALYSIS SUMMARY 8
IT sector in Malta
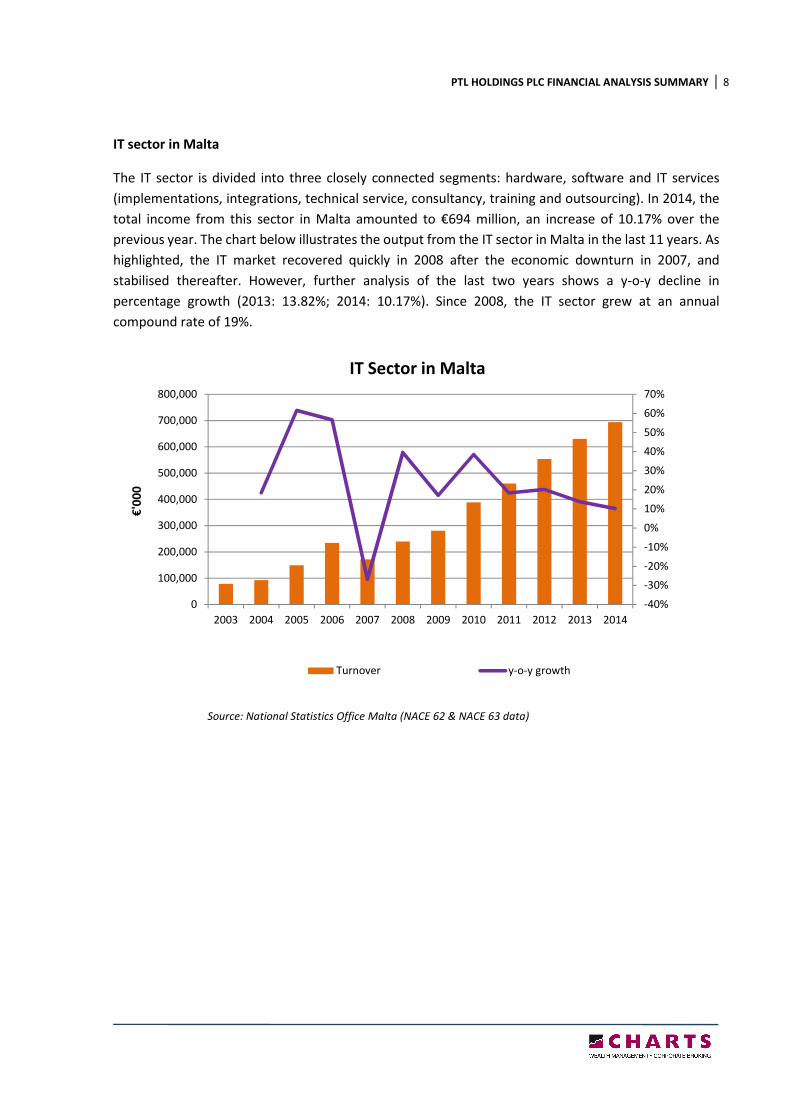
The IT sector is divided into three closely connected segments: hardware, software and IT services
(implementations, integrations, technical service, consultancy, training and outsourcing). In 2014, the
total income from this sector in Malta amounted to €694 million, an increase of 10.17% over the
previous year. The chart below illustrates the output from the IT sector in Malta in the last 11 years. As
highlighted, the IT market recovered quickly in 2008 after the economic downturn in 2007, and
stabilised thereafter. However, further analysis of the last two years shows a y-o-y decline in
percentage growth (2013: 13.82%; 2014: 10.17%). Since 2008, the IT sector grew at an annual
compound rate of 19%.
Source: National Statistics Office Malta (NACE 62 & NACE 63 data)
-40%
-30%
-20%
-10%
0%
10%
20%
30%
40%
50%
60%
70%
0
100,000
200,000
300,000
400,000
500,000
600,000
700,000
800,000
2003 2004 2005 2006 2007 2008 2009 2010 2011 2012 2013 2014
€'0
00
IT Sector in Malta
Turnover y-o-y growth
PTL HOLDINGS PLC FINANCIAL ANALYSIS SUMMARY 9
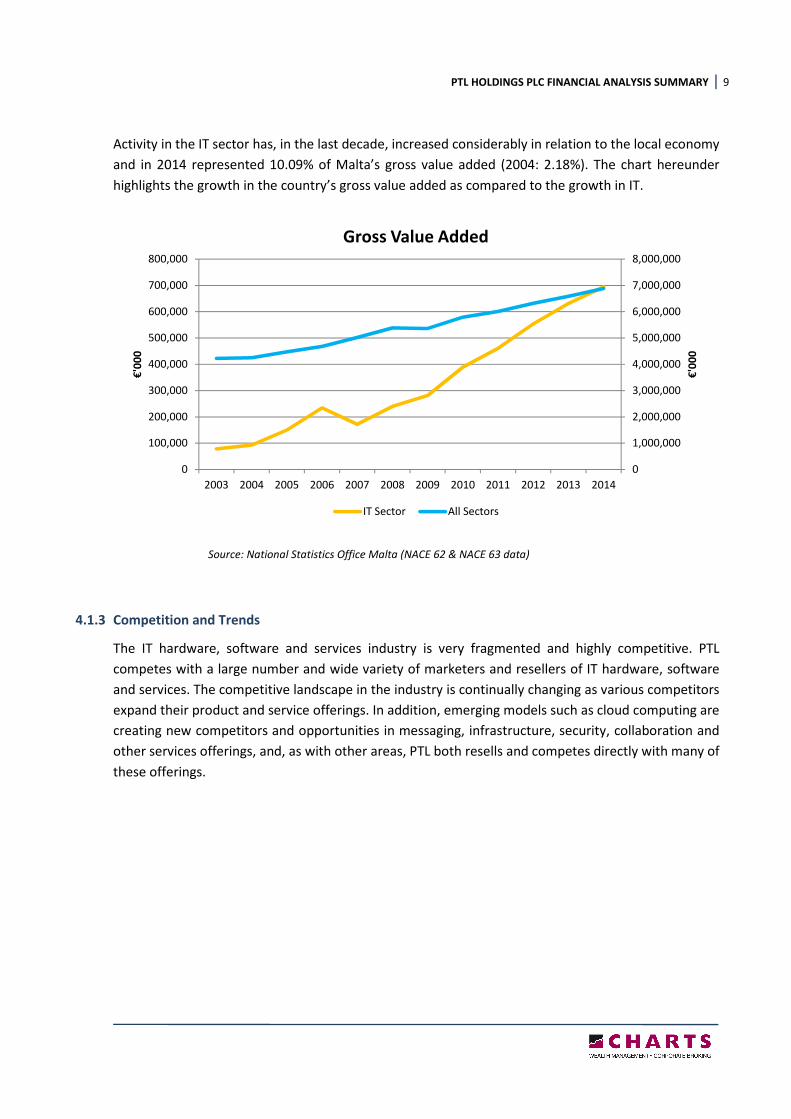
Activity in the IT sector has, in the last decade, increased considerably in relation to the local economy
and in 2014 represented 10.09% of Malta’s gross value added (2004: 2.18%). The chart hereunder
highlights the growth in the country’s gross value added as compared to the growth in IT.
Source: National Statistics Office Malta (NACE 62 & NACE 63 data)
4.1.3 Competition and Trends
The IT hardware, software and services industry is very fragmented and highly competitive. PTL
competes with a large number and wide variety of marketers and resellers of IT hardware, software
and services. The competitive landscape in the industry is continually changing as various competitors
expand their product and service offerings. In addition, emerging models such as cloud computing are
creating new competitors and opportunities in messaging, infrastructure, security, collaboration and
other services offerings, and, as with other areas, PTL both resells and competes directly with many of
these offerings.
0
1,000,000
2,000,000
3,000,000
4,000,000
5,000,000
6,000,000
7,000,000
8,000,000
0
100,000
200,000
300,000
400,000
500,000
600,000
700,000
800,000
2003 2004 2005 2006 2007 2008 2009 2010 2011 2012 2013 2014
€'0
00
€'0
00
Gross Value Added
IT Sector All Sectors
PTL HOLDINGS PLC FINANCIAL ANALYSIS SUMMARY 10
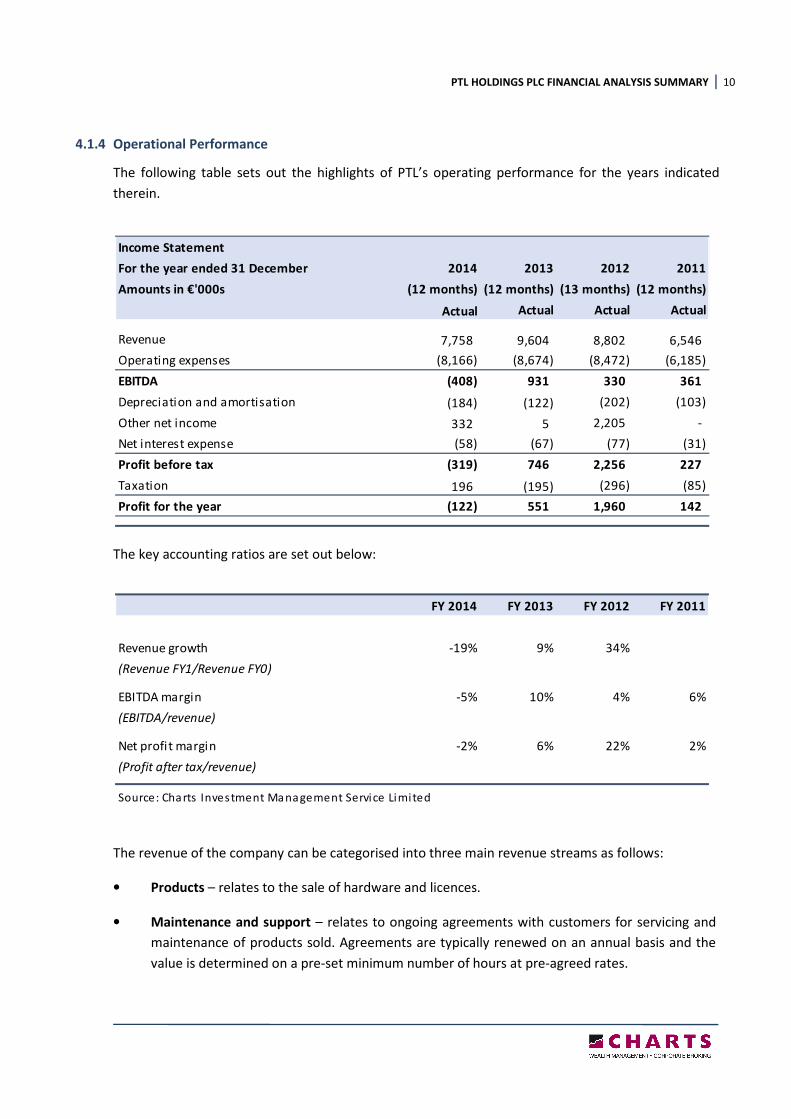
4.1.4 Operational Performance
The following table sets out the highlights of PTL’s operating performance for the years indicated
therein.
The key accounting ratios are set out below:
The revenue of the company can be categorised into three main revenue streams as follows:
• Products – relates to the sale of hardware and licences.
• Maintenance and support – relates to ongoing agreements with customers for servicing and
maintenance of products sold. Agreements are typically renewed on an annual basis and the
value is determined on a pre-set minimum number of hours at pre-agreed rates.
Income Statement
For the year ended 31 December 2014 2013 2012 2011
Amounts in €'000s (12 months) (12 months) (13 months) (12 months)
Actual Actual Actual Actual
Revenue 7,758 9,604 8,802 6,546
Operating expenses (8,166) (8,674) (8,472) (6,185)
EBITDA (408) 931 330 361
Depreciation and amortisation (184) (122) (202) (103)
Other net income 332 5 2,205 -
Net interest expense (58) (67) (77) (31)
Profit before tax (319) 746 2,256 227
Taxation 196 (195) (296) (85)
Profit for the year (122) 551 1,960 142
FY 2014 FY 2013 FY 2012 FY 2011
Revenue growth -19% 9% 34%
(Revenue FY1/Revenue FY0)
EBITDA margin -5% 10% 4% 6%
(EBITDA/revenue)
Net profit margin -2% 6% 22% 2%
(Profit after tax/revenue)
Source: Charts Investment Management Service Limited
PTL HOLDINGS PLC FINANCIAL ANALYSIS SUMMARY 11
• Services – this revenue stream encompasses all other services provided outside of the standard
service and maintenance agreements.
A segmental analysis of revenue for the four financial years ended 31 December 2011 to 31 December
2014 is provided below:
The company was acquired in FY2012 by the Hili group by way of the transfer of PTL’s issued ordinary
shares. As a result the financial year end was changed to match that of the Group from 30 November
to 31 December. During the year ended 31 December 2012, the company disposed of immovable
property and recorded a gain of €2.2 million.
Revenue for the year ended 31 December 2013 amounted to €9.6 million, an increase of 9% from the
previous year and which followed an increase of 34% from FY2011. In FY2013, 18% of revenue was
generated from clients located in the Middle East which operate in the retail sector. In addition, 5% of
turnover was derived from the sale of ATMs to banks in Libya. In relation to the business in Malta, PTL
has in the last years experienced a general decline in large scale IT projects locally, which are normally
driven by the public sector and the banking industry.
For the year ended 31 December 2014, PTL generated €7.8 million in revenue, a decrease of circa 19%
over the preceding year. This is mainly due to a reduction in revenue from the Middle East and Libya.
In 2014, PTL discontinued its relationship with a solutions supplier for the retail sector in the Middle
East which has adversely impacted revenue. Compared to FY2013, the revenue generated from the
services segment registered a decline of -29% (-€575,000), a reduction of -18% in the maintenance and
support segment (-€581,000) and a decrease of -16% in the products market (-€690,000). In 2014, PTL
managed to reduce its operating expenses over the previous year by €507,000 to circa €8.2 million.
This situation resulted PTL to report a negative EBITDA of €408,000, resulting in a -5% EBITDA margin.
In 2014, other income increased by circa €327,000, from €5,000 in 2013 to €332,000 in 2014. This
substantial increase was mainly due to sale of intangible assets to a related party in the form of
intellectual property rights and trademarks.
After taking into account a tax credit of €196,000, PTL registered a total loss for the year being reviewed
of circa €122,000.
Revenue by segment 2014 2013 2012 2011
Amounts in €'000s (12 months) (12 months) (13 months) (12 months)
Actual Actual Actual Actual
Products 3,707 4,397 3,947 1,876
Maintenance and support 2,637 3,219 2,973 2,569
Services 1,413 1,989 1,882 2,101
Total revenue 7,758 9,604 8,802 6,546
PTL HOLDINGS PLC FINANCIAL ANALYSIS SUMMARY 12
4.2 SAD
4.2.1 Business Overview
SAD is Poland’s largest Apple retailer and operates 23 stores under the iSpot brand, together with a
well-developed online proposition. As an Apple Premium Reseller and Apple Authorised Service
Provider, SAD outlets carry a full range of Apple products, including software and accessories, and
through its trained staff also offer support and repair services to customers regardless of where they
originally purchased the Apple product. In addition to Apple solutions, iSpot stores offer an extensive
range of third-party products and software.
SAD is also involved in turnkey solutions for government agencies and business customers, and its
services comprise the design and construction of networks, data security, and the supply of hardware
and software. Moreover, as a certified Apple Authorised Training Centre, SAD has since incorporation
participated in numerous projects relating to the implementation of Apple technology in higher
education, has equipped more than 2,000 school technology labs and provided training to circa 8,500
teachers on information technology.
An important part of SAD’s business is its involvement in the audio-video market, streaming and TV
broadcasting. In this niche market, SAD provides TV stations, production companies, content owners
and broadcasters with innovative technology and integration solutions to enable the production of live,
enriched video programming. SAD’s clients comprise most of the major TV stations in Poland, including
TVN, TVP and Polsat.
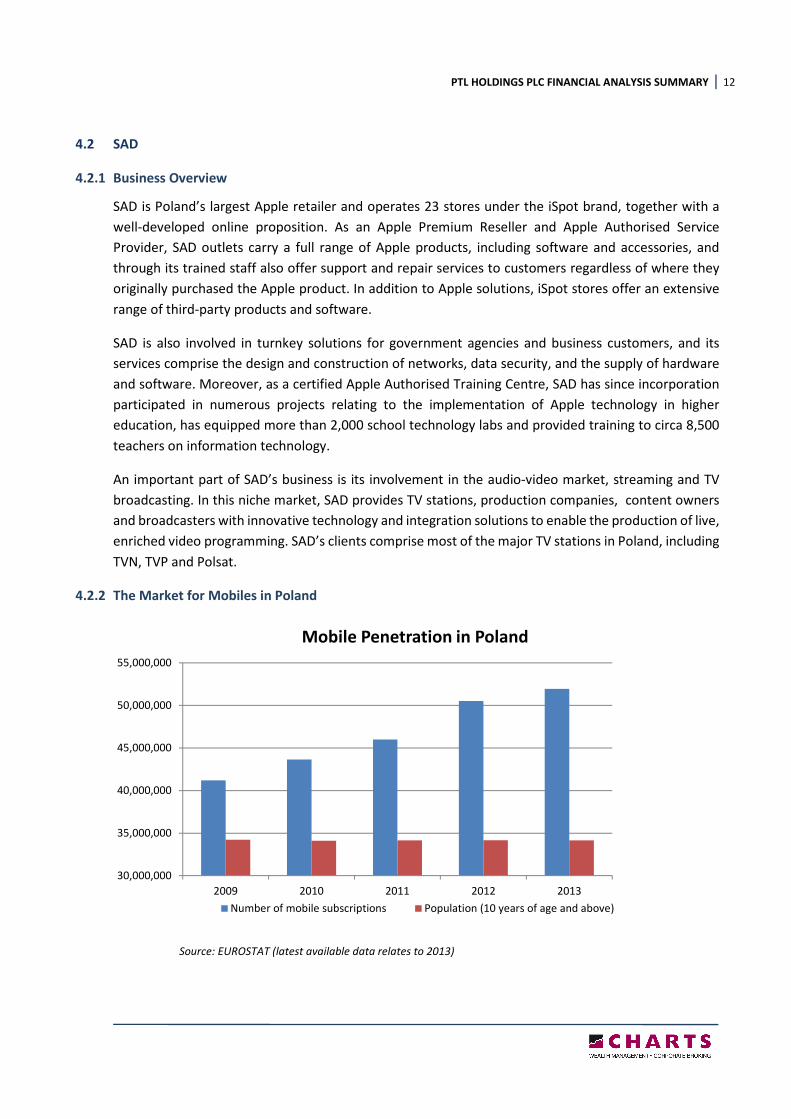
4.2.2 The Market for Mobiles in Poland
Source: EUROSTAT (latest available data relates to 2013)
30,000,000
35,000,000
40,000,000
45,000,000
50,000,000
55,000,000
2009 2010 2011 2012 2013
Mobile Penetration in Poland
Number of mobile subscriptions Population (10 years of age and above)
PTL HOLDINGS PLC FINANCIAL ANALYSIS SUMMARY 13
Poland’s mobile market is benefitting from continued investments in LTE (Long Term Evolution – 4G)
networks. By the beginning of 2015, mobile penetration was about 152%, among the highest levels in
the region and reflecting the popularity among consumers for keeping two or more SIM cards. With
about 58 million subscribers, the market has room for 26 licensed operators, including 19 MVNOs
(Mobile Virtual Network operators). The relatively high number of network operators is indicative of
market consolidation in coming years, as has been seen in other European markets. ARPU (Average
Revenue per User) has stabilised after falling in recent years as a result of retail tariff competition,
regulatory mandated reductions in mobile termination rates and the take-up of mobile services by
lower spending consumer segments of the market. 4G networks have been launched and coverage is
expected to improve markedly following the anticipated multi-spectrum auction, delivering improved
mobile broadband services nationally within three years.
2014 was the second year in which sales of smartphones outperformed sales of feature phones. In
2014, the disproportion between these two was even bigger than in 2013 - smartphones accounted for
70% share of all mobile phones’ volume sales. Penetration rate (percentage of households) of
smartphones rose to 60% and is now higher than the penetration rate of feature phones which dropped
to 50%. Smartphones has become a mainstream device, available in all price ranges offered by both
international and local manufacturers. Mobile marketing, mobile banking and even mobile payments
are increasingly common phenomenon in Poland with smartphones becoming an inherent device for
the vast proportion of Polish consumers.
Samsung led volume sales of smartphones in Poland with 44% retail volume share in 2013 (latest data
available). Due to globally acclaimed models like Galaxy and Note, aggressive marketing in Poland and
wide portfolio of products (which is especially important in Poland where cheaper smartphones are
fairly popular) Samsung became the leading smartphone brand in Poland in 2012. Samsung is also quite
popular in feature phones holding 31% retail volume share in 2013. However, Nokia continued to be
the most popular brand in feature phones with 47% retail volume share. Feature phones can be widely
identified with the Nokia brand which for years was the uncontested leader of mobile phone sales in
Poland. With respect to Apple, an estimated 4% of smart phone users were on the iOS platform in
Poland in 2013, though that number has been steadily growing. Such results re-confirm the fact that
Poles are very price conscious when it comes to choosing smart phones and tablets, and thus prefer
lower-end Android phones.
Retail volume sales of mobile phones are expected to experience moderate growth with a CAGR of 2%
over the forecast period. The main factors fuelling sales of mobile phones will be the general increase
in the number of mobile phones per capita in Poland and rapid hike in penetration rate of smartphones.
The number of landlines is diminishing quickly since more and more of Poles are choosing mobile
phones over traditional lines. An increasing number of elderly people and small children will be using
mobile phones in the future.
PTL HOLDINGS PLC FINANCIAL ANALYSIS SUMMARY 14
4.2.3 Competition and Trends
The market in Poland for Apple products and services is highly competitive. As with other developed
markets, the market is characterised by frequent product introductions and rapid technological
advances that have substantially increased the capabilities and use of mobile communication and
media devices, personal computers, and other digital electronic devices. SAD competes with other
resellers of Apple products and services, and therefore the main competing factors are not price or
quality of products, but location of stores, quality of service provided and share of the business-to-
business market. SAD’s other competitors, who sell mobile devices and personal computers based on
other operating systems, typically undertake aggressive price cuts and lower their product margins to
gain or maintain market share.
SAD is highly dependent on Apple to continuously introduce new and improved products and services
ahead of competitors so as to maintain high demand for Apple offerings. Principal competitive factors
important to SAD include price, product features, relative price/performance, product quality and
reliability, design innovation, a strong third-party software and peripherals ecosystem, marketing and
reselling capability, service and support, and corporate reputation.
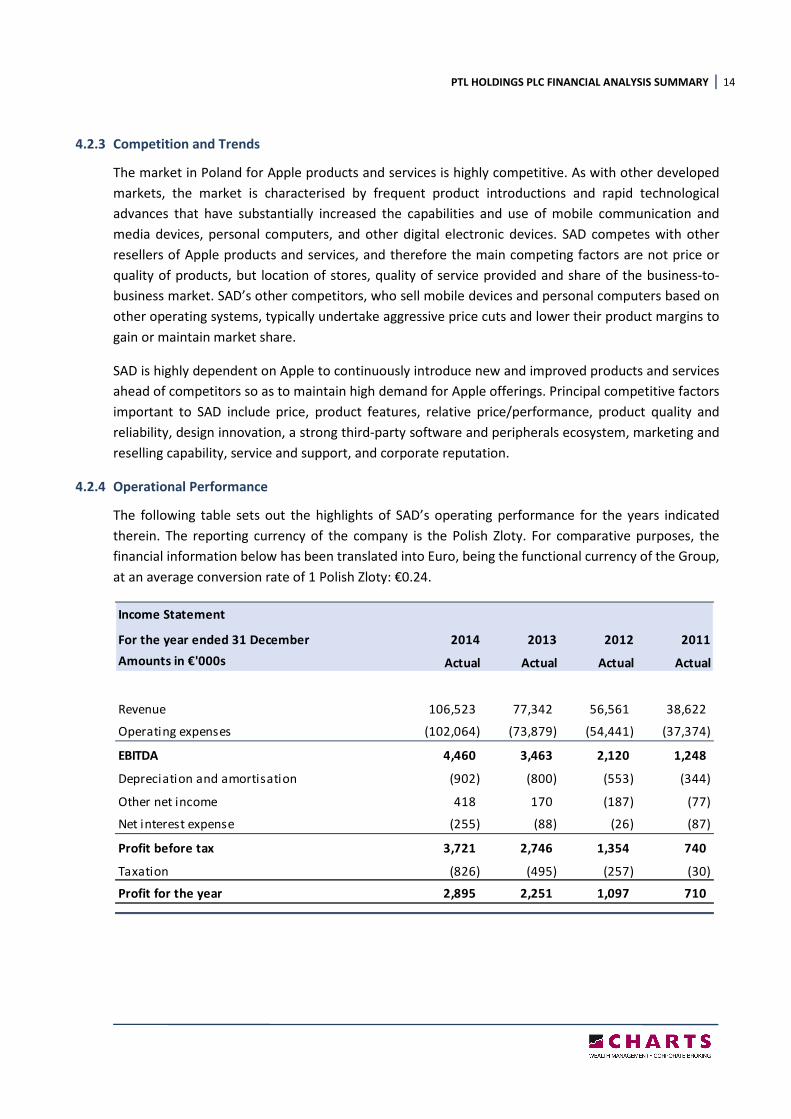
4.2.4 Operational Performance
The following table sets out the highlights of SAD’s operating performance for the years indicated
therein. The reporting currency of the company is the Polish Zloty. For comparative purposes, the
financial information below has been translated into Euro, being the functional currency of the Group,
at an average conversion rate of 1 Polish Zloty: €0.24.
Income Statement
For the year ended 31 December 2014 2013 2012 2011
Amounts in €'000s Actual Actual Actual Actual
Revenue 106,523 77,342 56,561 38,622
Operating expenses (102,064) (73,879) (54,441) (37,374)
EBITDA 4,460 3,463 2,120 1,248
Depreciation and amortisation (902) (800) (553) (344)
Other net income 418 170 (187) (77)
Net interest expense (255) (88) (26) (87)
Profit before tax 3,721 2,746 1,354 740
Taxation (826) (495) (257) (30)
Profit for the year 2,895 2,251 1,097 710
PTL HOLDINGS PLC FINANCIAL ANALYSIS SUMMARY 15
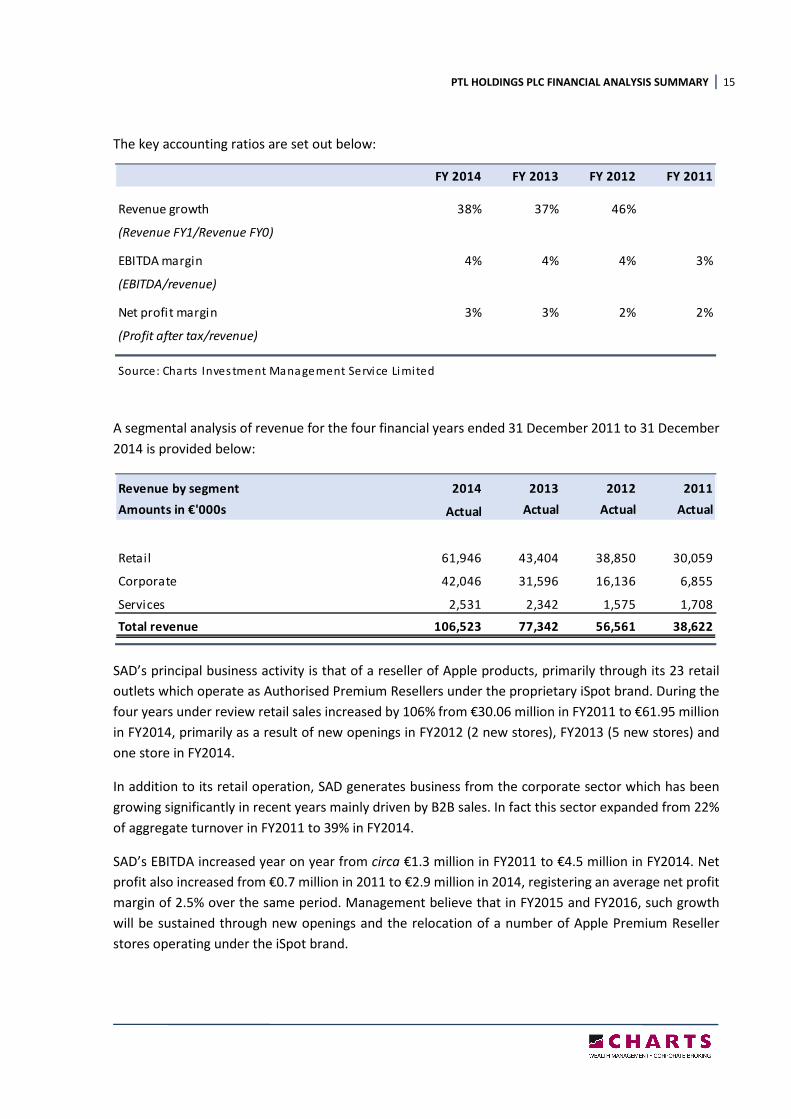
The key accounting ratios are set out below:
A segmental analysis of revenue for the four financial years ended 31 December 2011 to 31 December
2014 is provided below:
SAD’s principal business activity is that of a reseller of Apple products, primarily through its 23 retail
outlets which operate as Authorised Premium Resellers under the proprietary iSpot brand. During the
four years under review retail sales increased by 106% from €30.06 million in FY2011 to €61.95 million
in FY2014, primarily as a result of new openings in FY2012 (2 new stores), FY2013 (5 new stores) and
one store in FY2014.
In addition to its retail operation, SAD generates business from the corporate sector which has been
growing significantly in recent years mainly driven by B2B sales. In fact this sector expanded from 22%
of aggregate turnover in FY2011 to 39% in FY2014.
SAD’s EBITDA increased year on year from circa €1.3 million in FY2011 to €4.5 million in FY2014. Net
profit also increased from €0.7 million in 2011 to €2.9 million in 2014, registering an average net profit
margin of 2.5% over the same period. Management believe that in FY2015 and FY2016, such growth
will be sustained through new openings and the relocation of a number of Apple Premium Reseller
stores operating under the iSpot brand.
FY 2014 FY 2013 FY 2012 FY 2011
Revenue growth 38% 37% 46%
(Revenue FY1/Revenue FY0)
EBITDA margin 4% 4% 4% 3%
(EBITDA/revenue)
Net profit margin 3% 3% 2% 2%
(Profit after tax/revenue)
Source: Charts Investment Management Service Limited
Revenue by segment 2014 2013 2012 2011
Amounts in €'000s Actual Actual Actual Actual
Retail 61,946 43,404 38,850 30,059
Corporate 42,046 31,596 16,136 6,855
Services 2,531 2,342 1,575 1,708
Total revenue 106,523 77,342 56,561 38,622
PTL HOLDINGS PLC FINANCIAL ANALYSIS SUMMARY 16
4.3 APCO
4.3.1 Business Overview
APCO is a provider of electronic payments transaction processing services for retailers and internet-
based merchants and operates under the brand name ‘APCOPAY’. In addition, APCO is a supplier of
ATMs (Wincor Nixdorf), point-of-sale terminals, plastic cards, deposit machines, currency exchanges,
automotive fuel payment systems and other cash-handling equipment.
The primary business model of APCO is to enable merchants that are APCO clients to accept a variety
of card and electronic-based payments at the point of sale. The term “merchant” generally refers to
any entity that accepts credit or debit cards for the payment of goods and services. APCO sells its
products and services through multiple sales channels in Malta and internationally, and targets
customers in many vertical markets.
Card-based payment forms consist of credit, debit, vouchers and prepaid cards. Credit and debit card
transaction processing includes the processing of major international card brands such as MasterCard
and Visa, as well as other debit networks. Electronic payment processing involves a consumer or
cardholder acquiring goods or services from a merchant and using a credit or debit card or other
electronic method as the form of payment. APCO is the processing intermediary between the
merchant, the credit and debit networks and the financial institutions that issue cards. APCO’s offerings
include terminal sales and deployment, front-end authorisation processing, settlement and funding
processing, full customer support, industry compliance with PCI-DSS (Payment Card Industry Data
Security Standards), consolidated billing and statements, and online reporting. APCO’s value
proposition is to provide high quality, responsive, secure and full end-to-end service to all its customers.
The majority of merchant services revenue is generated on services priced as a percentage of
transaction value or a specified fee per transaction, depending on card type. APCO also charges fees
based on specific services that are unrelated to the number of transactions or the transaction value.
4.3.2 The E-payments and M-payments Market
E-payments are defined as digital payments that are made over the internet for e-commerce activities.
The largest segment of e-payments is the consumer-to-business (C2B) payments, which are used
mainly for goods purchased in online stores, and are being driven by the fast growing global e-
commerce market. Consumers are likely to increasingly opt for online stores that provide more
convenience and a broader selection of products at prices regarded as competitive. Moreover, in order
to drive sales, e-commerce businesses are increasingly offering personalised services and loyalty
programs to frequent customers.
M-payments are defined as a form of payment where the mobile phone is used as a payment method
– not just as an alternative channel to send the payment instruction – and the payment information
flow takes place in real time. Such payments occur across applications such as: (i) Peer-to-peer (P2P) –
as domestic money transfers or international remittances; and (ii) Consumer-to-business (C2B) – as
retail payments at stores, mobile online payments such as those made on eBay or to purchase
PTL HOLDINGS PLC FINANCIAL ANALYSIS SUMMARY 17
ringtones. It should be noted that these payments are not made using the browser on the mobile, but
by using the payment application built for the mobile.
It is estimated that there were 345.7 billion non-cash transactions in 2013, and the number is expected
to rise to 411.2 billion by 2017. Cheques continue their downward cycle, and debit cards are
consolidating their position as second only to cash. Debit cards are by far the most popular payment
type and their numbers are increasing. The increased popularity of e-commerce is a factor pushing up
these figures. This growth is also being driven by competitor products, such as Apple Pay or PayPal,
since such transactions are actually initiated through debit card transactions.
Furthermore, non-cash transactions in emerging markets are growing at an exceptional pace. For
example, the BRIC countries alone accounted for nearly 15% of all growth in volume between 2012 and
2013.
Three forces are helping drive growth in mobile and electronic payments transactions – increased
penetration of smart phones and internet usage, advances in technology, and innovative products and
services. Industry expectations are that m-payment transactions will have grown 58.5% annually to
28.9 billion transactions in 2014; and e-payments, as demonstrated by trends in e-commerce, are
expected to have grown by 18.1% yearly in the same period to a total of 34.8 billion transactions. This
growth is making the area an attractive one for banks and non-banks.
4.3.3 Competition and Trends
APCO believes that electronic transactions will expand further in the future and that an increasing
percentage of these transactions will be processed through emerging technologies. Competitors are
continually offering innovative products and enhanced services, such as products that support smart
phones that contain mobile wallet software. As mobile payments continue to evolve and are desired
by merchants and consumers, APCO will continue to develop new products and services that will
leverage the benefits that these new technologies can offer customers. In addition, it is expected that
new markets will develop in areas that have been previously dominated by paper-based transactions.
Industries such as e-commerce, government, recurring payments and business-to-business should
continue to see transaction volumes migrate to more electronic-based settlement solutions. As a result,
the continued development of new products and services and the emergence of new vertical markets
will provide opportunities for APCO to expand its business in the years to come.
4.3.4 Operational Performance
APCO Limited
APCO Limited is engaged in the importation of office and banking equipment and the provision of
payment services. The following table sets out the operating performance highlights of APCO Limited
for the years indicated therein.
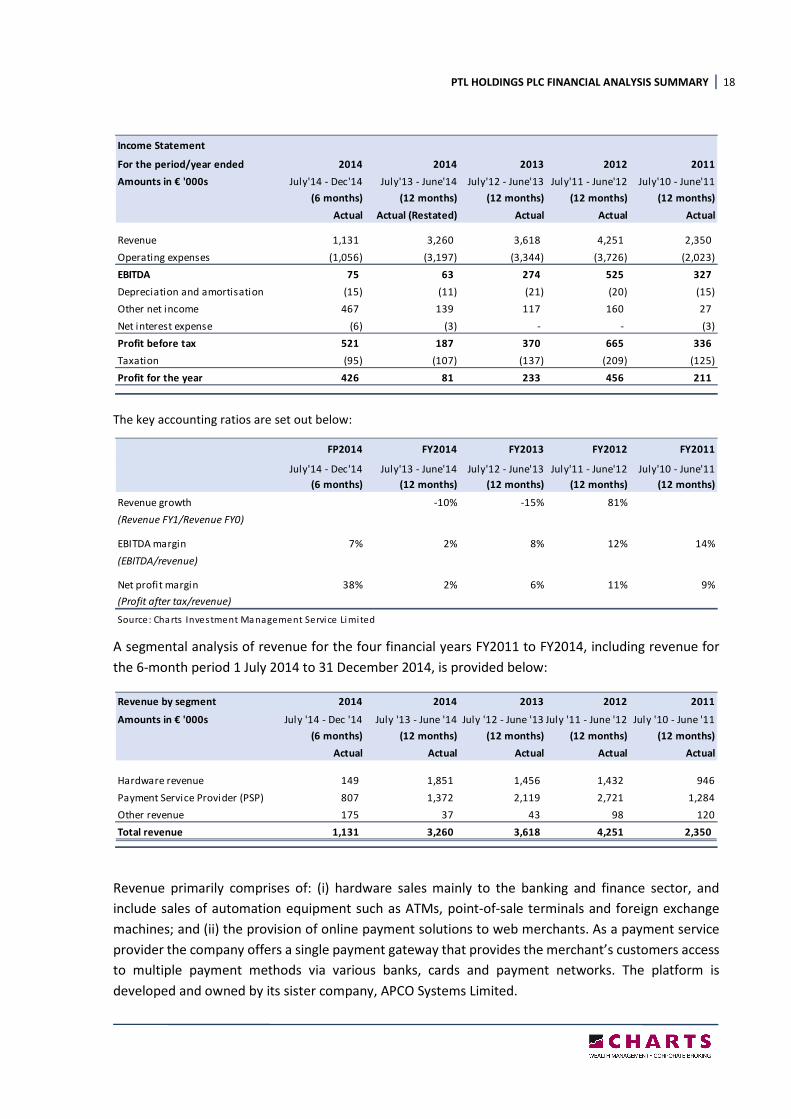
PTL HOLDINGS PLC FINANCIAL ANALYSIS SUMMARY 18
The key accounting ratios are set out below:
A segmental analysis of revenue for the four financial years FY2011 to FY2014, including revenue for
the 6-month period 1 July 2014 to 31 December 2014, is provided below:
Revenue primarily comprises of: (i) hardware sales mainly to the banking and finance sector, and
include sales of automation equipment such as ATMs, point-of-sale terminals and foreign exchange
machines; and (ii) the provision of online payment solutions to web merchants. As a payment service
provider the company offers a single payment gateway that provides the merchant’s customers access
to multiple payment methods via various banks, cards and payment networks. The platform is
developed and owned by its sister company, APCO Systems Limited.
Income Statement
For the period/year ended 2014 2014 2013 2012 2011
Amounts in € '000s July'14 - Dec'14 July'13 - June'14 July'12 - June'13 July'11 - June'12 July'10 - June'11
(6 months) (12 months) (12 months) (12 months) (12 months)
Actual Actual (Restated) Actual Actual Actual
Revenue 1,131 3,260 3,618 4,251 2,350
Operating expenses (1,056) (3,197) (3,344) (3,726) (2,023)
EBITDA 75 63 274 525 327
Depreciation and amortisation (15) (11) (21) (20) (15)
Other net income 467 139 117 160 27
Net interest expense (6) (3) - - (3)
Profit before tax 521 187 370 665 336
Taxation (95) (107) (137) (209) (125)
Profit for the year 426 81 233 456 211
FP2014 FY2014 FY2013 FY2012 FY2011
July'14 - Dec'14 July'13 - June'14 July'12 - June'13 July'11 - June'12 July'10 - June'11
(6 months) (12 months) (12 months) (12 months) (12 months)
Revenue growth -10% -15% 81%
(Revenue FY1/Revenue FY0)
EBITDA margin 7% 2% 8% 12% 14%
(EBITDA/revenue)
Net profit margin 38% 2% 6% 11% 9%
(Profit after tax/revenue)
Source: Charts Investment Management Service Limited
Revenue by segment 2014 2014 2013 2012 2011
Amounts in € '000s July '14 - Dec '14 July '13 - June '14 July '12 - June '13 July '11 - June '12 July '10 - June '11
(6 months) (12 months) (12 months) (12 months) (12 months)
Actual Actual Actual Actual Actual
Hardware revenue 149 1,851 1,456 1,432 946
Payment Service Provider (PSP) 807 1,372 2,119 2,721 1,284
Other revenue 175 37 43 98 120
Total revenue 1,131 3,260 3,618 4,251 2,350
PTL HOLDINGS PLC FINANCIAL ANALYSIS SUMMARY 19
Income increased significantly in FY2012 by €1.90 million (FY2011: €2.35 million) mainly due to growth
in the payment solutions sector. During the said year, the company experienced an increase in the
number of new merchants and a corresponding increase in the processing of payments. However, most
of these merchants terminated the service in FY2013 and as a result revenue in FY2013 was lower than
the preceding financial year. Further to the above event, management resolved to better evaluate
prospective merchants and initiate business relationships only with more established and stable
merchants.
Revenue registered in June 2014 was 10% lower than in the preceding year, principally as a result of a
35% decrease in the revenue generated through the provision of online services (FY2014: €1.37
million). This decrease was partly offset with an increase of 27% in hardware sales and a 4% reduction
in operating expense. As a result, EBITDA margin decreased from 8% in FY2013 to 2% in FY2014. Profit
for the financial year ended 30 June 2014 declined by €152,000 from €233,000 (in FY2013) to €81,000.
Revenue generated from the provision of payment services is highly volatile partly due to seasonality
factors that affect the business activities of APCO’s clients. A portion of its customer base operates in
the gaming industry and as a result the number of major sports events has a material impact on the
volume of transactions and achieved revenue. In FY2013, apart from the exceptional movement in
merchant accounts described above, the lack of major sports events in the summer months also
contributed to lower income for the year. As for FY2014, the company experienced a general decrease
in transactions volume during the year which adversely impacted revenue from services.
During FY2015, part of APCO’s business has been integrated with PTL to create synergies, industry focus
and cost efficiencies. In fact, through this integration, PTL and APCO were awarded a number of
projects in the public and private sector, some of which are considered by management to be of a
complex nature.
Change in accounting year end
In September 2014, the company changed its financial year end from 30 June to 31 December.
Consequently, the Income Statement being presented in this Financial Analysis Summary includes the
financial results for a period of 6 months ending 31 December 2014. The profit before tax increased
from circa €81,000 on 30 June 2014 to circa €426,000 on 31 December 2014. This substantial increase
resulted from the gain on disposal made from the sale of immovable property amounting to circa
€325,000.
PTL HOLDINGS PLC FINANCIAL ANALYSIS SUMMARY 20
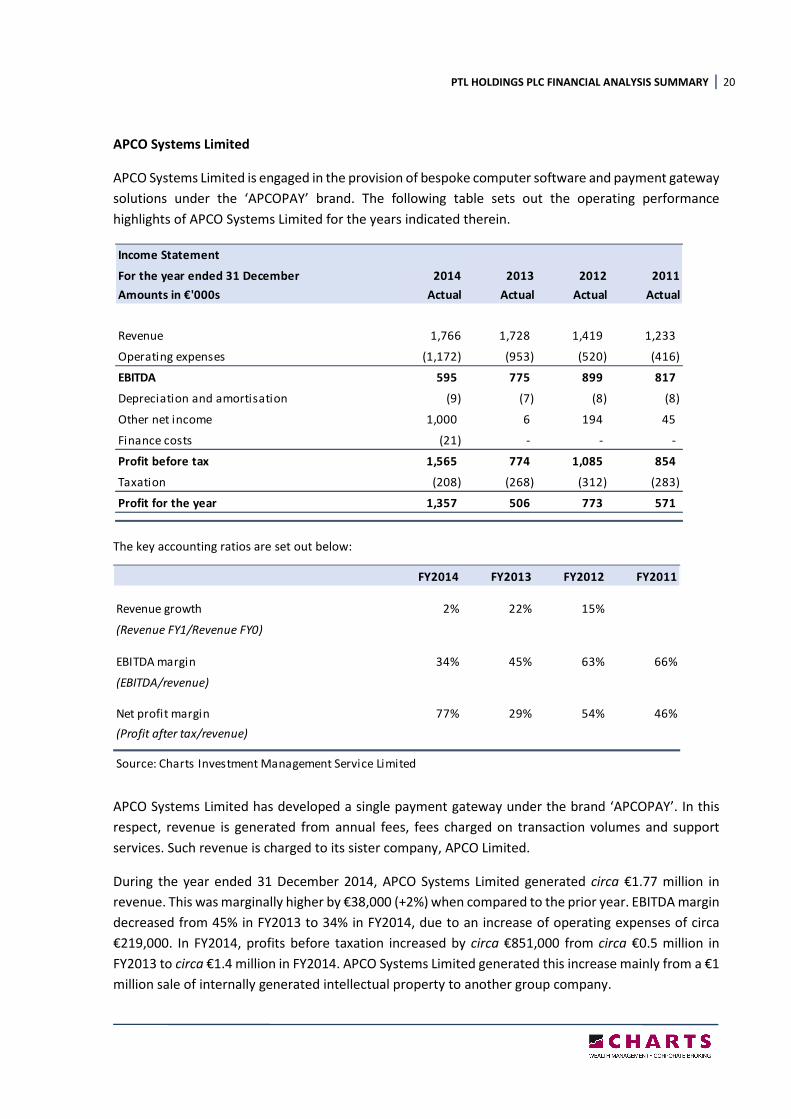
APCO Systems Limited
APCO Systems Limited is engaged in the provision of bespoke computer software and payment gateway
solutions under the ‘APCOPAY’ brand. The following table sets out the operating performance
highlights of APCO Systems Limited for the years indicated therein.
The key accounting ratios are set out below:
APCO Systems Limited has developed a single payment gateway under the brand ‘APCOPAY’. In this
respect, revenue is generated from annual fees, fees charged on transaction volumes and support
services. Such revenue is charged to its sister company, APCO Limited.
During the year ended 31 December 2014, APCO Systems Limited generated circa €1.77 million in
revenue. This was marginally higher by €38,000 (+2%) when compared to the prior year. EBITDA margin
decreased from 45% in FY2013 to 34% in FY2014, due to an increase of operating expenses of circa
€219,000. In FY2014, profits before taxation increased by circa €851,000 from circa €0.5 million in
FY2013 to circa €1.4 million in FY2014. APCO Systems Limited generated this increase mainly from a €1
million sale of internally generated intellectual property to another group company.
Income Statement
For the year ended 31 December 2014 2013 2012 2011
Amounts in €'000s Actual Actual Actual Actual
Revenue 1,766 1,728 1,419 1,233
Operating expenses (1,172) (953) (520) (416)
EBITDA 595 775 899 817
Depreciation and amortisation (9) (7) (8) (8)
Other net income 1,000 6 194 45
Finance costs (21) - - -
Profit before tax 1,565 774 1,085 854
Taxation (208) (268) (312) (283)
Profit for the year 1,357 506 773 571
FY2014 FY2013 FY2012 FY2011
Revenue growth 2% 22% 15%
(Revenue FY1/Revenue FY0)
EBITDA margin 34% 45% 63% 66%
(EBITDA/revenue)
Net profit margin 77% 29% 54% 46%
(Profit after tax/revenue)
Source: Charts Investment Management Service Limited
PTL HOLDINGS PLC FINANCIAL ANALYSIS SUMMARY 21
For FY2015 and FY2016, management believes that the e-commerce business will continue to grow
globally, thereby leading to an increase in demand for the platform being operated by APCO System
Limited. Management acknowledges that whilst the demand is increasing, the financial industry is
imposing stricter regulations and imposing due diligences, thereby reducing the risk appetite to operate
in certain industries which are considered to have higher risk when it comes to charge backs and/or
reputational risks. In this respect, in FY2015, management has embarked on a number of initiatives
that balance between the level of volatility within the markets and industries that use APCO’s platform.
This was felt necessary by management to build stronger foundations and thereby increasing the level
of stability of future growth.
5. BUSINESS DEVELOPMENT STRATEGY
The key elements of the Group’s strategy are:
The Group’s vision is to be the trusted advisor to its clients, helping them enhance their business
performance through innovative technology solutions. The Group’s value is its ability to guide, advise,
implement and manage IT solutions for its clients, and the strategy is to grow profitable market share
by delivering relevant IT solutions to customers on a scalable support and delivery platform. With the
continual emergence of new technologies and technology solutions in the IT industry, management
believes businesses continue to seek technology providers to supply value-added advice to help them
identify and deploy IT solutions, rather than to just supply product selection, price and availability. The
Group believes that it is well positioned in the market and can gain profitable market share and provide
enhanced value to clients.
The Group’s strategy is based on the following objectives:
• Growing the traditional core business faster than market through innovation and additional
products;
• Strengthening the core business through targeted expansion of its range of software solutions
and support services;
• Focusing on increasing penetration of Apple products and services in Poland through the
expansion of Apple stores and further developing business-to-business propositions; and
• Pursue potential acquisitions or investments that have high growth potential.
PTL HOLDINGS PLC FINANCIAL ANALYSIS SUMMARY 22
PART 2
6. COMPANY PERFORMANCE REVIEW
The projected financial statements detailed below relate to events in the future and are based on
assumptions which the Company believes to be reasonable. Consequently, the actual outcome may
be adversely affected by unforeseen situations and the variation between forecast and actual results
may be material.
The Company was registered on 23 December 2013 as a private limited liability company for the
purpose of developing and managing the technology business of Hili Ventures Limited (C 57902), the
parent company of the Issuer. Upon incorporation, the Company acquired a 100% shareholding in PTL
International Limited (C 63276) which was set up on the same day. Subsequently, by virtue of a number
of share transfer instruments the latter company acquired the Group companies highlighted in section
3.1 of this report, other than (i) PTL Company B.V. (28889541) and Ipsyon Limited (C 65394) which
were incorporated after the said transactions; and (ii) SAD and APCO which were acquired from third
parties in 2014. As at 31 December 2013, the principal operating company of the Group was PTL. On
30 June 2014 and 1 August 2014, PTL International Limited acquired SAD and APCO respectively.
6.1 FINANCIAL INFORMATION
The following financial information is extracted from the audited consolidated financial statements of
PTL Holdings p.l.c. (the “Company”) for the financial years ended 31 December 2013 and 2014. The
financial information for the years ending 31 December 2015 and 31 December 2016 has been
provided by Group management.
PTL HOLDINGS PLC FINANCIAL ANALYSIS SUMMARY 23
6.1.1 Group Income Statement
Note: The consolidated figures for 2014 include the results for SAD and APCO from 1 July 2014 and 1 August 2014 respectively.
The key accounting ratios are set out below:
Income Statement
For the year ended 31 December 2016 2015 2014 2013
Amounts in € '000s Projections Projections Actual Actual
Revenue 118,582 143,369 66,669 9,639
Operating expenses (112,249) (137,353) (65,334) (8,707)
EBITDA 6,332 6,016 1,335 931
Depreciation and amortisation (1,140) (921) (800) (123)
Share of profits/(losses) of associates and jointly control led entities - (34) (104) -
Net interest expense (2,491) (2,647) (1,321) (67)
Profit before tax 2,701 2,414 (890) 741
Taxation (718) (508) (108) (198)
Profit for the year 1,983 1,906 (998) 544
FY2016 FY2015 FY2014 FY2013
Operating Profit Margin 5% 4% 2% 10%
(EBITDA/revenue)
Interest Cover (times) 2.5 2.3 1.0 13.9
(EBITDA/net finance cost)
Net profit margin 2% 1% -1% 6%
(Profit after tax/revenue)
Return on equity 31% 26% -16% 17%
(Profit after tax/shareholders’ equity)
Return on capital employed 13% 12% 3% 23%
(Operating profit/total assets less current liabilities)
Return on assets 3% 3% -1% 7%
(Profit after tax/total assets)
Source: Charts Investment Management Service Limited
PTL HOLDINGS PLC FINANCIAL ANALYSIS SUMMARY 24
0
20,000
40,000
60,000
80,000
100,000
120,000
2014 2015 2016
Tu
rno
ve
r (€
' 0
00
)
Revenue by Operating Entity
PTL APCO SAD*
PTL Group Segmental Analysis FY2016 FY2015
(€’000) Projection Projection
Revenue
PTL 11,314 10,776
SAD 104,769 95,417
SAD Exports (Discontinued Operations) - 34,798
APCO 2,497 2,378
Total revenue 118,581 143,369
EBITDA
PTL 1,400 410
SAD 4,363 3,767
SAD Exports (Discontinued Operations) - 1,918
APCO Systems 934 272
Non-operating entities (365) (350)
Total EBITDA 6,332 6,017
EBITDA Margin
PTL 12% 4%
SAD 4% 4%
SAD Exports (Discontinued Operations)
APCO Systems 37% 11%
*The SAD revenue figures for FY2015 excludes €34.8 million of exports
(discontinued operations)
PTL HOLDINGS PLC FINANCIAL ANALYSIS SUMMARY 25
The figures relating to FY2013 in the Income Statement, Balance Sheet and Statement of Cash Flow
do not take into account the acquisition of the two major businesses, these being SAD (acquired in
July 2014) and APCO (acquired in August 2014). FY2015 will be the first year that reflects the annual
results of operations of PTL, SAD and APCO.
In FY2013, the Group generated total revenue of circa €9.6 million, primarily from PTL Limited by
providing IT solutions and security systems. In FY2014, the Group’s revenue increased by €57.1 million
to €66.7 million, mainly due to the SAD acquisition. Management believes that revenue growth at SAD
will be sustained over the coming years through the opening of new iSpot stores, relocating a number
of existing stores to more prominent locations, and selling newly launched Apple products. Up to the
second quarter of 2015, SAD sold electronic goods across a number of European Countries, generating
an additional income of circa €34.8 million. However, due to the recent change in VAT regulations as
well as the risks associated with cross border sales of technology items, management decided not to
pursue any further such opportunities. Therefore, as from Q2 FY2015 till the end of FY2016, the
projected numbers only take into account transactions in Poland through iSpot chain and with other
business customers. In FY2016, it is projected that SAD will generate circa €104.8 million in revenues,
an increase of 9.8% over the previous year (€95.4 million sales generated in Poland). With respect to
Group EBITDA, SAD is expected to generate €5.7 million (including discontinued operations) of the
projected figure of €6.0 million in FY2015.
As to PTL, revenue decreased from €9.6 million in FY2013 to €7.8 million in FY2014 (-€1.8 million). This
is mainly due to a reduction in revenue from the Middle East and Libya. In the former market, PTL
discontinued its relationship with a solutions supplier for the retail sector in FY2014 which has
adversely impacted revenue in FY2014. PTL however plans to remain active in the Middle East through
the launch of alternative products for its retail clients and moreover plans to widen its offerings to win
new customers operating in other sectors. In Libya, PTL sold a number of ATMs to Libyan banks in
FY2013 and in the initial six months of FY2014. Such business operation has however ceased in the
latter half of FY2014 and management is not projecting any further sales from Libya. During FY2015,
part of APCO’s business has been integrated with PTL Limited to create synergies, industry focus and
cost efficiencies. Through this integration, PTL and APCO were awarded a number of projects in the
public and private sector. In FY2015, PTL is projected to generate revenue amounting to €10.8 million
increasing to €11.3 million in FY2016. Management expects growth to be driven through new areas of
and from synergies with APCO.
Regarding the operations of APCO, during FY2015 the company will be investing in a more robust
payment system infrastructure and will be embarking on a number of initiatives that balance the level
of volatility within high-risk markets and industries using APCO’s platform. As a result, APCO is
projecting to have less high return transactions, resulting in €2.4 million in revenue in FY2015 and a
marginal increase of €0.1 million to €2.5 million in FY2016.
On a consolidated basis, the Group registered an interest cover ratio of 1.0x for FY2014, principally
due to exceptional interest costs incurred by the Group in respect of the acquisition of SAD and APCO.
Such ratio is expected to improve to 2.3x in FY2015 and 2.5x in FY2016 due to a substantial
improvement in projected EBITDA. As to the net result for FY2014, the Group incurred a loss after tax
PTL HOLDINGS PLC FINANCIAL ANALYSIS SUMMARY 26
of circa €1 million as a consequence of the inclusion of the aforesaid acquisition costs. The net profit
margin is expected to recover to 1% and 2% in FY2015 and FY2016 respectively.
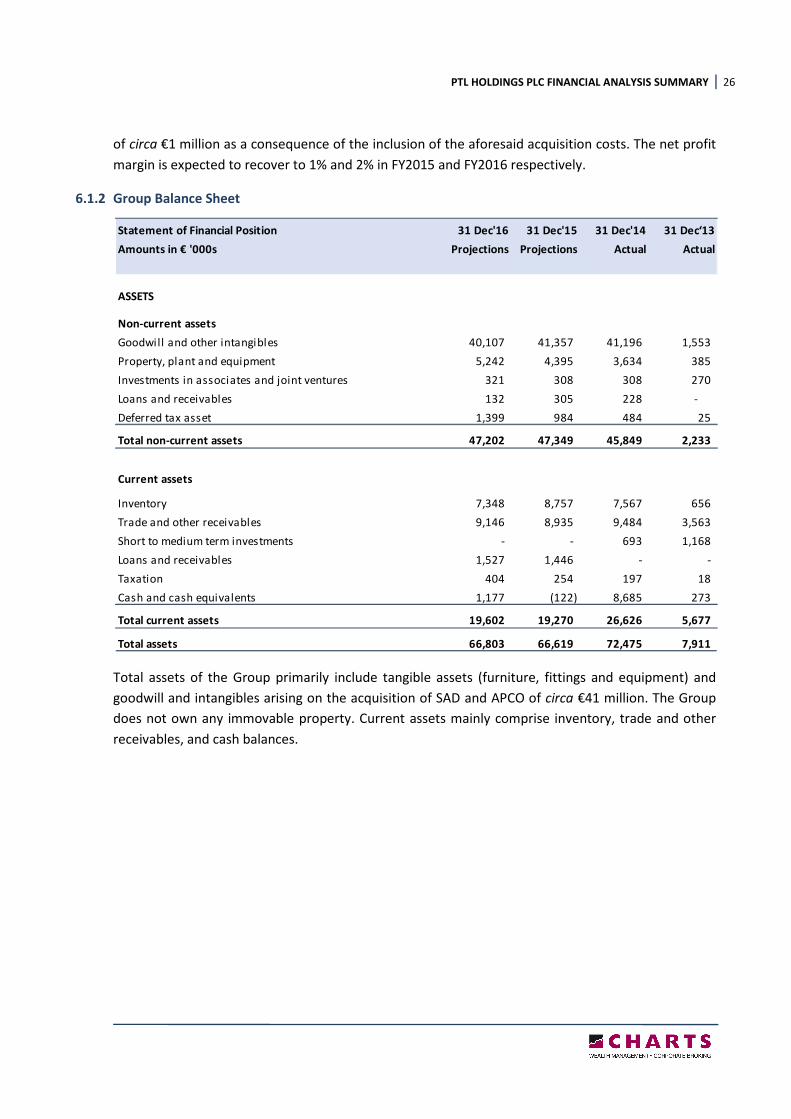
6.1.2 Group Balance Sheet
Total assets of the Group primarily include tangible assets (furniture, fittings and equipment) and
goodwill and intangibles arising on the acquisition of SAD and APCO of circa €41 million. The Group
does not own any immovable property. Current assets mainly comprise inventory, trade and other
receivables, and cash balances.
Statement of Financial Position 31 Dec'16 31 Dec'15 31 Dec'14 31 Dec‘13
Amounts in € '000s Projections Projections Actual Actual
ASSETS
Non-current assets
Goodwill and other intangibles 40,107 41,357 41,196 1,553
Property, plant and equipment 5,242 4,395 3,634 385
Investments in associates and joint ventures 321 308 308 270
Loans and receivables 132 305 228 -
Deferred tax asset 1,399 984 484 25
Total non-current assets 47,202 47,349 45,849 2,233
Current assets
Inventory 7,348 8,757 7,567 656
Trade and other receivables 9,146 8,935 9,484 3,563
Short to medium term investments - - 693 1,168
Loans and receivables 1,527 1,446 - -
Taxation 404 254 197 18
Cash and cash equivalents 1,177 (122) 8,685 273
Total current assets 19,602 19,270 26,626 5,677
Total assets 66,803 66,619 72,475 7,911
PTL HOLDINGS PLC FINANCIAL ANALYSIS SUMMARY 27
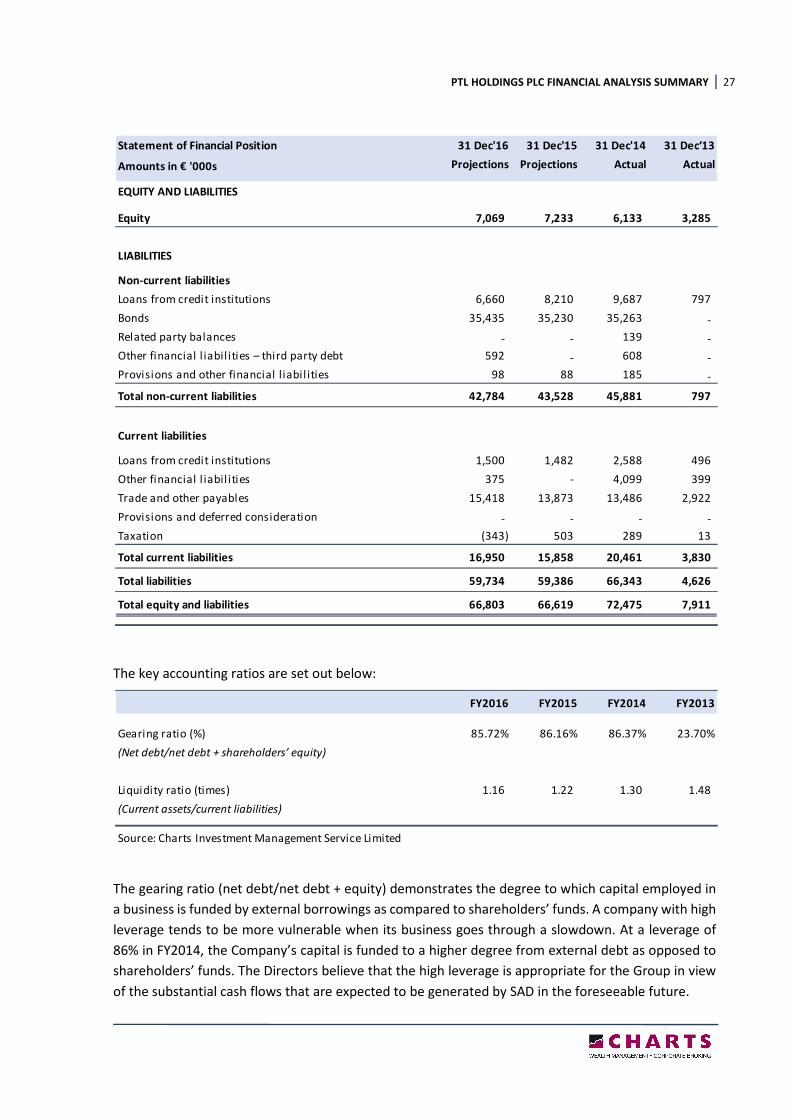
The key accounting ratios are set out below:
The gearing ratio (net debt/net debt + equity) demonstrates the degree to which capital employed in
a business is funded by external borrowings as compared to shareholders’ funds. A company with high
leverage tends to be more vulnerable when its business goes through a slowdown. At a leverage of
86% in FY2014, the Company’s capital is funded to a higher degree from external debt as opposed to
shareholders’ funds. The Directors believe that the high leverage is appropriate for the Group in view
of the substantial cash flows that are expected to be generated by SAD in the foreseeable future.
Statement of Financial Position 31 Dec'16 31 Dec'15 31 Dec'14 31 Dec‘13
Amounts in € '000s Projections Projections Actual Actual
EQUITY AND LIABILITIES
Equity 7,069 7,233 6,133 3,285
LIABILITIES
Non-current liabilities
Loans from credit institutions 6,660 8,210 9,687 797
Bonds 35,435 35,230 35,263 -
Related party balances - - 139 -
Other financial l iabil ities – third party debt 592 - 608 -
Provisions and other financial liabil ities 98 88 185 -
Total non-current liabilities 42,784 43,528 45,881 797
Current liabilities
Loans from credit institutions 1,500 1,482 2,588 496
Other financial l iabil ities 375 - 4,099 399
Trade and other payables 15,418 13,873 13,486 2,922
Provisions and deferred consideration - - - -
Taxation (343) 503 289 13
Total current liabilities 16,950 15,858 20,461 3,830
Total liabilities 59,734 59,386 66,343 4,626
Total equity and liabilities 66,803 66,619 72,475 7,911
FY2016 FY2015 FY2014 FY2013
Gearing ratio (%) 85.72% 86.16% 86.37% 23.70%
(Net debt/net debt + shareholders’ equity)
Liquidity ratio (times) 1.16 1.22 1.30 1.48
(Current assets/current liabilities)
Source: Charts Investment Management Service Limited

PTL HOLDINGS PLC FINANCIAL ANALYSIS SUMMARY 28
Other than equity, the Group is principally financed through bank loans and debt securities, analysed
as follows:
The Group’s bank borrowings are secured by general hypothecs, pledges and guarantees provided by
Group companies, by companies forming part of the Hili Ventures Group and by the Company’s
ultimate shareholders. The related party loan of the Group is unsecured and interest free.
The Bonds constitute unsecured obligations of the Issuer, and rank equally without priority or
preference with all other present and future unsecured and unsubordinated obligations of the Issuer.
PTL Group Borrowings & Bonds FY2016 FY2015 FY2014 FY2013
(€’000) Projection Projection Actual Actual
For funding the acquisitions
Loan – HSBC Bank Malta p.l .c. 20,970
Loan – HSBC Bank Pols ka S.A. 8,160 9,692 11,595 12,707
Related party loan 8,287
Total 8,160 9,692 11,595 41,964
For operational purposes
Loan & overdraft – HSBC Bank Malta p.l .c. 122 679 1,195
Loan – Bani f Bank (Malta) p.l .c. 97
Total 122 679 1,292
Debt securities
Bonds 35,435 35,230 35,263
Total debt 43,595 45,044 47,537 43,256
PTL HOLDINGS PLC FINANCIAL ANALYSIS SUMMARY 29
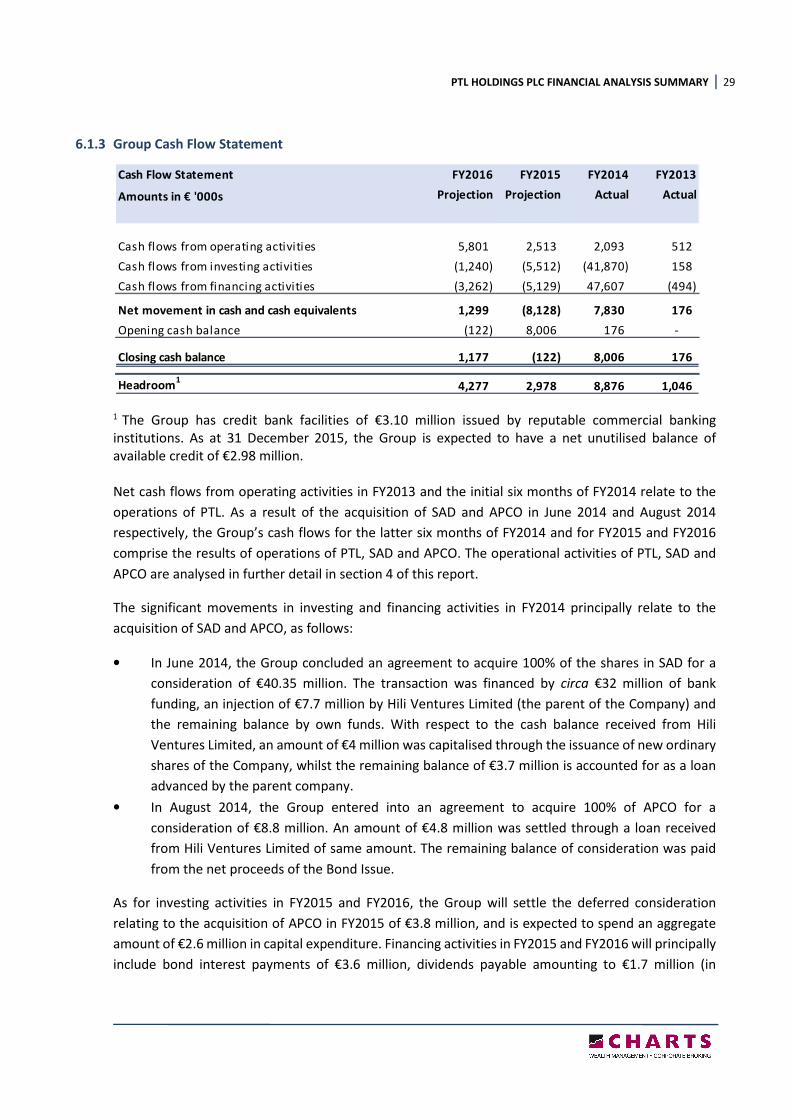
6.1.3 Group Cash Flow Statement
1 The Group has credit bank facilities of €3.10 million issued by reputable commercial banking
institutions. As at 31 December 2015, the Group is expected to have a net unutilised balance of
available credit of €2.98 million.
Net cash flows from operating activities in FY2013 and the initial six months of FY2014 relate to the
operations of PTL. As a result of the acquisition of SAD and APCO in June 2014 and August 2014
respectively, the Group’s cash flows for the latter six months of FY2014 and for FY2015 and FY2016
comprise the results of operations of PTL, SAD and APCO. The operational activities of PTL, SAD and
APCO are analysed in further detail in section 4 of this report.
The significant movements in investing and financing activities in FY2014 principally relate to the
acquisition of SAD and APCO, as follows:
• In June 2014, the Group concluded an agreement to acquire 100% of the shares in SAD for a
consideration of €40.35 million. The transaction was financed by circa €32 million of bank
funding, an injection of €7.7 million by Hili Ventures Limited (the parent of the Company) and
the remaining balance by own funds. With respect to the cash balance received from Hili
Ventures Limited, an amount of €4 million was capitalised through the issuance of new ordinary
shares of the Company, whilst the remaining balance of €3.7 million is accounted for as a loan
advanced by the parent company.
• In August 2014, the Group entered into an agreement to acquire 100% of APCO for a
consideration of €8.8 million. An amount of €4.8 million was settled through a loan received
from Hili Ventures Limited of same amount. The remaining balance of consideration was paid
from the net proceeds of the Bond Issue.
As for investing activities in FY2015 and FY2016, the Group will settle the deferred consideration
relating to the acquisition of APCO in FY2015 of €3.8 million, and is expected to spend an aggregate
amount of €2.6 million in capital expenditure. Financing activities in FY2015 and FY2016 will principally
include bond interest payments of €3.6 million, dividends payable amounting to €1.7 million (in
Cash Flow Statement FY2016 FY2015 FY2014 FY2013
Amounts in € '000s Projection Projection Actual Actual
Cash flows from operating activities 5,801 2,513 2,093 512
Cash flows from investing activities (1,240) (5,512) (41,870) 158
Cash flows from financing activities (3,262) (5,129) 47,607 (494)
Net movement in cash and cash equivalents 1,299 (8,128) 7,830 176
Opening cash balance (122) 8,006 176 -
Closing cash balance 1,177 (122) 8,006 176
Headroom1
4,277 2,978 8,876 1,046
PTL HOLDINGS PLC FINANCIAL ANALYSIS SUMMARY 30
FY2015), and the remaining balance of circa €1.6 million will relate to net movement in bank and
related party borrowings.
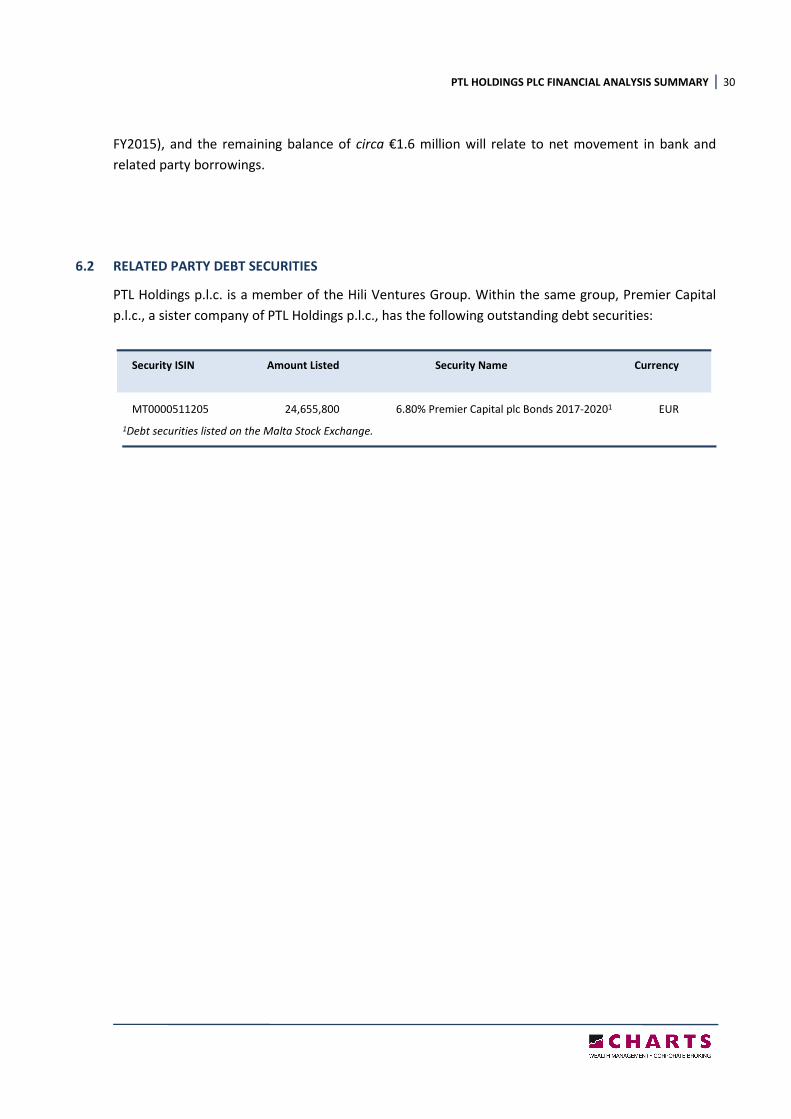
6.2 RELATED PARTY DEBT SECURITIES
PTL Holdings p.l.c. is a member of the Hili Ventures Group. Within the same group, Premier Capital
p.l.c., a sister company of PTL Holdings p.l.c., has the following outstanding debt securities:
Security ISIN Amount Listed Security Name Currency
MT0000511205 24,655,800 6.80% Premier Capital plc Bonds 2017-20201 EUR
1Debt securities listed on the Malta Stock Exchange.
PTL HOLDINGS PLC FINANCIAL ANALYSIS SUMMARY 31
PART 3
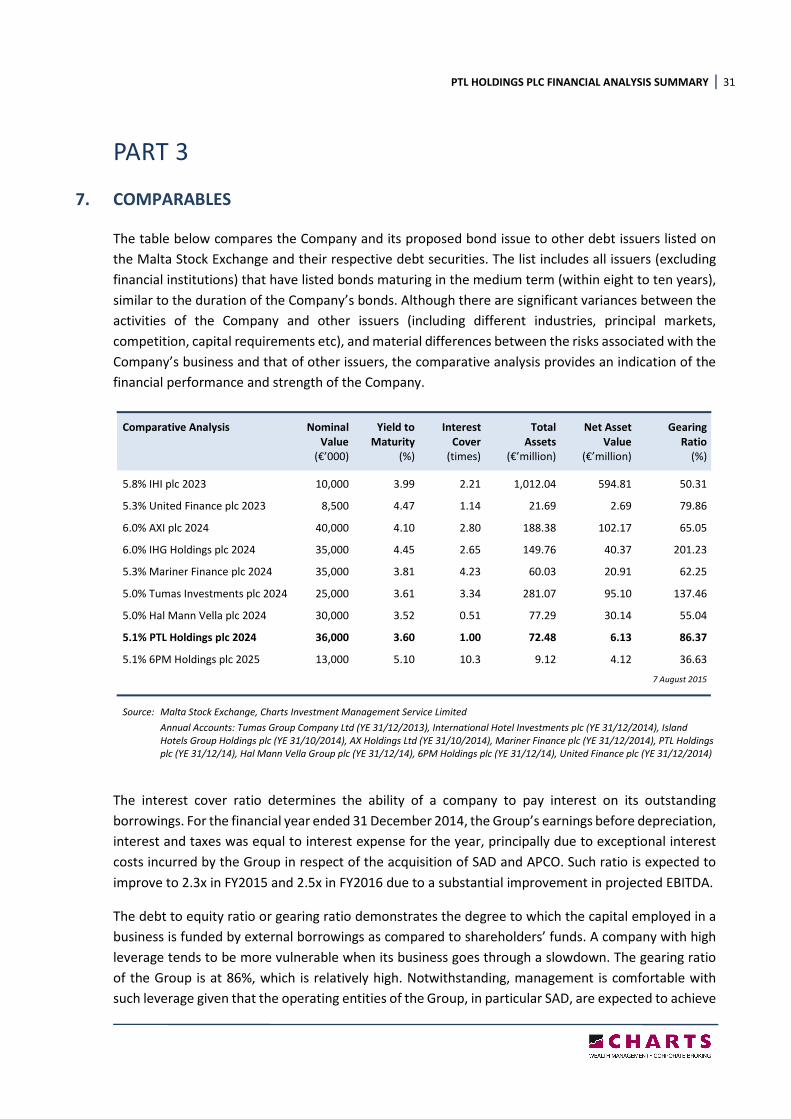
7. COMPARABLES
The table below compares the Company and its proposed bond issue to other debt issuers listed on
the Malta Stock Exchange and their respective debt securities. The list includes all issuers (excluding
financial institutions) that have listed bonds maturing in the medium term (within eight to ten years),
similar to the duration of the Company’s bonds. Although there are significant variances between the
activities of the Company and other issuers (including different industries, principal markets,
competition, capital requirements etc), and material differences between the risks associated with the
Company’s business and that of other issuers, the comparative analysis provides an indication of the
financial performance and strength of the Company.
Comparative Analysis Nominal Yield to Interest Total Net Asset Gearing
Value Maturity Cover Assets Value Ratio
(€’000) (%) (times) (€’million) (€’million) (%)
5.8% IHI plc 2023 10,000 3.99 2.21 1,012.04 594.81 50.31
5.3% United Finance plc 2023 8,500 4.47 1.14 21.69 2.69 79.86
6.0% AXI plc 2024 40,000 4.10 2.80 188.38 102.17 65.05
6.0% IHG Holdings plc 2024 35,000 4.45 2.65 149.76 40.37 201.23
5.3% Mariner Finance plc 2024 35,000 3.81 4.23 60.03 20.91 62.25
5.0% Tumas Investments plc 2024 25,000 3.61 3.34 281.07 95.10 137.46
5.0% Hal Mann Vella plc 2024 30,000 3.52 0.51 77.29 30.14 55.04
5.1% PTL Holdings plc 2024 36,000 3.60 1.00 72.48 6.13 86.37
5.1% 6PM Holdings plc 2025 13,000 5.10 10.3 9.12 4.12 36.63
7 August 2015
Source: Malta Stock Exchange, Charts Investment Management Service Limited
Annual Accounts: Tumas Group Company Ltd (YE 31/12/2013), International Hotel Investments plc (YE 31/12/2014), Island
Hotels Group Holdings plc (YE 31/10/2014), AX Holdings Ltd (YE 31/10/2014), Mariner Finance plc (YE 31/12/2014), PTL Holdings
plc (YE 31/12/14), Hal Mann Vella Group plc (YE 31/12/14), 6PM Holdings plc (YE 31/12/14), United Finance plc (YE 31/12/2014)
The interest cover ratio determines the ability of a company to pay interest on its outstanding
borrowings. For the financial year ended 31 December 2014, the Group’s earnings before depreciation,
interest and taxes was equal to interest expense for the year, principally due to exceptional interest
costs incurred by the Group in respect of the acquisition of SAD and APCO. Such ratio is expected to
improve to 2.3x in FY2015 and 2.5x in FY2016 due to a substantial improvement in projected EBITDA.
The debt to equity ratio or gearing ratio demonstrates the degree to which the capital employed in a
business is funded by external borrowings as compared to shareholders’ funds. A company with high
leverage tends to be more vulnerable when its business goes through a slowdown. The gearing ratio
of the Group is at 86%, which is relatively high. Notwithstanding, management is comfortable with
such leverage given that the operating entities of the Group, in particular SAD, are expected to achieve
PTL HOLDINGS PLC FINANCIAL ANALYSIS SUMMARY 32
substantial growth in revenue and operating cash flows in the short to medium term which will enable
the Group to reduce significantly its gearing level by the redemption date of the Bonds.
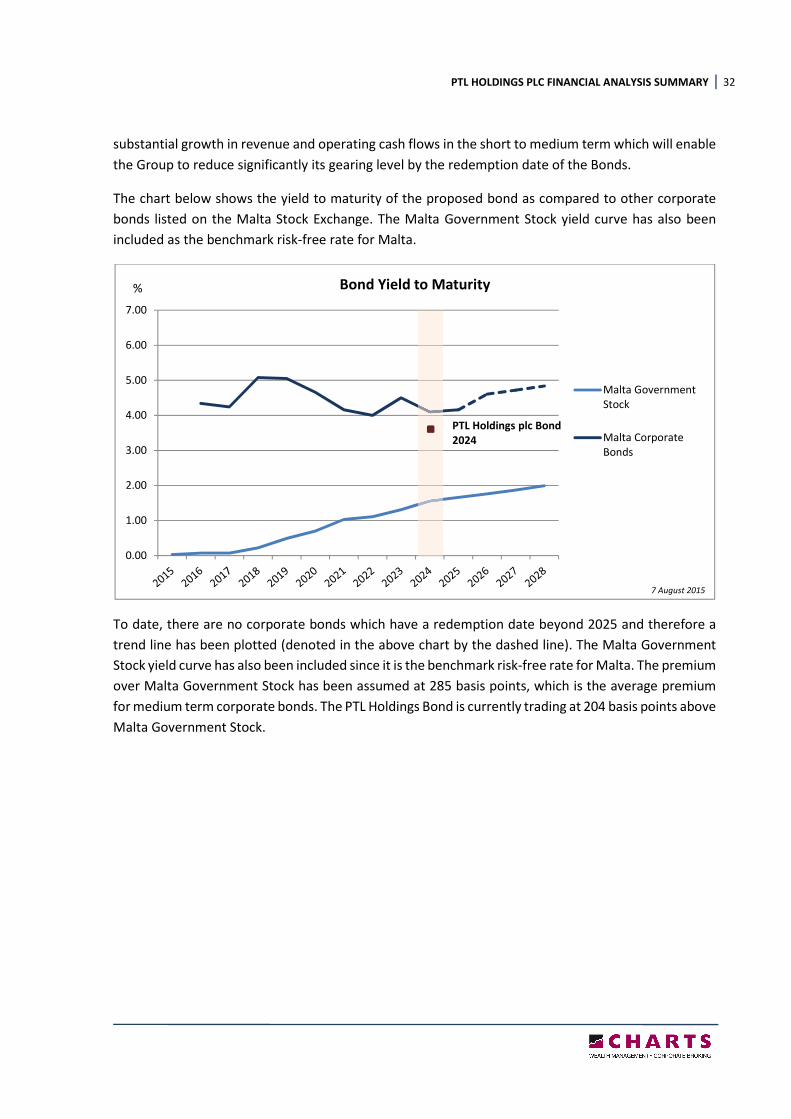
The chart below shows the yield to maturity of the proposed bond as compared to other corporate
bonds listed on the Malta Stock Exchange. The Malta Government Stock yield curve has also been
included as the benchmark risk-free rate for Malta.
To date, there are no corporate bonds which have a redemption date beyond 2025 and therefore a
trend line has been plotted (denoted in the above chart by the dashed line). The Malta Government
Stock yield curve has also been included since it is the benchmark risk-free rate for Malta. The premium
over Malta Government Stock has been assumed at 285 basis points, which is the average premium
for medium term corporate bonds. The PTL Holdings Bond is currently trading at 204 basis points above
Malta Government Stock.
0.00
1.00
2.00
3.00
4.00
5.00
6.00
7.00
Bond Yield to Maturity
Malta Government
Stock
Malta Corporate
Bonds
PTL Holdings plc Bond
2024
%
7 August 2015
PTL HOLDINGS PLC FINANCIAL ANALYSIS SUMMARY 33
PART 4
8. EXPLANATORY DEFINITIONS
Income Statement
Revenue Total revenue generated by the Group from its business activities during the
financial year, including IT hardware, software, consultancy and related
services.
Net operating expenses Net operating expenses include the cost of products, labour expenses, and
all other direct expenses.
EBITDA EBITDA is an abbreviation for earnings before interest, tax, depreciation and
amortisation. EBITDA can be used to analyse and compare profitability
between companies and industries because it eliminates the effects of
financing and accounting decisions.
Share of results of joint
ventures
The PTL Group owns minority stakes in a number of companies (less than
50% plus one share of a company’s share capital). The results of such
companies are not consolidated with the subsidiaries of the Group, but the
Group’s share of profit is shown in the profit and loss account under the
heading ‘share of results of associates and jointly controlled entities’.
Profit after tax Profit after tax is the profit made by the Group during the financial year both
from its operating as well as non-operating activities.
Profitability Ratios
Operating profit margin Operating profit margin is operating income or EBITDA as a percentage of
total revenue.
Net profit margin Net profit margin is profit after tax achieved during the financial year
expressed as a percentage of total revenue.
Efficiency Ratios
Return on equity Return on equity (ROE) measures the rate of return on the shareholders’
equity of the owners of issued share capital, computed by dividing profit after
tax by shareholders’ equity.
Return on capital employed Return on capital employed (ROCE) indicates the efficiency and profitability
of a company’s capital investments, estimated by dividing operating profit by
capital employed.
Return on Assets Return on assets (ROA) is computed by dividing profit after tax by total assets.
PTL HOLDINGS PLC FINANCIAL ANALYSIS SUMMARY 34
Equity Ratios
Earnings per share Earnings per share (EPS) is the amount of earnings per outstanding share of
a company’s share capital. It is computed by dividing net income available to
equity shareholders by total shares outstanding as at balance sheet date.
Cash Flow Statement
Cash flow from operating
activities
Cash generated from the principal revenue-producing activities of the
Company.
Cash flow from investing
activities
Cash generated from the activities dealing with the acquisition and disposal
of long-term assets and other investments of the Company.
Cash flow from financing
activities
Cash generated from the activities that result in change in share capital and
borrowings of the Company.
Balance Sheet
Non-current assets Non-current asset are the Group’s long-term investments, which full value
will not be realised within the accounting year. Non-current assets are
capitalised rather than expensed, meaning that the Group allocates the cost
of the asset over the number of years for which the asset will be in use,
instead of allocating the entire cost to the accounting year in which the asset
was purchased. Such assets include goodwill and other intangible assets,
property, plant & equipment and investments accounted for using the equity
method.
Current assets Current assets are all assets of the Group, which are realisable within one
year from the balance sheet date. Such amounts include inventory, accounts
receivable, cash and bank balances.
Current liabilities All liabilities payable by the Group within a period of one year from the
balance sheet date, and include accounts payable and short-term debt.
Net debt Borrowings before unamortised issue costs less cash and cash equivalents.
Non-current liabilities The Group’s long-term financial obligations that are not due within the
present accounting year. The Group’s non-current liabilities include bank
borrowings and bonds.
Total equity Total equity includes share capital, reserves & other equity components, and
retained earnings.
Financial Strength Ratios
Liquidity ratio The liquidity ratio (also known as current ratio) is a financial ratio that
measures whether or not a company has enough resources to pay its debts
over the next 12 months. It compares a company’s current assets to its
current liabilities.
PTL HOLDINGS PLC FINANCIAL ANALYSIS SUMMARY 35
Interest cover The interest coverage ratio is calculated by dividing a company’s EBITDA of
one period by the company’s interest expense of the same period.
Gearing ratio The gearing ratio indicates the relative proportion of shareholders’ equity
and debt used to finance a company’s assets, and is calculated by dividing a
company’s net debt by net debt plus shareholders’ equity.