public annual report of 2005 - seb · interest income ... the public annual report of 2005 differs...
TRANSCRIPT

Public Annual Report of 2005 (Act No 25, of the President of Bank of Estonia, dd. October 19, 1999)

ContentsStatement of the Management Board__________________ 2 2. Risk management and maintenance policy_______ 34
I. Introduction_____________________________________ 3 3. Changes concerning transition to IFRS __________ 401. Credit institution__________________________________ 3 4. Interest income_____________________________ 452. Auditor__________________________________________ 3 5. Interest expenses___________________________ 45
6. Fee and commission income__________________ 45II. Management Report______________________________ 4 7. Fee and commission expense__________________ 451. Credit institution's group____________________________ 4 8. Net profit from financial activities______________ 45
1.1. Consolidated group____________________________ 4 9. Other adminastrive expenses__________________ 461.2. Share issues__________________________________ 5 10. Value adjustments of advances and off-balance1.3. Employees___________________________________ 5 sheet commitments (+/-)_____________________ 461.4. Shares held by the members of Management and 11. Other operating income______________________ 46
Supervisory Council___________________________ 5 12. Other operating expense______________________ 461.5. Strategy and organisation_______________________ 6 13. Income tax of financial period_________________ 47
2. Highlights of operations____________________________ 7 14. Balances with the central bank_________________ 473. Internal control systems_____________________________ 9 15. Loans and advances to credit institutions_________ 474. Key Figures______________________________________ 10 16. Loans and advances to customers______________ 475. Ratings__________________________________________ 11 17. Allowances for doubtful debt__________________ 486. Normatives_______________________________________ 12 18. Information about loans and advances,
6.1. Capital adequacy______________________________ 12 restructured during the 2005__________________ 486.2. Net currency position__________________________ 12 19. Securities_________________________________ 496.3. Liquidity (assets and liabilities by remaining 20. Intangible assets____________________________ 52
maturity)____________________________________ 13 21. Tangible assets_____________________________ 536.4. Large exposures______________________________ 13 22. Investment properties________________________ 54
23. Other assets_______________________________ 55III. Financial Statements_________________________ 14 24. Accrued income and prepaid expenses__________ 55
1. Income Statement_________________________________ 14 25. Deferred income tax_________________________ 552. Balance Sheet_____________________________________ 15 26. Due to credit institutions_____________________ 553. Cash Flow Statement_______________________________ 16 27. Due to customers___________________________ 554. Changes in Shareholders' Equity______________________ 17 28. Issued debt securities________________________ 56
29. Other liabilities_____________________________ 56Notes to Financial Statements__________________________ 18 30. Accrued expenses and deferred income__________ 57
1. Accounting principles__________________________ 18 31. Provisions in group_________________________ 571.1. Basis of preparation____________________________ 18 32. Subordinated liabilities_______________________ 571.2. Consolidation________________________________ 19 33. Shareholders_______________________________ 581.3. Foreign currency transactions and assets and 34. Earnings per share__________________________ 58
liabilities denominated in a foreign currency________ 20 35. Dividend policy____________________________ 581.4. Cash and cash equivalents_______________________ 20 36. Off-Balance sheet items______________________ 591.5. Financial assets_______________________________ 21 37. Concentration of loans and advances from 1.6. Offsetting financial instruments__________________ 24 customers by countries_______________________ 601.7. Tangible and intangible assets other than goodwill___ 24 38. Concentration of loans and advances from 1.8. Goodwill____________________________________ 25 customers by economic sector_________________ 621.9. Investment properties__________________________ 26 39. Related parties_____________________________ 641.10. Assets held for sale____________________________ 26 38. Legal disputes______________________________ 641.11. Impairment of non-financial assets________________ 26 41. Overdue__________________________________ 651.12. Leases - a group is the lessee____________________ 27 42. Provided security___________________________ 651.13. Financial liabilities____________________________ 27 43. Contingent liabilities________________________ 661.14. Provisions___________________________________ 28 44. Events after end of the financial year____________ 661.15. Classification and accounting principles of life 45. IFRS Financial Statements____________________ 67
insurance contracts____________________________ 291.16. Capitalisation of acquisition costs_________________ 30 IV. Auditor's Report_______________________________ 711.17. Reserves____________________________________ 30 V. Proposal of the Management Board regarding the1.18. Revenue recognition___________________________ 31 profit distribution______________________________ 721.19. Taxation_____________________________________ 311.20. Fiduciary activities____________________________ 321.21. Earnings per share_____________________________ 321.22. New International Financial Reporting Standards,
interpretations of International Financial Reporting Interpretations Committee and amendments to published standards_________________________ 32

Statement of the Management Board The Management Board of SEB Eesti Ühispank is on an opinion that the Public Annual Report of 2005, which consists of Introduction, Management Report, Financial Statements, Auditor's Report and Proposal of the Management Board regarding the profit distribution, contains information, corresponding to the requirements set forth for Public Annual Reports in the Decree no. 25, dated 19.10.1999 of the Bank of Estonia President. The financial and additional information presented in the Public Annual Report of 2005 is true and complete. There is no financial or other information, missing from the Public Annual Report of 2005, which could affect the meaning or contents thereof. The Annual Financial Accounts give a true and fair view of the actual financial position, results of operations and cash flows of the company. Annual Financial Accounts, presented in the Public Annual Report of 2005 have been compiled in accordance with the accounting principles, stipulated in International Financial Reporting Standards, as adopted in the European Union. This Public Annual Report of 2005 has been compiled in accordance with the Decree no. 25, dated 19.10.1999 of the Bank of Estonia President and is in conformity with the requirements set forth in the law of the Republic of Estonia. AS SEB Eesti Ühispank and the group companies are assumed to be going concern. The audit of the year 2005 was conducted in accordance with International Standards of Auditing. The SEB Eesti Ühispank Annual Report 2005 will be submitted to the General Meeting of Shareholders for approval on 04.04.2006. Previous Annual Report 2004 was approved by the Shareholders’ Meeting on 02.03.2005. The Public Annual Report of 2005 differs from the SEB Eesti Ühispank Annual Report of 2005 primarily by its way of presentation, since this report implements the balance sheet and income statement as well as cash flow scheme requirements, established with the Decree no. 13, dated 03.12.2003 of the Bank of Estonia President and in parallel presents also separate statements of the bank, as the parent company. The Public Annual Report of 2005 is not subject to approval by the General Meeting of Shareholders. Members of the Management Board: 20.03.2006. (signed) Mart Altvee 20.03.2006. (signed) Lembit Kitter 20.03.2006. (signed) Tauno Vanaselja 20.03.2006. (signed) Andrus Kimber 20.03.2006. (signed) Rein Rätsep 20.03.2006. (signed) Mats Hedström
2

I. Introduction
1. Credit institutionCompany name AS SEB Eesti ÜhispankAddress Tornimäe Str.2, Tallinn 15010, EstoniaRegistred in Republic of EstoniaRegistry date 08.12.95Registry code 10004252 (Estonian Commercial Register)Phone +372 6 655 100 Telex 173 006 UNION EEFax +372 6 655 102SWIFT EEUHEE2Xe-mail [email protected] Internet homepage http://www.seb.ee
2. AuditorAuditor's company name AS PricewaterhouseCoopers Registry code 10142876Address Pärnu str. 15, 10141 Tallinn, Estonia
Report balance sheet date 31.12.05Reporting period 01.01.2005 - 31.12.2005Report currency Estonian kroon (EEK), millions
3

II. Management Report
1. Credit institution's group
1.1. Consolidated group 31.12.05
Company name
Register Reg.date Address ActivityOwner- ship***
(%)
AS SEB Ühisliising 10281767 03.10.1997 Tallinn, Tornimäe 2 Leasing 100.0%HF Liisingu AS (on liquidation)* 10304592 07.11.1997 Tallinn, Tornimäe 2 Leasing 100.0%AS SEB Ühisliisingu Kindlustusmaakler* 10723587 16.01.2001 Tallinn, Tornimäe 2 Insurance brokerage 100.0%AS Rentacar* 10303546 20.10.1997 Haapsalu, Karja 27 Leasing 100.0%
SEB Russian Leasing R-6603.16 19.06.1997 St.Peterburg, Kropotkina 1 Leasing 100.0%AS Ühisinvesteeringud 10282152 06.10.1997 Tallinn, Tartu str. 13 Investment banking 100.0%AS SEB Ühispanga Fondid 10035169 22.05.1996 Tallinn, Tornimäe 2 Asset management 100.0%AS SEB Ühispanga Elukindlustus 10525330 21.01.1999 Tallinn, Tornimäe 2 Insurance 100.0%AS Bangalo 10088272 18.10.1996 Tallinn, Tornimäe 2 Real estate 100.0%AS Tornimägi 10198768 05.05.1997 Tallinn, Tornimäe 2 Real estate 100.0%OÜ Strongler 10141919 23.04.1997 Tallinn, Tornimäe 2 Real estate 100.0%SEB IT Partner Estonia OÜ** 10002566 20.11.1995 Tallinn, Tartu str. 13 IT consulting, programming 35.0%AS Sertifitseerimiskeskus** 10747013 27.03.2001 Tallinn, Pärnu str. 12 Data communication services 25.0%Pankade Kaardikeskuse AS** 10452335 19.05.1998 Tallinn, Laki 12 Card centre 41.5%OÜ TietoEnator Support ** 11065244 30.08.2004 Tallinn, Roosikrantsi 11 IT consulting, programming 20.0%AS Eesti Liisingukeskus (on liquidation)** 10325921 17.11.1997 Tallinn, Liivalaia 12 Leasing centre 33.3%
SEB Russian Leasing registered in Russian Commercial Register, all other enterprises registered in Estonian Commercial Register.Parent company of the Group is AS SEB Eesti Ühispank, it's activity being banking (information on page 3).* consolidated subsidaries of AS SEB Ühisliising** associates***For all investments the percentage of holding equals to both, the holding from the number of shares as well as from the number of votes.The ‘consolidated group’ in the meaning of Credit Institutions Law in Estonia and the ‘Group’ are identical.
Changes in the consolidated group during the accounting period and projects for year 2006
In April the business name of the parent company and of several subsidiaries were changed. The new name of AS Eesti Ühispank is AS SEB Eesti Ühispank, Ühisliisingu AS was changed into AS SEB Ühisliising, the new name of AS Ühispanga Elukindlustus is AS SEB Ühispanga Elukindlustus, AS Ühispanga Varahaldus was changed intoAS SEB Ühispanga Fondid and Union Kindlustuskonsultatsioonid was changed into AS SEB Ühisliisingu Kindlustusmaakler
In April, the Management Board of AS Eesti Liisingukeskus resolved to liquidate the company, as the economic operationsof the company had been terminated.
In June, the Management Board of HF Liisingu AS assessed the volume and structure of the company’s assets and liabilities, and resolved to liquidate the company.
In August SEB Eesti Ühispank sold the 50% ownership in the associated company AS Intergate (note 19 to Financial Statements).In December 20% ownership in OÜ TietoEnator was bought (note 19 to Financial Statements).
No such events or trends have occurred by the time of publishing the "Public Annual Report of 2005", which would affect the economic situation and financial strategy of the group in 2006.
4

1.2. Share issues
IssueDecision made at Registered at
Number of shares
Share capital
(EEKmio)Restructuring gen.partnership to joint stock Co. 06.05.94 - 8,353,700 83.5Government, current shareholders 31.12.94 - 2,146,300 21.5Current shareholders, reinvestments 30.06.95 - 2,000,000 20.0Swedfund 15.11.95 14.06.96 2,500,000 25.0Ernesto Preatoni 29.03.96 14.06.96 2,200,000 22.0Employees 29.03.96 14.06.96 427,888 4.3Small investors 29.03.96 14.06.96 5,872,112 58.7Merger of Põhja Eesti Pank 12.04.97 04.09.97 5,000,000 50.0Share issue 12.04.97 28.04.97 1,175,000 11.7Swedfund Financial Markets AB 19.12.97 04.03.98 590,406 5.9Bankers Trust Co. & customers 05.03.98 01.04.98 11,159,592 111.6Owners of Tallinna Pank 24.05.98 29.07.98 9,726,444 97.3Skandinaviska Enskilda Banken 26.11.98 07.12.98 15,000,000 150.0Netherlands Development Finance Company 26.11.98 20.05.99 410,939 4.1Total 31.12.2005 66,562,381 665.6As at 31.12.2005 bank's 100% shareholder is SEB (note 33 to Financial Statements)
1.3. Employees Group Bank31.12.05 31.12.04 31.12.05 31.12.04
Avg number of employees during the year 1,451 1,362 1,228 1,165Number of employees (period end) 1,506 1,396 1,269 1,186
1.4. Shares held by the members of Management and Supervisory Board
Members of the Supervisory Board: Mats Kjaer, Ann Karlsson, Harald Fleetwood, Viesturs Neimanis, Julius Niedvaras.
Members of the Management Board: Mart Altvee, Lembit Kitter, Tauno Vanaselja, Andrus Kimber, Rein Rätsep, Mats Hedström.
The members of AS SEB Eesti Ühispank Management and Supervisory Board and their confidants, as well as the commercial undertakings controlled jointly or severally by the mentioned persons did not hold any shares or rights related to shares of AS SEB Eesti Ühispank as of 31.12.2005.
5
1.5. Strategy and organisation SEB Eesti Ühispank Group, being a member of SEB Group, is an Estonian financial group that serves private individuals, companies and the public sector. The bank is a universal bank that offers its customers a wide range of financial services. SEB Group is a North European financial group for corporate customers, institutions and private individuals 750 branch offices in Sweden, Germany, Baltic countries, Poland and the Ukraine. SEB has more than 5 million customers, of whom approximately 2.2 million use the internet for their banking transactions. SEB Eesti Ühispank Group carries out the vision of SEB Group, that is to be the leading bank in Northern Europe based on long-term customer relationships, competence and e-technology. The largest area of our operations is commercial banking together with leasing. However, long term saving products offered by asset management and life insurance are growing very fast indeed. In addition, most of our operation is focused to Estonia. However, in certain areas we are growing also our international operations quickly. SEB Russian Leasing, is for instance, a 100%-owned subsidiary which is a very fast growing leasing company in St Petersburg, Russia. Furthermore, SEB Eesti Ühispank is acting as Centre of Excellence within SEB Group for Asset Management activities concerning Eastern Europe. Our now more than 680,000 customers are served by approximately 1500 employees. The customers are served through many different channels such as 66 branch offices, more than 100 on-line post offices, more than 300 ATMs, 5500 POS-terminals. There are close to 400,000 debit and credit cards in use. In addition, close to 60% of our customers use our U-Net and U-Net Business services. Customer surveys during 2005 showed that we continue to have very satisifed customers. This is a key strength of our group, a strength that we are determined to maintain. SEB Eesti Ühispank is owned 100% by SEB AB, which will become 150 years old in 2006. We are getting a lot of diversified support from our parent in providing our customers even better services. In many product/service areas our owner is the strongest bank in the Nordic arena – expertise that we can draw upon to also serve our customers. In addition, we are getting strong support in controlling and managing our risks – something that is especially important given our country´s fast development.
6

2. Highlights of operations Organisational management At the general meeting of shareholders Ain Hanschmidt, the Chairman of the bank’s management board, was appointed the Chairman of the bank’s supervisory board. Mart Altvee, former head of Ühisliising was elected new Chairman of the bank’s management board, assuming office February 1st 2005. Later during the year Ain Hanschmidt was replaced by Mats Kjaer as Chairman of the bank´s Supervisory Board. The supervisory board of Ühisliising elected Indrek Julge as the new chairman of the management board to replace Mart Altvee. In addition, Raul Toomsalu was elected new Chairman of the Management Board of SEB Russian Leasing. In November the bank reorganised the structure of commercial banking area and established a new unit, Corporate & Institutions, Tauno Vanaselja was appointed head of the unit and new Management Board member of the bank, who is responsible for managing the Corporate and Institutional banking area, which holds corporate banking division and capital and money markets division. At the same time Gerd Krieger assumed the position of deputy director of Corporate Banking division. He will be responsible for the foreign trade financing, project financing and acquisition financing areas. Financing In January Eesti Ühispank and KfW signed a 15-million euro credit line agreement. The credit line enables to finance long-term investment projects of the Estonian local governments, related to the construction, improvement or renovation of infrastructure objects of the local governments. In September, the bank increased its capital base by issuing 50 M Euro in subordinated debt. Other significant events Since April 11, Eesti Ühispank changed its name to SEB Eesti Ühispank, emphasising the relationship of the bank with SEB. The change concerns all the Baltic banks of the SEB Group – Latvijas Unibanka in Latvia became SEB Latvijas Unibanka, Vilniaus Bankas in Lithuania became SEB Vilniaus Bankas. Also the names of subsidiaries were changed respectively. During the year a number of very successful product promotion campaigns were launched, such as the 60-minute campaign, investment deposit campaigns and student loan campaign. Moody´s confirmed SEB Eesti Ühispank’s rating A1. The Baltic e-banking report elected SEB Eesti Ühispank´s U-Net to be the best Internet bank in Estonia
7
We equipped all our offices with technical facilities, which enabled people to elect electronically during the local government pre-elections from October 10 to 12. SEB Ühispanga Fondid concluded in June an agreement for the management of the assets of SEB Lux Eastern Europe Fund and SEB Östeuropafond, as a result of which SEB Ühispanga Fondid manages now the assets of all SEB East European investment funds. Starting from October the payment orders between Estonian banks started moving faster - 9 times a day instead of the previous 3 times. Super speed of information exchange between State Treasury and SEB Eesti Ühispank. As a result of co-operation between the Ministry of Finance and SEB Eesti Ühispank, real time message-based information exchange was launched in November. SEB Eesti Ühispank in co-operation with SEB Ühispanga Elukindlustus founded a nonprofit association SEB Eesti Ühispanga Heategevusfond, the purpose of which is to improve the condition of homeless children.
8
3. Internal control systems Internal control systems are management tools that cover the activities of the entire banking group and form an integral part of the internal processes in the bank and in the group. The responsibility for the establishment and operation of internal control systems lies with the Management Board; the need for and the scope of controls is determined by the extent and nature of the risks involved. The Management Board of the bank establishes, in accordance with the requirements of the law, the competence and scope of responsibility of the structural units as well as the internal rules that regulate activities, the accounting rules and the procedure for preparing and submitting reports. The bank’s Supervisory Board carries out supervision of the activities of the bank and the entire group by establishing the general risk management principles. The Risk Control Department co-ordinates the monitoring of the risks involved, and the reporting of the sufficiency of risk capital to the supreme risk management body Assets and Liabilities Management Committee. In addition to the management, responsibility for the supervision and evaluation of the efficiency of the internal control system and development and improvement of the system lies with the Internal Audit Department and the Audit Committee. The Audit Committee co-ordinates the (internal) audit work in accordance with the group’s business objectives by reviewing the audit reports on a quarterly basis, and co-ordinating the annual audit plans. The annual audit plan of the group is co-ordinated with the external auditor responsible for auditing the SEB Eesti Ühispank group in accordance with the integrated audit model used in the SEB Group. External auditors examine the systems and procedures to an extent limited to what the auditors considered necessary to enable them to express an opinion on the financial statements in accordance with International Standards on Auditing. The comments and recommendations for improvements based on the findings by external auditors arising in the course of the audit were reported to management and Audit Committee of SEB Eesti Ühispank group. Important risk management and risk control quality-related (incl. the high quality of internal control systems) activities are designed to facilitate integration of the SEB Eesti Ühispank group in the international financial group as well as to bring the group’s audit environment and activity standards into compliance with the requirements established in the SEB Group.
9

4. Key Figures Group Bank31.12.05 31.12.04 31.12.05 31.12.04
Net profit 923.5 743.2 536.9 439.5Average equity 4,222.0 3,388.5 3,375.4 2,889.8Return on equity (ROE, %) 21.87 21.93 15.91 15.21
Average assets 42,286.0 30,156.8 36,634.8 29,198.9Average equity 4,222.0 3,388.5 3,375.4 2,889.8Equity multiplier (EM) 10.02 8.90 10.85 10.10
Net profit 923.5 743.2 536.9 439.5Total income (EEKmio) 2,698.3 2,151.4 2,084.6 1,806.6Profit margin (PM), % 34.23 34.54 25.76 24.33
Total income 2,698.3 2,151.4 2,084.6 1,806.6Average assets 42,286.0 30,156.8 36,634.8 29,198.9Asset utilization (AU), % 6.38 7.13 5.69 6.19
Net profit 923.5 743.2 536.9 439.5Average assets 42,286.0 30,156.8 36,634.8 29,198.9Return on assets (ROA, %) 2.18 2.46 1.47 1.51
Net interest income (excl. derivatives) 894.7 871.9 662.1 647.5Average interest earning assets 39,351.9 27,432.6 34,598.2 27,176.4Net interest margin (NIM, %) 2.27 3.18 1.91 2.38
Credit losses adjusted net interest income 914.3 846.9 685.9 620.6Average total assets 42,286.0 30,156.8 36,634.8 29,198.9Credit losses adjusted net interest margin (%) 2.16 2.81 1.87 2.13
Interest income (excl. derivatives) 1,630.9 1,368.3 1,267.5 1,142.2Average interest earning assets 39,351.9 27,432.6 34,598.2 27,176.4Yield on interest earning assets 4.14 4.99 3.66 4.20
Interest expenses (excl. derivatives) 736.2 496.4 605.4 494.7Average interest bearing liabilities 36,541.7 25,682.0 32,558.3 25,755.1Cost of interest bearing liabilities 2.02 1.93 1.86 1.92
SPREAD (%) 2.12 3.06 1.80 2.28
ExplanationsReturn on equity (ROE), % = Net profit / Average equity * 100Equity multiplier (EM) = Average assets / Average equityProfit margin (PM), % = Net profit / Total income * 100Asset utilization (AU), % = Total income / Average assets *100Return on assets (ROA), % = Net profit / Average assets * 100Net interest margin (NIM), % = Net interest income (excl. derivatives) / Average interest earning assetsCost of interest bearing liabilities = Interest expenses (excl. derivatives) / Average interest bearing liabilitiesSPREAD, % = Yield on interest earning assets - Cost of interest bearing liabilities
Credit losses adjusted net interest income = Net interest income (excl. derivatives) - Allowances for loans to customers - Allowances for receivables from credit institutions
10

Interest earning assets: Interest bearing liabilities:Balances with the central bank Due to central bankLoans and advances to credit institutions Due to credit institutionsLoans and advances to customers of credit institutions Due to clients of credit institutionsDue from customers of leasing enterprises Due to clients of insurance institutionsDue from insurance institutions Other commitmentsDebt securities and other fixed income securities Issued debt securities-Allowances for doubtful debt Subordinated liabilities
For Group: For Bank:Interest income Interest incomeInsurance premium Profit/income from currency dealingIncome from securities Income from fees and commisionsProfit from equity method (+) Income from financial investmentsFees and commissions receivedNet profit from financial activities (+)
Value adjustments of long term investments (+) Other operating incomeOther income Extraordinary incomeExtraordinary income/expense (+)
Assets quality Group Bank(millions of EEK) 31.12.05 31.12.04 31.12.05 31.12.04Assets 49,838.7 34,733.2 39,719.6 33,549.9Overdue loans and receivables (gross) 138.5 163.6 102.5 139.5Overdue/assets, % 0.28% 0.47% 0.26% 0.42%Allowances for losses on amounts due from customers and credit institutions 203.7 278.6 146.1 219.2
since since since5. Ratings 18.02.04 10.01.03 12.12.02
Moody’s Investor ServiceDeposit rating (Long term / Short term) A1/P-1 A2/P-1 A3/P-2Financial strength rating C– C– C–Rating descriptions in Internet:http://www.moodys.com
Total income includes the following items (Act No 25 of President of the Bank of Estonia, dd. October 19, 1999):
Value adjustments of advances and off-balance sheet commitments (+/-)
Income from value adjustemsnts of long term financial investments (+)
Profit/income from adjustmsnts of real estate, tangible and intangible assets (+)
Value adjustments of real estate investments, tangible and intangible assets (+/-)
Profit/income from value adjustments of advances and off-balance sheet commitments (+)
11

6. Normatives
6.1. Capital adequacy(millions of EEK) Group Bank
31.12.05 31.12.04 31.12.05 31.12.041. Tier 1 own funds 4,283.8 3,357.9 3,249.7 2,711.8 1.1 Paid in share capital and equity 2,012.2 2,012.2 2,012.2 2,012.2 1.2 General banking reserves 298.5 298.5 298.5 298.5 1.3 Other reserves 9.6 0.0 0.0 0.0 1.4 Retained earnings 1,431.1 701.6 793.6 359.2 1.5 Profit for the period after auditing 923.5 743.2 536.9 439.5 1.6 Other primary own funds 0.0 0.0 - - 1.7 Minority interest 0.0 0.0 - - 1.8 Translation reserve 0.4 0.0 - - 1.9 Treasury stock (less) 0.0 0.0 0.0 0.0 1.10 Intangible assets (less) -391.5 -397.6 -391.5 -397.6 1.11 Loss for the period (less) 0.0 0.0 0.0 0.02. Tier 2 own funds 1,048.3 266.0 1,048.3 266.03. Total gross own funds (1+2) 5,332.1 3,623.9 4,298.0 2,977.84. Deductions from own funds 4.8 2.4 35.5 45.65. Total net own funds (3-4) 5,327.3 3,621.5 4,262.5 2,932.26. Tier 3 own funds 0.0 0.0 0.0 0.07. Risk weighted assets 36,486.1 25,204.7 26,995.3 24,385.7
7.1 I category 0% 0.0 0.0 0.0 0.07.2 II category 20% 730.9 724.3 672.0 673.47.3 III category 50% 5,329.5 3,013.3 5,318.3 3,002.07.4 IV category 100% 30,425.7 21,467.1 21,005.0 20,710.3
8. Risk weighted off-balance sheet commitments 3,662.5 2,956.0 3,658.6 2,969.98.1 I Group 3,627.3 2,925.9 3,622.9 2,939.68.2 II Group 35.2 30.1 35.7 30.3
9. Capital requirement for covering foreign currency risk 27.4 11.9 0.0 0.010. Capital requirement for covering trading portfolio risks 13.0 2.5 13.0 2.5
10.1 Capital requirement for covering interest position risks 6.8 1.0 6.8 1.010.2 Capital requirement for covering equity position risks 6.2 1.5 6.2 1.510.3 Capital requirement for covering commodity risks - - - -10.4 Capital requirement for covering option risks - - - -10.5 Capital requirement for covering trading portfolio transfer risk - - - -10.6 Capital requirement for covering trading portfolio credit risk - - - -
11.0.0 0.0 0.0 0.0
12. Total capital adequacy (5.+6.)/(7.+8.+9.×10,0+10.×12,5+11.×12,5) 13.13 12.79 13.83 10.71Tier 1 Capital Ratio % (5.+6.-2.)/(7.+8.+9.×10,0+10.×12,5+11.×12,5) 10.54 11.85 10.43 9.74Tier 2 Capital Ratio % (2.)/(7.+8.+9.×10,0+10.×12,5+11.×12,5) 2.58 0.94 3.40 0.97
6.2. Net currency position
Net position of every currency at 31.12.2005 and 31.12.2004 is under 1 % level of net equity.
Capital requirement for covering open positsion of trading portfolio credit risks, exceeding limitation on concentration of
12

6.3. Liquidity (assets and liabilities by remaining maturity)(millions of EEK)
31.12.05
Assets, liabilities:Demand deposits
Over- due
< 1 month
1 < 3 months
3 < 12 months
1 < 2 years
2 < 5 years
over 5 years Total
1.Bank assets 3,578.1 83.1 3,145.0 1,543.8 4,944.0 3,889.9 8,027.9 13,768.8 38,980.62.Group assets 4,144.3 119.6 4,411.8 2,272.3 6,623.4 5,860.5 10,993.6 14,324.3 48,749.8
cash & due from credit institutions 2,996.2 0.0 1,680.4 0.1 0.5 0.7 0.8 0.0 4,678.7due from customers 0.5 117.3 2,003.5 2,241.5 6,609.7 5,812.5 10,906.2 14,037.2 41,728.4securities 1,101.4 0.0 0.0 0.1 4.9 46.8 86.1 182.9 1,422.2other assets 46.2 2.3 727.9 30.6 8.3 0.5 0.5 104.2 920.5
1.Bank liabilities 15,285.2 0.0 11,303.2 2,932.6 2,512.3 1,021.9 1,246.8 1,776.4 36,078.42.Group liabilities 14,988.8 0.0 11,562.7 2,949.5 2,861.9 1,434.7 8,861.7 2,495.5 45,154.8
due to credit institutions 161.6 0.0 3,969.4 391.2 328.5 1,173.5 8,617.1 141.8 14,783.1due to customers 14,811.9 0.0 6,596.4 2,223.6 2,486.8 252.8 233.7 584.8 27,190.0issued debt securities 0.0 0.0 0.0 293.2 6.0 0.0 0.0 0.0 299.2other liabilities 15.3 0.0 996.9 41.5 40.6 8.4 10.9 1,768.9 2,882.5
31.12.04
Assets, liabilities:Demand deposits
Over- due
< 1 month
1 < 3 months
3 < 12 months
1 < 2 years
2 < 5 years
over 5 years Total
1.Bank assets 2,516.9 104.0 1,142.6 2,874.9 5,349.5 4,076.0 7,957.3 8,776.5 32,797.72.Group assets 2,822.2 128.4 2,230.7 3,195.0 6,219.3 4,720.8 6,513.6 7,803.1 33,633.1
cash & due from credit institutions 2,500.8 0.0 23.6 1,736.9 0.0 0.0 0.0 0.0 4,261.3due from customers 0.1 126.5 1,518.6 1,439.7 6,205.2 4,698.8 6,379.4 7,506.6 27,874.9securities 274.3 0.0 0.2 0.5 1.3 20.6 133.8 229.4 660.1other assets 47.0 1.9 688.3 17.9 12.8 1.4 0.4 67.1 836.8
1.Bank liabilities 10,533.0 0.0 5,071.5 2,399.3 4,620.7 636.2 6,368.2 811.5 30,440.42.Group liabilities 10,327.3 0.2 5,298.7 2,416.0 4,647.9 666.8 6,402.8 1,213.5 30,973.2
due to credit institutions 355.6 0.0 1,790.6 0.0 1,285.0 391.2 6,266.0 0.0 10,088.4due to customers 9,967.4 0.0 2,831.5 2,349.1 2,605.7 255.6 98.4 543.4 18,651.1issued debt securities 0.0 0.0 0.0 39.0 712.2 6.0 0.0 0.0 757.2other liabilities 4.3 0.2 676.6 27.9 45.0 14.0 38.4 670.1 1,476.5
The column of overdue indicates the (net) amount of claims and liabilities overdue.
6.4. Large exposures 31.12.05(millions of EEK)
Group Bank
number/ amount
% from net
equitynumber/ amount
% from net equity
1.Number of customers with large exposure 3 - 4 -2.Due from customers with large exposure 2,061.4 38.70 1,994.6 46.793.Due from related persons and shareholders 8.6 0.16 1.7 0.04
2,070.0 38.86 1,996.3 46.83
Large exposure is the total exposure of one party or related parties to the group which exceeds 10% of the group's/bank´s net equity. All instruments where credit risk may arise to the group/bank are taken into consideration. The maximum rate of total large exposure allowed by Eesti Pank is 800%. The limit of the total exposure of one party or related parties is 25%. As of 31.12.2005 the group had 3 and the bank had 4 large exposures. Total exposure of any group of related parties did not exceed the limit of 25%.
13
III. Financial Statements
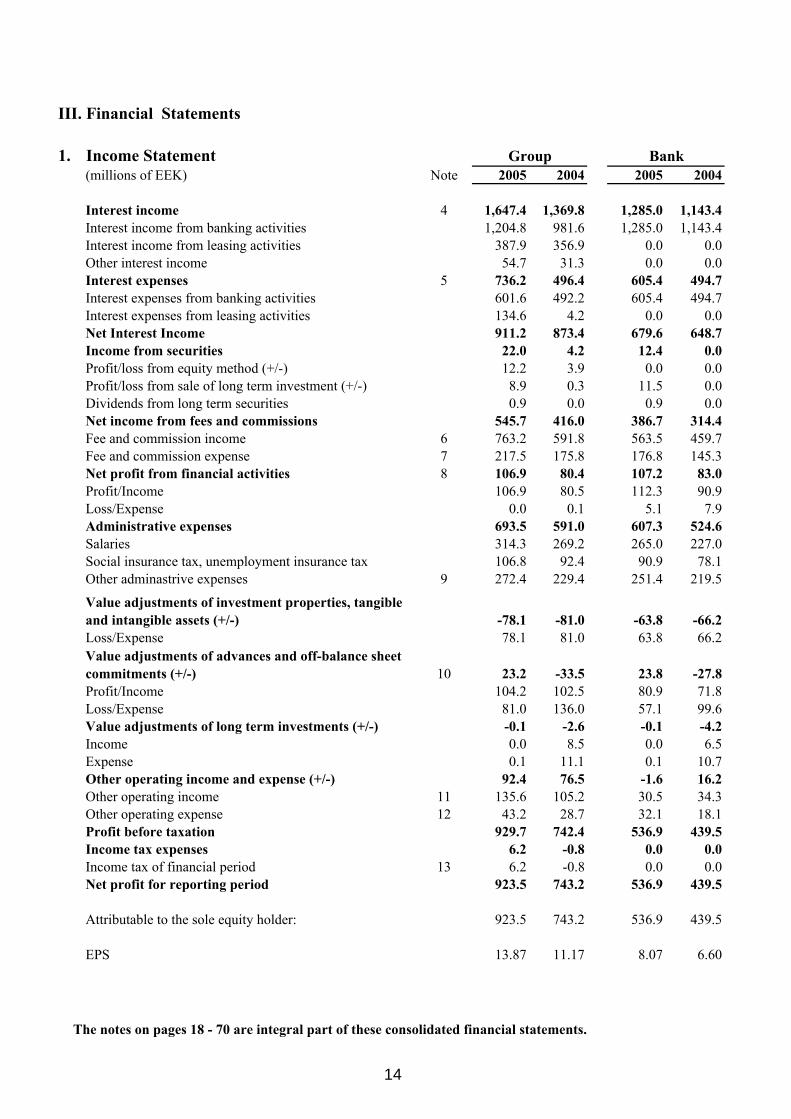
1. Income Statement Group Bank(millions of EEK) Note 2005 2004 2005 2004
1. Interest income 4 1,647.4 1,369.8 1,285.0 1,143.41.1. Interest income from banking activities 1,204.8 981.6 1,285.0 1,143.41.2. Interest income from leasing activities 387.9 356.9 0.0 0.01.3. Other interest income 54.7 31.3 0.0 0.02. Interest expenses 5 736.2 496.4 605.4 494.72.1. Interest expenses from banking activities 601.6 492.2 605.4 494.72.2. Interest expenses from leasing activities 134.6 4.2 0.0 0.03. Net Interest Income 911.2 873.4 679.6 648.75. Income from securities 22.0 4.2 12.4 0.05.1. Profit/loss from equity method (+/-) 12.2 3.9 0.0 0.05.2. Profit/loss from sale of long term investment (+/-) 8.9 0.3 11.5 0.05.3. Dividends from long term securities 0.9 0.0 0.9 0.06. Net income from fees and commissions 545.7 416.0 386.7 314.46.1. Fee and commission income 6 763.2 591.8 563.5 459.76.2. Fee and commission expense 7 217.5 175.8 176.8 145.37. Net profit from financial activities 8 106.9 80.4 107.2 83.07.1. Profit/Income 106.9 80.5 112.3 90.97.2. Loss/Expense 0.0 0.1 5.1 7.98. Administrative expenses 693.5 591.0 607.3 524.68.1. Salaries 314.3 269.2 265.0 227.08.2. Social insurance tax, unemployment insurance tax 106.8 92.4 90.9 78.18.3. Other adminastrive expenses 9 272.4 229.4 251.4 219.59.
-78.1 -81.0 -63.8 -66.29.2. Loss/Expense 78.1 81.0 63.8 66.2
10. 10 23.2 -33.5 23.8 -27.810.1 Profit/Income 104.2 102.5 80.9 71.810.2 Loss/Expense 81.0 136.0 57.1 99.611. Value adjustments of long term investments (+/-) -0.1 -2.6 -0.1 -4.211.1 Income 0.0 8.5 0.0 6.511.2 Expense 0.1 11.1 0.1 10.712. Other operating income and expense (+/-) 92.4 76.5 -1.6 16.212.1 Other operating income 11 135.6 105.2 30.5 34.312.2 Other operating expense 12 43.2 28.7 32.1 18.114. Profit before taxation 929.7 742.4 536.9 439.515. Income tax expenses 6.2 -0.8 0.0 0.015.1 Income tax of financial period 13 6.2 -0.8 0.0 0.017. Net profit for reporting period 923.5 743.2 536.9 439.5
Attributable to the sole equity holder: 923.5 743.2 536.9 439.5
EPS 13.87 11.17 8.07 6.60
Value adjustments of investment properties, tangible and intangible assets (+/-)
Value adjustments of advances and off-balance sheet commitments (+/-)
The notes on pages 18 - 70 are integral part of these consolidated financial statements.
14

2. Balance sheet Group Bank(millions of EEK) Note 31.12.05 31.12.04 31.12.05 31.12.04
ASSETSCash 526.1 443.5 526.1 443.5Loans and advances 45,881.0 31,692.7 37,072.3 31,383.9Balances with the central bank 14 2,231.1 1,701.4 2,231.1 1,701.4Loans and advances to credit institutions 15 1,924.1 2,119.0 1,904.5 2,105.1Loans and advances to customers of credit institutions 16 33,493.1 22,148.4 33,082.8 27,796.6Due from customers of leasing enterprises 16 8,434.5 6,001.2 - -Due from insurance institutions 1.9 1.3 - -Allowances for doubtful debt 17, 18 -203.7 -278.6 -146.1 -219.2Debt securities and other fixed income securities 19 834.1 296.0 550.9 189.2Shares and other securities 19 610.1 370.0 420.4 477.3Shares and participations in affiliates 28.5 33.6 12.9 27.4Shares and participations in subsidaries - - 346.8 346.8Other shares and participations 559.6 330.6 38.0 97.3Derivatives 22.0 5.8 22.7 5.8Intangible assets 20 391.5 397.5 391.5 397.6Consolidated goodwill 379.1 379.1 379.1 379.1Other intagible assets 12.4 18.4 12.4 18.5Tangible assets 21 588.6 593.8 261.9 269.0Investment properties 22 108.8 108.8 85.6 85.6Other assets 23 270.3 221.8 243.4 180.4Accrued income and prepaid expenses 24, 25 628.2 609.1 167.5 123.4TOTAL ASSETS 49,838.7 34,733.2 39,719.6 33,549.9
LIABILITIES AND SHAREHOLDERS' EQUITYLiabilities 41,973.1 28,739.5 33,899.7 28,846.1Due to credit institutions 26 14,783.1 10,088.4 6,463.4 10,088.4Due to customers of credit institutions 27 27,074.8 18,482.3 27,387.4 18,692.3Due to customers of insurance institutions 27 1.3 1.0 - -Other commitments 113.9 167.8 48.9 65.4Securities 310.5 777.5 310.5 778.1Issued debt securities 28 299.2 757.2 299.2 757.2Derivatives 11.3 13.9 11.3 14.5Other debt securities 0.0 6.4 0.0 6.4Other liabilities 29 1,087.0 389.1 604.1 305.9Accrued expenses and deferred income 30 422.6 398.2 215.0 243.5Provisions 31 313.3 402.9 0.8 0.8Insurance technical provisions 310.6 402.1 - -Other provisions 2.7 0.8 0.8 0.8Subordinated liabilities 32 1,048.3 266.0 1,048.3 266.0TOTAL LIABILITIES 45,154.8 30,973.2 36,078.4 30,440.4
Share capital 33,34,35 665.6 665.6 665.6 665.6Share premium 1,346.6 1,346.6 1,346.6 1,346.6General banking reserve 298.5 298.5 298.5 298.5Revaluation reserve 8.6 0.0 0.0 0.0Statutory reserve 9.6 4.5 0.0 0.0Translation reserve 0.4 0.0 0.0 0.0Retained earnings 1,431.1 701.6 793.6 359.3Profit for the reporting period 923.5 743.2 536.9 439.5TOTAL SHAREHOLDERS' EQUITY 4,683.9 3,760.0 3,641.2 3,109.5TOTAL LIABILITIES AND CAPITAL 49,838.7 34,733.2 39,719.6 33,549.9
The notes on pages 18 - 70 are integral part of these consolidated financial statements.
15

3. Cash Flow Statement(millions of EEK) Group Bank
Note 31.12.05 31.12.04 31.12.05 31.12.04I. Cash flows from operating activities
Interest received 1,544.0 1,284.5 1,201.0 1,064.6Interest paid -584.2 -361.8 -500.5 -360.1Dividends received 0.9 0.0 0.9 0.0Fee and commission received 763.2 591.8 563.5 459.7Net trading income and other income 7.5 81.3 -60.9 -45.9Administrative expenses -693.5 -591.0 -607.3 -524.6Income taxes paid -6.2 0.8 0.0 0.0Adjustments -5.1 -0.1 -5.2 0.0
1,026.6 1,005.5 591.5 593.7
Changes in operating assets:Loans and advances to credit institutions -218.8 74.6 -214.9 43.0Loans and advances to customers -13,934.5 -7,605.3 -5,335.5 -7,427.9Other assets 68.1 -5.2 23.0 83.8
Changes of operating liabilities:Due to credit institutions 5,392.6 4,174.2 -3,326.8 4,148.8Due to customers 27 8,592.8 3,763.2 8,695.1 3,818.7Government lending funds and counterpart funds -53.9 -61.1 -16.5 -49.6Other liabilities -226.2 79.7 -143.0 -109.0Net cash from operating activities 646.7 1,425.6 272.9 1,101.5
II. Cash flows from investing activities
Purchase of investment portfolio securities 19 -1,003.3 -487.8 -3.2 -159.0Proceeds from sale of investment portfolio securities 19 887.1 345.9 253.6 299.3Purchase of associates 19 -0.6 0.0 -0.6 0.0Proceeds from sale of associates 19 16.3 0.0 16.3 0.0
20, 21, 22 -81.2 -81.4 -56.2 -69.2
20, 21, 22 14.3 15.1 5.6 6.6Net cash used in investing activities -167.4 -208.2 215.5 77.7
III. Cash flows from financing activitiesProceeds from debt securities (issuing) 28 293.2 663.6 293.2 663.6Repurchasing of debt securities 28 -751.2 -344.5 -751.2 -344.5Proceeds from subordinated loans 32 782.3 0.0 782.3 0.0Net cash from financing activities 324.3 319.1 324.3 319.1Effect of exchange rate changes on cash and cash equivalents -3.5 -26.4 0.1 -0.4
Net increase in cash and cash equivalents 800.1 1,510.1 812.8 1,497.9
Cash and cash equivalents at beginning of period 4,270.3 2,760.2 4,256.4 2,758.5
Cash and cash equivalents at end of period 5,070.4 4,270.3 5,069.2 4,256.4
Group BankCash and cash equivalents includes: 31.12.05 31.12.04 31.12.05 31.12.04Cash on hand 526.1 443.5 526.1 443.5Balances with the central bank (note 14) 2,231.1 1,701.4 2,231.1 1,701.4Liquid deposits in other credit institutions (note 15) 1,730.2 2,095.4 1,729.0 2,081.5Trading portfolio (note 19) 583.0 30.0 583.0 30.0Total 5,070.4 4,270.3 5,069.2 4,256.4
Annexes to Cash Flow Statement
1. AS SEB Eesti Ühispank has not paid income tax.2. Financial transactions that are not reflected on the Cash Flow Statement:2.1. AS SEB Eesti Ühispank has not made investments with nonmonetary payment.2.2. AS SEB Eesti Ühispank has not received nonmonetary dividends paid in other assets. 3. AS SEB Eesti Ühispank and his subsidaries have not bought assets, which acquired with Estonian Privatisation Vouchers (EVP)
Cash flows from operating profits before changes in the operating assets and liabilities
Purchase of investment properties, tangible and intangible assetsProceeds from sale of investment properties, tangible and intangible assets
The notes on pages 18 - 70 are integral part of these consolidated financial statements.16

4. Changes in Shareholders' Equity(millions of EEK) Group
Share capital
Share premium
Other reserves
Unrealized rate diffe-
rencesRetained earnings
Total share-holders' equity
Final balance 31.12.2003 665.6 1,346.6 300.7 0.0 704.0 3,016.9Revaluation of securities - - - - -0.1 -0.1Statutory reserve - - 2.3 - -2.3 0.0Profit for the year - - - - 743.2 743.2Final balance 31.12.2004 665.6 1,346.6 303.0 0.0 1,444.8 3,760.0
Changes related to IAS 39 (note 3) - - 8.6 - -8.6 0.0
Year beginning 01.01.2005 665.6 1,346.6 311.6 0.0 1,436.2 3,760.0Statutory reserve - - 5.1 - -5.1 0.0Revaluation of securities available-for-sale - - 5.2 - - 5.2Realization of revaluation of securities available-for-sale - - -5.2 - - -5.2Consolidation of foreign subsidaries - - - 0.4 - 0.4Profit for the year - - - - 923.5 923.5Final balance 31.12.2005 665.6 1,346.6 316.7 0.4 2,354.6 4,683.9
Bank
Share capital
Share premium
General Banking reserve
Revalua- tion reserve
Retained earning
Total share-holders' equity
Final balance 31.12.2003 665.6 1,346.6 298.5 0.0 714.2 3,024.9
Changes related to IAS 27 (note 3) - - - - -354.9 -354.9
Year beginning 01.01.2004 665.6 1,346.6 298.5 0.0 359.3 2,670.0Profit for the year - - - - 439.5 439.5Closing balance 31.12.2004 665.6 1,346.6 298.5 0.0 798.8 3,109.5
Book value of holdings under control or significant influence - - - - -374.2 -374.2Value of holdings under control or significant influence, calculated by equity method - - - - 1,024.7 1,024.7Adjusted unconsolidated equity as at 31.12.2004 665.6 1,346.6 298.5 0.0 1,449.3 3,760.0
Changes related to IAS 39 (note 3) - - - 5.2 -5.2 0.0
Year beginning 01.01.2005 665.6 1,346.6 298.5 5.2 793.6 3,109.5
Realisation of revaluation of securities - - - -5.2 - -5.2Profit for the year - - - - 536.9 536.9Closing balance 31.12.2005 665.6 1,346.6 298.5 0.0 1,330.5 3,641.2
Book value of holdings under control or significant influence - - - - - -359.6Value of holdings under control or significant influence, calculated by equity method - - - - - 1,402.3Adjusted unconsolidated equity as at 31.12.2005 665.6 1,346.6 298.5 0.0 1,330.5 4,683.9
The notes on pages 18 - 70 are integral part of these consolidated financial statements.17

Note 1 ACCOUNTING PRINCIPLES AS SEB Eesti Ühispank (Reg. No. 10004252) is a credit institution registered in Tallinn (Estonia), Tornimäe Street 2, the sole shareholder of which is SEB AB, registered in Sweden. As at the end of year 2005 SEB Eesti Ühispank Group employed 1 506 people. 1.1. Basis of preparation First-time Adoption of International Financial Reporting Standards These financial statements are the first financial statements of SEB Eesti Ühispank Group (the Group) prepared in accordance with International Financial Reporting Standards (IFRS) as adopted by the EU. Consolidated financial statements of SEB Eesti Ühispank until 31 December 2004 had been prepared in accordance with the generally accepted accounting principles of Estonia (Estonian GAAP) and legal acts of the Bank of Estonia applicable to credit institutions in preparing consolidated public annual accounts. In preparing these first IFRS financial statements, the Group adopted IFRS 1 “First-time Adoption of International Financial Reporting Standards”. Reconciliation and descriptions of the effect of the transition from Estonian GAAP to IFRS as adopted by the EU is given in Note 3 "Changes concerning transition to IFRS". These financial statements have been prepared under the historical cost convention, except as disclosed in the accounting policies below. Financial accounts have been prepared according to accrual principle of accounting. The preparation of the consolidated financial statements in accordance with the International Financial Reporting Standards requires the use of estimates and assumptions that affect the reported amounts of assets and liabilities and disclosure of contingent assets and liabilities at the date of the financial statements and the reported amounts of revenues and expenses during the reporting period. Although these estimates are based on management’s best knowledge of current event and actions, actual results ultimately may differ from those estimates. More detailed treatment of the assessments made is provided under accounting principles set out below. Specific disclosure Notes in addition to accounting principles add information to the judgments made by management in the following areas: - goodwill - Note 20. - investment properties - Note 22. - credit allowances Note 2. Presentation and comparability The financial statements have been prepared for the period ended 31.12.2005. The financial statements have been prepared in millions of Estonian kroons. When the presentation or classification of items in the financial statements is amended, comparative amounts for the previous period are also reclassified, if not referred differently in specific accounting principle.
18

1.2. Consolidation Scope of consolidated financial statements Into the consolidated financial statements of the SEB Eesti Ühispank Group have been included by consolidation the financial statements of the subsidiaries as at 31 December 2005. Into SEB Eesti Ühispank Group consolidated financial statements have been consolidatd the financial statements of the subsidiaries, which are listed on page 4 (see table 1.1). Consolidation In the group’s consolidated financial statements, the financial statements of the parent and its subsidiaries have been combined on a line-by-line basis. Intra-group balances and intra-group transactions have been eliminated in full. The subsidiaries that are controlled by SEB Eesti Ühispank have been consolidated. The accounts of the subsidiaries and associates have been prepared in conformity with the accounting principles of the parent company. In the parent separate financial statements the investments into the shares of subsidiaries and associated companies are accounted for at cost. Subsidiaries Subsidiary is an entity controlled by the parent company. Control is presumed to exist when the parent owns, directly or indirectly, more than 50% of the voting power of an enterprise or otherwise has power to govern the financial and operating policies. Subsidiaries are consolidated from the date on which control is transferred to the Group and are no longer consolidated from the date that control ceases. The purchase method of accounting is used to account for the acquisition of subsidiaries. According to the purchase method the assets and liabilities of the subsidiary acquired are measured at their fair values and the difference between the cost of acquisition and the fair value of the net assets of the subsidiary acquired is recorded as goodwill. Revenues and expenses of the subsidiaries acquired within the financial year are consolidated into the group income statement starting from the date of acquisition to the end of the financial year. Result of operations of subsidiaries disposed of during the year is consolidated into group income statement until the date of disposal. Associates Associate is an entity over which the Group has significant influence, but which it does not control. Generally, significant influence is presumed to exist when the group holds between 20% and 50% of the voting rights. Investments in associates are accounted for under the equity method of accounting. Under this method, the investment in Group financial statements is increased by the share of profit and reduced by the share of loss or distribution of profit received from the associated company and attributable to the Group.
19

1.3. Foreign currency transactions and assets and liabilities denominated in a foreign currency Functional currency The financial statements of the Group companies have been prepared using the currency (functional currency) which best reflects the company’s economic environment. The consolidated financial statements have been presented in Estonian kroons, which is also the functional currency of the parent company. Foreign currency transactions Foreign currency transactions have been recorded based on foreign currency exchange rates of the Bank of Estonia prevailing on the transaction dates. In the case of differences in the transfer of cash and exchange rates on the transaction date, the exchange rate differences are recorded in the income statement under the line "Net profit from financial activities". Assets and liabilities denominated in foreign currencies Monetary assets and liabilities and non-monetary assets and liabilities valued at fair value and denominated in foreign currencies have been translated into Estonian kroons based on the foreign currency exchange rates of the Bank of Estonia prevailing on the balance sheet date. Gains and losses on translation are recorded in the income statement under the line "Net profit from financial activities". Group companies Income statements and cash flows of foreign entities are translated into Estonian kroons at average exchange rates (unless this average is not a reasonable approximation of the cumulative effect of the rates prevailing on the transaction dates, in which case income and expenses are translated at the dates of the transactions)for the year and their balance sheets are translated at the exchange rates ruling on 31 December. Unrealised exchange differences arising from the translation are taken to shareholders’ equity. When a foreign entity is sold, such exchange differences are recognised in the income statement as part of the gain or loss on sale. 1.4. Cash and cash equivalents For the purposes of the cash flow statement, cash and cash equivalents are cash at hand, deposits due from central bank and readily available deposits in other credit institutions and also less than 3-month maturity liquid securities acquired for trading purpose.
20

1.5. Financial assets Financial assets are any assets that are cash, a contractual right to receive cash or another financial asset from another enterprise, a contractual right to exchange financial instruments with another enterprise under conditions that are potentially favourable or an equity instrument of another enterprise. The Group classifies its financial assets in the following categories:
• loans and receivables, • financial assets at fair value through profit or loss, • available for sale financial assets.
1.5.1. Loans and receivbles Loans and receivables Loans and receivables are non-derivative financial assets with fixed or determinable payments that are not quoted in an active market. They arise when the Group provides money, goods or services directly to a debtor with no intention of trading the resulting receivable. Loans and receivables are recognized in the balance sheet when the cash is paid to the borrower and are initially recognized at fair value plus transaction costs and are derecognized only when they are repaid or written-off, regardless of the fact that part of them may be recognized as costs through providing allowances for loans. The loan allowances are presented on the respective balance sheet line at negative value. Loans have been recognized in the balance sheet at amortized cost using the effective interest rate method. Accrued interest on the loans and not yet collected is recorded in the balance sheet line under accruals. For overdrafts and credit cards, the actual use of the limit by the borrower is stated in the balance sheet. The unused credit limit is recognized as off-balance sheet commitment. Leasing loans and receivables Financial lease claims include receivables from financial lease, consumer factoring and installment sale. A financial lease is a rental transaction where all major risks and rights deriving from the use of the leased assets are transferred from the leasing firm to the lessee. Legal ownership to the property may be transferred to the lessee at the end of the lease period. The receivables from the financial lease agreements are recognized in net present value of the minimum lease payments, from which the payments of principal received have been deducted. Lease payments collected are allocated between repayment of principal and financial income. Financial income is recognized over the rental period based on the pattern reflecting a constant periodic rate of return on the lessor’s net investment in the finance lease. Initial service fees collected at issuance are included into the calculation of effective interest rate and lessor’s net investment. Allowances for lease receivables are presented on the respective balance sheet line at negative value. The lease receivable to the client is recognized in the balance sheet as of the moment of delivering the assets being the object of the agreement to the client. In case of transactions, in which the assets being the object of the agreement having a long delivery term have not yet been delivered to the client, the payments received from the lessees under these agreements are recognized in the balance sheet as
21

prepayments of buyers under “accrued expenses and deferred income”. The amounts paid by the leasing firm for the assets under lease agreements not yet delivered are recognized in the balance sheet as prepayments to suppliers under “accrued income and prepaid expenses”. Factoring receivables Factoring transactions are considered to be financing transactions where the leasing firm provides the financial resources to its selling partners through transfer of the rights to the receivables from these sales transactions. The leasing firm acquires the right for the receivables payable by the buyer subject to the sales contract. Factoring is the transfer of receivables. Depending on the terms of the factoring contract the buyer either accepts the transfer of substantially all the risks and rewards of the ownership of the receivable (non-recourse factoring) or retains the right to transfer the risks and rewards back to the seller during a pre-specified term (recourse factoring). Factoring receivables are recorded in the balance sheet at amortisied cost, from which the payments of principal claim collected have been deducted. Allowances for factoring receivables are presented on the respective balance sheet line at negative value. The receivable to the client is recognized as of the moment of factoring the purchase-sale agreement, i.e. as of assuming the receivable. Valuation of loans and receivables For valuation of loans and receivables several risks are prudently considered. SEB Eesti Ühispank introduced a customer rating system for evaluating corporate loans, corresponding to the principles used in SEB, the parent company of SEB Eesti Ühispank. Valuation of the customer receivables is based on the client’s company’s financial position, situation of the industry, trustworthiness of the borrower, competence of the management of the client, timely fulfillment of contractual obligations and other factors, all of which together help to assess the value of the receivable and the amount of incurred loss in the portfolio of loans. Valuation of loans to private individuals is based on timely fulfillment of contractual obligations, solvency and collateral; for mortgage loans, additionally also educational status, length of employment, saving practices and other factors, affecting the credit risk. For assessment of loan losses, the probability of collecting the loan and interest payments over the coming periods are considered, as well as discounted present value of estimated collections and anticipated proceeds from the realization of collateral, which together help to assess the amount of loss incurred of the loan. For these assessed loan losses, the relevant allowance has been established. Specific and group allowances (based on incurred loss estimation on the group basis) are provided for individually assessed loans, and group-based allowances for homogenous loan groups. Changes in the loan allowances are presented on the income statement under "Value adjustments of advances and off-balance sheet commitments". Interest income on loans is presented on the income statement under "Interest income". More detailed overview of the credit risk management principles is given in Note 2 “Risk management and maintenance policy” (see page 34).
22

1.5.2. Financial assets at fair value through profit or loss Financial assets at fair value through profit or loss include:
• financial assets held for trading • financial assets designated at fair value through profit or loss at inception
Financial assets held for trading This group of financial assets includes securities acquired or incurred principally for the purpose of selling or repurchasing in the near term, and derivatives. Securities acquired or incurred principally for the purpose of selling or repurchasing in the near term This group includes shares and bonds acquired for trading purpose. Trading securities are initially recognized at fair value net of transaction costs on the trade date and are subsequently presented in fair value. The fair value of held for trading securities quoted on an active market are based on current bid prices. The shares not quoted on an active market are revalued in fair value according to the price of the last transaction. If this price is not reliable, the shares are revaluated into fair value based on all available information regarding the investment value. For held for trading debt securities, which are not quoted on an active market, cash flows are discounted at market interest rates, issuer's risk added. In any case, if the market for a financial asset is not active, the Group establishes fair value by using valuation techniques. These include the use of recent arm’s length transactions, discounted cash flow analysis, and other valuation techniques commonly used by market participants. The unrealized and realized result of the trading securities is recorded in income statement under "Net profit from financial activities". Derivatives Derivatives (forward-, swap- and option transactions) are initially recognized at fair value net of transaction costs on the trade date and are subsequently presented at fair value. If derivatives are quoted on an active market, market value is used as a fair value. If not, the valuation techniques are used to find the fair value. These transactions are booked in balance sheet as assets, if their fair value is positive and as liabilities, if the fair value is negative. The fair values of derivative assets and liabilities recorded in balance sheet are not netted. The Group does not apply hedge accounting principles for the accounting of derivative financial instruments. In valuation of currency derivatives (excl. currency options), future cash flows are discounted using market interest rates. Currency and equity options are revalued to market value, if active market exists. If a reliable market value can not be obtained, the fair value of options is calculated by using the Black-Scholes model. Currency forward and swap transactions are valued by discounting future cash flows using effective interest rate. Respective interest income is presented in the income statement under "Interest
23

income". The realized profit and unrealized gain/loss from the revaluation of derivatives is recorded in the income statement under "Net profit from financial activities". Financial assets designated at fair value through profit or loss at inception In this class of securities are classified securities where the company has upon initial recognition designated the securities to be recorded as at fair value through profit or loss and as a result the changes in the fair value of these securities are consistently recognized in the profit or loss of the reporting period. In the current reporting period this class of securities includes the portfolio of investments acquired and held to cover the insurance and investment contracts concluded by the life insurance company belonging to the group. The realized and unrealized result from the revaluation of these securities is recorded in the income statement under “Other operating income”. 1.5.3. Available for sale financial assets Securities are classified as available for sale financial assets, if they do not belong to one of the aforementioned categories: financial assets held for trading or other financial assets at fair value through profit or loss. Available for sale securities are the shares and bonds, acquired either with intention to sell at some point in the long-term future or with strategic purpose for long-term holding. Available for sale financial assets are recorded at fair value plus transaction costs on their settlement date. Subsequently they are carried at fair value. If the assessment of fair value is not reliable, the securities will be presented at amortized cost (i.e. original acquisition cost less possible write-downs). The gains and losses arising from changes in the fair value of available for sale financial assets are recognized directly in equity under “revaluation reserve”. When the financial asset is derecognized or impaired the cumulative gain previously recognized in equity on that specific instrument is to the extent reversed from equity and the remaining portion is recognized in income statement under "Income from securities". 1.6. Offsetting financial instruments Financial assets and liabilities are offset only, when there is a legally enforceable right to offset and there is an intention to settle on net basis or realize the asset and settle the liability simultaneously. 1.7. Tangible and intangible assets other than goodwill Land, buildings and other assets of long-term use are recognized in the balance sheet as tangible fixed assets. Intangible assets comprise acquired software. Fixed assets are recorded at acquisition cost, consisting of the purchase price, non-refundable taxes
24

and other direct costs related to taking the asset into use. Tangible fixed assets are subsequently stated at historical cost less depreciation and any impairment. Depreciation is calculated as of the month of acquisition until full depreciation of the asset. Assets are depreciated on straight-line-basis. Depreciation calculation is based on useful life of the fixed asset, which serves as basis for forming the depreciation rates. Buildings are depreciated over 20-50 years, intangible assets with limited lifetime over 3-5 years, and other fixed assets over 2-10 years. Land is not depreciated. For assets having a substantial residual value, only the difference between the acquisition cost and the residual value is depreciated to expense over the useful lifetime of the asset. In case the residual value becomes to be greater than the carrying value of the asset, no further depreciation expense is calculated. At each balance sheet date the appropriateness of depreciation rates, methods and residual values are assessed. The Group reviews fixed assets for impairment losses whenever events or changes in circumstances indicate that the carrying amount may not be recoverable. An impairment loss is recognized for the amount by which the carrying amount of the asset exceeds its recoverable amount, which is the higher of an asset’s net selling price and value in use. Depreciation and impairment is recorded in the income statement under "Value adjustment of real estate investments, tangible and intangible assets". Capitalisation of expenses Reconstruction expenditures of bank offices are capitalized as tangible assets and are subsequently charged to the income statement on a straight-line basis over five years or over the period of the lease, if that is shorter. Establishment and Development Costs Establishment and development costs are not capitalized. Advertising expenses and the expenses for launching of new products, services and processes are recognized as an expense as incurred. Expenditures related to trademarks etc., developed by the company itself, are also recorded as expense as incurred. 1.8. Goodwill Goodwill represents the excess of the cost of an acquisition over the fair value of the company’s share of the net assets acquired at the date of acquisition, reflecting the part of the acquisition cost that was paid for the assets that are not separately identifiable for the balance sheet purposes. Goodwill acquired from acquisition of a subsidiary is recorded in balance sheet as an intangible asset on a separate line. Goodwill acquired from acquisition of an associate is included in the cost of an associate in the balance sheet. Goodwill is recorded in the balance sheet at the date of acquisition. Subsequently goodwill is recorded in its historical cost less any impairment losses recognized. Goodwill arising from business combinations is not depreciated. Goodwill is instead tested annually (or more frequently if events or changes in circumstances indicate that the impairment may have incurred) for impairment by comparing the carrying amount of the goodwill to its recoverable amount. Goodwill is allocated to cash-generating units for the purpose of impairment testing and the recoverable amount is
25

determined by discounting the expected cash flows of the relevant cash generating unit. An impairment loss is recognized for the amount by which the carrying amount of the goodwill exceeds its recoverable amount. Amortization calculations for goodwill balances recognized as a result of business combinations incurred before 1 January 2005, have been terminated since the 1 January 2005, the impairment test has been performed as at balance sheet date and in case necessary the impairment loss has been recognized in income statement. 1.9. Investment properties Investment properties comprise property (land, buildings), which is held for the purpose to earn rental income or gain from the growth in its market value, and which is not occupied by the Group for its own business activities. Investment properties are initially recorded at acquisition cost, consisting of the purchase price and other direct costs related to its acquisition. Subsequently investment property is carried at fair value using discounted cash flow method. Changes in fair value are recorded in the income statement under “Value adjustments of real estate investments, tangible and intangible assets”. Investment property carried at fair value is not depreciated. 1.10. Assets held for sale Assets are classified as assets held for sale and stated at the lower of carrying amount and fair value less costs to sell if their carrying amount is recovered principally through a sale transaction rather than through a continuing use. Assets held for sale are tangible or intangible assets, for which the objective of the management is to dispose these assets, and where it is reasonably expected that these assets will be disposed within 12 months and where the management has commenced active sales activities and the assets are offered for sale at a reasonable price compared to their fair value. Depreciation calculation is terminated for the assets held for sale. Assets held for sale are recorded in balance sheet under “other assets”. 1.11. Impairment of non-financial assets Assets with an indefinite useful life are not subject to amortization and are tested annually for impairment, comparing the carrying value of the asset to its recoverable value. Assets that are subject to amortization are reviewed for impairment whenever events or changes in circumstances indicate that the carrying amount may not be recoverable. In such circumstances the recoverable value of the asset is assessed and compared to its carrying value. An impairment loss is recognized for the amount by which the asset’s carrying amount exceeds its recoverable amount. The recoverable amount is the higher of an asset’s fair value less costs to sell and value in use. For the purposes of assessing impairment, assets are grouped at the lowest levels for which there are
26
separately identifiable cash flows (cash-generating units). 1.12. Leases – a group is the lessee Leases of assets where the company acquires substantially all the risks and rewards of ownership are classified as finance leases. Other leases are classified as operating leases. Finance leases are capitalised at the inception of the lease at the lower of the fair value of the leased property or the present value of the minimum lease payments. Each lease payment is allocated between the repayment of a liability and finance charges (interest expense). The interest element of the finance cost is charged to the income statement over the lease period so as to produce a constant periodic rate of interest on the remaining balance of the liability for each period. Fixed assets acquired under finance leases are depreciated similarly to acquired assets over the shorter of the useful life of the asset or the lease term. Operating lease payments are recognised in income statement as expense over the rental period on straight line basis. The Group uses operating lease mainly for renting buildings. 1.13. Financial liabilities Deposits Deposits are recognized in the balance sheet on their settlement date at fair value net of transaction costs and are subsequently recorded at amortized cost on line “due to customers of credit institutions” without accrued interests, which is presented under “accrued expenses and deferred income". Interest expenses are recorded in the income statement under "Interest expenses". Borrowings and issued securities Borrowings and issued securities are recognized initially at fair value net of transaction costs (the proceeds received, net of transaction costs incurred). Borrowings and securities are subsequently stated at amortized cost using the effective interest rate method; any difference between proceeds (net of transaction costs) and the redemption value is recognized in the income statement over the period of the borrowings. The effective interest rate is the rate that exactly discounts the expected stream of future cash payments through maturity. The amortization of the transaction costs is presented in the income statement together with the interest expenses. The respective interest expenses are recorded in the income statement under "Interest expenses". Unused loan limit is presented as contingent asset. Financial liabilities of an investment contract with discretionary participation feature The financial liability of investment contract with discretionary participation feature comprises of payments received from contracts and interest credited to the contracts less administration fees and risk covers accounted for the past period. The annual guaranteed interest rate on these contracts remains between 3% and 4%, depending on the type of contract, time of conclusion and the currency of the
27

specific contract. Depending on the type of contract, the interest rate is guaranteed either until maturity or for 5 years from conclusion of the contract, thereafter it may be changed. The financial liability also includes the amounts of additional profits assigned to the policyholders for the former contract years. Financial liabilities of an investment contract without discretionary participation feature This class contains unit-linked contracts and their financial liabilities, which are initially recognized at their acquisition value and which are subsequently valued at the fair value of underlying securities virtually connected with these contracts. 1.14. Provisions Provisions are recognised when the company has a present legal or constructive obligation as a result of past events, it is probable that an outflow of resources will be required to settle the obligation, and a reliable estimate of the amount can be made. The provisions are recognised based on the management’s estimates regarding the amount and timing of the expected outflows. When it is a probable that the provision is expected to realise later than 12 months after the balance sheet date it is recorded at discounted value (present value of expected outflows), unless the discounting effect is immaterial. Expense from provisions is recorded in the income statement for the period. Life insurance technical provisions Life insurance provision Life insurance provision in the balance sheet includes obligations from insurance contracts to the policyholders calculated on basis of actuarial methods, and the unearned premiums’ provision arising from transfer of the risk premium to the following accounting periods. The provision is calculated on individual contractual basis and comprises of discounted present value of future outflows (sum insured, surrenders and calculated costs) less discounted present value of future premiums of the insurance contracts to be received. The future expenditures of the insurance contract and discounting interest rates used in calculation of the life insurance provision are the same values used in calculating the insurance premium for these contracts. The annual interest rate on these contracts remains between 2.5% and 4%,, depending on the type of contract, time of conclusion and the currency of the specific contract. The life insurance provision includes also the amounts of additional profits assigned to the policyholders for the former contract years. Provision for outstanding claims Provision for outstanding claims includes the amount, covering estimated expenditures in connection with disbursements of sums insured and surrenders of insurance contracts, which are caused by insurance events or cancellation of contracts incurred before the end of the reporting period. Claims, reported before the balance sheet date, are assessed individually. The provision for claims, which are incurred but not reported by the balance sheet date, is calculated with a statistical estimation, based on the previous experience of dates of reporting and dates of incurring of claims.
28

Provision for bonuses for insurance contracts Provision for bonuses for insurance contracts includes amounts, which are based on the decision of management assigned to the insurance contracts in the reporting perion and on the account of which the life insurance provisions or financial liabilities will be increased or bonus disbursements made in the following reporting periods. Liability adequacy test A liability adequacy test is carried out according to IFRS 4 on the liabilities of insurance contracts and investment contracts with discretionary participation feature, based on discounting the future estimated cash flows from the portfolio of contracts. The cash flows used in the test are expected contractual premiums, disbursements and administration costs by years. When estimating the future premiums and disbursements, the mortality, surrender rates and rates of converting into waiver of premiums, are estimated based on historical patterns of the portfolio contracts. When estimating the future expected administration costs, the present average administration cost per contract is used. The resulting cash flow year by year has been discounted with the risk-free EUR interest rate of the respective year. EUR interest rate has been used as the Estonian kroons are begged to EUR at a fixed rate since 1999 and EUR rates are considered most reliable for valuation purposes here, even more as also the majority of the investments matching the insurance liabilities are nominated in EUR. If the resulting value of the liabilities estimated with the given liability adequacy test becomes higher than the amount of liabilities calculated under the aforementioned approaches (less capitalized deferred acquisition costs), then firstly the capitalized deferred acquisition costs are decreased, followed by increase of liabilities (if necessary). The respective loss is presented in the income statement for the period. Based on the results of the liability adequacy test performed as at the year end of 2005, the liabilities arising from currently in force insurance contracts and investment contracts with discretionary participation feature are sufficient. Risk free interest rate curve has the biggest influence to the results of lability adequacy test. Shifting down interest rate curve by 1% the result of test would rise by 119 million EEK, but corresponding liabilities would be still adequate. Minor impact to the test result have also assumptions made for predicting future cash flows. These are assumptions about mortality, lapses of contracts, surrenders of contracts and future administrative costs. 1.15. Classification and accounting principles of life insurance contracts According to International Financial Reporting Standard IFRS 4 the contracts concluded by the life insurance company with its clients are starting from 2005 classified as either insurance contracts or investment contracts. For the purpose of IFRS 4, all contracts with a fixed payment schedule are classified as insurance contracts (except for single payment child insurance) and the part of free payment schedule contracts, which covers the insurance risks. These contracts are classified as insurance contracts, since they contain significant insurance risk, in the meaning of IFRS 4.
29

As a general guideline an insurance risk is defined as the possibility of having to pay benefits on the occurrence of an insured event that are at least 5% more than the benefits payable if the insured event did not occur. Free payment schedule contracts with guaranteed interest and single payment child insurance are classified as investment contracts with discretionary participation feature. Unit-linked contracts are classified as investment contracts (without discretionary participation feature). Accounting principles for insurance contracts and investment contracts with discretionary participation feature have not changed in applying IFRS 4 accounting principles. The financial liabilities and assets of investment contacts not belonging under former classifications are estimated at fair value in the balance sheet. 1.16. Capitalisation of acquisition costs Acquisition costs of these insurance contracts, which are connected with premiums to be received in the future accounting periods, are deferred as prepaid expenses. Only direct acquisition costs, like the performance based salary paid for concluding the contracts and commission fees of contracts are deferred. Calculation is performed on the contractual basis and only for the insurance contracts, where the payment frequency is more than once a year. Depreciation of deferred acquisition costs is on straight-line basis, within period of two months to one year depending on the type of insurance contract. Other acquisition costs are recognized in expense as incurred. 1.17. Reserves According to the Income Tax Act valid until 2000 the credit institutions could form a tax-exempt general banking reserve up to 5% of the loan portfolio to cover potential losses. Allocations to this reserve could be deducted from the taxable income. According to the Commercial Code at least 5% of the net income has to be transferred into the statutory reserve capital every year, until the reserve capital comprises 10% of the share capital. The statutory reserve capital may be used for covering losses. Eesti Ühispank profit for the year 1994, 1995, 1996 and 1997 has been allocated to the general banking reserve (except for 6.2 million kroons from the 1995-year profit). The reserve amounts to 298.5 million kroons, including also the statutory reserve capital according to the Commercial Code. In 1998-2005 the bank made no allocations to the reserves. In 2001-2004 the subsidiaries of Eesti Ühispank made allocations to the statutory reserves from their undistributed profits in the amount of 9.6 million kroons.
30

1.18. Revenue recognition Interest income and expense Interest income and expense is recognized in income statement for all instruments carried at amortized cost using the effective interest rate method. Interest income includes also similar income on derivatives. The effective interest method is a method of calculating the amortized cost of a financial asset or a financial liability and of allocating the interest income or interest expense over the relevant period. The effective interest rate is the rate that exactly discounts estimated future cash payments or receipts through the expected life of the financial instrument to the net carrying amount of the financial asset or financial liability. When calculating the effective interest rate, the Group estimates cash flows considering all contractual terms of the financial instrument, but does not consider future credit losses. The calculation includes all significant fees paid or received between parties to the contract that are an integral part of the effective interest rate, transaction costs and all other premiums or discounts. Once a financial asset or a group of similar financial assets has been written down as a result of an impairment loss, interest income is recognized using the rate of interest used to discount the future cash flows for the purpose of measuring the impairment loss. Fee and commission income Fees and commissions are generally recognized on an accrual basis when the service has been provided. Credit issuance fees for loans/leases that are considered significant, are deferred and recognized as an adjustment to the effective interest rate on the credit. Portfolio management and other advisory service fees, as well as custody service fees are recognized based on the applicable service contracts, usually on an accrual basis. Asset management fees related to management of investment funds are recognized over the period the service is provided. Other transaction fee income and other income are recognized on accrual basis at the moment of executing the respective transactions. 1.19. Taxation Corporate income tax According to the Income Tax Act, the annual profit earned by enterprises is not taxed in Estonia and thus there are no temporary differences between the tax bases and carrying values of assets and liabilities and no deferred tax assets or liabilities arise. Instead of taxing the net profit, the distribution of retained earnings is subject to the taxation at the rate of 23/77 (until 31.12.2005: 24/76) on the amount paid out as net dividends. The corporate income tax arising from the payment of dividends is accounted for as an expense in the period when dividends are declared, regardless of the actual payment date or the period for which the dividends are paid.
31

Corporate income tax of foreign subsidiaries Profits earned by foreign subsidiaries, adjusted with temporary and permanent differences between the tax bases of assets and liabilities and their carrying values in the balance sheet, are subject to corporate income tax. The tax rate applicable to SEB Russian Leasing belonging to the SEB Eesti Ühispank Group and registered in Russia is 24% from taxable income. Deferred tax is provided for all temporary differences between the tax bases of assets and liabilities and their carrying values in the balance sheet. Main temporary differences arise from depreciation of fixed assets and tax losses carried forward. Deferred tax asset in respect of tax losses carried forward are recognized in the balance sheet only if their realization is probable. 1.20. Fiduciary activities The Group provides asset management services and offers fund management services. The assets owned by third parties, but managed by the Group, are excluded from these financial statements, as they are not assets of the Group. 1.21. Earnings per share Basic earnings per share are calculated by dividing the net profit of the year over the weighted average number of shares outstanding during the year. For the calculation of the diluted earnings per share the net profit and weighted average number of shares is adjusted by all potential ordinary shares that have a dilutive effect on earnings per share. 1.22. New International Financial Reporting Standards, interpretations of International Financial Reporting Interpretations Committee and amendments to published standards Certain new standards, amendments and interpretations to existing standards have been published by the time of compiling these financial statements that are mandatory for the company’s accounting periods beginning on or after 1 January 2006 or later periods. The Group’s estimate on the potential impact of applying the new standards and interpretations is given below:
1. IAS 1 (Amendment) - Presentation of Financial Statements: Capital disclosures. The amendment should be applied for annual periods beginning on or after 1 January 2007. The Group has decided not to adopt the amendments earlier. The standard requires additional disclosures in the financial statements.
2. IAS 19 (Amendment) - Employee Benefits: Actuarial Gains and Losses, Group Plans and
Disclosures. The amendment should be applied for annual periods beginning on or after 1 January 2006. As the Group has no defined benefit obligations, the amendment has no impact on Group’s financial statements.
32

3. IAS 39 (Amendment) – Financial instruments: Cash Flow Hedge Accounting of Forecast Intragroup Transactions; The Fair Value Option. The amendments apply for annual periods starting on or after 1 January 2006. The Group has decided not to adopt the amendments earlier. The Group believes that this amendment should not have a significant impact on the classification of existing financial instruments.
4. IAS 39 and IFRS 4 (Amendments): Financial Guarantee Contracts. The amendments apply
for annual periods starting on or after 1 January 2006. The Group has decided not to adopt the amendments earlier. The Group believes that this amendment should not have a significant impact on the classification of existing financial instruments.
5. IFRS 6, Exploration for and Evaluation of Mineral Resources. The standard is not relevant to
the Group’s operations, as the Group does not carry out exploration for and evaluation of mineral resources.
6. IFRS 7, Financial Instruments: Disclosures. IFRS 7 should be applied for annual periods
beginning on or after 1 January 2007. The Group has decided not to adopt the standard earlier. The standard requires additional disclosures in the financial statements.
7. IFRIC 4, Determining whether an Arrangement Contains a Lease. IFRIC 4 should be applied
for annual periods starting on or after 1 January 2006. The Group has decided not to adopt the standard earlier. The Group believes that application of this interpretation should not have a significant impact on the recording of existing arrangements in company’s financial statements.
8. IFRIC 5, Rights to Interests arising from Decommissioning, Restoration and Environmental
Rehabilitation Funds. The Group does not participate in decommissioning, restoration and environmental rehabilitation funds, thus the interpretation has no impact on Group’s financial statements.
9. IFRIC 7, Applying the Restatement Approach under IAS 29 Financial Reporting in
Hyperinflationary Economies. IFRIC 7 should be applied for annual periods starting on or after 1 March 2006. The Group does not prepare its financial statements in a currency of a hyperinflationary economy, thus the interpretation has no impact on Group’s financial statements.
33

2. Risk management and maintenance policy Risk policy and structure In its everyday activity SEB Eesti Ühispank is facing various risks, the management of which is an important and integral part of SEB Eesti Ühispank business activities. The ability of the organisation to identify, measure and control different risks is an important input for the profitability of the entire company. SEB Eesti Ühispank defines the risk as a possible negative deviation from expected financial result. Main risk factors are credit risk, market risk, operational risk and liquidity risk. Main advances of risk management in 2005 were testing new market risk measurement system (EVAR), continuing development of liquidity model, conducting regular operational risk self-assessments (ORSA), preparing for implementation of operational risk management information system (ORMIS) in 2006 and ongoing participation in the project of implementing the Basel II requirements. Requirements set by the Bank of Estonia and other regulatory bodies, adherence to the general accounting standards and good banking practice and internal regulations and risk policies form the risk management basis. Risk management generally embraces identification, measuring and controlling of the risks. The Assets and Liabilities Committee (ALCO) plays the central role in risk management, approving of risk procedures and establishment and monitoring of various risk limits. Besides ALCO different committee systems are established complementing each other, the assignment of which is systematic monitoring of risks. Credit risk Credit risk is a potential loss that may occur in case of improper fulfilment or non-compliance of the client with the contractual obligations as a result of failure of the client’s business operations or other factors. The principles for measuring and taking credit risk are established with the SEB Eesti Ühispank Group credit policy. The principles of credit policy are the following: a) lending should be in line with credit policy; b) lending should be based upon analysis; c) the basis of all lending activity is credibility; d) the purpose of the credit should be fully understood; e) lending must be in proportion to the capacity to repay; f) borrower should have an identified source of repayment and also a second way for repaying .....the loan; g) the equity investment of the borrower must be significant in relationship to the loan; h) lending activity shall take into account any potential adverse effects in the business cycle; i) lending shall be in line with the bank’s profit goals. Credit risk analysis related to a certain client involves several different activities, like evaluation of the risk of the borrower’s background, structure, management and owner, economic environment and position of the borrower, analysis and evaluation of the business plan and submitted cash flow
34

prognosis; evaluation of the familiarity, reliability and credit history of the client. Deciding on the risk taking is performed collegially by credit committees and by the authorised persons in accordance with the decision-making limits established by the bank’s management. Credit risks are mainly measured on two levels. For verifying the loan portfolio’s exposure to credit risk, SEB Eesti Ühispank uses a portfolio diversification method. The division of financial obligations is monitored by different products, clients and industries. The Credit Area performs monthly analysis on the credit risk of loan portfolio and informs the bank’s managing bodies of the results. In respect to individual clients the bank prepares regular analyses on the borrowers’ situation as well as their risk level. The analyses are based on annual and quarterly reports, on basis of which the financial situation is evaluated, as well as on credit history and information originating from other sources. Evaluation of the borrowers’ reliability is of material importance. Based on the results of the analysis, the clients - being legal persons with credit risk assumed by SEB Eesti Ühispank Group exceeding 2,000,000 Estonian kroons – are divided into sixteen risk classes in accordance with the SEB Eesti Ühispank client rating system.
Risk class Explanation 1 2 3 4 5 6 7 8 9 10 11
Ordinary Business
12 Special Observation 13 14 15
Watch-list
16 Default According to the client rating system the risk class assignment is not required for companies or a group of companies with credit risk assumed by the group less than 2,000,000 Estonian kroons. Evaluation of these borrowers is based on the same grounds as of the borrowers with assigned risk class. In analysing mortgage loans the credit scoring and left-to-live model is used. The model considers among other matters credit history, income, age, employment conditions and assets and the output of the model is credit score and lending recommendation based on the score.
35
Private individuals are on basis of their payment history divided into five risk classes: Risk class Explanation 1 Borrower makes prompt principal and interest payments, presumably there is no problem with loan repayment. 2 Financial position of the borrower is stable, however certain unfavourable factors may influence the loan repayment. 3 Financial position of the borrower is unstable, problems with making principal and interest payments. 4 Financial position of the borrower is weak; problems with further servicing of the loan. 5 Further loan servicing is unlikely. Risk classes of private individuals are updated on monthly basis. Review of the situation and risk level of legal persons is performed on regular basis, at least once a year. During the review the bank assesses the client’s financial condition, risk level, regularity of fulfilling existing financial obligations and need for financing. As an important outcome, a risk class is assigned to the client with exposure exceeding 2 million kroons, which, depending on the risk class shall be valid for one year, half a year or three months. With the resolution of a credit committee also a different (shorter) term may be established to the risk class of a client but no longer than the aforementioned terms. Primary responsibility for monitoring the quality lies with client executives, who shall inform immediately their department head and if necessary, the credit area of occurred problems and accordingly take necessary measures. Provided, during the valuation of the loan it becomes evident that the loan or part of it is doubtful and the collateral is insufficient for covering the loan amount together with accrued interest and penalties, i.e. a loan loss may be assumed, a reserve for loan loss i.e. allowance will be established for the loan. Specific and collective allowances are established for individually appraised loans and separate allowances used for homogeneous groups of loans appraised on a group level. The purpose is to calculate and present the actual value of the loan portfolio as fairly and objectively as possible. For decreasing real loan losses a separate department has been established within the Credit Area, handling problem loans and recovering written-off loans by using several methods in doing so: negotiations with clients, rehabilitation, execution and bankruptcy proceedings. The head office credit control department and credit risk management departments of the offices perform regular in-depth survey of the quality of the loan portfolio. Also the bank's internal audit carries out a survey and valuation of the loan portfolio and external auditors review the valuation of the loan portfolio. During the control the adherence to procedures, availability of required information and documents, regularity of loan servicing (repayments), adequacy of collateral and other factors influencing the risks is verified. In order to diminish credit risk the bank has established a requirement for the borrowers to provide the bank with collateral in the form of registered immovable property, registered movable property and/or personal sureties as security. The principles for granting an unsecured loan are stated in the credit policy. The pledged assets have to be insured throughout the loan period in an insurance firm accepted by the bank at least within the restoration value. In case of a housing loan also life insurance is required, if
36

the borrower is contributing majority to the family’s income. The aforementioned measures help to decrease the credit risk as they serve as an alternative in collecting the loan facility, in case the borrower is not able to repay the loan from primary cash flow. Market risk SEB Eesti Ühispank defines market risk as a potential loss resulting from the unexpected adverse changes in interest rates, foreign exchange rates, equity prices and associated volatilities. Market risk may arise from the bank’s activity at the financial markets and it has an impact on the majority of bank products: loans, deposits, securities, credit lines. SEB Eesti Ühispank calculates the risks on daily basis using different methods of risk valuation and management pursuant to the type of risk. Important role in risk prevention is diversification of risk assets and limitation for trading positions. The risk assets can be divided into short-term or trading positions and long-term or investment positions. The purpose of trading positions is to earn profit on short-term price fluctuations. Due to different risk characteristics the risks of trading positions and investment positions are valued individually. If necessary, different instruments facilitating risk management are used. Maximum limits approved by the committees, which are in compliance with the limits set by the Bank of Estonia, form the basis for controlling and monitoring the risk of various instrument portfolios. For positions related to market risk nominal limits are applied, which are monitored by trading portfolios on daily basis. Any limit breach shall be reported in accordance with the regulations of market risk policy. In addition to the aforementioned, also scenario analysis is applied in market risk management, which is used for valuing the performance of trading positions in case of more extreme fluctuations in market variables. Market risk for trading portfolios is measured by using the “Value at Risk” (VAR) model. VAR is defined as a maximum potential loss on the financial instruments’ portfolio over a specified period of time at a given level of confidence. VAR is calculated on trading positions daily, using a 99 percent confidence level, meaning that on one day out of hundred the loss may exceed the computed amount. VAR model enables to effectively measure market risks associated with different instruments and the results are homogeneously comparable. There are three basic methods for calculating VAR: parametric method, historical simulation, Monte Carlo simulation. SEB Eesti Ühispank is using the parametric method on a daily basis. This method considers the diversification effect arising out of different financial instruments. Analysis is based on volatility of historical market variables and presumes that asset returns are normally distributed. The bank also uses other VAR methods, as necessary. The reliability of VAR model is controlled using so called back-testing, where the actual profit/loss is compared with the profit/loss over the given period estimated with VAR model. In addition to the Bank of Estonia prudential ratios the bank uses also Delta1% methodology for measuring the ALM (assets-liability mismatch) risk, arising from the structure of interest earning assets and interest bearing liabilities. SEB Eesti Ühispank defines Delta1% as decrease of potential
37

return due to one-percent change in market rates. In Delta1% calculation it is assumed there is a parallel shift in the yield curve, which means that all interest rates (long- and short-term) will change by 100 b.p. Delta1% method enables to effectively measure the impact of interest rate changes to interest bearing assets and liabilities. Delta1% limit is monitored as a negative or positive net position respectively, depending of which one is higher. The market risk “Capital at Risk” (CAR) is used to measure the bank’s capital need for covering potential risks. CAR is calculated over a one-year period on a higher level of confidence (99.97%) and for the total balance sheet of the bank. The market risk is one the most important risks for SEB Ühispanga Elukindlustus. Market risk in a life insurance company derives from the risk of investing the assets under insurance contracts and investment contracts with guaranteed interest. This risk is managed in SEB Ühispanga Elukindlustus with an investment policy, which establishes investment restrictions of the aforementioned assets between shares and bonds, as well as the diversification requirements of assumed positions towards the clients. The European Union is working on new insurer capital adequacy requirements under project Solvency II, where the assessment of market risk plays a major part. SEB Ühispanga Elukindlustus is making efforts to assess its market risk in conformity with the Solvency II project and in line with the practices of other SEB Group life insurance companies. Liquidity risk Liquidity risk is defined as the risk for a loss or substantially higher costs than calculated due to inability of the Bank to meet its payment commitments on time. The bank's liquidity risk is regulated and managed on basis of the mandatory reserve of the Bank of Estonia and internal liquidity limits determined by ALCO. Liquidity risk is measured as cumulative cash flows arising from the assets and liabilities of the Bank in various time bands. Liquidity management is based on special models reflecting cash flow behaviour in the case of different scenarios including crisis scenario. Long-term liquidity of the bank is planned and control over liquidity risk management is executed by ALCO. Central and daily management of the bank’s liquidity is the responsibility of the Treasury, and analysing that of the Risk Control department. Operational risk Operational risk is the possibility of loss due to external factors (e.g. natural disasters, external crime) as well as internal factors (breakdown of IT systems, fraud, non-compliance with laws and internal procedures and other internal control system deficiencies). SEB Eesti Ühispank has established Operational Risk Committee (ORC) – top level advisory group to group’s management on operational risk issues. Operational Risk Committee is a body guiding and co-ordinating the operational risk management in all units, including security work of SEB Eesti Ühispank, evaluation of technological risks and quality management, acting within the authority granted by the SEB Eesti Ühispank Management Board. Following could characterize SEB Eesti Ühispank operational risk management framework:
38

• Reporting of operational risk events (losses, near misses and extraordinary gains), which insures that every event is registered in loss database and major events are followed-up. Monthly reviews of events are presented to ORC.
• Set of Key Risk Indicators has been developed and used on a regular basis. Fluctuations of indicators and reasons of such fluctuations are discussed at monthly ORC meetings.
• Regular implementation of operational risk self-assessment (ORSA) since year 2004. • New product approval process has been implemented in order to minimize operational risk in
product development. • Business continuity planning - outlining of business continuity plans for most critical business
processes, recovery plans for IT and insuring physical security in crisis situations. Operational Risk Policy states minimum standards for operational risk management Insurance agreements concluded by Skandinaviska Enskilda Banken AB applied to SEB Eesti Ühispank cover the following:
• crime insurance, • professional indemnity, • directors and officers liability, • damage caused to a third party resulting from the activity of the bank.
The purpose for managing information technology (IT) risks is to guarantee economically justified safety of the information of SEB Eesti Ühispank and financially optimal lowering of security incidents that would suspend the bank’s critical business processes and cause business loss. SEB Eesti Ühispank data security group ensures evaluation and management of risks in the IT Area. SEB Eesti Ühispank IT infrastructure ensures the security of data and information systems with implementing respective security measures (firewall, detection and repel of an attack, virus protection, implementation of access policy, etc). SEB Eesti Ühispank Operational Risk Policy is realised through implementation of security measures, adherent to security requirements, established on basis of risk analysis. Prior to implementation of any new banking products, they are analysed in respect to information technology risks, if necessary the technological support of the product is modified in a way to adhere to the required security level. Designing process of information security consists of the following stages: • Defining information assets and their managers • Defining security requirements for information assets • Determining security measures – a detailed analysis and detailed description of security
measures, if necessary • Risk analysis and financial justification, accepting residual risks and determining residual
security measures • Operating information security:
• Monitoring / maintenance of changes / incidents • Regular accreditation of information security • Handling information security incidents
39

3. Changes concerning transition to IFRS Changes in accounting principles and presentation SEB Eesti Ühispank has starting from 1 January 2005 prepared its financial statements in accordance with International Financial Reporting Standards (IFRS). IFRS has been adopted as of 1 January 2005 and the transition date for the group is 1 January 2004. Balance sheet as at transition date (1.1.2004) is not included here as there are no differences at that date against the Estonian GAAP balance sheet. The Group has applied IFRS 1 rules for First-time Adoption of IFRS. The accounting policies set out in Note 1 have been consistently applied to all the years presented except for the following exemptions applied according to IFRS 1: (a) Business combinations exemption The Group has applied the business combinations exemption in IFRS 1. It has not restated business combinations that took place prior to the 1 January 2004 transition date. (b) Cumulative translation differences exemption The Group has elected to set the previously accumulated cumulative translation to zero at 1 January 2004. This exemption has been applied to all subsidiaries in accordance with IFRS 1. (c) Exemption from restatement of comparatives for IAS 32 and IAS 39. The Group elected to apply this exemption. It applies previous GAAP rules to derivatives, financial assets and financial liabilities for the 2004 comparative information. The adjustments required for differences between GAAP and IAS 32 and IAS 39 are determined and recognised at 1 January 2005. (d) Insurance contracts exemption The Group elected to apply this exemption. It applies previous GAAP rules to insurance contract for the 2004 comparative information. The adjustments required for differences between GAAP and IFRS 4 is presented in Note 31. In preparing first IFRS financial statements, the accounting principles were changed. To ensure comparability of reporting after change of accounting principles, the opening balances of 2005 have been adjusted and the retained earnings of 2004 and former periods were adjusted respectively pursuant to the new accounting principles (Exemptions from full retrospective application elected by the Group have been described above). The impact on the opening reserve as at 1.1.2004 (transition date) was not material.
40
The following accounting principles have been changed for consolidated financial statements: 3.1. IAS 39 The unrealised profit/loss from the change of fair value of available for sale financial assets is presented in equity as a value adjustment reserve of financial assets in the amount of 8.6 million kroons and the retained earnings of previous periods were reduced by 8.6 million kroons. The gain/loss to be received from the sale of these financial assets and any impairment losses are recognized in income statement for the respective period of the transaction. 3.2. IAS 40 From application of IFRS 40 and implementation of the harmonized accounting principles by the parent company, the principle of accounting for property investments has been changed. Starting from 1 January 2005 the property investments are recorded at their fair value. The profit/loss from the changes in fair value are recognized in the in the income statement of the accounting period. Until 2004 the property investments were recorded at their acquisition cost less accumulated depreciation and impairment losses recognized. 3.3. IFRS 4 The financial liabilities of life insurance investment contracts have been reclassified from life insurance provisions to financial liabilities and are now recorded in balance sheet under “other liabilities”. Accordingly, financial liabilities increased by 408.6 million kroons and the provisions decreased by 408.6 million kroons in the balance sheet. Comparatives for 2004 were not adjusted. In addition, the accounting principles for accounting for income from the contracts concluded with the clients of life insurance have changed in applying IFRS 4. Starting from 2005 the collections from insurance contracts (as defined in IFRS 4) are recorded in income statement as insurance premium income and the collections from investment contracts are divided to acquisition value of the investments, which is then recorded as a financial liability in the balance sheet, and management fee from the investment contract, which is accounted for as fee income in income statement. In former periods all these collections were recorded in income statement as insurance premium collected. The following changes were made to the 2004 income statement and balance sheet: 3.4. IFRS 3 Goodwill is not depreciated and an impairment test is performed annually for valuation of goodwill. Accordingly, the amortization of goodwill expensed in 2004 has been adjusted (reduced) by 31.2 million kroons and the carrying value of goodwill in balance sheet was increased by 31.2 million kroons.
41

3.5. IFRS 1 Accumulative unrealised exchange rate difference between the equity entries has been reclassified. Accordingly, the unrealised exchange rate differences has been reduced by 1.3 million kroons and retained earnings have been increased by 1.3 million kroons. 3.6. Other adjustments to presentation In 2004 the life insurance profit was recorded on one line under other operating income in the group income statement. In 2005 the income and expenses from insurance activities are summarised on the row "Other operating income" and other operating expenses are consolidated line by line in the income statement, whereas intra-group transactions have been eliminated. The income statement balances of comparable period have been adjusted to correspond to the method of presentation of the reporting year (see Note 11). The following changes were made to the accounting principles of the separate financial statements of the parent company: 3.7. IAS 27 Investments into subsidiaries and associates, which were previously accounted for using equity method, are now presented in the separate financial statements of the parent company at cost. Accordingly, the value of investments into subsidiaries and associates were reduced by 651.8 million kroons and the profit calculated using the equity method for 2004 was reduced by 303.7 million kroons, the retained earning for previous periods were reduced by 348.1 million kroons.
42

Income Statement Group Bank(millions of EEK) 2004 Change 2004 2004 Change 2004
Estonian IFRS Estonian IFRSGAAP GAAP
1.Interest income 1,369.5 1,369.5 1,143.4 1,143.4
1.1. Interest income from banking activities 981.3 981.3 1,143.4 1,143.41.2. Interest income from leasing activities 356.9 356.9 0.0 0.01.3. Other interest income 31.3 31.3 0.0 0.02. Interest expenses 496.4 496.4 494.6 494.62.1. Interest expenses from banking activities 492.2 492.2 494.6 494.62.2. Interest expenses from leasing activities 4.2 4.2 0.0 0.02.3. Other interest expenses 0.0 0.0 0.0 0.03. Net Interest Income 873.1 873.1 648.8 648.84. Income and expenses from insurance activities (+/-) 0.0 0.0 0.0 0.04.1. Insurance premium (net) 0.0 0.0 0.0 0.04.2. Insurance compensations and changes in provisions (net) 0.0 0.0 0.0 0.05. Income from securities 3.9 3.9 303.7 -303.7 0.05.1. Profit from equity method 3.9 3.9 303.7 -303.7 0.05.2. Profit/loss from sale of long term investment (+/-) 0.0 0.0 0.0 0.05.3. Dividends from long term securities 0.0 0.0 0.0 0.06. Net income from fees and commissions 421.1 421.1 314.3 314.36.1. Fee and commission income 597.2 597.2 459.7 459.76.2. Fee and commission expense 176.1 176.1 145.4 145.47. Net profit fom financial activities 80.3 80.3 83.0 83.07.1. Profit/Income 80.4 80.4 90.9 90.97.2. Loss/Expense 0.1 0.1 7.9 7.98. Administrative expenses 572.0 572.0 524.6 524.68.1. Salaries 258.4 258.4 227.0 227.08.2. Social insurance tax, unemployment insurance tax 88.8 88.8 78.1 78.18.3. Pension expense 0.0 0.0 0.0 0.08.3. Other adminastrive expenses 224.8 224.8 219.5 219.59. Value adjustments of investment properties, tangible
and intangible assets (+/-) -111.5 31.2 -80.3 -97.4 31.2 -66.29.1. Profit/Income 0.0 0.0 0.0 0.09.2. Loss/Expense 111.5 31.2 80.3 97.4 31.2 66.210. Value adjustments of advances and off-balance sheet
commitments (+/-) -31.5 -31.5 -27.8 -27.810.1. Profit/Income 67.5 67.5 36.8 36.810.2. Loss/Expense 99.0 99.0 64.6 64.611. Value adjustments of long term investments (+/-) -2.4 -2.4 -4.2 -4.211.1. Income 8.8 8.8 6.5 6.511.2. Expense 11.2 11.2 10.7 10.712. Other operating income 50.2 50.2 16.2 16.212.1. Other operating income 79.4 79.4 34.3 34.312.2. Other operating expense 29.2 29.2 18.1 18.113. Extraordinary income/expense (+/-) 0.0 0.0 0.0 0.013.1. Extraordinary income 0.0 0.0 0.0 0.013.2. Extraordinary expense 0.0 0.0 0.0 0.014. Profit before taxation 711.2 742.4 712.0 439.415. Income tax expenses -0.8 -0.8 0.0 0.015.1. Income tax of financial period -0.8 -0.8 0.0 0.015.2. Change of potential income tax commitment 0.0 0.0 0.0 0.016. Minority interest 0.0 0.0 0.0 0.017. Net profit for reporting period 712.0 31.2 743.2 712.0 -272.6 439.4
43

Balance Sheet Group Bank(millions of EEK) 31.12.04 Change 31.12.04 31.12.04 Change 31.12.04
Estonian IFRS Estonian IFRSASSETS GAAP GAAP
1. Cash 443.5 443.5 443.5 443.52. Loans and advances 31,692.7 31,692.7 31,383.9 31,383.93. Debt securities and other fixed income
securities 296.0 296.0 189.2 189.24. Shares and other securities 370.0 370.0 1,129.1 -651.8 477.34.1. Shares and participations in affiliates 33.6 33.6 32.4 -5.0 27.44.2. Shares and participations in subsidaries 0.0 0.0 993.6 -646.8 346.84.3. Other shares and participations 330.6 330.6 97.3 97.34.4. Derivatives 5.8 5.8 5.8 5.85. Intangible assets 366.4 31.1 397.5 366.4 31.1 397.55.1. Consolidated goodwill 348.0 31.1 379.1 348.0 31.1 379.15.2. Other intagible assets 18.4 18.4 18.4 18.46. Tangible assets 593.8 593.8 269.0 269.07. Investment properties 108.8 108.8 85.6 85.68. Other assets 221.8 221.8 180.4 180.49. Accrued income and prepaid expenses 609.1 609.1 123.5 123.510. TOTAL ASSETS 34,702.1 31.1 34,733.2 34,170.6 -620.7 33,549.9
LIABILITIES AND SHAREHOLDERS' EQUITY1. Liabilities 28,739.5 28,739.5 28,846.2 28,846.22. Securities 777.6 777.6 778.1 778.13. Other liabilities 389.1 389.1 305.9 305.94. Accrued expenses and deferred income 398.2 398.2 243.5 243.55. Provisions 402.9 402.9 0.8 0.86. Subordinated liabilities 266.0 266.0 266.0 266.07. TOTAL LIABILITIES 30,973.3 30,973.3 30,440.5 30,440.58. Share capital 665.6 665.6 665.6 665.69. Share premium 1,346.6 1,346.6 1,346.6 1,346.610. General banking reserve 298.5 298.5 298.5 298.511. Statutory reserve 4.5 4.5 0.0 0.012. Translation reserve -1.2 1.3 0.1 0.0 0.013. Retained earnings 702.8 -9.9 692.9 707.4 -353.3 354.114. Profit for the reporting period 712.0 31.1 743.1 712.0 -272.6 439.4
Revaluation reserve 0.0 8.6 8.6 0.0 5.2 5.215. TOTAL SHAREHOLDERS' EQUITY 3,728.8 31.1 3,759.9 3,730.1 -620.7 3,109.416. TOTAL LIABILITIES AND
SHAREHOLDERS' EQUITY 34,702.1 31.1 34,733.2 34,170.6 -620.7 33,549.9
44

Notes 4 - 44 to Financial Statements(millions of EEK)
4. Interest income Group Bank2005 2004 2005 2004
Loans 1,216.1 991.9 1,236.2 1,116.7Leasing loans 387.9 356.9 0.0 0.0Deposits 25.7 17.8 25.5 17.8Derivatives 16.5 1.5 17.5 1.2Fixed income securities 1.0 1.5 5.6 7.5Other 0.2 0.2 0.2 0.2
1,647.4 1,369.8 1,285.0 1,143.4
5. Interest expenses Group Bank2005 2004 2005 2004
Interest to other banks 337.9 222.3 120.8 222.3Time and other deposits 227.6 154.5 317.1 154.7Demand deposits 130.6 81.6 130.4 84Subordinated debts 13.8 7.9 13.8 7.8Issued bonds 12.9 22.2 12.9 22.2Other 7.8 0.0 7.8 0Due to government and foreign aid funds 5.6 7.9 2.6 3.7
736.2 496.4 605.4 494.7
6. Fee and commission income Group Bank2005 2004 2005 2004
Credit and payment cards 236.0 202.1 236.0 202.1Credit contracts* 168.5 133.1 137.7 105.9Transaction fees 89.3 77.3 89.8 77.6Fund management fees 82.2 46.2 - -Securities market services 54.4 29.7 49.6 34.6Income from leasing agreements 44.0 35.4 0.0 0.0Other 30.2 18.4 14.1 7.1Real state insurance brokerage fees 26.6 20.3 3.8 2.6Cash handling fees 13.5 10.4 13.5 10.5Other settlement fees 10.0 12.0 10.0 12.0Income from electronic channels 8.5 6.9 9.0 7.3
763.2 591.8 563.5 459.7*
7. Fee and commission expense Group Bank2005 2004 2005 2004
Credit and payment cards 121.3 101.4 121.3 101.4Expenses to leasing agreements (full service) 31.8 26.2 0.0 0.0Money collecting fees 18.0 17.1 18.0 17.1Securities market 17.5 9.3 11.8 8.4Transaction fees 15.5 10.9 15.0 10.6Other 7.3 6.4 4.6 3.3Expenses of electronic channels 6.1 4.5 6.1 4.5
217.5 175.8 176.8 145.3
8. Net profit from financial activities Group Bank2005 2004 2005 2004
Trading securities 9.2 7.1 9.2 7.1Profit from shares 2.6 3.3 2.6 3.3Profit from fixed income securities 6.6 3.8 6.6 3.8
Derivatives 3.3 1.7 3.3 1.7Equity derivatives 2.6 1.1 2.6 1.1Interest derivatives, options 0.7 0.6 0.7 0.6
Income from foreign exchange 94.4 71.6 94.7 74.2106.9 80.4 107.2 83.0
Credit contracts include loan, leasing, letter of credit and guarantee contracts signed with customers, which are short-term or do not constitute a significant part of interest income, to recognize these fees as interest income andefer through effective interest rate calculation.
45

9. Other adminastrive expenses Group Bank2005 2004 2005 2004
Advertizing and marketing 68.6 42.2 55.3 34.5Premises cost 60.4 56.8 75.4 72.6Other administrative cost 57.4 53.0 42.8 38.9IT related expenses 45.1 37.4 46.2 38.2Other personnel expenses 21.2 18.0 17.2 15.7Consulting 6.8 6.5 4.5 5.9Information services 6.6 5.6 4.3 4.3Insurance 5.2 9.0 5.0 8.8Translating services 0.7 0.5 0.5 0.4Other maintenance cost (land tax etc.) 0.4 0.4 0.2 0.2
272.4 229.4 251.4 219.5
10. Value adjustments of advances and off-balance sheet commitments (+/-) Group Bank
2005 2004 2005 2004Allowances for advances to customers 19.6 -25.0 23.8 -26.9 - specific loan allowances -84.6 -92.5 -57.1 -63.7 - recovered loans 9.4 9.9 6.9 8.2 - reversals of allowances 94.8 57.6 74.0 28.6Revaluation of seized assets 3.6 -8.5 0.0 -0.9
23.2 -33.5 23.8 -27.8
11. Other operating income Group Bank2005 2004 2005 2004
Income from insurance activities* 90.2 57.7 - -Penalties 0.9 2.5 0.2 0.2Rent income 22.9 21.7 14.8 14.3Result from seized properties 2.9 2.9 0.6 0.4Gains on assets sales 0.2 0.4 0.1 0.2Net deferred acquisitionn costs 0.5 0.0 0.0 0.0Other income 18.0 20.0 14.8 19.1
135.6 105.2 30.5 34.2Rental income was earned from investment properties (Note 22) and partial rent-out of buildings in our own use.
* Income from insurance activities Group2005 2004
Net insurance premium revenue (note 3, comment 3.3) 138.7 111.6Commission fee income 7.1 4.2Investment income 14.7 0.1Net realised gains on investment assets 30.7 12.6Net fair value gains on assets at fairvalue through income 4.1 9.3Other operating income 2.4 1.6Total income 197.7 139.4Net insurance benefits and claims -107.4 -81.3Expenses for asset management services -0.1 -0.4Total expenses -107.5 -81.7Total Income net 90.2 57.7
12. Other operating expense Group Bank2005 2004 2005 2004
Legal services 3.1 3.2 2.7 2.9Penalties 2.7 0.4 2.0 0.5Finance Inspection and Guarantee Fund cost 8.3 7.9 6.4 6.3Income tax on not business oriented expenses 6.0 6.6 4.6 4.4Cost on bad loans 1.0 0.7 1.0 0.7Other value adjustments of advances 0.1 -2.5 0.1 -2.5Losses on sales of fixed assets 0.2 0.7 0.0 0.0Cost on seized properties 5.5 5.3 0.2 0.3Other operating expenses 16.3 6.4 15.1 5.5
43.2 28.7 32.1 18.1Development CostsEstablishment and development costs are not capitalised. Advertising expenses and the costs to launch new products,services and processes are expensed as incurred. Expenditures related to trademarks, etc., to be developed inside thecompany are also expensed at the moment of their occurrence. In 2005 SEB Eesti Ühispank made expenses for the developing IT and electronic products in total amount of 37,3 millionkroons (in 2004 34,9 millon kroons).
46
13. Income tax of financial period Group Bank2005 2004 2005 2004
Income tax from annual profit 3.1 0.0 0.0 0.0Deferred tax expense (note 25) 2.7 -0.8 0.0 0.0Adjustments 0.4 0.0 0.0 0.0Total tax expense 6.2 -0.8 0.0 0.0
Operating profit 2005 2004 2005 2004Income tax from annual profit, based on Estonian tax rate (0%) 929.7 742.4 536.9 439.5Income tax from annual profit of foreign subsidary 0.0 0.0 0.0 0.0Change of deferred income tax liabilities -3.1 0.0 0.0 0.0Adjustments -2.7 0.8 0.0 0.0Total income tax expense -0.4 0.0 0.0 0.0
Net profit -6.2 0.8 0.0 0.0923.5 743.2 536.9 439.5
14. Balances with the central bank Group Bank31.12.05 31.12.04 31.12.05 31.12.04
Balances with the central bank 2,231.1 1,701.4 2,231.1 1,701.4
15. Loans and advances to credit institutions Group Bank31.12.05 31.12.04 31.12.05 31.12.04
Demand deposits* 239.0 355.9 237.8 342.0Time deposits 193.9 23.6 175.5 23.6Reverse repos* 1,486.5 1,736.9 1,486.5 1,736.9Other* 4.7 2.6 4.7 2.6
1,924.1 2,119.0 1,904.5 2,105.1* Cash equivalents
16. Loans and advances to customers Group Bank31.12.05 31.12.04 31.12.05 31.12.04
Overdrafts 1,649.8 1,448.6 1,913 1,636Loans 30,871.7 19,969.4 31,169.8 26,160.7Factoring 971.5 730.4 - -Leasing 8,434.6 6,001.2 - -Insurance recievables 1.9 1.3 - -
41,929.5 28,150.9 33,082.8 27,796.6
All deferred income tax expense is related to SEB Russian Leasing. The effective income tax rate in Russia is 24% of the taxable income. SEB Eesti Ühispanga Group has no other income tax expenses.
Estonian commercial banks are obliged to maintain mandatory reserves on their clearing accounts with the Central Bank, calculated on 13% of the mandatory reserve basis. Mandatory reserve requirement as of 31.12.05 was 4,104.7 million kroons (31.12.04 3,329.5).
Mandatory reserve on the correspondent account of the Bank of Estonia is monitored on basis of monthly average. As of 01.07.2001 the reserve may be filled with external assets in the amount of 50% from the monthly average mandatory reserve requirement. As at 31.12.05 the reserve requirement was filled by balances with central bank, reverse repo at SEB, financial assets held for trading, etc.
47
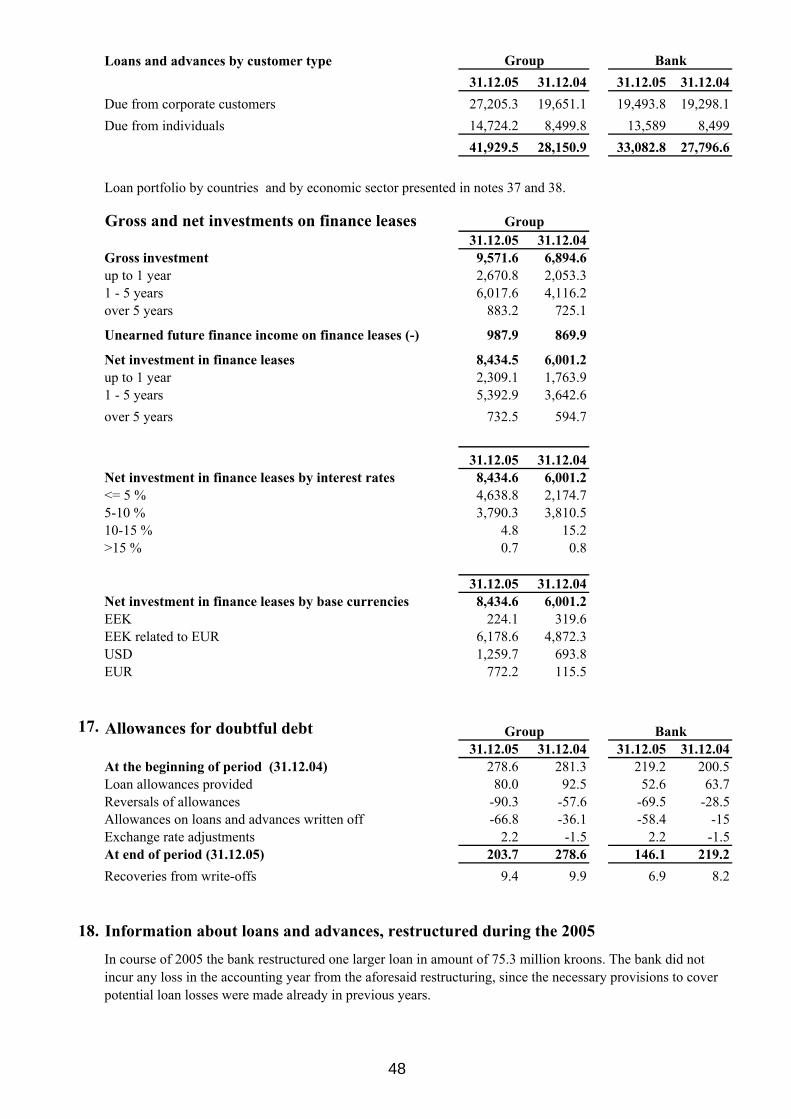
Loans and advances by customer type Group Bank31.12.05 31.12.04 31.12.05 31.12.04
Due from corporate customers 27,205.3 19,651.1 19,493.8 19,298.1Due from individuals 14,724.2 8,499.8 13,589 8,499
41,929.5 28,150.9 33,082.8 27,796.6
Loan portfolio by countries and by economic sector presented in notes 37 and 38.
Gross and net investments on finance leases Group31.12.05 31.12.04
Gross investment 9,571.6 6,894.6up to 1 year 2,670.8 2,053.31 - 5 years 6,017.6 4,116.2over 5 years 883.2 725.1
Unearned future finance income on finance leases (-) 987.9 869.9
Net investment in finance leases 8,434.5 6,001.2up to 1 year 2,309.1 1,763.91 - 5 years 5,392.9 3,642.6over 5 years 732.5 594.7
31.12.05 31.12.04Net investment in finance leases by interest rates 8,434.6 6,001.2<= 5 % 4,638.8 2,174.75-10 % 3,790.3 3,810.510-15 % 4.8 15.2>15 % 0.7 0.8
31.12.05 31.12.04Net investment in finance leases by base currencies 8,434.6 6,001.2EEK 224.1 319.6EEK related to EUR 6,178.6 4,872.3USD 1,259.7 693.8EUR 772.2 115.5
17. Allowances for doubtful debt Group Bank31.12.05 31.12.04 31.12.05 31.12.04
At the beginning of period (31.12.04) 278.6 281.3 219.2 200.5Loan allowances provided 80.0 92.5 52.6 63.7Reversals of allowances -90.3 -57.6 -69.5 -28.5Allowances on loans and advances written off -66.8 -36.1 -58.4 -15Exchange rate adjustments 2.2 -1.5 2.2 -1.5At end of period (31.12.05) 203.7 278.6 146.1 219.2Recoveries from write-offs 9.4 9.9 6.9 8.2
18. Information about loans and advances, restructured during the 2005In course of 2005 the bank restructured one larger loan in amount of 75.3 million kroons. The bank did not incur any loss in the accounting year from the aforesaid restructuring, since the necessary provisions to cover potential loan losses were made already in previous years.
48

19. Securities Group Bank31.12.05 31.12.04 31.12.05 31.12.04
Financial assets held for trading 583.0 30.0 583.0 30.0Shares 32.8 2.5 32.8 2.5incl. listed 32.8 2.5 32.8 2.5Debt securities and other fixed income securities 550.2 27.5 550.2 27.5incl. listed 539.2 22.9 539.2 22.9
Derivatives 22.0 5.8 22.7 5.8
761.9 473.8 0.0 0.0Shares 478.7 208.1 0.0 0.0incl. listed 406.3 163.9 0.0 0.0Debt securities and other fixed income securities 283.2 265.7 0.0 0.0incl. listed 249.5 247.7 0.0 0.0
Available-for-sale financial assets 48.8 122.8 5.9 256.5Shares 48.1 120.0 5.2 94.8incl. listed 0.0 15.9 0.0 15.9Debt securities and other fixed income securities 0.7 2.8 0.7 161.7incl. listed 0.0 0.0 0.0 0.0
Investments in associates 28.5 33.6 12.9 27.4Investments in subsidaries - - 346.8 346.8
Securities total 1,444.2 666.0 971.3 666.5
Investments in associates of group
Nominal value(EEK) Assets
Liabili- ties Income
Calculatedprofit/-loss on equity method
Balance value
Owner- ship (%)
2005SEB IT Partner Estonia OÜ 17,500 6.5 1.9 18.8 0.5 1.6 35.0%AS Sertifitseerimiskeskus 100,000 15.6 11.4 12.5 -0.8 1.0 25.0%AS Intergate (sold) - - - - 6.7 - -Pankade Kaardikeskuse AS 1,000 61.3 3.1 37.5 5.8 24.1 41.5%OÜ TietoEnator Support 20,000 2.3 1.4 9.0 0.0 0.6 20.0%AS Eesti Liisingukeskus (on liquidqtion) 400,000 3.4 0.0 0.1 0.0 1.2 33.3%Total 89.1 17.8 77.9 12.2 28.5
2004SEB IT Partner Estonia OÜ 17,500 5.9 2.7 15.6 0.5 1.1 35.0%AS Sertifitseerimiskeskus 100,000 21.2 14.0 11.5 -0.7 1.8 25.0%AS Intergate 10 22.3 0.0 0.3 0.0 11.1 50.0%Pankade Kaardikeskuse AS 1,000 51.7 7.5 30.4 4.1 18.4 41.5%AS Eesti Liisingukeskus (on liquidation) 400,000 3.4 0.0 0.1 0.0 1.2 33.3%Total 104.5 24.2 57.9 3.9 33.6
Financial assets at fair value through profit or loss at inception
Share of the Group from the net assets of associates equals to the carrying value of the investment in the Group financial statements, except for investment in OÜ TietoEnator Support, where the goodwill in amount of 0.4 million kroons is included in the carrying value of investment.
49

Movements of securities Group
Financial assets held for trading Derivatives
Financial assets at fair value
through profit or loss at inception
Available-for-sale
financial assets
Investments in associates Total
At the beginning of period (31.12.03) 14.2 9.4 295.8 132.5 29.7 481.6Acquisitions 28,763.0 0.0 479.0 8.8 0.0 29,250.8Sales and redemptions -28,747.4 0.0 -330.1 -15.8 0.0 -29,093.3Changes of value 0.2 0.0 29.1 1.9 0.0 31.2Changes of currency rate 0.0 -3.6 0.0 0.0 0.0 -3.6Impairment 0.0 0.0 0.0 -4.6 0.0 -4.6Profit from equity method 0.0 0.0 0.0 0.0 3.9 3.9At the end of period (31.12.04) 30.0 5.8 473.8 122.8 33.6 666.0
At the beginning of period (31.12.04) 30.0 5.8 473.8 122.8 33.6 666.0Acquisitions 34,232.1 0.0 987.6 15.6 0.6 35,235.9Sales and redemptions -33,681.2 0.0 -792.4 -95.0 -17.8 -34,586.4Changes of value 2.1 0.0 89.0 5.2 0.0 96.3Changes of currency rate 0.0 16.2 3.9 0.0 0.0 20.1Impairment 0.0 0.0 0.0 0.1 0.0 0.1Profit from equity method 0.0 0.0 0.0 0.0 12.2 12.2At the end of period (31.12.05) 583.0 22.0 761.9 48.7 28.6 1,444.2
Bank
Financial assets held for trading Derivatives
Financial assets at fair value
through profit or loss at inception
Available-for-sale
financial assets
Investments in associates and
subsidaries TotalAt the beginning of period (31.12.03) 14.2 9.4 0.0 400.8 374.2 798.6Acquisitions 28,763.0 0.0 0.0 159.0 0.0 28,922.0Sales and redemptions -28,747.4 0.0 0.0 -299.1 0.0 -29,046.5Changes of value 0.2 0.0 0.0 0.0 0.0 0.2Changes of currency rate 0.0 -3.6 0.0 0.4 0.0 -3.2Impairment 0.0 0.0 0.0 -4.6 0.0 -4.6Profit from equity method - - - - - -At the end of period (31.12.04) 30.0 5.8 0.0 256.5 374.2 666.5
At the beginning of period (31.12.04) 30.0 5.8 0.0 256.5 374.2 666.5Acquisitions 34,232.1 0.0 0.0 3.2 0.6 34,235.9Sales and redemptions -33,681.2 0.0 0.0 -253.7 -15.1 -33,950.0Changes of value 2.1 0.0 0.0 0.0 0.0 2.1Changes of currency rate 0.0 16.9 0.0 0.0 0.0 16.9Impairment 0.0 0.0 0.0 -0.1 0.0 -0.1Profit from equity method - - - - - -At the end of period (31.12.05) 583.0 22.7 0.0 5.9 359.7 971.3
Financial investments available-for-sale with ownership in shares over 10%, presented on the balance sheet line “Securities” under "Available-for-sale financial assets", are: AS Krediidiinfo, Kaarsar OÜ, Silverlaw OÜ, OÜ Croneland, OÜ Munga Maja, AS Tallinna Börs. The aforementioned companies are located in Estonia.
50
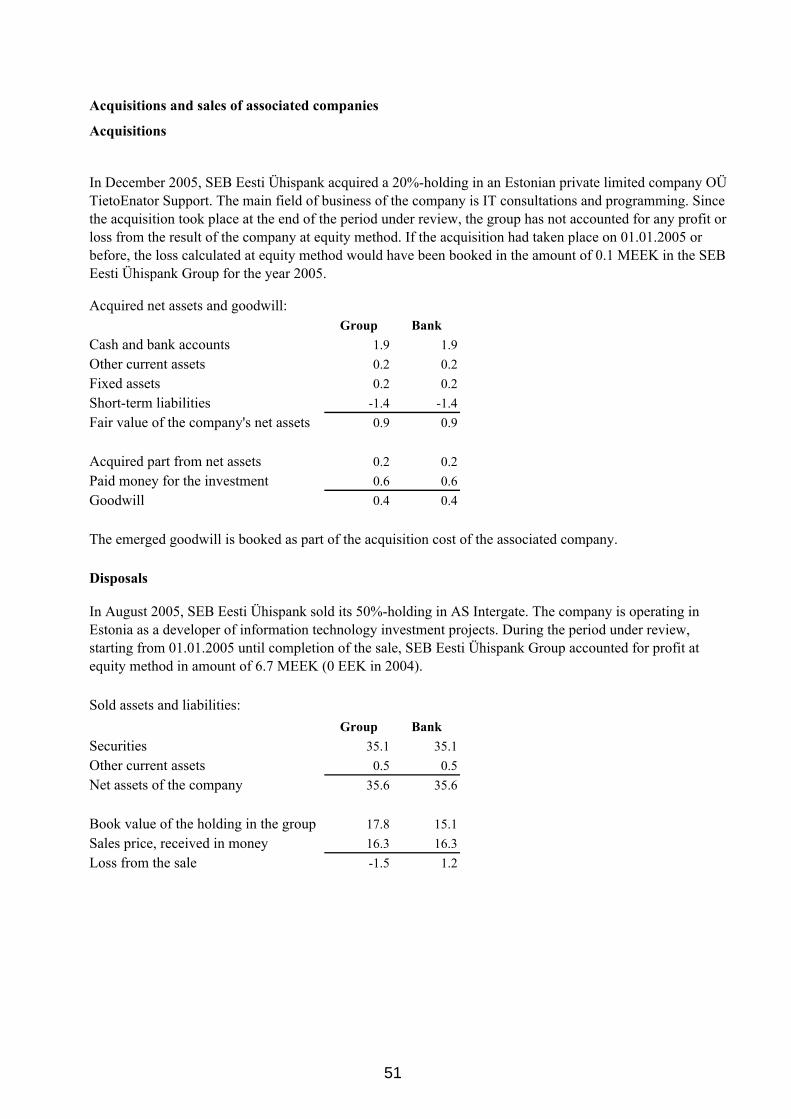
Acquisitions and sales of associated companies
Acquisitions
Acquired net assets and goodwill:Group Bank
Cash and bank accounts 1.9 1.9Other current assets 0.2 0.2Fixed assets 0.2 0.2Short-term liabilities -1.4 -1.4Fair value of the company's net assets 0.9 0.9
Acquired part from net assets 0.2 0.2Paid money for the investment 0.6 0.6Goodwill 0.4 0.4
The emerged goodwill is booked as part of the acquisition cost of the associated company.
Disposals
Sold assets and liabilities:Group Bank
Securities 35.1 35.1Other current assets 0.5 0.5Net assets of the company 35.6 35.6
Book value of the holding in the group 17.8 15.1Sales price, received in money 16.3 16.3Loss from the sale -1.5 1.2
In December 2005, SEB Eesti Ühispank acquired a 20%-holding in an Estonian private limited company OÜ TietoEnator Support. The main field of business of the company is IT consultations and programming. Since the acquisition took place at the end of the period under review, the group has not accounted for any profit or loss from the result of the company at equity method. If the acquisition had taken place on 01.01.2005 or before, the loss calculated at equity method would have been booked in the amount of 0.1 MEEK in the SEB Eesti Ühispank Group for the year 2005.
In August 2005, SEB Eesti Ühispank sold its 50%-holding in AS Intergate. The company is operating in Estonia as a developer of information technology investment projects. During the period under review, starting from 01.01.2005 until completion of the sale, SEB Eesti Ühispank Group accounted for profit at equity method in amount of 6.7 MEEK (0 EEK in 2004).
51

20. Intangible assets Group Bank
Goodwill Other Goodwill OtherAt the beginning of period (31.12.03)Cost 623.2 66.7 623.2 64.7Accumulated depreciation -244.1 -51.2 -244.1 -49.3Carrying value 379.1 15.5 379.1 15.4
Change of accounting principles (IFRS3) 01.01.2004 (note 3)Goodwill at net carrying value 379.1 - 379.1 -
Opening carrying value 379.1 15.5 379.1 15.4Additions 0.0 12.4 0.0 12.5Depreciation charge - -9.5 -31.2 -9.4Closing carrying value 379.1 18.4 347.9 18.5
At end of period (31.12.04)Cost 379.1 78.1 623.2 76.6Accumulated depreciation - -59.7 -244.1 -58.1Carrying value 379.1 18.4 379.1 18.5
At the beginning of period (31.12.04)Cost 379.1 78.1 623.2 76.6Accumulated depreciation - -59.7 -244.1 -58.1Carrying value 379.1 18.4 379.1 18.5
Opening carrying value 379.1 18.4 379.1 18.5Additions 0.0 1.8 0.0 1.7Depreciation charge - -7.8 0.0 -7.8Closing carrying value 379.1 12.4 379.1 12.4
At end of period (31.12.05)Cost 379.1 75.4 623.2 73.8Accumulated depreciation - -63.0 -244.1 -61.4Carrying value 379.1 12.4 379.1 12.4
Goodwill
D) Key assumptions are based on past experience
According to impairment test the recovarble value exeeds substantially carrying value of goodwill, therefore no impairment has been identified.
Cash generating unit for goodwill is considered to be assets and liabilities obtained through merging theTallinna Bank. Calculation of value in use is based on the following assumptions:
A) 2006-2008 cash flow projections are based on the business plan, approved by the management board, where the average annual growth rate of assets (excl. fixed assets) and liabilities is 23%, income 17% and expenses 14%, and fixed assets is 6%
B) When finding the 2009-2010 cash flows, the income-expense growth rate of 5% and asset growth rate of 10% is used (excl. fixed assets). The growth rates for the years starting from 2009 are based on the assumption that the volume increase in financing activities will slow down on the market, resulting in lower growth also in volumes at SEB EÜP.C) Cash flow discount rate 9% is used, which is assessed in line with parent companys Treasury specialists.
52

21. Tangible assets Group Bank
At the beginning of period (31.12.03) Land BuildingsOtherassets Total Land Buildings
Otherassets Total
Cost 7.0 554.1 483.0 1,044.1 1.0 201.1 442.9 645.0Accumulated depreciation 0.0 -109.7 -325.6 -435.3 0.0 -68.0 -303.5 -371.5Carrying value 7.0 444.4 157.4 608.8 1.0 133.1 139.4 273.5
Opening carrying value 7.0 444.4 157.4 608.8 1.0 133.1 139.4 273.5Additions 0.5 3.2 65.2 68.9 0.6 8.8 47.3 56.7Disposals (carrying value) 0.0 -0.5 -14.7 -15.2 0.0 -0.5 -6.0 -6.5Impairment charge 0.0 0.0 -0.7 -0.7 0.0 0.0 -0.4 -0.4Depreciation charge 0.0 -13.7 -54.4 -68.0 0.0 -6.1 -48.2 -54.3Closing carrying value 7.5 433.4 152.8 593.8 1.6 135.3 132.1 269.0
At end of period (31.12.04)Cost 7.4 551.0 453.0 1,011.4 1.6 203.7 412.1 617.4Accumulated depreciation 0.0 -117.6 -300.0 -417.6 0.0 -68.4 -280.0 -348.4Carrying value 7.4 433.4 153.0 593.8 1.6 135.3 132.1 269.0
Group Bank
At the beginning of period (31.12.04) Land BuildingsOtherassets Total Land Buildings
Otherassets Total
Cost 7.4 551.0 453.0 1,011.4 1.6 203.7 412.1 617.4Accumulated depreciation 0.0 -117.6 -300.0 -417.6 0.0 -68.4 -280.0 -348.4Carrying value 7.4 433.4 153.0 593.8 1.6 135.3 132.1 269.0
Opening carrying value 7.4 433.4 153.0 593.8 1.6 135.3 132.1 269.0Additions 0.1 4.1 75.2 79.4 0.1 3.4 51.0 54.5Disposals (carrying value) 0.0 -0.3 -13.9 -14.2 0.0 -0.1 -5.5 -5.6Depreciation charge 0.0 -12.8 -57.6 -70.4 0.0 -5.7 -50.3 -56.0Closing carrying value 7.5 424.4 156.7 588.6 1.7 132.9 127.3 261.9
At end of period (31.12.05)Cost 7.5 551.8 463.1 1,022.4 1.7 204.7 410.9 617.3Accumulated depreciation 0.0 -127.3 -306.5 -433.8 0.0 -71.9 -283.5 -355.4Carrying value 7.5 424.5 156.6 588.6 1.7 132.8 127.4 261.9
53

22. Investment propertiesGroup Bank
At the beginning of period (31.12.03)Cost 129.6 100.8Accumulated depreciation -18.2 -13.1Carrying value 111.4 87.7
Opening carrying value 111.4 87.7Depreciation charge -2.6 -2.1Closing carrying value 108.8 85.6
At end of period (31.12.04)Cost 129.6 100.8Accumulated depreciation -20.8 -15.2Carrying value 108.8 85.6
At the beginning of period (31.12.04)Cost 129.6 100.8Accumulated depreciation -20.8 -15.2Carrying value 108.8 85.6
Change of accounting principles (IFRS3) 01.01.2005 (note 3)Investment property at fair value 108.8 85.6
At the beginning of the period (01.01.05) 108.8 85.6At the end of the period (31.12.05) 108.8 85.6
Group Bank31.12.05 31.12.04 31.12.05 31.12.04
Rent income from investment properties 11.5 10.0 9.5 8.8Expenses for generating rent income 3.4 3.2 2.4 2.4
8.1 6.8 7.1 6.4
Total fair value of investment properties does not differ materially from the carrying value; accordingly, no adjustments have been made by objects. For finding a fair value the value in use is appraised on basis of cash flows, using the estimated discount rate 10%. As general cash flows we have taken into account rental and other income and maintenance-, public utility-, insurance- and other costs. Investment properties were not valued by third parties (external experts) on the balance sheet date.
54

23. Other assets Group Bank31.12.05 31.12.04 31.12.05 31.12.04
Payments in transit 240.7 177.6 240.6 177.6Assets held for sale 33.8 53.4 2.8 2.8Allowances for losses from other recievables -4.2 -9.2 - -
270.3 221.8 243.4 180.4
24. Accrued income and prepaid expenses Group Bank31.12.05 31.12.04 31.12.05 31.12.04
Accrued interest receivable 103.4 85.3 84.0 78.8Prepaid taxes 63.2 15.7 0.0 0.0Prepaid expenses 351.8 44.0 52.3 32.2Other accrued revenue 109.8 464.1 31.2 12.4
628.2 609.1 167.5 123.4
25. Deferred income tax Group Bank31.12.05 31.12.04 31.12.05 31.12.04
Deferred tax assets in subsidary SEB Russian LeasingAt the beginning of period 0.8 0.0 0.0 0.0Deferred tax expenses / income 0.0 0.8 0.0 0.8Realised deferred tax expenses -0.8 0.0 0.0 0.0At end of period 0.0 0.8 0.0 0.8
Deferred tax liability in subsidary SEB Russian LeasingAt the beginning of period 0.0 0.0 0.0 0.0Accelerated tax depreciation 1.9 0.0 0.0 0.0At end of period 1.9 0.0 0.0 0.0
26. Due to credit institutions Group Bank31.12.05 31.12.04 31.12.05 31.12.04
Demand deposits 161.6 355.6 161.6 355.6Time deposits and loans (maturity up to 1 year) 4,689.1 3,075.6 4,360.6 3,075.6Time deposits and loans (maturity more than 1 year) 9,932.4 6,657.2 1,941.2 6,657.2
14,783.1 10,088.4 6,463.4 10,088.4
27. Due to customers Group Bank31.12.05 31.12.04 31.12.05 31.12.04
Demand deposits 14,811.9 9,967.4 15,123.6 10,177.5Time deposits and other deposits, insurance 12,264.2 8,515.9 12,263.8 8,514.8
27,076.1 18,483.3 27,387.4 18,692.3
Non residents 2,860.1 1,440.4 2,860.7 1,439.4Residents 24,216.0 17,042.9 24,526.7 17,252.9
27,076.1 18,483.3 27,387.4 18,692.3Due to customers by type of customerDue to corporate customers 19,062.0 12,464.1 19,374.6 12,674.2Due to individuals 8,014.1 6,019.2 8,013 6,018
27,076.1 18,483.3 27,387.4 18,692.3
See by remaining maturity in table "Liquidity" on page 13.
In 2005 the bank took credit lines from KFW (Kreditanstalt für Wiederaufbau) 4.5 million EUR with maturity 15.09.2009 and 9,1 million EUR with maturity 15.09.2014.
55

Customer assets under management of the group
28. Issued debt securities 31.12.05
Buyer / Registry holderAmount in foreign
currency (mio) Amount
in EEKmioInterest
rateMaturity
dateIssued bonds by AS SEB Eesti ÜhispankEstonian Central Register of Securities 293.2 EEK 293.2 2.55% 31.03.06Unemployment Cash Department 6.0 EEK 6.0 0.00% 11.10.06
299.2
31.12.04
Buyer / Registry holderAmount in foreign
currency (mio) Amount
in EEKmioInterest
rateMaturity
dateIssued bonds by AS SEB Eesti ÜhispankEstonian Central Register of Securities 60.8 EEK 60.8 5.15% 01.04.05Estonian Central Register of Securities 49.1 EEK 49.1 2.40% 14.06.05Estonian Central Register of Securities 156.8 EEK 156.8 5.15% 01.04.05Estonian Central Register of Securities 110.7 EEK 110.7 2.55% 14.06.05Estonian Central Register of Securities 39.0 EEK 39.0 2.30% 01.03.05Unemployment Cash Department 6.0 EEK 6.0 0.00% 11.10.06Estonian Central Register of Securities 263.5 EEK 263.5 2.50% 01.11.05Estonian Central Register of Securities 71.3 EEK 71.3 5.15% 01.04.05
757.2
29. Other liabilities Group Bank31.12.05 31.12.04 31.12.05 31.12.04
Payments in transit 608.2 305.9 604.1 305.9Factoring balances 70.2 83.2 0.0 0.0Insurance financial liabilities (Note 3, comment 3.3) 408.6 0.0 - -
1,087.0 389.1 604.1 305.9
As of 31.12.2005 the customers security portfolios under management of the group amounted to 1803,7 million kroons (including 382,0 million in portfolio of Ühispanga Elukindlustus). The total volume of aforementioned portfolios as of 31.12.2004 was 1439,2 million kroons (including 271,6 million in portfolio of SEB Ühispanga Elukindlustus). Commission fee is received from management of these portfolios and no credit or market risks are born by the Group.
As at 31.12.2005 the Asset Management Company (AS SEB Ühispanga Fondid) belonging to the group managed 9 investment and pension funds (i.e. 5 open-end investment funds, 2 mandatory pension funds and 2 voluntary pension funds) with total value of assets of 4,51 billion kroons. As at 31.12.2004 the Asset Management Company managed 7 investment and pension funds (i.e. 3 open-end investment funds, 2 mandatory pension funds and 2 voluntary pension funds) with total value of assets of 2,98 billion kroons.
56

30. Accrued expenses and deferred income Group Bank
31.12.05 31.12.04 31.12.05 31.12.04Income tax payable 0.6 0.0 0.0 0.0Other tax liabilities 35.3 35.4 13.2 13.7Accrued interest payable 152.0 134.5 104.9 134.6Other accrued expenses 234.7 228.3 96.9 95.2
422.6 398.2 215.0 243.5
31. Provisions in groupLife
insurance provision
Provision of unsettled
claimsBonus
provision
Unit-linked technical
provisions
Technical provisions
totalAs at 31.12.2003 173.9 0.7 2.8 71.2 248.6Added to the insurance technical provisions 2.8 0.0 -2.8 0.0 0.0Calculated during the period under review 89.2 1.8 5.7 57.6 154.3Share of re-insurance 0.0 -0.8 0.0 0.0 -0.8Total technical provisions of insurance as at 31.12.04.* 265.9 1.7 5.7 128.8 402.1Other provisions - - - - 0.8Total 31.12.2004 - - - - 402.9
Change of accounting principles (IFRS4) (Note 3, comment 3.3) -51.8 -0.1 -1.0 -128.8 -181.7
As at 31.12.2004 214.1 1.6 4.7 0.0 220.4Added to the insurance technical provisions 4.7 0.0 -4.7 0.0 0.0Calculated during the period under review 82.2 -0.4 7.9 0.0 89.7Share of re-insurance 0.0 0.5 0.0 0.0 0.5Total technical provisions of insurance as at 31.12.05. 301.0 1.7 7.9 0.0 310.6Other provisions - - - - 2.7
30 Total 31.12.2005 - - - - 313.3Provisions in bank 0.8* According to IFRS4 paragraph 36A the opening balance of 2005 is not recalculated or reclassified.
32. Subordinated liabilities 31.12.05
Amount in foreign currency
AmountInterest rate
Maturity date
SEB 17.0 EURmio 266.0 EUR 3 month Euribor+1.75%
21.12.11
SEB 50.0 EURmio 782.3 2.22 % 23.09.151,048.3
31.12.04
Amount in foreign currency
AmountInterest rate
Maturity date
SEB: 17.0 EURmio 266.0 EUR 3 month Euribor+1.75% 21.12.11
266.0
Subordinated debt may be considered as hybrid instrument, which due to their partial capital nature may be included under the bank's own funds in case certain requirements are met. In calculation of capital adequacy, loans with the remaining maturity over 5 years meeting certain requirements are included in own funds. Regarding loans with maturity less than 5 years, a 20% straightline depreciationis applied in each following year, thus the loan is not considered own funds when the maturity period is less than one year.
57

33. ShareholdersNames, countries and ownership
CountryNumber of
shares
% from total
number of shares
Shareholders of AS SEB Eesti Ühispank at 31.12.2004:Skandinaviska Enskilda Banken (SEB) Sweden 66,562,381 100.00
Shareholders of AS SEB Eesti Ühispank at 31.12.2005:Skandinaviska Enskilda Banken (SEB) Sweden 66,562,381 100.00
Nominal value of shares: 10 EEKMaximum number of shares in articles of association: 240,000,000 All shares are paid for.
34. Earnings per share Group Bank31.12.05 31.12.04 31.12.05 31.12.04
Number of shares of AS SEB Eesti Ühispank at end of period 66,562,381 66,562,381 66,562,381 66,562,381Average number of shares 66,562,381 66,562,381 66,562,381 66,562,381Profit for the year (EEK mio) 923.5 743.2 536.9 439.5Earnings per share (EPS), EEK 13.87 11.17 8.07 6.60Diluted earnings per share (EEK) 13.87 11.17 8.07 6.60
As the bank did not have potentially issued common stock in 2005 and 2004,the ordinary earnings per share equals the diluted earnings per share.
Book value of shares, EEK 64.49 50.52 48.82 40.74
Explanations:Earnings per share (EPS), EEK = Net profit / Average number of sharesBook value of shares, EEK = (Equity - Intangible assets) / Number of shares at end of period
35. Dividend policy
SEB AB is the ultimate parent of AS SEB Eesti Ühispank. In working out the strategy for equity management, profitdistribution and formation of reserves the bank is following the common approach for assessment of future risks andperformance strategy of the SEB Group.
SEB AB is the ultimate parent of AS SEB Eesti Ühispank. SEB AB does not have a controlling parent company.
58

36. Off-Balance sheet items(millions of EEK)
Group Bank31.12.05 Assets Liabilities Assets Liabilities
1.Irrevocable transactions 140.5 9,149.6 140.5 9,172.31.1. Guarantees and pledges 47.6 2,195.3 47.6 2,385.3 incl. financial guarantees 0.0 489.4 0.0 489.41.2. Stand-by Loans 92.9 6,954.3 92.9 6,787.02. Derivatives 4,516.5 4,504.8 4,563.0 4,550.52.1. Currency Rate based Derivatives 3,431.4 3,419.7 3,477.9 3,465.4incl forwards 448.3 446.6 454.4 452.5
swaps 2,446.8 2,436.6 2,487.2 2,476.4options, written / purchased 21.7 21.7 21.7 21.7others (spots) 514.6 514.8 514.6 514.8
2.2. Interest Rate based Derivatives 1,085.1 1,085.1 1,085.1 1,085.13. Revocable Transactions 0.0 15.4 0.0 15.43.1. Other revocable transactions 0.0 15.4 0.0 15.4
Group Bank31.12.04 Assets Liabilities Assets Liabilities
1.Irrevocable transactions 70.9 6,434.2 70.9 6,461.61.1. Guarantees and pledges 0.0 1,895.3 0.0 1,904.9 incl. financial guarantees 0.0 356.1 0.0 356.11.2. Stand-by Loans 70.9 4,538.9 70.9 4,556.72. Derivatives 2,445.8 2,454.2 2,466.2 2,475.22.1. Currency Rate based Derivatives 1,917.0 1,925.4 1,937.4 1,946.4incl forwards 444.9 445.4 444.9 445.4
swaps 863.5 871.3 883.9 892.3others (spots) 608.6 608.7 608.6 608.7
2.2. Interest Rate based Derivatives 528.8 528.8 528.8 528.8
59

37. Concentration of loans and advances from customers by countries(millions of EEK)
Group 31.12.05In balance sheet
Country Loans Securities Other
incl. total outstanding of overdue and
uncollectible debt and loans
off-balance sheet
commitments
% from total
Belgium 0.1 153.2 0.0 0.0 0.2 0.3Cyprus 58.6 0.0 0.0 0.0 0.1 0.1Estonia 40,511.7 425.2 97.7 676.4 10,391.5 87.0Finland 21.4 1.6 0.1 3.6 10.1 0.1Germany 8.8 172.3 0.0 0.0 75.8 0.4Italy 0.6 0.0 0.0 0.1 31.0 0.1Latvia 73.3 16.3 0.1 0.7 4.7 0.2Lithuania 85.4 15.5 0.0 0.1 117.0 0.4Luxembourg 3.4 145.8 0.0 0.0 0.0 0.2Malta 128.3 0.0 0.9 80.2 0.0 0.2Marshall Islands 42.9 0.0 0.1 42.7 0.3 0.1Netherlands 0.4 266.4 0.0 0.0 0.0 0.4Poland 1.6 36.9 0.0 0.0 0.5 0.1Russia 1,038.8 77.7 1.4 0.0 54.3 2.0St. Vincent 55.6 0.0 0.0 0.0 0.0 0.1Sweden 1,587.7 22.9 2.8 0.7 2,664.2 7.2Switzerland 6.4 0.2 0.0 0.0 283.6 0.5United States 65.2 16.4 0.1 0.0 2.8 0.1Unallocated 163.4 93.8 0.2 3.7 33.7 0.5TOTAL 43,853.6 1,444.2 103.4 808.2 13,669.8 100.0
Bank 31.12.05In balance sheet
Country Loans Securities Other
incl. total outstanding of overdue and
uncollectible debt and loans
off-balance sheet
commitments
% from total
Belgium 0.0 153.2 0.0 0.0 0.2 0.3Cyprus 54.8 0.0 0.0 0.0 0.1 0.1Estonia 32,841.8 427.9 80.1 497.5 10,494.0 88.1Finland 20.2 0.0 0.2 3.6 10.1 0.1Germany 8.0 155.0 0.0 0.0 75.8 0.5Italy 0.0 0.0 0.0 0.0 31.0 0.1Latvia 73.2 0.0 0.1 0.7 4.7 0.1Lithuania 85.3 0.0 0.0 0.1 83.0 0.3Malta 80.2 0.0 0.8 80.2 0.0 0.1Netherlands 0.4 231.1 0.0 0.0 0.0 0.5Russia 128.7 2.0 0.0 0.0 54.3 0.4Sweden 1,587.5 1.9 2.8 0.7 2,664.2 8.5Switzerland 6.4 0.2 0.0 0.0 283.6 0.6United States 22.6 0.0 0.0 0.0 2.8 0.1Unallocated 78.2 0.0 0.0 3.5 34.4 0.2TOTAL 34,987.3 971.3 84.0 586.3 13,738.2 100.0
The columns of outstanding amounts indicate the balance (gross) of these claims and loans that are overdue and/or written down, including not overdue.
60

Concentration of loans and advances from customers by countries(millions of EEK)
Group 31.12.04In balance sheet
Country Loans Securities Other
incl. total outstanding of overdue and
uncollectible debt and loans
off-balance sheet
commitments
% from total
Cyprus 79.3 0.0 0.0 0.0 0.1 0.2Denmark 4.8 40.8 0.0 0.0 0.0 0.1Estonia 27,848.5 313.6 80.6 740.6 8,083.2 91.0Finland 48.6 6.1 1.6 2.8 10.2 0.2Germany 9.4 9.1 0.0 0.0 61.8 0.2Latvia 27.2 0.1 0.0 0.0 32.5 0.1Lithuania 1.7 12.1 0.0 0.0 36.2 0.1Luxembourg 6.1 75.7 0.0 0.0 0.0 0.2Netherlands 0.3 24.1 0.0 0.0 0.0 0.1Poland 2.0 41.5 0.0 0.0 8.3 0.1Russia 228.4 33.4 0.0 0.0 41.7 0.8St. Vincent 34.7 0.0 0.0 0.0 0.0 0.1Sweden 1,801.8 28.5 3.0 0.0 507.1 5.9United States 119.7 22.7 0.0 0.4 1.8 0.4Unallocated 57.4 58.3 0.1 3.9 105.5 0.5TOTAL 30,269.9 666.0 85.3 747.7 8,888.4 100.0
Bank 31.12.04In balance sheet
Country Loans Securities Other
incl. total outstanding of overdue and
uncollectible debt and loans
off-balance sheet
commitments
% from total
Cyprus 70.4 0.0 0.0 0.0 0.1 0.2Estonia 27,516.7 655.6 73.9 546.1 8,131.7 91.9Finland 47.6 4.5 1.6 2.6 10.2 0.2Germany 9.4 0.0 0.0 0.0 61.8 0.2Ireland 0.5 0.0 0.0 0.0 21.9 0.1Latvia 27.1 0.0 0.0 0.0 32.5 0.1Lithuania 0.8 0.0 0.0 0.0 36.2 0.1Russia 246.0 1.9 0.3 0.0 41.7 0.7Sweden 1,801.8 4.0 3.0 0.0 507.1 5.8United Kingdom 14.9 0.1 0.0 0.9 74.4 0.2United States 117.9 0.0 0.0 0.0 1.8 0.3Unallocated 48.6 0.4 0.0 2.7 17.4 0.2TOTAL 29,901.7 666.5 78.8 552.3 8,936.8 100.0
The columns of outstanding amounts indicate the balance (gross) of these claims and loans that are overdue and/or written down, including not overdue.
61

38. Concentration of loans and advances from customers by economic sector(millions of EEK)
Group 31.12.05
In balance sheet
Economic sector Loans Securities Other
incl. total outstanding of overdue and uncollectible
debt and loans
off-balance sheet
commit- ments
% from total
Agriculture, hunting, forestry 1,519.8 0.0 2.7 28.3 194.8 2.9Construction 539.3 1.0 1.1 17.3 825.9 2.3Education 30.0 0.0 0.9 6.2 7.7 0.1Energy, gas and water plants 782.0 29.8 1.0 0.6 398.2 2.1Finance 1,488.5 538.7 2.4 2.6 4,193.0 10.5Fishing 45.8 0.0 0.1 0.7 6.4 0.1Government, soc.insurance 1,868.2 644.4 3.1 2.2 196.6 4.6Health services, social work 473.9 6.7 0.8 0.8 276.1 1.3Home services 0.0 0.0 0.0 0.0 0.5 0.0Hotels, restaurants 582.9 0.0 1.0 6.5 212.4 1.4Industry 3,738.7 56.3 8.7 52.2 1,146.1 8.4Mining 20.4 0.0 0.0 0.0 4.6 0.0Real estate 8,791.1 79.0 16.2 89.7 2,244.0 18.8Trading 5,784.9 10.5 13.8 117.9 1,761.4 12.8Transport 3,483.9 24.5 11.6 148.1 754.8 7.2Other gov. & social services 1,012.2 31.2 1.6 34.3 203.3 2.1Individuals 13,692.0 0.1 38.4 300.8 1,244.0 25.4Derivatives 0.0 22.0 0.0 0.0 0.0 0.0TOTAL 43,853.6 1,444.2 103.4 808.2 13,669.8 100.0
Bank 31.12.05
In balance sheet
Economic sector Loans Securities Other
incl. total outstanding of overdue and uncollectible
debt and loans
incl. uncollec-
tible overdue
off-balance sheet
commit- ments
% from total
Agriculture, hunting, forestry 820.6 0.0 1.5 17.5 0.0 0.0 158.5 2.0Construction 242.2 1.0 0.6 7.9 0.0 0.3 802.7 2.1Education 19.4 0.0 0.8 6.0 0.0 1.9 7.7 0.1Energy, gas and water plants 304.2 2.5 0.6 0.3 6.0 21.0 397.5 1.4Finance 2,189.3 108.7 3.5 2.6 0.0 82.2 4,726.7 14.1Fishing 19.9 0.0 0.0 0.4 0.0 17.5 1.2 0.0Government, soc.insurance 1,536.2 549.5 2.5 1.9 0.0 70.0 196.6 4.6Health services, social work 367.9 0.0 0.6 0.0 0.0 6.0 275.9 1.3Home services 0.0 0.0 0.0 0.0 4.2 21.5 0.5 0.0Hotels, restaurants 545.5 0.0 0.9 5.8 15.0 46.4 212.4 1.5Industry 2,513.1 2.6 5.6 23.0 0.0 0.0 959.1 7.0Mining 7.0 0.0 0.0 0.0 0.0 0.4 1.8 0.0Real estate 7,276.6 266.1 11.9 70.0 2.6 2.6 2,244.0 19.7Trading 3,304.9 0.0 8.3 46.4 0.0 7.9 1,559.7 9.8Transport 1,594.9 2.2 8.0 82.2 0.0 5.8 749.5 4.7Other gov. & social services 656.5 15.8 0.9 23.3 0.0 0.0 200.5 1.8Individuals 13,589.0 0.1 38.2 298.9 1.7 298.9 1,244.0 29.9Derivatives 0.0 22.7 0.0 0.0 0.0 0.0 0.0 0.0TOTAL 34,987.3 971.3 84.0 586.3 29.5 582.5 13,738.2 100.0
The columns of outstanding amounts indicate the balance (gross) of these claims and loans that are overdue and/or written down, including not overdue.
62

Concentration of loans and advances from customers by economic sector(millions of EEK)
Group 31.12.04In balance sheet
Economic sector Loans Securities Other
incl. total outstanding of overdue and
uncollectible debt and loans
off-balance
sheet commit- ments
% from total
Agriculture, hunting, forestry 866.4 0.2 2.1 14.3 119.0 2.5Construction 358.4 0.0 0.9 7.9 593.8 2.4Education 55.6 0.0 0.5 0.0 7.3 0.2Energy, gas and water plants 387.5 10.0 0.8 0.2 332.2 1.8Exterritorial organisations 0.2 0.0 0.0 0.0 0.0 0.0Finance 1,724.0 330.2 2.5 3.0 2,223.7 10.7Fishing 27.1 0.0 0.1 1.8 2.2 0.1Government, soc.insurance 1,635.5 81.6 3.0 0.1 164.3 4.7Health services, social work 492.6 2.4 0.9 0.4 259.3 1.9Home services 2.1 0.0 0.0 0.4 3.0 0.0Hotels, restaurants 444.4 0.0 1.5 14.5 13.1 1.2Industry 2,938.7 94.6 8.6 167.1 953.7 10.0Mining 16.1 0.0 0.0 0.0 3.3 0.0Real estate 5,007.2 85.5 9.5 84.3 1,232.7 15.9Trading 4,362.3 4.5 12.6 128.1 1,245.5 14.1Transport 2,761.4 34.1 9.4 69.4 806.4 9.0Other gov. & social services 690.6 17.1 1.6 15.1 213.4 2.3Individuals 8,499.8 0.0 31.3 241.1 715.5 23.2Derivatives 0.0 5.8 0.0 0.0 0.0 0.0TOTAL 30,269.9 666.0 85.3 747.7 8,888.4 100.0
Bank 31.12.04In balance sheet
Economic sector Loans Securities Other
incl. total outstanding of overdue and
uncollectible debt and loans
incl. uncollec-
tible overdue
off-balance
sheet commit- ments
% from total
Agriculture, hunting, forestry 427.3 0.0 1.0 3.0 0.0 3.0 65.9 1.3Construction 141.2 0.0 0.4 1.3 0.0 1.3 568.8 1.8Education 45.7 0.0 0.5 0.0 0.0 0.0 7.4 0.1Energy, gas and water plants 296.6 0.1 0.6 0.0 0.0 0.0 332.2 1.6Finance 8,103.2 121.9 12.8 2.6 2.6 2.6 2,634.9 27.5Fishing 19.0 0.0 0.1 1.6 0.0 1.6 0.7 0.0Government, soc.insurance 1,346.3 4.0 2.5 0.0 0.0 0.0 164.3 3.8Health services, social work 380.7 0.0 0.7 0.1 0.0 0.1 245.0 1.6Home services 0.0 0.0 0.0 0.0 0.0 0.0 3.0 0.0Hotels, restaurants 406.3 0.0 0.9 13.7 0.0 13.7 13.1 1.1Industry 2,054.8 54.1 5.8 141.5 93.9 55.4 863.8 7.5Mining 5.8 0.0 0.0 0.0 0.0 0.0 3.3 0.0Real estate 4,453.9 459.6 8.2 55.3 26.3 55.3 1,232.7 15.5Trading 2,046.6 4.5 6.5 41.4 33.9 41.4 1,075.8 7.9Transport 1,377.9 16.2 6.7 42.4 0.0 42.4 801.1 5.6Other gov. & social services 297.9 0.3 0.8 9.7 4.3 7.8 209.4 1.3Individuals 8,498.5 0.0 31.3 239.7 1.7 239.3 715.4 23.4Derivatives 0.0 5.8 0.0 0.0 0.0 0.0 0.0 0.0TOTAL 29,901.7 666.5 78.8 552.3 162.7 463.9 8,936.8 100.0
The columns of outstanding amounts indicate the balance (gross) of these claims and loans that are overdue and/or written down, including not overdue.
63

39. Related parties(millions of EEK) Group Bank
31.12.05 31.12.04 31.12.05 31.12.04
13.3 9.9 6.4 3.9
Demands to subsidiaries - - 868.6 6,549.5Commitments to subsidiaries - - 324.9 226.6Off-balance sheet demands to subsidiaries - - 46.4 20.4Off-balance sheet commitments to subsidiaries - - 570.3 553.6
Loans to parent company 1,603.0 1,803.7 1,602.1 1,803.7Due to parent company 15,042.8 9,793.5 6,724.0 9,793.5 incl. subordinated liabilities 1,048.3 0.0 1,048.3 0.0Contingent assets and commitments to parent company 1,493.5 444.0 1,493.5 444.0Contingent liabilities and commitments to parent company 2,633.1 973.3 2,633.1 973.3
Loans to enterprises of parent company's consolidation group 130.3 26.2 130.3 26.2Due to enterprises of parent company's consolidation group 21.9 12.6 21.9 12.6Contingent assets and commitments to enterprises of parent company's consolidation g 87.6 51.0 87.6 51.0Contingent liabilities and commitments to enterprises of parent company's consolidatio 87.6 51.0 87.6 51.0
Interest income from parent company 40.7 32.2 40.7 32.2Interest expence from parent company 343.9 228.0 214.7 228.0Commission income from parent company 3.0 1.8 1.2 0.6Commission expences from parent company 0.2 0.6 0.2 0.6
Interest income from enterprises of parent company's consolidation group 0.7 0.3 0.6 0.3Interest expence from enterprises of parent company's consolidation group 0.2 0.5 0.2 0.5Commission income from enterprises of parent company's consolidation group 14.3 2.4 1.7 0.3Commission expences from enterprises of parent company's consolidation group 4.2 0.2 0.2 0.0
Interest rates of the loans given to related parties do not differ materially from interest rates of theloans to customers. Transactions with related parties have been based on market terms.
Related parties are:- subsidaries- parent company and subsidaries of parent company;- members of management board of credit institution and internal audit manager, also their confidants and commercial undertakings, controlled jointly or severally by the mentioned persons.
31.12.05 31.12.04Salaries in AS SEB Eesti Ühispank 265.0 227.0Members of management board 8.8 8.3Members of supervisory board 2.9 0.0Employees 253.3 218.7
Salaries in subsidaries of AS SEB Eesti Ühispank 49.3 53.0Members of management board 0.0 0.0Members of supervisory board 0.0 0.0Employees 49.3 53.0Total salaries, Group 314.3 280.0
38. Legal disputesThere are no outstanding legal disputes from which AS SEB Eesti Ühispank could suffer major losses.
Compensation upon termination of the agreement concluded with a management board member
Loans to members of management board of credit institution and internal audit manager, also their confidants and commercial undertakings, controlled jointly or severally by the mentioned persons.
The bank's management board members are paid a compensation amounting to 12-month remuneration if they are not re-elected as management board members or if the management board member refuses to accept the position offered under employment contract in AS SEB Eesti Ühispank or a company belonging to the same consolidation group with AS SEB Eesti Ühispank.
OÜ Cosmotrade has filed a claim against AS SEB Eesti Ühispank in amount of 12.8 million kroons. First court session will be held in March 2006. Today we have no sufficient grounds to believe that we will incur major losses, accordingly we have not made any provision for the claim.
64
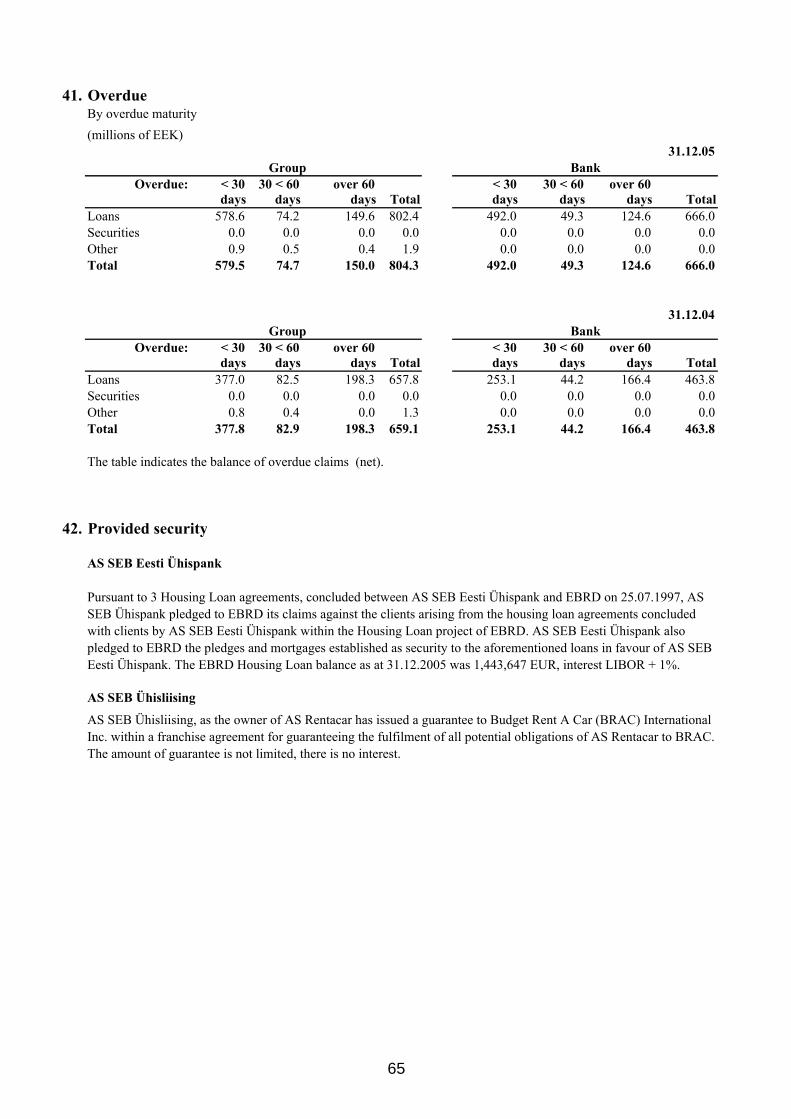
41. OverdueBy overdue maturity(millions of EEK)
31.12.05Group Bank
Overdue: < 30 30 < 60 over 60 < 30 30 < 60 over 60days days days Total days days days Total
Loans 578.6 74.2 149.6 802.4 492.0 49.3 124.6 666.0Securities 0.0 0.0 0.0 0.0 0.0 0.0 0.0 0.0Other 0.9 0.5 0.4 1.9 0.0 0.0 0.0 0.0Total 579.5 74.7 150.0 804.3 492.0 49.3 124.6 666.0
31.12.04Group Bank
Overdue: < 30 30 < 60 over 60 < 30 30 < 60 over 60days days days Total days days days Total
Loans 377.0 82.5 198.3 657.8 253.1 44.2 166.4 463.8Securities 0.0 0.0 0.0 0.0 0.0 0.0 0.0 0.0Other 0.8 0.4 0.0 1.3 0.0 0.0 0.0 0.0Total 377.8 82.9 198.3 659.1 253.1 44.2 166.4 463.8
The table indicates the balance of overdue claims (net).
42. Provided security
AS SEB Eesti Ühispank
AS SEB Ühisliising
Pursuant to 3 Housing Loan agreements, concluded between AS SEB Eesti Ühispank and EBRD on 25.07.1997, AS SEB Ühispank pledged to EBRD its claims against the clients arising from the housing loan agreements concluded with clients by AS SEB Eesti Ühispank within the Housing Loan project of EBRD. AS SEB Eesti Ühispank also pledged to EBRD the pledges and mortgages established as security to the aforementioned loans in favour of AS SEB Eesti Ühispank. The EBRD Housing Loan balance as at 31.12.2005 was 1,443,647 EUR, interest LIBOR + 1%.
AS SEB Ühisliising, as the owner of AS Rentacar has issued a guarantee to Budget Rent A Car (BRAC) International Inc. within a franchise agreement for guaranteeing the fulfilment of all potential obligations of AS Rentacar to BRAC. The amount of guarantee is not limited, there is no interest.
65

43. Contingent liabilities
Potential income tax on distribution of dividends
Potential liabilities arising from tax inspection
44. Events after end of the financial yearNo such significant events have occurred after the end of the financial year in SEB Eesti Ühispank, that would affect the conditions of the assets and liabilities as at the balance sheet date 31.12.2005.
The retained earnings of the group as at 31 December 2005 were 2 354,6 (31 December 2004: 1 444,8 million kroons. Distribution of retained earnings as dividends to the owners is subject to the income tax at the rate of 23/77 since 1 January 2006 (until 31.12.2005: 24/76) on the amount paid out as net dividends. Therefore, from the retained earnings available at the balance sheet date it is possible to pay out to the shareholders as dividends 1 813,0 million kroons and the corresponding income tax would amount to 541,6 million kroons. As of 31 December 2004 it would have been possible to pay out dividends the amount of 1 098,0 million kroons, and the corresponding income tax would have amounted to 346,8 million kroons.
As at 31 December 2005 100% shares of AS SEB Eesti Ühispank are owned by SEB AB, who makesthe decisions about profit distribution. SEB AB has decided not to pay out dividends from the netprofit of AS SEB Eesti Ühispank for the reporting period.
The tax authorities may at any time inspect the books and records of the company within 6 years subsequent to the reported tax year, and may as a result of their inspection impose additional tax assessments and penalties.The Company's management is not aware of any circumstances which may give rise to a potential material liability in this respect.
The tax administrator conducted a tax audit in the bank (concerning fringe benefits for the period from July 1999 to August 2002). As a result of the audit, additional amount of income and social tax imposed to the group totalled to ca 11 million kroons, to which interests for the period of 2002-2005 were added. The bank paid the tax amount in 2005, however has disputed the notice of assessment in the court of law. The impact of the imposed additional tax on the bank’s financial position and operating results in amount of approximately 18 million kroons has been recorded in reporting period under "other expenses".
66

45. IFRS Financial Statements
IFRS Consolidated Income Statement(millions of EEK) 2005 2004
Interest and similar income 1,647.4 1,369.8Interest expenses and similar charges -736.2 -496.4
Net Interest Income 911.2 873.4Fee and commission income 763.2 591.8Fee and commission expense -217.5 -175.8
Net income from fees and commissions 545.7 416.0Income from foreign exchange (net) 94.4 71.6Gains less losses from trading of securities 12.5 8.8Income from insurance activities 90.2 57.7Income from dividends 0.9 0.0Gains less losses from investment securities 8.8 -2.3Share of profit of associates 12.2 3.9Other income 41.2 44.5Total income 1,717.1 1,473.6
Personnel expenses -442.3 -379.6Other expenses -288.4 -234.8
-78.1 -81.0Total expenses -808.8 -695.4
908.3 778.2
Impairment losses on loans and advances 21.4 -35.8
Profit before tax 929.7 742.4Income tax -6.2 0.8
Profit for the year 923.5 743.2
Attributable to the sole equity holder 923.5 743.2
EPS 13.87 11.17
Depreciation and value adjustments of tangible and intangible assets
Profit before Impairment losses on loans and advances
67

IFRS Consolidated Balance Sheet(millions of EEK) 31.12.05 31.12.04
ASSETSCash 526.1 443.5Balances with central bank 2,231.1 1,701.4Loans and advances to credit institutions 1,921.5 2,116.4Loans and advances to customers 41,728.4 27,874.9Securities 1,444.2 666.0Intangible assets 391.5 397.5Tangible assets 588.6 593.8Investment properties 108.8 108.8Other assets 270.3 221.8Accrued income and and prepaid expenses 628.2 609.1TOTAL ASSETS 49,838.7 34,733.2
LIABILITIES AND SHAREHOLDERS' EQUITYDue to credit institutions 14,783.1 10,088.4Due to customers 27,076.1 18,483.3Government and foreign aid funds 113.9 167.8Issued securities 299.2 757.2Other liabilities 1,098.3 409.4Deferred income tax liabilities 1.9 0.0Accrued expenses and deferred income 422.6 398.2Provisions 311.4 402.9Subordinated loans 1,048.3 266.0Total Liabilities 45,154.8 30,973.2
Share capital 665.6 665.6Share premium 1,346.6 1,346.6Other reserve 316.7 303.0Translation reserve 0.4 0.0Retained earnings 2,354.6 1,444.8Total Shareholders' Equity 4,683.9 3,760.0TOTAL LIABILITIES AND SHAREHOLDERS' EQUITY 49,838.7 34,733.2
68
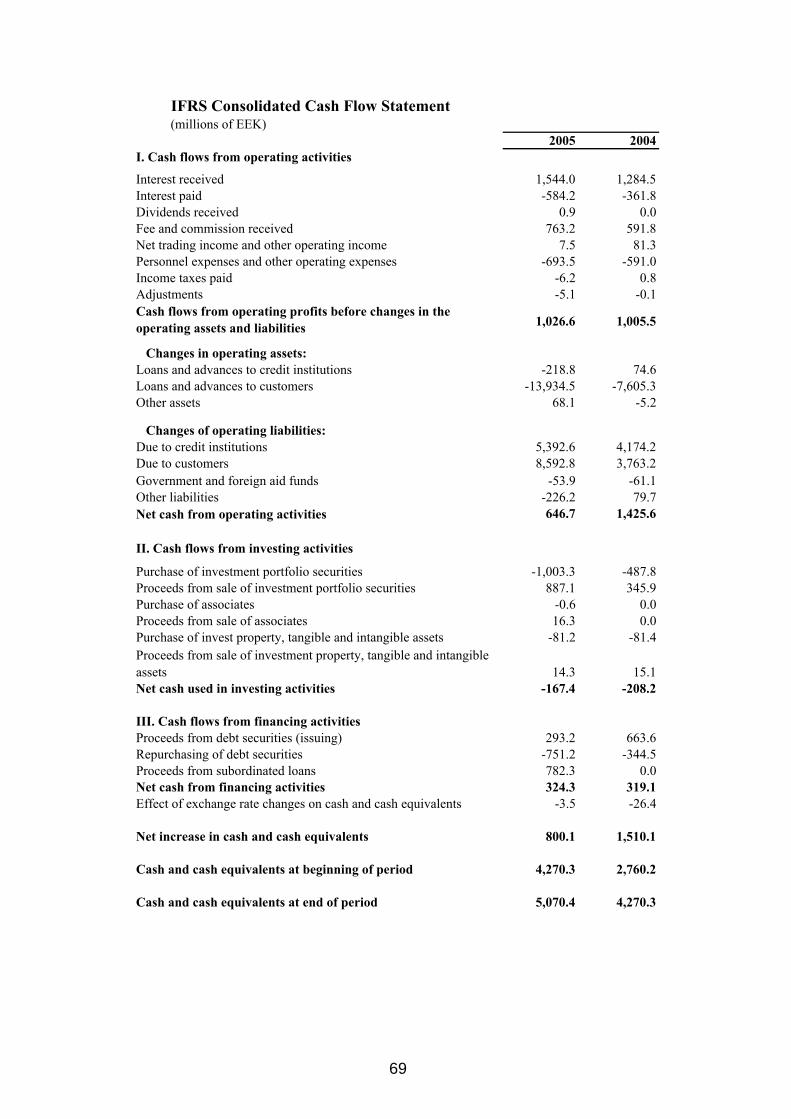
IFRS Consolidated Cash Flow Statement(millions of EEK)
2005 2004I. Cash flows from operating activities
Interest received 1,544.0 1,284.5Interest paid -584.2 -361.8Dividends received 0.9 0.0Fee and commission received 763.2 591.8Net trading income and other operating income 7.5 81.3Personnel expenses and other operating expenses -693.5 -591.0Income taxes paid -6.2 0.8Adjustments -5.1 -0.1
1,026.6 1,005.5
Changes in operating assets:Loans and advances to credit institutions -218.8 74.6Loans and advances to customers -13,934.5 -7,605.3Other assets 68.1 -5.2
Changes of operating liabilities:Due to credit institutions 5,392.6 4,174.2Due to customers 8,592.8 3,763.2
-53.9 -61.1Other liabilities -226.2 79.7Net cash from operating activities 646.7 1,425.6
II. Cash flows from investing activities
Purchase of investment portfolio securities -1,003.3 -487.8Proceeds from sale of investment portfolio securities 887.1 345.9Purchase of associates -0.6 0.0Proceeds from sale of associates 16.3 0.0Purchase of invest property, tangible and intangible assets -81.2 -81.4
14.3 15.1Net cash used in investing activities -167.4 -208.2
III. Cash flows from financing activitiesProceeds from debt securities (issuing) 293.2 663.6Repurchasing of debt securities -751.2 -344.5Proceeds from subordinated loans 782.3 0.0Net cash from financing activities 324.3 319.1Effect of exchange rate changes on cash and cash equivalents -3.5 -26.4
Net increase in cash and cash equivalents 800.1 1,510.1
Cash and cash equivalents at beginning of period 4,270.3 2,760.2
Cash and cash equivalents at end of period 5,070.4 4,270.3
Cash flows from operating profits before changes in the operating assets and liabilities
Government and foreign aid funds
Proceeds from sale of investment property, tangible and intangible assets
69

IFRS Changes in Consolidated Shareholders' Equity (millions of EEK)
Share capital
Share premium
Other reserves
Translation reserve
Retained earnings
Total share-holders' equity
Final balance 31.12.2003 665.6 1,346.6 300.7 0.0 704.0 3,016.9Revaluation of securities - - - - -0.1 -0.1Statutory reserve - - 2.3 - -2.3 0.0Profit for the year - - - - 743.2 743.2Final balance 31.12.2004 665.6 1,346.6 303.0 0.0 1,444.8 3,760.0
Changes related to IAS 39 (note 3) - - 8.6 - -8.6 0.0
Year beginning 01.01.2005 665.6 1,346.6 311.6 0.0 1,436.2 3,760.0Statutory reserve - - 5.1 - -5.1 0.0Revaluation of securities available-for-sale - - 5.2 - - 5.2Realization of revaluation of securities available-for-sale - - -5.2 - -5.2Consolidation of foreign subsidaries - - - 0.4 - 0.4Profit for the year - - - - 923.5 923.5Final balance 31.12.2005 665.6 1,346.6 316.7 0.4 2,354.6 4,683.9
70

AS PricewaterhouseCoopers Pärnu mnt. 15 10141 Tallinn Estonia www.pwc.ee Telephone +372 6 141 800 Facsimile +372 6 141 900
AUDITOR’S REPORT (Translation of the Estonian original) To the shareholder of AS SEB Eesti Ühispank We have audited the consolidated financial statements of AS SEB Eesti Ühispank and its subsidiary companies (the Group) for the year ended 31 December 2005, from which the summarised consolidated financial statements set out on pages 67 to 70 were derived. We conducted our audit in accordance with International Standards on Auditing. In our report dated 15 February 2006 we expressed an opinion that the consolidated financial statements, from which the summarised consolidated financial statements were derived, give a true and fair view of the financial position of the Group in accordance with International Financial Reporting Standards as adopted by the European Union. In our opinion, the accompanying summarised consolidated financial statements are consistent, in all material respects with the consolidated financial statements from which they were derived. For a better understanding of the Group’s financial position and the results of its operations for the period and of the scope of our audit, the summarised consolidated financial statements should be read in conjunction with the consolidated financial statements from which the summarised consolidated financial statements were derived and our auditor’s report thereon. Tiit Raimla Relika Mell Authorised Auditor Authorised Auditor 20 March 2006
71

AS SEB EESTI ÜHIPANK Located at Tornimäe 2, Tallinn
MANAGEMENT BOARD RESOLUTION No 24
In Tallinn 14. 02. 2006 Pursuant to Paragraph 1 of Article 37 of the AS SEB Eesti Ühispank Articles of Association and Clause 2.1.4 of the Management Board bylaws, AS SEB Eesti Ühispank Management Board hereby resolves:
1. To make a proposal to the general shareholders’ meeting not to distribute the profit of the financial year 2005 in the amount of 536'909'882 EEK (five hundred and thirty-six million, nine hundred and nine thousand, eight hundred and eighty two Estonian kroons). 2. To submit the present resolution to the Supervisory Board of AS SEB Eesti Ühispank for review. Mart Altvee Chairman of the Management Board
72