public board report/memo
TRANSCRIPT

CONFIDENTIAL MEMORANDUM
To: Metrolinx Board of Directors From: Jennifer Gray, Chief Financial Officer Mark Childs, Chief Marketing & Communications Officer
Date: June 25, 2020
Re: Metrolinx 2019-20 Annual Report
Recommendations RESOLVED, on recommendation of the Audit, Finance, and Risk Management Committee:
THAT, subject to any comments received from the Metrolinx Board of Directors and the Audit, Finance, and Risk Management Committee, the Metrolinx Annual Report 2019-20 be approved; THAT Audited Financial Statements for Metrolinx for the year ended March 31, 2020 as appended to the 2019-20 Annual Report be approved;
AND THAT the CEO submit the Annual Report to the Minister of Transportation in accordance with the Metrolinx Act, 2006;
AND THAT the CEO submit the approved Audited Financial Statements to the Ministers of Finance and Transportation.
Background An electronic version of the 2019-20 Annual Report will be posted to Metrolinx’s website at:http://www.metrolinx.com/en/aboutus/publications/annual_reports.aspx The Annual Report is consistent with the updated guideline provided by the Province for Annual Reports and is in accordance with the requirements of the Metrolinx Act, 2006. The Annual Report features a look back at significant milestones and achievements from 2019-20, including the progress made on the GO Expansion program, rapid transit projects, OnCorr, and the new subways portfolio in our capital infrastructure program. Our customer experience deliverables for GO, PRESTO and UP Express are also highlighted. The Annual Report also outlines how Metrolinx implemented business continuity measures, shifted its operations, and executed its response to the

Page 2 of 2
COVID-19 pandemic to ensure continued services and delivery on our mandate across the Greater Golden Horseshoe. The Audit, Finance, and Risk Management Committee has also reviewed the Annual Report consistent with that committee’s mandate. The Annual Report draft will be finalized upon approval of the Board of Directors, signed by the Board Chair, and submitted to the Minister of Transportation in accordance with section 33 of the Metrolinx Act, 2006. Respectfully submitted, Jennifer Gray and Mark Childs Attachment: Metrolinx Annual Report 2019-20

Annual Report
2019-20

Annual Report 2019-20 2
Table of Contents
Land Acknowledgement ............................................................................................................................................... 3
Message from the Chair ................................................................................................................................................ 4
Message from the CEO ................................................................................................................................................. 5
Vision, Mission, Values & Mandate .............................................................................................................................. 7
Introduction .................................................................................................................................................................... 8
Financial Highlights & Business Plan Report ............................................................................................................... 9
Report on Non-Financial Activities ............................................................................................................................. 10
Governance ..................................................................................................................................................................30
Management Discussion & Analysis ..........................................................................................................................32
Financial Statements ...................................................................................................................................................33
Appendix A – 2019-20 Strategic Objectives Report .................................................................................................34
Appendix B – Metrolinx GRI Report ........................................................................................................................... 41

Annual Report 2019-20 3
Land Acknowledgement
Let us take a moment to acknowledge that we are on the traditional territory of many nations. In particular, the Mississaugas of the Credit, the Anishnabeg, the Haudenosaunee and the Wendat peoples. We acknowledge that Metrolinx operates on these lands and has a responsibility to work with the original keepers of this territory and the many Indigenous Peoples living here today.
Annual Report 2019-20 4
Message from the Chair
Metrolinx continues to play a critical role in the integration and economic development of the Greater Golden Horseshoe. The 2019-20 fiscal year brought even greater clarity to the agency’s role as we accepted the responsibility of delivering the province’s subway program and refined our mandate of achieving the capital investments that will bring the 2041 Regional Transportation Plan to fruition.
The resiliency of Metrolinx’s service to its customers across the region, its capital project implementation, emergency response plans and agility and commitment of the entire executive and staff team were brought into sharp focus during the last quarter of the business year when COVID-19 was declared a global pandemic.
The Metrolinx team has excelled to keep our services operating for our customers and particularly for the region’s essential workers who were dependent on us to get them to their jobs, and home again to their families.
Despite the impact of the pandemic on ridership and revenue targets, we achieved many of the targets we established at the outset of the fiscal year, particularly in terms of service expansion, PRESTO adoption, fare integration and capital works. We spent just under $3.4 billion on construction projects, including GO Expansion and rapid transit projects as well as capital improvement works across the region.
Our focus on building strong partnerships is critical to the work that we do in the region. In February 2020, the Board of Directors endorsed the Prioritization Framework which was developed in conjunction with municipalities to evaluate unfunded frequent rapid transit network (FRTN) projects – specifically to determine benefits, planning readiness, and contribution to the transit network in the region.
As we plan for the next fiscal year, the priority focus will be adjusting our business to manage the ongoing changes brought on by COVID-19. Business improvement and recovery efforts are key planning areas, especially as many customers resume normal work routines and will require confidence in Metrolinx’s transit services – a challenge I am positive the team will rise to meet.

Annual Report 2019-20 5
Message from the CEO
The 2019-20 fiscal year proved to be momentous in many ways for Metrolinx. In addition to significant progress made in expanding our services, achieving key milestones on our Transit Oriented Communities (TOC) program, and significantly advancing our existing capital projects, the province has expanded our capital program by entrusting us to deliver the subway program.
Though the subway program has required Metrolinx to rapidly strengthen its capacity to successfully deliver this program, the efforts are starting to pay off. We successfully published the Ontario Line Initial Business Case, the Scarborough Subway Extension Preliminary Design Business Case, the Eglinton Crosstown West Extension Initial Business Case, and made significant progress on the Yonge-North Subway Extension Initial Business Case that will be released in 2020-21 fiscal year. In partnership with Infrastructure Ontario, Metrolinx has successfully closed the Requests for Qualifications for tunneling for both the Scarborough and Eglinton extensions.
Metrolinx has also made significant progress with the early works to start the Hurontario LRT, Finch West LRT with significant work on Finch Station, bridge rehabilitation over Highway 400, and progress on the maintenance and storage facility. Despite the Eglinton Crosstown LRT project being delayed into 2022, the project has achieved significant progress since our 2018 commercial settlement, including the extraction of the tunnel boring machines and over 50 per cent of the track work now complete. The GO Expansion program continues to progress on its early works projects as we work to finalize our OnCorr procurement, which will bring $2.60 in benefits for every $1 invested in the region.
Our Transit Oriented Communities profile grew considerably this past year with the completion of the deal on a new Woodbine GO station, execution of a binding agreement for an improved and integrated Mimico GO station, and with a number of other deals progressing well.
The achievements on the capital program cannot be overstated in the face of an infrastructure market that is becoming more risk averse and facing capacity issues, including dealing with skilled labour shortages.
Even with all of the exciting projects underway in our region, existing and potential new customers do not need to wait for an improved experience on our network. Increasing services has remained a priority for Metrolinx. More peak and two-way evening service was added to the Kitchener line, while weekend train service was introduced on the Stouffville. We also increased rush hour, two-way weekend service and introduced a new late-night express service on the Lakeshore lines. In the meantime, we continue to

Annual Report 2019-20 6
expand service on the Richmond Hill, Barrie, and Milton lines and continue to look for new opportunities across all lines, while minimizing the need for new infrastructure. This is a pragmatic approach that is bringing more service to our region with a respect for taxpayer dollars.
2019-20 was a big year for PRESTO as it achieved a 99.5 per cent equipment availability rate, almost one million downloads of the new app, and a reduction of the minimum load requirements. The PRESTO file will become even more exciting in the year to come as we look to start an open payment pilot, which will transform how people pay their fares.
The fiscal year came to a close in an unprecedented fashion with the onset of the COVID- 19 pandemic, which has reduced our ridership by over 90 per cent, has impacted how we operate our service, how people work, and has been a real strain on our balance sheets.
I am proud of how our team has responded to this global crisis by coming together to not only ensure we are keeping our customers and colleagues safe, but going the extra mile to help the broader provincial effort. Metrolinx was able to donate 12,000 N-95 masks and 6,000 filters to frontline health care workers, convert some of our Park & Ride locations into rest stops for the trucking community, and converted our billboards into public health advertising. The “Ontario Spirit” is alive and well at Metrolinx.
Our response to this crisis has been successful because of our safety culture. We made major reductions in our lost time injury frequency rates (LTIFR) and commuter train operating violations. We continue to instill this culture of safety into our external contractors as well. In a world that emerges from COVID-19, health and safety will be emphasized even more than it has to date. “Safety Never Stops” is more than a slogan at Metrolinx, it is the essence of our work each and every day as we serve our customers across the region.
The 2020-21 year will no doubt be a year of transformation and we are implementing Business Improvement Plans to improve the way we deliver services in a more efficient and safe manner, so as to ensure Metrolinx is a trusted partner with our community as life starts to return to a more normal state.
I look forward to achieving even more success in the coming year and just want to thank each and every customer and every Metrolinx employee for meeting the challenge during these unique times. I am truly proud of the success we have made over the past year and know that the best is yet to come.
Stay safe and healthy.

Annual Report 2019-20 7
Vision, Mission, Values & Mandate
OUR VISION We connect our communities.
OUR MISSION Getting you there better, faster, easier.
OUR VALUES Serve with Passion. Think Forward. Play as a team.
OUR MANDATE Metrolinx is an agency of the Government of Ontario, established under the Metrolinx Act of 2006 (“the Act”). The Act mandates Metrolinx to coordinate, plan, finance, develop and implement an integrated transit network in the Greater Golden Horseshoe (GGH) in alignment with applicable growth plans and provincial transportation policies and plans. Metrolinx is responsible for the operation of the regional transit system.
The organization’s mission is to ensure the implementation of an integrated transit network that connects people, improves their quality of life, and brings sustainable development and prosperity to our communities.
Annual Report 2019-20 8
Introduction
From business continuity to operational resilience
Metrolinx was faced with preparing for an unprecedented public health event in January 2020 with the global COVID-19 outbreak. The organization’s early response to the pandemic and initiation of business continuity plans across all business units prepared us in the face of uncertainty, while keeping the safety of our customers and employees top of mind.
We continue to play a key role in delivering historic new projects to expand Ontario’s transit infrastructure, working to meet the needs of those across the Greater Golden Horseshoe (GGH).
In April 2019, we announced the largest single expansion in Toronto’s subway history with the Ontario Line, the Yonge North subway extension, the Scarborough subway extension and the Eglinton West subway extension.
GO Expansion moved forward with work taking place across the GO network, such as bridge replacements, grade separations, tunneling and installation of new tracks, and completion of a new rail storage and maintenance facility that will provide faster and more convenient rail transit service throughout the region.
We also worked to improve service for our customers – offering new programs, promotions, and increases in service.
As we neared the end of the fiscal year and the pandemic hit Ontario, our primary objective shifted to maintaining a lifeline transit service for those needing to travel in the region. We began looking at longer-term strategies to safely support the region’s transit needs into the recovery period.

Annual Report 2019-20 9
Financial Highlights & Business Plan Report
For the 2019-20 business year, revenue was just under $706.5 million comprised of $574.2 million from fare revenue and $132.3 million from non-fare revenue.
Our operating costs totaled $1.3 billion while our budget for the year was $1.1 billion. We ended the year with a net loss for the fiscal year of $18.4 million.
Our capital expenditures for the year were $3,395.0 million, which was $482.4 million lower than the annual budget of $3,877.4 million. COVID-19 has some related impacts to the underspend related to construction progress and the move to a work-from-home environment for most professional services staff. In addition, several projects did not meet scheduled milestones as originally forecasted for 2019-20 and accounted for most of the underspend.
The fiscal year came to a close in an unprecedented fashion with the onset of the COVID-19 pandemic, which has reduced Metrolinx’s ridership by as much as 95 per cent and has impacted how Metrolinx operates its service. Services were reduced by approximately 55 per cent beginning in mid-March.
Key achievements from 2019-20 outlined in the 2020-21 Business Plan include:
• Increased service on the Lakeshore East, Lakeshore West, and Kitchener
corridors, and improved off-peak service on the Stouffville, Barrie, and Lakeshore corridors.
• Advanced procurement work for major capital projects including GO Expansion new stations, off-corridor and on-corridor works; finalized procurement process and started construction of the Hurontario LRT
• Implemented fare strategy that includes lower GO fares for short distance trips and Kids GO Free, launched new e-ticketing platform and introduced “Sunday Funday” e-ticketing promotion
• Implemented improvements to PRESTO customer experience including through web chat enhancements, reduced minimum card load, and elevated customer support provided via social channels
The 2020-21 Business Plan key deliverables include:
• Continuing work to implement planned rail service extensions and GO bus
strategy, while also enhancing customer service and safety; • Continuing to work towards delivering capital project commitments, including
by working together with Infrastructure Ontario (IO) in advancing enabling work and other critical procurements to support the GO Rail Expansion program, advancing preliminary work on the province’s new subway transit plan and

Financial Highlights & Business Plan Report
10 Annual Report 2019-20
making progress on rapid transit projects; • Continuing PRESTO improvements through system enhancements,
implementing new forms of payments and continuing to work with municipalities to roll out new PRESTO devices;
• Continuing to pursue non-fare revenue initiatives, implementing fare changes and utilizing research and experience-driven customer insights to drive ridership growth;
• Advancing ongoing work with municipalities related to fare and service integration and improving station access.

Report on Non-Financial Activities
Annual Report 2019-20
11
EVERYONE SAFE
Safety remains central to everything we do at Metrolinx. We continue to build on safety themes and reinforce a positive and responsive safety culture through the involvement of all our employees and contractors across the organization, as well as the implementation of programs to support continuous improvement.
The importance of our safety focus became very clear when the COVID-19 global outbreak meant enormous changes for the entire world, including our customers and employees.
In late January, an Incident Command Team (ICT) was convened to monitor and plan the organization’s response to the unfolding COVID-19 outbreak. Towards the end of the fourth quarter, many business units had activated their business continuity plans to respond to the onset of the pandemic and the new requirements for working remotely and physical distancing.
By the end of the March, 40 new safety measures were in place to ensure the safety of both our customers and our employees during the pandemic.
At the start of the year, safety targets were set to reduce lost time injury frequency rates (LTIFR) among employees and among contractors for construction hours worked, and to reduce Train Operating Rule Violations. At the close of the business year, we exceeded our goal to attain a LTIFR of 3.2 among employees and saw instead a rate of 2.9, 22 per cent less than our target. Among contractors, our 12-month rolling LTIFR was 0.18, slightly above our target of 0.10. (See Appendix A for further details).
For the 2019/2020 reporting period Train Operating Rule Violations decreased by 30 per cent with a result of 1.0, less than our target of 1.2 and, a 27 per cent decrease when compared to our results last year.
Since the launch of the Safety Charter in March 2018, our employees have become increasingly vigilant to the safety needs of our customers as well as to operational and personal safety. Throughout the year, over 24 employees were recognized at the Board of Directors meeting and the Leadership conference for being stewards of safety.

Annual Report 2019-20 12
Reporting safety concerns was made easier across the organization through safety education, leader-led safety planning sessions, and the rollout of the Safety Observation Reporting program. The program provides a mechanism for employees to record and report any safety breaches they identify in their workspaces and to have them escalated for resolution.
Safety efforts were further enhanced with the historic addition of the canine unit to the Transit Safety team in August. On call 24 hours a day, the canine unit increases response capacity to investigate suspicious packages, while further ensuring public safety.
On November 2, 2019, Metrolinx’s emergency management plan was tested as we held a full-scale emergency exercise at Union Station, in conjunction with Toronto Paramedic Services, Toronto Police and Fire Services, and the City of Toronto. More than 150 people volunteered as actors and we were able to successfully test our emergency and crisis management plans.
In February of this year, Metrolinx faced blockades to our rail corridors from Indigenous solidarity groups supporting the Wet’suwet’en Nation in its opposition to the Coastal GasLink Pipeline. Metrolinx addressed the situation and impacts to our staff and customers through safety and security management practices that were respectful to everyone involved. Our principal focus throughout this situation was safety and security for GO rail customers, operational crew, front line staff, and solidarity movement participants.

Annual Report 2019-20
13
ENGAGED PEOPLE
Celebrating and appreciating our differences was a focus in 2019-20. Metrolinx continues to innovate so that we can attract and retain the best talent. We were named one of the 2019 winners of Canada’s Most Admired Corporate Cultures by Waterstone Human Capital and named as one of Greater Toronto's Top Employers and Canada’s Greenest Employers for 2020 by Mediacorp Canada.
Our goal of achieving gender balance continues to be prioritized as one of our organization’s key Strategic Objectives, for the second fiscal year in a row. We exceeded our gender balance targets for the year, with women representing 38 per cent of employees at the senior manager level or above, and 34 per cent of all Metrolinx employees.
Since June 2019, key foundational work has taken place to develop a strong culture of inclusion through education. This included the development and launch of unconscious bias training for more than 900 people leaders, enhanced talent acquisition strategies and a Dates of Significance plan that featured a printed and digital calendar made available to all staff.
The Indigenous Relations unit, established in March 2019, focused on employee education and developing a culture of awareness within Metrolinx. Activities included observing Treaties Week, Orange Shirt Day, National Indigenous History Month, and conducting a Blanket Exercise with key staff members. Metrolinx also developed a formal land acknowledgement protocol and statement that recognizes the unique and enduring relationship which exists between Indigenous Peoples and their traditional territories.
In addition to educating and raising awareness with staff, the Indigenous Relations unit provides support and advice to project delivery teams where engagement and consultation with Indigenous communities is required. This includes communicating and meeting with Indigenous communities about specific Metrolinx projects, potential environmental impacts and engagement on archaeological assessments taking place. The Indigenous Relations office is also building relationships with Indigenous communities to ensure that Metrolinx projects and services do not negatively impact them.
Metrolinx’s employee recognition program is aligned with the Customer and Safety Charters, and employees who demonstrated the behaviours associated with the charter promises were celebrated at quarterly awards ceremonies and through internal communications channels. More than 665 employees who attained milestones in terms of years of service (five, 10, 15, 20, 25 or 30 years as well as retirement) were recognized across the organization.

Annual Report 2019-20
14
Metrolinx is committed to supporting its employees and works to provide new resources and tools that complement our existing ones. In March 2020, we introduced a new Employee Care Office, an inclusive, emotionally safe and confidential space for all employees to be provided with support and guidance to navigate the complexities of life. Resources include elder care, psychological care, reproduction, parenting, and LGBTQ2S support. These services are in addition to those offered through our Employee & Family Assistance Program (EFAP) provider.
A focus on leader-led employee engagement continued in 2019-20 and for the first time we executed an organization-wide virtual engagement session with the senior management team. The session was very well-attended and there was active participation from a significant number of employees. Given the range in shift hours and access to technology within our organization, a video of the session was shared and questions continued to be addressed after it ended.
Internal communications and engagement activities took place consistently throughout the year and helped contribute to increasing our employee engagement score to 78 per cent. Campaigns to educate and seek feedback from employees related to organizational changes, policies and decisions took place through several channels including the rebranded Metrolinx News website, Yammer (Metrolinx’s internal social media platform), Newslinx weekly employee newsletter, all-staff emails, videos and town halls. Capturing and measuring employees’ interaction with content was a key focus for the team, in order to better gauge interest and reach.
A major milestone was reached in 2019-20 with the implementation of the new Human Resources Information System cloud solution in August 2019 – improving position management, efficient employee data administration, benefits administration and recruitment. This platform provides employees with online access to their employment data and pay statements from any device without having to be connected to our internal network.
Also in August our internal online centre for professional development, Metrolinx University (MXU) was updated with a new learning management system. This platform supports our efforts in improving our employees’ engagement, confidence and competence. MXU provides us with the ability to host and track required and optional employee course offerings. Additional education and training opportunities offered to all employees included first aid training, a cybersecurity course, a records information management course and workplace violence, harassment and discrimination training. By the end of September, the adoption rate for the new system surpassed our targets.
In 2019-20, the Human Resources division also introduced new functional areas under the banner of Enterprise Centres of Excellence (ECOE). The Project Management ECOE supports project delivery across the organization with a standard project delivery framework coupled with easy-to-use tools and targeted training to improve collaboration

Annual Report 2019-20
15
and employees’ ability to multiply and scale large projects. The Lean ECOE team partners throughout Metrolinx to provide Lean expertise, training, coaching, tools and best practices to operationalize continuous improvement competency. This includes working to ensure that Metrolinx employees are empowered to identify and solve problems while demonstrating a Lean mindset and while working to satisfy our customers by optimizing our available Metrolinx capacity, increasing efficiency and relentlessly eliminating waste.
With these new areas of focus, the Human Resources division rebranded itself earlier this year to Human Resources & Enterprise Centres of Excellence.
Metrolinx’s pay-for-performance program saw some improvements this past fiscal year, expanding to incorporate the achievement of corporate key performance indicators (Lost-Time Injury Frequency Rate, Customer Satisfaction and Engagement) in addition to an individual’s performance against goals and objectives. This change brings Metrolinx in line with many other organizations and is intended to drive employee engagement and dedication to achieving the organization’s objectives and mandate.
We launched the IGNITE program, a mandatory leadership training program that provides people leaders with foundational skills to more effectively lead their teams. Late in the fiscal year, we also introduced an enhanced onboarding program for new employees. While this is a new program, we expect to see positive impact through our annual employee engagement survey score.
We know the challenges of a global health emergency such as COVID-19 are enormous for everyone and our Metrolinx employees are no exception. With the initiation of Metrolinx’s COVID-19 Incident Command Team in January, Human Resources and communications strategies were implemented to support our employees and key business and operational partners in their work functions and personal considerations during this crisis.
HR COVID-19 response actions implemented up to March 31, 2020 include:
• For the small number of employees who tested positive/probable for COVID-19, the Employee Care Office reached out to those individuals to provide additional support
• We supported our employees’ mental wellness during the pandemic by ensuring our people were aware of the existing resources they have access to and by introducing new resources on our employee intranet site, such as mental health webinars
• Revised application of the telework policy and support resources • Developed and implemented new protocols for the management and reporting of
illness, out-of-country travel and self-isolation cases • Introduced new and enhanced mental health support resources • Established a ‘Work from Home (WFH)’ group on Yammer to help engage our staff
while providing support, tips and tools for remote working

Annual Report 2019-20
16
• Launched an employee E-cards program where employees can recognize and show support to colleagues
• Updated recruitment procedures, first-day onboarding procedures and the delivery of employee related HR services
Our employee communications related to COVID-19 were proactive from day one, and included an information hub on our employee intranet, establishment of a dedicated email account regularly monitored by Incident Command Team members, and regular updates in our weekly employee newsletter. Our senior leadership team communicated with our staff via email and on Yammer, and used leader-led town halls to answer staff questions.

Annual Report 2019-20
17
TRUSTED BUSINESS PARTNER
Communications, community relations and stakeholder engagement Metrolinx must earn and retain the trust and confidence of the communities we serve, the stakeholders we work with, as well as our business partners in order to achieve our mandate. It is a business imperative that we be consistent in facilitating open and honest two-way dialogue in order to build meaningful relationships, while demonstrating transparency and trustworthiness. These relationships of trust help us to realize and deliver transit to meet the needs of the region.
In the past fiscal year, our engagement activities included the award winning Ask Metrolinx Town Hall1, a series of high profile consultations to discuss the Ontario Line and ongoing community engagement work. In all, we held or conducted 75 public meetings, 867 stakeholder briefings, 5,499 interactions (including correspondence, telephone calls, walks-in visits to community offices, etc.), 20,827e-blasts and 916,143 contacts through direct-to-home outreach.
The Indigenous Relations unit began to establish relationships with the First Nations communities whose traditional territory and Treaty lands we currently operate on. The CEO met with the Chief of the Mississaugas of the Credit First Nation to establish a working relationship and to ensure that engagement and consultation on Metrolinx projects is carried out in a respectful manner.
The media team responded to more than 1,800 media calls and managed many high- profile issues throughout the year, while Metrolinx News (formerly the Link blog) grew to become established as the organization’s primary source of news and information, telling the Metrolinx story, providing updates on capital projects, service changes and other news events. Metrolinx News readership broke several records throughout the year, with the audience growing steadily month after month. The news site finished with more than 300 per cent more views than the previous year.
The Community Benefits program, in partnership with our contractors on the Eglinton Crosstown LRT project, hired 367 people, while local business spend and social enterprise spend totaled just over $7.5 million and more than $740,000, respectively. The Finch West Light Rail Transit project, which officially broke ground on November 15, 2019, hired 10 people through the Community Benefits program by the end of March 2020.
From surveys conducted based on our 2019-20 objectives, residents have a 76 per cent net positive impression score of Metrolinx. This result is indicative of the work done to build positive partnerships and achieve positive impressions through not only integrated,
1 The Ask Metrolinx Town Hall program received an Audio and Visual Arts (AVA) award for Interactive Communication-Citizenship Engagement.
Annual Report 2019-20
18
proactive and targeted communications with our communities, but also through steps taken to deliver value for money and assurances of fact-based business decisions around transit and development.
In May 2019, the first of two planned annual surveys used to understand stakeholder impressions of Metrolinx was completed, with Metrolinx realizing a total positive impression score2 of 59 per cent, a 5 per cent increase from 2018. Continuous improvement programming launched in June 2019 continues to deliver progress towards improved impression scores.
Impacts to our capital program from COVID-19 began to be felt late in the fiscal year. We continued to engage with communities by holding virtual engagements and even while community offices closed, our teams remained active.
Planning and consultation Planning and consulting are critical drivers for building trust and influencing community and stakeholder perception, while soliciting the necessary consensus and support for our work in the region. Work continued throughout the fiscal year to evaluate unfunded Frequent Rapid Transit Network (FRTN) projects using a new prioritization framework, while regional consultations convened with municipal partners sought to advance elements of the 2041 Regional Transportation Plan, including fare integration, station area planning and transit oriented communities (TOC).
Consistent with Metrolinx’s corporate strategy to increase revenue streams, development efforts focused on increasing revenue through the TOC program. Through the successful disposition of several properties, the TOC program was able to secure $22.8M. The Cooksville GO transaction was identified as a significant contributor towards the $40M revenue target, and the transaction was planned to close in March 2020. Due to uncertainty in the market associated with COVID-19, the Cooksville GO transaction was delayed until June 2020. In addition, we executed the Agreement of Purchase and Sale for a new Woodbine GO station, and the binding agreement for an improved and integrated Mimico GO station. We also deployed the ProLinx Property Management system aimed at cost savings from enabled portfolio rationalization, and identification of under-performing real estate assets to generate efficiency. Overall there was growth in the awareness and profile of the TOC program within the real estate development industry, and engagement helped to identify a pipeline of development opportunities in the GO Rail, Light Rail Transit (LRT) and Subway portfolios.
2 Positive Impression Score is the total number of respondents who rank their impression of Metrolinx 7-10 on a 10-point scale, where 1 is negative and 10 is positive. I.e.: 59% of respondents rank Metrolinx 7 or higher in overall impression.

Annual Report 2019-20
19
The Fare Integration Forum (FIF), composed of transit general managers, CEOs and commissioners nominated by their city manager or CAO, met for the first time in May 2019 with the mandate to advance fare integration in the Greater Golden Horseshoe. The FIF reached consensus on a two-year work plan – a collaborative effort from both Metrolinx and municipal partners to build ridership, support transit expansion, and enhance the regional customer experience.
We expanded direct application of the sponsorship project lifecycle approach to include 67 per cent of Metrolinx’s capital program, and supported the production of 77 business cases from across the organization. The Investment Panel advanced 95 per cent of the sponsored submissions it reviewed to the next stage. As part of 2019-20 objectives, there was progression of the GO Expansion On-Corridor Design Build Finance Operate Maintain project procurement, and a Project Evaluation Advisory Panel was established to further support business case guidance. We also did preliminary assessment on the future on new rail lines, successfully completing initial business cases for the Kitchener Expansion and the Niagara and Bowmanville extensions.
Planning for the newly-announced subways program expanded rapidly to support the Ontario Line, Scarborough Subway Extension, Yonge North Subway Extension and Eglinton Crosstown West Extension projects.
The 2019-20 business year also marked the final year of the 2015-2020 Sustainability Plan. During the year, we focused on a number of strategic actions stemming from the Plan, for example: becoming a signatory to the Flood Resilient Toronto Chapter; developing winter readiness and summer readiness plans in Operations; developing the first third-party verified Greenhouse Gas Emissions and Energy Consumption Inventory Report, and progressing our Sustainable Procurement Policy and Vendor Code of Conduct. As part of our Sustainability Strategy commitment to monitor and report on performance annually, a Sustainability Report is once again integrated into the Metrolinx 2019-2020 Annual Report using the Global Reporting Initiative (GRI) (See Appendix B). While this is a self-reporting mechanism, it speaks to our organization’s commitment to sustainability and openness.
Work progressed on several aspects of our important Station Access program. These include development of various standards, such as the Bicycle Infrastructure Standard, completed in July 2019; plans for better integration at stations between GO and local transit services, and development of a range of new mobility pilots such as autonomous vehicle shuttle and micro transit.

Annual Report 2019-20
20
Metrolinx’s Transit Procurement Initiative (TPI) continues to achieve remarkable growth with four new municipal partners this past year: the Municipality of Leamington, the Municipality of Chatham-Kent, the Corporation of the County of Grey and the City of Greater Sudbury. Overall, 52 transit partners have participated since the program began in 2006. This continued interest and growth speaks to the merit of the program, especially since its participation is on a voluntary basis. Transit partners’ testimonials and customer satisfaction feedback continue to trend above 93 per cent.
The TPI program demonstrates that working together creates better efficiencies provides lower unit costs and increases quality of goods to achieve best value for money for Ontario. Program participation helps municipalities capitalize on the opportunity to use their Investing in Canada Infrastructure Program (ICIP) and Gas Tax program funding to deliver more transit services with new bus purchases, improved ridership experience and safety solutions.
TPI’s bus order deliveries reached a new landmark in July with deliveries to Simcoe County marking the 1,500th bus delivery. OC Transpo placed a third order for 74 conventional buses for a total of 249 buses. The new 2019-2024 TPI Governance Agreement supporting joint procurement participation continues to be approved by councils across the region. As of March 31, 2020, estimated savings to municipalities and taxpayers across all joint procurements contracts is more than $32 million.
Capital Projects Group We continued to advance a large program of signature transit expansion projects, including a new subway program, a suite of projects comprising the GO Expansion program as well as light rail transit (LRT) and bus projects.
SUBWAY PROGRAM
Subway development is Metrolinx’s newest series of capital projects, and will bring improved rapid transit service to Toronto and surrounding communities.
In April 2019, Ontario announced four major transit initiatives that will reshape the Greater Toronto Area. The Ontario Line, a 15.5-kilometre free-standing subway line with 15 proposed stations, will run from Exhibition/Ontario Place through downtown Toronto to the Ontario Science Centre and has a preliminary cost estimate of $10.9 billion (subject to market bids). The Yonge North Subway Extension, extending the Yonge subway up into York Region, is expected to cost $5.6 billion and to be complete after the Ontario Line. The Scarborough Subway Extension will extend subway service nearly eight kilometres further into Scarborough, with an estimated cost of $5.5 billion. Lastly, the Eglinton Crosstown West Extension will expand LRT service from the under-construction Mount Dennis Station, on to Renforth Drive and to Pearson airport with an estimated cost of $4.7 billion. Ultimately, through future phases of the Eglinton Crosstown West Extension project, the province is committed to establishing connectivity with Pearson International Airport.

Annual Report 2019-20
21
We awarded the Ontario Line technical advisor contract, continued project planning, and work on environmental approvals, including due diligence and further refinements to design and engineering.
The tunneling procurement for Scarborough and Eglinton projects was released March 10 and in response to COVID-19, the bid open period was extended by six weeks, from the originally scheduled date of April 17.
LIGHT RAIL TRANSIT
Despite the opening being pushed back to 2022, significant construction milestones were achieved on the Eglinton Crosstown LRT, including the installation of more than 50 per cent of the track along the line. The construction of the Eglinton Maintenance & Storage Facility was completed in October. The facility will be home to the Eglinton Crosstown’s fleet of LRVs, where they will be inspected, cleaned and maintained. Other notable construction milestones achieved this past year on the Crosstown project include the early completion of construction work in July that required the temporary closure of Leslie Street at Eglinton, completion of mining at Laird Station in September and Oakwood Station in November, and removal of the last of the tunnel boring machines in March. We also saw in March the installation of the first shelter at the Pharmacy Road street-level stop, and the catenary systems from Mount Dennis, along the elevated guideway to Caledonia Station was completed.
On the Finch West LRT, Mosaic Transit Group, the consortium delivering the project, progressed all design packages through the initial 30 per cent design development stage and presented all 60 per cent design packages for review. Progress continued on early works including the relocation of Enbridge Gas lines and the relocation and protection of oil pipelines. We broke ground on the Maintenance and Storage Facility and work began to replace the Highway 400 bridge at Finch Avenue West.
Mobilinx was selected as the preferred proponent and awarded the contract to deliver the Hurontario LRT in October 2019. Mobilinx will design, build, finance, operate and maintain the project for a 30-year term. Early works construction began with relocation works conducted by telecommunications and utility companies.
Although plans to move forward with the Hamilton LRT were cancelled, a task force was established by the province to assess what transit system should proceed, and work continued in Hamilton under the GO Expansion program.

Annual Report 2019-20
22
GO EXPANSION
This past fiscal year saw work and progress continue on the various aspects of the overall GO Expansion program, which will dramatically increase GO train service across the region. The program includes significant rail corridor infrastructure work, station improvements and other projects to support new and improved connections across the region.
Throughout the year, a number of key enabling rail infrastructure projects made progress:
• In Hamilton, we replaced the John Street Bridge and expanded the Centennial Parkway Bridge. We worked on new track and signalling infrastructure between Hamilton Junction and West Harbour station. Track and bridge improvements were also completed on the Bayview Junction with our CN partners.
• Significant progress was made on the Stouffville rail corridor expansion with part one of double tracking work on the corridor completed this past year.
• Major grade separations and bridge work took place with the Davenport Diamond contract awarded and early works construction beginning.
• The Steeles Avenue grade separation construction began. • Tunneling began at the 401/409 tunnel to allow for additional tracks. • We completed detailed design for the Union Station Rail Corridor (USRC) east
track enhancement project. This project will expand and modify rail infrastructure in the eastern approaches to Union Station to provide additional mainline track capacity and increased track speed capabilities, thereby supporting increased passenger and train volumes. Also in the USRC, construction was completed on the Don Yard Upgrade and Expansion project.
• The new Whitby Rail Maintenance Facility was completed and went into service.
Improvements to existing stations and construction of new stations will support increased service as the GO network is expanded:
• As part of the early station improvements project which began this year, work took place on dozens of existing stations, as we modernize to provide comfort and safety in preparation for increased service across the GO system. We achieved 90 per cent design submission for this project on May 31, 2019.
• Kipling GO Station saw construction work progress with the pedestrian tunnel and canopy put into place. This transit hub’s connections to the GO Milton line, the TTC’s Line 2 (Bloor-Danforth) subway line, and more than 10 bus routes operated by three transit providers, including express access to Pearson International Airport, will provide for seamless travel across the region. The final package of detailed design work for the Kipling Bus Terminal was completed by the design-build contractor.
• Construction began on Rutherford GO Station, including the building of a new six- storey structure which will add 1,200 new parking spaces and work on a grade

Annual Report 2019-20
23
separation that will ensure traffic flow along Rutherford Road is no longer impacted by passing trains.
• Bramalea GO station improvements made significant progress with the parking structure, platform rehabilitation and pedestrian tunnel connection all advancing.
• The parking structure at Cooksville GO station was partially completed and opened to customers.
• Design and construction work also advanced for Weston GO Station, sections of the Barrie corridor (including Downsview Park GO Station), Aurora GO Station and Port Credit GO Station.
• Metrolinx Asset Protection Packages were released for two Transit Oriented Communities projects (Woodbine and Mimico).
The corridor maintenance program keeps the GO network rail corridors in a state of good repair by managing track, signals, bridges and communications maintenance projects. This work has a positive impact on safety, ride quality, asset resilience and rail on-time performance.
Maintenance contractors continue to stay vigilant to seasonal conditions such as rising temperatures, flooding risk locations, and other weather-related issues. While routine maintenance is ongoing, we saw specific projects completed this year, including:
• Replacement of concrete ties at Exhibition and Newmarket GO stations • Upgrades to the station backup generator at UP Express Pearson Terminal 1
Station • The Humber Bridge Replacement project reached substantial completion • Slow orders were removed where work was completed on the Kitchener line,
saving two minutes on travel time along the corridor.
The GO Transit Control System project will give Metrolinx control of routing and dispatching rail traffic (this work has historically been done by Canadian National or Canadian Pacific railways). As part of this project, this year Metrolinx successfully passed all routine inspections and system validations. Upgrades for bandwidth and resilience of all signal sites on the data network have also been completed.
We moved toward automating project reporting and using consistent system-generated data to provide monthly updates. Asset Management Plans for every asset class were developed, with the objective of forecasting the State of Good Repair investment for the upcoming 2020-21 fiscal year.
BUS PROJECTS
Work continued to get the new Union Station Bus Terminal and Bay Concourse ready for customers. The pedestrian bridge over Bay Street that provides a seamless and weather- controlled connection between the new terminal and Union Station was lifted into place.

Annual Report 2019-20
23
The new Union Station Bus Terminal will replace the current terminal and provide a more comfortable and convenient experience for customers.
Our Bus Rapid Transit program also achieved milestones with two new segments of the York Viva BRT handed over to York Region for operations this past year.
In Niagara, bus infrastructure improvements took place at Stanley Avenue and Highway 420 in the City of Niagara Falls. We also completed park and ride facilities at Dundas Street and Highway 407 West, Confederation, and Courtice and Ritson Roads, enabling improved bus journeys across the region.

Annual Report 2019-20
24
CUSTOMER FOCUSED
Transit Service We continued to expand GO rail service to better serve our customers and attract new ridership, increasing service expansion by 11 per cent over our 2018-19 performance. We introduced weekend train service on the Stouffville line, and added more peak train trips as well as new two-way evening service on the Kitchener line. The Lakeshore West line saw increased peak service, a new late-night express service and increased two-way weekend service, including year-round trips to and from Niagara Falls and St. Catharines. On the Stouffville and Barrie lines, some existing off-peak trips were extended to serve more communities.
In April 2019, we lowered fares for short-distance trips to bring greater alignment between GO and local transit fares, increasing ridership on trips within 10 kilometres of Union Station by 13 per cent – and a 25 per cent increase specifically on weekends.
The Discounted Double Fare program, which gave PRESTO customers a $1.50 discount on their combined trips using the TTC and GO Transit/UP Express, entered its third and final year. The learnings from this program will be leveraged to develop new fare and service integration options.
We continued to work on improving our on-time performance (OTP) for our customers. Our annual target for OTP was met for UP Express and we improved our GO train and bus OTP over last year. This was particularly evident in the winter months due to the development and deployment of several rail fleet modifications geared towards winter reliability and performance. These winter rail fleet enhancements included:
• Adjustments on the GO fleet to improve drainage and prevent delays to due freezing
• De-icing throughout the day • New door trim heaters (GO) and upgraded door seals on both GO and UP to
prevent door freezing • New heating systems and insulation to reduce freezing of under carriage
Rail OTP was at or near target during the final quarter of the year. A number of targeted action plans were implemented over the course of the year that focused on correcting key known contributors to rail OTP degradation, including:
• Improved process for sign-off on workblocks (construction) • Focus on rail traffic control dispatch improvements through increased
engagement with Canadian National (CN) and start of transition of rail traffic control to Metrolinx
• Schedule adjustments to better align with actual run times • Initiatives to improve signal and switch performance: system-wide program to
replace relays to reduce signal failures, replacement of switch turn-outs, improved remote monitoring capability across key locations

Annual Report 2019-20
25
For bus, a number of action plans have been implemented resulting in achieving or exceeding the OTP target from January 2020 onwards. These include:
• Targeted actions to improve bus fleet reliability, including close engagement with vehicle manufactures to replace filters and coolant hoses
• Improved data analysis which uncovered a procedural error that was inflating delays and has now been corrected, resulting in a 1-2 percentage point gain
• Program to remove auxiliary heaters to reduce coolant-related breakdowns
Our target for increasing revenue seat miles to 138 million was not met. The decision to defer some planned new services to 2020 affected the year-end weekly seat miles achievement, and was further impacted by service reductions related to COVID-19 in the last month of the fiscal year. Services were reduced by approximately 55 per cent beginning in mid-March.
GO & UP Express Customer Charter Results for 2019-2020
YTD - April 2019 to March 2020
Promise Service Brand Measure Target Actual
To Do Our Best To Be On Time.
GO
We will run 95% of trains within 5 minutes of scheduled time. 95% 93.2%
We will run 96% of buses within 15 minutes of scheduled time. 96% 94.9%
UP We will run 97% of trains within 5 minutes of scheduled time. 97% 97.5%
To Always Take Your Safety Seriously.
GO
We will have 30 or fewer complaints per 1,000,000 boardings regarding safety.
30 or Fewer
22.8
UP
We will have 2 or fewer complaints per 100,000 boardings regarding safety.
2 or Fewer
0.3
To Keep You In The Know.
GO
We will have 30 or fewer complaints per 1,000,000 boardings regarding service status communication.
30 or Fewer
19.2
UP
We will have 4 or fewer complaints per 100,000 boardings regarding service status communication.
4 or Fewer
2.0
To Make Your Experience Comfortable.
GO
We will have 30 or fewer complaints per 1,000,000 boardings regarding comfort in stations, trains, and buses.
30 or Fewer
30.5
UP
We will have 1 or fewer complaints per 100,000 boardings regarding comfort in stations and trains.
1 or Fewer
0.9
To Help You Quickly and Courteously.
GO
We will ensure that 80% of all calls are answered within 20 seconds or less.
80% or Higher
79.0%
UP
We will ensure that 80% of all calls are answered within 20 seconds or less.
80% or Higher
96.0%
PRESTO
The total capital investment for PRESTO to March 31, 2020 has been $1.1B (total expected program spend is $1.2B by end of fiscal year 2021-22).

Annual Report 2019-20
26
We achieved nearly one million downloads (984,000 to fiscal year end) of the new PRESTO App which was launched at the end of January 2019, and which has resulted in almost $100 million in funds loaded ($99,756,516).
PRESTO Tickets were launched on the TTC with more than 2.3 million sold and in use so far (to the end of March 2020).
In fall 2019, we removed the previous minimum $10 load required on PRESTO cards loaded through in-person channels, as part of our ongoing commitment to enhance the customer experience and make transit affordable.
Last fiscal year, PRESTO payment was enabled on TTC bus routes that cross municipal boundaries from Toronto and into York Region or Mississauga. PRESTO payment was also added to Wheel-Trans contracted sedan taxis, with devices installed on more than 1,500 vehicles.
Shoppers Drug Mart continues to be a key partner in the distribution of PRESTO media across all PRESTO service areas in the province. PRESTO’s retail network was expanded to all Shoppers Drug Mart stores in the GTHA and Ottawa. This was complemented by adding new vending machines in underserved areas as well as at Pearson airport. We reached our 99.5 per cent equipment availability target by fiscal year end, steadily climbing throughout the year through improved equipment monitoring and methods. We began installing new PRESTO payment devices across 905 transit agencies and GO Transit, with completion expected next fiscal year, pending supply chain interruptions caused by the pandemic.
Although our target of 75 per cent adoption on partner transit agencies was not achieved this year, by February average adoption had hit 70.9 per cent for the first time on all agencies – and forecasts for the year end were to come close to or reach the 75 per cent target, prior to the onset of COVID-19. For many agencies such as GO and Brampton Transit, adoption was consistently over 90 per cent. Higher levels of adoption were boosted by the retirement of legacy media on the TTC and other agencies such as paper monthly and day passes, plus a partial phase-out of tokens, with PRESTO assisting the TTC with the customer and operational transition.
Another way we worked to increase ridership and non-fare revenue and build brand affinity through PRESTO was with expansion of commercial partnerships to drive distribution of co-branded cards. Co-branded cards were developed for CAA, Canada Goose and CP Rail with additional partnerships being developed in the upcoming year.
The customer satisfaction rate remained below the 81 per cent target. A number of actions were implemented in response to this and will continue into the next fiscal year. These include further improvements to communications and issue resolution, as wellas

Annual Report 2019-20
27
web and mobile app improvements. Our device reliability target was achieved as we increased device monitoring and improved targets for our mean time to restore service. We expect that this increased reliability will lead to improved satisfaction scores.
PRESTO Customer Charter Results for 2019-2020
YTD - April 2019 to March 2020
Promise Measure Target Actual
To Do Our Best To Be On Time.
We will ensure that 99.9% of all customers transactions are available to be viewed online by the next day.
99% or higher
100%
To Always Take Your Safety Seriously.
We will ensure that safeguards are in place to ensure customer accounts and information are secure.
Full
Compliance
100%
To Keep You In The Know.
We will ensure our customers are satisfied with our communications around service interruptions (80% or higher on the bi-annual customer satisfaction survey).
80% or Higher
72%
To Make Your Experience Comfortable.
We will do our best to make sure we have 40 or less complaints per 1,000,000 taps (excluding transfers).
40 or Fewer
24.7
To Help You Quickly and Courteously.
We will ensure that 80% of calls are answered within 30 seconds or less. 80% 83%
We will ensure that 80% of web inquiries are resolved within 2 business days. 80% 95%
Customer Experience across our network
Customer Satisfaction (CSAT) of 79 per cent for GO exceeded our annual targets by one percentage point. UP Express CSAT exceeded expectations with a score of 90 per cent, three points above target.
After reliable on time performance, customer communications is the second largest driver of customer satisfaction. Enhancements made to communications with new digital signage and introduction of webchat drove a four point increase in overall satisfaction with communication compared to 2018-19 results, contributing to overall attainment of customer satisfaction objectives.
Monthly CSAT learning and action planning across the organization is a continuous improvement focus and in the past year a customer change readiness group was implemented to proactively plan and support customers through service changes and disruptions.
These enhancements to the customer experience, increased peak and off-peak service and the Find Your GO Time marketing campaign to promote customer trip purpose resulted in year-over-year ridership at the end of February, prior to COVID-19, tracking at

Annual Report 2019-20
28
5.5 per cent higher (adjusting for child boardings and business days). Seven of the 10 highest all-time GO ridership months happened in the last fiscal year.
We saw an 89 per cent increase in event ridership to 750,000 and an increase in the number of event partnerships from 13 to 30. There were also five new PRESTO Perk partnerships this year, with a 133 per cent increase in PRESTO Perk redemptions in 2019- 20.
Event partnerships also reported tremendous revenue growth of 106 per cent. Our partnership in July’s Jehovah Witness convention in Toronto was a highlight that included an UP Express promo code and group sales programs.
COVID-19 directly impacted our service and events strategy performance with five events cancelled in March 2020. As a result, fiscal year ridership reported growth of 0.4 per cent (adjusted for child boardings and business days) and did not achieve our objective.
Integrated brand marketing and partnership activation campaigns supported the changes of two fare policies, lowering of short-distance fares, Kids GO Free and the introduction of GO eTickets including the ‘Sunday Funday’ pass and promotion of the UP Express ‘Meeter Greeter’ fare.
We introduced a ticket-reselling program which has allowed us to access the secondary ticket market, and a new UP Express corporate ticket program.
Wi-Fi on GO trains and buses has been a long-term desired benefit as indicated by our customers. This past fiscal year, we finalized the free Wi-Fi solution and selection of our partner, Icomera, was finalized in July 2019. Implementation plans continue for launch later in 2020.
Our retail strategy advanced in 2019-20 to augment the customer experience:
• We opened two Tim Hortons franchisee locations, inside Burlington GO station in
June 2019, and a location beside Oshawa GO station in September 2019, with sales and customer feedback exceeding expectations.
• Balzac’s Coffee Roasters in UP Express at Union Station saw its best performance in five years.
• Vending machine offerings were extended at Oshawa, Cooksville, Guildwood and UP Express at Union.
• Seasonal food trucks were hosted in the spring, summer and fall of 2019 at Oshawa, Whitby, Rouge Hill, and Ajax stations.
• A food and beverage partnership opportunity expression of interest was launched to place retail in nine GO stations.
• A successful vending test with Chargerent (portable cell phone battery pack rental machine) at five GO stations.

Annual Report 2019-20
29
• Purolator operated a truck at Scarborough GO Station for the full year, and will continue service through 2020.
New partnerships were established this year:
• Pilot partnership with Lyft and GO Transit launched in July 2019. • A multi-year partnership with CAA and GO Transit & PRESTO launched in May
2019. • Pilot program with GO and GTAA airport employees launched in December 2019.
During 2019-20, Metrolinx constructed five new digital billboards across the network. In the fourth quarter of 2019-20, we released a public tender for additional digital billboards across the Metrolinx network.
Value-in-kind media partnerships were also negotiated with TVO, Corus Entertainment, and the Globe and Mail.
Phase one of upgrading and expanding our advertising assets across six stations on the GO network was completed this past fiscal year including 74 static and retrofitted positions, and 37 new digital assets to deliver a 13 per cent increase in advertising revenue for 2019-20.
Overall advertising revenue growth increased by 25 per cent versus the prior year.
We continued to also leverage these media assets to amplify our brand advertising and to support public health messaging during COVID-19.
As we consistently strive to increase customer satisfaction and inform customer experience enhancement, we implemented new tracking tools to uncover fresh customer insight and refined our forecasting models in 2019-20 to a strong level of precision, adding new data sources to improve accuracy. During COVID-19, new tools were built and customer research fielded to support our business improvement planning and ridership recovery marketing communications that will reassure our customers that they are safe, and that they can feel safe, choosing our transit services.

Annual Report 2019-20
30
Governance
Metrolinx is an agency of the Government of Ontario and is guided by a mandate from the Minister of Transportation, on behalf of the Premier of Ontario.
The Board of Directors is responsible for setting Metrolinx’s strategic direction, identifying, managing and monitoring key risks, as well as providing oversight to operations. The Chair of the Board is accountable to the Minister of Transportation.
The Metrolinx Board of Directors includes up to 15 members from several communities in the Greater Golden Horseshoe. They are appointed through Order in Council under the Metrolinx Act, 2006.
Current Board Members Period of Service Annual Remuneration Donald Wright, Chair Serves from August 16,
2019to August 15, 2022 $146,700
Rick Byers
Serves from December 12, 2019 to December 11, 2022.
Remuneration to be paid in 2020-21 fiscal year.
Bryan Davies, Vice Chair Serves from November 15, 2017 to November 14, 2020.
$7,750
Janet Ecker Serves from October 31, 2012 to October 30, 2022.
$4,500
Luigi Ferrara
Michael Kraljevic
Serves from January 17, 2019 to January 16, 2022.
Serves from January 17,
$4,100
$4,300
Tony Marquis
2019 to January 16, 2022.
Serves from December 6, 2019 to December 7=5, 2022.
Remuneration to be paid in 2020-21 fiscal year.
Emily Moore Serves from January 17, 2019 to January 16, 2022.
$4,300

Annual Report 2019-20
31
Reg Pearson Serves from February 14,
2019 to February 13, 2022.
$4,100
Robert Poirier Serves from January 17, 2019 to January 16, 2022.
$5,100
Clio Straram Serves from January 17, 2019 to January 16, 2022.
$3,500
Paul Tsaparis Serves from January 17, 2019 to January 16, 2022.
$4,500
Phil Verster, President & CEO Serves from October 2, 2017 to October 01, 2020.
Phil Verster receives an annual salary as President & CEO of Metrolinx but does not receive remuneration as a Board member.

MANAGEMENT DISCUSSION & ANALYSIS
Management Discussion & Analysis
Corporate Performance
Metrolinx revenue comprises of fare revenues from transit operations, including bus and rail services, as well as non- fare revenues, including partnership, advertising, fees collected from transit providers for the use of the PRESTO system and commercial space rent. Net loss represents the excess of operating expenses, including amortization, over revenues earned in the year. The net loss for the fiscal year ended March 31, 2020 of $18.4 million was higher than the 2018-19 actual loss of $15.3 million but lower than the 2019-20 budgeted loss of $40.0 million.
The fiscal year came to a close in an unprecedented fashion with the onset of the COVID-19 pandemic, which has reduced Metrolinx’s total boardings by approximately 95%, compared to the equivalent prior year period and has impacted how Metrolinx operates its service. In response to the decrease in ridership, GO rail services were reduced by approximately 29% in mid-March and 55% after the year-end. GO bus and rail dashboards, and an UP dashboard, help Metrolinx monitor customer use of its services during physical distancing, and help determine appropriate utilization levels, given physical distancing measures in place. These tools will also help Metrolinx recover services once physical distancing measures ease. Metrolinx will be able to see how its customers return to its system, and where there is demand across its system. The following table summarizes the consolidated revenues, operating costs and ridership for Metrolinx for fiscal year ending 2019-20, the three prior fiscal years and the 2019-20 Budget.
Summary of Corporate Performance
2016-17
2017-18
2018-19
2019-20
2019-20
(rounded to 000') Actual Actual Actual Actual Budget
Operating Costs 849,735,000 994,532,000 1,156,399,000 1,329,579,000 1,148,866,000
Fare Revenue 519,899,000 540,989,000 566,663,000 574,160,000 628,559,000
Non-fare Revenue 52,143,000 64,688,000 95,383,000 132,324,000 159,093,000
Ridership 70,232,000 72,374,000 76,225,000 76,334,000 82,113,000

Financial Report
The following discussion and analysis of the financial condition and results for Metrolinx should be read in conjunction with the audited financial statements and related notes for the fiscal years ended March 31, 2017 (fiscal 2016-17), March 31, 2018 (fiscal 2017-18), March 31, 2019 (fiscal 2018-19) and March 31, 2020 (fiscal 2019-20).
Financial Report 2016-17 2017-18 2018-19 2019-20 2019-20 2019-20
(rounded to '000) Actual Actual Actual Actual Budget Variance
Revenue
Fare Revenue 519,899,000 540,989,000 566,663,000 574,160,000 628,559,000 (54,399,000) Non-fare Revenue
52,143,000
64,688,000
95,383,000
132,324,000
159,093,000
(26,769,000)
Provincial Contributions
262,834,000
341,309,000
478,135,000
590,394,000
321,214,000
269,180,000
Amortization of Deferred Capital Contributions
520,871,000
616,494,000
700,977,000
803,312,000
778,650,000
24,662,000
Gain/(loss) on disposal of capital assets
(376,000)
19,837,000
(536,000)
14,410,000
-
14,410,000
Total Revenues
1,355,370,000
1,583,317,000
1,840,622,000
2,114,600,000
1,887,516,000
227,084,000
Expenditures
Supplies & services
88,746,000
97,112,000
177,074,000
318,232,000
121,676,000
196,556,000
Equipment maintenance
99,944,000
118,192,000
117,855,000
138,332,000
131,557,000
6,775,000
Facilities & track 129,897,000 146,002,000 168,967,000 145,414,000 145,679,000 (265,000) Labour & benefits*
282,963,000
318,656,000
336,167,000
352,201,000
340,429,000
11,772,000
Operations 248,185,000 314,570,000 356,336,000 375,400,000 409,524,000 (34,124,000) Amortization of capital assets
521,815,000
611,795,000
699,248,000
803,105,000
778,323,000
24,782,000
Amortization of long-term leases
327,000
327,000
327,000
327,000
327,000
-
Total Expenditures
1,371,877,000
1,606,654,000
1,855,974,000
2,133,011,000
1,927,515,000
205,496,000
Net loss
(16,507,000) (23,337,000)
(15,352,000)
(18,411,000)
(39,999,000)
21,588,000
Note: Numbers may not add due to rounding
*Actual includes long-term accruals for post-employment benefits which are not funded.

Revenues
Fare revenue
Metrolinx fare revenue from transit operations, including bus and rail services, increased in 2019-20 to $574.2 million compared to prior year’s $566.7 million. The net increase of $7.5 million or 1.3% in fare revenue was a result of several factors such as an increase in service expansion by 11% to GO rail services. Close to 213 new weekly GO train trips were added across the Kitchener, Lakeshore East and Lakeshore West lines, the extension of weekly trips across the Lakeshore West, Kitchener, as well as making weekend train service to Niagara Falls and St. Catharines a year-round offering. Revenues also increased as ridership on the UP Express increased by 4.6%. Services were reduced by 29% in mid-March due to lower ridership as a result of the COVID-19 pandemic.
Ridership was positively impacted by several new fare revenue initiatives. Enhanced customer experience, implementation of a fare strategy and planned service expansions continued to increase ridership and fare revenue. Metrolinx ridership has experienced healthy growth for most of the 2019-20 fiscal year with the exception of the last few weeks in March where ridership declined significantly due to the COVID-19 pandemic. Total fare integration costs related to the Discounted Double Fare program was $23.4 million. The fare revenue for the year was lower than budget by $54.4 million or 8.7% which takes into consideration the lower ridership and revenue due to COVID-19 and decline in GO average fare. In the five year period from fiscal 2015-16 to 2019-20, fare revenue has increased at a compounded annual growth rate of 3.7%.
479.5 519.9 541.0 566.7 574.2
0.0
100.0
200.0
300.0
400.0
500.0
600.0
2015-16 2016-17 2017-18 2018-19 2019-20
$ in
Mill
ions
Fiscal Year
Total Fare Revenue(Including Fare Integration Costs)

Ridership
Metrolinx ridership reflects the use of GO and UP trains and GO buses across the region. Year over year ridership increased by 0.1 million or 0.1% from 76.2 million in 2018-19 to 76.3 million in 2019-20. The ridership for the month of March 2020 compared to the month of March 2019 declined by 3.3 million largely as a result of the emergence of the COVID-19 pandemic in mid-March, which had a significant impact on ridership.
Over the last year, Metrolinx announced many improvements for GO customers, including:
• weekend rail travel to/from St. Catharines and Niagara Falls available year-round;
• lower GO fares for short distance trips (10 km or less) and Kids GO Free (children 12 and under ride for free);
• new e-ticketing platform was launched as a pilot to support growth in seasonal and infrequent travel markets;
• “Sunday Funday” e-ticketing promotion, which allowed customers unlimited travel on GO Transit for $10;
• more peak GO train service on the Lakeshore West and Kitchener corridors; and
• more off-peak GO service on the Barrie, Stouffville and Lakeshore corridors.
Metrolinx continues to work with a number of professional organizations and industry partners to keep abreast of changing economic conditions and demographic shifts to understand how anticipated changes may affect regional rail and bus network demand and performance over time.
In the five year period from fiscal 2015-16 to 2019-20, ridership increased at a compounded annual growth rate of 2.8%.
66.6 70.2 72.4 76.2 76.3
0.0
10.0
20.0
30.0
40.0
50.0
60.0
70.0
80.0
2015-16 2016-17 2017-18 2018-19 2019-20
Rid
ersh
ip in
Mill
ions
Fiscal Year
Total Ridership

Non-fare revenue
Non-fare revenue consists of partnership and advertising revenue, fees collected from TTC and other transit providers for the use of the PRESTO system, corridor access fees and commercial space revenue.
The following chart shows non-fare revenue performance from 2015-16 to 2019-20. Non-fare revenues were $132.3 million (excluding gain/loss on sale of capital assets) in 2019-20 in comparison to $95.4 million in 2018-19, an increase of $36.9 million or 38.7%.
45.4 52.1 64.7
95.4
132.3
0.0
30.0
60.0
90.0
120.0
150.0
2015-16 2016-17 2017-18 2018-19 2019-20
$ In
Mill
ions
Fiscal Year
Total Non-fare Revenue

In the five year period from fiscal 2015-16 to 2019-20, non-fare revenue increased at a compounded annual growth rate of 23.9%. The following chart shows the year over year performance of components of non-fare revenue for the fiscal years ending March 31, 2019 and 2020.
The increase in the revenue generated by the PRESTO system usage fees were the major contributing factor to the increase in non-fare revenues this year. Such fees increased from $52.3 million in 2018-19 to $75.0 million in 2019-20, an increase of $22.7 million or 43.4%. The increase in fees is primarily due to increased PRESTO adoption with key improvements in customer experience including PRESTO web chat enhancements, reduced minimum card load from $10 to 5 cents, elevated customer experience provided via social channels and advancements in customer communications. In addition, PRESTO steadily improved equipment availability and continued to deliver new forms of payment through the launch of PRESTO Tickets on the TTC. Non-fare partnership revenue is derived from partnerships with a number of companies in the private sector representing the financial services, information and technology, consumer electronics and retail food services sectors. Partnership revenue increased from $5.3 million in 2018-19 to $6.8 million in 2019-20, an increase of $1.5 million or 28.3%.
Interest and investment income increased from $8.8 million in 2018-19 to $17.6 million in 2019-20, an increase of $8.8 million or 100%. The increase was driven by higher interest from both a higher interest yield and higher PRESTO e-purse bank balance resulting from higher commission revenues.
Metrolinx owns most of its transit railway corridors and also shares its corridors with its partners including Canadian National Railway (CN) and Canadian Pacific Railway (CP). Railway partners pay access corridor fees on Metrolinx- owned corridors that cover signalling, dispatch and communications costs. Trackage fees decreased from $9.4 million in 2018-19 to $9.1 million in 2019-20, a decrease of $0.3 million or 3.2%.
We anticipate non-fare revenue to grow over time as we expand service levels and infrastructure capacity, such as through opening new stations, upgrading existing advertising assets, acquiring corporate partners and sponsors, and deploying free customer Wi-Fi onboard buses and trains; however, due to the impact of COVID-19, construction timelines and revenue will be impacted significantly.
AdvertisingInterest &
InvestmentIncome
CommercialSpace
TrackageFees
ReservedParking
PartnershipRevenue
PRESTOSystem
Usage FeeOther
2018-19 $8.6 8.8 2.7 9.4 4.9 5.3 52.3 3.4
2019-20 $9.3 17.6 2.8 9.1 5.9 6.8 75.0 5.8
0
15
30
45
60
75Non-fare Revenue
2018-19 2019-20
$ In
mill
ions

Government Funding
Operating Subsidy
Metrolinx received approximately $590.4 million in operating subsidy from the Province of Ontario (the Province) in 2019-20, an increase of about $112.3 million or 23.5% from $478.1 million in 2018-19. Planned 2019–20 subsidy reductions were offset by increases in subsidies required due to losses in revenues and proceeds due to COVID-19 and the impact of capital adjustments and accounting adjustments. Operating subsidy from the Province has increased at a compounded annual growth rate of 20.4% each year since 2015-16. No municipal or federal operating subsidy or grant has been received over the last five years. The operating subsidy is used for implementing many of the commitments made under the Regional Transportation Plan (RTP). The subsidy is funded by the Province to support the operating expenses less income earned.
Amortization has been fully funded by the Province. Amortization expense for the year was $803.4 million or $103.8 million over the prior year of $699.6 million as a result of Metrolinx’s ongoing investments in capital initiatives.
233.8 262.8 341.3
478.1 590.4
457.0 522.1
612.1
699.6
803.4
Total:953.4
Total:1,177.7
Total:1,393.8
Total:690.8
Total:784.9
0.0
200.0
400.0
600.0
800.0
1,000.0
1,200.0
1,400.0
2015-16 2016-17 2017-18 2018-19 2019-20
$ in
Mill
ions
Fiscal Year
Operating Subsidy & Amortization
Operating (excluding amortization) Amortization

Capital Subsidy
Capital subsidy declined by $431.4 million to $3,427.9 million in 2019-20 from $3,859.3 million in 2018-19. Funding from the Province of Ontario totaled $3,417.7 million for 2019-20. Metrolinx also received capital funding from the federal government of $4.3 million and $5.9 million from municipal governments.
Federal funding from three separate programs, Canada Strategic Infrastructure Fund (CSIF), PRESTO CSIF program and P3 Canada contributes to the Metrolinx capital program. In addition, municipalities contribute towards the GO Growth program.
The original CSIF program is still funding portions of the Union Station Rail Corridor Train Control system and the PRESTO CSIF program is contributing funding towards the implementation of PRESTO on the TTC.
Federal funding was reduced to $4.3 million from $27.0 million last year and municipal funding for capital has declined to $5.9 million in 2019-20 from $12.7 million in 2018-19.
2015-16 2016-17 2017-18 2018-19 2019-20
Municipal 9.9 7.7 13.6 12.7 5.9
Federal 34.6 26.4 111.7 27.0 4.3
Provincial 2,711.9 2,759.3 3,407.2 3,819.6 3,417.7
Total 2,756.4 2,793.4 3,532.5 3,859.3 3,427.9
0.0
500.0
1000.0
1500.0
2000.0
2500.0
3000.0
3500.0
4000.0
$ in
Mill
ion
Fiscal Year
Capital Subsidy

Operating and Capital Expenditures
Operating Costs
Operating costs, before amortization, for the year were $1,329.6 million or $180.7 million (15.7%) over the budget of $1,148.9 million. The increase in spending was primarily due to an increase in Supplies & Services of about $196.6 million largely due to capital adjustments and increase in procurement bid fees, higher spending in Labour and benefits of about $11.8 million, partially offset by Operations of about $34.1 million due to various operations costs including, among other, fuel and insurance.
Operating expenditures by category are shown below.
Labour ($263.1 M)
Operations ($375.4 M)
Facilities and track ($145.4 M)
Equipment maintenance
($138.3 M)
Benefits ($89.2 M)
Suppliesand services
($318.2 M)
Operating Expenditures by Category
Labour ($263.1 M)
Operations ($375.4 M)
Facilities and track ($145.4 M)
Equipment maintenance ($138.3 M)
Benefits ($89.2 M)
Supplies and services ($318.2 M)

Capital Investments
In 2019-20, Metrolinx continued working towards the Province’s priority to significantly increase investment in public transit infrastructure. Major capital projects such as implementation of GO Expansion early works and procurement activities for On Corridor works, planning and design for the priority Subway projects, construction of the VIVA BRT, Eglinton Crosstown LRT and the Finch West LRT continued progressing and achieved key milestones throughout the year. Significant investments were also made towards the State of Good Repair (SOGR) program for existing infrastructure in order to maintain and improve safety and reliability. Capital expenditures in 2019-20 were $3,395.0 million.
Toronto LRTs
Optimization & Expansion
State of Good Repair
GO Expansion
York VIVABRT
Hurontario & Hamilton LRTs
PRESTO
Subways Next Wave
Toronto LRTs ($1,260.3 M)
Optimization & Expansion ($442.8 M)
State of Good Repair ($550.4 M)
GO Expansion ($631.4 M)
York VIVA BRT ($140.0 M)
Hurontario & Hamilton LRTs ($203.6 M)
PRESTO ($96.3 M)
Subways ($66.4 M)
Next Wave Projects ($3.8 M)
2019-20 Capital Expenditures by Category

Capital Investments – Budgeted and Actual
Metrolinx is advancing a large and growing program, including signature projects like the GO Expansion program, the Eglinton Crosstown LRT, Finch West LRT, Hurontario LRT and York VIVA BRT. In addition, there was significant advancement and progress on the planning and design works on the priority subways projects- Ontario Line, Eglinton Crosstown West Extension, Scarborough Subway Extension and the Yonge North Subway Extension. In 2019-20, Metrolinx’s capital expenditure was $3,395.0 million, which is $482.4 million lower than the annual budget of $3,877.4 million.
The capital underspend had some COVID-19 related impacts throughout the month of March 2020 in terms of construction progress and the move to a work-from-home environment for most professional services staff. In addition, several projects did not meet scheduled milestones as originally forecasted for 2019-20 which was the main cause of underspend. It should also be noted that due to changes in accounting treatment and capital adjustments, the following items were reclassified from capital expenditures to operating; procurement bid fees, Hamilton LRT costs as a result of the project cancellation and costs for the Yonge North Subway Extension prior to September 1st, 2019.
GO Expansion delivers on the Province’s commitment to transform the GO Transit rail network into a comprehensive, all-day rapid transit network. Capital costs associated with the GO Expansion program are estimated to be $26.8 billion. The GO Expansion program has the largest underspend to report this year which is a result of delays in property acquisitions, slower than expected progress on utilities preparatory activities and some changes to procurement timelines and delays related to P3 projects.
State of Good Repair (SOGR) includes assets that are regularly scheduled for repairs and maintenance and rehabilitation. Actual spending of $550.5 million was under budget by about $150.3 million. To better meet budgeted spending targets, more robust condition assessments and asset management planning are being performed to ensure SOGR projects are delivered within targeted expenditure. Focused efforts are also being made to improve data quality and to provide reporting on contracts and detailed cost positions.
A number of PRESTO enhancements were made, such as delivery and installation of new second-generation self-serve reload machines, new PRESTO devices and enhancements in customer web chat.

Capital Expenditures by Category ($ in millions)
2019-20
Actual
2019-20
Budget
2019-20
Variance
Expansion & Optimization
442.8 816.4 (373.6)
State of Good Repair 550.4 700.7 (150.3)
Subways 66.4 107.2 (40.8)
GO Expansion 631.4 1,081.9 (450.5)
RT - York VIVA BRT 140.0 102.7 37.3
RT - Toronto LRTs 1,260.3 1,574.2 (313.9)
RT – Hamilton (74.8) 180.8 (255.6)
RT – Hurontario 278.4 372.4 (94.0)
Next Wave Projects 3.8 5.6 (1.8)
PRESTO 96.3 100.4 (4.1)
Other* - (1,164.9) 1,164.9
Total 3,395.0 3,877.4 (482.4)
* Beginning in 2019–20, the government’s plan reflects more sustainable levels of infrastructure investment. It also
reflects a more realistic forecast of construction timelines for major projects planned or underway, in keeping with actual expenditure patterns.
Enterprise Risk Management Metrolinx continues to enhance its Enterprise Risk Management (ERM) Program to support risk-informed decision-making, assess opportunities and ensure that the organization complies with the Government of Ontario requirement for all provincial agencies to use a risk-informed approach in managing business. The identification, assessment, management, monitoring and reporting of risks is vital to the successful ongoing achievement of the organization’s strategic objectives.
In 2019-20, Metrolinx developed and refined risk appetite statements that guide the decision-making and strategic planning processes, and reviewed the organization’s risk tolerance level. Formalizing these, along with the ongoing training on a variety risk concepts including risk identification, action plans, risk appetite and tolerance, will further embed risk awareness across the organization and better influence strategic and day to day operational decisions.
In 2020-21 Metrolinx will continue to review all appropriate risks on a monthly basis and ensure appropriate mitigation plans are developed and in place. Management continues to work towards managing risks and mitigating any respective risk events and other significant factors that impact results. Risks reported fell within the following risk categories:

• Safety which includes risks related to employee fit for duty, climate resiliency, rail crossings, bus station pedestrian areas, business continuity and pandemic planning;
• Customer Experience which includes risks related to PRESTO customer experience;
• Financial which includes risks related to ridership, revenue forecasting and data governance;
• Operations which includes risks related to on-time performance;
• Cyber which includes risks related to technology cyber risk; and
• Projects which includes risks related to delivery of capital projects such as Eglinton Crosstown, Union Station Enhancement Project, project scope packaging for GO Expansion Program and Corridor Extension and market capacity to deliver capital projects.
Metrolinx will also continue to focus on delivering on its ERM maturity plan. The risk education plan will continue to expand to different areas of the organization using different modalities. The risk reporting tool will be upgraded to improve key reporting functions and enable better reporting across the enterprise. The integration between business units, program and project risks will continue to be an area of focus. The ERM function will continue to identify, assess and report on current and emerging risks and ensure ongoing discussion of risks at all levels of the organization.
Key Performance Indicators
Our Corporate Key Performance Indicators (KPIs) measure and report the organization’s performance to Metrolinx’s major stakeholders: the public and Ontario’s Ministry of Transportation. These Corporate KPIs are reported against targets which are a product of the Annual Business Planning process. A more detailed set of KPIs are used internally to manage day-to-day business operations. The Corporate KPIs measure both Metrolinx’s operations performance in delivering service and its capital infrastructure build performance. Capital Infrastructure
New Rapid Transit Corridors
New Rapid Transit Corridors KPI measures the number of kilometres of Rapid Transit Corridors that are under construction and built and in-service. Metrolinx has built and placed in service 17 kilometres of Rapid Transit since 2013-14. Metrolinx has begun construction on 54.5 kilometres of Rapid Transit corridor as of 2019-20. This includes 18 kilometres on the Hurontario corridor, 19 kilometres on the Eglinton corridor, 6.5 kilometres on the vivaNext BRT corridor and 11 kilometres on the Finch corridor. More kilometres of rapid transit will be under construction as the priority subway projects advance through the design phase into procurement and construction.

Operations Delivery
Cost Recovery Ratio
The cost recovery ratio (CRR), measured as the ratio of total revenues (excluding operating subsidy, grants, sale of assets, and extraordinary revenues) to total operating costs (excluding capital adjustments and procurement bid fees), represents the extent to which the organization's operations are self-funded. Metrolinx compares its cost recovery ratios to its historic results as well as to industry benchmarks. Historically, Metrolinx has always had one of the best cost recovery ratios among its North American peers. The cost recovery ratio in 2019-20 of 64.3%, decreased by 0.2% points from 2018-19 levels. The organization was experiencing a very successful year with significant fare revenue growth from the successful launch of the lower base fare on short distant trips and Kids GO Free and significant PRESTO revenue growth due to increased adoption on TTC. The onset of COVID-19 caused a significant reduction in revenue in the last two weeks of March which negatively impacted the cost recovery ratio. Cost improvements generated from the organization’s focus on commercial management and LEAN process improvements coupled with robust cost management prevented the cost recovery ratio from having a significant decline.
811
13
17 17 17
36
46 4440 40
55
0
10
20
30
40
50
60
0
3
6
9
12
15
18
2014-15 2015-16 2016-17 2017-18 2018-19 2019-20
Co
rrid
ors
-U
nder
Co
nstr
uctio
n
Co
rrid
ors
-B
uilt
and
In S
ervi
ce
New Rapid Transit Corridors (kms)
Built and In Service Cumulative Under Construction
Fiscal Year

*Note: In 2019-20, KPI on cost recovery ratio has changed to include PRESTO operations and all historical results have been restated for comparative purposes.
Cost Efficiency
The Cost Efficiency key performance indicator measures the transit operating expenses (Rail and Bus) incurred per seat- kilometer of service provided for the period. This key performance indicator is a measure of how efficiently the organization delivers its transit services to the public. For fiscal 2019-20, cost efficiency of $0.067 is slightly lower than the 2018-19 measure of $0.068. The continuous improvement in cost efficiency is due to the 6% increase in rail services (as measured in seat-kms) which includes new services, extensions as well as the conversion of rail equipment moves into fare generating trips. The cost efficiency improvement reflects the organization’s commercial mindset in managing operating expenses through vendor contract optimization and the ongoing application of LEAN continuous improvement practices across the Operations Division.
71.3 69.1 68.4 62.6 64.5 64.3
0.0
10.0
20.0
30.0
40.0
50.0
60.0
70.0
80.0
90.0
100.0
2014-15 2015-16 2016-17 2017-18 2018-19 2019-20
Co
st R
eco
very
Rat
io(in
per
cent
age)
Fiscal Year
Cost Recovery Ratio
$0.071 $0.073 $0.075 $0.071 $0.068 $0.067
$0.000
$0.010
$0.020
$0.030
$0.040
$0.050
$0.060
$0.070
$0.080
2014-15 2015-16 2016-17 2017-18 2018-19 2019-20
Co
st p
er S
eat K
m
Fiscal Year
Transit Cost Efficiency (Cost per Seat Km)
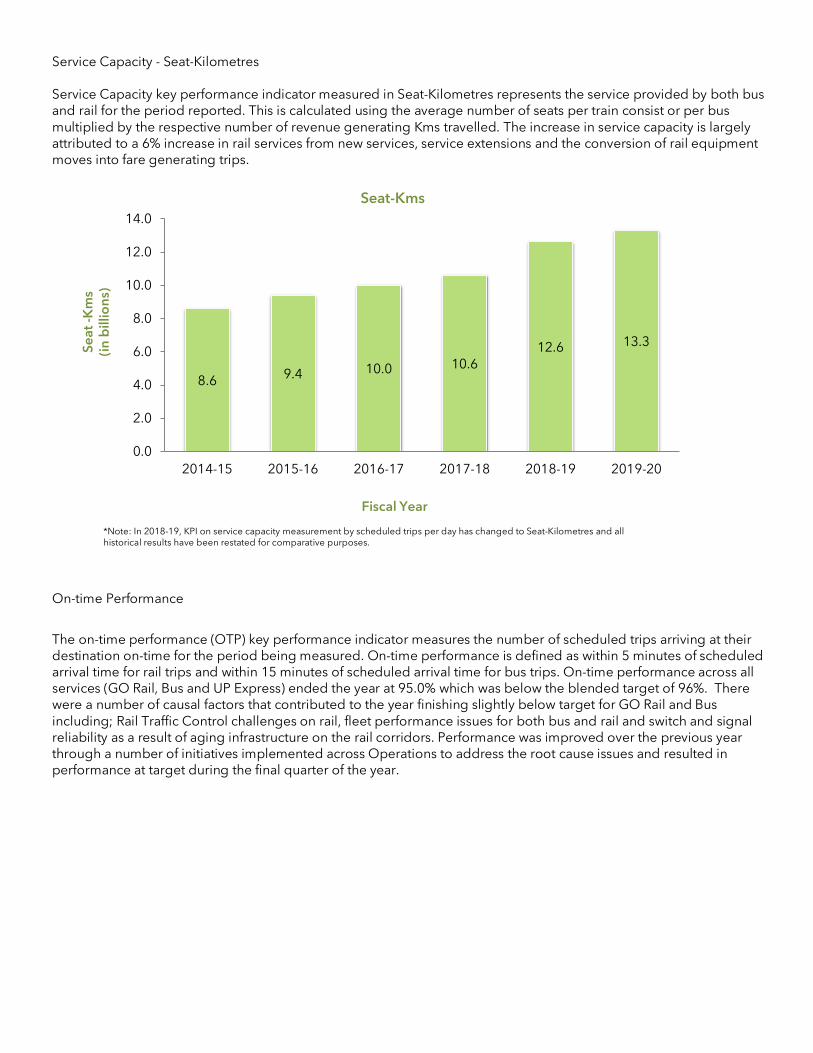
Service Capacity - Seat-Kilometres
Service Capacity key performance indicator measured in Seat-Kilometres represents the service provided by both bus and rail for the period reported. This is calculated using the average number of seats per train consist or per bus multiplied by the respective number of revenue generating Kms travelled. The increase in service capacity is largely attributed to a 6% increase in rail services from new services, service extensions and the conversion of rail equipment moves into fare generating trips.
*Note: In 2018-19, KPI on service capacity measurement by scheduled trips per day has changed to Seat-Kilometres and all historical results have been restated for comparative purposes.
On-time Performance
The on-time performance (OTP) key performance indicator measures the number of scheduled trips arriving at their destination on-time for the period being measured. On-time performance is defined as within 5 minutes of scheduled arrival time for rail trips and within 15 minutes of scheduled arrival time for bus trips. On-time performance across all services (GO Rail, Bus and UP Express) ended the year at 95.0% which was below the blended target of 96%. There were a number of causal factors that contributed to the year finishing slightly below target for GO Rail and Bus including; Rail Traffic Control challenges on rail, fleet performance issues for both bus and rail and switch and signal reliability as a result of aging infrastructure on the rail corridors. Performance was improved over the previous year through a number of initiatives implemented across Operations to address the root cause issues and resulted in performance at target during the final quarter of the year.
8.6 9.4 10.0 10.612.6 13.3
0.0
2.0
4.0
6.0
8.0
10.0
12.0
14.0
2014-15 2015-16 2016-17 2017-18 2018-19 2019-20
Seat
-Km
s(in
bill
ions
)
Fiscal Year
Seat-Kms
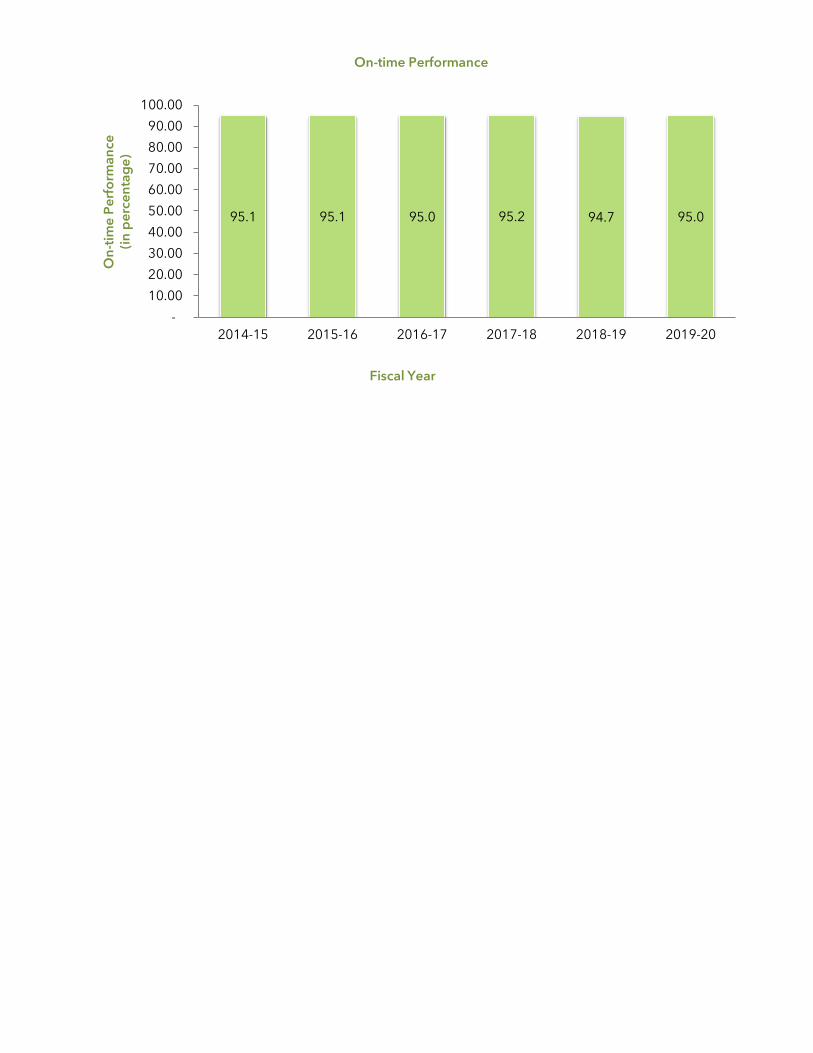
95.1 95.1 95.0 95.2 94.7 95.0
-
10.00
20.00
30.00
40.00
50.00
60.00
70.00
80.00
90.00
100.00
2014-15 2015-16 2016-17 2017-18 2018-19 2019-20
On-
time
Per
form
ance
(in p
erce
ntag
e)
Fiscal Year
On-time Performance

Metrolinx
Financial Statements March 31, 2020

PricewaterhouseCoopers LLP PwC Tower, 18 York Street, Suite 2600, Toronto, Ontario, Canada M5J 0B2 T: +1 416 863 1133, F: +1 416 365 8215 “PwC” refers to PricewaterhouseCoopers LLP, an Ontario limited liability partnership.
Independent auditor’s report
To the Board of Directors of Metrolinx
Our opinion
In our opinion, the accompanying financial statements present fairly, in all material respects, the financial position of Metrolinx (the Organization) as at March 31, 2020 and the results of its operations, its remeasurement gains and losses and its cash flows for the year then ended in accordance with Canadian public sector accounting standards.
What we have audited The Organization’s financial statements comprise:
• the statement of financial position as at March 31, 2020;
• the statement of operations for the year then ended;
• the statement of changes in net assets for the year then ended;
• the statement of cash flows for the year then ended;
• the statement of remeasurement gains and losses for the year then ended; and
• the notes to the financial statements, which include a summary of significant accounting policies.
Basis for opinion
We conducted our audit in accordance with Canadian generally accepted auditing standards. Our responsibilities under those standards are further described in the Auditor’s responsibilities for the audit of the financial statements section of our report.
We believe that the audit evidence we have obtained is sufficient and appropriate to provide a basis for our opinion.
Independence We are independent of the Organization in accordance with the ethical requirements that are relevant to our audit of the financial statements in Canada. We have fulfilled our other ethical responsibilities in accordance with these requirements.
Other information
Management is responsible for the other information. The other information comprises the Management’s Discussion and Analysis.

Our opinion on the financial statements does not cover the other information and we do not express any form of assurance conclusion thereon.
In connection with our audit of the financial statements, our responsibility is to read the other information identified above and, in doing so, consider whether the other information is materially inconsistent with the financial statements or our knowledge obtained in the audit, or otherwise appears to be materially misstated.
If, based on the work we have performed, we conclude that there is a material misstatement of this other information, we are required to report that fact. We have nothing to report in this regard.
Responsibilities of management and those charged with governance for the financial statements
Management is responsible for the preparation and fair presentation of the financial statements in accordance with Canadian public sector accounting standards, and for such internal control as management determines is necessary to enable the preparation of financial statements that are free from material misstatement, whether due to fraud or error.
In preparing the financial statements, management is responsible for assessing the Organization’s ability to continue as a going concern, disclosing, as applicable, matters related to going concern and using the going concern basis of accounting unless management either intends to liquidate the Organization or to cease operations, or has no realistic alternative but to do so.
Those charged with governance are responsible for overseeing the Organization’s financial reporting process.
Auditor’s responsibilities for the audit of the financial statements
Our objectives are to obtain reasonable assurance about whether the financial statements as a whole are free from material misstatement, whether due to fraud or error, and to issue an auditor’s report that includes our opinion. Reasonable assurance is a high level of assurance, but is not a guarantee that an audit conducted in accordance with Canadian generally accepted auditing standards will always detect a material misstatement when it exists. Misstatements can arise from fraud or error and are considered material if, individually or in the aggregate, they could reasonably be expected to influence the economic decisions of users taken on the basis of these financial statements.
As part of an audit in accordance with Canadian generally accepted auditing standards, we exercise professional judgment and maintain professional skepticism throughout the audit. We also:
• Identify and assess the risks of material misstatement of the financial statements, whether due to fraud or error, design and perform audit procedures responsive to those risks, and obtain audit evidence that is sufficient and appropriate to provide a basis for our opinion. The risk of not

detecting a material misstatement resulting from fraud is higher than for one resulting from error, as fraud may involve collusion, forgery, intentional omissions, misrepresentations, or the override of internal control.
• Obtain an understanding of internal control relevant to the audit in order to design audit procedures that are appropriate in the circumstances, but not for the purpose of expressing an opinion on the effectiveness of the Organization’s internal control.
• Evaluate the appropriateness of accounting policies used and the reasonableness of accounting estimates and related disclosures made by management.
• Conclude on the appropriateness of management’s use of the going concern basis of accounting and, based on the audit evidence obtained, whether a material uncertainty exists related to events or conditions that may cast significant doubt on the Organization’s ability to continue as a going concern. If we conclude that a material uncertainty exists, we are required to draw attention in our auditor’s report to the related disclosures in the financial statements or, if such disclosures are inadequate, to modify our opinion. Our conclusions are based on the audit evidence obtained up to the date of our auditor’s report. However, future events or conditions may cause the Organization to cease to continue as a going concern.
• Evaluate the overall presentation, structure and content of the financial statements, including the disclosures, and whether the financial statements represent the underlying transactions and events in a manner that achieves fair presentation.
We communicate with those charged with governance regarding, among other matters, the planned scope and timing of the audit and significant audit findings, including any significant deficiencies in internal control that we identify during our audit.
(to be signed - PricewaterhouseCoopers LLP/s.r.l./s.e.n.c.r.l.)
Chartered Professional Accountants, Licensed Public Accountants
Toronto, Ontario June 25, 2020

Metrolinx Statement of Financial Position As at March 31, 2020
(in thousands of dollars)
The accompanying notes are an integral part of these financial statements.
Approved by the Board of Directors
___________________________________ Director ________________________________ Director
2020$
2019$
Assets
Current assetsCash and cash equivalents (note 5) 665,149 587,041Investments 12,781 -Accounts and other receivables (note 7) 261,479 140,428Contributions due from Province of Ontario 1,131,106 936,373Contributions due from Municipalities (note 11) 95,460 95,460Contributions due from Government of Canada 18,013 35,579Spare parts and supplies 20,878 15,672Prepaid expenses 20,561 12,699Derivatives - 1,102
2,225,427 1,824,354
Accounts and other receivables – long-term (note 7) - 74,787
Contributions due from Province of Ontario – long-term (note 10) 1,770,983 1,587,344
Other assets 40,704 -
Capital assets (note 6) 24,861,218 22,269,952
Deposits on land (note 8) 232,869 237,872
Advances on capital projects (note 8) 22,715 25,845
Long-term lease (note 9) 26,245 26,572
29,180,161 26,046,726
Liabilities
Current liabilitiesAccounts payable and accrued liabilities 2,131,566 1,776,850Presto Farecard E-Purse (note 5) 96,740 83,362Derivatives (note 21) 6,029 -
2,234,335 1,860,212
Long-term payable (note 10) 1,770,983 1,587,344
Deferred capital contributions (note 11) 21,460,662 19,083,563
Pension plan top-up benefits payable (note 13) 67,416 67,604
Other employee future benefits payable (note 14) 156,678 146,986
25,690,074 22,745,709
Net Assets
Invested in capital assets (note 15) 3,656,140 3,450,106
Invested in long-term lease 26,245 26,572
Internally restricted (note 16) 26,332 26,332
Deficiency of net assets (212,601) (203,095)
3,496,116 3,299,915
Accumulated remeasurement gains and losses (6,029) 1,102
29,180,161 26,045,624
Economic dependence (note 2)
Commitments (note 17)
Contingencies (note 18)

Metrolinx Statement of Operations For the year ended March 31, 2020
(in thousands of dollars)
The accompanying notes are an integral part of these financial statements.
2020$
2019$
RevenueOperating 688,761 653,006Contribution from the Province of Ontario 590,394 478,135Interest income 17,723 9,040Amortization of deferred capital contributions (note 11) 803,312 700,977Gain (loss) on disposal of capital assets 14,410 (536)
2,114,600 1,840,622
ExpensesSupplies and services 318,232 177,074Equipment maintenance 138,332 117,855Facilities and track 145,414 168,967Labour and benefits 352,201 336,167Rail and bus operations 375,400 356,336Amortization of capital assets 803,105 699,248Amortization of long-term lease 327 327
2,133,011 1,855,974
Excess of expenses over revenue (18,411) (15,352)

Metrolinx Statement of Changes in Net Assets For the year ended March 31, 2020
(in thousands of dollars)
The accompanying notes are an integral part of these financial statements.
2020 2019
Invested in capital
assets $
Investedin long-
term lease
$
Internallyrestricted
net assets
$Deficiency
$Total
$Total
$(note 15) (note 16)
Balance – Beginning of year 3,450,106 26,572 26,332 (203,095) 3,299,915 2,949,988
Excess of expenses over revenues - - - (18,411) (18,411) (15,352)
Amortization – net of amortization to revenue (1,710) (327) - 2,037 - -
Assets contributed by the Province of Ontario (note 19(b)) 2,330 - - - 2,330 719
Land acquisitions – net of deposits 2,904 - - - 2,904 126,688
Land – reclassifications and adjustments (23,491) (23,491)
Disposal of land (6,868) - - 6,868 - -Deposits on land 232,869 - - - 232,869 237,872
Balance – End of year 3,656,140 26,245 26,332 (212,601) 3,496,116 3,299,915

Metrolinx Statement of Cash Flows For the year ended March 31, 2020
(in thousands of dollars)
The accompanying notes are an integral part of these financial statements.
2020$
2019$
Cash provided by (used in)
Operating activitiesExcess of expenses over revenues (18,411) (15,352)Amortization of capital assets and long-term lease 803,432 699,575(Gain) loss on disposal of capital assets (14,410) 536Amortization of deferred capital contributions (803,312) (700,977)Employee future benefits – net of payments 9,505 11,112
(23,196) (5,106)Change in non-cash working capital
Investments (12,781) -Accounts and other receivables (46,264) 4,338Spare parts and supplies (5,206) (499)Prepaid expenses (7,862) (720)Accounts payable and accrued liabilities (82,719) 37,408PRESTO Farecard E-Purse 13,378 23,315
Other assets (40,704) -
(205,354) 58,736
Capital activitiesPurchase of capital assets (2,551,235) (2,821,922)Proceeds from sale of capital assets 23,195 5,108Deposits on land (note 15) (232,869) (237,872)Advances on capital projects (note 8) (22,715) (25,845)
(2,783,624) (3,080,531)
Financing activitiesGrants received for purchase of land 212,283 364,559Capital contributions 2,854,803 2,986,464
3,067,086 3,351,023
Net change in cash, cash equivalents and restricted cash 78,108 329,228
Cash and cash equivalents – Beginning of year 587,041 257,813
Cash and cash equivalents – End of year 665,149 587,041
Supplemental cash flow informationNon-cash capital activities
Change in accounts payable and accrued liabilities relating to capital assets 437,435 511,447Change in long-term capital payable/contribution due from Province 183,639 262,222Assets contributed by the Province of Ontario (note 19(b)) 2,330 719
Non-cash financing activitiesCapital contributions receivable/payable (177,168) (246,064)

Metrolinx Statement of Remeasurement Gains and Losses For the year ended March 31, 2020
(in thousands of dollars)
The accompanying notes are an integral part of these financial statements.
2020$
2019$
Balance, beginning of year 1,102 -
Unrealized gains (losses) attributable toForward fuel purchase contracts (note 21) (6,029) 1,102
Amounts reclassified to the statement of operations:Forward fuel purchase contracts (note 21) (1,102) -
Net remeasurement gains and (losses) (7,131) 1,102
Balance, end of year (6,029) 1,102

Metrolinx Notes to Financial Statements March 31, 2020
(in thousands of dollars)
(1)
1 Nature of operations
Metrolinx is a Crown agency, reporting to the Minister of Transportation of Ontario (MTO). It is a non-share capital
corporation and is exempt from income taxes under Section 149(1) (d) of the Income Tax Act (Canada).
Metrolinx was created by sections of the Greater Toronto Transportation Authority Act, 2006, which were proclaimed
on August 24, 2006. On May 14, 2009, Bill 163 was proclaimed amending the Greater Toronto Transportation Authority
Act, 2006 and changing the title of the Act to the Metrolinx Act, 2006. Metrolinx’s mandate is to lead the coordination,
planning, financing and development of an integrated multi-modal transportation network for the Greater Toronto and
Hamilton Area (GTHA). Taking a regional approach, Metrolinx brings together the Province of Ontario (the Province),
municipalities and local transportation authorities to produce long-term economically and environmentally sustainable
transportation solutions.
GO Transit is a business unit of Metrolinx that operates an inter-regional public transit system consisting of integrated
rail and bus corridors. The network of rail and bus services primarily serves communities across the Greater Toronto and
Hamilton Area including the cities of Toronto and Hamilton. GO Transit also serves the regions of Halton, Peel, York,
Durham, Simcoe County, Dufferin County, Wellington County and the cities of Barrie, Guelph, Kitchener and Niagara
Falls and the Town of Bradford-West Gwillimbury.
The Union Pearson (UP) Express provides high quality dedicated express rail service connecting Canada’s busiest
transportation hubs, Union Station in downtown Toronto and Toronto Pearson International Airport. The UP Express
began operations on June 6, 2015.
PRESTO is a business unit that operates the PRESTO fare system, an electronic fare card that allows riders to transfer
seamlessly across multiple transit systems.
2 Economic dependence
Metrolinx currently generates revenues primarily from the provision of transportation services provided by GO Transit,
UP Express and PRESTO card services.
In addition, Metrolinx receives government grants:
from all three levels of government to support its investment in capital infrastructure to be used in the delivery of
current and future transportation services; and
yearly operating subsidy from the Province of Ontario to further support the delivery of transportation services.
The ability of Metrolinx to continue to offer and grow its services and meet its obligations is dependent on the ongoing
grants it receives as outlined above.
Metrolinx Notes to Financial Statements March 31, 2020
(in thousands of dollars)
(2)
COVID-19 impact
The rapid spread of the COVID-19 virus, which was declared by the World Health Organization to be a pandemic on
March 11, 2020, and actions taken globally in response to COVID-19, have significantly disrupted business activities
throughout the world. Metrolinx’s operations rely, to a certain extent, on free movement of goods, services, and capital
within Canada, which has been significantly restricted as a result of the COVID-19 pandemic. Given the ongoing and
dynamic nature of the circumstances surrounding COVID-19, it is difficult to predict how significant the impact of
COVID-19, including any responses to it, will be on the economy and Metrolinx’s operations in particular, or for how long
any disruptions are likely to continue. The extent of such impact will depend on future developments, which are highly
uncertain, rapidly evolving and difficult to predict, including new information which may emerge concerning the
severity of COVID-19 and additional actions which may be taken to contain COVID-19, as well as the timing of the re-
opening of the economy in Canada. Such further developments could have a material adverse effect on Metrolinx’s
operations, financial condition, results of operations and cash flows.
As a Crown agency of the Government of Ontario, Metrolinx receives subsidy funding every year from the Province to
cover for the shortfall between operating revenue and expense, and capital funding for infrastructure renewal and
expansion. With the physical distancing restrictions in place as a result of the COVID-19 pandemic, ridership levels have
decreased significantly which, consequently, has resulted in significant reductions in operating revenues and cash flows
in fiscal 2021.
3 Summary of significant accounting policies
Financial statement presentation
These financial statements have been prepared by management in accordance with Public Sector Accounting Standards
(PSAS) for government, including not-for-profit organizations, as recommended by the Public Sector Accounting Board
(PSAB) of the Chartered Professional Accountants of Canada (CPA Canada).
Financial instruments
Financial instruments are financial assets or liabilities of Metrolinx which, in general, provide Metrolinx the right to
receive cash or another financial asset from another party or require Metrolinx to pay another party cash or other
financial assets.
Financial instruments reported on the statement of financial position of Metrolinx are measured as follows:
Cash and cash equivalents amortized cost
Investments amortized cost
Accounts and other receivables amortized cost
Contributions due from Province of Ontario amortized cost
Contributions due from municipalities amortized cost
Contributions due from Government of Canada amortized cost
Contributions due from Province of Ontario – long-term amortized cost
Derivatives fair value
Accounts payable and accrued liabilities amortized cost

Metrolinx Notes to Financial Statements March 31, 2020
(in thousands of dollars)
(3)
PRESTO Fare Card E-Purse amortized cost
Long-term payable amortized cost
Transaction costs on assets measured at fair value are expensed as incurred.
The fair value of Metrolinx’s cash and cash equivalents, investments, accounts and other receivables, contributions due
from Province of Ontario, contributions due from municipalities, contributions due from Government of Canada,
accounts payable and accrued liabilities, and PRESTO Fare Card E-Purse approximate their carrying values due to the
short-term nature of these financial instruments. The fair values of other financial instruments approximate their
carrying values unless otherwise noted, based on market rates available to Metrolinx for financial instruments with
similar risks, terms and maturities.
Fair value represents the amount that would be exchanged in an arm’s length transaction between willing parties who
are under no compulsion to act and is best evidenced by a quoted market price, if one exists. Metrolinx’s fair values are
management’s estimates and are generally determined using market conditions at a specific point in time. The
determinations are subjective in nature, involving uncertainties and the exercise of significant judgment.
From time to time, Metrolinx enters into contracts for diesel fuel to manage exposure to diesel fuel price risks. These
derivative instruments are recorded on the statement of financial position as an asset or liability and are measured at
fair value. The unrealized gains or losses in the derivative instruments’ fair value are recognized in the statement of
remeasurement gains and losses.
Metrolinx does not hold or issue derivative financial instruments for trading or speculative purposes, and controls are in
place to detect and prevent these activities.
Cash and cash equivalents
Cash and cash equivalents include cash on hand, balances with banks net of bank overdrafts and highly liquid short-term
investments with maturities of three months or less at the time of purchase.
Investments
Investments include highly liquid short-term investments with maturities of more than three months but not
exceeding a year at the time of purchase.
Spare parts and supplies
Spare parts and supplies are carried at the lower of cost and net realizable value. Cost is determined using the weighted
average method.

Metrolinx Notes to Financial Statements March 31, 2020
(in thousands of dollars)
(4)
Capital assets
Capital assets are recorded at cost. The cost of a capital asset includes all costs directly related to the acquisition,
construction, development or betterment of the capital asset. Salaries, wages and associated employee benefits for
staff directly involved in the acquisition, development or construction of a capital asset are included in the cost of the
capital asset.
Metrolinx has adopted a whole property approach in capitalizing and amortizing its buildings, rail equipment and bus
equipment. Under this approach, all components attached to the building structure (lighting, elevators, air conditioning,
etc.) are amortized over a composite service life of the property as a whole.
If the development or construction of a capital asset is terminated or deferred indefinitely before completion, the costs
capitalized to date are expensed, unless there is an alternative use for the capital asset or unless recovery of those costs
from a third party can be reasonably estimated and collection is likely based on related agreements.
Capital assets derived through an Alternate Financing Procurement (AFP) contract for design, build, finance, maintain
and operate will contain a portion of the capital design and construction costs that will be paid on substantial
completion of the construction of the capital asset and the remainder over the useful life. A matching contribution
receivable from the Province of Ontario is recorded. Annual service payments and lifecycle payments will be paid
annually over the term of the contract.
Amortization
Metrolinx provides for the amortization of the various classes of assets over their estimated useful lives on a straight-
line basis as follows:
Buildings (including shelters and ticket booths) 5 – 40 yearsLeasehold improvements lease lifeLocomotives and other railway rolling stock 20 – 30 yearsImprovements to railway right-of-way plant 20 yearsTrack work and installation 20 yearsBuses (including double decker buses) 10 yearsParking lots 20 yearsComputer equipment and software 5 – 10 yearsGrade separations 50 yearsOther (including furniture and equipment) 3 – 12 years
Work-in-progress comprises direct construction and development costs. No amortization is recorded until the assets are
in service.
Long-term lease
Long-term lease represents the pre-payment of the lease regarding Union Station. The amount is being amortized
straight-line over 100 years, which is the term of the lease plus one renewal period.

Metrolinx Notes to Financial Statements March 31, 2020
(in thousands of dollars)
(5)
Employee future benefits
Metrolinx provides pension plan benefits through the multi-employer Ontario Municipal Employees Retirement System
(OMERS) Pension Plan. The expense for the period equals the required contribution for the period.
Metrolinx provides a top-up pension plan benefit calculated by using the accrued benefit method, which reflects the
projected benefits for services rendered to date. Adjustments arising from employee benefit plan amendments,
experience gains and losses and changes in assumptions are amortized to earnings over the average remaining service
period of the active employees. Any past service costs are expensed when incurred.
Metrolinx also provides other employee future benefits calculated by using the accrued benefit method, which reflects
the projected benefits for services rendered to date. Adjustments arising from employee benefit plan amendments,
experience gains and losses and changes in assumptions are amortized to earnings over the average remaining service
period of active employees. Any past service costs are expensed when incurred.
Operating revenues
Operating revenues comprise fare revenues from transit operations, including bus and rail services and non-fare
revenues from various services including partnership, parking, advertising, farecard sales, commercial space rent and
other ancillary services. Revenue is recognized from commuter services when the transportation service is provided.
Other revenues are recognized when the related services are provided.
Contributions
Metrolinx follows the deferral method of accounting for contributions. Unrestricted contributions, including operating
grants, are recognized as revenue in the period to which they relate.
Deferred capital contributions relate to funds received for the acquisition of capital assets other than land. These
deferred capital contributions are recognized as revenue over the same period as the amortization of the related capital
asset.
Contributions received for the acquisition of land, including deposits for land, are recognized as direct increases in net
assets.
Internally restricted net assets
Internally restricted net assets are internally restricted to provide a funding source for planned future obligations and to
provide flexibility against uncertainties which may arise. All reserves are approved by the Board of Directors and are
disclosed on the statement of financial position as net assets.

Metrolinx Notes to Financial Statements March 31, 2020
(in thousands of dollars)
(6)
Liability for contaminated sites
Metrolinx assesses all land holdings to determine if contamination, as defined under the standard and regulatory
requirements, is present on lands not being used in providing transit and other related services. While contamination
may be present, the resultant liability also depends on the existing and future disturbances to the land. A complete
inventory of all land holdings was developed and assessed under the standard. There were no liabilities to report at year-
end.
Use of estimates
The preparation of financial statements in conformity with Canadian generally accepted accounting principles requires
management to make estimates and assumptions that affect the reported amounts of assets and liabilities and the
disclosure of contingent assets and liabilities at the date of the financial statements and the reported amounts of
revenues and expenses during the reporting period. Actual results could differ from those estimates. The items subject
to the most significant estimates are amortization of capital assets, certain accrued liabilities, pension plan top-up
benefits payable and other employee future benefits payable.
4 Financial instruments and risk management
Metrolinx’s financial assets and liabilities have exposure to the following risks:
Credit risk
Metrolinx is subject to credit risk through its receivables. It is management’s opinion that the risk is minimal as most of
the receivables are from federal, provincial and municipal governments and organizations controlled by them.
Interest rate risk
Metrolinx does not have significant exposure to interest rate risk related to its long-term liabilities as they are primarily
with related parties and are non-interest bearing or as a result of AFP contractual agreements.
Other price risk
Metrolinx is exposed to changes in crude oil prices as a result of diesel fuel consumption. The potential fluctuations in
crude oil prices could have a significant impact on the cost of providing transportation services. This risk is reduced,
from time to time, through the use of diesel fuel forward purchase contracts to lock in firmly committed future
operating costs for own use consumption.
5 PRESTO Farecard E-Purse balances
The balance of funds held on PRESTO Farecard E-Purse in the amount of $ 96,740 (2019 – $83,362) has been included in
cash and cash equivalents. The E-Purse balance is held on behalf of the Farecard owner and therefore a liability is
recorded on the statement of financial position.

Metrolinx Notes to Financial Statements March 31, 2020
(in thousands of dollars)
(7)
6 Capital assets
2020 2019
Cost $
Accumulatedamortization
$Net
$Net
$
Land 2,581,723 - 2,581,723 2,403,935Buildings 2,120,421 653,157 1,467,264 1,574,865Leasehold improvements 108,643 51,078 57,565 58,397Locomotives and other
railway rolling stock 3,396,790 1,106,815 2,289,975 2,108,798Improvements to railway
right-of-way plant 1,533,340 835,494 697,846 746,497Grade separations, track
work and installations 3,991,514 944,427 3,047,087 2,877,647Work-in-progress 11,771,165 - 11,771,165 10,140,781Buses 480,027 201,499 278,528 254,250Parking lots 887,827 362,918 524,909 536,609Computer equipment and
software 1,955,129 971,413 983,716 969,743Other 1,435,436 273,996 1,161,440 598,430
30,262,015 5,400,797 24,861,218 22,269,952
Work-in-progress includes the following:
2020
$
2019
$
Rail corridor expansion 1,345,419 979,193
Union Station 627,981 554,022
Rail fleet 173,856 262,455
PRESTO system 81,017 46,833
Light Rapid Transit and Bus Rapid Transit 7,853,530 7,092,023
Various 1,689,363 1,206,255
11,771,166 10,140,781
Work-in-progress relates to projects that are expected to come into service in one to seven years.
Certain comparative figures for work-in-progress have been reclassified to conform to the current year’s presentation.
Hamilton Light Rail Train (LRT) project
On December 16, 2019, the Government of Ontario announced the cancellation of the Hamilton LRT project and all
relevant procurement of properties. At the time of cancellation, approximately $171 million in costs had been incurred
and capitalized as work-in-progress in relation to the Hamilton LRT project.

Metrolinx Notes to Financial Statements March 31, 2020
(in thousands of dollars)
(8)
With the cancellation of the project, management revisited the costs incurred and capitalized and recorded a charge
during the year ended March 31, 2020 of $94 million for the write-off of costs related to certain professional services. In
addition, management recorded an additional charge of $22 million to record certain liabilities at March 31, 2020 mainly
related to breakage fees and other amounts owing to property owners arising from the cancellation of the project.
Subway upload projects
In April 2019, the Province announced through the passing of its budget that it would be amending the Metrolinx Act,
2006 for Metrolinx to take control of the planning, design, construction and operation of certain subway projects from
the City of Toronto (the City) and the Toronto Transit Commission (TTC).
Regulations under the Metrolinx Act, 2006 were passed in July 2019 to formalize the Province taking control of these
subway projects. As a result, these subway projects became the sole responsibility of Metrolinx, as an agency of the
Province pursuant to Ontario Regulation 248/19. The City and its agencies were no longer permitted to design, develop,
construct or work on, or cause design, construction or work on these projects. In September 2019, the subway contracts
were transferred from the TTC to Metrolinx which provided Metrolinx with the ability to procure and manage the design
and development activities.
In February 2020, the City and the Province signed a preliminary agreement (Ontario-Toronto Transit Partnership) that
noted amongst other items, the following:
The existing subway assets will remain the responsibility and under the ownership of the City and the TTC;
The Province will have sole responsibility for the planning, design and construction of these former TTC subway projects, and intends to own the resulting assets; and
The Province will undertake a financial review and reconciliation exercise with the City, related to the investments made by the TTC to fund the planning, design and engineering work for these subway projects. Subject to the outcome of the exercise, the Province commits to reimburse the City for reasonable costs incurred for these projects.
The Province and the City are currently working to finalize the partnership through a governance structure and
agreements framework that will codify roles and responsibilities of the respective parties regarding the delivery of the
rapid transit projects, capital funding contributions, operations and maintenance requirements and other governance
parameters. In addition, the aforementioned financial review and reconciliation exercise between the Province and the
City is not yet completed. Accordingly, Metrolinx has not recognized any amounts in the financial statements for the
year ended March 31, 2020 pertaining to amounts incurred by the TTC prior to September 1, 2019.

Metrolinx Notes to Financial Statements March 31, 2020
(in thousands of dollars)
(9)
7 Accounts receivable and other receivables
Accounts and other receivables are comprised of the following:
2020$
2019$
Recoverable Harmonized sales tax 144,161 93,512Other receivables 42,531 46,916
186,692 140,428Sunk project costs recoverable from City of Toronto 74,787 74,787
261,479 215,215
Included in accounts and other receivables is $74,787 (2019 – $74,787) related to the design of the Light Rapid Transit
(LRT) Scarborough corridor in the City of Toronto incurred by Metrolinx as at March 31, 2016 and does not include costs
related to any contract amendments or cancellations with third party vendors. On October 8, 2013, City of Toronto
Council voted to replace the planned LRT currently under construction under the Master Agreement with a Scarborough
Subway. The City of Toronto has agreed to reimburse Metrolinx for expenditures incurred for the Scarborough LRT,
including any potential costs associated with the LRT vehicle supply contract. Accordingly, the costs incurred to date
have been reclassified from work-in-progress to non-interest bearing accounts receivable. The receivable is expected to
be settled in connection with the negotiations related to the subway upload transaction with the City (note 6).
8 Advances on capital projects
Metrolinx has entered into Memorandum of Agreements (MOAs) with York Region Rapid Transit Corporation (YRRTC),
The Regional Municipality of York (York Region), City of Toronto and the TTC. The MOAs outline the projects, expected
costs, and responsibilities of the parties involved. The MOAs also outline the definition of eligible costs and ownership
rights of the projects specified in the agreements. A Master Agreement with YRRTC and York Region was signed
April 14, 2011 and covers both past and future eligible costs of constructing the bus rapidway. The MOA with the City of
Toronto and the TTC was extended until the earlier of September 30, 2012 and the date on which Metrolinx, TTC and
the City finalize definitive legal agreements. A Master Agreement with TTC and the City of Toronto was signed
November 28, 2012 and covers the cost of constructing the Eglinton LRT, Scarborough RT, Finch West LRT and
Sheppard East LRT. The Master Agreement also covers project governance and costs related to the East Rail
Maintenance Facility Alternate Financing procurement.
Pursuant to these agreements, advances were paid to York Region and to the TTC to provide working capital for
deposits on land totalling $231,969 (2019 – $213,247) and other project costs totalling $22,715 (2019 – $25,845) to fund
projects being developed by York Region and TTC on behalf of Metrolinx. The deposits on land referred to above relate
to obtaining, in the future, perpetual easements required for the operation of the York Region bus rapidway. The
advances on capital projects are to be held in a separate account and any interest accrued is recognized as interest
income in the period.
As at March 31, 2020, Metrolinx has expended approximately $9,194,772 (2019 – $7,706,807) in relation to these
projects, including the following amounts that have been advanced for costs expected to be incurred to June 30, 2020
and deposits related to future perpetual easements.

Metrolinx Notes to Financial Statements March 31, 2020
(in thousands of dollars)
(10)
2020$
2019$
York Region 251,316 235,723TTC 3,368 3,368
254,684 239,091Other land deposits 900 24,626
255,584 263,717
9 Long-term lease
2020 2019
Cost $
Accumulatedamortization
$Net
$Net
$
Leasehold – Union Station 32,704 6,459 26,245 26,572
10 Long-term payable and contributions due from Province of Ontario – long-term
Metrolinx and Infrastructure Ontario entered into an Alternate Financing Procurement (AFP) contract with Crosslinx
Transit Solutions for the design, build, finance and maintenance of its Eglinton Crosstown Light Rail Transit Line during
the year ended March 31, 2016. The AFP contract with Crosslinx Transit Solutions is for 30 years at a total amount of
$9,103,676. Metrolinx and Infrastructure Ontario had entered into another AFP contract with Plenary Infrastructure for
the design, build, finance and maintenance of its Whitby Facility (formerly known as the East Rail Maintenance Facility)
during the year ended March 31, 2015. The AFP contract with Plenary Infrastructure is for 30 years at a total amount of
$921,794. This amount also includes lifecycle payments over the term of the contract amounting to $76.6 million.
In addition, during the year ended March 31, 2019 a number of new AFP contracts were entered into for Cooksville,
#401/409 Tunnel, Kipling Bus Terminal, Rutherford Station grade separation and the Stouffville Station projects. During
the current year, a new AFP contract for Davenport Diamond Grade Separation project was commenced. Costs incurred
on these contracts as at March 31, 2020 are as follows and are included in work-in-progress.
ECLRT $
Whitby $
Cooksville $
#401/409 Tunnel
$
Kipling Bus
Terminal $
RutherfordStation,
grade separation
$
Stouffville Station
$
DavenportDiamond
Grade Separation
$2020
$2019
$
Cost incurred to date 4,049,755 518,570 122,663 90,583 50,651 87,468 133,980 19,017 5,072,687 3,898,832Less: Amount paid or
amount payable within 1 year 2,656,233 326,419 122,663 2,521 50,651 44,164 99,053 - 3,301,704 2,311,488
Long-term payable 1,393,522 192,151 - 88,062 - 43,304 34,927 19,017 1,770,983 1,587,344
A matching contribution receivable from the Province for costs incurred to date is included in deferred capital
contributions.

Metrolinx Notes to Financial Statements March 31, 2020
(in thousands of dollars)
(11)
11 Deferred capital contributions
The changes in the deferred capital contributions for the year are as follows:
2020$
2019$
Balance – Beginning of year 19,083,563 16,289,789Contributions received or receivable in the period for capital
acquisitionsProvince of Ontario 3,170,183 3,455,009Municipalities 5,946 12,746Government of Canada 4,282 26,996
Amortization of deferred capital contributions (803,312) (700,977)
Balance – End of year 21,460,662 19,083,563
Metrolinx realized a shortfall in municipal funding related to its capital program. The Province has provided funding to
bridge the shortfall in the current year in the amount of $60,783 (2019 – $63,327) and the cumulative amount is
$1,385,793 (2019 – $1,325,010). The Province will work with its municipal partners to address the funding shortfalls.
The City of Toronto has agreed to contribute $95,460 related to grade separation and utility relocation work performed
by Metrolinx on the Georgetown South (GTS) corridor. An Agreement in Principle signed in January 2018 between the
Province and the City of Toronto allows Metrolinx to recover eligible costs that it incurred on behalf of the City. The
receivable is expected to be settled in connection with the negotiations related to the subway upload transaction with
the City (note 6). Accordingly, the receivable has been classified as a short-term asset at March 31, 2020.
12 Pension contributions
Metrolinx provides pension benefits for substantially all of its permanent employees through participation in the
OMERS Pension Plan. The amount expensed in pension contributions for the year ended March 31, 2020 is $37,397
(2019 – $33,693).
13 Pension plan top-up benefits liability
With repatriation of the former GO Transit to the Province in 2002, bargaining and non-bargaining employees
requested the Province to rectify the difference in pension benefits to be received by employees of GO Transit. When
GO Transit was transferred from the Province to the Greater Toronto Services Board in 1999, the Provincial Plans were
frozen and a new plan commenced under OMERS. It had been resolved that GO Transit was responsible for the pension
obligation. GO Transit completed an actuarial valuation as at April 1, 2016. The pension expense recognized during the
year is $4,353 (2019 – $4,249).
The cost of pension plan top-up benefits is actuarially determined using the projected benefit method pro-rated on
service. The discount rate used to determine the accrued benefit obligation was determined based on the Ontario
provincial bond yields. The actuarial gains and losses are amortized over the average remaining service period of active
employees.
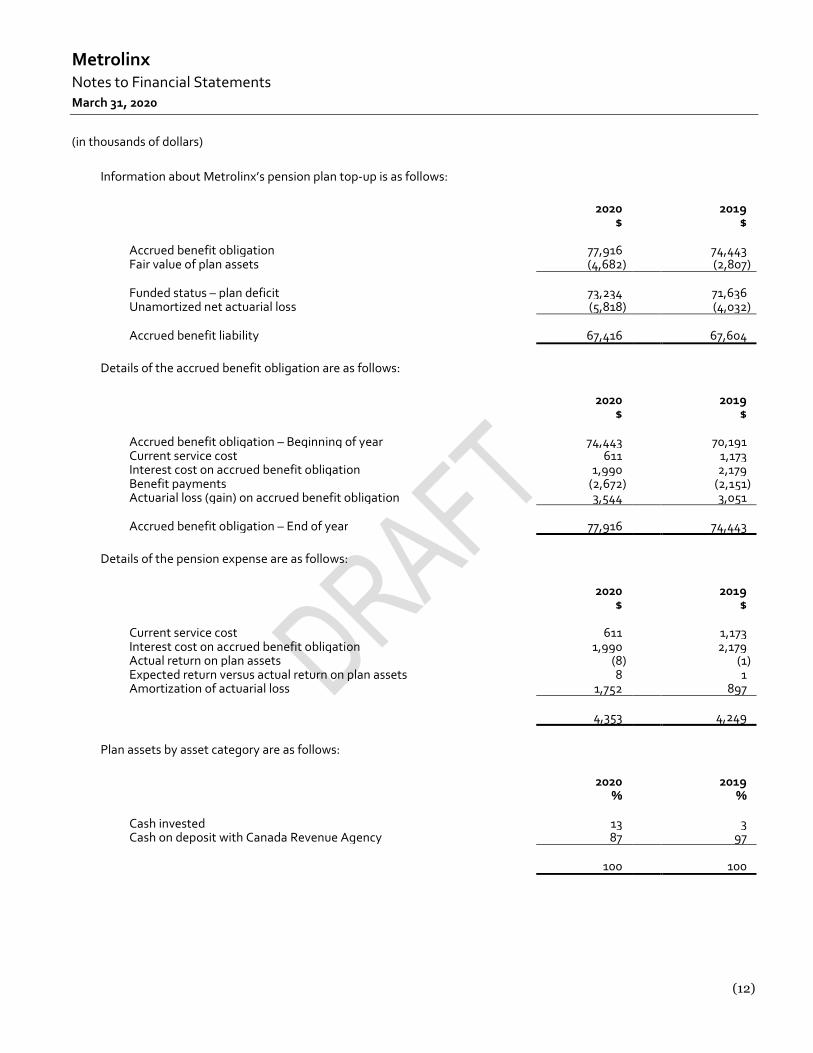
Metrolinx Notes to Financial Statements March 31, 2020
(in thousands of dollars)
(12)
Information about Metrolinx’s pension plan top-up is as follows:
2020$
2019$
Accrued benefit obligation 77,916 74,443Fair value of plan assets (4,682) (2,807)
Funded status – plan deficit 73,234 71,636Unamortized net actuarial loss (5,818) (4,032)
Accrued benefit liability 67,416 67,604
Details of the accrued benefit obligation are as follows:
2020$
2019$
Accrued benefit obligation – Beginning of year 74,443 70,191Current service cost 611 1,173Interest cost on accrued benefit obligation 1,990 2,179Benefit payments (2,672) (2,151)Actuarial loss (gain) on accrued benefit obligation 3,544 3,051
Accrued benefit obligation – End of year 77,916 74,443
Details of the pension expense are as follows:
2020$
2019$
Current service cost 611 1,173Interest cost on accrued benefit obligation 1,990 2,179Actual return on plan assets (8) (1)Expected return versus actual return on plan assets 8 1Amortization of actuarial loss 1,752 897
4,353 4,249
Plan assets by asset category are as follows:
2020%
2019%
Cash invested 13 3Cash on deposit with Canada Revenue Agency 87 97
100 100

Metrolinx Notes to Financial Statements March 31, 2020
(in thousands of dollars)
(13)
Other information about Metrolinx’s benefit plan is as follows:
2020$
2019$
Employer contributions 4,540 2,350Benefits 2,672 2,151
The significant actuarial assumptions adopted in measuring Metrolinx’s pension plan top-up benefit obligations are as
follows:
2020 2019
Discount rate 2.7% 3.1%Rate of compensation increase 2.5% 2.75%Inflation per annum 2% 2%Expected average remaining service life 4 years 4 years
14 Other employee future benefits liability
Metrolinx provides post-retirement life and health benefits, Workplace Safety & Insurance Board (WSIB) liabilities and
retiree severance benefits. The plan is unfunded and requires nominal contributions from employees. Substantially all
full-time active employees are eligible for life and health benefits. A limited number of employees are eligible for
severance benefits.
The measurement date of the plan assets and accrued benefit obligation is March 31 of each year. The most recent
actuarial valuation of the other employee future benefits was as at March 31,2020. The post-retirement non-pension
benefits recognized during the year were $13,135 (2019 – $11,855).
The cost of post-retirement non-pension benefits is actuarially determined using the projected benefit method pro-
rated on service, retirement ages of employees and expected health-care costs. The discount rate used to determine the
accrued benefit obligation was determined based on the Ontario provincial bond yields. The actuarial gains and losses
are amortized over the average remaining service period of active employees. Past service costs are expensed when
incurred. Information about Metrolinx’s post-retirement non-pension benefits is as follows:
2020$
2019$
Accrued benefit obligation 143,917 156,884
Funded status – plan deficit 143,917 156,884Unamortized net actuarial gain (loss) 12,761 (9,898)
Accrued benefit liability 156,678 146,986

Metrolinx Notes to Financial Statements March 31, 2020
(in thousands of dollars)
(14)
Details of the accrued benefit obligation are as follows:
2020$
2019$
Accrued benefit obligation – Beginning of year 156,884 140,302Adjustment at beginning of year - 715Current service cost 6,165 5,549Interest cost on accrued benefit obligation 4,514 4,469Benefit payments (3,442) (3,356)Actuarial (gain)/loss on accrued benefit obligation (20,204) 9,205
Accrued benefit obligation – End of year 143,917 156,884
Details on the post-retirement non-pension benefits expense are as follows:
2020$
2019$
Current service cost 6,165 5,549Interest cost on accrued benefit obligation 4,514 4,469Amortization of actuarial loss 2,456 1,837
13,135 11,855
The significant actuarial assumptions adopted in measuring Metrolinx’s post-retirement non-pension benefit
obligations are as follows:
2020 2019
Discount rate for post-retirement non-pension benefit 2.5% 3.1%Discount rate for WSIB liabilities 2.3% 2.7%Discount rate for retiree severance benefits 1.9% 2.5%Expected average remaining service life for post-retirement non-
pension benefit 15 years 15 yearsExpected average remaining service life for WSIB liabilities 9 years 9 yearsExpected average remaining service life for retiree severance
benefits 2 years 2 yearsRate of compensation increase 2.75% 2.75%Inflation per annum 2% 2%Initial Weighted Average Health Care Trend Rate 4.24% 5.1%Ultimate Weighted Average Health Care Trend Rate 3.02% 4%Dental care benefits increase 2.75% 2.75%
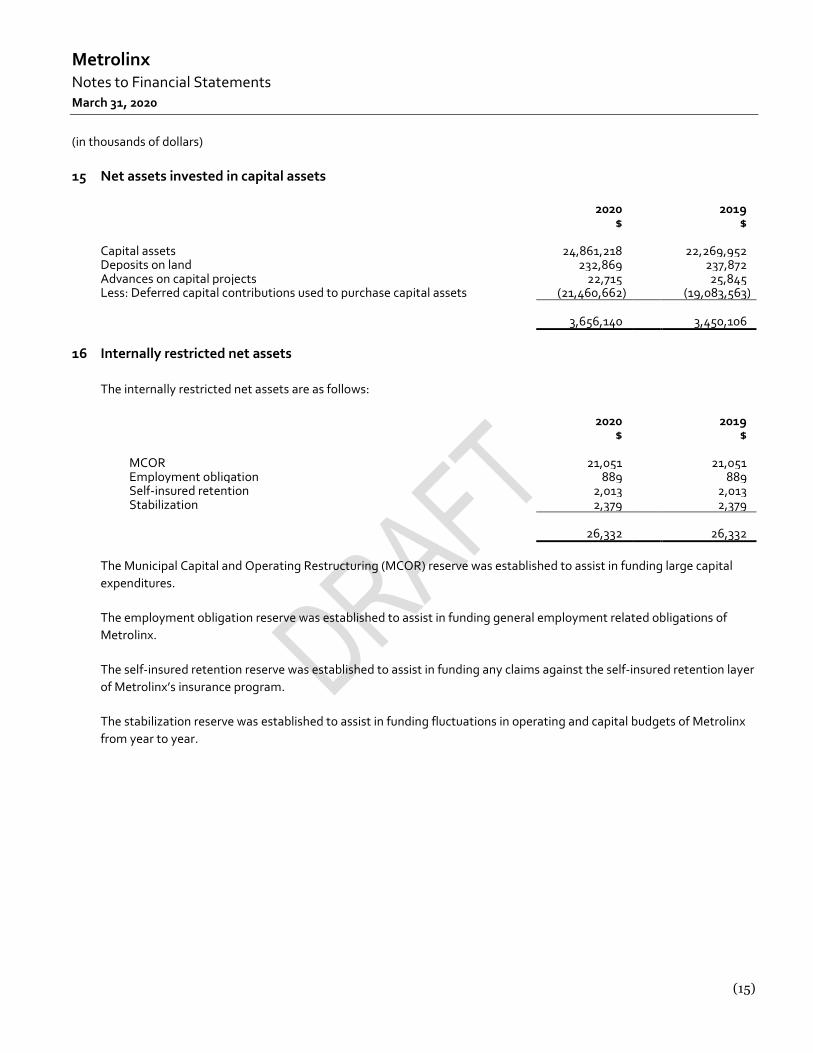
Metrolinx Notes to Financial Statements March 31, 2020
(in thousands of dollars)
(15)
15 Net assets invested in capital assets
2020$
2019$
Capital assets 24,861,218 22,269,952Deposits on land 232,869 237,872Advances on capital projects 22,715 25,845Less: Deferred capital contributions used to purchase capital assets (21,460,662) (19,083,563)
3,656,140 3,450,106
16 Internally restricted net assets
The internally restricted net assets are as follows:
2020$
2019$
MCOR 21,051 21,051Employment obligation 889 889Self-insured retention 2,013 2,013Stabilization 2,379 2,379
26,332 26,332
The Municipal Capital and Operating Restructuring (MCOR) reserve was established to assist in funding large capital
expenditures.
The employment obligation reserve was established to assist in funding general employment related obligations of
Metrolinx.
The self-insured retention reserve was established to assist in funding any claims against the self-insured retention layer
of Metrolinx’s insurance program.
The stabilization reserve was established to assist in funding fluctuations in operating and capital budgets of Metrolinx
from year to year.
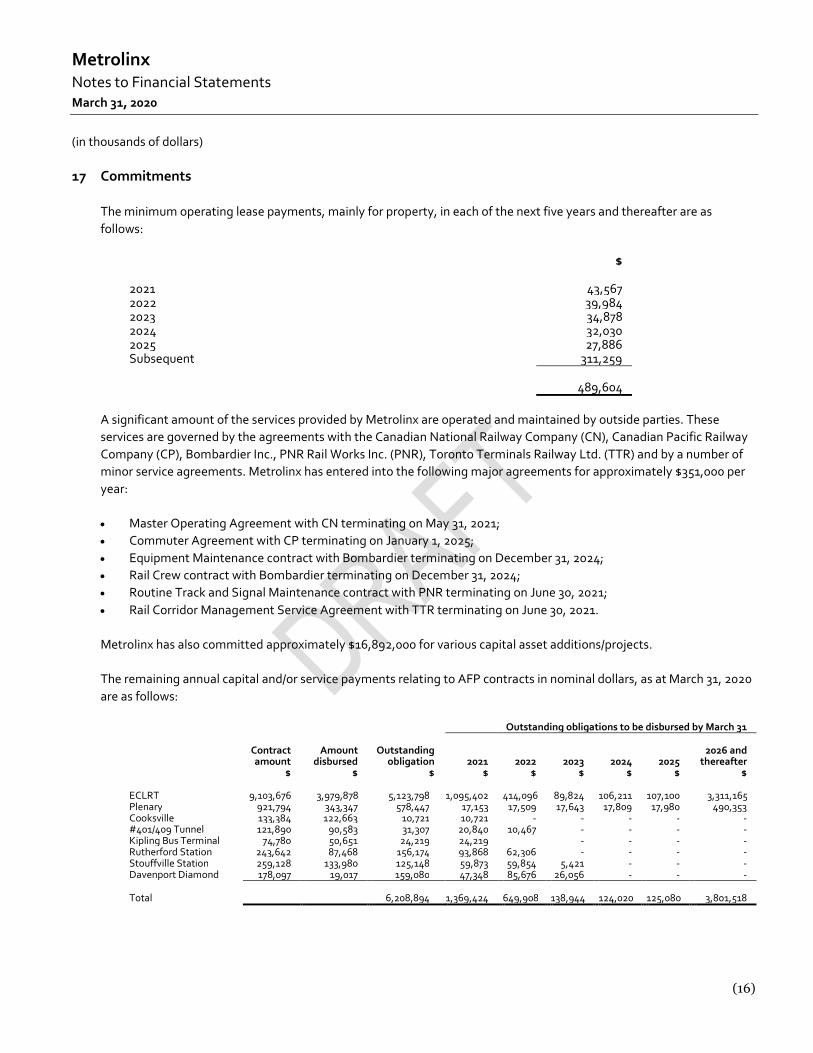
Metrolinx Notes to Financial Statements March 31, 2020
(in thousands of dollars)
(16)
17 Commitments
The minimum operating lease payments, mainly for property, in each of the next five years and thereafter are as
follows:
$
2021 43,5672022 39,9842023 34,8782024 32,0302025 27,886Subsequent 311,259
489,604
A significant amount of the services provided by Metrolinx are operated and maintained by outside parties. These
services are governed by the agreements with the Canadian National Railway Company (CN), Canadian Pacific Railway
Company (CP), Bombardier Inc., PNR Rail Works Inc. (PNR), Toronto Terminals Railway Ltd. (TTR) and by a number of
minor service agreements. Metrolinx has entered into the following major agreements for approximately $351,000 per
year:
Master Operating Agreement with CN terminating on May 31, 2021;
Commuter Agreement with CP terminating on January 1, 2025;
Equipment Maintenance contract with Bombardier terminating on December 31, 2024;
Rail Crew contract with Bombardier terminating on December 31, 2024;
Routine Track and Signal Maintenance contract with PNR terminating on June 30, 2021;
Rail Corridor Management Service Agreement with TTR terminating on June 30, 2021.
Metrolinx has also committed approximately $16,892,000 for various capital asset additions/projects.
The remaining annual capital and/or service payments relating to AFP contracts in nominal dollars, as at March 31, 2020
are as follows:
Outstanding obligations to be disbursed by March 31
Contractamount
$
Amountdisbursed
$
Outstandingobligation
$2021
$2022
$2023
$2024
$2025
$
2026 andthereafter
$
ECLRT 9,103,676 3,979,878 5,123,798 1,095,402 414,096 89,824 106,211 107,100 3,311,165Plenary 921,794 343,347 578,447 17,153 17,509 17,643 17,809 17,980 490,353Cooksville 133,384 122,663 10,721 10,721 - - - - -#401/409 Tunnel 121,890 90,583 31,307 20,840 10,467 - - - -Kipling Bus Terminal 74,780 50,651 24,219 24,219 - - - -Rutherford Station 243,642 87,468 156,174 93,868 62,306 - - - -Stouffville Station 259,128 133,980 125,148 59,873 59,854 5,421 - - -Davenport Diamond 178,097 19,017 159,080 47,348 85,676 26,056 - - -
Total 6,208,894 1,369,424 649,908 138,944 124,020 125,080 3,801,518

Metrolinx Notes to Financial Statements March 31, 2020
(in thousands of dollars)
(17)
Contractual rights are rights to economic resources arising from contracts or agreements that will result in revenues and
assets in the future. Metrolinx has contractual rights because of agreements entered into with various Transit agencies
for the use of the PRESTO fare system. The agreements allow for a commission fee paid to Metrolinx based on the
percentage of revenue collected via PRESTO. The terms of the agreements vary in length for periods between 9 and 15
years.
As at March 31, 2020, Metrolinx had outstanding letters of credit totalling $28 (2019 – $28).
18 Contingencies
Various lawsuits have been filed against Metrolinx for incidents which arose in the ordinary course of business.
Management has reviewed these claims and made provisions as appropriate. Where the outcome of a claim is not yet
determinable, any settlement will be recorded when it is determined that a claim is likely to be settled and the amount
is determinable.
19 Related party disclosures and transactions and balances
Related party disclosures
Key management personnel are defined as individuals having authority and responsibility for planning, directing and
controlling activities of the entity. Metrolinx has identified direct reports to the CEO and its board members as its key
management personnel and put in place processes for preparation and review of annual attestations. There were no
material transactions to report in the year.
Inter-entity transactions
Metrolinx had the following transactions with related parties during the year for the provision of services provided by
these organizations.
a) Infrastructure Ontario $55,632 (2019 – $48,723). As at March 31, 2020, accounts payable and accrued
liabilities included $22,090 (2019 – $17,385) owing to Infrastructure Ontario.
b) The Ontario Ministry of Transportation transferred two parcels of land to Metrolinx during the year. The
transfer was made at the fair value of the assets that amounted to $2,330. The Ministry owes $225 (2019 –
$225) for two parcels of land procured from Metrolinx in prior years.
The transactions above are measured at the exchange amount, which is the amount of consideration established and
agreed to by the related parties. Contributions of capital assets from the Province are recorded at fair value.
Balances due from/to the Province of Ontario are separately disclosed on the statement of financial position. Amounts
are non-interest bearing with no specified terms of repayment.

Metrolinx Notes to Financial Statements March 31, 2020
(in thousands of dollars)
(18)
20 Guarantees
In the normal course of business, Metrolinx enters into agreements that meet the definition of a guarantee.
a) Metrolinx has entered into agreements that include indemnities in favour of third parties such as purchase and sale
agreements, confidentiality agreements, engagement letters with advisers and consultants, outsourcing
agreements, leasing contracts, information technology agreements and service agreements. These
indemnification agreements may require Metrolinx to compensate counterparties for losses incurred by the
counterparties as a result of breaches in representation and regulations or as a result of litigation claims or
statutory sanctions that may be suffered by the counterparty as a consequence of the transaction. The terms of
these indemnities are not explicitly defined and the maximum amount of any potential reimbursement cannot be
reasonably estimated.
b) Indemnity has been provided to all directors and/or officers of Metrolinx including, but not limited to, all costs to
settle suits or actions due to association with Metrolinx, subject to certain restrictions. Metrolinx has purchased
directors’ and officers’ liability insurance to mitigate the cost of any potential future suits or actions. The term of
the indemnification is not explicitly defined, but is limited to the period over which the indemnified party served as
a trustee, director or officer of Metrolinx. The maximum amount of any potential future payment cannot be
reasonably estimated.
The nature of these indemnification agreements prevents Metrolinx from making a reasonable estimate of the
maximum exposure due to the difficulties in assessing the amount of liability, which stems from the unpredictability of
future events and the unlimited coverage offered to counterparties.
Historically, Metrolinx has not made any significant payments under such or similar indemnification agreements,
therefore, no amount has been recorded with respect to these agreements.
21 Diesel fuel forward contracts
As at March 31, 2020, Metrolinx has entered into three future contracts for 53.4 million litres of diesel fuel at prices
ranging from $0.485 to $0.704 per litre which mature in fiscal2020/2021. The change in fair value of the derivative
instrument of $6,029 for the year ended March 31, 2020 is recorded as an unrealized loss in the statement of
remeasurement gains and losses.

Annual Report 2019-20
81
Appendix A – 2019-20 Strategic Objectives Report
At the close of the 2018-19 business year, the organization determined the strategic plan heading into the 2019-2020 financial cycle. The company agreed on four critical outcomes: Everyone Safe, Engaged Employees, Trusted Business Partner and Customer Focused. These outcomes were to be achieved through 15 strategic objectives, with accountability shared amongst all the divisions in the organization. The following report provides an overview of the company’s performance on these targets.
Everyone Safe
Strategic Objective (SO) Status at end of FY2019-20 SO 1. Reduce Lost Time Injury Frequency Rate (LTIFR) by 20 per cent from 4.0 to 3.2 per 200,000 hours worked.
The Lost Time Injury Frequency Rate (LTIFR) decreased by 22 per cent for a result of 2.9 which was better than the target of 3.2.
The number of reported Lost Time Injuries (LTIs) has steadily decreased over the last 12 months and is 17 per cent lower when compared to the previous year.
SO 1b. Set a construction Safety LTIFR of 0.1 per 200,000 hours worked.
The construction contractor 12-month rolling LTIFR is 0.18, which is above the target of 0.10 but below the Ontario construction rate group average of 1.13 and Ontario General Contractors Association Members average of 0.36. The on-site construction LTIFR saw a declining trend in the first half of the fiscal year, landing under the target rate between July and September 2019. Three LTIs between September and October 2019 skewed the rate upwards to above benchmark. Because of the 12- month rolling rate, the impact of these LTIs continues throughout the end of Q4, although the rate has stabilized just above benchmark due to a recent increase in the number of reported hours.
SO 2. Reduce Train Operating Rule Violations Train Operating Rule Violations
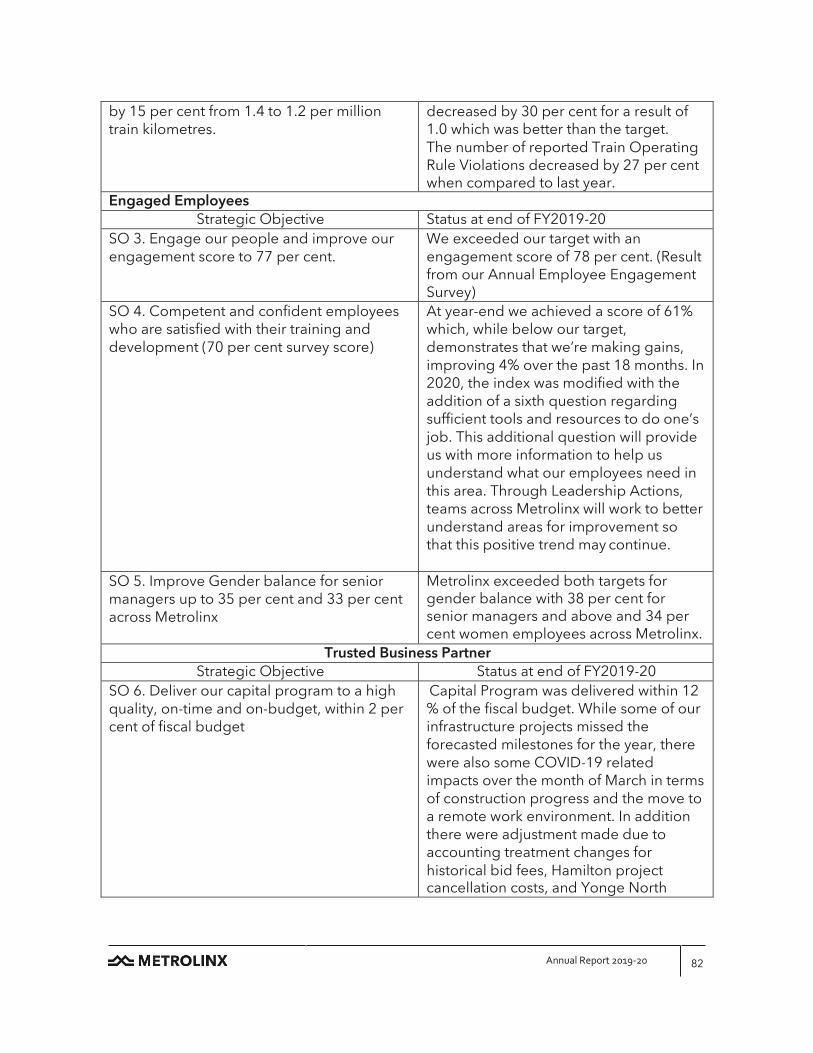
Annual Report 2019-20
82
by 15 per cent from 1.4 to 1.2 per million train kilometres.
decreased by 30 per cent for a result of 1.0 which was better than the target. The number of reported Train Operating Rule Violations decreased by 27 per cent when compared to last year.
Engaged Employees Strategic Objective Status at end of FY2019-20
SO 3. Engage our people and improve our engagement score to 77 per cent.
We exceeded our target with an engagement score of 78 per cent. (Result from our Annual Employee Engagement Survey)
SO 4. Competent and confident employees who are satisfied with their training and development (70 per cent survey score)
At year-end we achieved a score of 61% which, while below our target, demonstrates that we’re making gains, improving 4% over the past 18 months. In 2020, the index was modified with the addition of a sixth question regarding sufficient tools and resources to do one’s job. This additional question will provide us with more information to help us understand what our employees need in this area. Through Leadership Actions, teams across Metrolinx will work to better understand areas for improvement so that this positive trend may continue.
SO 5. Improve Gender balance for senior managers up to 35 per cent and 33 per cent across Metrolinx
Metrolinx exceeded both targets for gender balance with 38 per cent for senior managers and above and 34 per cent women employees across Metrolinx.
Trusted Business Partner Strategic Objective Status at end of FY2019-20
SO 6. Deliver our capital program to a high quality, on-time and on-budget, within 2 per cent of fiscal budget
Capital Program was delivered within 12 % of the fiscal budget. While some of our infrastructure projects missed the forecasted milestones for the year, there were also some COVID-19 related impacts over the month of March in terms of construction progress and the move to a remote work environment. In addition there were adjustment made due to accounting treatment changes for historical bid fees, Hamilton project cancellation costs, and Yonge North

Annual Report 2019-20
83
Subway costs prior Metrolinx assuming control of the subways project.
SO 7. Reduce the planned subsidy requirement by $149M, a 32 per cent decrease
Based on the Q3 forecast for 2019-20, Metrolinx was on path to achieve the target. At the end of Q3, the planned subsidy requirement for 2019-20 was forecast to be $341M, delivering $129M of the target decrease when compared to base approval for the year. However, COVID-19 has resulted in a significant decline in ridership and resulting decline in revenues of $32M, and lower proceeds from asset sales of $35M due to a delay in property sales, also due to COVID-19. This decrease in revenue and property sales along with additional costs due to capital adjustments and procurement bid fees due to accounting policy changes reduced the original planned subsidy requirement by $49M.
SO 8. Increase revenue and proceeds from asset sale
• fare revenue by $61M • non-fare revenue by $18M • Transit Oriented Communities
(TOC) proceeds from asset sales by $40M
Based on Q3 Forecast for 2019-20, Metrolinx was on path to achieve the SO: Prior to COVID-19, total revenue and TOC proceeds from asset sale was forecast to be $3M over budget. The surplus at Q3 forecast was a combination of shortfall in fare revenue, offset by increase in non-fare revenue and proceeds from asset sale. However, due to COVID-19, the total revenue and proceeds from asset sale reduced by $67M to end the year $64M under budget. The shortfall is mainly due to approximately 95% decline in ridership since mid-March, as well as a delay in the closing of a major property sale due to COVID-19, resulting in TOC revenue of $22.8M or $17.2M below the target of $40M.
SO 9. Reduce our operational costs by $30M Based on the Q3 forecast for 2019-20,

Annual Report 2019-20
84
and further $20M stretch Metrolinx was on path to achieve the target. Prior to COVID-19, operational expenses were forecast to achieve $33M in reductions in 2019-20 when compared to base approval for the year. Various in- year expense pressures were offset with savings and robust expense management, resulting in maintaining a consistent expense forecast throughout the year. Savings were also found across the board, mainly driven by Operations and PRESTO. However, these operational reductions have been offset by additional costs due to capital adjustments and procurements bid fees due to accounting policy changes. As a result, Metrolinx total costs have exceeded the overall target.
SO 10. Establish a fact-based, prioritized project pipeline with municipalities and the province
Published the Business Case Guidance which has increased rigor in development of business cases and the analysis to support decision-making. Prioritization Framework developed and applied in coordination with municipalities and MTO. Framework endorsed by Metrolinx Board on February 20, 2020.
SO 11. Engage our communities and stakeholders and achieve positive impression scores of 70 per cent and 65 per cent
In the summer of 2019, our research partner Ipsos fielded a Corporate Reputation study. Metrolinx realized a 76 per cent net positive impression score among our communities, far exceeding the 70 per cent target. In May 2019, the first of two planned annual surveys to understand stakeholder impressions of Metrolinx was completed with Metrolinx realizing a total positive impression score of 59 per cent, a 5 per cent increase from 2018. Continuous improvement programming launched in June 2019 continues to deliver progress toward the 2019-2020 objective of 65 per cent positive impression. However, the second
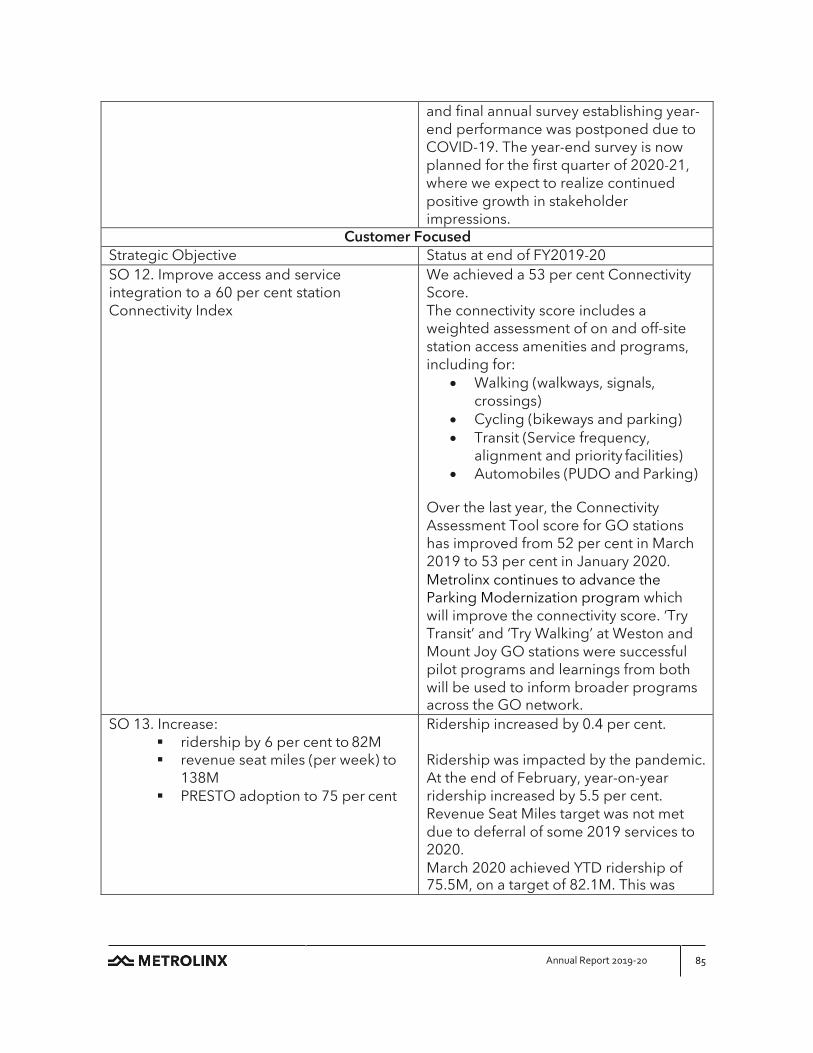
Annual Report 2019-20
85
and final annual survey establishing year- end performance was postponed due to COVID-19. The year-end survey is now planned for the first quarter of 2020-21, where we expect to realize continued positive growth in stakeholder impressions.
Customer Focused Strategic Objective Status at end of FY2019-20 SO 12. Improve access and service integration to a 60 per cent station Connectivity Index
We achieved a 53 per cent Connectivity Score. The connectivity score includes a weighted assessment of on and off-site station access amenities and programs, including for:
• Walking (walkways, signals, crossings)
• Cycling (bikeways and parking) • Transit (Service frequency,
alignment and priority facilities) • Automobiles (PUDO and Parking)
Over the last year, the Connectivity Assessment Tool score for GO stations has improved from 52 per cent in March 2019 to 53 per cent in January 2020. Metrolinx continues to advance the Parking Modernization program which will improve the connectivity score. ‘Try Transit’ and ‘Try Walking’ at Weston and Mount Joy GO stations were successful pilot programs and learnings from both will be used to inform broader programs across the GO network.
SO 13. Increase: ridership by 6 per cent to 82M revenue seat miles (per week) to
138M PRESTO adoption to 75 per cent
Ridership increased by 0.4 per cent.
Ridership was impacted by the pandemic. At the end of February, year-on-year ridership increased by 5.5 per cent. Revenue Seat Miles target was not met due to deferral of some 2019 services to 2020. March 2020 achieved YTD ridership of 75.5M, on a target of 82.1M. This was

Annual Report 2019-20
86
impacted in mid-March by COVID-19, with March 2020 ridership down 52.6 per cent, and services reduced by approximately 55 per cent. PRESTO’s adoption rate at the end of January was almost 71 per cent and was on track for 74.4 per cent by the fiscal year end. Ridership dropped sharply in March due to COVID-19.
SO 14. Deliver On-Time Performance of: 95 per cent for GO Rail 96 per cent for GO Bus 97 per cent for UP and payment equipment
availability of 99.5 per cent for PRESTO
Our on-time performance results were as follows: GO Rail– 93.2 per cent GO Bus - 94.9 per cent UP – 97 per cent PRESTO equipment reliability measured 99.5 per cent for February, 2020 (TTC only - reporting to be expanded to other agencies in FY20-21) There were a number of causal factors that contributed to our year finishing slightly below target for GO Rail and Bus, including Rail Traffic Control errors on rail, fleet performance issues for both bus and rail and switch and signal reliability because of aging infrastructure on the rail corridors. Performance was improved over the previous year through a number of initiatives implemented across Operations to address root cause issues, resulting in performance at target during the final quarter of the year.
SO 15. Deliver Customer Satisfaction for all the brands that are externally focused,
78 per cent for GO 87 per cent for UP 81 per cent for PRESTO,
to give an aggregate score of 82 per cent
Improvements in year-on-year on time performance, customer communications enhancements and consistent action planning supported gains for GO and UP Express. At the end of the fiscal year, our customer satisfaction score for GO was 79 per cent while UP recorded 90 per cent.
The customer satisfaction for PRESTO remained below the 81 per cent target. We ended the year with a score of 73 per cent. A number of actions were implemented and will continue into the

Annual Report 2019-20
87
next fiscal year to achieve our target. These include further improvements to communications and issue resolution, as well as web and mobile app improvements. Device reliability has already reached the targeted increase, which is expected to improve satisfaction scores.
We achieved 81 per cent aggregate across all 3 brands. Our target was 82 per cent.
Appendix B – Metrolinx GRI Report As part of the Metrolinx Sustainability Strategy (2015-2020), Metrolinx has committed to monitoring and reporting on its performance as a trusted and transparent organization. This commitment includes publicly reporting on its performance in achieving the goals articulated in the inaugural Sustainability Strategy.
The following report has been developed in accordance with the Global Reporting Initiative (GRI) framework. The GRI framework is the most widely-adopted sustainability reporting framework globally. GRI is also a United Nations-sanctioned framework that enables entities to manage and report on their Environmental, Social and Governance (ESG) impacts, mitigating risk, building trust, and publicizing successful initiatives.
For the second time in its history, Metrolinx has published its sustainability performance, using the GRI framework in the 2019-2020 Annual Report, to provide greater transparency to our stakeholders in how we operate as a Provincial agency. This is also the second consecutive year that Metrolinx has attained third-party limited assurance on our Scope 1 and Scope 2 greenhouse gas (GHG) emissions and our total criteria air contaminant (CAC) emissions by PricewaterhouseCoopers LLP (PwC). The benefits of obtaining limited assurance on GHG and CAC emissions include improving internal processes, identifying opportunities for emissions reductions and cost savings, and improving the reliability of data. The results of PwC's limited assurance engagement are documented in an assurance statement, which follows this introduction. This GRI report also demonstrates how the sustainability aspects we are reporting on are aligned with the United Nations Sustainable Development Goals (UN SDGs).

PricewaterhouseCoopers LLP 250 Howe Street, Suite 1400, Vancouver, British Columbia V6C 3S7 T: +1 604 806 7000, F: +1 604 806 7806 “PwC” refers to PricewaterhouseCoopers LLP, an Ontario limited liability partnership.
Independent practitioner’s limited assurance report on the selected information in Metrolinx’s Sustainability Report 2019-20
To the Board of Directors and Management of Metrolinx We have undertaken a limited assurance engagement of select key performance indicators (the Reported Emissions) of Metrolinx during the year ended March 31, 2019. This engagement was conducted by a multidisciplinary team including assurance practitioners, and individuals with environmental experience.
The Reported Emissions
Performance measure FY 2018-19 Global Reporting Initiative (GRI) report table reference*
Direct (Scope 1) GHG emissions 269,139 tCO2e GRI 305-1
Energy indirect (Scope 2) GHG emissions 2,464 tCO2e GRI 305-2
Total Criteria Air Contaminants (CAC) emission
2,332,755 Kg GRI 305-7
* Metrolinx have disclosed the basis of preparation for each of their selected Performance Measures within the body of the
Sustainability Report. The GRI table references refer the reader to where definitions can be found.
Management’s responsibility Management is responsible for preparation of the Reported Emissions in accordance with the Metrolinx internal criteria outlined in GRI report table reference (the criteria). Management is also responsible for such internal control as management determines necessary to enable the preparation of the Reported Emissions that is free from material misstatement.
Our responsibility Our responsibility is to express limited assurance conclusion on the Reported Emissions based on the evidence we have obtained. We conducted our limited assurance engagement in accordance with the Canadian Standard on Assurance Engagements (CSAE) 3000, Attestation Engagements Other than Audit or Reviews of Historical Financial Information and CSAE 3410, Assurance Engagements on Greenhouse Gas Statements. This standard requires us to conclude whether anything has come to our attention that causes us to believe that the Reported Emissions are not fairly stated, in all material respects.
A limited assurance engagement involves performing procedures (primarily consisting of making inquiries of management and other within the entity, as appropriate, and applying analytical procedures) and evaluating the evidence obtained. The procedures are selected based on our professional judgment, which includes identifying areas where the risks of material misstatement in preparing the Reported Emissions in accordance with the criteria are likely to arise.
The procedures performed in a limited assurance engagement vary in nature and timing from, and are less in extent than for a reasonable assurance engagement and, consequently, the level of assurance

2 | Page
obtained is substantially lower than the assurance that would have been obtained had a reasonable assurance engagement been performed.
Our independence and quality control We have complied with the relevant rules of professional conduct/code of ethics applicable to the practice of public accounting and related to assurance engagements, issued by various professional accounting bodies, which are founded on fundamental principles of integrity, objectivity, professional competence and due care, confidentiality and professional behavior.
The firm applies Canadian Standard on Quality Control 1, Quality Control for Firms that Perform Audits and Reviews of Financial Statements, and Other Assurance Engagements and, accordingly, maintains a comprehensive system of quality control, including documented policies and procedures regarding compliance with ethical requirements, professional standards and applicable legal and regulatory requirements.
Conclusion Based on the procedures we have performed and the evidence we have obtained, nothing has come to our attention that causes us to believe that Metrolinx’s Reported Emissions prepared in accordance with the criteria during the year ended March 31, 2019, is not fairly stated, in all material respects.
Purpose of statement and restriction of use and distribution The Reported Emissions has been prepared to assist the Board of Directors and Management of in reporting on the organization’s sustainability performance and activities. As a result, the Reported Emissions may not be suitable for another purpose. Our report is intended solely for Metrolinx and their Board of Directors, in accordance with the terms of our engagement, and should not be distributed to or used by parties other than Metrolinx and their Board of Directors.
Chartered Professional Accountants
Vancouver, British Columbia June 18, 2020

Metrolinx Sustainability Report 2019-2020 Global Reporting Initiative framework
3
Global Reporting Initiative report
Disclosure Disclosure Response Related United Nations SDGs
General Disclosures 102-1 Name of the
Organization Metrolinx N/A
102-2 Activities, Brands, Products and Services
In 2019-2020 we committed to delivering on several key goals. Primary among those achieved are: We implemented various fare changes in 19/20, including reducing fares for short distance trips (10km or less), introducing Kids GO Free (kids travel free on GO), and an e-ticketing Sunday Funday promotion ($10 unlimited travel on Sundays). Reducing fares on short distance trips and Kids GO Free resulted in incremental weekend boardings. Boardings increased 13% (and 22% on weekends) because of the lower fare for short trips close to Union and Kids GO Free. 15,000 Sunday Funday passes have been sold since being implemented in December, increasing Sunday e-tickets sales by 40%. E-tickets were offered for customers GO since July, with over 180K tickets sold. For more details, please consult the Metrolinx Annual Report 2019-2020.
• Goal 9: Industry, Innovation and Infrastructure • Goal 11: Sustainable Cities and Communities
102-3 Location of Headquarters
Toronto, Ontario N/A
102-4 Location of Operations
Metrolinx operates in Ontario, Canada.
102-5 Ownership and Legal Form
Refer to Report section: Our Mandate (Page 7).
102-6 Markets Served Transit and Operations Map: https://www.gotransit.com/en/trip-planning/system-and-route-map
Goal 11: Sustainable Cities and Communities
102-7 Scale of the Organization
Refer to Report section: Financial Highlights & Business Plan Report (Page 9).
Goal 8: Decent Work and Economic Growth
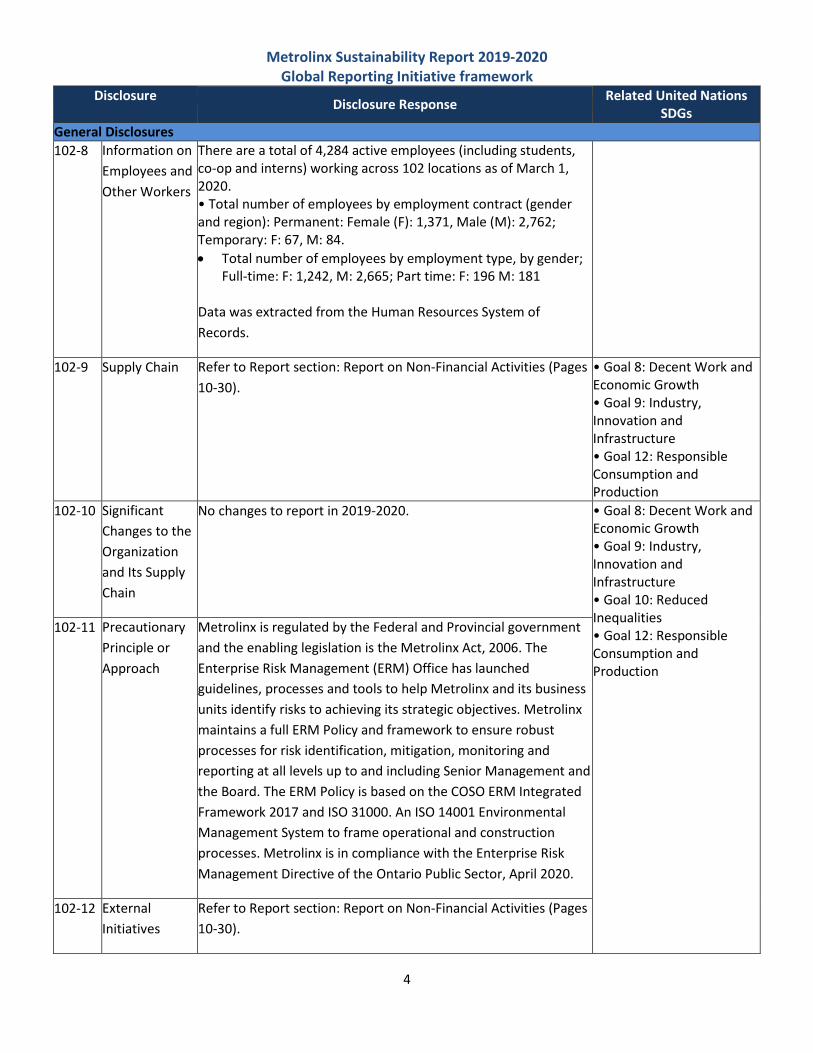
Metrolinx Sustainability Report 2019-2020 Global Reporting Initiative framework
4
Disclosure Disclosure Response Related United Nations SDGs
General Disclosures 102-8 Information on
Employees and Other Workers
There are a total of 4,284 active employees (including students, co-op and interns) working across 102 locations as of March 1, 2020. • Total number of employees by employment contract (gender and region): Permanent: Female (F): 1,371, Male (M): 2,762; Temporary: F: 67, M: 84. • Total number of employees by employment type, by gender;
Full-time: F: 1,242, M: 2,665; Part time: F: 196 M: 181
Data was extracted from the Human Resources System of Records.
102-9 Supply Chain Refer to Report section: Report on Non-Financial Activities (Pages 10-30).
• Goal 8: Decent Work and Economic Growth • Goal 9: Industry, Innovation and Infrastructure • Goal 12: Responsible Consumption and Production
102-10 Significant Changes to the Organization and Its Supply Chain
No changes to report in 2019-2020. • Goal 8: Decent Work and Economic Growth • Goal 9: Industry, Innovation and Infrastructure • Goal 10: Reduced Inequalities • Goal 12: Responsible Consumption and Production
102-11 Precautionary Principle or Approach
Metrolinx is regulated by the Federal and Provincial government and the enabling legislation is the Metrolinx Act, 2006. The Enterprise Risk Management (ERM) Office has launched guidelines, processes and tools to help Metrolinx and its business units identify risks to achieving its strategic objectives. Metrolinx maintains a full ERM Policy and framework to ensure robust processes for risk identification, mitigation, monitoring and reporting at all levels up to and including Senior Management and the Board. The ERM Policy is based on the COSO ERM Integrated Framework 2017 and ISO 31000. An ISO 14001 Environmental Management System to frame operational and construction processes. Metrolinx is in compliance with the Enterprise Risk Management Directive of the Ontario Public Sector, April 2020.
102-12 External Initiatives
Refer to Report section: Report on Non-Financial Activities (Pages 10-30).

Metrolinx Sustainability Report 2019-2020 Global Reporting Initiative framework
5
Disclosure Disclosure Response Related United Nations SDGs
General Disclosures 102-13 Membership of
Associations Metrolinx's list of active memberships is continuously evolving and we are able to share a list of currently active memberships upon request.
• Goal 17: Partnership for the Goals
102-14 Statement from Senior Decision-Maker
Refer to Report section: Message from the CEO (Page 5). • Goal 8: Decent Work and Economic Growth • Goal 9: Industry, Innovation and Infrastructure • Goal 11: Sustainable Cities and Communities
102-16 Values, Principles, Standards and Norms of Behaviour
http://www.metrolinx.com/en/aboutus/metrolinxoverview/metrolinx_overview.aspx
• Goal 11: Sustainable Cities and Communities • Goal 12: Responsible Consumption and Production • Goal 16: Peace, Justice and Strong Institutions
102-18 Governance Structure
http://www.metrolinx.com/en/aboutus/board/board_of_directors_bios.aspx
• Goal 8: Decent Work and Economic Growth • Goal 9: Industry, Innovation and Infrastructure • Goal 12: Responsible Consumption and Production • Goal 16: Peace, Justice and Strong Institutions
102-40 List of Stakeholder Groups
Main stakeholder categories: Metrolinx Executive Management, Metrolinx People Leaders/Process Managers, Federal/Provincial Government, Customer (External Advisory Committee), Customer (PRESTO), Customer (GO Transit), Suppliers/Vendors, Local Transit Agencies, Non-Government Organizations, Industry or Professional Associations, and Academics.
102-41 Collective Bargaining Agreements
Percentage of total employees covered by collective bargaining agreements: 51.77% in 2 unions: Amalgamated Transit Union (ATU) Local 1587 and International Association of Machinists & Aerospace Workers (IAM) Local 235.
• Goal 8: Decent Work and Economic Growth • Goal 10: Reduced Inequalities • Goal 12: Responsible Consumption and Production
102-42 Identifying and Selecting Stakeholders
Metrolinx stakeholders are diverse and dependent on the division engaging and the topic being engaged upon. Broadly speaking, all Metrolinx stakeholders are identified based on their location within the Metrolinx mandate area as per latest legislative requirements.
Goal 17: Partnerships for the Goals

Metrolinx Sustainability Report 2019-2020 Global Reporting Initiative framework
6
Disclosure Disclosure Response Related United Nations SDGs
General Disclosures 102-43 Approach to
Stakeholder Engagement
Engagement with elected and non-elected stakeholders consists of but is not limited to engagement in the form of community meetings, regional collaboration forums, speaking engagements, elected official briefings, municipal meetings, Council presentations, public town hall meetings, door-to-door neighbourhood engagement, material distribution, content partnerships, e-newsletters and digital engagement. The frequency of engagement depends on the forum, topic, and stakeholder, and in some cases is defined in a Terms of Reference document.
102-44 Key Topics and Concerns Raised
Stakeholder engagement is primarily focussed on existing operations, initiatives, service, current construction, and future projects within the Metrolinx. Key topics and concerns are addressed through meeting summaries, reports, briefing notes, action items, and KPIs. Elected and non-elected officials in municipalities and transit agencies are key stakeholder groups.
102-45 Entities Included in Consolidated Financial Statements
Refer to Report section: Financial Statements – Related Party Disclosures and Transactions and Balances (Page 33).
• Goal 8: Decent Work and Economic Growth • Goal 17: Partnerships for the Goals
102-46 Defining Report Content and Topic Boundaries
As a leading transit organization, Metrolinx engages stakeholders on a broad range of issues to improve performance and help shape strategic initiatives. In September 2019, Metrolinx engaged an independent firm to conduct an engagement exercise of both internal and external stakeholders. The objective of the engagement was to understand how stakeholders perceive Metrolinx in the context of social, environmental and economic topics and prioritize, by opinion, which topics should most influence decisions at Metrolinx.
Goal 17: Partnerships for the Goals

Metrolinx Sustainability Report 2019-2020 Global Reporting Initiative framework
7
Disclosure Disclosure Response Related United Nations SDGs
General Disclosures 102-47 List of Material
Topics Issues of high importance according stakeholders in the 2019 Materiality Matrix: • Health and safety programs workplace injury and illness reduction • Connection of new transit projects to high density homes and businesses • Prioritizing long-term benefits when making financial decisions • Upgrading infrastructure in ways that are environmentally sustainable and which will stand up to extreme weather • Requesting specific sustainability criteria when buying goods and services • Making investment decisions while considering environmental and social impacts • Considering environmental, social and economic criteria when planning and designing projects • Ensure service is reliable and on time • Being transparent and accountable to Ontario taxpayers • Choosing suppliers based on environmental practices • Reducing greenhouse gas emissions • Ensuring key destinations can be reached by transit, walking and cycling • Using alternative fuels in our fleet (e.g. biofuels, electricity) • Applying fair hiring and promotions practices
• Goal 8: Decent Work and Economic Growth • Goal 9: Industry, Innovation and Infrastructure • Goal 10: Reduced Inequalities • Goal 11: Sustainable Cities and Communities • Goal 12: Responsible Consumption and Production • Goal 13: Climate Action • Goal 14: Life Below Water • Goal 15: Life on Land • Goal 16: Peace, Justice and Strong Institutions • Goal 17: Partnerships for the Goals
102-48 Restatements of Information
No material restatements provided. N/A
102-49 Changes in Reporting
No changes in reporting boundary and material topic since the previous Metrolinx Annual Report 2018-2019.
102-50 Reporting Period
The Metrolinx 2019-2020 Annual Report details information and data in fiscal years 2019 (FY2019) and 2020 (FY2020), which ran from April 1, 2019- March 31, 2020.
102-51 Date of Most Recent Report
Prior to this report, the most recent Annual Report followed the GRI framework covering activities leading up to March 31, 2019.
102-52 Reporting Cycle We issue our GRI Report on an annual basis.
102-53 Contact Point for Questions Regarding the Report
For feedback, questions or additional information about this report please contact us at 416-874-5900.

Metrolinx Sustainability Report 2019-2020 Global Reporting Initiative framework
8
Disclosure Disclosure Response Related United Nations SDGs
General Disclosures 102-54 Claims of
Reporting in accordance with GRI
This report has been prepared in accordance with the GRI Standards: Core option.
102-55 GRI Content Index
This document is organized by GRI indicators and serves as our GRI Content Index with the inclusion of corresponding United Nations Sustainable Development Goals. Please see this website for reference: https://www.un.org/sustainabledevelopment/
102-56 External Assurance
This GRI Index is self-declared. External assurance has been obtained this year for Scope 1 and Scope 2 Greenhouse Gas Emissions and total CAC emissions for the FY 2018-2019 in the Environmental Management sub-section. Please see PwC’s limited assurance statement on pages 89-90.
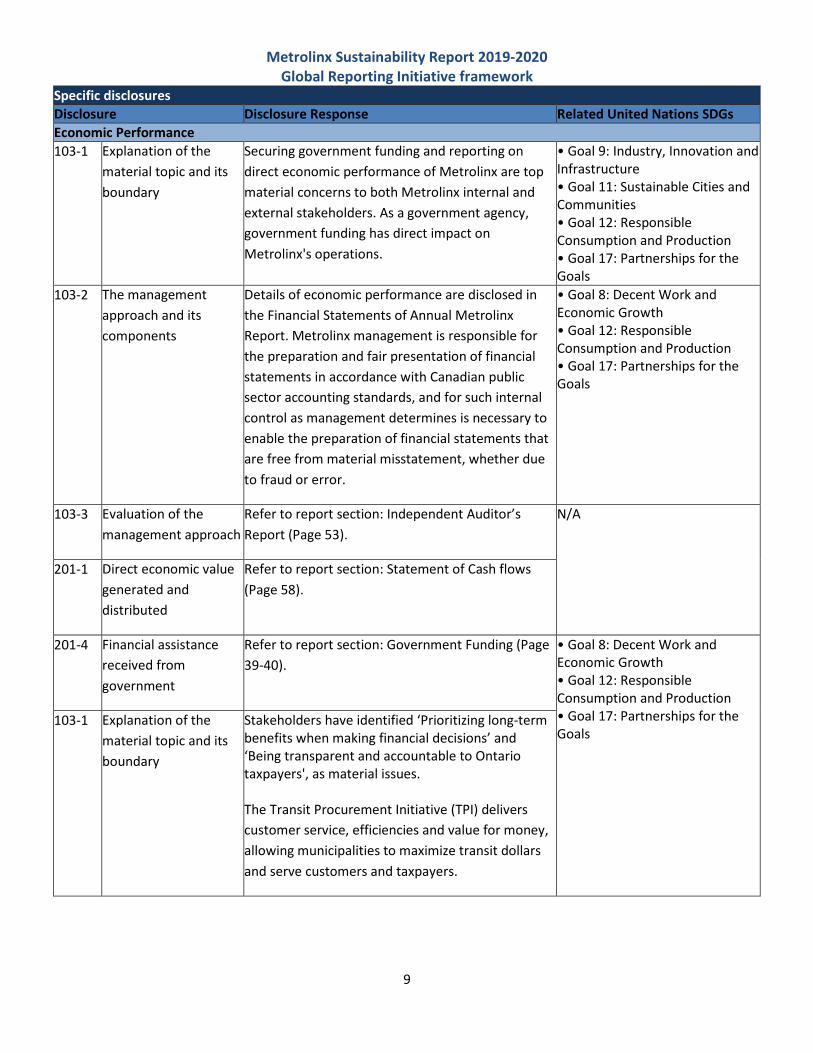
Metrolinx Sustainability Report 2019-2020 Global Reporting Initiative framework
9
Specific disclosures Disclosure Disclosure Response Related United Nations SDGs Economic Performance 103-1 Explanation of the
material topic and its boundary
Securing government funding and reporting on direct economic performance of Metrolinx are top material concerns to both Metrolinx internal and external stakeholders. As a government agency, government funding has direct impact on Metrolinx's operations.
• Goal 9: Industry, Innovation and Infrastructure • Goal 11: Sustainable Cities and Communities • Goal 12: Responsible Consumption and Production • Goal 17: Partnerships for the Goals
103-2 The management approach and its components
Details of economic performance are disclosed in the Financial Statements of Annual Metrolinx Report. Metrolinx management is responsible for the preparation and fair presentation of financial statements in accordance with Canadian public sector accounting standards, and for such internal control as management determines is necessary to enable the preparation of financial statements that are free from material misstatement, whether due to fraud or error.
• Goal 8: Decent Work and Economic Growth • Goal 12: Responsible Consumption and Production • Goal 17: Partnerships for the Goals
103-3 Evaluation of the management approach
Refer to report section: Independent Auditor’s Report (Page 53).
N/A
201-1 Direct economic value generated and distributed
Refer to report section: Statement of Cash flows (Page 58).
201-4 Financial assistance received from government
Refer to report section: Government Funding (Page 39-40).
• Goal 8: Decent Work and Economic Growth • Goal 12: Responsible Consumption and Production • Goal 17: Partnerships for the Goals
103-1 Explanation of the material topic and its boundary
Stakeholders have identified ‘Prioritizing long-term benefits when making financial decisions’ and ‘Being transparent and accountable to Ontario taxpayers', as material issues. The Transit Procurement Initiative (TPI) delivers customer service, efficiencies and value for money, allowing municipalities to maximize transit dollars and serve customers and taxpayers.
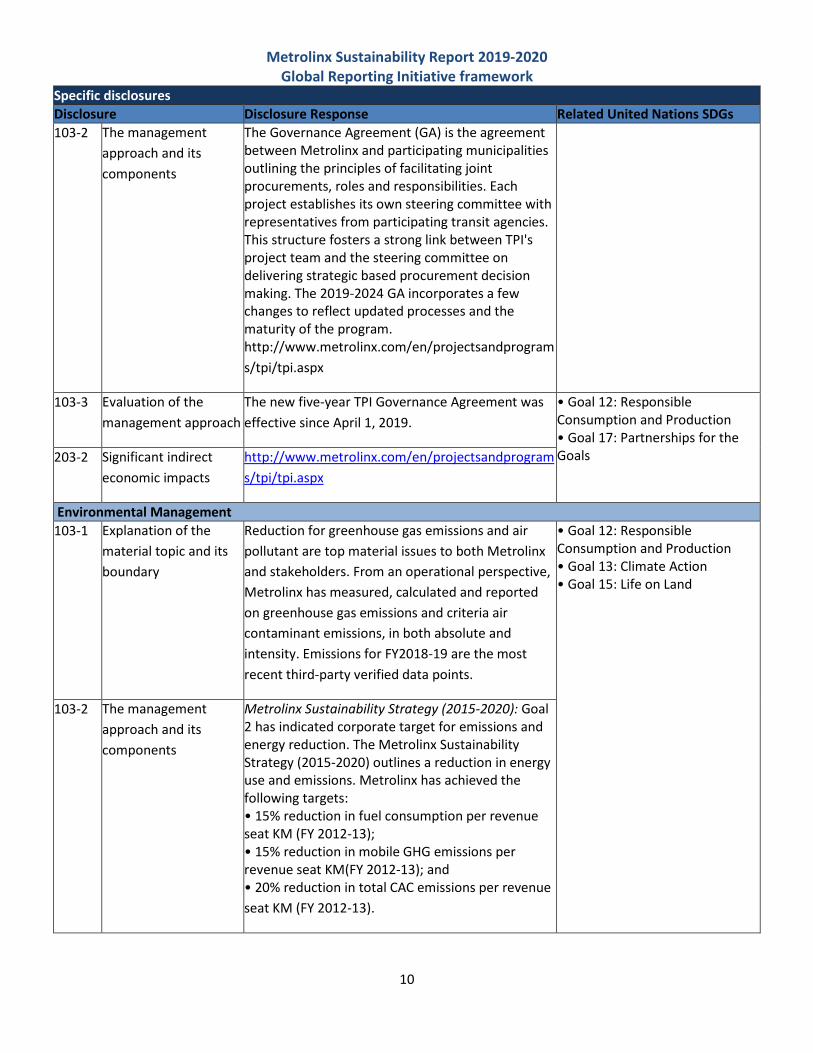
Metrolinx Sustainability Report 2019-2020 Global Reporting Initiative framework
10
Specific disclosures Disclosure Disclosure Response Related United Nations SDGs 103-2 The management
approach and its components
The Governance Agreement (GA) is the agreement between Metrolinx and participating municipalities outlining the principles of facilitating joint procurements, roles and responsibilities. Each project establishes its own steering committee with representatives from participating transit agencies. This structure fosters a strong link between TPI's project team and the steering committee on delivering strategic based procurement decision making. The 2019-2024 GA incorporates a few changes to reflect updated processes and the maturity of the program. http://www.metrolinx.com/en/projectsandprograms/tpi/tpi.aspx
103-3 Evaluation of the management approach
The new five-year TPI Governance Agreement was effective since April 1, 2019.
• Goal 12: Responsible Consumption and Production • Goal 17: Partnerships for the Goals 203-2 Significant indirect
economic impacts http://www.metrolinx.com/en/projectsandprograms/tpi/tpi.aspx
Environmental Management 103-1 Explanation of the
material topic and its boundary
Reduction for greenhouse gas emissions and air pollutant are top material issues to both Metrolinx and stakeholders. From an operational perspective, Metrolinx has measured, calculated and reported on greenhouse gas emissions and criteria air contaminant emissions, in both absolute and intensity. Emissions for FY2018-19 are the most recent third-party verified data points.
• Goal 12: Responsible Consumption and Production • Goal 13: Climate Action • Goal 15: Life on Land
103-2 The management approach and its components
Metrolinx Sustainability Strategy (2015-2020): Goal 2 has indicated corporate target for emissions and energy reduction. The Metrolinx Sustainability Strategy (2015-2020) outlines a reduction in energy use and emissions. Metrolinx has achieved the following targets: • 15% reduction in fuel consumption per revenue seat KM (FY 2012-13); • 15% reduction in mobile GHG emissions per revenue seat KM(FY 2012-13); and • 20% reduction in total CAC emissions per revenue seat KM (FY 2012-13).

Metrolinx Sustainability Report 2019-2020 Global Reporting Initiative framework
11
Specific disclosures Disclosure Disclosure Response Related United Nations SDGs 103-3 Evaluation of the
management approach As a leading transit organization, Metrolinx actively engages its stakeholders on a broad range of issues to improve performance and help shape strategic initiatives. In order to inform the sustainability framework, Metrolinx has determined that including stakeholder perspectives should be an important consideration, as prescribed by leading sustainability standards and industry best practices. In June 2014 and again in October 2019, Metrolinx engaged a consultant to conduct a robust engagement exercise of both internal and external stakeholders. The objective of the engagement was to understand how stakeholders perceive Metrolinx in the context of sustainability within the organization, strategic challenges, themes and topics that most influence decisions, and the benefits and challenges of embedding sustainability within the organization. Metrolinx defines materiality as the topics or key issues that reflect our organizations’ most significant governance and business conduct, fiscal, environmental, and social impacts as determined by key internal and external stakeholders.

Metrolinx Sustainability Report 2019-2020 Global Reporting Initiative framework
12
Specific disclosures Disclosure Disclosure Response Related United Nations SDGs 305-1 Direct (Scope 1) GHG
emissions FY 2018-19 Emissions. Gross direct Scope 1 emissions: 269,139 tCO2e. • Base year for the calculation: Fiscal April 1, 2012 - March 31, 2013 • The rationale for choosing it: first year with full data sets • Significant changes in emissions: No recalculations done. Increase in absolute Scope 1 emissions is due to increase in service in GO Train, GO Bus, new stations, and operation of UP Express starting in FY 2016-17. • Source of emission factors: The GHG emission factors are obtained from the National Inventory Report, and CAC emission factors are obtained from RailCan or the GHGenius Database. For stations and maintenance facilities, GHG emissions from purchased electricity and natural gas consumption were calculated using emission factors from the National Inventory Report. • Source of Global warming potential (GWP): IPCC AR5 Chapter 8, page 22 • Consolidation approach for emissions: Operational control • Standards, methodologies, assumptions, and/or calculation tools used: Emissions are calculated in accordance with Greenhouse Gas Protocol, Corporate Accounting and Reporting Standard.
305-2 Energy indirect (Scope 2) GHG emissions
Emission reported for FY 2018-19. Gross indirect Scope 2 emissions: 2,464 tCO2e. • Base year for the calculation: Fiscal year April 1, 2012 - March 31, 2013 • Refer to 305-1 for information on gases included, rationale for choosing base year, emission factor and GWP sources, as well as methodology used.
305-7 Nitrogen oxides (NOX), sulfur oxides (SOX), and other significant air emissions
Total Criteria Air Contaminants (CAC) emission reported for FY 2018-19 as: 2,332,755Kg • Gases included in CAC calculations are VOC, CO, NOx, SOx and PM10 • Refer to 305-1 for information on gases included, rationale for choosing base year, emission factor and GWP sources, as well as methodology used. Emission Factors sourced from GHGenius version 5.0e.

Metrolinx Sustainability Report 2019-2020 Global Reporting Initiative framework
13
Specific disclosures Disclosure Disclosure Response Related United Nations SDGs 306-3 Significant spills Total number of incidents in 2019 Calendar year: 16.
All reported to the Ministry of Environment, Conservation and Parks and often to local municipalities. Any spills to pavement were remediated.
• Goal 12: Responsible Consumption and Production • Goal 13: Climate Action • Goal 14: Life Below Water • Goal 15: Life on Land
Social Management 103-1 Explanation of the
material topic and its boundary
Metrolinx recognizes that major transit infrastructure investments should also provide benefits for the communities in which it works, and we are committed to providing employment, apprenticeship, and local supplier opportunities for local residents and businesses where our projects are under construction.
• Goal 8: Decent Work and Economic Growth • Goal 9: Industry, Innovation and Infrastructure • Goal 10: Reduced Inequalities • Goal 11: Sustainability Cities and Communities • Goal 12: Responsible Consumption and Production
103-2 The management approach and its components
The Crosstown will be delivered through an Alternative Financing and Procurement mechanism. A Request for Proposals has been issued and two qualified consortia are expected to bid on the project. Delivery of the community benefits program will ultimately be included as part of the final contract between Metrolinx, its procurement agent Infrastructure Ontario and the winning bidder ("ProjectCo") (jointly, the "Parties").
• Goal 8: Decent Work and Economic Growth • Goal 10: Reduced Inequalities • Goal 11: Sustainability Cities and Communities • Goal 12: Responsible Consumption and Production

Metrolinx Sustainability Report 2019-2020 Global Reporting Initiative framework
14
Specific disclosures Disclosure Disclosure Response Related United Nations SDGs 413-1 Operations with local
community engagement, impact assessments, and development programs
The Eglinton Crosstown Community Benefits Agreement commits 10% of all trade & craft working hours for apprentices, including, those who are from historically disadvantaged communities and equity-seeking groups. The project continues to support local business & Social Enterprises spending. As of March 20, 2020, the project supported Social Enterprise spending by $746,462.77, and supported local businesses by $7.5 million. 367 people in total were hired through community benefits employment.
Crosslinx Transit Solutions, on behalf of Metrolinx, is responsible for the implementation of Metrolinx Community Benefits Program through the Community Benefits Project Agreement. Currently, the Eglinton Crosstown project publishes a quarterly report on the Community Benefits & Liaison Plan and an annual report on the Community Benefits Apprentice Plan.