public deliberation summary report
TRANSCRIPT
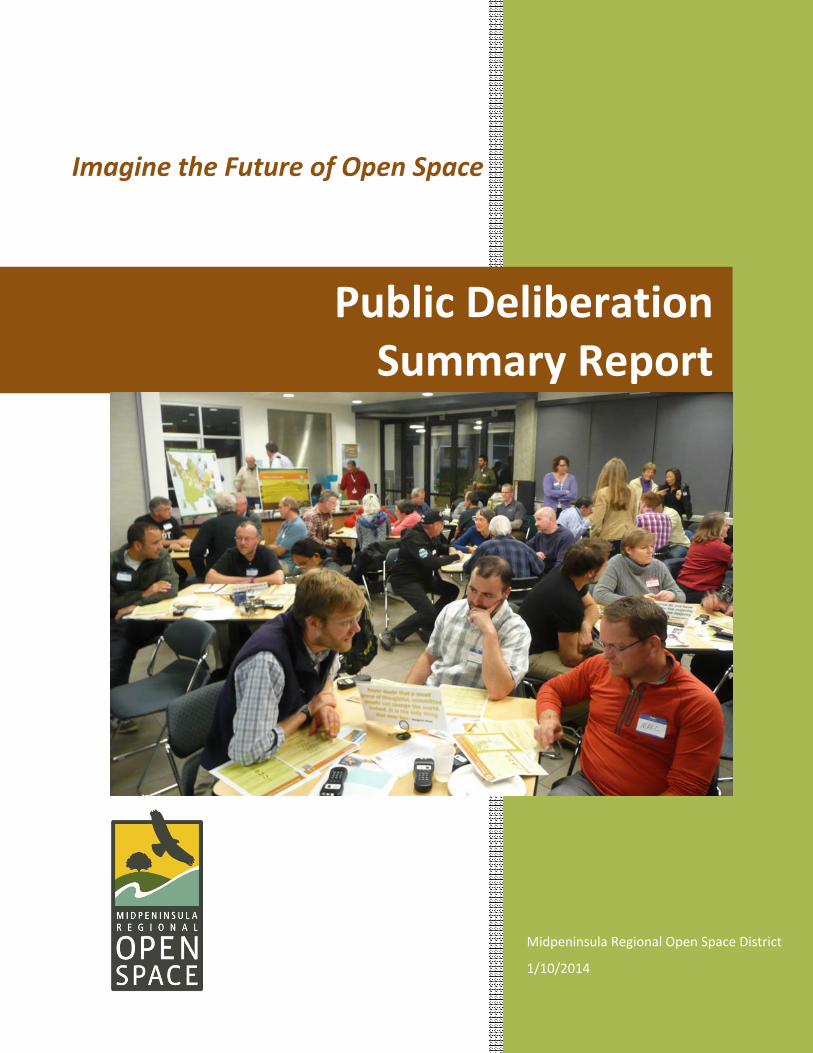
Imagine the Future of Open Space
Midpeninsula Regional Open Space District
1/10/2014
Public Deliberation Summary Report

TABLE OF CONTENTS
Introduction ................................................................................................................................................. 1
What We Did and Who We Talked To ....................................................................................................... 1
Public Outreach for Deliberation Phase .................................................................................................. 1
Public Workshops ................................................................................................................................... 2
Summary of Public Workshops: Locations, Number of Participants and Regions ........................... 2 Who We Talked To: Participant Demographics for Public Workshops ............................................. 3
Online Deliberation ................................................................................................................................. 4
Who We Talked To: Online Participant Demographics ..................................................................... 5
CAC Deliberation ................................................................................................................................... 6
Results of Public Deliberation .................................................................................................................... 7
Vision Plan Goal Results ........................................................................................................................ 7
Workshop Goal Ratings ...................................................................................................................... 7 Online Goal Ratings ............................................................................................................................ 8
Vision Plan Priority Action Results ...................................................................................................... 11
Workshop Priority Action Ratings .................................................................................................... 11 Online Priority Action Ratings ......................................................................................................... 11 CAC Priority Action Ratings ............................................................................................................ 11 Priority Action Ratings Compared to Goal Ratings ......................................................................... 12 Workshop Ratings Key ..................................................................................................................... 13
Participant-generated Goals and Actions .............................................................................................. 17
Workshop Participant Comments ......................................................................................................... 17
Workshop Participant Evaluations ........................................................................................................ 17
Next Steps ................................................................................................................................................. 18
Conclusion ................................................................................................................................................ 18
Appendices ................................................................................................................................................ 21
LIST OF TABLES Table 1: Goals Ratings ................................................................................................................................ 9 Table 2: Priority Action Ratings, by Region ............................................................................................ 14 Table 3: Priority Action ratings, by Public Workshop Ranking ............................................................... 16 Table 4: Comparison of All Ratings ......................................................................................................... 20
LIST OF APPENDICES Appendix A: Region Map Appendix B: Goals Detail Appendix C: Sample Priority Action Profiles Appendix D: Priority Action Ratings by Region: Details Appendix E: Participant Generated Goals and Priority Actions Appendix F: Workshop Participant Comments Appendix G: Workshop Evaluation Results
Report prepared by: Sandy Sommer, Senior Real Property Planner, Midpeninsula Regional Open Space District Linda Blong, Public Dialogue Consortium
Vision Plan Public Deliberation Summary Report 1
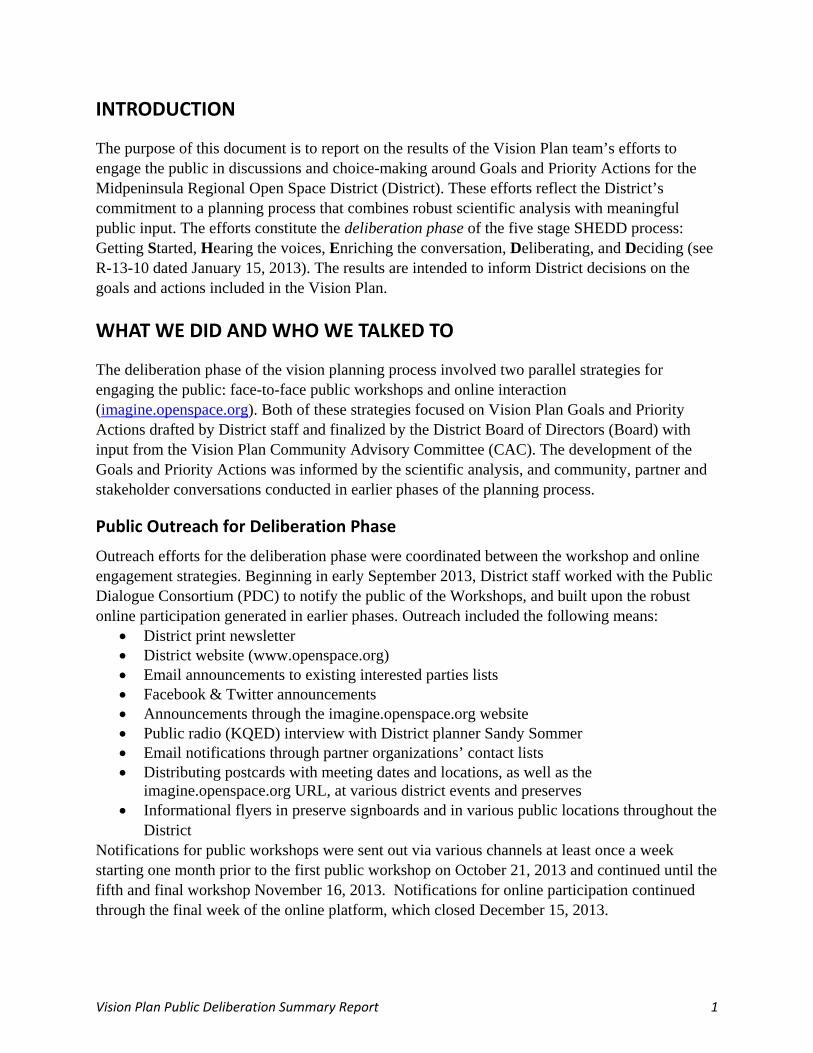
INTRODUCTION
The purpose of this document is to report on the results of the Vision Plan team’s efforts to engage the public in discussions and choice-making around Goals and Priority Actions for the Midpeninsula Regional Open Space District (District). These efforts reflect the District’s commitment to a planning process that combines robust scientific analysis with meaningful public input. The efforts constitute the deliberation phase of the five stage SHEDD process: Getting Started, Hearing the voices, Enriching the conversation, Deliberating, and Deciding (see R-13-10 dated January 15, 2013). The results are intended to inform District decisions on the goals and actions included in the Vision Plan.
WHAT WE DID AND WHO WE TALKED TO
The deliberation phase of the vision planning process involved two parallel strategies for engaging the public: face-to-face public workshops and online interaction (imagine.openspace.org). Both of these strategies focused on Vision Plan Goals and Priority Actions drafted by District staff and finalized by the District Board of Directors (Board) with input from the Vision Plan Community Advisory Committee (CAC). The development of the Goals and Priority Actions was informed by the scientific analysis, and community, partner and stakeholder conversations conducted in earlier phases of the planning process.
Public Outreach for Deliberation Phase
Outreach efforts for the deliberation phase were coordinated between the workshop and online engagement strategies. Beginning in early September 2013, District staff worked with the Public Dialogue Consortium (PDC) to notify the public of the Workshops, and built upon the robust online participation generated in earlier phases. Outreach included the following means:
District print newsletter District website (www.openspace.org) Email announcements to existing interested parties lists Facebook & Twitter announcements Announcements through the imagine.openspace.org website Public radio (KQED) interview with District planner Sandy Sommer Email notifications through partner organizations’ contact lists Distributing postcards with meeting dates and locations, as well as the
imagine.openspace.org URL, at various district events and preserves Informational flyers in preserve signboards and in various public locations throughout the
District Notifications for public workshops were sent out via various channels at least once a week starting one month prior to the first public workshop on October 21, 2013 and continued until the fifth and final workshop November 16, 2013. Notifications for online participation continued through the final week of the online platform, which closed December 15, 2013.
Vision Plan Public Deliberation Summary Report 2
Public Workshops
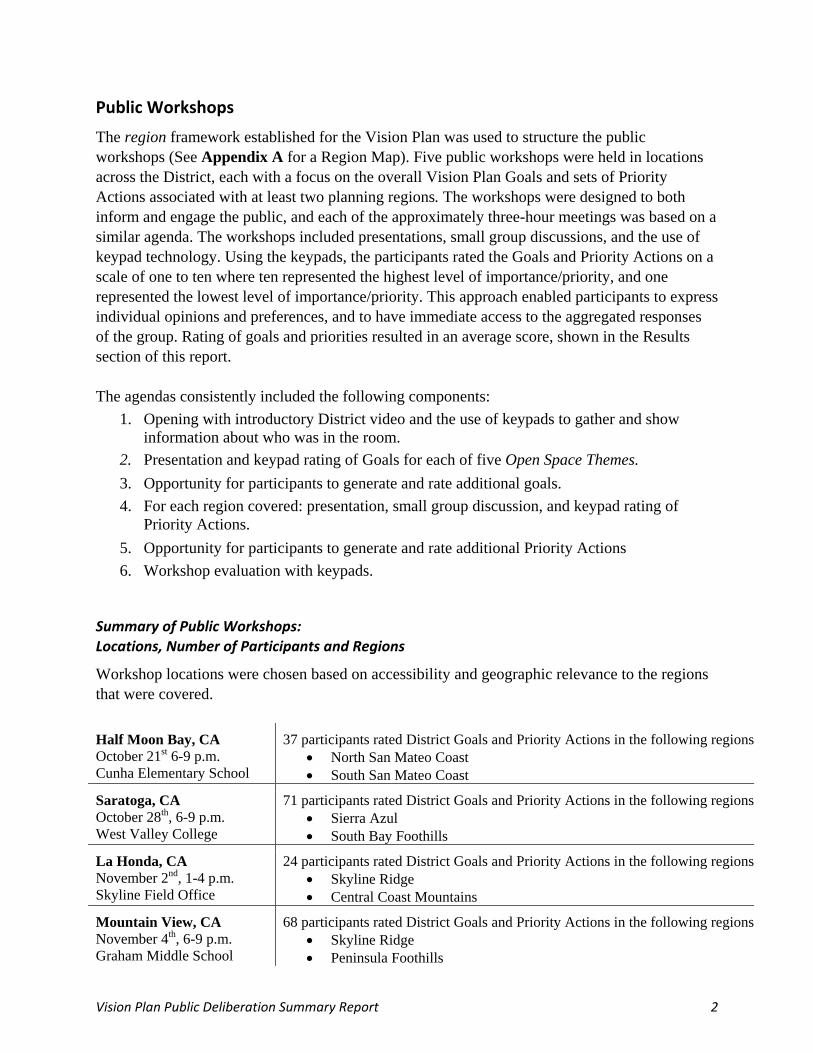
The region framework established for the Vision Plan was used to structure the public workshops (See Appendix A for a Region Map). Five public workshops were held in locations across the District, each with a focus on the overall Vision Plan Goals and sets of Priority Actions associated with at least two planning regions. The workshops were designed to both inform and engage the public, and each of the approximately three-hour meetings was based on a similar agenda. The workshops included presentations, small group discussions, and the use of keypad technology. Using the keypads, the participants rated the Goals and Priority Actions on a scale of one to ten where ten represented the highest level of importance/priority, and one represented the lowest level of importance/priority. This approach enabled participants to express individual opinions and preferences, and to have immediate access to the aggregated responses of the group. Rating of goals and priorities resulted in an average score, shown in the Results section of this report. The agendas consistently included the following components:
1. Opening with introductory District video and the use of keypads to gather and show information about who was in the room.
2. Presentation and keypad rating of Goals for each of five Open Space Themes.
3. Opportunity for participants to generate and rate additional goals.
4. For each region covered: presentation, small group discussion, and keypad rating of Priority Actions.
5. Opportunity for participants to generate and rate additional Priority Actions
6. Workshop evaluation with keypads.
Summary of Public Workshops: Locations, Number of Participants and Regions
Workshop locations were chosen based on accessibility and geographic relevance to the regions that were covered.
Half Moon Bay, CA October 21st 6-9 p.m. Cunha Elementary School
37 participants rated District Goals and Priority Actions in the following regions North San Mateo Coast South San Mateo Coast
Saratoga, CA October 28th, 6-9 p.m. West Valley College
71 participants rated District Goals and Priority Actions in the following regions Sierra Azul South Bay Foothills
La Honda, CA November 2nd, 1-4 p.m. Skyline Field Office
24 participants rated District Goals and Priority Actions in the following regions Skyline Ridge Central Coast Mountains
Mountain View, CA November 4th, 6-9 p.m. Graham Middle School
68 participants rated District Goals and Priority Actions in the following regions Skyline Ridge Peninsula Foothills
Vision Plan Public Deliberation Summary Report 3
Under 18
0%
18‐243%
25‐3415%35‐44
25%
45‐5431%
55‐64
16%65+
10%
Public Workshop Participant Age
Redwood City, CA November 16th, 1-4 p.m. Fair Oaks Community Center
34 participants rated District Goals and Priority Actions in the following regions Baylands; Peninsula & South Bay Cities Peninsula Foothills
TOTAL WORKSHOP ATTENDANCE:
234 participants
Who We Talked To: Participant Demographics for Public Workshops
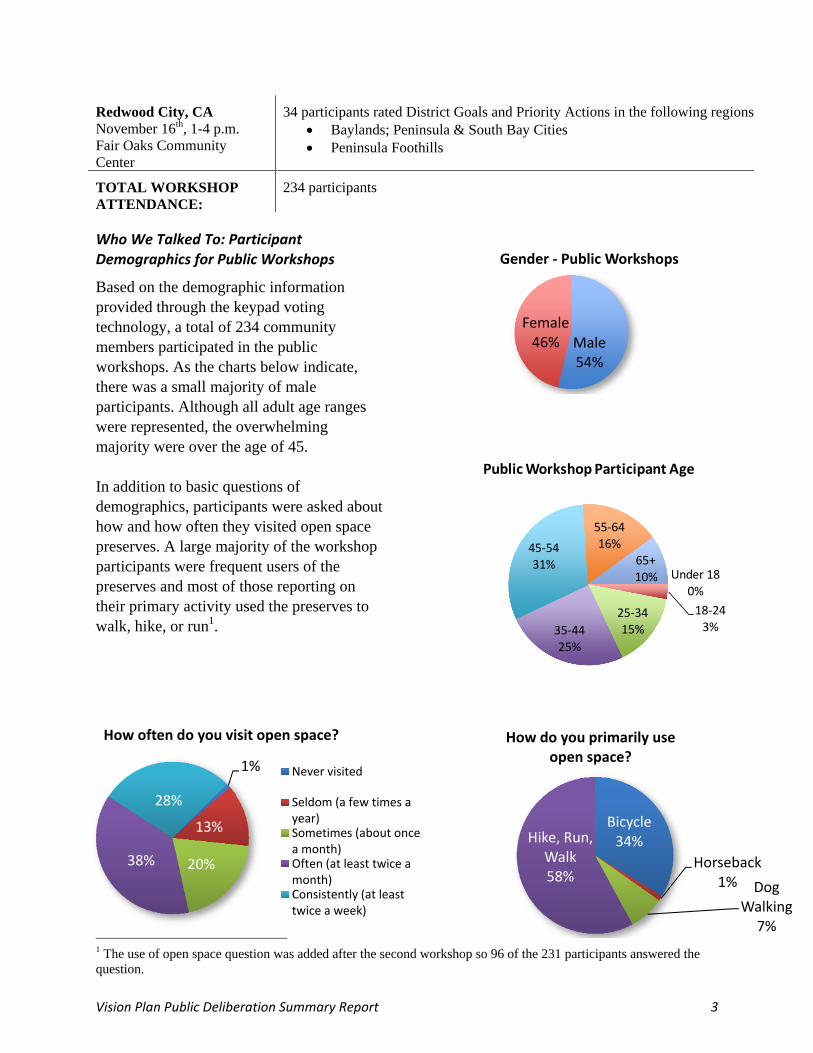
Based on the demographic information provided through the keypad voting technology, a total of 234 community members participated in the public workshops. As the charts below indicate, there was a small majority of male participants. Although all adult age ranges were represented, the overwhelming majority were over the age of 45. In addition to basic questions of demographics, participants were asked about how and how often they visited open space preserves. A large majority of the workshop participants were frequent users of the preserves and most of those reporting on their primary activity used the preserves to walk, hike, or run1.
1 The use of open space question was added after the second workshop so 96 of the 231 participants answered the question.
Male54%
Female46%
Gender ‐ Public Workshops
1%
13%
20%38%
28%
How often do you visit open space?
Never visited
Seldom (a few times a year)Sometimes (about once a month)Often (at least twice a month)Consistently (at least twice a week)
Bicycle34%
Horseback1% Dog
Walking7%
Hike, Run, Walk58%
How do you primarily useopen space?
Vision Plan Public Deliberation Summary Report 4
Mountain View
17%
Los Gatos
12%Saratoga
9%
Sunnyvale
9%
Cupertino
8%
Portola Valley8%
Half Moon
Bay7%
Redwood
City8%
La Honda
6%Los Altos
5%
Palo Alto
3%
San Carlos
3%
Woodside
2%
Other
District Cities
3%
Workshop Participants from District (172)
San Jose12%
Santa Clara3%
Pacifica2%
Other Cities83%
Workshop Participants from Outside District (59)
74%
26%
Workshop Participants
In‐District residents
Outside District residents
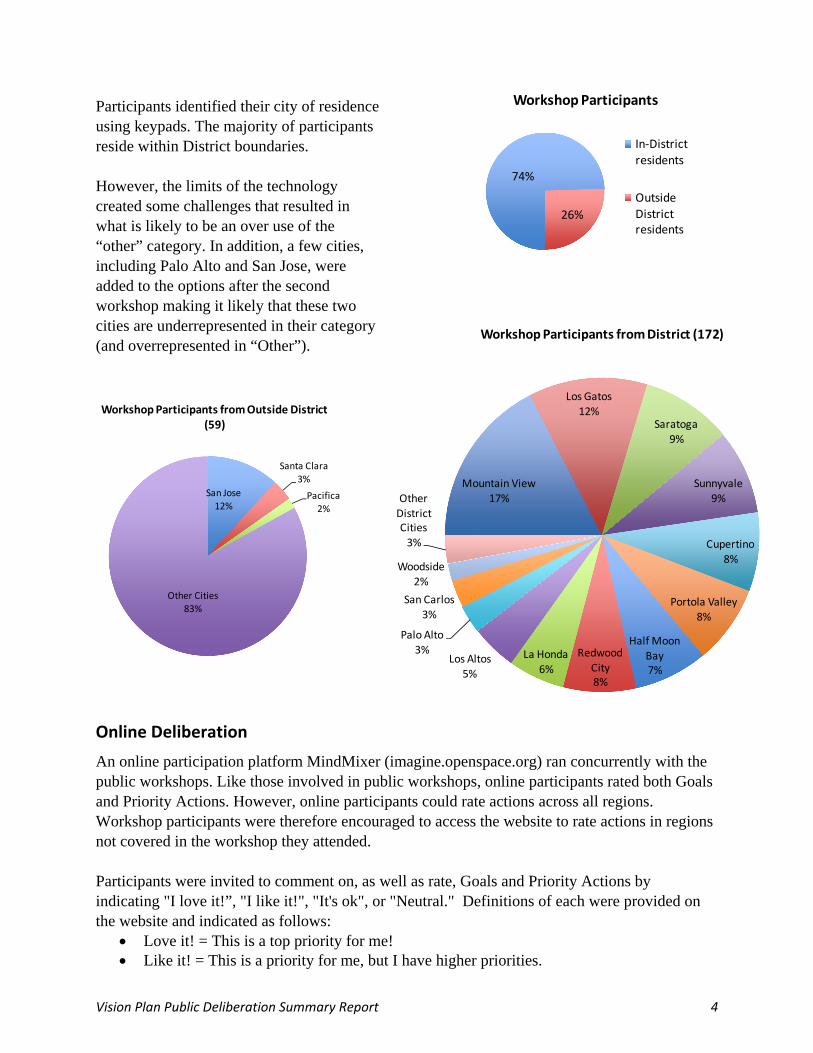
Participants identified their city of residence using keypads. The majority of participants reside within District boundaries. However, the limits of the technology created some challenges that resulted in what is likely to be an over use of the “other” category. In addition, a few cities, including Palo Alto and San Jose, were added to the options after the second workshop making it likely that these two cities are underrepresented in their category (and overrepresented in “Other”).
Online Deliberation
An online participation platform MindMixer (imagine.openspace.org) ran concurrently with the public workshops. Like those involved in public workshops, online participants rated both Goals and Priority Actions. However, online participants could rate actions across all regions. Workshop participants were therefore encouraged to access the website to rate actions in regions not covered in the workshop they attended. Participants were invited to comment on, as well as rate, Goals and Priority Actions by indicating "I love it!”, "I like it!", "It's ok", or "Neutral." Definitions of each were provided on the website and indicated as follows:
Love it! = This is a top priority for me! Like it! = This is a priority for me, but I have higher priorities.
Vision Plan Public Deliberation Summary Report 5
Under
180%
18‐24
3%
25‐34
15%
35‐44
25%45‐54
31%
55‐6416%
65+
10%
Online Participant Age
Male
57%
Female43%
Online Participant Gender
It's OK = I see how that can be important, but it is not a high priority for me. Neutral = This is not a priority for me.
Rating of goals and priorities resulted in the accumulation of points (or stars) as shown in the tables in the Results section of this report. In addition to rating the Goals and Priority Actions developed by the District, online participants could add their own goals and actions for rating and comment.
Who We Talked To: Online Participant Demographics
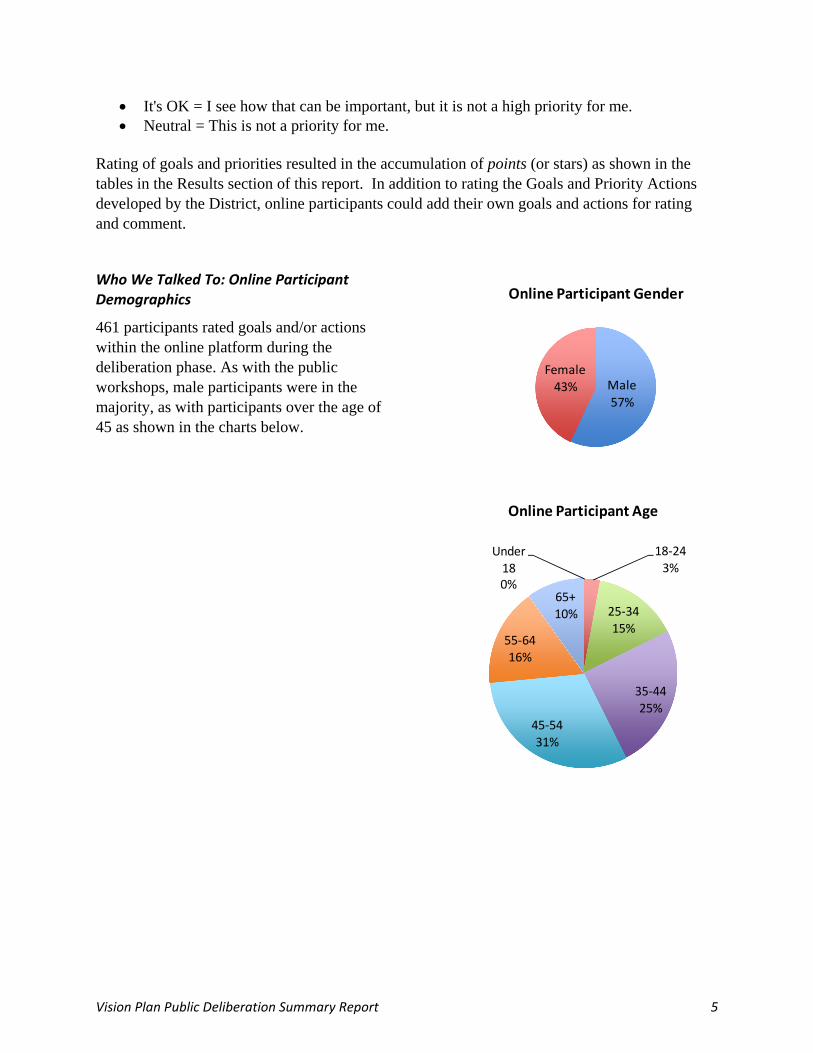
461 participants rated goals and/or actions within the online platform during the deliberation phase. As with the public workshops, male participants were in the majority, as with participants over the age of 45 as shown in the charts below.

Vision Plan Public Deliberation Summary Report 6
63%
37%
Online Participants
In‐District
Residents
Outside
District Residents
San Jose32%
San Francisco
15%
Out of California
7%
Campbell7%
Santa Clara6%
Santa Cruz
5%
Morgan Hill
2%
Oakland
2%
San Mateo2%
Walnut
Creek2%
Other Cities
20%
Online Participants from Outside District (170)
Los Gatos
21%
Los Altos10%
Palo Alto10%
Portola Valley9%
Redwood
City9%
Sunnyvale8%
Mountain View7%
Cupertino
6%
Menlo Park
5%
Saratoga5%
La Honda
4%
San Carlos2%
Atherton1% Half
Moon Bay1%
Other Coastal Towns2%
Online Participants from District (291)
The majority of online participants resided within the District. Participants from a wide range of cities joined the deliberation, as shown in the following charts.
CAC Deliberation
The Vision Plan Community Advisory Committee (CAC) also rated the Priority Actions across all regions at their meeting on December 18, 2013. The meeting was similar to the public workshops, with brief presentations, group discussions, and the use of keypad technology.
Vision Plan Public Deliberation Summary Report 7
RESULTS OF PUBLIC DELIBERATION
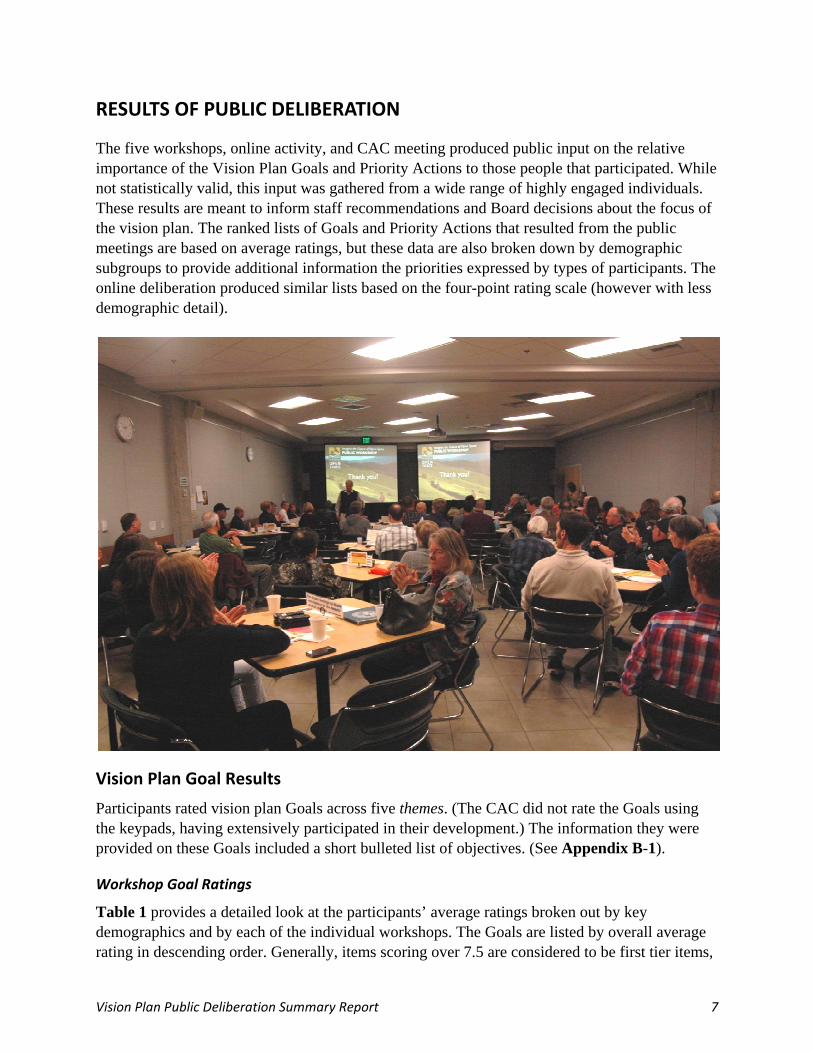
The five workshops, online activity, and CAC meeting produced public input on the relative importance of the Vision Plan Goals and Priority Actions to those people that participated. While not statistically valid, this input was gathered from a wide range of highly engaged individuals. These results are meant to inform staff recommendations and Board decisions about the focus of the vision plan. The ranked lists of Goals and Priority Actions that resulted from the public meetings are based on average ratings, but these data are also broken down by demographic subgroups to provide additional information the priorities expressed by types of participants. The online deliberation produced similar lists based on the four-point rating scale (however with less demographic detail).
Vision Plan Goal Results
Participants rated vision plan Goals across five themes. (The CAC did not rate the Goals using the keypads, having extensively participated in their development.) The information they were provided on these Goals included a short bulleted list of objectives. (See Appendix B-1).
Workshop Goal Ratings
Table 1 provides a detailed look at the participants’ average ratings broken out by key demographics and by each of the individual workshops. The Goals are listed by overall average rating in descending order. Generally, items scoring over 7.5 are considered to be first tier items,
Vision Plan Public Deliberation Summary Report 8
but it is also informative to review the ratings of core sub-groups that reflect significant minority preferences. “Stewardship of Nature” was, on average, the most highly rated goal at the workshops. “Expand Appropriate Low Intensity Access” tended to be more important than stewardship to younger age groups, those that consistently use open space, and bicyclists. Also of note in these ratings is the low diversity score in the top-rated goal (which indicates agreement), as well as the high diversity scores in red (which indicates lack of agreement).
Online Goal Ratings
For ease of comparison, the online ratings are also shown on Table 1 in the yellow column on the right. These are based on total points (rather than the average) gained across all ratings on a four-point scale (see page 4 and 5 above), so the comparison is somewhat limited. However, the difference in relative scores of some of the Goals may be of interest. Generally, the ranking of the Goals is similar across platforms and participant populations, at least in considering tiers. Two notable exceptions are the low ranking of “Sense of Place” and high ranking of “Expand Opportunity and Variety” by the online participants. For further detail regarding online goal ratings, including comments, see Appendix B-2.
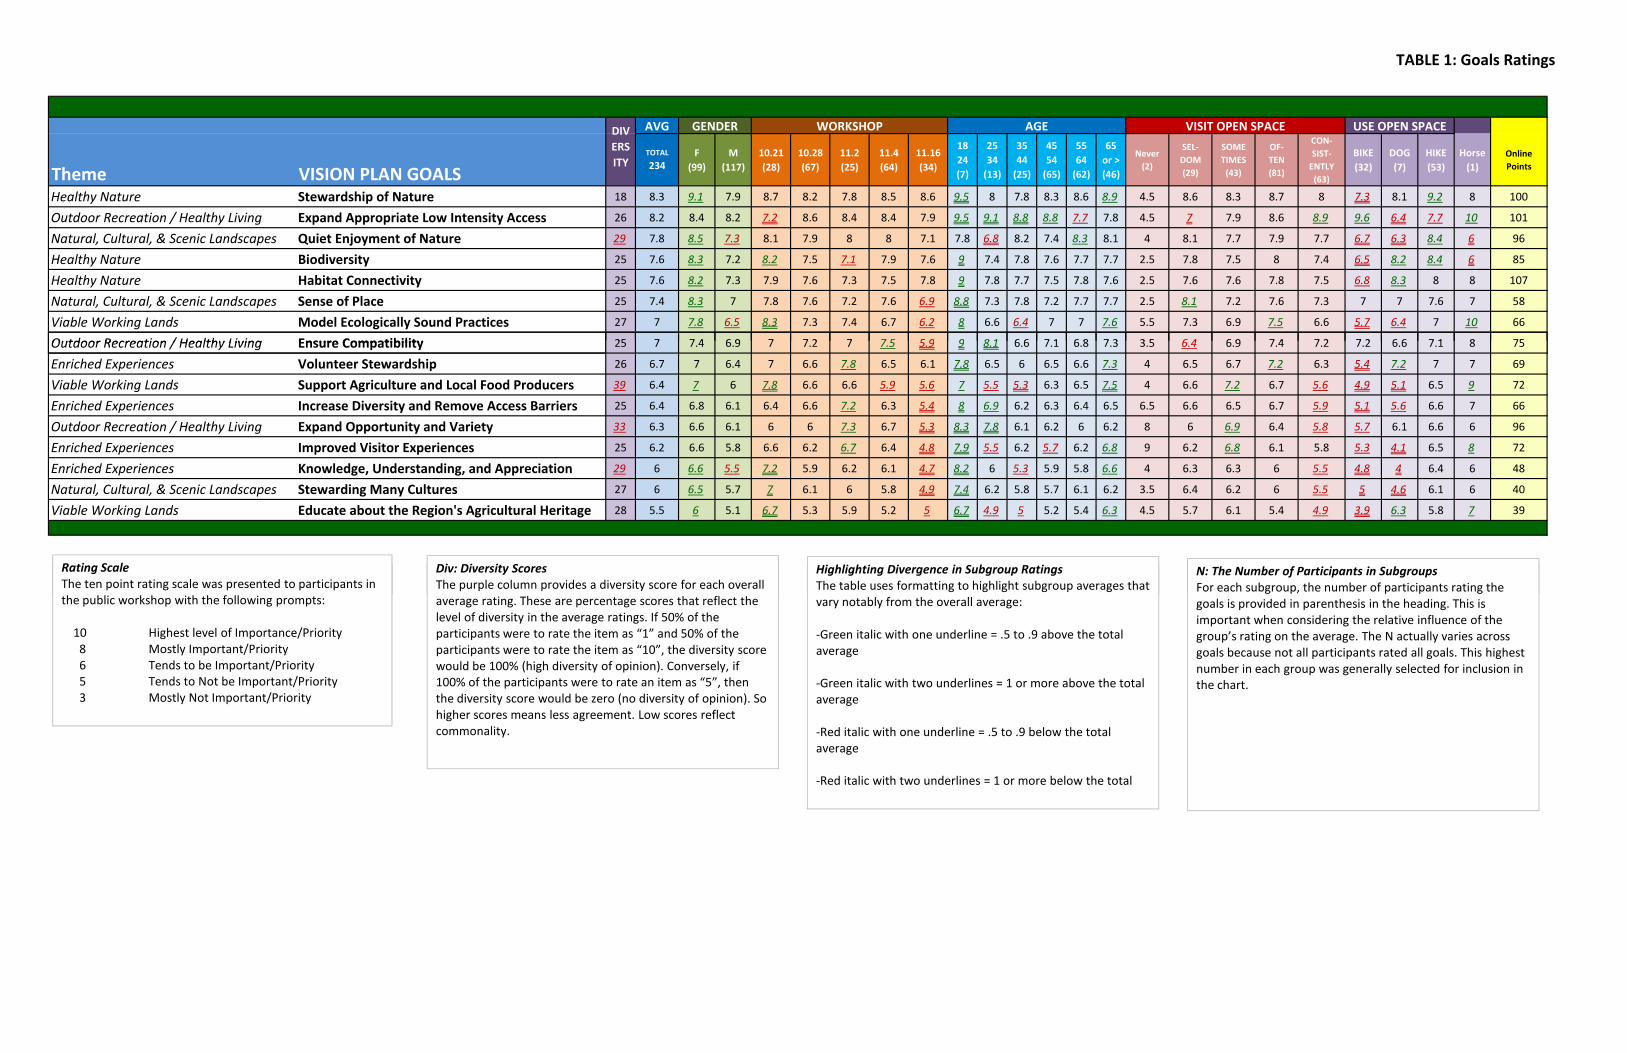
TABLE 1: Goals Ratings
AVG
TOTAL
234F
(99)
M
(117)
10.21
(28)
10.28
(67)
11.2
(25)
11.4
(64)
11.16
(34)
18
24
(7)
25
34
(13)
35
44
(25)
45
54
(65)
55
64
(62)
65
or >
(46)
Never
(2)
SEL‐
DOM
(29)
SOME
TIMES
(43)
OF‐
TEN
(81)
CON‐
SIST‐
ENTLY
(63)
BIKE
(32)
DOG
(7)
HIKE
(53)
Horse
(1)
Online
Points
Healthy Nature Stewardship of Nature 18 8.3 9.1 7.9 8.7 8.2 7.8 8.5 8.6 9.5 8 7.8 8.3 8.6 8.9 4.5 8.6 8.3 8.7 8 7.3 8.1 9.2 8 100
Outdoor Recreation / Healthy Living Expand Appropriate Low Intensity Access 26 8.2 8.4 8.2 7.2 8.6 8.4 8.4 7.9 9.5 9.1 8.8 8.8 7.7 7.8 4.5 7 7.9 8.6 8.9 9.6 6.4 7.7 10 101
Natural, Cultural, & Scenic Landscapes Quiet Enjoyment of Nature 29 7.8 8.5 7.3 8.1 7.9 8 8 7.1 7.8 6.8 8.2 7.4 8.3 8.1 4 8.1 7.7 7.9 7.7 6.7 6.3 8.4 6 96
Healthy Nature Biodiversity 25 7.6 8.3 7.2 8.2 7.5 7.1 7.9 7.6 9 7.4 7.8 7.6 7.7 7.7 2.5 7.8 7.5 8 7.4 6.5 8.2 8.4 6 85
Healthy Nature Habitat Connectivity 25 7.6 8.2 7.3 7.9 7.6 7.3 7.5 7.8 9 7.8 7.7 7.5 7.8 7.6 2.5 7.6 7.6 7.8 7.5 6.8 8.3 8 8 107
Natural, Cultural, & Scenic Landscapes Sense of Place 25 7.4 8.3 7 7.8 7.6 7.2 7.6 6.9 8.8 7.3 7.8 7.2 7.7 7.7 2.5 8.1 7.2 7.6 7.3 7 7 7.6 7 58
Viable Working Lands Model Ecologically Sound Practices 27 7 7.8 6.5 8.3 7.3 7.4 6.7 6.2 8 6.6 6.4 7 7 7.6 5.5 7.3 6.9 7.5 6.6 5.7 6.4 7 10 66
Outdoor Recreation / Healthy Living Ensure Compatibility 25 7 7 4 6 9 7 7 2 7 7 5 5 9 9 8 1 6 6 7 1 6 8 7 3 3 5 6 4 6 9 7 4 7 2 7 2 6 6 7 1 8 75
Theme
GENDER WORKSHOP AGE USE OPEN SPACE
VISION PLAN GOALS
DIV
ERS
ITY
VISIT OPEN SPACE
Outdoor Recreation / Healthy Living Ensure Compatibility 25 7 7.4 6.9 7 7.2 7 7.5 5.9 9 8.1 6.6 7.1 6.8 7.3 3.5 6.4 6.9 7.4 7.2 7.2 6.6 7.1 8 75
Enriched Experiences Volunteer Stewardship 26 6.7 7 6.4 7 6.6 7.8 6.5 6.1 7.8 6.5 6 6.5 6.6 7.3 4 6.5 6.7 7.2 6.3 5.4 7.2 7 7 69
Viable Working Lands Support Agriculture and Local Food Producers 39 6.4 7 6 7.8 6.6 6.6 5.9 5.6 7 5.5 5.3 6.3 6.5 7.5 4 6.6 7.2 6.7 5.6 4.9 5.1 6.5 9 72
Enriched Experiences Increase Diversity and Remove Access Barriers 25 6.4 6.8 6.1 6.4 6.6 7.2 6.3 5.4 8 6.9 6.2 6.3 6.4 6.5 6.5 6.6 6.5 6.7 5.9 5.1 5.6 6.6 7 66
Outdoor Recreation / Healthy Living Expand Opportunity and Variety 33 6.3 6.6 6.1 6 6 7.3 6.7 5.3 8.3 7.8 6.1 6.2 6 6.2 8 6 6.9 6.4 5.8 5.7 6.1 6.6 6 96
Enriched Experiences Improved Visitor Experiences 25 6.2 6.6 5.8 6.6 6.2 6.7 6.4 4.8 7.9 5.5 6.2 5.7 6.2 6.8 9 6.2 6.8 6.1 5.8 5.3 4.1 6.5 8 72
Enriched Experiences Knowledge, Understanding, and Appreciation 29 6 6.6 5.5 7.2 5.9 6.2 6.1 4.7 8.2 6 5.3 5.9 5.8 6.6 4 6.3 6.3 6 5.5 4.8 4 6.4 6 48
Natural, Cultural, & Scenic Landscapes Stewarding Many Cultures 27 6 6.5 5.7 7 6.1 6 5.8 4.9 7.4 6.2 5.8 5.7 6.1 6.2 3.5 6.4 6.2 6 5.5 5 4.6 6.1 6 40
Viable Working Lands Educate about the Region's Agricultural Heritage 28 5.5 6 5.1 6.7 5.3 5.9 5.2 5 6.7 4.9 5 5.2 5.4 6.3 4.5 5.7 6.1 5.4 4.9 3.9 6.3 5.8 7 39
Rating ScaleThe ten point rating scale was presented to participants in
Div: Diversity ScoresThe purple column provides a diversity score for each overall
Highlighting Divergence in Subgroup RatingsThe table uses formatting to highlight subgroup averages that
N: The Number of Participants in SubgroupsFor each subgroup, the number of participants rating the
Rating ScaleThe ten point rating scale was presented to participants in the public workshop with the following prompts:
10 Highest level of Importance/Priority8 Mostly Important/Priority6 Tends to be Important/Priority5 Tends to Not be Important/Priority3 Mostly Not Important/Priority
Div: Diversity ScoresThe purple column provides a diversity score for each overall average rating. These are percentage scores that reflect the level of diversity in the average ratings. If 50% of the participants were to rate the item as “1” and 50% of the participants were to rate the item as “10”, the diversity score would be 100% (high diversity of opinion). Conversely, if 100% of the participants were to rate an item as “5”, then the diversity score would be zero (no diversity of opinion). So higher scores means less agreement. Low scores reflect commonality.
Highlighting Divergence in Subgroup RatingsThe table uses formatting to highlight subgroup averages that vary notably from the overall average:
‐Green italic with one underline = .5 to .9 above the total average
‐Green italic with two underlines = 1 or more above the total average
‐Red italic with one underline = .5 to .9 below the total average
‐Red italic with two underlines = 1 or more below the total
N: The Number of Participants in SubgroupsFor each subgroup, the number of participants rating the goals is provided in parenthesis in the heading. This is important when considering the relative influence of the group’s rating on the average. The N actually varies across goals because not all participants rated all goals. This highest number in each group was generally selected for inclusion in the chart.

Vision Plan Public Deliberation Summary Report 11
Vision Plan Priority Action Results
Participants in the vision plan public deliberation phase learned about Priority Actions by reviewing Priority Action Profiles (see several samples in Appendix C). A total of 54 Priority Actions were developed.
Workshop Priority Action Ratings
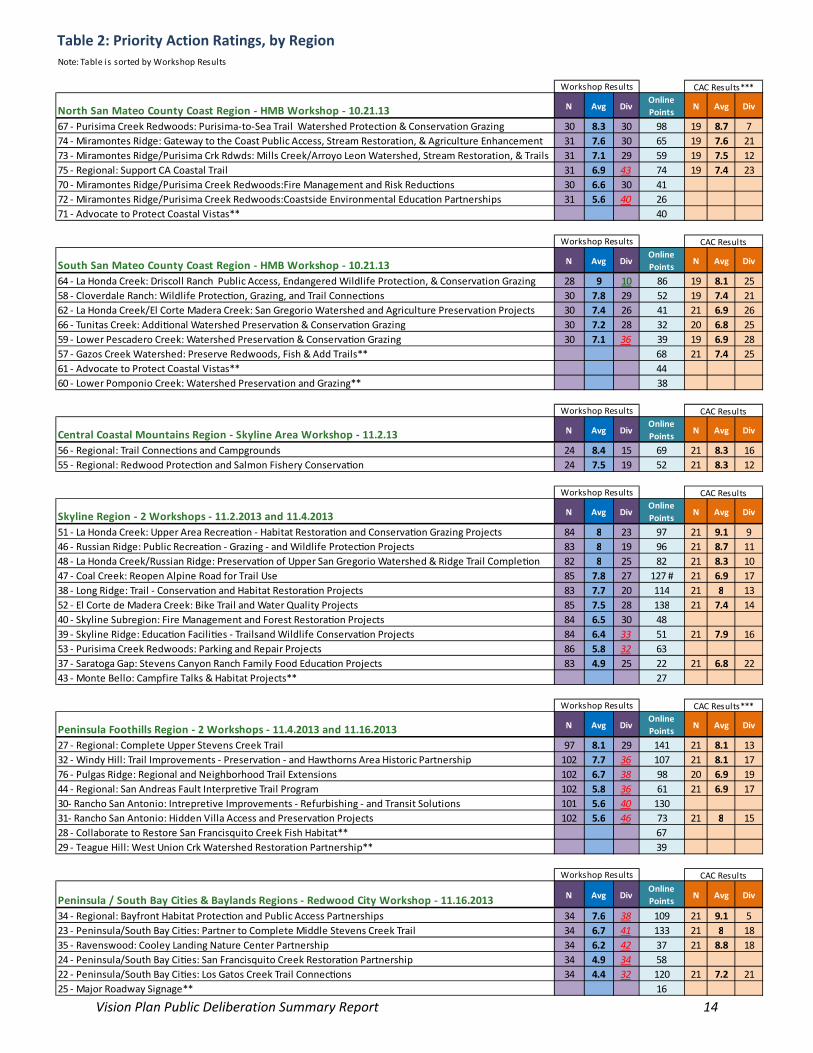
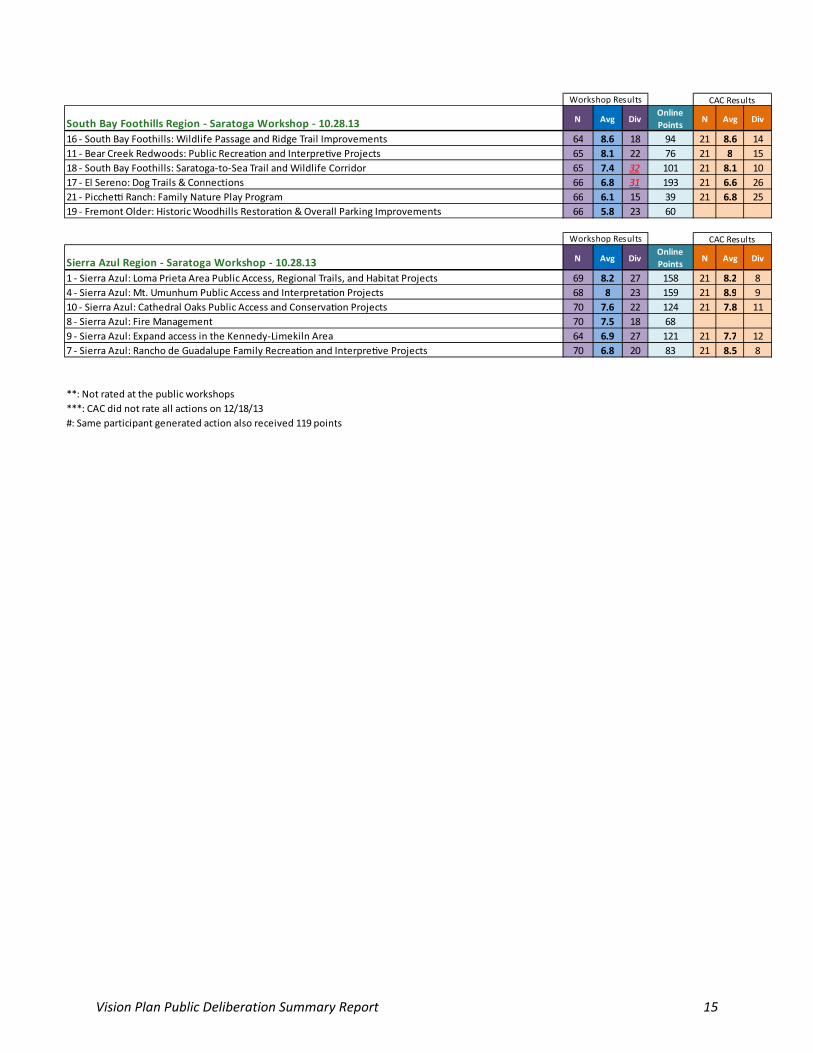
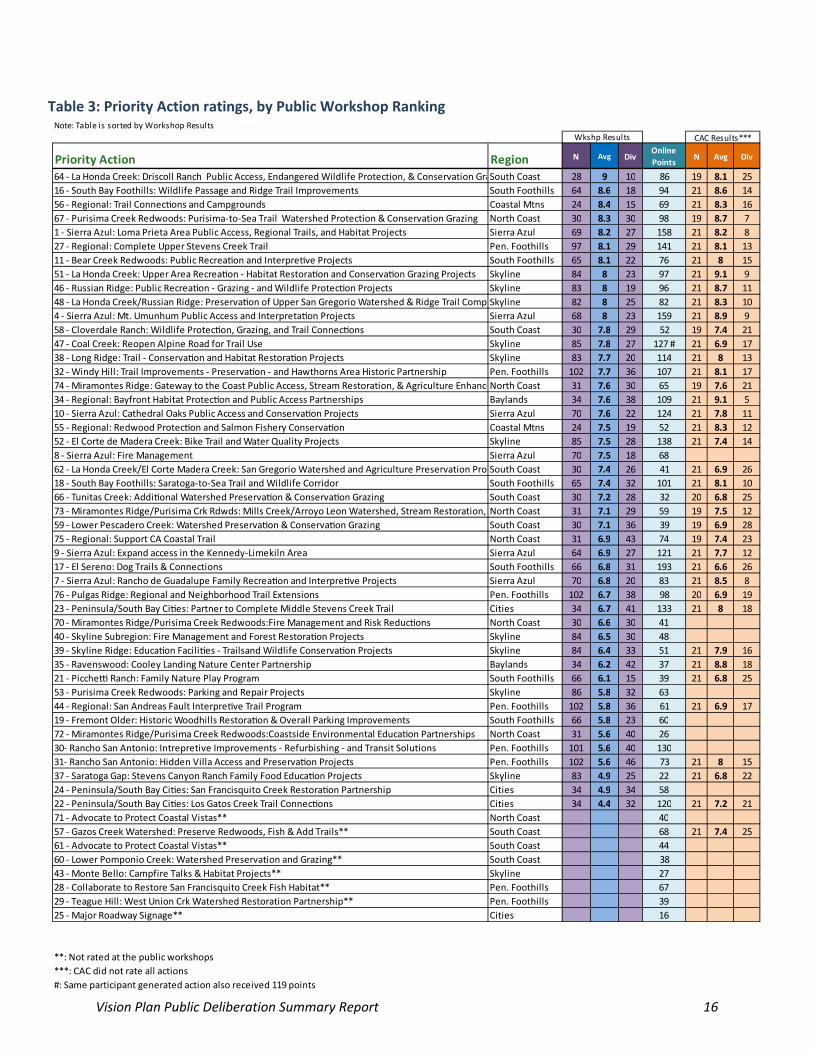
At the public workshops, District staff presented the Priority Action Profiles and addressed participant questions without getting into details that were not appropriate at this stage of priority action development. The workshop participants jotted down pencil ratings during the presentation and then engaged in small group discussions to explore different perspectives on priorities. Keypad ratings were thus informed by these discussions. The rating processes for the Priority Actions resulted in a ranked list of Priority Actions within each region (See Table 2 and Appendix D-1). Also provided (see Table 3) is a listing of all Priority Actions sorted by public workshop ranking. Refer to the Workshop Ratings Key on page 13 for an explanation of table abbreviations and formatting. Overall, due to time limitations, public workshop participants were able to rate 46 of the 54 Priority Actions. Workshop participants were therefore encouraged to access the website to rate actions not covered. With the exception of the “Cities” region, all areas of District have at least one priority action in the highest tier based on Public Workshop ratings (greater than 7.5). The participants in the Redwood City meeting consistently rated Priority Actions (across the board) lower than participants at other workshops.
Online Priority Action Ratings
Online participants were afforded the opportunity to rate all 54 Priority Actions across all regions, using the Vision Plan website at imagine.openspace.org. Tables 2 and 3 indicate the online point totals. Unlike the workshop results, average scores and demographic details are not available, making a direct comparison impossible. Online, the highest rated Priority Actions tended to be those that reflected long-standing community interest, that had received recent media coverage, or that were located in well known places. The most highly rated priority action was 17- El Sereno Dog Trails and Connections, which received 193 points. Considering that 13% of online participants were from Los Gatos and El Sereno Open Space Preserve is already open to the public, this score does not seem surprising. However, 47 – Coal Creek: Reopen Alpine Road for Trail Use (127 points) was also entered as a duplicate participant-generated action (119 points), so in total this priority action was by far the highest rated online item (with 246 points).
CAC Priority Action Ratings
At their December 18, 2013 meeting, the CAC rated 39 Priority Actions drawn from the more highly ranked subset, based upon public workshop and online rankings. Tables 2 and 3 indicate the CAC point totals (See Appendix D-2 for greater detail).

Vision Plan Public Deliberation Summary Report 12
CAC members tended to have lower diversity rankings than the public in general, reflective of their closer ties to the District and its work. The order of Priority Actions within regions was fairly consistent between the CAC and public workshops ratings, with the exception of the Skyline Region. Other notable exceptions were higher CAC ratings for #7 ‐ Sierra Azul: Rancho de Guadalupe Family Recreation and Interpretive Projects (which the CAC toured, so was more informed about the area) and #31‐ Rancho San Antonio: Hidden Villa Access and Preservation Projects (the CAC includes Hidden Villa’s Executive Director).
Priority Action Ratings Compared to Goal Ratings
The highly rated Priority Actions are generally in alignment with the highly rated Goals of Stewardship of Nature and Expanding Low Intensity Access. The highest rated Priority Actions for both the public workshop participants and the CAC show a balanced emphasis on both of these Goals. In contrast, the highest rated priorities of the online participants were more often those actions that emphasized expanded public access. Consistent with the Goals ratings, all participants tended to rate Priority Actions that emphasized the Viable Working Lands and Enriched Experiences themes (without stewardship or access) on the lower end of the scale.
Vision Plan Public Deliberation Summary Report 13
Workshop Ratings Key
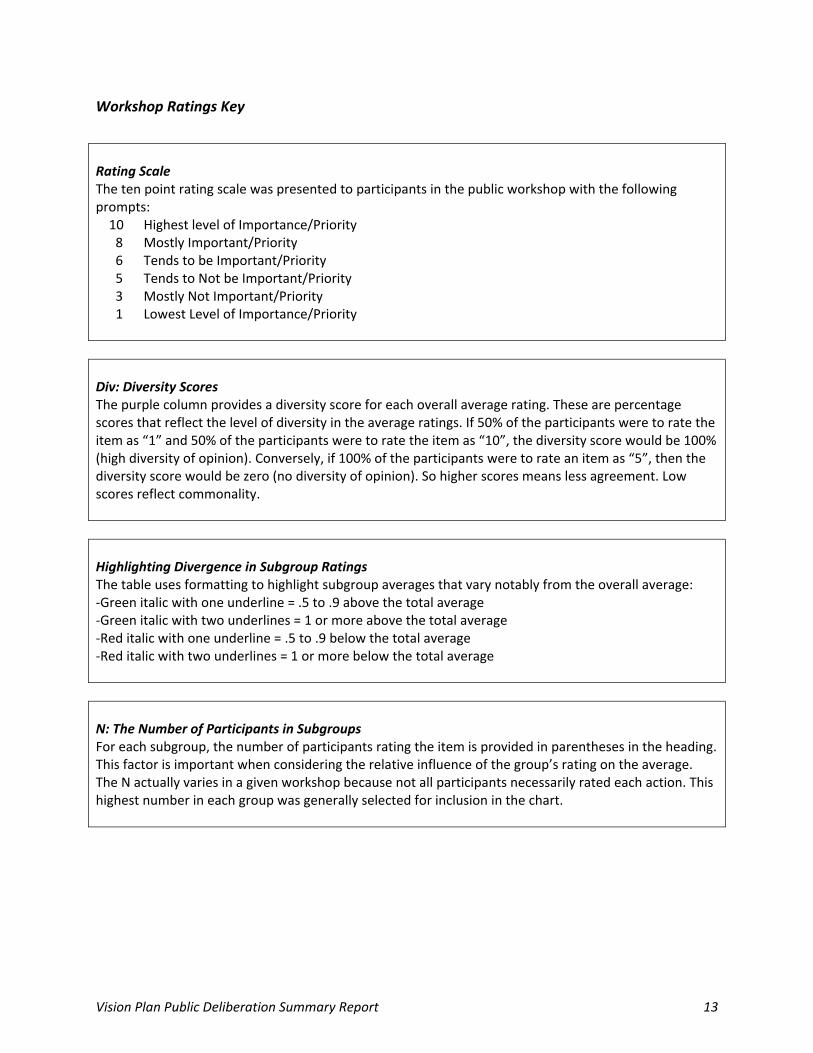
Rating Scale The ten point rating scale was presented to participants in the public workshop with the following prompts: 10 Highest level of Importance/Priority 8 Mostly Important/Priority 6 Tends to be Important/Priority 5 Tends to Not be Important/Priority 3 Mostly Not Important/Priority 1 Lowest Level of Importance/Priority
Div: Diversity Scores The purple column provides a diversity score for each overall average rating. These are percentage scores that reflect the level of diversity in the average ratings. If 50% of the participants were to rate the item as “1” and 50% of the participants were to rate the item as “10”, the diversity score would be 100% (high diversity of opinion). Conversely, if 100% of the participants were to rate an item as “5”, then the diversity score would be zero (no diversity of opinion). So higher scores means less agreement. Low scores reflect commonality.
Highlighting Divergence in Subgroup Ratings The table uses formatting to highlight subgroup averages that vary notably from the overall average: ‐Green italic with one underline = .5 to .9 above the total average ‐Green italic with two underlines = 1 or more above the total average ‐Red italic with one underline = .5 to .9 below the total average ‐Red italic with two underlines = 1 or more below the total average
N: The Number of Participants in Subgroups For each subgroup, the number of participants rating the item is provided in parentheses in the heading. This factor is important when considering the relative influence of the group’s rating on the average. The N actually varies in a given workshop because not all participants necessarily rated each action. This highest number in each group was generally selected for inclusion in the chart.
Vision Plan Public Deliberation Summary Report 14
Note: Table is sorted by Workshop Results
North San Mateo County Coast Region ‐ HMB Workshop ‐ 10.21.13 N Avg DivOnline
PointsN Avg Div
67 ‐ Purisima Creek Redwoods: Purisima‐to‐Sea Trail Watershed Protection & Conservation Grazing 30 8.3 30 98 19 8.7 7
74 ‐ Miramontes Ridge: Gateway to the Coast Public Access, Stream Restoration, & Agriculture Enhancement 31 7.6 30 65 19 7.6 21
73 ‐ Miramontes Ridge/Purisima Crk Rdwds: Mills Creek/Arroyo Leon Watershed, Stream Restoration, & Trails 31 7.1 29 59 19 7.5 12
75 ‐ Regional: Support CA Coastal Trail 31 6.9 43 74 19 7.4 23
70 ‐ Miramontes Ridge/Purisima Creek Redwoods:Fire Management and Risk Reduc ons 30 6.6 30 41
72 ‐ Miramontes Ridge/Purisima Creek Redwoods:Coastside Environmental Educa on Partnerships 31 5.6 40 26
71 ‐ Advocate to Protect Coastal Vistas** 40
South San Mateo County Coast Region ‐ HMB Workshop ‐ 10.21.13 N Avg DivOnline
PointsN Avg Div
64 ‐ La Honda Creek: Driscoll Ranch Public Access, Endangered Wildlife Protection, & Conservation Grazing 28 9 10 86 19 8.1 25
58 ‐ Cloverdale Ranch: Wildlife Protec on, Grazing, and Trail Connec ons 30 7.8 29 52 19 7.4 21
62 ‐ La Honda Creek/El Corte Madera Creek: San Gregorio Watershed and Agriculture Preservation Projects 30 7.4 26 41 21 6.9 26
66 ‐ Tunitas Creek: Addi onal Watershed Preserva on & Conserva on Grazing 30 7.2 28 32 20 6.8 25
59 ‐ Lower Pescadero Creek: Watershed Preserva on & Conserva on Grazing 30 7.1 36 39 19 6.9 28
57 ‐ Gazos Creek Watershed: Preserve Redwoods, Fish & Add Trails** 68 21 7.4 25
61 ‐ Advocate to Protect Coastal Vistas** 44
60 ‐ Lower Pomponio Creek: Watershed Preservation and Grazing** 38
Central Coastal Mountains Region ‐ Skyline Area Workshop ‐ 11.2.13 N Avg DivOnline
PointsN Avg Div
56 ‐ Regional: Trail Connec ons and Campgrounds 24 8.4 15 69 21 8.3 16
55 ‐ Regional: Redwood Protec on and Salmon Fishery Conserva on 24 7.5 19 52 21 8.3 12
Skyline Region ‐ 2 Workshops ‐ 11.2.2013 and 11.4.2013 N Avg DivOnline
PointsN Avg Div
51 ‐ La Honda Creek: Upper Area Recrea on ‐ Habitat Restora on and Conserva on Grazing Projects 84 8 23 97 21 9.1 9
46 ‐ Russian Ridge: Public Recrea on ‐ Grazing ‐ and Wildlife Protec on Projects 83 8 19 96 21 8.7 11
48 ‐ La Honda Creek/Russian Ridge: Preserva on of Upper San Gregorio Watershed & Ridge Trail Comple on 82 8 25 82 21 8.3 10
47 ‐ Coal Creek: Reopen Alpine Road for Trail Use 85 7.8 27 127 # 21 6.9 17
38 ‐ Long Ridge: Trail ‐ Conserva on and Habitat Restora on Projects 83 7.7 20 114 21 8 13
52 ‐ El Corte de Madera Creek: Bike Trail and Water Quality Projects 85 7.5 28 138 21 7.4 14
40 ‐ Skyline Subregion: Fire Management and Forest Restora on Projects 84 6.5 30 48
39 ‐ Skyline Ridge: Educa on Facili es ‐ Trailsand Wildlife Conserva on Projects 84 6.4 33 51 21 7.9 16
53 ‐ Purisima Creek Redwoods: Parking and Repair Projects 86 5.8 32 63
37 ‐ Saratoga Gap: Stevens Canyon Ranch Family Food Educa on Projects 83 4.9 25 22 21 6.8 22
43 ‐ Monte Bello: Campfire Talks & Habitat Projects** 27
Peninsula Foothills Region ‐ 2 Workshops ‐ 11.4.2013 and 11.16.2013 N Avg DivOnline
PointsN Avg Div
27 ‐ Regional: Complete Upper Stevens Creek Trail 97 8.1 29 141 21 8.1 13
32 ‐ Windy Hill: Trail Improvements ‐ Preserva on ‐ and Hawthorns Area Historic Partnership 102 7.7 36 107 21 8.1 17
76 ‐ Pulgas Ridge: Regional and Neighborhood Trail Extensions 102 6.7 38 98 20 6.9 19
44 ‐ Regional: San Andreas Fault Interpre ve Trail Program 102 5.8 36 61 21 6.9 17
30‐ Rancho San Antonio: Intrepretive Improvements ‐ Refurbishing ‐ and Transit Solutions 101 5.6 40 130
31‐ Rancho San Antonio: Hidden Villa Access and Preserva on Projects 102 5.6 46 73 21 8 15
28 ‐ Collaborate to Restore San Francisquito Creek Fish Habitat** 67
29 ‐ Teague Hill: West Union Crk Watershed Restoration Partnership** 39
Peninsula / South Bay Cities & Baylands Regions ‐ Redwood City Workshop ‐ 11.16.2013 N Avg DivOnline
PointsN Avg Div
34 ‐ Regional: Bayfront Habitat Protec on and Public Access Partnerships 34 7.6 38 109 21 9.1 5
23 ‐ Peninsula/South Bay Ci es: Partner to Complete Middle Stevens Creek Trail 34 6.7 41 133 21 8 18
35 ‐ Ravenswood: Cooley Landing Nature Center Partnership 34 6.2 42 37 21 8.8 18
24 ‐ Peninsula/South Bay Ci es: San Francisquito Creek Restora on Partnership 34 4.9 34 58
22 ‐ Peninsula/South Bay Ci es: Los Gatos Creek Trail Connec ons 34 4.4 32 120 21 7.2 21
25 ‐ Major Roadway Signage** 16
Workshop Results CAC Results
Workshop Results CAC Results
Workshop Results CAC Results***
Workshop Results CAC Results***
Workshop Results CAC Results
Workshop Results CAC Results
Table 2: Priority Action Ratings, by Region
Vision Plan Public Deliberation Summary Report 15
South Bay Foothills Region ‐ Saratoga Workshop ‐ 10.28.13 N Avg DivOnline
PointsN Avg Div
16 ‐ South Bay Foothills: Wildlife Passage and Ridge Trail Improvements 64 8.6 18 94 21 8.6 14
11 ‐ Bear Creek Redwoods: Public Recrea on and Interpre ve Projects 65 8.1 22 76 21 8 15
18 ‐ South Bay Foothills: Saratoga‐to‐Sea Trail and Wildlife Corridor 65 7.4 32 101 21 8.1 10
17 ‐ El Sereno: Dog Trails & Connections 66 6.8 31 193 21 6.6 26
21 ‐ Picche Ranch: Family Nature Play Program 66 6.1 15 39 21 6.8 25
19 ‐ Fremont Older: Historic Woodhills Restora on & Overall Parking Improvements 66 5.8 23 60
Sierra Azul Region ‐ Saratoga Workshop ‐ 10.28.13 N Avg DivOnline
PointsN Avg Div
1 ‐ Sierra Azul: Loma Prieta Area Public Access, Regional Trails, and Habitat Projects 69 8.2 27 158 21 8.2 8
4 ‐ Sierra Azul: Mt. Umunhum Public Access and Interpreta on Projects 68 8 23 159 21 8.9 9
10 ‐ Sierra Azul: Cathedral Oaks Public Access and Conserva on Projects 70 7.6 22 124 21 7.8 11
8 ‐ Sierra Azul: Fire Management 70 7.5 18 68
9 ‐ Sierra Azul: Expand access in the Kennedy‐Limekiln Area 64 6.9 27 121 21 7.7 12
7 ‐ Sierra Azul: Rancho de Guadalupe Family Recrea on and Interpre ve Projects 70 6.8 20 83 21 8.5 8
**: Not rated at the public workshops
***: CAC did not rate all actions on 12/18/13
#: Same participant generated action also received 119 points
Workshop Results CAC Results
Workshop Results CAC Results
Vision Plan Public Deliberation Summary Report 16
Note: Table is sorted by Workshop Results
Priority Action Region N Avg DivOnline
PointsN Avg Div
64 ‐ La Honda Creek: Driscoll Ranch Public Access, Endangered Wildlife Protection, & Conservation GraSouth Coast 28 9 10 86 19 8.1 25
16 ‐ South Bay Foothills: Wildlife Passage and Ridge Trail Improvements South Foothills 64 8.6 18 94 21 8.6 14
56 ‐ Regional: Trail Connec ons and Campgrounds Coastal Mtns 24 8.4 15 69 21 8.3 16
67 ‐ Purisima Creek Redwoods: Purisima‐to‐Sea Trail Watershed Protection & Conservation Grazing North Coast 30 8.3 30 98 19 8.7 7
1 ‐ Sierra Azul: Loma Prieta Area Public Access, Regional Trails, and Habitat Projects Sierra Azul 69 8.2 27 158 21 8.2 8
27 ‐ Regional: Complete Upper Stevens Creek Trail Pen. Foothills 97 8.1 29 141 21 8.1 13
11 ‐ Bear Creek Redwoods: Public Recrea on and Interpre ve Projects South Foothills 65 8.1 22 76 21 8 15
51 ‐ La Honda Creek: Upper Area Recrea on ‐ Habitat Restora on and Conserva on Grazing Projects Skyline 84 8 23 97 21 9.1 9
46 ‐ Russian Ridge: Public Recrea on ‐ Grazing ‐ and Wildlife Protec on Projects Skyline 83 8 19 96 21 8.7 11
48 ‐ La Honda Creek/Russian Ridge: Preserva on of Upper San Gregorio Watershed & Ridge Trail Comp Skyline 82 8 25 82 21 8.3 10
4 ‐ Sierra Azul: Mt. Umunhum Public Access and Interpreta on Projects Sierra Azul 68 8 23 159 21 8.9 9
58 ‐ Cloverdale Ranch: Wildlife Protec on, Grazing, and Trail Connec ons South Coast 30 7.8 29 52 19 7.4 21
47 ‐ Coal Creek: Reopen Alpine Road for Trail Use Skyline 85 7.8 27 127 # 21 6.9 17
38 ‐ Long Ridge: Trail ‐ Conserva on and Habitat Restora on Projects Skyline 83 7.7 20 114 21 8 13
32 ‐ Windy Hill: Trail Improvements ‐ Preserva on ‐ and Hawthorns Area Historic Partnership Pen. Foothills 102 7.7 36 107 21 8.1 17
74 ‐ Miramontes Ridge: Gateway to the Coast Public Access, Stream Restoration, & Agriculture EnhanceNorth Coast 31 7.6 30 65 19 7.6 21
34 ‐ Regional: Bayfront Habitat Protec on and Public Access Partnerships Baylands 34 7.6 38 109 21 9.1 5
10 ‐ Sierra Azul: Cathedral Oaks Public Access and Conserva on Projects Sierra Azul 70 7.6 22 124 21 7.8 11
55 ‐ Regional: Redwood Protec on and Salmon Fishery Conserva on Coastal Mtns 24 7.5 19 52 21 8.3 12
52 ‐ El Corte de Madera Creek: Bike Trail and Water Quality Projects Skyline 85 7.5 28 138 21 7.4 14
8 ‐ Sierra Azul: Fire Management Sierra Azul 70 7.5 18 68
62 ‐ La Honda Creek/El Corte Madera Creek: San Gregorio Watershed and Agriculture Preservation ProjSouth Coast 30 7.4 26 41 21 6.9 26
18 ‐ South Bay Foothills: Saratoga‐to‐Sea Trail and Wildlife Corridor South Foothills 65 7.4 32 101 21 8.1 10
66 ‐ Tunitas Creek: Addi onal Watershed Preserva on & Conserva on Grazing South Coast 30 7.2 28 32 20 6.8 25
73 ‐ Miramontes Ridge/Purisima Crk Rdwds: Mills Creek/Arroyo Leon Watershed, Stream Restoration, North Coast 31 7.1 29 59 19 7.5 12
59 ‐ Lower Pescadero Creek: Watershed Preserva on & Conserva on Grazing South Coast 30 7.1 36 39 19 6.9 28
75 ‐ Regional: Support CA Coastal Trail North Coast 31 6.9 43 74 19 7.4 23
9 ‐ Sierra Azul: Expand access in the Kennedy‐Limekiln Area Sierra Azul 64 6.9 27 121 21 7.7 12
17 ‐ El Sereno: Dog Trails & Connections South Foothills 66 6.8 31 193 21 6.6 26
7 ‐ Sierra Azul: Rancho de Guadalupe Family Recrea on and Interpre ve Projects Sierra Azul 70 6.8 20 83 21 8.5 8
76 ‐ Pulgas Ridge: Regional and Neighborhood Trail Extensions Pen. Foothills 102 6.7 38 98 20 6.9 19
23 ‐ Peninsula/South Bay Ci es: Partner to Complete Middle Stevens Creek Trail Cities 34 6.7 41 133 21 8 18
70 ‐ Miramontes Ridge/Purisima Creek Redwoods:Fire Management and Risk Reduc ons North Coast 30 6.6 30 41
40 ‐ Skyline Subregion: Fire Management and Forest Restora on Projects Skyline 84 6.5 30 48
39 ‐ Skyline Ridge: Educa on Facili es ‐ Trailsand Wildlife Conserva on Projects Skyline 84 6.4 33 51 21 7.9 16
35 ‐ Ravenswood: Cooley Landing Nature Center Partnership Baylands 34 6.2 42 37 21 8.8 18
21 ‐ Picche Ranch: Family Nature Play Program South Foothills 66 6.1 15 39 21 6.8 25
53 ‐ Purisima Creek Redwoods: Parking and Repair Projects Skyline 86 5.8 32 63
44 ‐ Regional: San Andreas Fault Interpre ve Trail Program Pen. Foothills 102 5.8 36 61 21 6.9 17
19 ‐ Fremont Older: Historic Woodhills Restora on & Overall Parking Improvements South Foothills 66 5.8 23 60
72 ‐ Miramontes Ridge/Purisima Creek Redwoods:Coastside Environmental Educa on Partnerships North Coast 31 5.6 40 26
30‐ Rancho San Antonio: Intrepretive Improvements ‐ Refurbishing ‐ and Transit Solutions Pen. Foothills 101 5.6 40 130
31‐ Rancho San Antonio: Hidden Villa Access and Preserva on Projects Pen. Foothills 102 5.6 46 73 21 8 15
37 ‐ Saratoga Gap: Stevens Canyon Ranch Family Food Educa on Projects Skyline 83 4.9 25 22 21 6.8 22
24 ‐ Peninsula/South Bay Ci es: San Francisquito Creek Restora on Partnership Cities 34 4.9 34 58
22 ‐ Peninsula/South Bay Ci es: Los Gatos Creek Trail Connec ons Cities 34 4.4 32 120 21 7.2 21
71 ‐ Advocate to Protect Coastal Vistas** North Coast 40
57 ‐ Gazos Creek Watershed: Preserve Redwoods, Fish & Add Trails** South Coast 68 21 7.4 25
61 ‐ Advocate to Protect Coastal Vistas** South Coast 44
60 ‐ Lower Pomponio Creek: Watershed Preservation and Grazing** South Coast 38
43 ‐ Monte Bello: Campfire Talks & Habitat Projects** Skyline 27
28 ‐ Collaborate to Restore San Francisquito Creek Fish Habitat** Pen. Foothills 67
29 ‐ Teague Hill: West Union Crk Watershed Restoration Partnership** Pen. Foothills 39
25 ‐ Major Roadway Signage** Cities 16
**: Not rated at the public workshops
***: CAC did not rate all actions
#: Same participant generated action also received 119 points
Wkshp Results CAC Results***
Table 3: Priority Action ratings, by Public Workshop Ranking
Vision Plan Public Deliberation Summary Report 17
Participant‐generated Goals and Actions
In addition to the ranked lists of Goals and Priority Actions developed by the District, participants in public workshops and online offered their own ideas for Goals and Priority Actions. Some of these were also rated. These ideas are included in Appendix E.
Workshop Participant Comments
Workshop participant comments are shown in Appendix F.
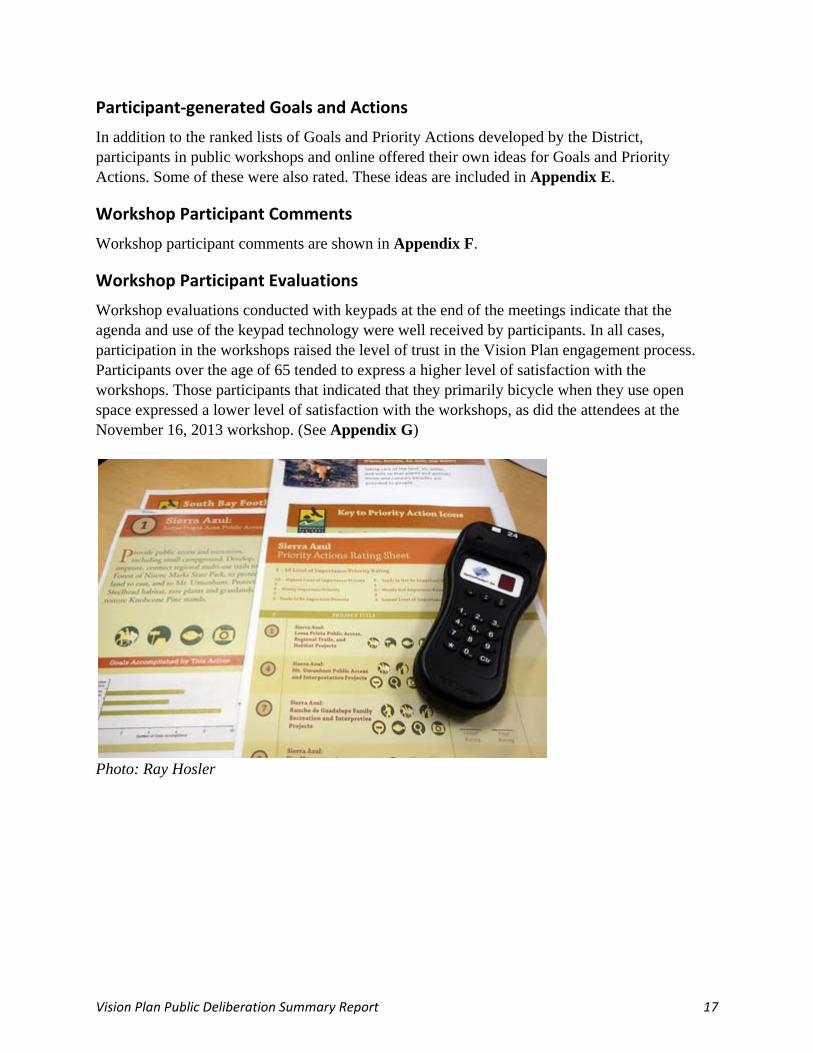
Workshop Participant Evaluations
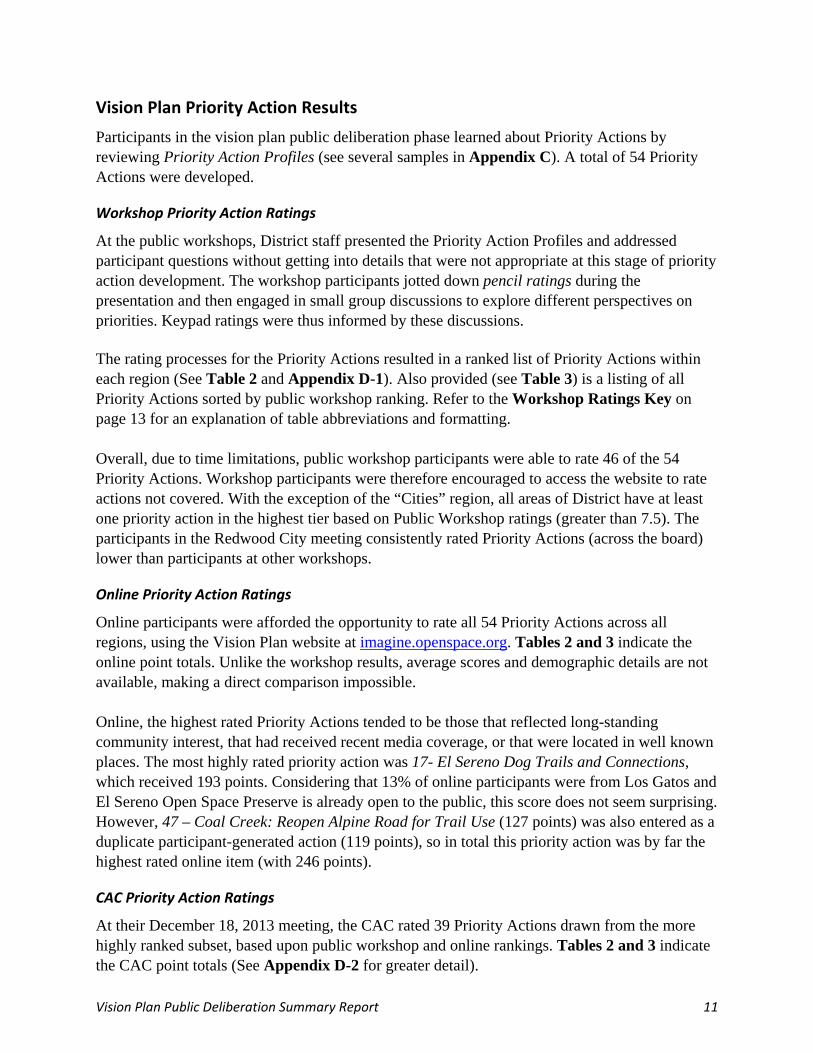
Workshop evaluations conducted with keypads at the end of the meetings indicate that the agenda and use of the keypad technology were well received by participants. In all cases, participation in the workshops raised the level of trust in the Vision Plan engagement process. Participants over the age of 65 tended to express a higher level of satisfaction with the workshops. Those participants that indicated that they primarily bicycle when they use open space expressed a lower level of satisfaction with the workshops, as did the attendees at the November 16, 2013 workshop. (See Appendix G)
Photo: Ray Hosler
Vision Plan Public Deliberation Summary Report 18
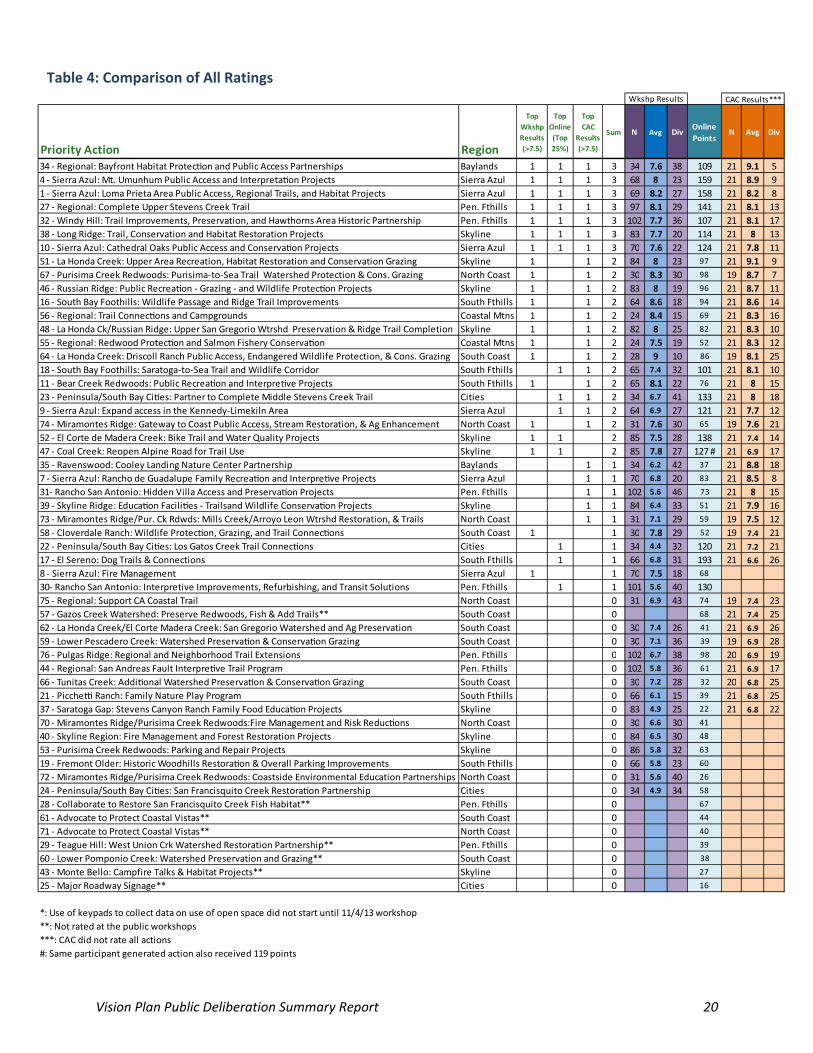
NEXT STEPS
The District now moves into the deciding phase of the vision planning process. In this final phase of the process the Board will delve into the results of the deliberations outlined in this report and decide what Priority Actions will be featured in the Vision Plan. This will not be an easy task as each and every one of the actions that were profiled in the deliberation phase were selected from an even broader pool of potential Priority Actions and developed with considerable input scientific and public input. It is important to keep in mind, however, that none of the actions that were included in the deliberation phase need be completely removed from all future consideration. In the future, conditions will change and priorities will shift accordingly in response to those changes. A first step in the deciding phase is to sort actions into tiers that reflect levels of priority. These tiers can be informed by the public input gathered across all three sources of deliberative input: public workshops, online deliberation, and the CAC deliberative meeting. Table 4 provides an overview of where the actions fall in relation to top tier ratings across the three sources of input. For purposes of this table, the top tier is generally defined as a rating in the top quartile. For the public workshops and CAC, the top quartile is an average result greater than 7.5. For the online scores, the scores over 100 comprise the top quartile. The table is not intended to comprise a final tiered ranking. Rather, it is meant as an initial summary that can be used to surface actions that require a closer look to understand their ratings, and the specific populations and situations through which these ratings were produced.
CONCLUSION
During the deliberation phase of the vision planning process, more than 535 members of the public actively engaged with the District and its work. They learned about the Themes and Goals that guide that work and the kinds of actions that might be taken to work toward those Goals. They considered their own priorities and values in relation to that work and many of them explored perspectives different from their own through small group conversations and online comments. And ultimately, they expressed their priorities through rating systems that invited them to consider tradeoffs and to see how others’ priorities compared to their own. The District has gained some useful information through this process. The results offer a solid look at the values and opinions of community stakeholders — those who really care about what the District is doing and what it will do in the future. What is more, the process has shown those stakeholders that the District cares about what is important to them, and intends to bring their voices into decision making processes that will shape the future of open space on the Peninsula and in the South Bay.
As the District Board engages in the work of making decisions about how Goals will be expressed and what Priority Actions will be featured in the Vision Plan, the results of the public deliberations outlined in this report will sit along side scientific analyses and expert planning to

Vision Plan Public Deliberation Summary Report 19
provide a balanced foundation for making difficult choices. Community stakeholders will continue to observe, participate, and better understand what has informed the decisions that will guide the work that they so clearly care about.
Vision Plan Public Deliberation Summary Report 20
Priority Action Region
Top
Wkshp
Results
(>7.5)
Top
Online
(Top
25%)
Top
CAC
Results
(>7.5)
Sum N Avg DivOnline
PointsN Avg Div
34 ‐ Regional: Bayfront Habitat Protec on and Public Access Partnerships Baylands 1 1 1 3 34 7.6 38 109 21 9.1 5
4 ‐ Sierra Azul: Mt. Umunhum Public Access and Interpreta on Projects Sierra Azul 1 1 1 3 68 8 23 159 21 8.9 9
1 ‐ Sierra Azul: Loma Prieta Area Public Access, Regional Trails, and Habitat Projects Sierra Azul 1 1 1 3 69 8.2 27 158 21 8.2 8
27 ‐ Regional: Complete Upper Stevens Creek Trail Pen. Fthills 1 1 1 3 97 8.1 29 141 21 8.1 13
32 ‐ Windy Hill: Trail Improvements, Preservation, and Hawthorns Area Historic Partnership Pen. Fthills 1 1 1 3 102 7.7 36 107 21 8.1 17
38 ‐ Long Ridge: Trail, Conservation and Habitat Restoration Projects Skyline 1 1 1 3 83 7.7 20 114 21 8 13
10 ‐ Sierra Azul: Cathedral Oaks Public Access and Conserva on Projects Sierra Azul 1 1 1 3 70 7.6 22 124 21 7.8 11
51 ‐ La Honda Creek: Upper Area Recreation, Habitat Restoration and Conservation Grazing Skyline 1 1 2 84 8 23 97 21 9.1 9
67 ‐ Purisima Creek Redwoods: Purisima‐to‐Sea Trail Watershed Protection & Cons. Grazing North Coast 1 1 2 30 8.3 30 98 19 8.7 7
46 ‐ Russian Ridge: Public Recrea on ‐ Grazing ‐ and Wildlife Protec on Projects Skyline 1 1 2 83 8 19 96 21 8.7 11
16 ‐ South Bay Foothills: Wildlife Passage and Ridge Trail Improvements South Fthills 1 1 2 64 8.6 18 94 21 8.6 14
56 ‐ Regional: Trail Connec ons and Campgrounds Coastal Mtns 1 1 2 24 8.4 15 69 21 8.3 16
48 ‐ La Honda Ck/Russian Ridge: Upper San Gregorio Wtrshd Preservation & Ridge Trail Completion Skyline 1 1 2 82 8 25 82 21 8.3 10
55 ‐ Regional: Redwood Protec on and Salmon Fishery Conserva on Coastal Mtns 1 1 2 24 7.5 19 52 21 8.3 12
64 ‐ La Honda Creek: Driscoll Ranch Public Access, Endangered Wildlife Protection, & Cons. Grazing South Coast 1 1 2 28 9 10 86 19 8.1 25
18 ‐ South Bay Foothills: Saratoga‐to‐Sea Trail and Wildlife Corridor South Fthills 1 1 2 65 7.4 32 101 21 8.1 10
11 ‐ Bear Creek Redwoods: Public Recrea on and Interpre ve Projects South Fthills 1 1 2 65 8.1 22 76 21 8 15
23 ‐ Peninsula/South Bay Ci es: Partner to Complete Middle Stevens Creek Trail Cities 1 1 2 34 6.7 41 133 21 8 18
9 ‐ Sierra Azul: Expand access in the Kennedy‐Limekiln Area Sierra Azul 1 1 2 64 6.9 27 121 21 7.7 12
74 ‐ Miramontes Ridge: Gateway to Coast Public Access, Stream Restoration, & Ag Enhancement North Coast 1 1 2 31 7.6 30 65 19 7.6 21
52 ‐ El Corte de Madera Creek: Bike Trail and Water Quality Projects Skyline 1 1 2 85 7.5 28 138 21 7.4 14
47 ‐ Coal Creek: Reopen Alpine Road for Trail Use Skyline 1 1 2 85 7.8 27 127 # 21 6.9 17
35 ‐ Ravenswood: Cooley Landing Nature Center Partnership Baylands 1 1 34 6.2 42 37 21 8.8 18
7 ‐ Sierra Azul: Rancho de Guadalupe Family Recrea on and Interpre ve Projects Sierra Azul 1 1 70 6.8 20 83 21 8.5 8
31‐ Rancho San Antonio: Hidden Villa Access and Preserva on Projects Pen. Fthills 1 1 102 5.6 46 73 21 8 15
39 ‐ Skyline Ridge: Educa on Facili es ‐ Trailsand Wildlife Conserva on Projects Skyline 1 1 84 6.4 33 51 21 7.9 16
73 ‐ Miramontes Ridge/Pur. Ck Rdwds: Mills Creek/Arroyo Leon Wtrshd Restoration, & Trails North Coast 1 1 31 7.1 29 59 19 7.5 12
58 ‐ Cloverdale Ranch: Wildlife Protec on, Grazing, and Trail Connec ons South Coast 1 1 30 7.8 29 52 19 7.4 21
22 ‐ Peninsula/South Bay Ci es: Los Gatos Creek Trail Connec ons Cities 1 1 34 4.4 32 120 21 7.2 21
17 ‐ El Sereno: Dog Trails & Connections South Fthills 1 1 66 6.8 31 193 21 6.6 26
8 ‐ Sierra Azul: Fire Management Sierra Azul 1 1 70 7.5 18 68
30‐ Rancho San Antonio: Interpretive Improvements, Refurbishing, and Transit Solutions Pen. Fthills 1 1 101 5.6 40 130
75 ‐ Regional: Support CA Coastal Trail North Coast 0 31 6.9 43 74 19 7.4 23
57 ‐ Gazos Creek Watershed: Preserve Redwoods, Fish & Add Trails** South Coast 0 68 21 7.4 25
62 ‐ La Honda Creek/El Corte Madera Creek: San Gregorio Watershed and Ag Preservation South Coast 0 30 7.4 26 41 21 6.9 26
59 ‐ Lower Pescadero Creek: Watershed Preserva on & Conserva on Grazing South Coast 0 30 7.1 36 39 19 6.9 28
76 ‐ Pulgas Ridge: Regional and Neighborhood Trail Extensions Pen. Fthills 0 102 6.7 38 98 20 6.9 19
44 ‐ Regional: San Andreas Fault Interpre ve Trail Program Pen. Fthills 0 102 5.8 36 61 21 6.9 17
66 ‐ Tunitas Creek: Addi onal Watershed Preserva on & Conserva on Grazing South Coast 0 30 7.2 28 32 20 6.8 25
21 ‐ Picche Ranch: Family Nature Play Program South Fthills 0 66 6.1 15 39 21 6.8 25
37 ‐ Saratoga Gap: Stevens Canyon Ranch Family Food Educa on Projects Skyline 0 83 4.9 25 22 21 6.8 22
70 ‐ Miramontes Ridge/Purisima Creek Redwoods:Fire Management and Risk Reduc ons North Coast 0 30 6.6 30 41
40 ‐ Skyline Region: Fire Management and Forest Restoration Projects Skyline 0 84 6.5 30 48
53 ‐ Purisima Creek Redwoods: Parking and Repair Projects Skyline 0 86 5.8 32 63
19 ‐ Fremont Older: Historic Woodhills Restora on & Overall Parking Improvements South Fthills 0 66 5.8 23 60
72 ‐ Miramontes Ridge/Purisima Creek Redwoods: Coastside Environmental Education Partnerships North Coast 0 31 5.6 40 26
24 ‐ Peninsula/South Bay Ci es: San Francisquito Creek Restora on Partnership Cities 0 34 4.9 34 58
28 ‐ Collaborate to Restore San Francisquito Creek Fish Habitat** Pen. Fthills 0 67
61 ‐ Advocate to Protect Coastal Vistas** South Coast 0 44
71 ‐ Advocate to Protect Coastal Vistas** North Coast 0 40
29 ‐ Teague Hill: West Union Crk Watershed Restoration Partnership** Pen. Fthills 0 39
60 ‐ Lower Pomponio Creek: Watershed Preservation and Grazing** South Coast 0 38
43 ‐ Monte Bello: Campfire Talks & Habitat Projects** Skyline 0 27
25 ‐ Major Roadway Signage** Cities 0 16
*: Use of keypads to collect data on use of open space did not start until 11/4/13 workshop
**: Not rated at the public workshops
***: CAC did not rate all actions
#: Same participant generated action also received 119 points
Wkshp Results CAC Results***
Table 4: Comparison of All Ratings
Vision Plan Public Deliberation Summary Report 21
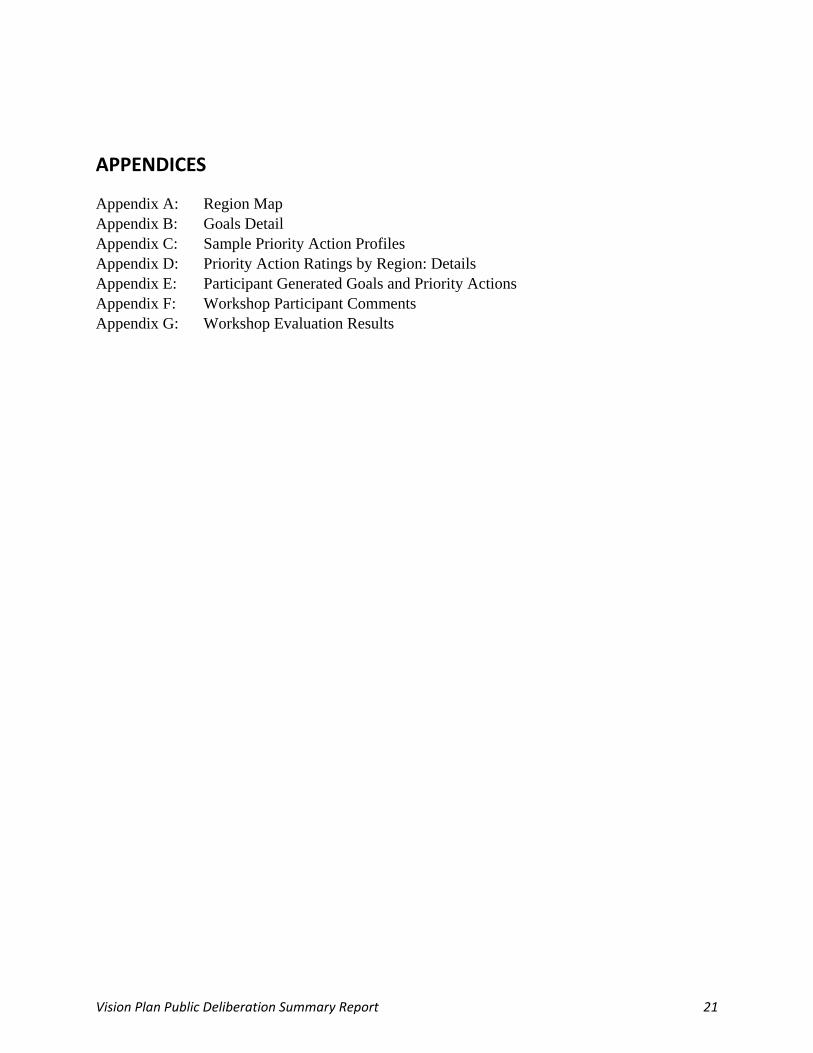
APPENDICES
Appendix A: Region Map Appendix B: Goals Detail Appendix C: Sample Priority Action Profiles Appendix D: Priority Action Ratings by Region: Details Appendix E: Participant Generated Goals and Priority Actions Appendix F: Workshop Participant Comments Appendix G: Workshop Evaluation Results