public disclosure authorized public expenditure on social ... · figure 4 public expenditure on...
TRANSCRIPT

Public Expenditure on SocialSectors in Pakistan
30612
Trends and Issues I
~ACr1
t X ) ~ Multi-donor Support Unit (MSU)
MULTI-DONOR SUPPOR UNI December 2001
Pub
lic D
iscl
osur
e A
utho
rized
Pub
lic D
iscl
osur
e A
utho
rized
Pub
lic D
iscl
osur
e A
utho
rized
Pub
lic D
iscl
osur
e A
utho
rized
Pub
lic D
iscl
osur
e A
utho
rized
Pub
lic D
iscl
osur
e A
utho
rized
Pub
lic D
iscl
osur
e A
utho
rized
Pub
lic D
iscl
osur
e A
utho
rized

-

I
Public Expenditure on SocialSectors in Pakistan
Trends and Issues
Abdul WasayBudget and Finance Specialist
Multi-Donor Support UnitIslamabad
December 2001


Glossary
ADP Annual Development PlanAJK Azad Jammu and KashmirALI Adult Literacy Index
[It is a ratio between a country's literacy rate and the maximum attainable rate (100)]BE Budget EstimateEl Education Index
[It is a measure of knowledge. A composite of adult literacy index (2/3 weight) andcombined gross enrollment rate at all levels (1/3 weight)]
FATA Federally Administered Tribal AreasFBS Federal Bureau of StatisticsFSS Federal SAP SecretariatFPA Foreign Project AssistanceFY Fiscal YearGDP Gross Domestic ProductGDP (PPP) Gross Domestic Product at Purchasing Power ParityGDPI Gross Domestic Product Index
[It is a measure of decent standard of living. GDPI =( log of a cozntry's GDP - log ofminimum GDP) /(log of maximum GDP - log of minimum GDP)]
GEI Gross Enrollment Index[It is ratio between a country 's combined gross enrollment rate at all levels and themaximum attainable rate (100)]
GER Gross Enrollnent RateGNP Gross National ProductHDI Human Development Index
[It is a summary measure of human development. It is a simple average of three otherindexes, namely, Life Expectancy Index, Education Index, and GDP Index]
HDR Human Development ReportHPI Human Poverty IndexICT Islamabad Capital TerritoryIMR Infant Mortality RateLEI Life Expectancy Index
[It is a measure of long and healthy life. LEI =( country's LER - minimum LER) /(maximum LER - minimum LER)]
LER Life Expectancy RateLICs Low Income CountriesM&E Monitoring and EvaluationMSU Multi-Donor Support UnitNA Northem AreasNWFP Northwest Frontier ProvincePIHS Pakistan Integrated Household SurveyRE Revised EstimateRWSS Rural Water Supply and SanitationSAP Social Action ProgramSAPP Social Action Program ProjectSAR South Asia RegionTA Technical AssistanceTFR Total Fertility RateUNDP United Nations Development ProgramWDR World Development Report

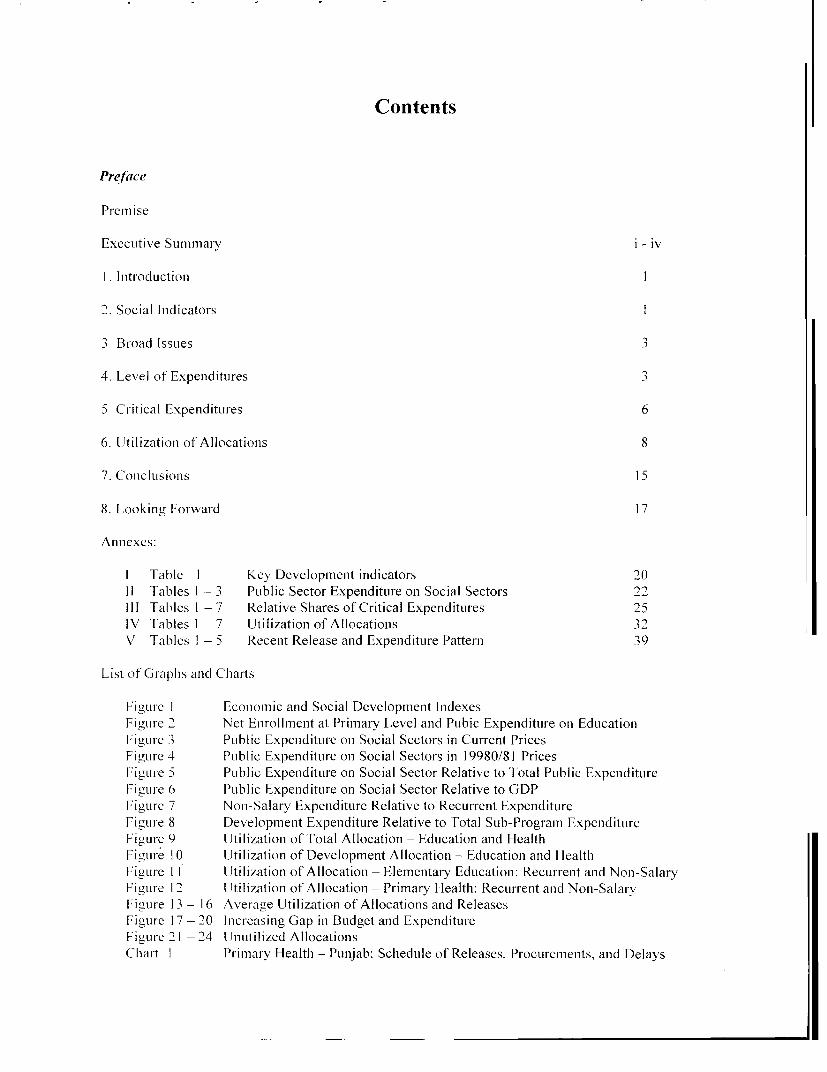
Contents
Preface
Premiiise
Executive Summiary i - iv
1. Introductioni 1
2. Social Indicators i
3 Broad Issues 3
4. Level of Expenditures 3
5 Critical Expenditures 6
6. Jtilizationi of Allocations 8
7. ConIclusionIs 15
8. Looking Forward 17
Annlexes:
I Tahle I Key Development indicators 2011 Tables I - 3 Public Sector Expenditure on Social Sectors 22IlI Tabiles I - 7 Relative Shares of Critical Expenditures 25IV Tables I - 7 Utilization of Allocations 32V Tables I - 5 Recent Release and Expenditure Pattern 39
List of Graphs and Charts
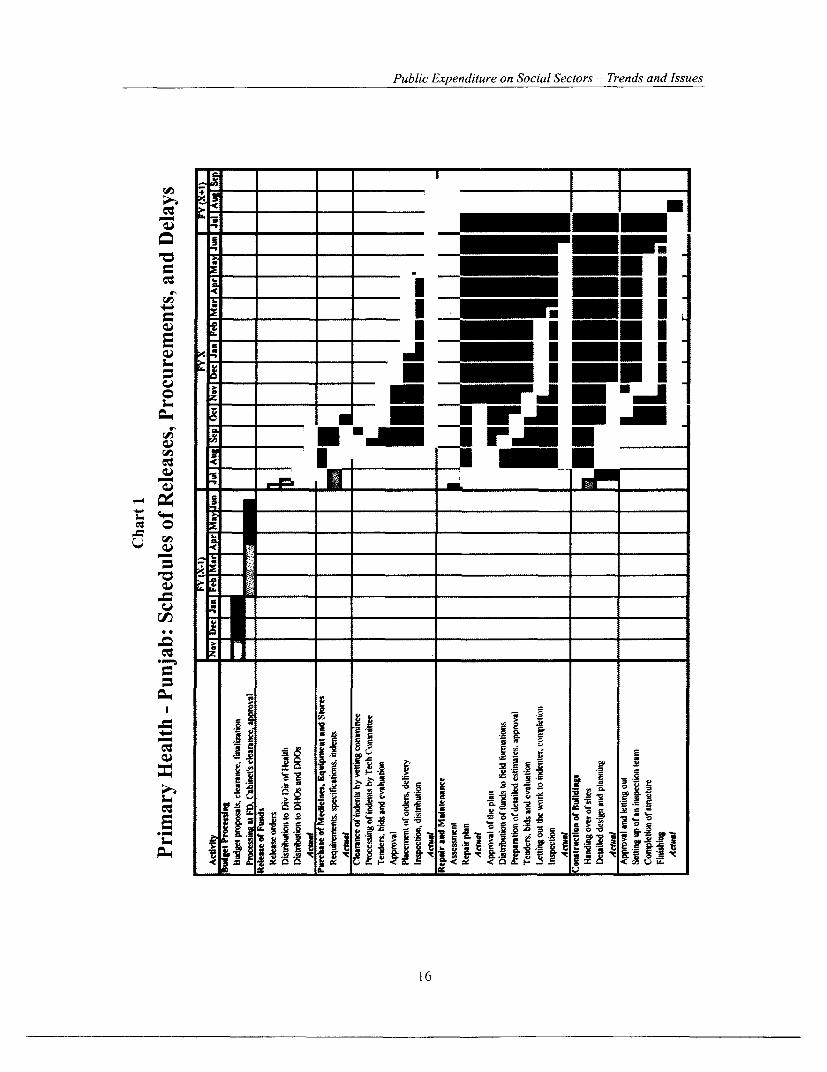
FiILuIe I Economic and Social Development IndexesFioul-e 2 Net Enrollment at Primary Level and Pubic Expenditure on EducationFigUre 3 Public Expenditure on1 Social Sectors in Current PricesFigure 4 Public Expenditure on Social Sectors in 19980/81 PricesFigul-e 5 Public Expenditure on Social Sector Relative to Total Public ExpenditureF igul-e 6 Public Expenditure on Social Sector Relative to GDPFigTure 7 Noon-Salary Expenditure Relative to Recurrent ExpenditureFigure 8 Development Expenditure Relative to Total Sub-Program ExpenditureFigure 9 Utilizationi of Total Allocation - Education and HealthFigure 10 UJtilizationi of Development Allocation - Education and HealthFigure I I Utilization of Allocation - Elementary Education: Recurrent and Non-SalaryFigure 1 2 U tilization1 of Allocation - Primary Health: Recurrent and Non-SalaryFigure 13 - 16 Average Utilization of Allocations and ReleasesFigure 1 7 - 20 Increasinig Gap in Budget and ExpenditureFigulre 2 I - 24 UlLutilized AllocationsCh1ar-t I Prim11ar-y Health - Punjab: Schedule of Releases, Procuremenits, and Delays


Preface
T Nhis paper attempts to provide a review of the current trends in public sector expenditure onsocial sectors. Using available sets of actual expenditure and budgetary data, it gives afair picture of the expenditure patterns in the nineties. The paper has been prepared in the
context of proposed Human Development Forum. It includes a review of trends in social sectorsexpenditures, pattern and status of critical categories of such expenditures, and utilization ofrelated allocations. The objective is to highlight the issues to enable policy makers to review theexisting policies and to rectify the snags.
The paper provides a reasonable comparison of the state of general development and that of thesocial sectors. It reconfirms that relative to its economic development, Pakistan lags behind in thesocial sector development. Though some of the critical social indicators have improved overtime, they are still well below the comparative indicators of tile South Asia region and theaverage of low income countries. The paper brings out clearly that, among many other factors, themost pertinent one that is causing poor level of social sector achievement in Pakistan is theunacceptably low levels of public expenditure on social sectors. Expenditure levels are notonly inadequate but also show negative trends in recent years. In this worsening scenario, notonly trends need to be reversed, but a sustained effort has to be made to ensure a positive growthin the public sector expenditures.
As stated above, the premise of this paper is actual expenditure and budgetary data. Since therehas generally been a substantial gap between allocation and utilization, it was considered moreappropriate to use actual expenditure data in delineating related trends. We hope that the readersfind the analysis and the coiiclusions of the paper useful.
Compilation, inputting and analyzing a host of related data span over a period of 10 years arepainstakingly time consuming efforts. It is against such backdrop that the efforts of Mr. AbdulWasay, Budget & Finance Specialist, MSU, are acknowledged.
Jahed-Ur RahmanChief


Premise
. With respect to social sector financing, the following issues have beenidentified as critical:
(i) Relatively low level of public sector fiscal effort;(ii) An apparent imbalance in the mix of expenditures; and(iii) Low utilization of allocated budgets due to inadequacy of and delays
In release of funds.
* Actual commitment to social sectors is not reflected in the expenditure data.Relevant to GDP, the expenditure on key social sectors have declined inthe last ten years (from 2.9 percent of GDP in 1988/89 to 2.5 percent in1998/99). Even with SAP intervention, under-funding of social sectorshas not changed significantly.
* Utilization of allocations for Education and Health is deteriorating overtime. If a real dent is to be niade in the social sectors, expenditures inthese sectors have to be increased.
. Policies and procedures for allocating resources are deficient. Theyleave huge allocated amounts un-utilized under salaries due to budgetaryallocations against all sanctioned positions - filled and vacant while n1on1-salary categories suffer from lack of available resources. These call for anurgent need to develop budgetary and expenditure standards. Likewise, thebudget estimation process needs to be revised.
* Additional fiscal space for social sector development is critical; however, asignificant improvement in service delivery and consolidation of socialservices may still be possible within the existing fiscal space provided thefollowing issues are addressed:
(i) Budget preparation and estimation process, specially relating tosalary component;
(ii) Resource management and mix of expenditures, particularlyfocusing on non-salary budget;
(iii) Management of releases of allocated budget;(iv) Revision of the need for obtaining authorization to spend from the
Finance Department subsequent to release;(v) Discontinuation of prolonged bans on1 procurement of goods and
services; and(vi) Efficient reconciliation of accounts at district level.
* The process of devolution and establishment of new local governmentstructure provide a unique opportunity to address some of the identifiedfinancial issues. The new Rules of Business that are being evolved in thecontext of devolution need to address some of such issues.


Executive Summary
Social Indicators
Pakistan's social indicators have lagged behind relative to its economic growth. There has beenimprovement over time but most of the key indicators are still lower compared to countries at similarstages of development. The Human Development Report of the UNDP for 2001 shows that despite apimprovement over time, the overall Human Development Index (HDI) for Pakistan is still lower thani theaverage of Low Income countries. Pakistan is ranked 1 27t'I out of a total of 1 67 countries in the list.
Broad Issues
The above ranking of Pakistan in terms of social development is the result of a number dfconstrainiing factors. These have been documented in numerous publications. Some of them are genericwhile some others are sectoral. Though some of such factors are not linked to each other, theyreinforce each other in slowing down progress. Progress in the past in social sectors has undoubtedlybeen affected by lower level of fiscal efforts. But more importantly, significant and prospectivSefficiency gains that could possibly be attained even under existing level of fiscal allocations were lost orsignificantly reduced due to policies and procedures that have their roots only in history with no relevancOto current situation. For the purpose of this analysis, attention is thus focused on the following broaifinancing issues: (i) relatively low level of public sector effort; (ii) an imbalance in the mix ofexpenditures; and (iii) low utilization of budgetary allocations resulting form inadequacy of andldelays in release of funds. All of these may sound familiar as they have been brought to the attention ofpolicy makers in the past also. This analysis takes a fresh look into the issues and trends on the basis ofrecent data. The paper analyses the above mentioned broad financing issues in terms of their contentand context to help the dialogue and decision making process.
Level of Expenditures
Public sector expenditures on key social sectors continue to be relatively low and recent trendsshow a real decline. Despite clearly stated importance for development of social sectors, actualcommitment to social sectors is not reflected in the expenditure data. In a worseninlg imbalance inresource and requirements in the nineties, the social sectors were hit badly. Despite a major interventionthrough the Social Action Program (SAP), the under funding of the sectors has not changedsignificantly. Some gains were made in the nineties but these are not being sustained. Recent trends arealarming and show a real decline.
Expenditures on key social sectors increased from Rs. 22.6 billion in 1988/89 to Rs. 72.0 billioiin 1998/99. In real terms (1980/81 prices), these expenlitures increased from Rs 13.4 billion to Rs,16.6 billion during the same reference years. The expenditure grew at 12.4 percent per annum, which isonly 1.8 percentage points higher relative to growth of total public expenditure during the same period.With an inflation of 9.9 percent during the same period, the real growth of expenditures on key socialsectors was only 2.2 percent.
Sector-wise, expenditures in population welfare have grown at a significantly high rate of 13.1percent on constant prices, health at 2.5 percent, and education at 2.2 percent. Expenditure on publiqhealth services declined at 0.8 percent in real terms. A disturbing fact is that these real growth ratesdecreased after the initiation of the SAP. Growth of real expenditures in education sector came down to

0.2 percent and that of health to 1.8 percent. Even more alarming fact is that the growth rates of these
sectors have turned negative since 1995/96.
Relative Changes in Expenditures
Relative share of expenditures on key social sectors in the total public sector expenditures has
only increased by 1.7 percentage points over a period of ten years. Relative to GDP, the expenditures
on key social sectors have declined in the last ten years. Total expenditure on the four key sectors was
2.9 percent of the GDP in 1988/89. It came down to 2.5 percent in 1998/99.
The share of education sector in the total public expenditure increased from 6.7 percent (in 1988/
89) to 7.8 percent (in 1998/99). It continued to increase to a maximum of 8.3 percent in 1991/92 and then
tapered of. It has turned downwards since 1994/95. Share of elementary education in the total expenditure
has marginally increased from 4.5 percent in 1992/93 to 4.7 percent in 1988/89. Relative to GDP, the
share of education has declined over time. It peaked at 2.07 percent in 1990/91 and then slided
downwards to reach 1.68 percent in 1998/99.
In the health sector, the expenditure relative to total public expenditure has increased from 2.03
percent in 1988/89 to 2.45 percent in 1998/99. The peak came in 1994/95 at 2.68 percent and then a
downslide set in. Share of primary health in total public expenditure increased from 1.01 percent to 1.45
during the reference period. A maximum of 1.66 percent was achieved in 1996/97 and then the relative
share moved downwards. The share of health expenditure in GDP declined over time. The share of
primary health, on the other hand, picked up from 0.26 percent in 1992/93 to 0.31 percent in 1998/99.
Critical Expenditures
There is a continuing imbalance in the mix of expenditures in the social sectors. Two of the most
critical types of expenditures are the non-salary part of the recurrent expenditure and the development
expenditure. The first one impacts on. the quality of service delivery and the second, in general, on
expanding and improving the coverage.
Starting from a very low level of 1.6 percent of the total recurrent expenditure in the elementary
education, the non-salary part grew at 21 percent per annum in real terms to reach a level of 4.5 percent of
the total recurrent in 1998/99. The share of non-salary kept on increasing up to 1995/96 and reached a
maximum level of 6.8 percent. Since then it has declined and remained between 4.3 and 4.8 percent.
In the primary health sub-sector, the share of non-salary component in the recurrent expenditure
has not shown any improvement. It grew at 5.2 percent in real terms and this rate of increase is lower
than the that of the salary part which grew at 6.2 percent per annum.
Share of development expenditure in the total has deteriorated both for the elementary education
and the primary health. In the elementary education sub-sector, the development expenditure decelerated
at 1.2 percent per annum against a 1.3 percent growth in the total elementary expenditure during the
reference period. In the primary health sub-sector, the development expenditure has shown a negative real
growth of 0.2 percent compared to a 4.3 percent growth in the total primary health expenditure between
the same reference period. Its share in the total expenditure has constantly declined over time.
ii

Utilization of Allocations
Utilization of allocations for education and health is deteriorating over time. Utilization ineducation and health sectors in all provinces has been relatively lower than the respective utilization ofrespective total allocations. The total utilization in education was significantly lower in five out ofseven years (1992/93-1998/99). Utilization of development allocations was significantly lower in allseven years. In the health sector, the situation was somewhat better but not satisfactory. In two yearsout of the seven, the total utilization was significantly lower. Utilization of development allocations wassignificantly lower in three out of seven years and that of recurrent, it was lower in all cases but nqtsignificantly. Province-wise, Balochistan's performance was better than any other province for boththe sectors. In the education sector, the utilization was only once significantly lower for recurrent budget.Same is the case for the health sector. Utilization of development allocations always remained lower butnot significantly.
Performance in the SAP part of the two sectors was somewhat better but not altogethersatisfactory. Recent trends show a significant decline. In 1992/93, the utilization of total allocation forelementary education was 91.1 percent. It came down to 66.4 percent in 1998/99. Out of the seveireference years, only in two years the utilization of the non-salary part was better than that of thesalary part. In two of the years, it was lower than the salary part, and in three years, it was significantlylower. Utilization of the development part of the expenditure is even worse. It has remained lower than)the total in all seven years, and out of these, in three years it was significantly lower. Position in the non-salary part of the primary health sub-sector was slightly better but not satisfactory. Utilization hascome down from 91.1 percent in 1992/93 to 69.6 percent in 1998/99. In three out of the seven years, theutilization of non-salary part of the recurrent expenditure was better than the salary part. In three of theyears, it was lower, and in one year it was significantly lower.
Factors for Low Utilization
Both the policies for and process of allocating resources to various categories are lopsided andlack efficiency. They leaves huge allocated amounts unutilized in one category while othercategories suffer from lack of available resources. An ever increasing non-utilization of recurrentsalary allocations for education and health is evident since 1995/96, both at the sector and sub-sector(SAP) levels. The unutilized recurrent allocation in the education sector in the earlier years rangedbetween Rs. 1.4 - 2.4 billion in the provinces. It jumped sharply in 1995/96 to Rs. 5.4 billion and reacheda level of Rs. 16.4 billion in 1998/99. Similarly, the unutilized recurrent allocation in the health sectorincreased more than fivefold in 1996/97 from a level of Rs. 362 million in 1995/96. It increased to 2.1billion in 1998/99. It is pertinent to note that recurrent allocations predominantly consist of salaries ipthese sectors - around 95 percent in education and 70 percent in health. A similar situation is experiencedin the SAP sub-sectors also.
The budgetary system is such that funds are allocated in preparing budget estimates for allsanctioned positions even if the positions are not likely to be filled during a fiscal year. Thqphenomenon of underutilization and the increasing trend thereof has emerged and exacerbated due tocontinued bans on new recruitments. Though the bans have resulted from the tight fiscal situation, yedthe salary budgets do not reflect this due to faulty and deficient resource allocation system. In such 4situation, on the one hand, sanctioned positions are not filled and delivery systems are adverselyaffected and, on the other, the non-salary and development allocations fall short of needs and thequality of services is even more badly hurt.
iii

A low utilization results from many other factors. Some of these are systemic and some relate to
resource availability. Some of these are internal to the implementing sectoral departments like absorptiveand implementation capacity, lengthy and rigid systems for procurements of goods and services, and
inadequate outreach to monitor availability of supplies. The factors external to the departmentsinclude delayed and inadequate releases of funds, instructions not to use released amounts due toways and means situation, and frequent and often prolonged bans on procurement of goods andservices. A recent study the government of Punjab on utilization of non-salary inputs in the primaryhealth care sector brings out these points very clearly.
The Punjab study outlines the existing theoretical time frames for procuremenits in the healthdepartment and some of the actual data reflecting delays resulting from late releases and systemic
problems. It shows that during the survey period, releases were late by two months. This, and other
problems, resulted in a delay of 4 months in purchase of medicines, equipment, and store supplies.Procurement and supplies were completed in the following fiscal year. Repair and maintenance wasdelayed by three months and construction activities by two months. All of this not only results in low
utilization of non-salary allocations but delayed procurement of supplies and untimely delivery at serviceoutlets severely affects the quality of service.
Conclusions and Observations
Trends in expenditure levels do not reflect a consistent commitment to develop social sectors.Growth rates are declining and relative position of socia! sectors is worsening. If a real dent is to bemade in the social sectors, expenditures in the social sectors have to be increased. Reprioritizationis a must. A long term policy of sustained and appreciable real increases in the level of effort has to be
chalked out and implemented vigorously. Along with this, a vigorous effort will have to be made toimprove implementation capacity, which has eroded over time for reasons that are well documented.Also, a monitoring mechanism must be evolved to ensure effective utilization of allocations. For this, are-orientation of the people at the helm of affairs in finance departments is urgently needed. Theymust be given some minimum standards that are to be adhered to. Need for developing budgetary andexpenditure standards is even more important now because of the devolution of activities andfunctions to local governments. A special effort will be required to focus their attention towardsdevelopment of social sectors and build their capacity to carry out the planning and implementation ofactivities.
The expenditures that are critical to quality and expansion of service delivery fall short ofrequirements and situation is getting worse. The budgetary process needs revisiting. Substantial over
allocations on the recurrent salary budget and meager non-salary allocation could be fixed ifimplementing departments and the finance departments make a realistic review of the situationthat is not based on the sanctioned posts but on what positions would be realistically filled in in a
particular year.
Situation of utilization of funds is worsening. Matters associated with this problem need to beaddressed urgently. Releases ought to be made in time. Allocations related to critical expendituresmust be made and released upfront to ensure timely initiation of the procurement processes.Procurement procedures need to be streamlined and simplified. The devolution plan has envisaged
delegation of related powers and activities to the lower tiers of the government. A lot of effort will berequired to train people and to evolve and implement a system of adherence and compliance under thedevolved set up. It may also take more than expected tine.
iv

Public E.rpenditure on Social Sectors - Trends and Issues
PUBLIC EXPENDITURE ON SOCIAL SECTORS - TRENDS AND ISSUES
1. Introduction
Despite considerable economic development, the coverage and quality of service deliveryin social sectors have remained inadequate in Pakistan. Some of the critical social indicators likelife expectancy, infant mortality, and illiteracy are still unsatisfactory, and even lower than someof the countries that are at similar stages of economic development. Until recently, the populationgrowth was very high and is still unsatisfactory. These factors are contributing to an increase inpoverty. Governments in Pakistan have been striving to improve the situation. A special effort inthe form of Social Action Program (SAP) was initiated in early nineties to increase the level ofeffort and to create an enabling policy environment that would improve the quality of servicedelivery in the key social sectors. Only limited gains were made. A major constraint in the wholeeffort, among many others, has been the inadequate resource availability. With spiraling debtservicing and a relatively high military expenditure, very little is available for other sectors.Currently, both of these add up to 74 percent of the total recurrent budget. This is resulting in aninadequate level of financial effort in the social sectors. Furthermore, the financial crunch is alsocausing imbalances in critical categories of social sector expenditures (establishment vsoperational and development), and putting strains on flow of funds that are resulting in furtherlowering the utilization of whatever little is allocated. In this paper, an effort is being made toassess: (i) the pattern of expenditures on major social sectors (education, health, public healthservices, and population welfare); (ii) relative position of critical expenditures in education andhealth; and (iii) trends in utilization of allocations. The objective is to identify issues that relate tolevel of effort in the social sectors.
The key development and social indicators data used in this analysis are taken fromWorld Development Reports (WDR) - 2001 and 2002 of the World Bank; Human DevelopmentReport (HDR) - 2001 of the UNDP; and Pakistan Integrated Household Survey (PIHS) - 1998/99of Federal Bureau of Statistics. Budgetary and actual expenditure data -for key major soci'.sectors has been taken from the budget documents and Combined Financial Accounts. Data onthe SAP part of the social sectors has been obtained from the Federal SAP Secretariat, donor Aidememoires, and Quarterly Monitoring Reports (QMRs). The GDP related data is from the PakistanEconomic Surveys.
2. Status of Social Indicators
Pakistan's social indicators have lagged behind relative to its economic growth. Therehas been improvement over time but most of the key indicators are still lower compared gocountries at similar stages of Figure^ I Economic and Social Development Indexes
development. Recent national and 1.oointernational reports provide 0o90
sufficient data to show the dismal 0.70
situation. The World Development i soIja i,iReports of the World Bank show 040
that Pakistan's per capita GNP in 0.20
year 2000 was better than the 0°10averages of South Asia Region Pakistan Low incom Mi Income Hih Incom1
(SAR) and Low Income countries Count Coounties comtntri
(LICs), and growth of its GDP has iiEad., du

Public Expenditure on Social Sectors - Trends and Issues
also been relatively much higher in the eighties. The growth tapered off in the nineties but was
still better than the average of LICs. The Human Development Report of the UNDP for 2001, onthe other hand, shows that despite an improvement over time, the overall Human DevelopmentIndex (HDI)' for Pakistan is still lower than the average of Low Income countries. From a valueof 0.343 in 1975, it has increased to 0.498 in 1999, which is still lower than the average value of
0.549 for LICs. Pakistan is ranked 127th out of a list of 167 countries. Table 1 at Annex Iprovides detail on social indicators and references.
The Education Index for Pakistan is even more alarming. Relative to Low Incomecountries' average of 0.58, it is 0.43 in case of Pakistan. The gross and net enrollment levels arefar below the comparable groups of countries. The combined gross enrollment ratio (for alllevels) in 1999 was 40 for Pakistan in - - --- rcomparison to 51 for LICs. Gender- r WLN *wlI t at42wywise, the combined GER for males and dfemales in Pakistan was 51 and 28, U%
respectively. The net enrollment rateat primary level shows an evenworse position. Comparable data for ***1997 shows that against rates of 64 for * * SAR and 66 for LICs (WDR, 2001), 7o -lof
Pakistan's net enrollment rate atprimary level is only 42 (PIHS, e
1998/99). Over time, it has shown
some deterioration as it was estimatedto be 44 in 1995/96. It is pertinent to relate this to low level of public sector expenditure oneducation in Pakistan. It expended 2.7 percent of GDP in 1997 on education relative to averagesof 3.1 percent in SAR and 3.3 percent in LICs.
Performance in the health sector is not much different. Infant mortality rate (IMR), a keyindicator in health sector, has improved over time but is still lower than the SAR and LICs. In
1990, it was 127 per one thousand live births in Pakistan. It came down to 91 in 1998 but stillremained relatively high. For the same reference period, the IMR for SAR came down from 119to 75, and for LICs from 97 to 68. Another important indicator, total fertility rate (TFR), gives a
similar picture in the WDR. For Pakistan, it reduced from a level of 7 births per woman in 1980to 4.9 in 1998. The average for SAR is 3.4, and for LICs, it is 3.1 in the year 1998. Linked to this
is the low contraceptive prevalence rate. During 1990-98, it was 24 percent of womenpopulation at age 15-48 in Pakistan, which is equal to the prevalence rate in LICs but much lowerthan a rate of 51 in SAR. Public sector expenditure on health relative to GDP in Pakistan was 0.9percent during 1990-98. This was slightly better than that of SAR at 0.8 percent, but far below theaverage of LICs at 1.3 percent.
In the public health services sector, the access to water supply increased from 38 percentof the population during 1982-85 to 60 percent in 1990-96. In the SAR, it improved from 52
percent to 77 percent for the same reference period. Access to a sanitation facility in Pakistan is
far better than both the SAR and LICs. The coverage is 30 percent in 1990-96 relative to 16percent in SAR and 24 percent in LICs.
l It is a composite summary measure of human development comprising Life Expectancy Index, Education Index, and
GDP Index. The value of all of these indexes ranges between 0 and 1. Summary definitions of these indexes are given
in the glossary. For more detail, please see Human Development Report 2001.
2

Public Expenditure on Social Sectors - Trends and Issues
3. Broad Issues
The above status of social development in Pakistan is the result of a number ofconstraining factors. These have been documented in numerous publications. Some of them aregeneric while some others are sectoral. Though some of such factors are not linked to eachother, they reinforce each other in slowing down progress. Any effort to make a substantiveand sustainable progress as well as qualitative and quantitative improvement in the social sectorsprimarily hinges on addressing the overall and sector financing issues, together with policies andprocedures involved in the budgetary process. Efficiency expected to emanate from a givenallocation of resources, even if not adequate, has historically been constrained due to self-defeating policies and processes involved. An immediate attention to this, with definite policymeasures to redress them, will hold future supportive key to progress in social sector in Pakistan.
Progress in the past in social sectors has undoubtedly been affected by lower level offiscal efforts. But more importantly, significant and prospective efficiency gains that couldpossibly be attained even under existing level of fiscal allocations were lost or significantlyreduced due to policies and procedures that have their roots only in history with no relevance tocurrent situation. For the purpose of this analysis, attention is thus focused on the followingbroad financing issues: (i) relatively low level of public sector effort; (ii) an imbalance in the mixof expenditures; and (iii) low utilization of budgetary allocations resulting form inadequacy ofand delays in release of funds. All of these may sound familiar as they have been brought to theattention of policy makers in the past also. This analysis takes a fresh look into the issues andtrends on the basis of recent data. The paper analyses the above mentioned broad financing issuesin terms of their content and context to help the dialogue and decision making process.
4. Level of Expenditures
Public sector expenditures on key social sectors in Pakistan continue to be relativelylow and recent trends show a real decline. Despite clearly stated importance for developmentof social sectors, actual commitment to social sectors is not reflected in the expenditure data.In a worsening imbalance in resource and requirements in the nineties, the social sectors were hitbadly. Despite a major intervention through the SAP, the under funding of the sectors hasnot changed significantly. Some gains were made in the mid-nineties but these are not beingsustained. Recent trends are alarming and show a real decline. Trends in nominal and real growthand relative position of expenditures in key social sectors are discussed below.
Figuru 1: I'ublic tipendit:urv tin Stwili SitltlniII ('urrcnt l'rices
4.1 Growth of Expenditures
Expenditures on social sectors, l 0though increasing, have remained bothlow and inadequate. In the recent 40
years, there is a visible decline. ' JO
Expenditures on key social sectorsincreased from Rs. 22.6 billion in 20
1988/89 to Rs. 72.0 billion in 1998/99.In real terms (1980/81 prices), the loexpenditures increased from Rs 13.4 obillion to Rs. 16.6 billion during the No.t Om 9WI .ibi ns .s w Vtl" "I" vim O"
3

Public Expenditure on Social Sectors - Trends and Issues
same reference years. If one looksI same rfr n e y as IfFigure 4: Public Expenditure on Social Scvtors
at Figures 3 and 4, the real growth in 1980/81 Prices
pattern can be divided in to three I_i20
distinct phases between 1988/89 and1998/99. During 1988/89 to
1991/92, the overall growth rate was s I K -significantly high. It tapered offbetween 1991/92 and 1995/96 and 4took a negative turn after 1995/96 liThe growth rates are given at Table1 of Annex II and basic. data are
contained at Table 3 of the same 5
Annex.
During the reference ten 0years, the GDP has grown at 14.3 -
percent, total public expenditure at 10.6 per cent, and expenditure on key social sectors at 12.4
percent. Inflation during the same period has been 9.9 percent. This left a real 'growth rate of
0.6 percent for the total expenditure and 2.2 percent on social sectors.
Sector-wise, expenditure on population welfare has grown at a significantly high rate of
24.3 percent, on health at 12.7 percent, on education at 12.3 percent, and on public health services
at 9.0 percent. In real terms (at constant price), the growth rates were 13.1 percent for population
welfare, 2.5 percent for health, and 2.2 percent for education. Expenditure on public health
services declined at 0.8 percent in real terms.
Time-wise, the growth of expenditure has declined in all sectors. A disturbing fact is
that, both in nominal and real terms, overall growth rates of all social sector expenditures
decreased after the initiation of the Social Action Program (SAP). In education sector, the
growth of expenditure in real terms came down from 2.2 percent for the entire period (1988/89 -
1998/99) to 0.2 percent for the SAP period (1992/93 - 1998/99). Similarly, expenditure on the
health sector declined from 2.5 percent to 1.8 percent for the same reference periods. These
reduced growth rates are related to the entire sectors (inclusive of SAP expenditure) though the
SAP parts of the sectors, viz, elementary education and primary health, grew at 1.4 and 7.0
percents, respectively. This would imply that growths of tertiary level expenditures in these two
sectors declined even more sharply.
Another way to look at the declining trends is to divide the reference period of ten
years in to distinct turning points in terms of growth rates. Figure 4 above shows sectoral
expenditures in 1980/81 prices. From this figure, three distinct periods of growth emerge. The
first period is 1988/99 to 1991/92, the second 1991/92 to 1995/96, and the third 1995/96 to
1998/99. During the first period, expenditures of three social sectors in real terms grew at
significantly high rates. Increase in education was the highest at 7.1 percent, followed by
population welfare at 6.5 percent, and health at 5.4 percent. Growth of expenditures on public
health services was, however, low at 1.4 percent. Growth rate of aggregate public expenditures
for the same period was negative at 0.3 percent. Overall level of effort on social sectors was,
therefore, reasonably going well during this period. During the second period, the growth rates of
expenditures on education and health tapered of to 2.7 percent and 4.9 percent, respectively.
Growth rate of expenditures on population welfare and p blic health services, however, increased
to 29.5 and 8.4 percent, respectively. Significantly, the real growth of expenditures on education
sector was lower than the real overall growth of public sector expenditures. Since 1995/96, which
4

Public Expenditure on Social Sectors - Trends and Issues
initiated the third period, the real growth rates for all social sector expenditures, except thatfor population welfare, have gone negative. Expenditures on public health service declined at13.8 percent, health at 3.4 percent, and education at 3.1 percent. The decline is even moresignificant when we see that the overall public sector expenditures decelerated in real terms at 1.6percent. Growth of expenditure on population welfare also declined and came down to 0.2percent.
4.2 Relative Changes in Expenditures'
The trends of relative changes in expenditure are also not good. Relative share ofaggregate expenditure on key social sectors in the total public sector expenditures has onlyincreased by 1.7 percentage points over a period of ten years. Figure 5 shows the relativeposition of expenditure on education, health, and aggregate of social sectors relative to totalpublic expenditure. Table 2 of Annex Figure 5: Public Expendiure on Social SectorsII gives relative shares with reference Relative to Total Public Expenditureto total public sector expenditure and 13.0%.GDP. The relative share of aggregate 12.0% .
social sector expenditures continued to I Iov. -pick up from 9.8 percent in 1988/89 to Io.ov. -a maximum of 12.6 percent in 1994/95 9.o.%.
and then slided down to 11.5 percent 8.0%
in 1999/99 after some ups and downs. 7.0%
The share of education sector in the __6 _ ___
total public expenditure increased from ,5 % - EdKc on6.7 percent in 1988/89 to 7.8 percent I 4 ____,.___:_-__1998/99. From 1988/89, it continued to 3.0%
increase, with some minor dips, to amaximum of 8.5 percent in 1994/95 _ sas9 S99 90 9 91.2 9293 93 9495 9S% 997 97MS 9S9_
and then tapered of to 7.8 percentinl998/99. Share of elementary education in the total expenditure has seen ups and downs and itmarginally increased from 4.4 percent in 1992/93 to 4.6 percent in 1998/99. It touched amaximum of 5.5 percent in 1995/96. The picture in the health sector is not different either. Theexpenditure relative to total public expenditure has increased from 2.0 percent in 1988/89 to 2.4percent in 1998/99. The peak came in 1994/95 at 2.7 percent and then a downslide set in. Share ofprimary health ir, total public expenditure increased from 1.0 percent to 1.4 percent during thereference period. A maximum of 1.7 percent was achieved in 1996/97 and then the relative sharemoved downwards.
Figure 6: Public Expenditure on Social SectorsRelative to GDP, the Relative to GDP
aggregate expenditures on key socialsectors have declined in the last ten 30 _____;__ __x
years. Total expenditure on the four keysectors was 2.9 percent of the GDP in -25%.
1988/89. It came down to 2.5 percent in1998/99. At its peak, it was 3.0 percent j' _ _ .
in 1994/95. Figure 6 depicts the relativeshares graphically. Sector-wise, the 'Fou Key Soci Sc ' -
share of education relative to GDP has _ E&xx =declined over time. Starting from a _ H_ a _
level of 2.0 percent in 1998/99, it peaked 05a
88,89 89,90 91G9 91/92 92,93 9394 94S95 95S96 96r97 9719 9&.99
5'

Public Expenditure on Social Sectors - Trends and Issues
at 2.1 percent in 1990/91 and then slided downwards to reach 1.7 percent in 1998/99, with up anddown variation in between. Share of elementary education increased from 1.1 percent in 1992/93to a peak level of 1.3 percent and then slided down to 1.0 percent in 1998/99, which is lower thanthe starting level of 1992/93. Similar to education, the share of health expenditure in terms ofGDP declined over time. It came down to 0.55 percent in 1998/99 in comparison to 0.61 percentin 1988/89. A declining trend is evident since 1994/95 after its peak at 0.64 percent. The share ofprimary health, on the other hand picked up from 0.26 percent in 1992/93 to 0.31 percent in1998/99. The peak level of 0.38 percent was achieved in 1995/96 and a downward trend was setin thereafter.
5. Critical Expenditures
There is a continuing imbalance in the mix of expenditures in the social sectors. Twoof the most critical types of expenditures are the non-salary part of the recurrent expenditure andthe development expenditure. The first one impacts on the quality of service delivery and thesecond, in general, on expanding and improving the coverage. In this analysis, an assessment ofcritical expenditures in terms of their mix has been attempted with respect to elementaryeducation and primary health from 1992/93 to 1998/99. The objective is to capture the nature andtrend of such expenditures and to determine their consistency with the overall objectives ofexpanding the. coverage and improving the services. Table 1 of Annex III provides relative sharesof non-salary and development expenditures for elementary education and primary health forperiod 1992/93 to 1998/99. The budgetary and expenditure aggregate data for provinces andspecial areas (AJK, FATA, ICT, NA) in current and constant prices of 1980/81 is available atTables 2-7 of the same Annex. Figures 7 and 8 below show the relative shares graphically.
5.1 Non-Salary Recurrent Expenditure
Elementary Education Figure 7: Non-Salary Expendliture
Relative to Recurrent lixpenditure
Starting from a very low level of 400. --. ___
1.6 percent of the total recurrent 3 , i-expenditure, the non-salaryexpenditures grew at an average of 21 250%
percent per annum in real terms to .reach a level of 4.5 percent of the totalrecurrent expenditures in 1998/99. The I5.0%share of non-salary kept on increasing up 0o.0%
to 1995/96 and reached a maximum level 5.0%
of 6.8 percents. Since then, it has 0.0%
declined and remained between 4.3 and 92-93 93-94 94.95 95.96 96-97 97-9S 98-99
4.8 percent. Such a low level ofexpenditure, with a declining trend, is inconsistent with the overall objective of improvingthe quality of education and has adversely affected the same. Inadequacy of training toteachers, lack and untimely availability of reading and laboratory materials at the schools, anddeteriorating conditions of schools resulting from postponed repairs and maintenance of schoolfurniture and classrooms have a negative effect on quality of education. Among others, these arethe factors that contribute to low level of enrollment and high rates of dropout in public sectorschools.
6

Public Expenditure on Social Sectors - Trends and Issues
Primary Health
Share of non-salarycomponent in the recurrent gurT 8- SD-p=m Expw&diwu
Rlab%ve to Total Sub-Promw Expendiuexpenditure has not shown any - __
improvement. It grew at 5.2 percentin real terms and this rate of increase is -lower than that of the salary part which igrew at 6.2 percent per annum. Again,the pattern of non-salary health 2
expenditure establishes a mismatchbetween objectives and actual _ performance. Between 1992/93 and i s o _1998/99, the relative share of non-salary had significant ups and downs. ____
From a level of 29.2 percent in S kr.
1992/93, it reduced to 23.1 percent in1994/95, picked up to a maximum ol .36.6 percent in 1996/97, and again . < * '4s W 9slided down to 28.1 percent, which is 1.1 percentage points lower than the 1992/93 level. Again,the low level of this category of expenditure results in inadequate supplies of medicines, bedding,x-ray films, testing equipment and other medical supplies, etc., impacting on the quality andreliability of services designed to be provided as well as shaking the public confidence in thepublic sector health delivery systems.
5.2 Development Expenditure
Elementary Education
Share of development expenditure in the total has deteriorated both for elementaryeducation and primary health. In the elementary education sub-sector, the developmentexpenditure decelerated at 1.2 percent per annum against a 1.3 percent growth in the totalelementary expenditure during 1992/93 - 1998/99. Within the development expenditure, theADP (government expenditure) deceleration was steeper at 2.7 percent while the foreignproject assistance grew at 0.2 percent. The share of development in the total expendituredecreased from 18 percent in 1992/93 to 15.4 percent in 1998/99. In between, it had significantups and downs, and from a maximum level of 21.6 percent in 1994/95, it has shown a decliningtrend.
Primary Health
Again, in the primary health sub-sector, the development expenditure has shown anegative real growth of 0.2 percent compared to a 4.3 percent growth in the total primary healthexpenditure between the same reference period. The share of development expenditure in the totalexpenditure has constantly declined over time. From a level of 29.5 percent in 1992/93, it hascome down to minimum of 22.6 percent in 1998/99. During the same period, the ADP part of thedevelopment expenditure reduced at 8.4 percent per annum and that of FPA grew at 92.3 percent.
7

Public Expenditure on Social Sectors - Trends and Issues
6. Utilization of Allocations
Utilization of allocations (budget estimates) for education and health is deterioratingover time. Three sets of data have been used to show this. The first set pertains to allocation andexpenditure data for education and health sectors in the four provinces. Table 1 of Annex IVprovides a summary of low and significantly low levels of utilizations in the two sectors derivedfrom Tables 2-6 of Annex IV. Figures 9-10 show graphic views of the aggregate anddevelopment allocations. The second set of data is related to SAP elementary education andprimary health in provinces and special areas. Table 7 gives a summary of utilization ofallocations on elementary education and primary health using data at Tables 2-7 of Annex III.
Graphic depiction of data is given at :oFigures 11-12 (para 9). The third set Figure9: Utilization ofaTotl Alocation
gives pattern of quarterly releases and 120%
utilization in SAP in the recent years. I - %
Tables 1 and 2 of Annex V provide ioo . - =_=
quarter-wise pattern of releases andutilization in the recent years for 80%
elementary education and primary ._-health. A graphic presentation of data _0_is given at Figures 13-16 (para 11) and 40% . -
more detailed data at Tables 3-5 ofAnnex V. The, data and figures 20' ...
clearly show that both at the sector 0%and sub-sector levels, the situation 92.93 93.94 94.95 95.96 96.97 97." 98.99
has worsened in general and moreso for the critical expenditures in SAP.
6.1 Education and Health Sectors in Provinces
Education Sector
A review of the aggregate Figure 10: Utilization of Development Allocation
budgetary allocations and actual Education and Health
expenditures shows that utilization in 120%
education and health sectors in 30_%
provinces has been relatively lowerthan the respective utilization of so% -
total provincial allocations. Asummary of results is given at Table 1 6'of Annex IV. Between 1992/93 and1998/99, the total utilization in 40%
education was significantly lower 20%
(more than 10 percentage points lowerthan the aggregate utilization) in five o%out of seven years. Utilization of -92-93 9394 94-95 9.96 997 97.98 9
development allocations was significantly lower (more than 20 percentage points lower than the
aggregate utilization) in all seven years. Utilization of recurrent allocations was significantlylower (more than 10 percentage points lower than the aggregate utilization) in three out of seven
years. Figures 11-12 present the situation graphically.
8

Public Expenditure on Social Sectors - Trends and Issues
Health Sector
In the health sector, the situation was somewhat better than the education, but notsatisfactory. In two years out of the seven, the total utilization was significantly lower.Utilization of development allocations was significantly lower in three out of seven years.Likewise, it was lower in all years of recurrent expenditure, but not significantly. Again, Figures11-12 provide comparative patterns of the utilization.
Province-Wise Comparison
Performance of Balochistan was better than any other province. In the educationsector, the utilization was significantly lower only once for recurrent budget. Same is the case forthe health sector. Utilization of development allocations always remained lower but notsignificantly. In comparison, Punjab, Sindh and NWFP's performance was lagging in both thesectors. Out of these, Punjab's performance was relatively better in the health sector.
6.2 Social Action Program
Elementary Education
Performance of the two sectors Figure 1: Utilizationi of Allocation
in the SAP was somewhat better but IIlemlentary Education: Recurrent and Noni-Salarynot altogether satisfactory. Recent 140.0% -- _ _. ____trends show a significant decline. In 120.0% . .TolRecuncol
1992/93, the utilization of total io.o% ... ..Non..lar.
allocation for elementary education 80.(%
was 90.1 percent. It came down to 66.4percent in 1998/99. A graphic view ofthe pattern of utilization is given at 40.0%
Figure 11. Utilization of non-salary 20.0%
part of the recurrent budgets was, in 0.0lgeneral, lower than the total recurrent 92-93 93-94 94-95 95-96 96-97 97-98 98.99
budgets for the same reference years. - -- Utiltzalion o --Figure 12: Utilizationi or ExpenditureOut of the seven reference years, only Primary Health: Recurrent and Non-Salaryin two years, 1994/95 and 1995/96, the .. --.- -utilization of the non-salary part was "better than that of the salary part. In 8o.0
two of the years, it was lower than the 60.0Y.
salary part, and in three years, it wassignificantly lower (lower by more J0.0 ET Rc - *%
than 10 percentage points). 20.0% * Non-Salay
Utilization of the 92-93 93-94 94-95 95-96 96-97 97-98 98-99
development part of the expenditure - --- ~ -
is even worse. It has remained lower than the total in all seven years, and out of these, in threeyears it was significantly lower (lower by more than 20 percentage points).
9

Public Expenditure on Social Sectors - Trends and Issues
Primary Health
Position of the non-salary part in the primary health sub-sector was slightly better but not
satisfactory. Utilization has come down from 91.1 percent in 1992/93 to 69.6 percent in
1998/99. In three out of the seven years, the utilization of non-salary part of the recurrent
expenditure was better than the salary part. In three of the years, it was lower, and in one year it
was significantly lower. Please see Figure 12 for a comparative view.
Utilization of development allocations is more alarming in primary health than the
elementary education. It has come down from 86.8 percent in 1992/93 to 38.7 percent in
1998/99. In all seven years, it was lower than the total, and in four out of seven years, it was
significantly lower.
6.3 Pattern of Quarterly Releases and Expenditures in SAP
Quarter-wise release and utilization pattern show an unsatisfactory position. This will be
evident when one looks into the data for the recent three years, i.e., 1997/98 to 1999/00. Tables I
and 2 of Annex V provide quarterly pattern of releases and utilization for elementary education
and primary health. A graphic presentation of data is given at Figures 13-16 and more detailed
data at Tables 3-5 of Annex V.
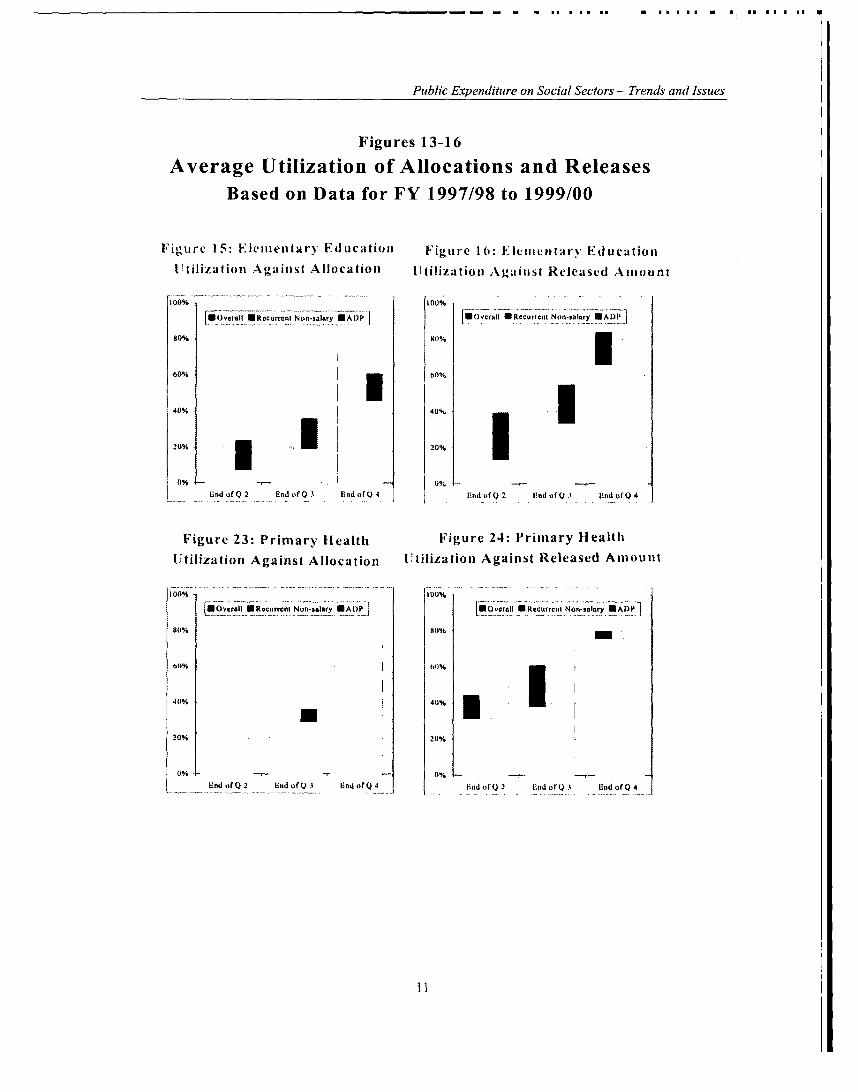
Elementary Education
By the end of second quarter of each fiscal year, the overall average utilization remained
at 37 percent of allocation and 43 percent of the released amount. At the end of the third quarter,
it was about 51 and 66 percents, respectively. The total average annual utilization was 72 on
allocation and about 84 per cent on the released amount at the end of each of these years.Utilization of critical non-salary part of the recurrent allocations was even worse. The
utilizations against non-salary allocations were 7.0, 18.9, and 45.4 per cent at the end of quarters
2, 3, and 4, respectively. It shows that most of the expenditures are made in the fourth
quarter. Only about 66 per cent of the released amount was utilized against the critical non-salary part of the recurrent allocation at the end of the year. Utilization of ADP allocations
was relatively better than that of the non-salary part across the quarters and in totality. Against
allocations, the utilization if ADP was about 60 per cent and it was 87.1 percent against releases.
Primary Health
The primary health sub-program appears to have performed somewhat better on non-
salary part of the allocations. Utilization of overall allocated amount was slightly better than
that of the elementary education, but relatively lower on the released amount. Quarterly
utilization of non-salary allocation was better than that of elementary education, but again the
bulk of expenditure were made in the fourth quarter. Utilization of non-salary allocations was
better at 78.6 percent relative to the overall 75.3 percent. Utilization of ADP allocations was
better in primary health relative to the elementary education.
6.4 Factors for Low Utilization
Distortions in Allocations
Both the policies for and process of allocating resources to various categories are not
efficient and are generally lopsided. They leaves huge allocated amounts unutilized in one
10
Public Expenditure on Social Sectors - Trends and Issues
Figures 13-16
Average Utilization of Allocations and ReleasesBased on Data for FY 1997/98 to 1999/00
Figurc 1 5: Ele[mentary Edtiucatioii Figi urC 1(: Elemientary Edt iication
t tilization Againlst Allocation r tilization Agaiust Released A imount
100% 100%
-Nsalary *AD)P iUOCratl U Recurrenl Non.snIiry*ADlPi
80% 80%
60% ~ ~~~~~~~l 60%40% 40%
20% % x _Lnd20%
B oQ 2 nd of Q 3 End ofQ 4 End of Q 2 End of Q I Hnd of Q 4
Figure. 23: Primmary Health Figure 24: Priimary HealthiUJtilization Against Allocationi Utilizatioin Against Released Amiounit
100% -I -%
9~~~~Nnar OvU liP *RccurrcnI NonIry*iP [ r naslary *ADP]80% 80%
60% F 0%
40% . 40% .1
20% 20%
0% - 0%
End ofQ 2 End ofQ 3 End ofQ 4 Had ofQ 2 Einid ofQ 3 End of Q 4
11

Public Expenditure on Social Sectors - Trends and Issues
category while other categories suffer from lack of available resources. An ever increasing
non-utilization of recurrent salary allocations for education and health is evident since 1995/96,
both at the sector and sub-sector (SAP) levels. Figures 13-16 (page I1) bring this out clearly. The
unutilized recurrent allocation in the education sector in the earlier years ranged between Rs. 1.4
and 2.4 billion in the provinces. It jumped sharply in 1995/96 to Rs. 5.4 billion and reached a
level of Rs. 16.4 billion in 1998/99. Similarly, the unutilized recurrent allocation in the health
sector increased more than fivefold in 1996/97 from a level of Rs. 362 million in 1995/96. It
increased to 2.1 billion in 1998/99. It is pertinent to note that recurrent allocations predominantly
consist of salaries in these sectors - around 95 percent in education and 70 percent in health.
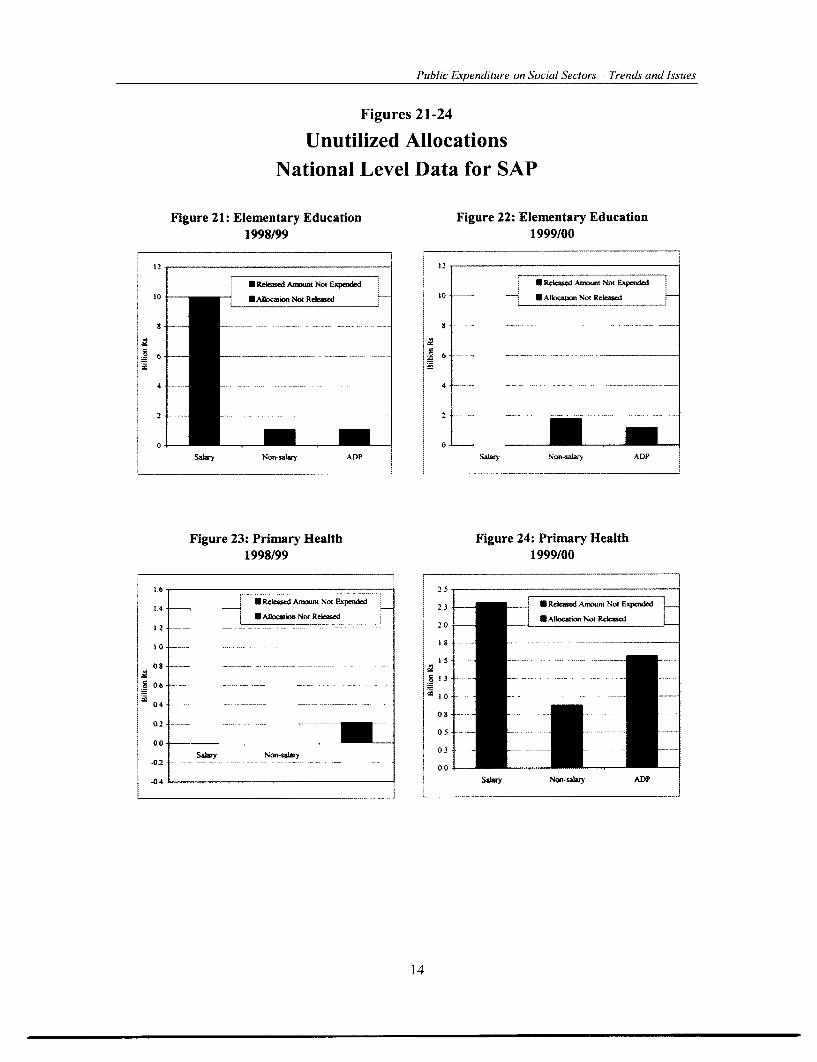
A similar situation is experienced in the SAP sub-sectors also. Figures 17-20 (page 13)
show this for elementary education and priniary health sub-sectors for two recent years. The
unutilized recurrent salary allocation in the elementary education at the national level was around
Rs. 10 billion each for the fiscal years 1998/99 and 1999/00. In the primary health sub-sector, the
unutilized amounts were Rs. 1.5 and 2.3 billion for the respective years. Figures 21-24 (page 14)
show unutilized allocations for the two reference years.
The budgetary system is such that funds are allocated in preparing budget estimates
for all sanctioned positions even if the positions are not likely to be filled during a fiscal
year. The phenomenon of underutilization and the increasing trend thereof has emerged and
exacerbated due to continued bans on new recruitments. Though the bans have resulted from the
tight fiscal situation, yet the salary budgets do not reflect this due to faulty and deficient revenue
allocation system. In such a situation, on the one hand, sanctioned positions are not filled and
delivery systems are adversely affected and, on the other, the non-salary and development
allocations fall short of needs and the quality of services is even more badly hurt. The
budgetary mechanism, therefore, needs to be adjusted to make allocations more efficient.
The salary allocations could be based on filled positions and a realistic estimation of positioned
likely to be filled during the course of a year. In the short term, it could provide a substantive
fiscal space for the critical categories of expenditure. Simultaneously, standards for allocating
non-salary part of the recurrent budget need to be updated such that they take full account of
the needs of the sectors and hedge against inflationary trends. Similarly, on the development
side, allocations should reflect the stated priorities of the sectors. The process of making
notional allocations should be done away with. Also those allocations, which are critical to a
smooth implementation of a project, should be non-lapsable (in the sense that unutilized
allocation in a fiscal year should be made available immediately in the next fiscal year).
Releases, Procedures, and Capacity
Apart from distorted allocations, a low utilization results from many other factors. Some
of these are systemic and some relate to resource availability. Some of these are internal to
the implementing sectoral departments, like absorptive and implementation capacity, lengthy
and rigid systems for procurements of goods and services, and inadequate outreach to monitor
availability of supplies. The factors external to the departments include delayed and
inadequate releases of funds, instructions from the Finance Departments to line
departments to not use the released amounts due to ways and means situation, and frequent
and often prolonged bans on procurement of goods and services. A recent study tihe
government of Punjab on utilization of non-salary inputs in the primary health care sector brings
out these points very clearly. Major conclusions of the study are:
* Budget proposals by the implementing departments are not realistic. These are based on
the sanctioned strength with a high proportion of continiued vacancies and there is an
over-bidding in requests for development funds.
1"

Public Expenditure on Social Sectors - Trends and Issues
Figures 17-20
Increasing Gap in Budget and ExpenditureAggregate Data for Provinces
Figure 17: Education Figure 18: Elementary EducationRecurrent Budget and Expenditure Recurrent Salary Budget and Expenditure
04- ___ __S__ __
_Op btr -Exe gI
40~~~~~~~~~~~~~~~~~~~~~3
5_
~~~~~~~~~0-~~~~~~~~~~~~~~1
9Z 39 93S0o4 95 -969 97 9S 99 9293 9394 9495 95f96 96 9 9798 9SW99
Figure 19: Health Sector Figure 20: Primary HealthRecurrent Budget and Expenditure Recurrent Salary Budget and Expenditure
;4r- BlJ 9 Eszem - -- &iga Esw
'z -
.1-
0l 9394 "9' 9S9 %9- 93 9S99 9V43 93 94 9495 9S96 9'97 97 9 9S99
Public Expenditure on Social Sectors - Trends and Issues
Figures 21-24
Unutilized AllocationsNational Level Data for SAP
Figure 21: Elementary Education Figure 22: Elementary Education1998/99 1999/00
2 I2
Rikased Anxm Not Ev-ded * Released AAmut Not Expcntded
fABocalion Not _R-as10 toN Albocation Not ReLased
4 -- - -4 --- -- ----- - -
0 ~~~~~~~~~~~~~~~~~~~~~~~~0 Salary Non-salary ADP Salary Non-salar) ADP
Figure 23: Primary Health Figure 24: Primary Health1998/99 1999/00
1 .6 _ 5
1 14 U RelAfdAunt Not Exended 2 3 Amoav Not E".Jed4 12 U RasdNA1.Mi.NotERxeased N R.0sedI~~~~~0s --- - -- ~~~~~~~~~~~~~~~~~1
~06 ---- - - -
04- 02 =- - - 0 ....... .- _ _
0-0
Salary Non-salary 0 3
-04 Sawry Non-salary ADP
14

I
Public Expenditure on Social Sectors - Trends and Issues
* Delayed and inadequate release of funds coupled with budgetary cuts, and frequent instructionsnot to spend the released amounts.
* Inefficient system takes 2-3 months to convey budgetary allocations to the field offices. Initiationof procurement action gets held up.
* Rigid and uncalled for pre-requisites and systems of procurement often result in delays inprocurement, and supplies do not to reach the service delivery points in time and in sufficielitquantities.
* There is an inadequate delegation of sanctioning authority, and financial powers for purchases areoutdated.
The study outlines the existing theoretical time frames for procurements in the health departmenitand some of the actual data reflecting delays resulting from late releases and systemic problems. Theseare graphically presented in Chart I (page 16). It shows that during the survey period, releases were lateby two months. This, and other problems, resulted in a delay of 4 months in purchase of medicine$,equipment, and store supplies. Procurement and supplies were completed in the following fiscal year.Repair and maintenance was delayed by three months and constructioni activities by two months. All ofthis not only results in low utilization of non-salary allocations but delayed procurement of supplicsand untimely delivery at service outlets severely affects the quality of service.
7. Conclusions
In spite of economic development over time, Pakistan still lags behinid in the critical sociqldevelopment indicators. The indictors are no better or worse than the coulitries with comparableeconomic development. This augurs for a more intense and consistent effort to rectify the situationi.Trends in expenditure levels do not reflect a consistent commitment to develop social sectors. Growth ofexpenditure in social sectors has declined and relative position of social sectors has worsened.
In its present context, financing of social sector needs to be assessed and decided upon from itsbroader perspective if the national vision for a progressive and prosperous Pakistan is to be achieved. It,however, needs to be eiisured that much needed interventioni in social sectors itself does not become ahostage to any Linendinig debate either on current fiscal space or on current fiscal opportunities. Thebottom line is that fiscal space perception is a nonstarter for any meaningful and substantive interventionin the social sectors . It has all the negative premises and connotations. On the contrary, evolving curreuitfiscal opportunities may have relevance for a limited period. It may also continlue to be susceptible toexternal balance. Hence, it will have significant bearings on sustainability in articulating any majolrintervenitioni.
Evidently, any long term solution to the endemic social sectors financing problem is to be foundinternally. This should preferably be based on internal economic and financing equations. The bestcurrent option in this regard is to take full advantage of the evolving economic developments ipredirectilng policies and efforts for a meaningful and sustainiable social change in Pakistan. Long termviability of this option would, however, predicate on direction of simultaneous efforts, withcommitment to a definite timeframe ( not to extend beyond two years), to address internalfinancing and related policies, processes and procedures.
1 ~~~~~~~~~~~~~~~15
Public Expenditure on Social Sectors - Trends and Issues
4*
en t s_=__ -- '1
a 2 __- __ _- |. io a;__ =-- _ -v _- - - U _I~
4- X-= r1- ] _
o _ __ l_l_ wl
*r~~~~~~~uA
Q ;EI ff
1 6
U~ ~ ~ ~ ~ ~ ~ ~~ ~ ~ ~ ~ ~~ ~ ~~ ~ ~~~~~~~~~~~~~~~~~~~~~~~ _ _ _ _.__ _ __

Public Expenditure on Social Sectors - Trends and Issues
The present external developments augur well for inflow of immediate resources and likelylong term investments paving the way for initiation of well conceived , well directed, and broad-basedreform initiatives , including those in social sectors ; however, experience shows that unless matchingefforts are simultaneously made internally and unless commitment at all levels is there to achieve theobjective covering all sphere of related activities, no reforn measure , however relevant it is , can sustainitself . Thus , while taking advantage of current favourable developments , it is imperative that due andtime-bound commitment is made to reassess the whole resource management system includingallocative prudence and efficiency under the current budgetary process .
If a real dent is to be made in the social sectors, expenditures in the social sectors have to beincreased. A reprioritization is a must. A long term policy of sustained and appreciable real increases inthe level of effort has to be chalked out and implemented vigorously. Along with this, a vigorous effortwill have to be made to improve implementation capacity, which has eroded over time for many reasonSthat are well documented. Also, a monitoring mechanism must be evolved to ensure effective utilizationof allocations. For this, a re-orientation of controllers in finance departments is urgently needed. Theymust realize the gravity of the situation and be given some minimum standards that must be adhered to.Need for developing budgetary and expenditure standards is even more important now because ofthe devolution of functions and activities to district/local governments. A special effort will berequired to focus attention towards development of social sectors and build related capacities to carry outthe planning and implementation of such activities.
Situation of utilization of funds is worsening. Matters associated with problem need to beaddressed urgently. In a resource crunch situation, it is important to use committed and available funds intime and effectively. Releases must be made in time. Allocations related to critical expenditures must bemade upfront to ensure timely initiation of the procurement processes. Procurement procedures need to bestreamlined and simplified. A system has to be evolved where most of the activities are delegated to lowertiers. The devolution plan has made much needed policy reorientation to devolve the process andresponsibilities in this regards to the lower tier; however, their recurrence, in one form or the other. cannotbe precluded. This needs close monitoring. In addition, a lot of effort will be required to train people andto evolve and implement a system of adherence and compliance.
8. Looking Forward
There is perhaps no better information available than the immediate experience andlessons learnt to focus on self-propelled internal reform initiatives . Reforn packages havinig theirroots to internal realities and experiences are likely to be more relevant, more effective , and more viabldin resolving key financing and budgetary issues . It is against this backdrop that the following experiencesand lessons learnt are reflected upon and dealt with to work out sustainable basis for carrying on futuresocial sector development in Pakistan:
(i) Budgetary Allocation Under "Salary" Head:
As analyzed and documented in this publication, about Rs. 12-15 billion are annually booked andeventually surrendered by all provinces under salary head of education and health sectors. This primarilyis because of estimating budget in terms of sanctioned posts. Such practices cause distortion in financialmanagemenit and impacts on allocative efficiency. If this issue is addressed, and even if 50 per cent of theaforesaid amount is not allocated to salary, significant resources can be programmed internally forquality inputs in the social sector, without resorting to fiscal measures or borrowing and within thefiscal space currently available. This has been an issue awaiting due response from the governmentfor quite sometime. Resolution of this is not that difficult either provided there is a will to do so.
17
Public Expenditure on Social Sectors - Trends and Issues
(ii) Allocations Under Non-Salary Head and Their Releases:
Lack of recognition and supportive policy decision to provide adequate non-salary budget
allocation has been a major constraining factor in planning and undertaking social sector development in
Pakistan. In monetary terms, the implication of providing such allocation and its timely release is
rather a nominal one; however, its over all impact on service delivery is substantial. Though a part
of the problem is the lack of planning and implementation capacity, a major element in thedeteriorating situation is the management of-releases. Uneven , unpredictable , and delayed releases
erode the efficiency and impact of such expenses and gives opportunities for violation of good
governance policies. The system is premised on ways and means situation alone and does not take in to
consideration the avowed priorities. Value for money concept seems to be out of the realm of those who
control resources. A balance has to achieved in resolving conflicting objectives. Allocations for non-
salary inputs are relatively small but have a greater impact on efficiency of service delivery. The national
aggregate for such inputs in elementary education sub-sector currently amounts to Rs. 2.5 billion and only
a little more for the primary health. In totality, it amounts to only one percent of the consolidatedexpenditure. By releasing this amount up-front, it is not likely to have a big affect on the ways and
means position. But the action will definitely help the process of improving quality of services with
concurrent attainment of objectives of good governance.
(iii) First Candidate for Budgetary Cut:
Traditionally, most budgets experience cuts at different times of the year and at variant
proportions; however, one unique feature is that in most of the times non-salary budget allocation is the
first candidate for enforcing such a cut. By ensuring that budget cuts do not apply to social sector
related non-salary budget allocations (which in real terms provide critical inputs for the outcomeexpected ), quality improvement and predictability of social service delivery can be improvedsignificantly. More important is that most of the priorities for improved service delivery and
enhanced coverage of services can be achieved.
(iv) Constraints within Budgetary Processes:
Budget planning and utilization have two specific elements. Though somewhat different in
relation to process, both of them have significant impact on the outcome. They relate to: (i) provision of
allocation; and (ii) timely spending of allocated amount. While the first one relates to resource
management policy, the second one predicates on procedures for resource utilization . Both these are
discussed briefly under separate sub-headings as below:
(a) Delay in Communicating Allocation: Inter and intra-category allocation issues have been
discussed separately in this paper. What, however, is equally relevant is the time lost in
communicating final budget allocations by the finance authority to the executing departments,
and by the executing departments to their line functionaries and field formations. This causes anaverage delay of about two months, or 20 per cent of the annual planned period, inprocuring goods and services, in undertaking works, and in receiving service inputs,impacting on quality and reliability of social services. Though this issue is likely to besubstantially addressed under the local government structure, efforts to achieveimprovement in this area will always merit consideration.
(b) Requirement with respect to Utilization of Budgeted Amount: In the context of utilizationof budgeted allocation, there are two specific steps involved. They are: first, release of the amount
allocated in the budget on a periodical basis by the finance authority; and second, onus on the
18

Public Expenditure on Social Sectors - Trends and Issues
executing department to obtain from the finance the needed authority to spend. This has been arequirement of the finance department for quite some time, affecting timely utilization of releasedfunds. The impact of this has been more acute and severe in the case of non-salary expendituresunder the recurrent budget. As analyzed and presented earlier in this paper (para 6.3), and if, onaverage, about 66 percent of the released amount under elementary education could be utilized bythe end of the year, then evidently there is a problem which warrants immediate attention.Creation of additional fiscal space alone will not solve financing problems of social sectors.It is issues like these, which are imbedded in systems and procedures, that need to betackled upfront with sustain commitment. The process of devolution initiated in August 2001provides an unique opportunity to address such problems. The new Rules of Business that arebeing evolved in the context of devolution must address such issues . Otherwise, no amountof fiscal space will solve problems that hitherto affected social service delivery in Pakistan.
(v) Fund Flow Consequent to Disbursement/Reimbursement:
The Social Action Programme was initiated by all provinces with enthusiasm and expectation.The provincial expectation principally hinged around expected additionality in resources as a result ofreimbursement by donors under SAP. In reality, that did not happeni . Even though a part of provincialSAP was pre-financed by the federation in the forn of grants, provinces would nevertheless expect tohave equivalent reimbursements credited to their respective account. In a deteriorating macro-economicsituation, such a position hardened gradually creating over time a negative view and perception aboutSAP among provincial policy makers. This gradually transcended provincial boundaries, and became anational phenomena . Before embarking on any new intervention with respect to social sectors, thisspecific financing issue needs to be sorted out. The problem in future may be more acute in the contextof responsibilities for financing the bulk of social sector needs by the district governments. There is aneed to take both care and caution in this respect because of immediate SAP related experience.
(vi) Distinction between Development and Recurrent Budgets:
The system of dividing the budget into development and recurrent is a time tested one and hasgenerally been institutionalized. It helped significantly overall resource management. It helped financialmanagers to project and provide for recurrent allocations consequent to development activities. However,and as witnessed in the recent past, some deviations in this arrangement are being noticed. In someprovincial budgets, established recurrent expenditures are being charged to development budgets, creatinga surplus on the revenue side. Though not a common phenomena, this needs to reviewed and sorted outpromptly to ensure maintenance of prudent financial system.
(vii) Reconciliation of Accounts at District Level:
This has been a major problem and continues to impede disbursement under external assistance aswell as causes confusion as to authenticity of the government accounting procedures. Since suchreconciliation takes longer than expected time, the audit is either delayed or contains adverse notations.This can be resolved by stipulating an extended but uniform timeframe for both the District AccountsOfficers (who work under the Office of the Provincial Accountant General or Accountant General ofPakistan Revenues) and that of Drawing and Disbursing Officers (DDOs), who work under their lineauthorities, to report their respective Receipts and Expenditures with mandatory requirements thatboth the functionaries only report Reconciled Accounts. This problem needs to be resolved. Thelocal government structure provides a unique opportunity to do so.
19


AI
AN NE XU RE S


Annex ITable 1
Key Development Indicators and ComparisonsSouth Low Nliddle High
Sotirce Data Year Pakistan Asia IncoIm1e IncoIme in1coIm1e
GeneralGNP per capita (U.S$) WDR 2002 2000 470 460 420 1-970 27 510GNP per capita (PPP. US$) WDR 2002 2000 1.960 2.260 1.990 5.650 27.450GDP growth (annual WDR 2001 1980-90 6.3 5 7 4.4 3.2 3.1
1990-9c) 4 9 57 24 3.5 24GDP index HDR 2001 0.49 0 49 0 66 0 93Populationi belos( the povertm line WDR 2002 1991 37 0
Population below $1 per day WDR 2002 1996 31.0Population below $2 per day WDR 2002 1996 84 7
HDI Ranki (Index) HDR 2001 1999 127HDI (Value) HDR 2001 1999 0.498 0.549 0.740 0.926
(Pakistan 1975=0 343. 1980=0.370. 1985=0.403 .1990=0 448. and 1995=0.476)HPI Rank (Index) HDR 2001 1999 65HPI (Value) HDR 2001 1999 39.2
Military expenditure (% ofGDP) WDR 2001 1992 7.4 3.1 2.7 4.0 3 1
k.) 1997 5 7 2.3 2.9 2.8 2.4Debt service (% ofGDP) HDR 2001 1990 480 3.70 3.60
1999 5.20 4 60 6.30Debt service (% ofexports) HiDR 2001 1990 23.00 26.60 16.90
1999 30.50 . 18.80 21.80
EducationEducation Index HDR 2001 1999 0.43 0.58 0.82 0.97Gross enrollment rate at primary level(%) PIHS 1998/99 1995/96 75
1996/97 72
1998/99 71Net enrollment rate at primary level (%) PIHiS 1998/99 1995/96 44
1996/97 42
1998/99 42
WDR 2001 1980 64 66 86 97
1997 77 76 97 100Combined gross enrollmeit ratio (all levels. o) HDR 2001 1999 40 5I 74 93
Male HDR 2001 1999 51Female 1IDR 2001 1999 28
Adult illiteracy rate (% for age 15+) WDR 2002 1999 55 46 39 15Public expenditure on education (% of GNP) WDR 2001 1980 21 2.0 3 4 38 85
1997 2.7 3 1 3.3 4 8 5.4HDR 20041 M8-87 3 1HDR 2001 1995-97 2 7
Public expenditure on education (% of govt. expenditure) HDR 2001 1985-87 8.8
HDR 2001 1995-97 7.1
.......... continued

Southl L[ow Nliddle HighSource Data Year Pakistan Asia Incomile Incolime income
Health and PopulationLife expectanc at birth (\ears) \DR 2002 1999 63 63 59 h9 78Child (under 5) mortalit\ rate (per 1-000) U'DR 2002 1999 126 99 116 38 6Infant mortaliti rate (per 1.000 hIc birtlisI WDR 2001 1990 127 119 07 60 12
1998 91 75 68 31 6Total letilht\ rate (births per 'lomaini WDR 2001 1980 7 I 5 3 4.3 3 7 1 8
1998 4.9 34 3 1 25 1 7ContraceptiNe prevalenice (% ofwomilei ages 15-48) WDR 2001 1990-98 24 49 24 53 75Child malnLItritionl O°o under ages) WDR 2001 1992-98 38 51 14Adult HIV prevalence ( 0of age 15-49) HDR 2001 1999 0.1 1 3 1 0 03TB cases per 100.000 people) HDR 2001 1999 60 92 52 15
Public expeinditure on healthi %/6 ofGDP) WDR 2001 1990-98 0 9 0 8 1 3 3.1 6 2HDR2001 1990 1.1
1998 0.9
Water & SewerageAccess to improved wvater source (Io of population) WDR 2001 1982-85 38 52
1990-96 60 77Access to sanitation. (%/o of poptilatioin) WDR 2001 1982-85 16 7
1990-96 30 16 24Access to sanitation, urban (% of population) WDR 2001 1990-96 53 46 56
GDP Gross Domestic ProductPPP Purchasing Power ParityHDI Human Development IndexHPI Human Povertv Index
HDR Htmian Development ReportWDR World Development ReportPIHS Pakistan Integrated Household Surve\
South Asia Incltides six lo\ incomiie countries (Afghanistan. Bangladesh. Bhutani India. Nepal. Pakistan ) and two middle income counitries(Maldives and Sri Lanka)
Lo\ Incomile Countries with pcr capita incomiie oftilp to US$ 755Niddle Income Coun1tries wNith per capita income of US$ 756 to 9.265High Income Couittries with per capita income of US$ 9,266 and aboxe

Annex II, page 1 of 3Table 1
Growth of Public Expenditure on Social SectorsSAP Turning Periods
Period Period I Period 2 Period 31988/89 1992/93 1988/89 1991/92 1995/96
to to to to to1998/99 1998/99 1991/92 1995/96 1998/99
(10 years) (6 years) (3 years) (4 years) (3 years)1 2 3 4
1. Expenditure in Current Prices
Total 10.6% 10.9% 9.5% 14.4% 7.0%
Key Social Sectors 12.4% 10.7% 16.6% 15.5% 4.4%
Educationi 12.3% 10.4% 17 6% 13 9% 5.4%3f irhich SAP 1.7% 0.9%
Health 12.7% 12.2% 15 X% 164% 5.1%if wuhich SAP 17.9% 4.4%
Populationi 24.3% 23.9% 17 0% 43 6% 9 0%
Public Health Services 9.0% 5.5% 11.3% 20.2% -6.2%
2. Expenditur-es in 1980/81 Prices
Tlotal 0.6% 0.7% -0.3% 3.1% -1.6%
Key Social Sectors 2.2% 0.4% 6.2% 4.1% -4.0%
Educationi 2.2% 0.2% 7. 1%' 2 7% -3.1%of ii'hich ISAP 1.4% -7.2%
llealtli 2.5% 1.8% 5.4% 4.9% -3.4%o/ichiChi SAP 7.0% -4.0%
Population 13.1% 12.4% 6 5% 29.5% 0.2%/o
lPublic Hleealtl Services -0 8% -4 2% 1.4% 8.4% -13.8%
3. GDI' and Inflation
GiDP (market prices) 14.3% 14.0% 163% 15.3% 11.1%
GiDP Detlator(19980/81 100) 9.9% 10.2% 9.8%YO 10.9% 8.8%
22

Annex II, page 2 of 3
Table 2
Relative Position of Public Expenditure on Social Sectors
1988/89 1989/90 1990/91 1991/92 1992/93 1 Q93/94 1994/95 1995/96 1996/97 1997/98 1998/99
1 2 3 4 5 6 7 8 9 10 11
1. Social Sectors Relative to Total 9.8% 10.7% 11.3% 11.8% 11.6% 12.1% 12.6% 12.3% 11.6% 12.0% 11.5%
Public Expenditure
Education 6.7% 755% 7 9% 833% 8.0% 84%o 8.5°o 8.1°% 79% 8.2% 7.8%
of which SAP 4 4 %, 4.6% 5 2% 5 5% 5 1% 4.8% 4.6%
Health 2.0% 2 2% 2.30% 2 4% 2.30o 2 5% 2 7/o 2.6% 2 5% 2.5% 2 4%
of lhich SAP I 0% 1.3% 1 4% 1 6% 1.7°'% 1 5% 1 4%
Population 0.1% 0 2% 0.2% 0.20/O 0.2°o 0.3% 0.3% 0.4%/o 0.3% 0.4% 0.4%
Public Health Services 1.0% 090/% 0.9% 10% 1.1° 10% 1.I°% 1.2°o% 0 9% 1.0% 0 P8/o
2. Social Sectors Relative to GDP 2.94% 2.90% 2.93% 2.97% 2.95% 2.91% 3.01% 2.99%. 2.54% 2.69% 2.48%
Educatioin 2 01%/o 2.02°o 2 06°o 2 07- 2.030o 2.01% 2 03% 1.97% 1 730% 1 83% 1 68%
of ihich SAP 1.13%zo I 11% 1 24% 1.34% 1 126 1.07% 1.00%o
Health 0.61% 0.59% 0 59% 0.60% 0 58%o 0.59% 0.64%. 0.620/o 0 55% 0 55% 0 53%
of i*zhiclh SAP 0 26%/o 0 31 /o 0 33% 0 38% 0 36% 0 34% 0.31%/.
Population 0.040'o 0.04%o 0 04% 0.04°o 0 05% 0 06% 0 0)8%/ 0 09%6 1 06%o 0 080o 0.09°-
Public Health Services 0 29/o 024°o 0.24%/o 0 25% 0.28% 0 25% 026% 030°o 020% 0.23% 0.18%

Annex 11, page 3 of 3Table 3
Consolidated Public Expenditure on Social Sectors(Million Rs.)
1988/89 1989/90 1990/91 1991/92 1992/93 1993/94 1994/95 1995/96 1996/97 1997/98 1998/991 2 3 4 6 7 8 9 10 11
1. Expenditure in Current Prices
Total 231,029.5 231,671.0 264,817.7 303,228.7 340,886.1 377,251.3 451,133.0 518,556.2 538,460.2 598,682.4 635,360.3
Key Social Sectors 22,644.9 24,848.2 29,894.6 35,925.7 39,556.6 45,794.7 56,651.5 63,936.0 62,454.8 72,038.3 72,789.9
Education 15,4442 17,321.4 20,9745 25,112.5 27,266.5 31,579 9 38195.5 42.1944 42.604.1 49084.1 49.4067of which SAP 15.168.0 17,529.0 23.417.0 28,715.0 27,454.0 28.662.6 29,520.0
Health 4.701 0 5.083 6 6,019.4 7.299.0 7,780 3 9.326.3 12,081 3 13.383 7 13,435.2 14.730.7 15.546 9of which SAP 3.427.9 4,923.9 6.250 , 8.081 6 8,922.5 9.156.4 9,202.0
Population 294 7 357.3 414.7 471.7 717.1 983.5 1,482.7 2.004 5 1,448.9 2.132.5 2.592 6
,'i Public Health Services 2.205 1 2,086.0 2,486.0 3,042.5 3,792 6 3,905.0 4,892 1 6,353.4 4.966.6 6,091.0 5,243.7
2. Expenditures in 1980/81 Prices
Total 136,220.2 128,321.2 129,729.9 134,954.3 139,610.1 136,898.5 143,403.5 152,565.9 139,772.7 144,347.8 145,195.3
Key Social Sectors 13,352.0 13,763.3 14,644.9 15,989.0 16,200.4 16,618.2 18,008.1 18,810.8 16,211.9 17,369.1 16,634.3
Education 9.106.2 9,594.2 10,275.1 11.1765 11.167.0 11,459.8 12.1414 12.4141 11.0591 11.8346 11.290.6qf which SAP 6,212.1 6,361.0 7,443.7 8,448.3 7.126 5 6,910 8 6,746.0
Health 2,771.8 2.815 8 2,948 8 3,248.5 3.186.4 3,384.4 3840.3 3.937 6 3.487 5 3.551 7 3.552 9ofin/ich iSAP 1,403.9 1,786.8 1,986.9 2,377.7 2.316 1 2,2077 2,102.9
Population 173.8 197 9 203.1 210.0 293.7 356.9 471.3 589 8 376 1 514 2 592.5
Public Health Services 1,300.2 1 155 4 1,217 9 1,354 1 1.553 3 1417 1 1.555 1 1.869 2 1,289.2 1.468.6 1, 198.3
3. Reference Data
GDP (market prices) 769,745.0 855,943.0 1,020,600.0 1.211.385 0 1,341,629.0 1,573.097.0 1.882.071 0 2.141.842.0 2.457.381 0 2.677.656.0 2,938,379.0
GDPDeftltQrI9980/81 = 00) 169.6 18035 2ft4-I 224.7 2442 275-6 314.6 3389 8.852 414.8 437.6
Sources: Sector Expenditures Government of Pakistan, Combined Finance AccountsSAP Expenditur es Federal SAP SecretariatGDP and Deflator Pakistan Economic Surveys

Annex III, page 1 of 7
Table 1
Relative Shares of Non-Salary and Development Expenditure
Elementary Education and Primary Health
Provinces and Special Areas(Million Rs.)
Real92/93 93/94 94/95 95/96 96/97 97/98 98/99 Growth
1 2 3 4 5 6 7 8
1. ExpendituresShare of Non-salary inRecurrent Expenditure
Elementaiy Education 1.6% 2.7% 4.90/o 6.8% 4.3% 4.8% 4.5% 20.9%
Primary Health 29.2% 26.6% 23.1% 28.4% 36.6% 32.8% 28.1% 5.2%
Proportion of Developmentin Respective Total Expenditure
Elemenitary Education 18.0% 13.7% 21.6% 18.4% 14.8% 16.5% 15.4%/o -1.2%
Primary Health 29.5% 27.0% 28.8% 28.0% 24.1% 22.7% 22.6% -0.2%
2. AllocationsShare of Non-salary inRecurrent Allocation
Elementary Education 2.3% 3.0% 4.7% 5.3% 7.1% 5.8% 5.1% 21.3%
Primharv Hlealth 29.0% 28.2% 30.4% 29.1% 30.4% 30.1% 29.0%/o 10.1%
Proportion of Developmentin Respective Total Allocation
Elemilenitar-y Education 23.2% 16.6% 23.0% 21.1% 21.5% 21.9% 23.7% 6.90/%
Primary Health 30.3% 32.10/o 35.9% 31.8% 28.8% 28.1% 35.2% 14.2%
25

Annex III, page 2 of 7
Table 2
Budget AllocationsElementary Education and Primary Health
Provinces and Special Areas(Million Rs.)
1992-93 1993-94 1994-95 1995-96 1996-97 1997-98 1998-99 Growth1 2 3 4 5 6 7 8
Elementary EducationIn Current Prices 16,828.0 17,477.0 24,395.0 28,722.6 34,254.9 40,232.7 44,233.0 17.5°u
Recurrent 12,921.0 14,570.0 18,788.0 22,672.6 26,874.4 31,423.5 33,768.0 17.4%Slarx 1 2,620.0 14,139.() 17,913.( 21,469.9 24,979.0 29,597.4 32.046.() 16.8X%Non-salarN 301.0 431.0 875.0 1,202.7 1,895.4 1,826.1 1,722.0 33.7°u
Development 3,907.0 2,907.0 5,607.0 6,050.0 7,380.5 8,809.2 10,465.0 17.8%AI)P 3.099.0 2,075.0 3,721.0 4.257.() 4.153.2 4,200.4 3,316.0 1.1 %IFPA 808.0 832.0 1,886.( 1.793.() 3,227.3 4,608.8 7,149.0 43.8%
In 1980/81 Prices 6,891.9 6,342.1 7,754.5 8,450.6 8,891.8 9,700.5 10,108.3 6.6%Recurrent 5,291.8 5,287.2 5,972.2 6,670.6 6,976.0 7,576.5 7,716.8 6.5%
Salary 5,168.5 5.130.8 5.694.1 6,316.7 6,484.0 7,136.2 7,323.3 6.0%Non-salarv 123.3 156.4 278.1 353.8 492.0 440.3 393.5 21.3°o
Development 1,600.1 1,054.9 1,782.3 1,780.0 1,915.8 2,124.0 2,391.5 6.9%AD1)P 1,269.2 753.0 1,182.8 1,252.5 1,078.1 1,012.8 757.8 -8.2°-oFPA 330.9 301.9 599.5 527.5 837.7 1,111.2 1,633.7 30.5°'o
Primary HealthIn Current Prices 3,686.6 4,727.5 5,953.5 6,860.2 8,271.5 10,517.7 12,618.0 22.8%
Recurrent 2,569.4 3,211.7 3,818.8 4,680.1 5,886.8 7,567.3 8,180.0 21.3%Salarv 1,823.4 2,306.7 2,657.2 3.316.1 4.094.4 5.288.9 5,805.0 21.3%Non-salary 746.0 905.0 1,161.6 1,364.0 1,792.4 2.278.4 2.375.0 21.3%
Development 1,117.2 1,515.7 2,134.7 2,180.1 2,384.7 2,950.5 4,438.0 25.8%/uADP 1.1()9.2 1,189.4 1,941.1 1,978.3 1,577.4 1,578.4 1,499.0 5.1%1E1P,A 8.( 326.3 193.6 2(01.8 807.3 1.372.1 2,939.0 167.6%
In 1980/81 Prices 1,509.8 1,715.5 1,892.5 2,018.4 2,147.1 2,535.9 2,883.5 11.4%Recurrent 1,052.3 1,165.5 1,213.9 1,377.0 1,528.1 1,824.5 1,869.3 10.1%
SLalary 746.8 837.1 844.7 975.6 1,062.8 1,275.2 1,326.6 10.1%Non-salary 3(05.5 328.4 369.2 401.3 465.3 549.3 542.7 10.1°%
Development 457.5 550.0 678.6 641.4 619.0 711.4 1,014.2 14.2°'oA[)P p 454.3 431.6 617.0 582.0 409.5 380.6 342.6 -4.6°-oFPA 3.3 118.4 61.5 59.4 209.6 33(0.8 671.6 142.8%
Proportion of Non-salaryin Total Recurrent
I L i,. i. Education 2.3% 3.0% 4.7% 5.3% 7.1% 5.8% 5.1%/oPrimary Healthi 29.0% 28.2% 30.4% 29.1% 30.4% 30.1% 29.00/o
Proportion of Developmentin Total
Elementary lEducatioll 23.2% 16.6% 23.0%o 21.1% 21.5% 21.9% 23.7%/oPrimary lAealti 3(0.3% 32.1% 35.9% 3 1.8% 28.8% 28.1I/o 35.2%
SouIce: 1ederal SAP Secretariat, Islamabad
26

Annex III, page 3 of 7
Table 3
ExpenditureElementary Education and Primary Health
Provinces and Special Areas(Million Rs.)
1992-93 1993-94 1994-95 1995-96 1996-97 1997-98 1998-99 Growth1 2 3 4 5 6 7 8
Elementary EducationIn Current Prices 15,164.0 17,520.0 23,358.0 28,634.0 27,342.0 28,574.6 29,386.0 11.7%
Recurrent 12,434.0 15,113.0 18,313.0 23,352.0 23,307.5 23,856.6 24,849.0 12.2%Salary 12,233.0 14,702.0 17,416.0 21,759.0 22,311.4 22,712.0 23,725.0 11.7%Non-salarv 201.0 411.0 897.0 1,593.0 996.1 1,144.6 1,124.0 33.2%
Development 2,730.0 2,407.0 5,045.0 5,282.0 4,034.5 4,718.0 4,537.0 8.8%A[)P 1.422.0 1,565.0 3,185.0 3,567.0 2,336.2 2,070.0 2,165.0 7.3%I2I1A 1,308.0 842.0 1,860.0 1,715.0 1,698.2 2,648.0 2,372.0 10.4%
In 1980/81 Prices 6,210.4 6,357.7 7,424.9 8,424.5 7,097.4 6,889.6 6,715.4 1.3%Recurrent 5,092.4 5,484.3 5,821.2 6,870.5 6,050.1 5,752.0 5,678.6 1.8%
Salary 5,010.0 5,335.1 5,536.1 6,401.8 5,791.6 5,476.1 5,421.7 1.3%Non-salary 82.3 149.1 285.1 468.7 258.6 276.0 256.9 20.9%
Development 1,118.1 873.5 1,603.7 1,554.0 1,047.3 1,137.6 1,036.8 -1.2%/o
ADIP 582.4 567.9 1,012.4 1,049.5 606.4 499.1 494.8 -2.7%F'PA 535.7 305.5 591.2 504.6 440.8 638.5 542.1 0.2%
Primary HealthIn Current Prices 3,292.9 4,347.9 5,487.7 6,241.6 6,934.5 8,016.4 7,595.0 14.9%
Recurrent 2,323.1 3,173.5 3,908.7 4,495.2 5,261.0 6,196.5 5,876.0 16.7%Salaiy 1,643.7 2,329.2 3.006.9 3,217.2 3,335.3 4,164.0 4,222.0 17.0%Non-salary 679.4 844.2 901.8 1,278.0 1,925.7 2,032.5 1,654.0 16.0%
Development 969.8 1,174.5 1,579.0 1,746.4 1,673.5 1,819.9 1,719.0 10.0%A[)P 962.1 951.0 1,289.5 1,574.6 1,263.1 1,240.3 1,021.0 1.0%FPA 7.7 223.5 289.6 171.8 410.5 579.6 698.0 111.9%
In 1980/81 Prices 1,348.6 1,577.8 1,744.4 1,836.3 1,800.0 1,932.8 1,735.6 4.3%Recurrent 951.4 1,151.6 1,242.5 1,322.5 1,365.6 1,494.0 1,342.8 5.9%
Salary 673.2 845.2 955.8 946.5 865.8 1,004.0 964.8 6.2%Non-salarN 278.2 306.4 286.7 376.0 499.9 490.1 378.0 5.2%/o
Development 397.2 426.2 501.9 513.8 434.4 438.8 392.8 -0.2%ADI' 394.0 345.1 409.9 463.3 327.9 299.0 233.3 -8.4%F[PA 3.2 81.1 92.0 5().5 106.6 139.7 159.5 92.3%
Proportion of Non-salaryin Total Recurrent
Elementarv [ducation 1.6% 2.7% 4.9% 6.8% 4.3% 4.8% 4.5%
Primary I lcaltti 29.2°o 26.6% 23.1% 28.4% 36.6%/o 32.8% 28.1%
Proportion of Developmentin Total
I'leiacaitary Educatioll I X8.o 13.7% 21.6% 18.4% 14.8% 16.5% 15.49/0l'rimarv Hlealth 29.5% 27.0% 28.8% 28.0% 24.1% 22.7% 22.6%
Source: Federal SAIP Secretariat, Islamnabad
27

Annex 111, page 4 of 7
Table 4
Budget AllocationsElementary Education and Primary Health
Provinces(Million Rs)
1992-93 1993-94 1994-95 1995-96 1996-97 1997-98 1998-99 Growth
1 2 3 4 5 6 7 8
Elementary EducationCurrent Prices 15,802.0 16,375.0 22,979.0 27,139.6 32,519.0 38,055.9 41,827.0 17.6%
Recurrent 12,101.0 13,657.0 17,771.0 21,479.6 25,477.0 29,722.7 31,864.0 17.5%
Salary I .806.(0 13,235.0 16,948.0 20.352.9 23,658.7 27,937.1 30,259.0 17.0%
Non-salary 295.() 422.0 823.0 1,126.7 1.818.3 1,785.6 1,605.0 32.6%/o
Development 3,701.0 2,718.0 5,208.0 5,660.0 7,042.0 8,333.2 9,963.0 17.9%
ADP 2,893.0 1,886.0 3,351.0 3,895.0 3,845.7 3,885.4 2,996.0 0.6%
FPA 808.( 832.0 1,857.0 1,765.0) 3,196.3 4,447.8 6,967.0 43.2%
1980/81 Prices 6,471.7 5,942.2 7,304.4 7,984.8 8,441.2 9,175.6 9,558.5 6.79/o
Recurrent 4,956.0 4,955.9 5,648.9 6,319.6 6,613.3 7,166.4 7,281.7 6.6o
Salar\ 4,835.2 4,802.8 5,387.3 5,988.1 6,141.3 6,735.9 6,914.9 6.1 %
NoM-SahUlIN 120.8 153.1 261.6 331.5 472.)) 430.5 366.8 20.3%
Development 1,515.7 986.3 1,655.5 1,665.2 1,828.0 2,009.2 2,276.8 7.0%
ADP 1,184.8 684.4 1,065.2 1,146.0 998.3 936.8 684.7 -8.7%
FPA 330.9 301.9 590.3 519.3 829.7 1 .72.4. 1,592.1 29.9%
Primary HealthCurrent Prices 3,319.0 4,261.2 5,334.9 6,217.2 7,426.9 9,495.7 11,289.0 22.6%/o
Recurrent 2,299.0 2,856.3 3,370.8 4,208.1 5,307.6 6,935.3 7,425.0 21.6%
Salary 1.630.0 2,053.9 2,342.7 2,961.2 3,696.7 4,853.1 5,281.0 21.6%
Non-salary 669.0) 8X)2.4 1,028.1 1,246.9 1,610.9 2.)82.2 2,144.0 21.4%o
Development 1,020.0 1,404.9 1,964.1 2,009.1 2,119.3 2,560.4 3,864.0 24.9%
ADI' 1.(12.() 1,()78.6 1,771.! 1,824.6 1.436.0 1.338.8 1,095.0) 1.3%/o
I IA 8.1 326.3 193.0) 184.5 683.3 1.221.6 2.769.0) 165.0(%
1980/81 Prices 1,359.3 1,546.3 1,695.8 1,829.2 1,927.9 2,289.5 2,579.8 11.3%,o
Recurrent 941.6 1,036.5 1,071.5 1,238.1 1,377.7 1,672.2 1,696.8 10.3°o
Salary 667.6 745.3 744.7 871.2 959.6 1.170).1 1,206.8 10.4%
Non-salary 274.0 291.2 326.8 366.9 418.2 50)2.0) 491).0) 10.2 0/
Development 417.7 509.8 624.3 591.1 550.1 617.3 883.0 13.3%0
ADP 414.5 391.4 563.0 536.8 372.8 322.8 2510.2 -8.1°%
F'PA 3.3 118.4 61.3 54.3 177.4 294.5 632.8 140.4%/,)
Source. Federal SAIP Secretariat. Islamathad
28
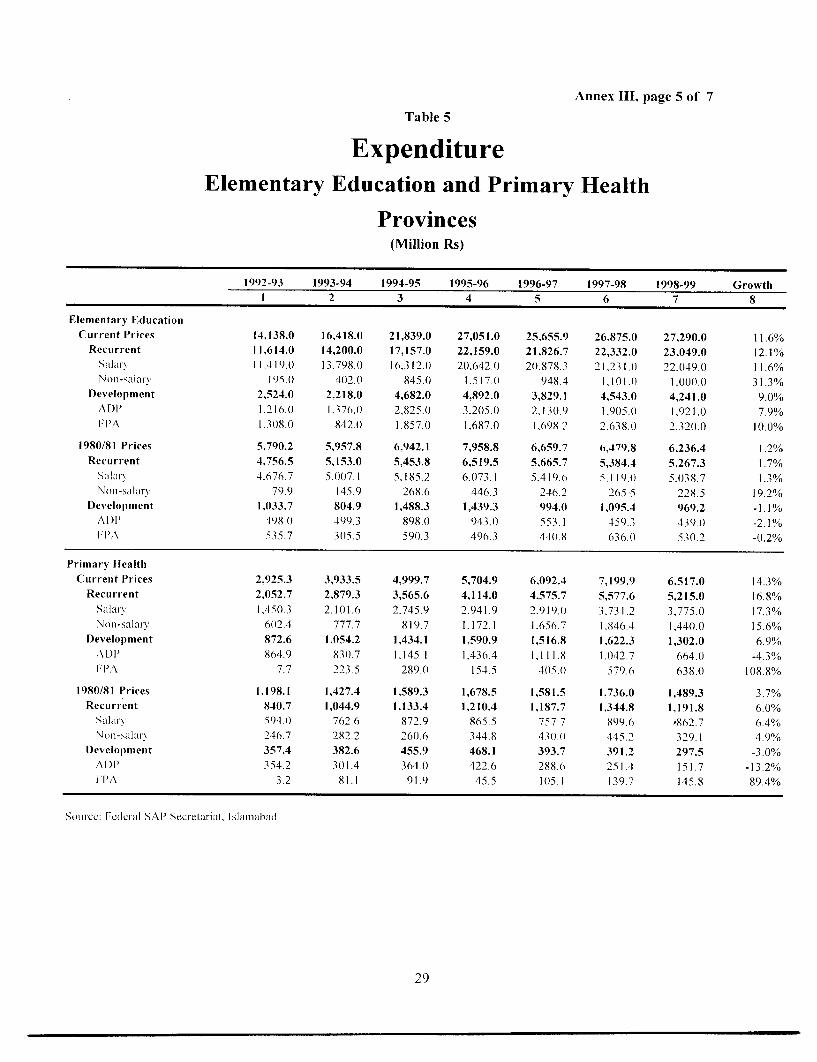
Annex III, page 5 of 7
Table 5
ExpenditureElementary Education and Primary Health
Provinces(Million Rs)
1992-93 1993-94 1994-95 1995-96 1996-97 1997-98 1998-99 Growth1 2 3 4 5 6 7 8
Elementary EducationCurrent Prices 14,138.0 16,418.0 21,839.0 27,051.0 25,655.9 26,875.0 27,290.0 11.6%
Recurrent 11,614.0 14,200.0 17,157.0 22,159.0 21,826.7 22,332.0 23,049.0 12.1%Sakl8r- 11,419.0 1 3.798.0 16,3 12.0 20,642.0 20,878.3 21,23 1.( 22,049.0 11.6%Non-salarv 195.( 402.0 845.0( 1.517.0 948.4 1,101.( 10(0.0 31.3%
Development 2,524.0 2,218.0 4,682.0 4,892.0 3,829.1 4,543.0 4,241.0 9.0%ADI 1.216.0 1.376.0 2,825.0 3,205.0 2,130.9 1,905.0 1,921.0 7.9%FPA 1,308.0 842.0 1.857.0 1,687.0 1,698.2 2.638.0) 2,320.0 10.0%
1980/81 Prices 5,790.2 5,957.8 6,942.1 7,958.8 6,659.7 6,479.8 6,236.4 1.2%Recurrent 4,756.5 5,153.0 5,453.8 6,519.5 5,665.7 5,384.4 5,267.3 1.7%
Salar) 4,676.7 5.007.1 5,185.2 6,073.1 5.419.6 5,119.11 5.038.7 1.3%Non-saliar 79.9 145.9 268.6 446.3 246.2 265.5 228.5 19.2%
Development 1,033.7 804.9 1,488.3 1,439.3 994.0 1,095.4 969.2 -1.1%AD)I' 498.0 499.3 898.0 943.0 553.1 459.3 439.0 -2.1%11T,\ 535.7 3(05.5 590.3 496.3 44(0.8 636.1) 530.2 -0.2%
Primary HealthCurrent Prices 2,925.3 3,933.5 4,999.7 5,704.9 6,092.4 7,199.9 6,517.0 14.3%
Recurrent 2,052.7 2,879.3 3,565.6 4,114.0 4,575.7 5,577.6 5,215.0 16.8%Salary 1,450.3 2.1(11.6 2.745.9 2,941.9 2,919..0 3,731.2 3,775.0 17.3%Non-salary 6(02.4 777.7 819.7 1,172.1 1.656.7 1,846.4 1,440.0 15.6%
Development 872.6 1,054.2 1,434.1 1,590.9 1,516.8 1,622.3 1,302.0 6.9%ADI' 864.9 83(0.7 1,145.1 1,436.4 1,111.8 1.042.7 664.0 -4.3%F 1'A 7.7 223.5 289.0 154.5 405.O) 579.6 638.0 108.8%
1980/81 Prices 1,198.1 1,427.4 1,589.3 1,678.5 1,581.5 1,736.0 1,489.3 3.7%Recurrent 840.7 1,044.9 1,133.4 1,210.4 1,187.7 1,344.8 1,191.8 6.0%
SalalrN 594.0 762.6 872.9 865.5 757.7 X99.6 o862.7 6.4%Non-soalahu- 246.7 282.2 26(0.6 344.8 4301.01 445.2 329.1 4.9%
Development 357.4 382.6 455.9 468.1 393.7 391.2 297.5 -3.0%A D) 1 354.2 3(01.4 364.0 422.6 288.6 251.4 151.7 -13.2%ITA 3.2 81.1 91.9 45.5 1()5.1 139.7 145.8 89.4%
Sour-ce: Federal SAI' Secretariat, Islamabad
29

Annex 111, page 6 of 7
Table 6
Budget AllocationsElementary Education and Primary Health
Special Areas(Million Rs.)
1992-93 1993-94 1994-95 1995-96 1996-97 1997-98 1998-99 Growth
1 2 3 4 5 6 7 8
Elementary EducationCurrent Prices 1,026.0 1,102.0 1,416.0 1,583.0 1,735.9 2,176.8 2,406.0 15.3%
Recurrent 820.0 913.0 1,017.0 1,193.0 1,397.4 1,700.8 1,904.0 15.1%
Salar\ 814.0 904.0 965 0 1.117.0 1,320.3 1(660.3 1.787.0) 14.0%'
Non-sak-aN 6.0 9. 52.(0 76.0 77.1 40.5 117.0 64.1%
Development 206.0 189.0 399.0 390.0 338.5 476.0 502.0 16.)0%.AD1)1 'r206.0 189.( 3770.0 362 0 30)7.5 315.0 320.0 7.6%
1 P'A 29.0) 28.0 31.0 161.0 I 82.01
1980/81 Prices 420.2 399.9 450.1 465.7 450.6 524.8 549.8 4.6%oRecurrent 335.8 331.3 323.3 351.0 362.7 410.1 435.1 4.4°o
Salary 333.4 328.0 306.7 328.6 342.7 400.3 408.4 3.4",,
Non-salar\ 2.5 3.3 16.5 22.4 20.0 9.8 26.7 48.9%
Development 84.4 68.6 126.8 114.7 87.9 114.8 114.7 5.3%
I A .)' X 84.4 68.6 117.6 106.5 79.8 75 9 73.1 -2.4^%
FPA 9.2 8.2 8.() 38.8 41.6
Primary HealthCurrent Prices 367.6 466.3 618.6 643.0 844.6 1,022.1 1,329.0 23.9%o
Recurrent 270.4 355.4 448.0 472.0 579.2 632.0 755.0 18.7%Salars 193.4 252.8 314.5 3549 397.7 435.8 524.0 18.1^%
Non-salary 77.0) 102.6 133.5 117.1 181.5 196.1 231.1) 2(0.1%
Development 97.2 110.8 170.6 171.0 265.4 390.1 574.0 34.4^o
ALDI' 97.2 110.8 17(0.0) 153.7 141 4 2396 404.0 26.8%
FPA ().6 17.3 124.1) 15().5 170.0
1980/81 Prices 150.5 169.2 196.6 189.2 219.2 246.4 303.7 12.4%
Recurrent 110.7 129.0 142.4 138.9 150.3 152.4 172.5 7.7%o
Salarv 7') 2 91.7 1i0(.0 104.4 1(03.2 105.1 119.7 7. 1°
Non-sailry 31.5 37.2 42.4 34.5 47.1 47.3 52.8 9.0%
Development 39.8 40.2 54.2 50.3 68.9 94.1 131.2 22.0%
ADP 39.8 40.2 54.0 45.2 36.7 57.8 92.3 15.1%
ITA (0.2 5.1 32.2 36.3 38.8
Source: Federal SAI' Secrctariat, Islamahad
30

Annex III, page 7 of 7
Table 7
ExpenditureElementary Education and Primary Health
Special Areas(Million Rs.)
1992-93 1993-94 1994-95 1995-96 1996-97 1997-98 1998-99 Growth1 2 3 4 5 6 7 8
Elementary EducationCurrent Prices 1,026.0 1,102.0 1,519.0 1,583.0 1,686.1 1,699.6 2,096.0 12.6%
Recurrent 820.0 913.0 1,156.0 1,193.0 1,480.8 1,524.6 1,800.0 14.0%Salary 814.0 904.0 1,104.0 1,117.0 1,433.1 1,481.0 1,676.0 12.8%
Non-salary 6.0 9.0 52.0 76.0 47.8 43.6 124.0 65.7%
Development 206.0 189.0 363.0 390.0 205.3 175.0 296.0 6.2%ADP 206.0 189.0 360.0 362.0 205.3 165.0 244.0 2.9%FPA 3.0 28.0 10.0 52.0
1980/81 Prices 420.2 399.9 482.9 465.7 437.7 409.8 479.0 2.2%Recurrent 335.8 331.3 367.5 351.0 384.4 367.6 411.3 3.4%
Salary 333.4 328.0 350.9 328.6 372.0 357.1 383.0 2.3%Non-salary 2.5 3.3 16.5 22.4 12.4 10.5 28.3 50.3%
Development 84.4 68.6 115.4 114.7 53.3 42.2 67.6 -3.6%ADP 84.4 68.6 114.4 106.5 53.3 39.8 55.8 -6.7%FPA 1.0 8.2 2.4 11.9
Primary HealthCurrent Prices 367.6 414.4 488.0 536.7 842.1 816.5 1,078.0 19.6%
Recurrent 270.4 294.2 343.1 381.2 685.3 618.9 661.0 16.1%
Salary 193.4 227.6 261.0 275.3 416.3 432.8 447.0 15.0%
Non-salary 77.0 66.5 82.1 105.9 269.0 186.1 214.0 18.6%Development 97.2 120.3 144.9 155.5 156.8 197.6 417.0 27.5%
ADI' 97.2 120.3 144.4 138.2 151.3 197.6 357.0 24.2%FPA 0.6 17.3 5.5 60.0
1980/81 Prices 150.5 150.4 155.1 157.9 218.6 196.9 246.3 8.6%Recurrent 110.7 106.7 109.1 112.1 177.9 149.2 151.1 5.3%
Salary 79.2 82.6 83.0 81.0 108.1 104.4 102.2 4.3%Non-salary 31.5 24.1 26.1 31.1 69.8 44.9 48.9 7.6%
Development 39.8 43.6 46.1 45.7 40.7 47.6 95.3 15.7%
ADP 39.8 43.6 45.9 40.7 39.3 47.6 81.6 12.7%FPA 0.2 5.1 1.4 13.7
Source: Federal SAP Secretariat, Islamabad
31
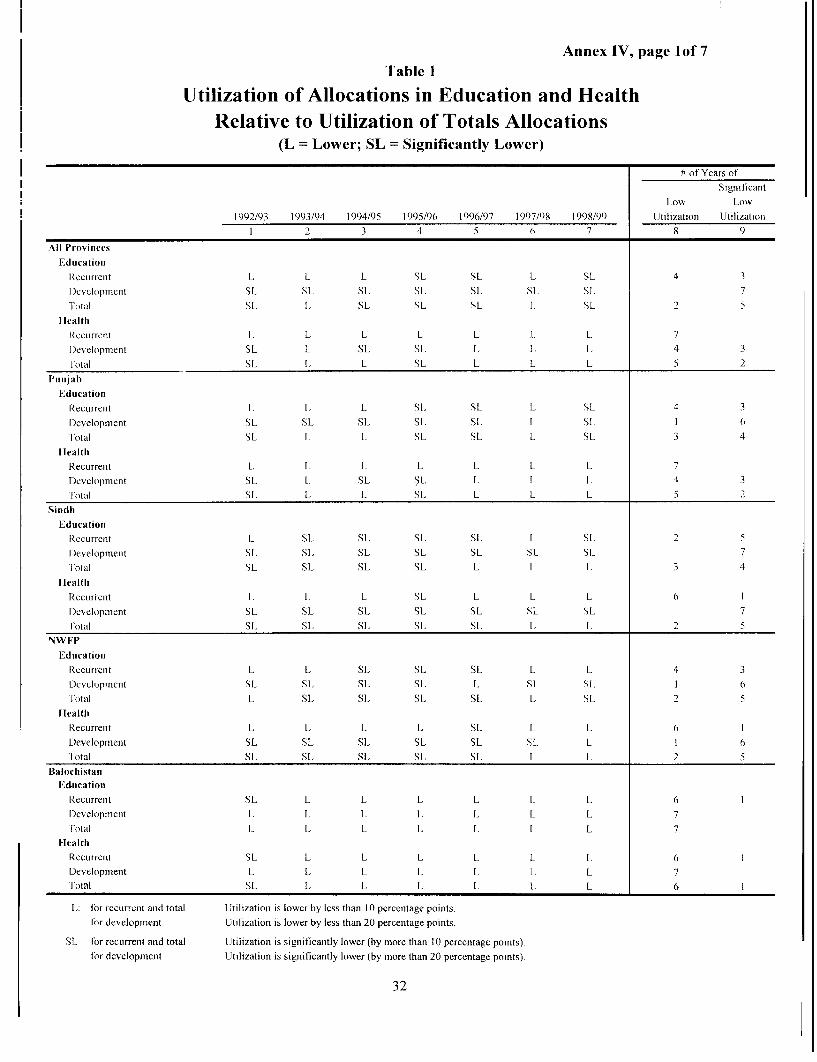
Annex IV, page lof 7Table 1
Utilization of Allocations in Education and HealthRelative to Utilization of Totals Allocations
(L = Lower; SL = Significantly Lower)
# of Years ofSigignilicant
Low L ow1992/93 i993/94 1994/95 1995/96 1996/97 1997/98 1998/99 Utilization Utilization
1 2 3 4 5 6 7 8 9
All ProvincesEducation
Rccuirrenit L L L SL SL. L SL 4 3I)evelopment Sl. SL Sl Sl. SL Si, Si. 7Total SL l SL SL SL I SL 2
I lcalth
Recurrenit L LJ L L L L L. 7
I)evelopment SL L Sl. SL L L L 4 3Total SL L L1 SL L L L 5 2
PuinjabEducation
Recurreiit L 1. L St. Sl L SL 4 3Development SL SL Sl Sl. SL L SL 1 6Total SL L 1. SL SL L SL 3 4
IclalthRecurrent L l I. L L L L 7Development SL 1. SL SL L I 1. 4 3lotal SL L L SL L L L 5 2
SindbEducation
Rccurrenit L SL SL SL SL L. SL 2 5Developmenit SL SL SL SL SL Sl Sl 7Total SL SL SL SL L L. 1. 3 4
IlealthRecurrenit L L L SL L l L 6 1
Developmiienit SL Sl SL SL SL SL SL 7ITotal SL SL SL SL SL L L 2
NWFPEducationi
Rceurrenit L L SL SL SL L L 4 3Development SL SL SL SL L Sl Si. 1 6lotal L SL Si, SL SL L SL 2 5
HealthRecurrenit L L L L. SL L L 6 1
Developmenit SL SL Sl SL SL SL L 1 6Total SL SL SL SL SL L. 1 2 5
BalochistanEducation
Recurrenit SL L L L L L L 6 1
Development L L L L. L L L 7
llotal l L. L L L L. L 7
llealthRecurrent SL L L L 1. L. L 6 1
Development L L L 1. L 1. L 7Total SL L L 1. L L L 6 i
L: iOr recurrent and total Utilization is lower by less than 10 percentage points.for developmenit Utilization is lower by less than 20 percentage points.
Sl for recurrent and total Utilization is significantly lower (by more than 10 percentage points).for development Utilization is significantly lower (by more than 20 percentage points).
32

Annex IV, page 2 of 7
Table 2
Public Sector Expenditure on Education and HealthAll Provinces
(Million Rs.)1992/93 1993/94 1994/95 1995/96 1996/97 1997/98 1998/99
1 2 3 4 5 6 7
Budget EstimateRecutrent 85,780.1 98,667.7 117,344.5 136,251.8 157,416.6 165,788.0 183,011.0
IEducation 23,434.7 27,643.0 33,888.6 40,527.0 46,824.6 50,717.6 58.270 7Healthi 6,300.5 6,940.5 7,542.6 8,962.6 10,729.5 11,649 2 12,720.6
Development 30,794.9 27,635.7 29,736.7 35,322.4 41,968.8 35,803.2 40,419.0IEducation 6,022.7 3,883.1 5,404.3 6,348 1 6,649.4 5,929 7 5,389.6HIfealtlh 3,215 8 2,219.2 2,583.0 3,199.3 2,878.5 2,476.1 2,297 7
Iotai 116,574.9 126,303.4 147,081.2 171,574.2 199,385.4 201,558.2 223,300.5Fducation 29,457.4 31,526.1 39,292.9 46,875.1 53,474.0 56,647 2 63,660.31 lealtlh 9,516.3 9,159.6 10,125.7 12,161 9 13,6080 14,1254 15,018.4
Revised EstimateRecurrent 86,758.7 98,518.8 116,651.0 141,916.4 150,904.8 160,216.6 172,127.6
Education 21,939.8 26,632.4 33,416.3 39,786.4 43,332.2 47,280.3 50,081.5Healthi 5,955.2 6,721.1 7.480.9 9,092 2 10,094.4 11,139.2 12,009.2
D)evelopment 27,802.2 20,163.5 35,651.5 40,859.0 27,142.7 39,131.6 43,756.4Educationi 3,191.4 3,524.3 5,785.6 5,588.5 4,778.3 5,099.0 5,205.6Healtlh 2,079.7 1,971.7 2,827.5 2,462.3 1,826 3 2,201.6 1.890.5
Total 114,560.8 118,682.2 152,302.5 182,775.4 177,793.8 199,321.4 215,756.5dIducatioin 25.131 2 30,156.7 39,201 9 45,374.9 48,110.5 52,379.3 55,287.1
IAcalth 8,034.9 8,692.8 10,308.4 11,554.4 11,920.7 13,340.8 13,899.7Expenditure
Rcturrent 85,951 93,901 116,361 138,528 140,604 143,387 154,410E-`du1ca1tion1 22,082 25,419 31,475 35,102 35,815 40,802 41.855hlealth 5,837 6,415 7,756 8,601 4,777 10,074 10,642
D)velopment 23,164 20,652 30,269 29,440 17.861 21,532 21,752EducatioLn 1,190 1,875 1,640 1,586 1,175 2,118 1,591Health 698 1,271 1,476 1,348 1.212 1,250 1,135
lotal 109,115 114,554 146,630 167,969 158,466 164,918 176,162Education 23,272 27,294 33,115 36,688 36.990 42,920 43,446Ilealth 6,535 7,686 9,232 9,949 9.989 11,324 11,777
Utilization on Budget EstimateRectlllrent 100.2% 95.2% 99.2% 101.7% 89.3% 86.5% 84.4%
Education 94.2% 92.0% 92.9% 86.6% 76.5% 80.4% 71.8%HeIaclth 92.6% 92.4% 102.8% 96.0% 81.8% 86.5% 83.7%
I)evelopment 75.2% 74.7% 101.8% 83.3% 42.6% 60.1% 53.8%Education 19.8% 48.3% 30.3% 25.0%1) 17.7% 35.7% 29.5%llealth 21.7% 57.3% 57.1% 42.10/S, 42 1% 50.5% 49.4%
lotal 93.6% 90.7% 99.7% 97.9% 79.5% 81.8% 78.9%IdUIcation 79 0% 86.6% 84 3% 78.3% 69.2%M) 75.8% 68 2%I Icalth 68.7% 83.9% 91.2% 81 8% 73 4% 80.2% 78.4%
Utilization on Revised EstimateRecurr-cnt 99.1% 95.3% 99.8% 97.6%X) 93.2% 89.5% 89.7%
l/dUcation 100 7% 95.4% 94 2% 88.2% 82 7% 86.3% 83 6%Healtlh 98.0% 95.4% 103.7% 94.6% 86 9% 90.4% 88.6%
Development 83.3% 102.4% 84.9% 72.1% 65.8% 55.0% 49.7%EdLicationi 37.3% 53.2% 28.3% 28.4% 24 6% 41.5% 30 6%Hcalth 33.6% 64.5% 52.2% 54 7% 66.40/4 56.8% 60.0%
'rota i 95.2% 96.5% 96.3% 91.9% 89.1% 82.7% 81.6%Education 92.6% 90.5% 84.5% 80.9% 76.9% 81.9% 78.6%Healtlh 81.3% 88.4% 89.6% 86.1% 83.8% 84.9% 84.7%
33
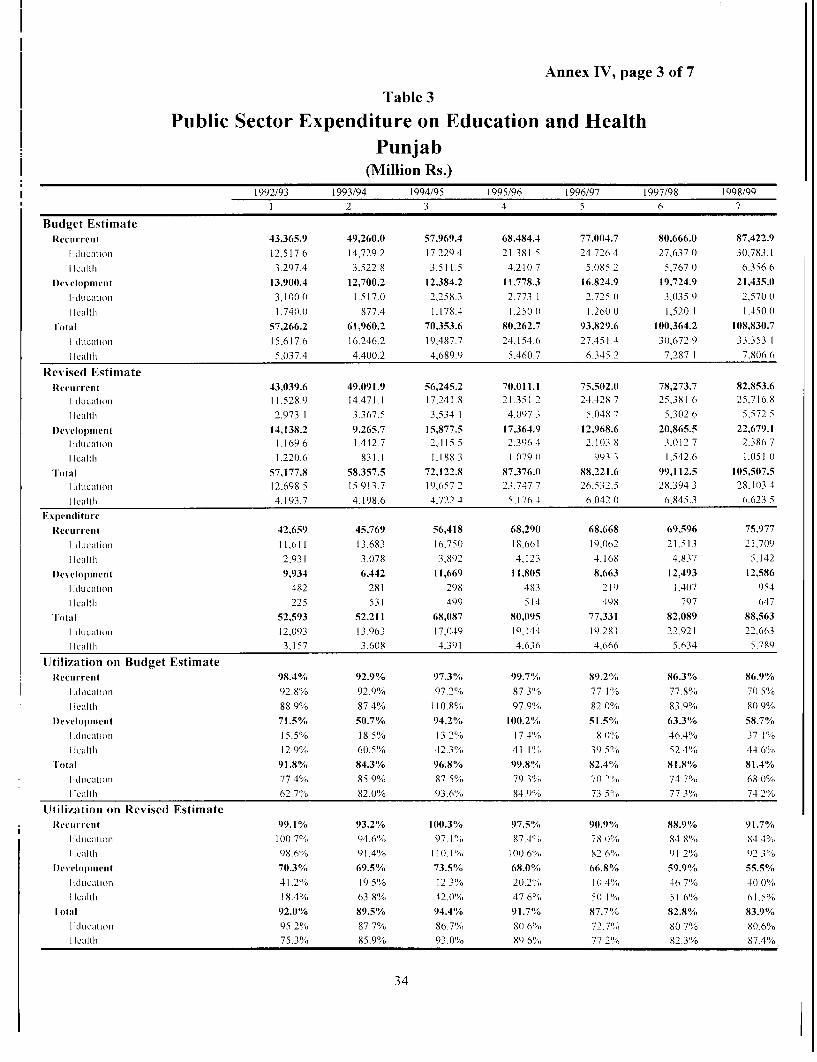
Annex IV, page 3 of 7
Table 3
Public Sector Expenditure on Education and HealthPunjab
(Million Rs.)1992/93 1993/94 1994/95 1995/96 1996/97 1997/98 1998/99
1 2 3 4 6 7
Budget EstimateRecrll-r-elnt 43,365.9 49,260.0 57,969.4 68,484.4 77,004.7 80,666.0 87,422.9
I.ducatulon 12,5176 14,7292 17,2294 21.381 5 24.7264 27,6370 30,783.1
I Icalth 3,297.4 3 522 8 3,511.5 4,210 7 5,085 2 5,767 0 6,356 6I)evelopmuent 13,900.4 12,700.2 12,384.2 11,778.3 16,824.9 19,724.9 21,435.0
12 (It,olt 3,1000) 1.517.0 2.258.3 2,773 1 2,725 0 3.035 9 2,5700
I Icalth 1,74(00 877.4 1.178.4 1],250-) 1-260 0 1,520. 1 1,450.0
Iotal 57,266.2 61,960.2 70,353.6 80,262.7 93,829.6 100,364.2 108,830.7
I (ILIC8tlc00 15,617.6 16,246.2 19,487.7 24,154.6 27,451.4 30,672 9 33.353 1l Icilltlh 5,037.4 4,400.2 4,689.9 5,460.7 6,345.2 7,287 1 7,806 6
Revised EstimateRecmi -r-ent 43,039.6 49,091.9 56,245.2 70,011.1 75,502.0 78,273.7 82,853.6
I cItLciAtno I 1528.9 14,471.1 17,241.8 21.351 2 24,428 7 25,381 6 25,716.8I Icaltlh 2.973.1 3,367.5 3,534 1 4.097 I 5,048 7 5,302 6 5,572 5
I)eselopinent 14,138.2 9,265.7 15,877.5 17,364.9 12,968.6 20,865.5 22,679.1(lducallon 1,169.6 1,442.7 2.415 5 2.3964 2,1038 .3,0127 2,386.7
l Icalth 1.220.6 831.1 1.1 883 I .079 11 993 3 1,542.6 1.051 0
Total 57,177.8 58,357.5 72,122.8 87,376.0 88,221.6 99,112.5 105,507.5I (ducatioll 12,698.5 15,913.7 19,657 2 23.747 7 26,532.5 28,394 3 28,1()3.4I callth 4-193.7 4,198.6 4,722.4 5,176.4 6,042(1 6,845.3 6.6235
ExpendittureRecmrcent 42,659 45,769 56,418 68,290 68,668 69,596 75,977
I AItIC:iunIO 11,611 13,683 16,751) 18,661 19,062 21,513 21,709
IlcaIlti 2,931 3,078 3,892 4,123 4.168 4,837 5,142I)eDellopmnent 9,934 6,442 11,669 11,805 8,663 12,493 12,586
I (ilUCOtOlll 482 281 298 483 219 1,4(07 954
l Izilltli 225 531 499 514 498 797 647I u tll 52,593 52,211 68,087 80,095 77,331 82,089 88,563
I (SCILtCAIOl 12,093 13,963 17,0)49 19,144 IQ-281 22,921 22,663
lIlcaltht 3,157 3,608 4,391 4.636 4,666 5.634 5,789
Utilization on Budget EstimateRecurrenll-lt 98.4% 92.9% 97.3% 99.7%Vo 89.2% 86.3% 86.9%
I l:dUCath)fl 92.8% 92.9% 97.2% 87 3% 77 1%'/. 778°o 7( 5%
I 1iltlt 88 9% 87 4% 110.8% 97.9"o 82 (0/1% 83.9% 80 9%
I)eveloopment 71.5% 50.7% 94.2%fi 100.2%, 51.5% 63.3% 58.7%
I ducatlon) 15.5% 18 5% 13 2o 17 4%/; 8 (1% 464% 37 1%
I Icailth 12 9% 60.5% 42.30,N) 41 1["% 39 5'o, 52.4%/i 44.6%
Iota Il 91.8% 84.3% 96.8% 99.8%V,, 82.4% 81.8% 81.4%
I(dIcatlonl 77.4% 85 9% 87 5% 79.3% 70 2O 74 7'%/ 686 0%YoI lcalth 62.7"/o 82.0% 93 6%/o 84.9"¼1- 73 5X,I 77 3%l) 74 2%
Utilizatioii on Revised Estimateltecuri-r-elnt 99.1%(I, 93.2% 100.3% 97.5%/1, 9(.9% 88.9% 91.7%
I I ,IuCai,noll 1001.7%, 94.6%N 97 1 "¼ 87.4" , 78 WN% 84 84% 84 4"/
Icalltlt 98.6% 91.4% 11(1.1" , 11) 6"¼, 82 6%Yi 91 2%'/' 92 3%
D)evelopmuent 70.3%0/4 69.5% 73.5%fi) 68.0% 66.8% 59.9% 55.5%
Iducation 41 2%Vo 19 5'% 12 3%' 20.2'¼"( 11)4%Mo 46 7% 4)0%/.
I Icalth 18.4% 63.8% 42.0% 476¼,o 5(1 1 %, 51 6% 61.5'N -
I utiM1 92.0% 89.5% 94.4% 91.7% 87.7% 82.8% 83.9%
ILcatlnll 95 2%/o 87.7% 86.7%Yo 8() 65,, 727¼,. 80 7%, 8().6%
I Icolth 75.3% 85.9% 93.0% 89 6%) 77 2% 822.33% 87.4%
34

Annex IV, page 4 of 7
Table 4
Public Sector Expenditure on Education and HealthSindh
(Million Rs.)1992/93 1993/94 1994/95 1995/96 1996/97 1997/98 1998/99
1 2 3 4 5 6 7
Budget EstimateRecurrlelt 20,501.8 24,462.1 29,876.9 34,770.7 41,137.0 41,071.3 47,388.1
Education 5,688.4 6,807.1 8,894 4 10,202 2 11,179 6 11,578 6 14.287 2HIcalth 1,348 3 1,574.9 1,733 4 2,214 3 2.544 5 2,602.9 2,965.4
D)evelopiment 4,764.2 6,435.7 6,008.5 10,916.6 11,806.6 6,769.7 7,732.5IEducatioll 960 ( 1.032 0 922 4 1,255 7 1.255.O 686.0 89( (1I calth 58() 0 630 0 527(0 762 9 720.0 340 0 360 0
Tol 11 25,265.9 30,897.8 35,885.4 45,687.3 52,943.6 47,841.0 55,024.9I.dtlcatloll 6,648 4 7,839.1 9,816.9 11.457 9 12,434.6 12,264.6 15.177 2I Icltlth 1,928.3 2,204 9 2,260.4 2.977.2 3,264 2,942.9 3,325.4
Revised EstimateReeiir-reljt 21,095.2 24,498.9 31,106.9 36,826.7 38,919.4 39,127.4 43,388.1
f-7dcation 5,201 3 6,215.7 8,7498 9,508.7 8, 829 3 10,576.6 11,463.6I lalth 1,387.5 1,486.9 1,784.2 2.4682 2,188 9 2,713.4 3,037.7
I)Dcoluee lioet 4,060.3 3,300.8 8,207.5 10,956.4 5,927.3 9,339.7 8,301.1I dLICLtIOn1 879 5 1,055.0 956.7 1.342 4 749.1) 704 9 890.0I Icalth 452 9 626 7 533.4 637 9 34().9 35().3 360.0
Toftal 25,155.5 27,799.7 39,314.5 47,783.1 44,846.7 48,467.0 51,593.5I:ducaltin 6,080.8 7,270.7 9,706.5 1().851 () 9,578 3 11,281.5 12,353 6I Iealtlh 1,840.4 2,113 6 2,317 6 3,1 06 2 2.529 8 3,063.7 3,397.7
I.xpcenditiircRevcii -C-ci t 21,296 24,914 31,592 37,485 38,919 38,307 39,406
'(iLIcatioIn 5,402 6,181 8.1 (6 8,689 8.829 10,253 10(,323l Icaltlh 1,337 1,487 1.745 2,067 2.189 2.547 2,597
I)cDclopment 5,289 5,481 8,674 7,713 3,572 4,470 3,592Editucatioll 87 83 140 105 44 64 771 lealthi 113 232 265 175 58 131 79
TIotal 26,585 30,395 40,265 45,198 42,491 42,777 42,998I cILtioC i 5,49(0 6,264 8,246 8,794 8,873 10,317 10,40(0l-caltlh 1,449 1,719 2,01(0 2,242 2,246 2,678 2,676
UJtilization on Budget EstimateReculrenlt 103.9% 101.8% 105.7% 107.8% 94.6% 93.3% 83.2%
E.ducation 95(01° 90.8% 91. 1° 85.2%1 79.10% 88 6% 72 3%I Icl1thi 99.1% 94 4% 100.6'/;, 93.3%, 86 0% 97.9% 87 6%
D)evelopment 111.00% 85.2% 144.40%, 70.7%. 30.3% 66.0% 46.5%IVducatloln 9. 1 % 8 0% 15 1% 8 3%11 3. 5 % 9.4% 8.7°'I Icalth 19.4%/o 36.9% 50.3% 22.9% 8 0%/. 38.5% 21.9%
'Fotal 105.2% 98.4% 112.2% 98.9% 8(0.3% 89.4% 78.1%1 ducationi 82.6% 7999% 840°o 76.7% 71 4% 84.1% 68.5%
Ilcaltli 75.2"o 780% 889%o 75.3% 68.8% 91.0(% 80.5%
Utilization on Revised EstimateRecurreit t0I. 0ION% 101.7% 101.6% 101.8%/o 100.0% 97.9% 90.8%
I'ducation 103.9% 994% 926%/o 91.4%) 1( ('0(1% 969% 9()0%/oI lealtlh 96.3% 100.0% 97.8% 83 .7 10() (1%I 93 .9% 85.5%
I)ev,elopment 130.3% 166.0% 105.7% 70.4% 60.3% 47.9% 43.3%Educatio1n 9.9% 7 8M) 14.6 %X 7. 8%. 5 9% 9 1% 8.7%Health 24.8% 37.1 %) 49.7% 27.4%/E, 1(6 9% 37.4% 21.9°/%
Tlotal 105.7% 109.3% 102.4% 94.6% 94.7% 88.3% 83.3%Lducaition 90.30 86.2% 84.9%,) 81.0% 92 6% 91.5% 84.2%Ilcaltlh 78.7% 81.3% 86.7% 72.2/o 88.8% 87.4% 78.8%
35

Annex IV, page 5 of 7
Table 5
Public Sector Expenditure on Education and HealthNWFP
(Million Rs.)1992/93 1993/94 1994/95 1995/96 1996/97 1997/98 1998/99
1 2 3 4 5 6 7
Budget EstimateRecu rrent 14,370.8 16,511.3 19,189.9 21,972.4 26,X62.0 30,058.5 33,004.0
ILducation 3,666 5 4,332.0 5.550) 9 6,600 8 8 272 2 8.459 6 9,722 9llcalth 997.4 1,164.7 1,411 5 1,6873 2.130 4 2,1577 2,4124
Development 8,392.3 3,970.5 6,964.0 7,865.6 8,485.3 4,896.2 5,820.0LIducation 1.727.9 1,0569 1,9397 1,915.1 2,1989 1,824.7 1,596.9Health 692 0 434.0 636.6 893.0 617 6 320 ( 256.8
Total 22,763.1 20,481.8 26,153.9 29,838.0 35,347.3 34,948.4 38,817.4Educatioll 5,394.4 5.388 9 7,490 6 8.51 5.9 10,471 2 10,284 3 11,319.8IlIealth 1,689.4 1,598 7 2,048 1 2,580.2 2,748 I 2,477 7 2,669.1
Revised EstimateRecuri-ent 14,579.1 16,635.9 19,404.5 23,564.0 25,800.0 29,451.0 32,004.0
FEducaltio] 3.676.0 4,323.1 5,544.4 6,592.6 7,657 3 8,453.0 9.709 3H ealth1 1,029.1 1,179.4 1,414.9 1,704() 1.9722 2,157 8 2,4127
Development 4,652.1 4,298.6 7,349.2 7,952.3 5,515.3 5,279.1 7,565.3Iducation 1,142.4 1,026 6 2,097.8 1.849.7 1,325 6 1,381 4 1.670 9
Ilc,llthi 406.2 513.9 847.0 745.3 492? 1 308.7 27( 9'Fotal 19,231.2 20,934.5 26,753.7 31,516.3 31,310.7 34,73(0.1 39,562.7
Educationi 4,818.4 5,349.8 7,642.3 8,442-2 9,582 8 9,834 4 11.380 2Health 1,435.3 1,693.3 2,261.9 2,449 3 2.464 2 2,466.5 2,6890
ExpendituireRecurrent 13,880 14,929 18,755 21,634 22,334 22,959 25,792
Lducatiom 3,569 3,932 4.750 5,499) 5,5()5 6.230 6.647 7liealtih 1,008 1,163 1.372 1,59() 1,535 1.725 1,955 (
D)evelopment 4,855 4,421 5,070 5,303 3,082 2,685 3,565Educa1tion 413 402 295 239 738 415 258I lealth 198 165 228 1401 66 90 159
Total 18,735 19,35(0 23,824 26,937 25.415 25,644 29,357EduLcation 3,982 4,334 5,044 5.738 6,244 6,645 6,905Healtli 1,206 1,328 1,601 1,730 1,601) 1,815 2,115
Utilization on Budget Estimate[Recuirrent 96.6% 90.4% 97.7% 98.5% 83.1% 76.4% 78.1%
I'ducation 97.3% 90.8% 85.6% 83.30., 66 6%"o 73.60/%. 68.4%N.
Health 101 1% 99.8% 97 2% 94 2%i 72 10_ 79 9% 81.1I0'
I)evelopmelit 57.8% 111.4% 72.8% 67.4"/D 36.3% 54.80% 61.3%I-ducation 23 9% 38.0% 15.2°/o 12.5"o 33 6% 22.8%/. 16.1%
HIcalthi 28 .7%0 38.1% 35.9% 15.7%/,, 10 7% 28.2% 62. 1 %
'Iotal 82.3% 94.5% 91.1% 90.3% 71.9% 73.4% 75.6%FIducation 73.8% 80.4% 67.3% 67.4/ 59( 6% 64 6% 61. 0I'/Hlealtih 71.4% 83. 1° 78.2% 67.0%i 58 3% 73.3% 79 2%
Utilization on Revised EstimateRectirr-ent 95.2% 89.7% 96.7% 91.8 0% 86.6%Y. 78.0% 80.6%
Educatioln 97.1% 90.9% 85.7% 83.4%o 71 9°o 73 7%') 68.5%I-lealthl 98.0% 98.6% 97 0% 93.30'., 77 8% 79 9% 81 1%
Development 104.4% 102.9% 69.0% 66.7'%,D 55.9% 50.9% 47.1%EIducation 36.2% 39.2% 14.1% 12.9")o 38 3%) 30.1% 15 4%/o
-lealthi 48.8%' 32.20/) 2700% 18.8% 134°'o 29.2% 576%Total 97.4% 92.4% 89.1% 85.5% 81.2% 73.8% 74.2%
E'ducation 82.6% 81.0%o 66.0% 68.05.. 65 2% 67 6% 60 7%I-lcalthi 84 0% 78.4% 70.8'% 70.6%) 65.0%/ 73.6% 78.60%,
36

Annex IV, page 6 of 7
Table 6
Public Sector Expenditure on Education and HealthBalochistan
(Million Rs.)1992/93 1993/94 1994/95 1995/96 1996/97 1997/98 1998/99
1 2 3 4 5 6 7
Budget EstimateRecurrent 7,541.6 8,434.3 10,308.4 11,024.3 12,412.9 13,992.2 15,196.0
I-ducationI 1,562.1 1,7747 2,213.9 2342.6 2.646.4 3,042.4 3,477.5hlealth 6574 678.0 8862 850(3 9693 1,121.6 986.4
D)ovelopmient 3,738.1 4,529.2 4,380.( 4,761.9 4,851.9 4,412.4 5,431.51ducation 234.8 277.2 283.8 404 1 470 5 383.1 332.7hlealth 203.8 2778 241.0 2934 2809 296.0 231.0
rotal 11,279.6 12,963.6 14,688.4 15,786.2 17,264.8 18,404.6 20,627.5I ducation 1,796.9 2,051.9 2,497.7 2,746 7 3,11 6.9 3,425.5 3,810.2Hlcaltil 861.2 955.8 1,127.2 1,143 7 1,25( 2 1,417.6 1,217.3
Revised EstimateReciuirent 8,044.7 8,292.1 9,894.3 11,514.5 10,683.4 13,364.5 13,881.9
Education 1,533 5 1,622.6 1.880 3 2,334.0 2,416.9 2.869 1 3,191.8I lcilthi 565 5 687.3 747 7 822 6 884 7 965.4 986.4
I)evelopmenut 4,951.7 3,298.4 4,217.2 4,585.4 2,731.4 3,647.2 5,210.9FLducationi NA NA 315.6 NA NA NA 258.0lIcalth NA NA 258 9 NA NA NA 202.5
Totai 12,996.4 11,590.4 14,111.5 16,099.9 13,414.8 17,011.7 19,092.8I ducation0 NA NA 2,196.0 NA NA NA 3,449.8llealth NA NA 1,006.6 NA NA NA 1,188.9
ExpenditureRecuririet 8,116 8,289 9,596 11,12(1 1(1,683 12,525 13,235
FducationI 1,50() 1,623 1,869 2.253 2-41X 2.806 3,175I lcalthi 561 687 747 821 885 965 947
I)evelopment 3,086 4,309 4,857 4,619 2,545 1,883 2,009I(I Ca II o0i 208 1,110 907 760 174 231 302Il eal th 162 343 484 51') 591 232 250
Total 11,202 12,598 14,453 15,739 13,228 14,408 15,244I-duIcatIOnI 1,708 2,733 2,776 3,013 2,592 3,037 3,477I lcalthi 723 1,031 1,231 1,340) 1,475 1,197 1,197
Utilization on Budget EstimateRecir-rent 107.6% 98.3% 93.1 100.9"/% 86.1% 89.5% 87.1%
Fdtucation 96. Oo/o 91.5% 84.4%o 96 2'El 91 4%" 92.2% 91.3%heCalth 85.4o/O 101.4% 84.3% 966'%'o 91 3% 86.0% 960%
Development 82.6% 95.1% 110.9% 97.0°/, 52.5% 42.7% 37.0%Lducation 88.5%i/ 40(0.3% 319.6% 188.0W'i 37.0)%o 60 3% 90.8%I lealth 79.5°o% 123.6% 200.8//o 177 1)"i 210.3%, 78.4% 108.2%
1lu)tal 99.3% 97.2% 98.4%Y. 99.7% 76.6%Y6 78.3% 73.9%I'ducation 95.1% 133.2% III 1% 10)9 7o 83 2%u 88 7% 91.3%I Icalth 84.0% 107.8% 109 2% 117 2'", 118 ()',) 84.4% 98.3%
Utilization on Revised EstimateRecuirrelit 100.9% 100.0% 97.(0%/o 96.6'%) 10.(10% 93.7% 95.3%
Iuklcation 97.8o%/ 1 00.0% 99.4%o 96 5'1)~ 1( (11W. 97.8% 99.5%
I Icalth 99 3% 100.0% 99.9% 99.8")I)" 1( o 1(10.0)°o% 96.0%I)evelopment 62.3% 130.6% 115.2% 100.7%) 93.2% 51.6% 38.6%
I'ducatioll NA NA 2X7.4% NA NA NA 117.1%Health NA NA 187 0%/) NNA NA NA 123 .4%
Total 86.2% 108.7% 102.4'% 97.8'%,) 98.6% 84.7% 79.8%Education NA NA 126 4%/.' NA NA NA 1(0 8%I lcaltli NA NA 122.3% NA NA NA 100.7%
37

Annex IV, page 7 of 7
Table 7
Utilization of AllocationsElementary Education and Primary Health
Provinces and Special Areas(Million Rs.)
1992-93 1993-94 1994-95 1995-96 1996-97 1997-98 1998-991 2 3 4 5 6 7
Elementary Education 90.1% 100.2% 95.7% 99.7^% 79.8% 71.0% 66.4%Recurrent 96.2% 103.7% 97.5% 103.0% 86.7% 75.9% 73.6%
Salary 96.9% 104.0% 97.2% 101.3% 89.3% 76.7% 74.0%Non-salary 66.8% 95.4% 102.5% 132.5%) 52.6% 62.7% 65.3%
Development 69.9% 82.8% 90.0% 87.3%Yt 54.7%Yo 53.6% 43;4%ADP 45.9% 75.4% 85.6% 83.8% 56.3% 49.3% 65.3%FPA 161.9% 101.2% 98.6% 95.6% 52.6 % 57.5% 33.2%
Primary Health 89.3% 92.0% 92.2%0, 91.0%yo 83.8%) 76.20% 60.20%Recurrent 90.4% 98.8% 102.4% 96.0%" 89.4%o 81.9% 71.80%)
Salary 90.1% 101.0% 113.2% 97.0% 81.5°o 78.7% 72.7%Non-salar-y 91.1% 93.3% 77.6% 93.79/o 107.4% 89.2% 69.6%
Development 86.8% 77.5% 74.0% 80.10%a 70.2% 61.70/t% 38.7%ADP 86.7% 79.9% 66.4% 79.6% 8W10o 78.6% 68.1%FPA 96.3% 68.5% 149.6% 85.1% 50.8% 42.2% 23.7%/o
LUtilization of Non-salary AllocationRealtive to Total Recurrent Allocation
Elementary Education SL L SL SL L
Pi-imlary Health L SL L L
Utilization of Development AllocationRealtive to Total Allocation
Elemenitary Educationi SL L L L SL L SLPrimiiary Health L SL SL L L SL SL
L: for noni-salary Utilization is lower by less than 10 percentage points.for developmenit Utilization is lower by less than 20 percentage points.
SL: for noni-salary Utilization is significantly lower (by more than 10 percentage poinlts).foir developmiient I Utilization is significantly lower (by more than 20 percentage poinits).
38

Annex V, page 1 of 4Table I
Releases and Expenditure on SAP Education and HealthNational Average for 1997/98 to 1999/00
(Million Rs.)
End of Quarter 2 End of Quarter 3 End of Quarter 413E Released Expended Released Expenlded Released Expended
1 2 3 4 5 6 7
Elementary Educationi 40,031.8 30,501.1 13,149.3 30,991.0 201,481.6 34,514.7 28,869.2.Reculrrent 36,399.4 28,311.0 12,295.3 28,623.6 19,191.4 31,998.5 26,676.8
Salar-y 34,078 1 27,086.5 12,133 9 27,307 1 8753.3 30,392.4 25,622.1
Non-salarv 2,321.4 1,224.5 161 3 1,316 5 438 1 1,606 1 1,054.7I)evelopment 3,632.4 2,190.1 854.0 2,367.4 1,290.2 2,516.2 2,192.5
ADP 3,632.4 2,190.1 854 0 2,367 4 1,200 2 2,516 2 2,192.5
IPrimilary Health 11,579.5 7,344.3 3,237.5 8,417.5 5,107.9 10,951.9 8,719.8Recurrllent 8,196.6 6,083.1 2,592.6 6,691.3 3,741.3 7,827.7 6,165.3
Salary 5.787 8 4,371.3 2,062.1 4,859.7 3044.4 5,323 5 4,271.7Non-salary 2,408.7 1,711.8 530.6 1,831 6 697.T) 2.504 2 1,893.7
I)evelopment 3,382.9 1,261.1 644.8 1,726.2 1,366.6 3,124.2 2,554.4ADP 3,382.9 1,261 1 644.8 1,726.2 1,207 6 3.124.2 2,554.4
Source: D)erived from tables at AnYex V
Table 2
Average Utilization of Allocations and ReleasesSAP Education and Health
Based on Data for FY 1997/98 to 1999/00(Million Rs.)
End of Quarter 2 End of Quarter 3 End of Quarter 4Utilization on Utilization on L tilizatioln on
Allocation Released Allocation Released Allocation ReleasedAmouLnt Amoullt Amount
1 2 3 4 5 6
Elementary E.ducation
hcy-all 32.8% 43.1%o) 51.2% 66 I"o 72.1°'o 83.6%RCcuirent Non-salary 7.0% 13. 2%4 18 9% 33 3°/o 45A40/0 65.7%AD)1' 23.5% 39.0)"'o 35.5% 54 5%11 60 4% 87.1%/o
Plrinlary Health
(scrall 28(0% 44 1%. 44. 1%o 60.7%r() 75.3"/o 79.6%
Rcuiii-rrent Non-salary 22.0% 31 0%() 28.9% 38. /1% 78 6%' 75 6%
ADP) 19.1% 51. 1%/ 3 5.7% 7 0.0)'%o 75 5% 81.8%
39

Annex V, page 3 of 4
Table 4
Releases and Expenditure: 1998/99Social Action Program - II
National Summary(Million Rs.)
UY 1998/99
Budget End of Quarter 2 Enid of Quarter 3 End of Quarter 4
Estimate Released Expended Released Expended Rccased Expenided
1 3 4 5 ( 7 8
FIlemeitarN ldticationi 41,746.6 31,246.5 12,670.7 21,091 33,783.2 29,591.0
ltecilr ercnt 37,957.0 28,708.7 11,708.8 19,934 30,871.3 26,876.3
Salary 35_531 7 27,496 S 11,454.3 19)361 29Q3'9 9 25.544 4
Nou-salar\ 2'425 3 1,212.2 254 5 574 1,471.4 1.331 9
D)eN clopncit 3,789.6 2,537.8 961.9 1,156 2,911.9 2,714.7
ADP)1 3,789.6 2.537.8 961.9 1,156 2 911 9 2,714 7
1-Icalthl 11,367.8 6,819.9 2,763.1 5,827 10,770.2 9,305.1
Iteculrent 8,190i.8 6,054.6 2,377.1 3,710 7,393.5 6,142.5
Salary 5,832 2 4,283.1 20 11.2 2959 5.091 8 4,371 7
Non-salarN 2.3586 1,771 5 365.8 751 2.391 7 1 770(8
l)Deelopment 3,177.0 765.3 386.0 2,117 3,376.7 3,162.6
AD)l 3,177.( 7653 386.0 1.640 3,376.7 .1626
IRWN SS 5,885.9 3,565.2 1,468.3 2,941 5,756.3 5,086.0
!Recuiirent 2,253.9 1,312.5 581.5 1,337 2,158.3 1,984.2
Sal;kry 1.086.7 844.1 344 6 700 1,096.0 971 9
JNon-salary 1.167 3 468.5 236 8 637 1 _)62.2 1.012 3
I)Declopinent 3,631.9 2,252.6 886.9 1,604 3,598.1 3,101.8
AN,\t) 3,631.9 2.252.6 88( 9 1,60)4 3,598.1 3.10 1 8
Xlinistr y of Population Welfar-eDe)Nclopmlieiet (ADOP) 90( 0 967 000 711 300 477 ( 1.343.3 1,156 0
Srill)[ ot ActivitiesD)x\clopmient (Al) ) (Y7 6 32.200 1 300 28.9 37 9
FotaIl 60,097.9 42,630.8 17,614.7 29,858.0 51,682.0 45,176.1
Reci - eent 48,401.7 36,075.8 14,667.3 24,981.0 40,423.1 35,003.0
S;alary 42.450 6 32,623.7 13,810.1 2' 019 7 35_587.7 3(1,888 0
Noin-salarv 5-951.1 3,452.1 857.2 1,961 3 4.835 3 4 1 5i0
D)evelopment 11,696.2 6,554.9 2,947.3 4,877.1 11,258.9 10,173.0
A1)0 11,6962 6,554.9 2,9473 4.877 1 11,2589 1(1.173 0
Soture-: Aidc miemiioires of the donor missions for SAPP-II reviews and Qtiarterly Monitorinig Reports
40

Annex V, page 2 of 4
Table 3
Releases and Expenditure: 1997/98Social Action Program - II
National Summary(Million Rs.)
1997/98Budget End of Quarter 2 knd of Quarter 3 1 :nd of Quarter 4
Estimate Released Expended Released Expended Released Expenlded1 3 4 5 6 7 8
lElententarv' Educatioin 37,217.6 26,765.2 12,602.3 27,720.9 19,727.9Recrllr-elnt 32,936.8 24,613.8 11,815.0 25,002.0 18,149.9
SalIlr- 30,944.6 23.65 1.8 11,673 8 24,008 8 17.598.'Non-salary 1,992.2 961.9 141 2 993.2 551 1
Developrncnt 4,280.7 2,151.5 787.4 2,718.9 1,578.1AD1)1' 4,280 7 2,151.5 7874 2,718.9 1,578 1
Health 10,486.2 6,341.4 3,058.6 7,414.1 4,284.5Recurrent 7,024.6 5,322.6 2,550.8 6,214.9 3,530.0
Salaly 5,048.8 3,948.8 1.732.1 4,687.4 2.95() 1Noii-salarv 1.975.8 1,373 9 818 .7 1,527 6 58(0
D)ceclopillent 3,461.6 1,018.8 507.8 1,199.1 754.4ADP)1' 3,461.6 1,0188 5078 1,199.1 7544
IMWSS 6,557.9 4,552.1 2,334.7 4,641.3 3,599.0Recull-rent 2,060.5 1,345.3 619.0 1,193.8 1,0O1.8
Salarx 888.8 705.4 322.2 624 5 586 ()Non-salary 1.171 7 640.0 296.8 5693 415 8
D)evelopmcnt 4,497.4 3,206.7 1,715.8 3,447.5 2,597.2AO)' 4.4974 3,2067 1,715.8 3,447.5 2,597.2
iN1inistc-v of Population Welfarec 1,161.0D)evelopment (ADP) 1,161 (
Slupport Activities 131.2 44.3 75.9I)evelopmnent (ADP) 131.2 44.3 75.9
Total 55,553.8 37,703.0 18,071.6 39,776.3 27,611.4Receii-i-ent 42,021.9 31,281.7 14,984.7 32,410.8 22,681.7
Salar- 36,882.3 28.306.0 13.728.() 29,320.7 21-134.9Non-salary 5 139 6 2,975 8 1,256.7 3,090.1 1,546 9
I)evelopment 13,531.9 6,421.2 3,086.8 7,365.5 4,929.7AD)P 13,531.9 6,421 2 3,086.8 7365 5 4,929.7
Source: Aide memoires ol tlhc donor missions ior SAPP-1I reviews and Quarterly Monitoring Reports
41

Annex V, page 4 of 4
Table 5
Releases and Expenditure: 1999/00Social Action Program - II
National Summary(Million Rs.)
FY 1999-2000Budget End of Quarter 2 End of Quarter 3 Enid of Quarter 4Estimate Released E xpended Released Expended Released Expended
1 3 4 5 6 7 8
E.Iententarv Educatioti 41,131.3 33,491.5 14,174.9 34,261.0 20,626.3 35,246.2 28,147.5Recilil rent 38,304.5 31,610.6 13,362.1 32,245.2 19,489.9 33,125.7 26,477.3
Salarv 35,757 9 30,111.2 13.273 8 30,605 4 19,300.3 31385 0 25,699 7Nnii-salarN 2,546 6 1,499 4 88 3 1.639.8 189) 6 1740 8 777 5
I)cDclopmient 2,826.9 1,880.9 812.8 2,015.8 1,130.4 2,120.5 1,670.2MA)1 2,8269 1.880.9 812.8 2,015.8 1.1364 2-120.5 1.67()2
llcalth 12,884.5 8,871.6 3,890.7 9.420.9 5,212.6 11,133.6 8,134.4lecuirenilt 9,374.2 6,872.2 2,850.(0 7,167.6 3,984.0 8,261.8 6,188.2
SaIllry 6-482.4 4,882 0 2,442.9 5,(32() *.224. .555 2 4.171 6Non-salarv 2,891 8 1,99(.2 407 1 2,135(, 761)0 2.7(166 2.016 5
I)eNelopment 3,510.3 1,999.4 1,040.7 2,253.3 1,228.6 2,871.7 1,946.3ADI) 3.51() 3 1,999.4 1.040.7 2,253 3 1 228 6 2,871 7 1,9463
RWSS 6,300.5 3,968.2 2,306.4 4,764.1 3,49(1.1 4,888.2 4,456.9Recurrent 2,449.0 1,399.7 667.6 1,772.7 1,292.6 2,104.0 1,699.0
SalarN 1,291 .9 879.6 4004 1,0()1.( 7592 1,1160 931 6Non-salary 1 157.1 520.1 267 2 771 7 533 3 988 ( 767 4
I)e Clopment 3,851.6 2,568.5 1,638.9 2,991.3 2,197.5 2,784.3 2,757.9ADI1 3,851 6 2,568.5 1,6389 2,991.3 2.197.5 2784.3 2.7579
Mhinistr- of' IPopulation WeIlfare 1,350.3 1,354.0I k\clo pment (ADP) 1,1(11) 1,3503 1.354.) 1.35()3 1,354.0 1,572 5 1 .572.5
Sulpport Activities*(I I2ese\lolptoieut IAI)'I 288.6 64 0 26.6 71 2 29 8 52.1) 39 5
I otaI 61,705.0 47,745.6 21,752.7 49,867.4 30,712.8 52,892.5 42,350.7lRecill-re-int 5(,127.7 39,882.5 16,879.7 41,185.5 24,766.5 43.491.6 34,364.4
Sakmr\ 43.532 2 35,872.8 16.117 1 366038.4 23,283 6 38X056.2 311,8(13 ()Non-salai\ 6.595 5 4,009.7 762 6 4,547.1 1.482 9 5,435 4 3,561 5
I)e clopment 11,577.3 7,863.1 4,873.0 8,681.9 5,946.3 9,400.9 7,986.3ADP II- .577.3 7,863 1 4,873 ( 8,681 9 5,946.3 9,400 9 7998, 3
otiree: Aide memoires of ltle donor missionis for SAPP-I1 reviewvs and QUarterly Monitorinig Reports
42


I

Multi-Donor Support Unit for the Social Action Programme
c/o World Bank Building a
20-A, Shahrah-e-JamhuriatIslamabad - Pakistan
Telephone: 051-2279 639 And 2279 640Fax: (051) 2828757
a,