public dissemination report contract no: brpr … · energy optimised traction system for electric...
TRANSCRIPT

P
Contract No: Project No: Title: Project Coordina Partners: Reference Period Starting date: Duration: Date of issue:
UBLIC DISSEMINATION REPORT
BRPR-CT97-0499 BE97-4502
OPTELEC Energy Optimised Traction System for Electric Vehicles
tor: University of Sheffield (UK)
Centro Ricerche FIAT (I) Magnetics Systems Technology (UK) Centro Nacional de Microelectronica (E) SAFT (F) TraXis (NL)
: from 01 April 1998 to 30 September 2001
01 April 1998
42 months
24 July 2002
Project funded by the European Community
under Brite/Euram
TABLE OF CONTENTS. 1. MANAGEMENT ISSUES........................................................................................... 3
1.1. Documentation........................................................................................................ 3
1.2. Project contractor Details........................................................................................ 3
1.3. Partner contact details. ............................................................................................ 3
2. PROJECT AIMS AND OBJECTIVES........................................................................ 4
3. RESEARCH APPROACH AND METHODOLOGY................................................. 7
4. ELECTRIC VEHICLE ENERGY CONSIDERATIONS............................................ 8
5. WP1 - VEHICLE SIMULATION................................................................................ 9
5.1. Vehicle simulation models...................................................................................... 9
5.2. Dual source systems.............................................................................................. 11
6. WP2 – POWER ELECTRONICS.............................................................................. 13
6.1. Integrated power module. ..................................................................................... 13
6.2. Gate driver development....................................................................................... 14
6.3. DC-to-DC Converter design. ................................................................................ 14
7. WP3 – DRIVE-TRAIN INTEGRATION. ................................................................. 15
7.1. Machine design optimisation. ............................................................................... 15
7.2. Traction machine integration. ............................................................................... 16
8. WP4 – ENERGY AND POWER STORAGE DEVICES.......................................... 17
8.1. Supercapacitors. .................................................................................................... 17
8.2. Lead-acid traction battery test facility. ................................................................. 18
9. WP5 – VEHICLE CONTROL................................................................................... 18
9.1. Traction system control studies. ........................................................................... 18
9.2. Hardware and software developments. ................................................................. 19
10. WP6 - BRASS-BOARD DEMONSTRATOR. ........................................................ 20
11. CONCLUSIONS....................................................................................................... 22
12. REFERENCES. ........................................................................................................ 23
Document No: optelec_ush_public dissemination report_24-07-02 Page 2 of 2

1. MANAGEMENT ISSUES.
1.1. Documentation. This report is a summary of the Final Technical Report of the EC Funded Project ‘OPTELEC’, Energy Optimised Traction System for Electric Vehicles, for public dissemination. The report details the project main contractors and their respective contact details, the project aims and objectives, work programme structure, a summary of the results from each work package, and final over conclusions. Further technical information may be requested from the project co-ordinator.
1.2. Project contractor Details.
EC PROGRAMME : Brite Euram
PROJECT TITLE & ACRONYM :
Energy Optimised Traction System for Electric Vehicles – OPTELEC
CONTRACT NUMBER : BRPR-CT97-0499
PROJECT WEB SITE : (if any)
http://www.shef.ac.uk/eee/emd/index.html – research projects, OPTELEC Abbreviation Status Country University of Sheffield USH CO UK Centro Ricerche FIAT CRF CR I Magnetic Systems Technology Ltd. MST CR UK Centro Nacional de Micro-electronica CNM CR E SAFT SAFT CR F
PARTNER NAMES :
Alstom Traxis Traxis CR NL
Table 1.1. OPTELEC Project contractor details.
1.3. Partner contact details.
Name Association Tel. No. E-Mail Daniel CHIRON
EC Scientific Officer
+32 229 52503 [email protected]
Nigel SCHOFIELD
USH +44 114 222 5879 [email protected]
Alberto MELZI
CRF +39 011 9083158 [email protected]
Marcus JENKINS
MST +44 114 2448416 [email protected]
Jose MILLAN
CNM +34 935 947700 [email protected]
Christophe JEHOULET
SAFT +33 557 106872 [email protected]
Jolt OOSTRA
Alstom Traxis +31 180 445947 [email protected]
Table 1.2. OPTELEC Partner contact details.
Document No: optelec_ush_public dissemination report_24-07-02 Page 3 of 3
2. PROJECT AIMS AND OBJECTIVES. In order to improve both the energy utilisation and acceleration/regenerative braking performance of electric and hybrid-electric vehicles, electro-chemical supercapacitors and electro-mechanical flywheels are being developed world-wide for use as peak power buffer units. Prior to the commencement of this project, the general practice was to interface such units directly to a fixed dc link of a conventional traction system via additional, standard format, power electronic converters; a constraint which adds complexity and cost, compromises the potential performance improvement, and limits the scope for a higher degree of drive-train component integration. The main technical objectives of the OPTELEC project were, therefore, to completely re-evaluate the electrical traction system format for a typical passenger vehicle, incorporating state-of-art components, specifically : • a high efficiency, permanent magnet traction machine, and • a super-capacitor or flywheel peak power source with energy efficient / low cost
power electronic conditioning, and to research higher integration of the traction system power conversion electronics. The research project proposal was to carry out a detailed appraisal and analysis of the optimal form of electric vehicle traction systems, propose new alternative connection schemes and relevant energy management methods, making optimal use of supercapacitors or flywheel peak power sources. The outcome of the research study would be a specification for the most promising Energy Optimised Traction System, in terms of efficiency and cost saving potential, which would be realised in a prototype and tested via a laboratory based ‘brass-board demonstrator’. The Energy Optimised Traction System should achieve improved energy conversion efficiency and energy utilisation, by virtue of inclusion of a peak power buffer in the vehicle drive-train, resulting in an increase of up to 25% in the range of a vehicle for a given stored battery energy, compared with current traction system technology. Whilst the cost of the power conversion electronics should be some 50% lower than for current non-integrated systems. The reference for comparison of system improvements was taken as a commercial 1.5 tonne passenger electric vehicle, the Fiat Seicento Elettra, having a maximum speed of 120km/h and range of 70km. The vehicle reference mission profile was specified as 4x enhanced ECE15 cycles, plus 1x sub-urban profile. The enhanced ECE15 incorporates an improved acceleration performance of 0-to-50 km/h in 8s, as opposed to 12s, necessitating an increase in drive-train peak power capability of 50%, from 30kW to 45kW. The target objective being to realise this improved drive-train performance without additional traction machine mass or compromise in efficiency. Figure 2.1 shows the basic layout of a state-of-the-art electric vehicle traction system, the main elements being the energy storage and power supply system, the traction machine(s), and the power conditioning and control electronics. Numerous alternative enabling technologies as well as variants of the basic layout are being researched throughout the world. For example, the energy storage and supply systems under consideration include batteries, fuel cells, low emission ICE/generators,
Document No: optelec_ush_public dissemination report_24-07-02 Page 4 of 4

flywheels and supercapacitors, whilst the traction machine technologies include asynchronous, synchronous variable-reluctance, switched reluctance and permanent magnet brushless. However, practically all currently available all-electric, and hybrid-electric, vehicles have similar traction system structures, in which the power-train consists of a single in-board power electronic controlled electrical machine connected via a fixed or variable ratio mechanical transmission to the wheels. In the case of a hybrid-electric vehicle, the battery acts as a peak power supply during acceleration and regenerative braking. The innovative aspects of the OPTELEC project research is in the optimisation of an electric vehicle traction system which incorporates a supercapacitor or flywheel peak power source, rather than focusing on the optimisation of individual elements of the system. This will lead to the most energy efficient and cost-effective system architecture, which will have enhanced functionality, a higher degree of integration and improved performance. Thus, it is anticipated that the traction system for next-generation electric vehicles will take the form shown in Figure 2.2.
Peak Power Source
Supercapacitor/ Flywheel
Voltage source Power converter
TractionMachine
DC
AC
Battery Charger
Power Converter
Auxiliary Load
40kW
Energy source (battery, fuel cell, etc)
Fixed dc link voltage
~ 45kW5 kW
Figure 2.1. State-of-the-art electric vehicle traction system. At the heart of the traction system is the power conversion electronics which facilitates control of the energy/power flow and is designed to operate at the terminal voltage of the supercapacitor / flywheel peak power source. Typically, this will vary over a 2:1 range (equivalent to an energy discharge from 100% to 25%). The battery energy store is interfaced to the variable voltage dc link via a low power dc-to-dc converter. In this way, peak power handling is by only one fully rated power electronic converter, which could also be reconfigured to act as a fast charger - to charge both the batteries, via the dc-to-dc converter, and the supercapacitors/ flywheel peak power source.
Document No: optelec_ush_public dissemination report_24-07-02 Page 5 of 5

In the case of a flywheel peak power source, the output of the integral flywheel motor/generator could be interfaced by a diode rectifier, with a simply commutated inverter being used to control the flywheel motor during regenerative braking.
Permanent magnetmachine and gear stage
1φ, 3φ110/220 Vac
High frequencyinduction
Energy source(battery, fuel cell, etc)
Peak powersource:SupercapacitorFlywheel
Chargersupply
Auxiliary load
5kWFixed dc
216V
45kW
2:1 voltagevariation (Energycharge/dischargefrom 100%-25%)
Integrated TractionPower Control
and BatteryCharging Unit
Figure 2.2. Next-generation electric traction system.
Document No: optelec_ush_public dissemination report_24-07-02 Page 6 of 6

3. RESEARCH APPROACH AND METHODOLOGY. A systematic approach to the OPTELEC project research programme was adopted, as illustrated by the work package flow diagram in Figure 3.1. PHASE I of the work programme consisted of the evaluation of alternative concepts for the energy optimised traction system, containing a separate power buffer unit and a battery energy supply via detailed simulation of the vehicle drive-train. Having derived the system and individual component specifications and their respective boundary interface specifications in PHASE I, four separate, but interdependent, work packages progressed in tandem, each addressing the research and development of component elements of the drive-train system. Thus, in PHASE II of the work programme, the vehicle power electronic requirements (WP2), integrated traction machine, gear-stage and differential (WP3), energy and power source development (WP4) and energy management and vehicle control system (WP5), were completely defined as regards their individual technological requirements and interdependency with the complete vehicle drive-train. Drive-train components were designed, prototypes manufactured and individually tested. PHASE III of the project, WP6, consisted of the final assembly and testing of the complete traction system, initially at USH and then independently by CRF on test benches developed for the project. PHASE 1 PHASE 2 PHASE 3
System concept and selection of advanced traction system
Specifications
Energy and Power Source
Integrated Power Unit
Control Machine
Simulation
Cost and efficiency evaluation
Iterative process
DesignManufacturingTesting
System integrationAssembly
Testing
WP5
WP1
WP6
WP2 WP3WP4
Figure 3.1. OPTELEC Project Work Programme flow diagram.
Document No: optelec_ush_public dissemination report_24-07-02 Page 7 of 7
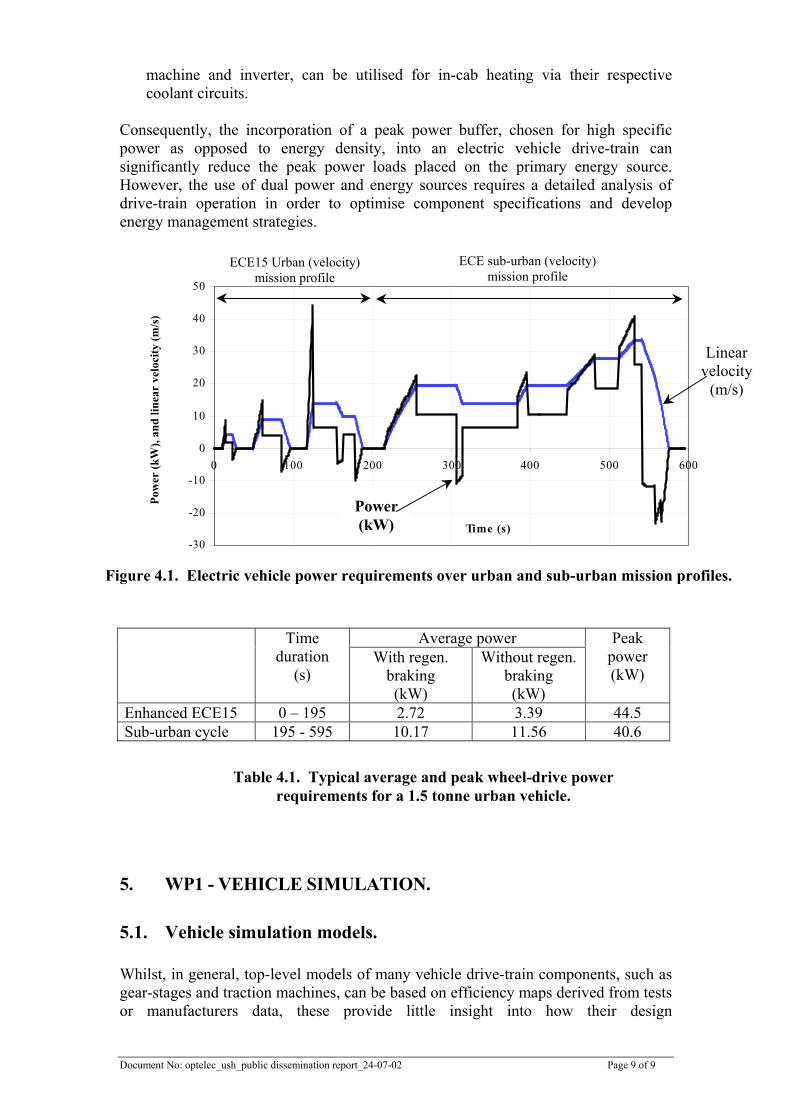
4. ELECTRIC VEHICLE ENERGY CONSIDERATIONS. Research and development in the field of high power, high efficiency traction systems for electric vehicles has been reported world-wide over the last three decades[1] and such systems are reaching a technical maturity with cost optimisation in volume manufacture now the primary target area. However, a major area for further research is in improving the specification and integration of system components and management of energy flow to realise optimum energy utilisation from the drive-train. A major operational problem with electric vehicle traction batteries is their poor performance at high current charge/discharge rates, typical of vehicle acceleration and braking demands. For example, a high power demand from a lead-acid traction battery, even for a short duration (2-3s), chemically limits the remaining energy capacity of the battery due to lowering of the available active mass and effective surface area of the battery plates[2]. In addition, high cyclic operation reduces battery life adding a significant premium to the operating costs of an electric vehicle. The incorporation of a peak power buffer into an electric vehicle drive-train can reduce the peak power load on the primary energy source, resulting in a significant improvement in battery energy utilisation due to levelling of the battery energy demand. Additionally, the response of the vehicle is more consistent when accelerating and braking, and the recovery of vehicle kinetic energy during braking enhanced, since the drive-train energy management is independent of the traction battery state-of-charge or terminal voltage. For example, the power requirements of a small urban, 1.5 tonne, family vehicle during typical urban mission profiles are highly dynamic, being characterised by a relatively low mean continuous power of ~2-4kW, but high peak transient powers of ~45kW, the latter equating to acceleration of the vehicle from 0-50km/h in 8 seconds. Similarly for sub-urban driving, where a 4:1, peak-to-average power is typical, as illustrated in Figure 4.1, again showing power requirements of a small 1.5 tonne vehicle, over an enhanced ECE15 (urban) and sub-urban velocity mission profiles, the specifics of which are detailed in Table 4.1. For the mission profiles illustrated in Figure 4.1, regenerative braking can yield an improvement in vehicle wheel drive energy requirement of 20% and 12% for the urban and sub-urban parts respectively, which is not unrepresentative. Similar potential gains can also be shown for public transport vehicles (buses) that have power demands predominantly characterised by high acceleration and regenerative braking, over low mean energy consumption. Goods delivery vehicles operating in urban areas also exhibit similar trends. However, recovery of vehicle kinetic energy does not fully translate to a lower battery energy requirement, with only marginal benefits <5% being reported by one of the project partners[3]. The shortfall can be attributed to:
the poor response of most readily available chemical battery technologies (in-particular lead-acid) and their associated management systems, to pulsed power demands, and
•
•
inefficiencies in the wheel-to-battery drive-train, although some of the energy dissipated in the drive-train components during regenerative braking, i.e. traction
Document No: optelec_ush_public dissemination report_24-07-02 Page 8 of 8
machine and inverter, can be utilised for in-cab heating via their respective coolant circuits.
Consequently, the incorporation of a peak power buffer, chosen for high specific power as opposed to energy density, into an electric vehicle drive-train can significantly reduce the peak power loads placed on the primary energy source. However, the use of dual power and energy sources requires a detailed analysis of drive-train operation in order to optimise component specifications and develop energy management strategies.
-30
-20
-10
0
10
20
30
40
50
0 100 200 300 400 500 600
Time (s)
Pow
er (k
W),
and
linea
r ve
loci
ty (m
/s)
Power (kW)
Linear velocity
(m/s)
ECE sub-urban (velocity) mission profile
ECE15 Urban (velocity)mission profile
Figure 4.1. Electric vehicle power requirements over urban and sub-urban mission profiles.
Average power Time duration
(s) With regen.
braking (kW)
Without regen. braking (kW)
Peak power (kW)
Enhanced ECE15 0 – 195 2.72 3.39 44.5 Sub-urban cycle 195 - 595 10.17 11.56 40.6
Table 4.1. Typical average and peak wheel-drive power requirements for a 1.5 tonne urban vehicle.
5. WP1 - VEHICLE SIMULATION.
5.1. Vehicle simulation models. Whilst, in general, top-level models of many vehicle drive-train components, such as gear-stages and traction machines, can be based on efficiency maps derived from tests or manufacturers data, these provide little insight into how their design
Document No: optelec_ush_public dissemination report_24-07-02 Page 9 of 9

parameters/characteristics influence overall vehicle performance. Therefore, since the choice of power electronic converter topology, semiconductor device technology, pulse-width-modulation switching strategy, current control strategy, nominal battery voltage, and traction machine design parameters all affect the system efficiency, to a greater or lesser degree, detailed modelling of key components was undertaken. 0
Fig. 2. SABER-based simulation tool.
Figure 5.1. SABERTM-based simulation tool.
(a) Top level model of electricvehicle traction system
-150
-100
-50
0
50
100
150
200
25 50 75 100 125 150 175 200
Time (s)
Torq
ue (N
m),
Line
ar v
eloc
ity (m
/s)
Velocity
Torque
(b) Traction machine torque over mission profile
(c) Traction machine transient iron and copper loss data
Iron lossCopper lossLoss(W)
(d) Transient thermal data for traction machine back-iron, winding, tooth body and magnets
θ(oC)
Time domain simulations, using the SABER simulation platform and incorporating experimentally validated macro-models of the various vehicle system components, provided a detailed insight into the influence of the drive-train architecture, the ratings of the energy and peak power buffer sources, and the energy management strategy on the overall vehicle performance under prescribed driving cycles. A comprehensive suite of macro-models of various traction system components has been established, and subsequently employed in top-level SABER-based simulations of a benchmark urban electric vehicle, an example of the software graphics and results being shown in Figure 5.1. The top-level model, Figure 5.1(a), comprises of a number of component models with pre-specified inputs/outputs. Vehicle simulation is facilitated by the interconnection of the component models thus allowing a high degree of design flexibility whilst optimising the drive-train system topology. From inputs of specified driving cycles (e.g. standard ECE, FTB, CARB, etc. or other user defined), the torque-speed requirement at the driven wheel(s) was calculated from a model of the vehicle kinematics, Figure 5.1(b). This was translated to a power demand from the battery, or a power input when regeneratively braking, via models of the transmission and reduction gearing, the traction machine and the power electronic drive. Hence, from the estimated battery loss and its state-of-charge, the range of the vehicle could be determined, as well as other performance data, such as component losses, Figure 5.1(c), and temperature rise, Figure 5.1(d). However, whilst time-domain simulation tools such as SABER are capable of solving large mixed signal systems, containing detailed models of semiconductor
Document No: optelec_ush_public dissemination report_24-07-02 Page 10 of 10

devices, analogue/digital controllers and electromechanical devices, etc., the computational effort to simulate a vehicle over representative driving cycles whilst accurately accounting for operation of each switching device would be prohibitive. Hence, a hierarchical approach to system modelling was employed, in which a top-level vehicle model such as that in Figure 5.1(a) was supplied with data calculated off-line from detailed models of the relevant traction system components[4].
5.2. Dual source systems. The developed simulation models have been used to evaluate alternative dual power and energy source traction system architectures that combine a supercapacitor peak power buffer with the battery energy source. For example, Figure 5.2. illustrates two possible structures for a dual power source system, showing (a) the traction battery directly supplying the traction inverter DC link voltage and the power buffer connected to supplement the traction peak power via a dc:dc converter, and (b) the peak power buffer directly connected to the traction drive DC link and the batteries connected via a dc:dc converter. Figure 5.2(a) represents a conventional electric vehicle traction system to which a power buffer and DC:DC converter interface has been added to provide system transient loading. The DC:DC converter typically interfaces between a low voltage, high current supercapacitor system (chosen due to concerns over cell charge and voltage management) and a traction battery voltage of nominally 240V. As such, the DC:DC power transients are in the order of ~45kW, which is demanding in terms of silicon and passive component (i.e. inductor) volumes. Since the terminal voltage of a traction battery will vary considerably between fully charged and discharged states, the traction drive has to be rated to cater for a wide range of operating voltages without loss in performance. Therefore the change from the more conventional approach to one where the DC link is allowed to continually vary, as in Figure 5.2(b), has minimal impact on the traction drive design. Further, a direct connection between the peak power source and traction system is more energy efficient since the DC:DC converter power handling requirements are much reduced, ideally, only transferring the average vehicle power from the traction battery. Consequently, the DC:DC converter can have a reduced silicon rating, an important commercial consideration.
Vdc
DC/DC Power buffer
Battery Inverter
AC PM Machine
Tractiondrive
V dc DC/DC
Powerbuffer
Battery
(a) Battery on DC link (b) Power buffer on DC link Figure 5.2. Two possible dual source structures.
Document No: optelec_ush_public dissemination report_24-07-02 Page 11 of 11

Figure 5.3. shows simulation results for a small, 1.5 tonne, urban passenger vehicle with a traction system configured with the variable DC link dual source structure of Figure 5.2(b), and a 180Wh supercapacitor as the peak power buffer. Note, other peak power buffer technologies, e.g. flywheels, could provide this function. The vehicle is simulated over 4x enhanced ECE15 mission profiles and an additional suburban cycle, as shown in Figure 5.3(a). For illustration, a simple energy management scheme is implemented within the model such that (i) the peak power buffer normally supplies the peak power, (ii) the battery supplies the average power, (iii) when the buffer unit is fully charged any surplus regenerative energy is diverted to the battery, and (iv) when the DC link falls below a minimum set level, all further power requirement is drawn directly from the battery, as shown in Figure 5.3(b). The resulting supercapacitor current is highly dynamic as shown in Figure 5.3(c), while the battery current (d) is, for this scenario, unipolar and with a significantly reduced cyclic profile. Note, for the case of no peak power buffer, the battery current would be the summation of the currents of Figure 5.3(c) and (d). The simulation results for battery current demonstrate that the use of a 180Wh supercapacitor power buffer, suitably integrated in a vehicle drive-train augmenting energy management, can significantly reduce the peak battery current magnitude and cyclic loading during urban driving, with the consequential improvement in vehicle range and lifetime from batteries in electric vehicles.
020406080
100120140
speed[km/h]
(a) CENE driving cycle(urban and suburban)
Speed (km/h)
(d) battery currentA
(c) peak powerbuffer currentA
link voltage
Target min. for energymanagement controller
Accelerationcurrents
Braking currents
0 200 400 600 800 1000 1200 1400
(b) d.c.V
Time (s)
Figure 5.3. Simulation results for 1.5 tonnes urban vehicle over four urban and one sub-urban mission profile.
Document No: optelec_ush_public dissemination report_24-07-02 Page 12 of 12

6. WP2 – POWER ELECTRONICS.
6.1. Integrated power module. To research higher integration of vehicle traction inverter power electronics, a 400A, 600V, inverter phase-leg power module has been researched, designed and evaluated via tests on a number of prototype units. The module has been designed with an integrated direct copper bonded (DCB), alumina based, water-cooled heatsink construction to:
improve the silicon-to-coolant heat transfer, leading to a reduction of required silicon area per ampere, and
•
• optimise the thermal expansion coefficients between the silicon substrate and coolant surface, thus improving the mechanical integrity of the device when subjected to transient thermal expansions experienced during typical traction duty loading scenarios, a major lifetime failure mechanism in traction inverter drives.
The module design employed state-of-the-art, non-punch-through IGBTs, and fast recovery diodes with unique ‘triple Q’ lifetime control for fast, low loss switching. Additionally, a number of passive components such as silicon junction temperature measurements and break-over voltage protection devices were also integrated within the module to provide a higher degree of device protection than would be available on present commercially available modules. The prototype module construction incorporates a plastic housing, with silicone and epoxy die coatings providing excellent moisture resistance, and a robust and compact design ideally suited for application in an automotive environment. The thermal simulation methodology has been established and validated with the OPTELEC modules. In parallel CNM have expanded their capability for power silicon device mounting and module fabrication. Although the potential for application of the module is limited due to the single phase-leg topology, the application expertise and knowledge, design innovations and thermal data generated by the OPTELEC consortium, will form the basis of further research and development towards full integration of the power electronic stage of electric vehicle drive-trains. Figure 6.1. illustrates (a) the prototype integrated power module, (b) open case view and (c) bond wire connection schematic. Test data illustrated the potential for reduction of ~40% of power silicon usage for a given device current rating, a significant cost reduction given that approximately 60-80% of module cost for commercial three phase inverter modules is the power silicon content.
c1
e1g1
t2
t4
t3
t1
g2
c2
e2
Rsense2Rsense1
(a) (b) (c)
Figure 6.1. Prototype integrated power module (a), open case view (b) and bond wire connection schematic (c).
Document No: optelec_ush_public dissemination report_24-07-02 Page 13 of 13

6.2. Gate driver development. A significant cost component and energy consumer in power electronic converters is the silicon device gate drive circuitry. A gate drive circuit suitable for a 400A, 600V, water cooled IGBT power module (in a phase leg configuration) has been researched, designed and prototypes manufactured. The main features of the drive circuit are its protections against short circuit fault currents and shoot through conduction, over temperature, transient over voltage (device) and under voltage (driver supply). The output driver forces negative gate-to-emitter voltage during the IGBT off-state using a single isolated voltage power supply, as well as ‘soft’ turn-off after short circuit fault. This feature reduces the IGBT gate voltage from its positive value to zero and then from zero to the negative value, avoiding excessive collector-emitter voltage peaks. The main novelties of the IGBT power module gate drive circuit design are the: • drive circuit simplicity in order to realise a compact system and a high level of
driver-power device integration, and consequently reduce fabrication costs, • power device protection under optimal switching conditions for module reliability,
and • low driver circuit power consumption for increased converter efficiency.
6.3. DC-to-DC Converter design. The management of energy transfer between a battery, peak power buffer (e.g. supercapacitor) and traction system invariably requires interface electronics in the form of a dc:dc converter between the two energy sources. Prior to commencement of the OPTELEC project, limited work had been published on detailed design of dc:dc converters for the transfer of energy at the levels pertinent to electric vehicle applications. High current transients experienced in the control of power dc:dc converters has, in the past, tended to lead to an over-specification of the power silicon devices, device gate drive requirements and dc filtering capacitance, resulting in an elevated production cost for such units. Figure 6.2. Power stage of OPTELEC brass-board dc-to-dc converter.
Document No: optelec_ush_public dissemination report_24-07-02 Page 14 of 14

Research into the design of power dc:dc converters has been undertaken, with detailed, in-depth analysis and simulation of the transient switching and loss mechanisms of the silicon devices and circuit topology. The outcome of this research study has resulted in improved design and analysis of high power dc:dc converters, in-particular for device switching transients and gate drive design requirements which significantly influence converter losses and hence converter energy efficiency. The research has been validated via two prototype dc:dc converters built for the project brass-board demonstrator, the power stage of which is illustrated in Figure 6.2. 7. WP3 – DRIVE-TRAIN INTEGRATION.
7.1. Machine design optimisation. The OPTELEC research has formalised a design methodology for brushless permanent magnet traction machines designed to realise a high peak-to-continuous torque/power duty rating, a performance specification typical of urban electric vehicles. The machine target performance requirements are derived from a classical, linear, two-axis approach, from which it can be shown that an optimal set of machine parameters are necessary to realise the required traction performance envelope within the volt-ampere constraints of the dc supply and machine inverter power silicon. The machine performance is dependant upon the flux-linkage per pole, which defines the maximum torque for a given nominal current, and the normalised armature reaction which influences the base-to-maximum speed ration. Consequently, the preliminary design stage consists of optimising these parameters to fulfil these requirements. The design methodology implements a linear electro-magnetic model coupled with a numerical search algorithm to calculate the main geometric dimensions of the machine, and hence the terminal parameters in terms of phase emf coefficient, inductance and resistance, whilst verifying the thermal performance via a detailed lumped parameter model. The optimised machine geometry is checked via finite element analysis and validated via tests on a prototype traction machine. The machine design methodology is exploitable over a wide area of traction machine applications and should lead to the improved design optimisation of these machines in future vehicle systems. Figure 7.1 illustrates an example of the computed electro-magnetic field distribution for the brass-board demonstrator prototype machine.
Figure 7.1. Computed electro-magnetic field distribution for the brass-board demonstrator prototype machine.
Document No: optelec_ush_public dissemination report_24-07-02 Page 15 of 15

7.2. Traction machine integration. The interdependence of electric vehicle drive-train mechanical components, i.e. permanent magnet traction machine, reduction gear-stage and differential, has been researched via several case studies which highlighted the efficiency and mass saving potential of considering the integration of the drive-train components at the earliest stage of the drive-train design process. For example, mounting of the drive-train components longitudinally in the vehicle, for convenience of ‘packaging’, incurs a penalty of increased drive train frictional losses between skewed axes. Conversely, mounting of the drive-train components laterally in the vehicle permits numerous combinations of electro-magnetic machine size/specification, gear-stage configuration, and drive-train shaft layout. The case studies showed that: • by introducing a single stage speed reduction epicyclic gear, large reductions in
motor mass and volume are made, in exchange for minimal drive-train power losses, at the expense of moderate increase in machine complexity, and
• further reductions in electro-magnetic machine mass and volume will be increasingly offset by increased mass and volume of alternative two (or more) stages of reduction gear, while necessitating increasing complexity in the machine, and leading to increasing gear train power losses.
The final integrated mechanical drive-train solution for the OPTELEC project (permanent magnet traction machine, reduction gear-stage and differential) achieves an overall peak power density of 0.69kW/kg, compared with 0.51kW/kg for the reference vehicle drive-train, with a 30% reduction in volume envelope. Additionally, the permanent magnet solution yields higher overall efficiencies over the system torque-speed envelope and has a peak power capability 1.5 times that of the induction based reference vehicle machine, i.e. 45kW vs. 30kW, an important vehicle performance enhancing attribute in terms of acceleration capability. Figure 7.2. illustrates (a) the mass and volumetric improvements for the integrated drive-train solution and (b) the integrated prototype traction machine, gear-stage and differential unit prototype.
Figure 7.2. Integrated traction machine, gear-stage and differential prototype.
(a) (b)
Fiat Seicento Elettrareference drive-trainTotal mass: 59.8kgPeak power: 30kW
OPTELEC drive-trainTotal mass: 62.3kgPeak power: 45kW
300mm
Document No: optelec_ush_public dissemination report_24-07-02 Page 16 of 16

8. WP4 – ENERGY AND POWER STORAGE DEVICES.
8.1. Supercapacitors. A supercapacitor peak power buffer was implemented for the project ‘brass-board’ demonstrator, comprising of two supercapacitor technologies, SAFT and Maxwell, and chosen to compare their relative technical performance and to investigate and specify the component operational requirements in a high voltage (280-300V) series configuration. Individual supercapacitor cell voltage is limited by decomposition of the active carbon electrode and organic liquid electrolyte to typically 2.7Vmax per cell for the technologies considered. The upper voltage limit is also a function of the operating temperature of the cell, factors which can dramatically reduce cell operating life. Since cells have a production variance in capacitance, individual cell voltages will naturally vary during the initial charging of a high voltage series string, after which the cell voltage distribution will become a function of the internal leakage current over time. Hence, a series cell configuration will settle to have a non-uniform cell voltage distribution. Consequently, suitable management of cell voltage and temperature is critical to the safe and lifetime operation of supercapacitor systems. A Labview based cell management system utilising an Agilent 34970A data acquisition package connected to a PC via a GPIB data bus, has been designed for the data logging, monitoring and protection of the ‘brass-board’ supercapacitor system. Data for each capacitor cell is graphically displayed, no user interaction is required and all recorded data is saved and time-stamped. Test data from the cell management system has been used to research and develop improved cell management strategies for supercapacitor systems and has demonstrated the relatively low variation in cell voltages during transient cyclic operation once the individual cells have been suitably formed. The strategies will enhance the future utilisation potential of supercapacitor based peak power buffers in vehicle applications. Figure 8.1 illustrates the Maxwell supercapacitor bank, interconnection and protections for the brass-board demonstrator.
Controls for SAFTbank discharge.
Controls forMAXWELL bank
discharge.
Connectors for DC:DCconverters 1&2
Inverter Connector
SAFT SC Bank Connector
Balancing and overvoltage protection boards.
Supercapacitor tray 1.Containing 25 MaxwellPowercache 2500F cells.
Supercapacitor tray 2.Containing 25 MaxwellPowercache 2500F cells.
Safety discharge resistors.
Ventilation fan.
Auxiliary power supplies.
Vacuum contactors.
Figure 8.1. Supercapacitor and brass-board interconnection test facility.
Document No: optelec_ush_public dissemination report_24-07-02 Page 17 of 17
8.2. Lead-acid traction battery test facility. A major operational problem with electric vehicle traction batteries is their poor performance at high current charge/discharge rates, typical of urban vehicle acceleration and braking demands. For example, a high power demand from a lead-acid traction battery, even for a short duration (2-3s), chemically limits the remaining energy capacity of the battery due to lowering of the available active mass and effective surface area of the battery plates. In addition, high cyclic operation reduces battery life adding a significant premium to the operating costs of an electric vehicle. Testing of 70Ah, valve-regulated, sealed, lead-acid traction batteries has been undertaken for varied load scenarios: • continuous power discharges, at increasing load levels from 7A/10hrs, upwards, to
determine a ‘steady discharge’ Peukert relationship, and • repetitive cycling of the traction battery over enhanced ECE15 (45kW peak)
mission profiles, to study battery deterioration with transient loads. The test data has been utilised to develop improved transient battery models and evaluate the impact on vehicle energy utilisation associated with the incorporation of a peak power buffer into an electric vehicle drive-train. 9. WP5 – VEHICLE CONTROL.
9.1. Traction system control studies. Energy management strategies for electric vehicle traction systems comprising of a battery and supercapacitor peak power buffer have been researched and a number of suitable control philosophies developed and implemented via the vehicle energy management unit (VMU). The energy management controller design is derived from analytical expressions of the vehicle system, and applying classical control design techniques, such as Bode and root locus analysis. A state-space form is adopted for the controller representation, thus enabling a wide range of linear controller structures to be simulated and evaluated via Simulink™. The developed controllers have been studied via vehicle system simulation tools and two schemes, a DC-link voltage regulator configuration, and a voltage-tracking configuration, have been validated via implementation on the project ‘brass-board’ demonstrator VMU. The main exploitable results of the study are: • energy management control schemes suitable for vehicle traction systems,
Document No: optelec_ush_public dissemination report_24-07-02 Page 18 of 18
• identification of control variables required by an energy based control strategy for each power module connected to the VMU, and
• specification of the controller up-date frequencies (bandwidths) for the controller
and vehicle variables, using Discrete Fourier Transform (DFT) techniques. The application area of the research is wide and encompasses surface transport vehicles employing multi-sourced energy systems. However, there are a number of potential research areas to be addressed, in-particular the on-line prediction of vehicle traction requirements and the implementation of predictive control algorithms.
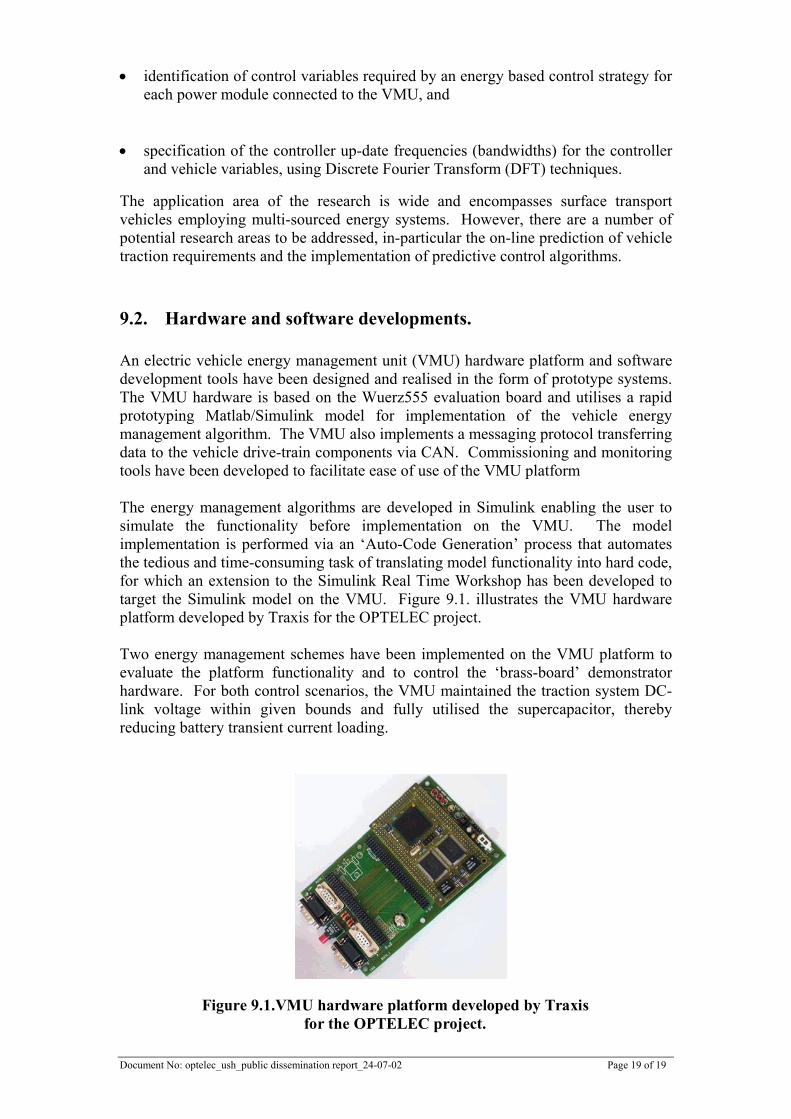
9.2. Hardware and software developments. An electric vehicle energy management unit (VMU) hardware platform and software development tools have been designed and realised in the form of prototype systems. The VMU hardware is based on the Wuerz555 evaluation board and utilises a rapid prototyping Matlab/Simulink model for implementation of the vehicle energy management algorithm. The VMU also implements a messaging protocol transferring data to the vehicle drive-train components via CAN. Commissioning and monitoring tools have been developed to facilitate ease of use of the VMU platform The energy management algorithms are developed in Simulink enabling the user to simulate the functionality before implementation on the VMU. The model implementation is performed via an ‘Auto-Code Generation’ process that automates the tedious and time-consuming task of translating model functionality into hard code, for which an extension to the Simulink Real Time Workshop has been developed to target the Simulink model on the VMU. Figure 9.1. illustrates the VMU hardware platform developed by Traxis for the OPTELEC project. Two energy management schemes have been implemented on the VMU platform to evaluate the platform functionality and to control the ‘brass-board’ demonstrator hardware. For both control scenarios, the VMU maintained the traction system DC-link voltage within given bounds and fully utilised the supercapacitor, thereby reducing battery transient current loading.
Figure 9.1.VMU hardware platform developed by Traxisfor the OPTELEC project.
Document No: optelec_ush_public dissemination report_24-07-02 Page 19 of 19
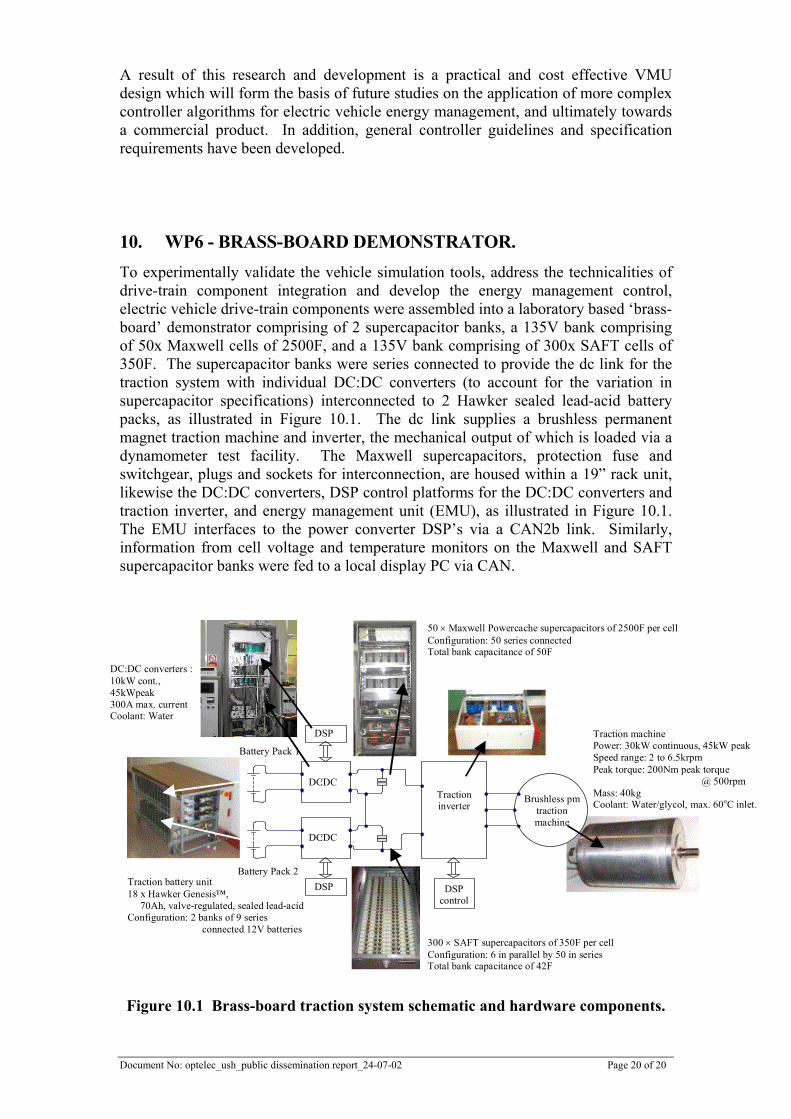
A result of this research and development is a practical and cost effective VMU design which will form the basis of future studies on the application of more complex controller algorithms for electric vehicle energy management, and ultimately towards a commercial product. In addition, general controller guidelines and specification requirements have been developed. 10. WP6 - BRASS-BOARD DEMONSTRATOR. To experimentally validate the vehicle simulation tools, address the technicalities of drive-train component integration and develop the energy management control, electric vehicle drive-train components were assembled into a laboratory based ‘brass-board’ demonstrator comprising of 2 supercapacitor banks, a 135V bank comprising of 50x Maxwell cells of 2500F, and a 135V bank comprising of 300x SAFT cells of 350F. The supercapacitor banks were series connected to provide the dc link for the traction system with individual DC:DC converters (to account for the variation in supercapacitor specifications) interconnected to 2 Hawker sealed lead-acid battery packs, as illustrated in Figure 10.1. The dc link supplies a brushless permanent magnet traction machine and inverter, the mechanical output of which is loaded via a dynamometer test facility. The Maxwell supercapacitors, protection fuse and switchgear, plugs and sockets for interconnection, are housed within a 19” rack unit, likewise the DC:DC converters, DSP control platforms for the DC:DC converters and traction inverter, and energy management unit (EMU), as illustrated in Figure 10.1. The EMU interfaces to the power converter DSP’s via a CAN2b link. Similarly, information from cell voltage and temperature monitors on the Maxwell and SAFT supercapacitor banks were fed to a local display PC via CAN.
50 × Maxwell Powercache supercapacitors of 2500F per cellConfiguration: 50 series connectedTotal bank capacitance of 50F
DSP
DSP
DSPcontrol
DC:DC
DC:DC
Battery Pack 1
Battery Pack 2
Tractioninverter
Brushless pmtractionmachine
300 × SAFT supercapacitors of 350F per cellConfiguration: 6 in parallel by 50 in seriesTotal bank capacitance of 42F
Traction machinePower: 30kW continuous, 45kW peakSpeed range: 2 to 6.5krpmPeak torque: 200Nm peak torque @ 500rpmMass: 40kgCoolant: Water/glycol, max. 60oC inlet.
Traction battery unit18 x Hawker Genesis™, 70Ah, valve-regulated, sealed lead-acidConfiguration: 2 banks of 9 series connected 12V batteries
DC:DC converters :10kW cont.,45kWpeak300A max. currentCoolant: Water
Figure 10.1 Brass-board traction system schematic and hardware components.
Document No: optelec_ush_public dissemination report_24-07-02 Page 20 of 20

One of the features of supercapacitor technologies perceived to be technically limiting is their low cell voltage, typically max. 2.7V, which fosters parallel connection (and hence high current) for cell balancing and load share. However, such low voltage systems are not conducive to vehicle traction systems handling peak powers of ~45kW, essentially the silicon and component interconnections would not be cost effective. Hence, a high voltage (270V) supercapacitor configuration was implemented for the project brass-board demonstrator. This necessitated the design of supercapacitor cell balancing and monitoring circuitry to ensure safe and effective operation. An important exploitation outcome of the research was the applications experience gained during test of the brass-board system. Results showed that once the series connected supercapacitor cells had been fully charged and the cells balanced, i.e. a ‘forming’ procedure, the series configuration was then relatively insensitive to dynamic load variations, as illustrated in Figure 10.2(a), showing individual cell voltage variation as the Maxwell supercapacitor bank is cycled over the ECE15 mission profile. A simple and low energy ‘forming’ process being implanted via the vehicle EMU during periods of system rest. Figure 10.2(b). illustrates measured data from the brass-board test facility showing system dc link voltage, traction machine current, supercapacitor and battery currents over one ECE15 mission cycle. The results illustrate the predicted reduction in battery current magnitude, how the energy management utilises battery current in addition to regenerated current to recharge the supercapacitors, and the essentially unipolar nature of the battery current.
0
0.5
1
1.5
2
2.5
3
2 161 320 479 639
Time (s)
Supe
rcap
acito
r cel
l vol
tage
s (V
)
(a) Individual cell voltages of Maxwellsupercapacitor bank during CENE mission profile
-40
-20
0
20
40
60
80
100
0 50 100 150 200
Time (s)
DC Link voltage (V/3)
Tractioncurrent (A)
Supercapacitorcurrent (A)
Velocity (m/s)
Battery current (A)
(b) Brass-board test data for 1 cycle ofECE15 mission profile
0
50
100
150
200
250
300
0 2500 5000 7500 10000 12500 15000
Time (s)
Batte
ry v
olta
ge (V
)
With supercapacitorand energy
management
Withoutpowerbuffer
(c) Battery terminal voltage variation duringdischarge over repetitive ECE15 mission profiles
Figure 10.2 Brass-board traction system test data. Repetitive cycling of the traction battery over ECE15 cycles demonstrates a clear improvement in battery loading, better energy utilisation and hence range for the dual source scenario, as illustrated in Figure 10.2(c), showing measured battery terminal
Document No: optelec_ush_public dissemination report_24-07-02 Page 21 of 21

voltage for a system operating with and without a supercapacitor power buffer and energy management unit. The improvement in battery energy utilisation equates to an increase in vehicle range of 56% for this case study, the increase in energy usage per cycle for the battery and supercapacitor case being due to the conversion efficiency of the DC:DC converter, Table 10.1.
Battery alone Battery supercap. and EMU
Nominal dc link voltage (V) 216 216 Test duration (s) 9,483 14,748 ECE15 cycles completed 48.6 75.6 Range (km) 54.9 85.4 Battery performance (Ah) 33.5 55.6 Battery performance (kWh/cycle) 0.145 0.156 Total energy (kWh) 7.05 11.77
Table 10.1. Lead-acid traction battery test data.
11. CONCLUSIONS. The integration of vehicle system components and the development of energy management philosophies are significantly enhanced by the facility of a detailed and re-configurable simulation based design tool. The use of a peak power buffer can significantly reduce peak currents drawn from the traction battery of an electric vehicle resulting in a marked improvement in vehicle range and battery lifetime. A peak power buffer is an essential drive-train element if vehicle kinetic energy is to be fully exploited during regenerative braking. Additionally, with appropriate energy management of the vehicle dual energy and peak power sources, the response of the vehicle is more consistent when accelerating and braking, since it is independent of the traction battery state-of-charge. The variable DC link architecture, where the power buffer is directly connected to the traction drive, yields promising results for both supercapacitor and flywheel systems. However, careful energy management is required to ensure effective use of the limited energy storage capacity of the peak power buffer whilst maintaining system voltage stability. As stated earlier, a high power demand from a lead-acid traction battery, even for a short duration (2-3s), chemically limits the remaining energy capacity of the battery due to lowering of the available active mass and effective surface area of the battery plates. This is illustrated by the reduction in vehicle range from 70km to 54.9km, as a consequence of increasing the battery peak power demand from 30kW to 45kW for improved vehicle acceleration performance, i.e. 0-50km/h in 8s as opposed to 12s. The original project objectives of increased vehicle range and higher performance can, therefore, only be realised by the inclusion of a peak power buffer in the vehicle drive-train. For the vehicle traction system considered, the inclusion of a peak power
Document No: optelec_ush_public dissemination report_24-07-02 Page 22 of 22

buffer yields a 22% improvement in range from the reference vehicle specification of 70km to 85.4km, with a 50% improvement in vehicle acceleration performance, realised via improved utilisation of the stored energy available from the lead-acid traction battery. Finally, test data has illustrated the potential for a reduction of ~40% of power silicon usage, for a given device current rating, by improved thermal integration of the power stage and cooling system. Additionally, a similar power silicon saving can be realised for the traction system dc-to-dc converter by improved component specification. Although silicon cost is highly variable due to market demand, the savings highlighted could result in a significant power converter cost reduction given that approximately 60-80% of module cost for commercial three phase inverter modules is the power silicon content. 12. REFERENCES. [1] Brusaglino, G., Ravello, V., Schofield, N. and Howe, D.: ‘Advanced drives for
electrically propelled vehicles’, Proc. 33rd Int. Symp. on Automotive Technology and Automation (ISATA), Dedicated Conf. on Electric, Hybrid, Fuel Cell and Alternative Fuel Vehicles, Paper 00ELE045, pp.293-300, Dublin, 25-27 Sept. 2000.
[2] Brodd, R. J., Kordesch, K. V.: ‘Lead-acid batteries’, book, Wiley-Interscience Publication, ISBN 0-471-08455-7.
[3] Technical meeting between USH and CRF. [4] Mellor, P.H., Schofield, N., Brown, A.J. and Howe D.: ‘Assessment of
supercapacitor/flywheel and battery EV traction systems’, Proc. 33rd Int. Symp. on Automotive Technology and Automation (ISATA), Dedicated Conf. on Electric, Hybrid, Fuel Cell and Alternative Fuel Vehicles, Paper 00ELE044, pp.235-242, Dublin, 25-27 Sept. 2000.
Document No: optelec_ush_public dissemination report_24-07-02 Page 23 of 23