public expenditure review national agricultural input voucher … · · 2015-08-13public...
TRANSCRIPT

DRAFT FOR DISCUSSION
PUBLIC EXPENDITURE REVIEW
NATIONAL AGRICULTURAL INPUT VOUCHER SCHEME (NAIVS)
TANZANIA
SEPTEMBER 2013
DRAFT FOR DISCUSSION
2
TABLE OF CONTENTS
TABLE OF CONTENTS ........................................................................................................................................ 2
LIST OF FIGURES ............................................................................................................................................... 4
LIST OF TABLES ................................................................................................................................................ 5
ACRONYMS ...................................................................................................................................................... 6
ACKNOWLEDGEMENTS .................................................................................................................................... 7
EXECUTIVE SUMMARY ..................................................................................................................................... 8
1.0 INTRODUCTION .................................................................................................................................... 12
1.1 ECONOMIC AND POLICY CONTEXT .................................................................................................................. 12
1.2 TRENDS IN CROP PRODUCTION AND PRODUCTIVITY ........................................................................................... 16
1.3 NAIVS PROGRAM MOTIVATION .................................................................................................................... 18
2.0 NAIVS IMPLEMENTATION AND COSTS .................................................................................................. 20
2.1 OVERVIEW OF NAIVS ............................................................................................................................. 20
2.2 IMPLEMENTATION FEATURES OF NAIVS .......................................................................................................... 22
2.2.1 Annual Implementation Cycle ....................................................................................................... 22
2.2.2 Implementation Procedure ........................................................................................................... 23
2.3 EXPENDITURE ON NAIVS .............................................................................................................................. 25
3.0 MEASURING FINANCIAL AND ECONOMIC RETURNS ............................................................................. 30
3.1 ANALYTICAL APPROACH AND STUDY POPULATION ............................................................................................. 30
3.1.1 Sample Selection ........................................................................................................................... 31
3.1.2 Data Collection .............................................................................................................................. 31
3.1.3 Data Collection Instruments ......................................................................................................... 32
3.1.4 Household Survey .......................................................................................................................... 32
3.1.5 Listing Survey ................................................................................................................................ 33
3.1.6 Other Surveys ................................................................................................................................ 33
3.1.7 Changes to the Sample ................................................................................................................. 33
3.2 EMPIRICAL MODEL AND RESULTS ................................................................................................................... 33
3.2.1 Summary Statistics of Program Participants ................................................................................ 34
3.2.2 Impacts of Program on Input Usage and Yields ............................................................................ 36
3.2.3 Benefit-Cost Analysis..................................................................................................................... 44
4.0 NAIVS DESIGN AND IMPLEMENTATION ISSUES..................................................................................... 48
4.1 HOUSEHOLDS TARGETING AND DISPLACEMENT ................................................................................................. 48
4.1.1 Households Targeting ................................................................................................................... 48
4.1.2 Displacement ................................................................................................................................ 49
4.2 BENEFICIARIES GRADUATION AND PROGRAMME KNOWLEDGE ............................................................................. 49
4.3 INPUT MARKET ACCESS AND PUBLIC AWARENESS .............................................................................................. 50
4.4 EXPANSION TO LOWER RAINFALL ZONES .......................................................................................................... 52
4.5 SUSTAINABILITY........................................................................................................................................... 53
4.6 EVIDENCE OF MISUSE OF VOUCHERS ............................................................................................................... 55
4.7 DELAYED DELIVERY OF VOUCHERS AND INPUTS ................................................................................................. 58
4.8 PARTICIPATION OF TRAINED AGRO DEALERS IN THE PROGRAM ............................................................................. 58
5.0 CONCLUSIONS AND RECOMMEDATIONS .............................................................................................. 60
DRAFT FOR DISCUSSION
3
REFERENCES ................................................................................................................................................... 62
APPENDICES................................................................................................................................................... 65
APPENDIX 1: PERFORMANCE INDICATORS FOR NAIVS ............................................................................ 65
APPENDIX 2: ANNUAL ACTIVITY IMPLEMENTATION TIMELINE FOR THE PROGRAM ................................ 67
APPENDIX 3: INSTITUTIONAL ARRANGEMENT ......................................................................................... 70
APPENDIX 4: NUMBER OF VOUCHERS DISTRIBUTED TO REGIONS IN 2010/11 CROP SEASON ................. 73
APPENDIX 5: NUMBER OF VOUCHERS DISTRIBUTED TO REGIONS IN 2011/12 CROP SEASON ................. 74
APPENDIX 6: NUMBER OF VOUCHERS DISTRIBUTED TO REGIONS IN 2012/13 CROP SEASON ................. 75
APPENDIX 7: TECHNICAL DETAILS OF THE IMPACT EVALUATION ............................................................. 77
APPENDIX 8: CONSUMER AND PRODUCER PRICES PER KG ...................................................................... 81
APPENDIX 9: VOUCHER DISTRIBUTION TO THE REGIONS: ADMINISTRATIVE COSTS IN TZS ..................... 82
APPENDIX 10: TERMS OF REFERENCE OF THE DISTRICT AGRICULTURE AND LIVESTOCK DEVELOPMENT
OFFICER (DALDO) ........................................................................................................................................... 83
APPENDIX 11: TERMS OF REFERENCE OF THE VILLAGE AGRICULTURAL EXTENSION OFFICER (VAEO) ........ 84
DRAFT FOR DISCUSSION
4
LIST OF FIGURES
FIGURE 1.1: SHARE OF AGRICULTURE IN GDP AND GDP PER CAPITA IN TANZANIA .......................................................... 13
FIGURE 1.2: AGRICULTURE AND GDP GROWTH RATES IN TANZANIA ............................................................................ 13
FIGURE 1.3: PERCENTAGE OF FARMERS USING FERTILIZER IN TANZANIA BY DISTRICT ......................................................... 14
FIGURE 1.4: TRENDS IN CROP PRODUCTION ............................................................................................................. 17
FIGURE 1.5: TRENDS IN PRODUCTIVITY .................................................................................................................... 17
FIGURE 1.6: PADDY IRRIGATION SCHEMES IN TANZANIA ............................................................................................. 18
FIGURE 2.1: ANNUAL ACTIVITY IMPLEMENTATION TIMELINE OF THE PROGRAM .............................................................. 24
FIGURE 2.2: IMPLEMENTATION PROCEDURE ............................................................................................................. 25
FIGURE 2.3: NAIVS DIRECT COSTS BY PLANNED BUDGET AND ACTUAL EXPENDITURE IN USD ........................................... 27
DRAFT FOR DISCUSSION
5
LIST OF TABLES
TABLE 1.1: AGRICULTURE AND POVERTY IN TANZANIA, 2011 .................................................................................... 12
TABLE 2.1: INPUT PACKAGES FOR MAIZE AND RICE (FOR 0.5 HA) ................................................................................. 20
TABLE 2.2: NAIVS AREAS ................................................................................................................................... 21
TABLE 2.3: CHANGES MADE BETWEEN 2009/10 AND 2011/12 ................................................................................ 22
TABLE 2.4: NAIVS TOTAL PLANNED BUDGET AND ACTUAL EXPENDITURE IN USD ......................................................... 26
TABLE 2.5: INPUTS MARKET PRICES IN RUKWA REGION 2011/12 ............................................................................. 27
TABLE 2.6: DISTRIBUTION OF VOUCHERS BY SEASON ................................................................................................ 28
TABLE 2.7: DISTRIBUTION OF VOUCHERS BY REGION: 2010/11 ................................................................................. 29
TABLE 3.1: SUMMARY STATISTICS......................................................................................................................... 35
TABLE 3.2: INPUT USAGE AND YIELDS ACROSS REGIONS (ONLY BENEFICIARIES 1-3 YEARS) ............................................... 38
TABLE 3.3: IMPACT OF VOUCHER SCHEME ON YIELDS BY REGION (HOUSEHOLD-LEVEL DATA) USING THE LISTINGS SURVEY .... 41
TABLE 3.4: INPUT USAGE AND YIELDS AMONG 4TH YEAR PARTICIPANTS ....................................................................... 42
TABLE 3.5: BENEFIT-COST ANALYSIS (LISTINGS SURVEY) ........................................................................................... 46
TABLE 4.1: TARGETING RESULTS FROM LISTING SURVEY (2010/11 VOUCHER CYCLE) ..................................................... 48
TABLE 4.2: BENEFICIARIES USED INPUT IN YEARS BEFORE THE START OF NAIVS ............................................................. 49
TABLE 4.3: REASONS GIVEN FOR NOT USING INPUTS IN THE PAST ( % OF TOTAL RESPONDENTS) ........................................ 51
TABLE 4.4: AVERAGE YIELD GAIN OF FARMERS WITH AND WITHOUT VOUCHERS BY HIGHER AND LOWER RAINFALL DISTRICT ..... 53
TABLE 4.5: COMMON AUDIT CONCERNS ................................................................................................................ 55
TABLE 4.6: CASES OF POSSIBLE MISUSE OF NAIVS VOUCHERS UNDER INVESTIGATION FOR 2010/2011 ............................ 56
TABLE 4.7: NUMBER OF VOUCHERS RECEIVED AND USED BY RECIPIENT HOUSEHOLDS, 2010/11 SEASON ............................ 57
TABLE 4.8: PARTICIPATION OF AGRO-DEALERS IN NAIVS (2010/11 AND 2011/12) .................................................... 59
DRAFT FOR DISCUSSION
6
ACRONYMS
ACT Agricultural Council of Tanzania
AFSP Accelerated Food Security Project
AG Attorney General‟s Office
AGRA Alliance for a Green Revolution in Africa
AIS Agricultural Input Section
ASDP Agricultural Sector Development Program
BOT Bank of Tanzania
CNFA Citizens Network for Foreign Affairs
CAG Controller and Auditor General
CBO Community-Based Organization
CSOs Civil Society Organizations
DALDO District Agriculture and Livestock Officer
DAP Diammonium Phosphate
DVC District Voucher Committee
ESRF Economic and Social Research Foundation
GDP Gross Domestic Product
HAIS Head of Agricultural Input Section
LGA Local Government Authority
MAFC Ministry of Agriculture, Food Security and Cooperatives
MKUKUTA National Strategy for Growth and Reduction of Poverty
MoFEA Ministry of Finance and Economic Affairs
MRP Mmussoorie Rock Phosphate
NAIVS National Agricultural Input Voucher Scheme
NMB National Microfinance Bank
NVSC National Voucher Steering Committee
OPV Open Pollinated Variety
PADEP Participatory Agricultural Development and Empowerment Project
PCCB Prevention and Combating of Corruption Bureau
PIM Programme Implementation Manual
PMO-RALG Prime Minister Office-Regional Administrative and Local Government
RC Regional Commissioner
RVC Regional Voucher Committee
TAFSIP Tanzania Agriculture and Food Security Investment Plan
TASAF Tanzania Social Action Fund
URT United Republic of Tanzania
USAID United States Agency for International Development
VA Village Assembly
VEO Village Executive Officer
VG Village Government
VVC Village Voucher Committee
WDI World Development Indicator
WVC Ward Voucher Committee
DRAFT FOR DISCUSSION
7
ACKNOWLEDGEMENTS
The study team consists of staff members from the Tanzanian Ministry of Agriculture, Food
and Cooperatives (MAFC), University of Dar-es-Salaam, Tanzanian research institution
(REPOA), and the World Bank. In particular, the report was prepared jointly by David
Biswalo, Xavier Gine, Aparajita Goyal, Oswald Mashindano, Donald Mmari, David
Rohrbach, under the overall guidance of Stephen Mink; and has been possible, thanks
especially, to the continuous support provided by the Ministry of Agriculture, Food and
Cooperatives, Government of Tanzania.
Additional comments and suggestions were received from Sergiy Zorya, Madhur Gautam,
Jacques Morisset, Emmanuel Mungunasi, Isis Gaddis, Victoria Cunningham, and Michael
Morris. Faith Lucy Motambo and Volana Farantsa Andriamasinoro provided excellent
assistance in various aspects of administration of the project.
Financial support from Bill and Melinda Gates Foundation for the overall project on
Strengthening National Comprehensive Agricultural Public Expenditure in Sub-Saharan
Africa, 3ie International Initiative for Impact Evaluation, and the World Bank Accelerated
Food Security Project is gratefully acknowledged.
DRAFT FOR DISCUSSION
8
EXECUTIVE SUMMARY
The National Agricultural Input Voucher Scheme (NAIVS) is a market smart input subsidy
program aiming to increase the adoption of improved seed and fertilizer in smallholder maize
and rice systems in order to raise productivity and improve food security. Since 2008/09,
approximately TZS 480 billion has been invested in helping 2.5 million farmers (roughly 45
percent of all smallholders in the country) by distributing vouchers that subsidize half of the
price of a package of improved seed and fertilizer that farmers obtain with the vouchers from
private dealers at market prices. Each farm household is expected to receive three consecutive
years of assistance that would allow farmers to estimate the returns to investing in improved
seed and fertilizer under variable rainfall conditions, and build a stock of capital for
continuing purchases of these inputs once the subsidy is withdrawn. The three year coverage
also provides time for input retailers to strengthen their supply chains and understanding of
the rural market conditions. Hence, the immediate gain of the program is expected to be the
additional grain obtained through the productivity gains derived from using improved inputs,
while the medium term gain is expected to be the level of sustained productivity gain derived
from continuing adoption of improved seed and fertilizer after the subsidy ends.
Farming households that cultivate no more than 1 hectare (approximately 2.4 acres) of maize
or paddy and could afford the top-up payment for the input package are selected into the
NAIVS subsidy program. Priority is given to female-headed households and to households
that have not used any fertilizer and improved seeds for targeted crops over the last five
years. More broadly, NAIVS expected to introduce improved maize and rice seed varieties to
farmers who would not otherwise have applied these inputs, and introduced the use of
chemical fertilizer to households who would not otherwise have tried this input.
The aim of the NAIVS is to intensify food production in areas with high agro-ecological
potential for producing the two staple foods. These areas are concentrated in the Southern
Highlands, Northern Highlands, and Western regions with agro-ecological zones suitable for
the targeted crops, accounting for at least 70 percent of total maize production and 50 percent
of total paddy production in Tanzania. These three regions accounted for 82 percent of the
total number of household beneficiaries and 82.3 percent of the total value of voucher in
2010/11. Moreover, Tanzania‟s grain belt known as the “big six” regions covers the Southern
Highlands (Ruvuma, Iringa, Rukwa, Mbeya) as well as some of the Western (Kigoma) and
Central zones (Morogoro). In 2010/11 season, the “big six” regions had received 62.1
percent of total printed vouchers. When the program was designed, it was targeted to cover
65 districts in Tanzania‟s higher potential zones for maize and rice. However, there appears
to have been a political imperative to cover all regions and all farming districts in the country.
By 2011/12, the project provided support to farmers in over 130 of the country‟s 152
districts. The additional districts encompassed many relatively drier and more drought prone
areas of the country.
DRAFT FOR DISCUSSION
9
The average annual expenditure on NAIVS between 2009/10 and 2011/12 is USD 71 million
that includes three types of costs: direct costs, indirect costs and complementary investments,
with direct subsidy costs taking the largest share of the total annual expenditures on NAIVS
(96.5 percent on average annually). Indirect costs mainly consist of resources spent to
improve farmers‟ awareness and project management costs, while complementary
investments include the costs of strengthening agro-dealers‟ network, strengthening the
national seed system, and the project monitoring and evaluation; that together make up the
remaining share of the total expenditure on NAIVS. NAIVS started with 740,000 household
beneficiaries in 2008/09 and then expanded to 1,511,900 households in 2009/10 and
2,011,000 household receiving a total of six million vouchers in 2010/11. The number of
beneficiaries in 2011/12 season decreased a bit because the first-round (2008/09)
beneficiaries of NAIVS had graduated from the program. On average, the amount of NAIVS
expenditure on each household beneficiary was USD 51 in 2009/10, USD 33 in 2010/11 and
USD 41 in 2011/12.
To evaluate the impacts of NAVIS, two rounds of household surveys were conducted
between December 2010 and December 2012 focusing specifically on eight regions that
comprised of the “big six” as mentioned before (Iringa, Mbeya, Ruvuma, Rukwa, Morogoro,
Kigoma) and two additional regions in the North (Arusha and Kilimanjaro). Among these
eight regions, Morogoro, Arusha, and Kilimanjaro are distinct because they experience bi-
modal rainfall patterns, which result in a later start date for the main planting season as
compared to southern areas with uni-modal rainfall. The sample was also expanded in the
2012 follow up survey to include regions that experience lower rainfall (Tabora and Dodoma)
to estimate spatial heterogeneity in effects and implications of expanding the program to drier
regions of the country.
A total of 2,000 households comprising of both beneficiaries and non-beneficiaries were
interviewed in both baseline and follow-up surveys over time. The empirical analysis exploits
the roll-out plan of the program to generate comparable treatment and counterfactual groups
for estimating the program impacts. The treatment group is comprised of farming households
that receive the subsidy for the first time in the 2009/11 planting season and the comparison
group consists of eligible farming households in the same village that did not receive the
subsidy. By comparing eligible beneficiary and eligible non-beneficiary households within
the same village, we find that for 2010/11 season the usage of improved inputs significantly
increased average maize yields. In contrast, the impacts for paddy are smaller and much less
significant. This may partly reflect the fact that the rice farmers being targeted were all
expected to be on irrigation schemes. Therefore they had higher yields to begin with. Some
rice farmers perhaps also have had access to improved rice seed and fertilizer through
alternative development programs. The analysis also suggests that the average yield gains
achieved in these drier regions were lower than the gains achieved in areas of more reliable
rainfall.
DRAFT FOR DISCUSSION
10
Overall, the program appears to be cost effective for maize in most of the surveyed regions at
the current level of subsidy but not so for paddy. The survey data also indicates that a
significant proportion of the voucher graduates who had not used improved inputs prior to the
program are continuing to purchase improved seed an fertilizers. This suggests that farmers
widely valued the improved access to the modern varieties of maize and rice and will
continue to grow these varieties into the future, indicating a sustained payoff of the program
that would extend well beyond the period of the subsidy program if the behavior persists.
This coincides with evidence received from both fertilizer and seed companies that their
commercial sales were increasing in the aftermath of the subsidy program. Several of these
companies are investing more in developing wholesale to retail marketing chains, and in the
provision of private technical advice to encourage smallholders to continue to purchase their
products.
It should be noted that the analysis reflects the most immediate returns to the investment, and
underestimates the longer term gains derived from training farmers about the value of
improved seed and fertilizer, and developing retail input supply chains extending closer to the
farmgate. A number of farmers interviewed suggested that they were seeing some improved
varieties of maize or paddy for the first time. Insofar as they continue to use improved
varieties, the productivity gains will be sustained. The increase in seed and fertilizer adoption
rates among subsidy graduates, particularly those who had not previously purchased these
inputs, also raises the level of investment gains.
Despite the success of the NAIVS program in terms of increase in adoption rates for
improved seed and fertilizer, yield and food security, there are still some concerns that need
to be addressed. First, there has been substantial public attention to the misuse of vouchers
The impact survey data reveal that many farmers only received 1 or 2 vouchers instead of the
mandated three. Data from the National Microfinance Bank, which has been responsible for
the payment of all vouchers, suggests that in 2010/11, approximately 92 percent of all
vouchers were redeemed and paid out suggesting a need to tighten voucher tracking and
security to reduce fraudulent redemption. Perhaps deploying electronic vouchers that are
transferred to farmers‟ cell phones and then transferred to licensed agro-dealers upon
purchase of inputs could be one way to address such distortions.
Second, farmers commonly complained about the late delivery of vouchers, as well as the late
delivery of inputs once the vouchers were in hand. The period of delay varied considerably
depending on the district and local practice. For example, in 2010/11, the subsidy vouchers
were printed late, arrived in early December, but then remained in the port of Dar es Salaam
until mid-January because of a tax dispute. Many farmers only received their vouchers in late
January and early February – long after the planting season. The yield gains derived from the
use of improved seed and chemical fertilizer depend heavily on the timeliness of application
of these inputs. In general, the later the crop is planted, relative to the start of the rainy
season, the lower the yield. The actual level of loss depends on the choice of seed variety, the
consistency or rains and the length of the season. Basal fertilizer should commonly be
DRAFT FOR DISCUSSION
11
applied at or just prior to planting. Perhaps, if the voucher and input delivery had been
achieved on a timelier basis, these yield gains would likely have been higher.
Third, the failure to withdraw the subsidy from participating farmers after three years led to
some households receiving a subsidy for four or even five years. Finally, withdrawal of the
services of agro-dealers would undermine the levels of continuing commercial purchases of
improved inputs. Many of the agro-dealers providing inputs under the program withdrew
from village markets when the demand for their inputs was no longer guaranteed by the
vouchers. While the agro-dealers were required to set up shops in the villages in order to
participate, many of these shops were seasonal and rented on a short term basis. This is
sensible because grain seed and chemical fertilizer sales are highly seasonal. If farmers have
to travel to a distant town to look for seed or fertilizer with uncertainty about prices and
availability, commercial sales will decline. Another factor undermining the continuing
purchase of these improved inputs is their high cost. The fact remains that seed and chemical
fertilizer remain expensive commodities at the farmgate. Many farmers face difficulty finding
the capital to make this investment during the start of the growing season. Thus, whether the
adoption of improved seed and fertilizer will be sustained as the subsidy is withdrawn is of
greater concern.
Different from the inputs subsidy program like NAIVS, the investment programs proposed in
the Big Results Now laboratories primarily target the objective of making maize and rice
production more profitable. The maize program principally targets the improvement of
production returns by helping farmers make use of warehouse based crop storage systems
that facilitate the exploitation of price seasonality and the opportunities for achieving better
farmgate prices through bulk sales. These warehouse operations can also be used to facilitate
the bulk purchase of crop inputs. The Big Results Now proposal for paddy seeks a
combination of improvements in production and market productivity through the pursuit of
better crop management through block farming as well as a similar warehousing arrangement
as that proposed for maize. This could help resolve the question raised by the NAIVS impact
assessment of how the agronomic performance derived from the improved inputs can be
sustained and further improved. Moreover, there are similarly multiple ways to help farmers
resolve the cash flow constraint in the face of limited credit markets and high borrowing
costs.
The rest of the report is comprised of six chapters in addition to this executive summary.
Chapter 1 reviews the developments of the economy and the agricultural sector, especially
the crop production and productivity. Chapter 2 provides a comprehensive overview on the
NAIVS program, including budget, expenditure and implementation. Chapter 3 presents the
general economic model used in the paper and discusses and analyzes the empirical results.
Chapter 4 discusses the challenges and problems faced during the implementation of NAIVS
program. The final chapter describes policy implication of the NAIVS program and
concludes the report.
DRAFT FOR DISCUSSION
12
1.0 INTRODUCTION
1.1 Economic and Policy Context
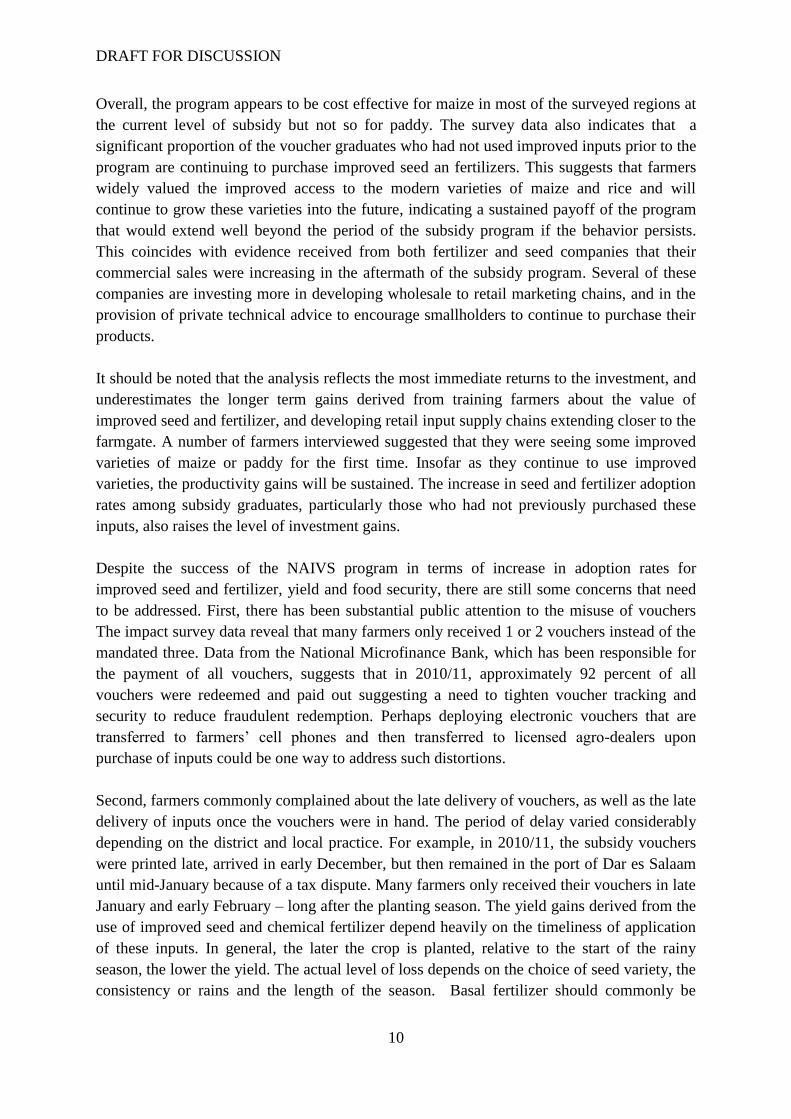
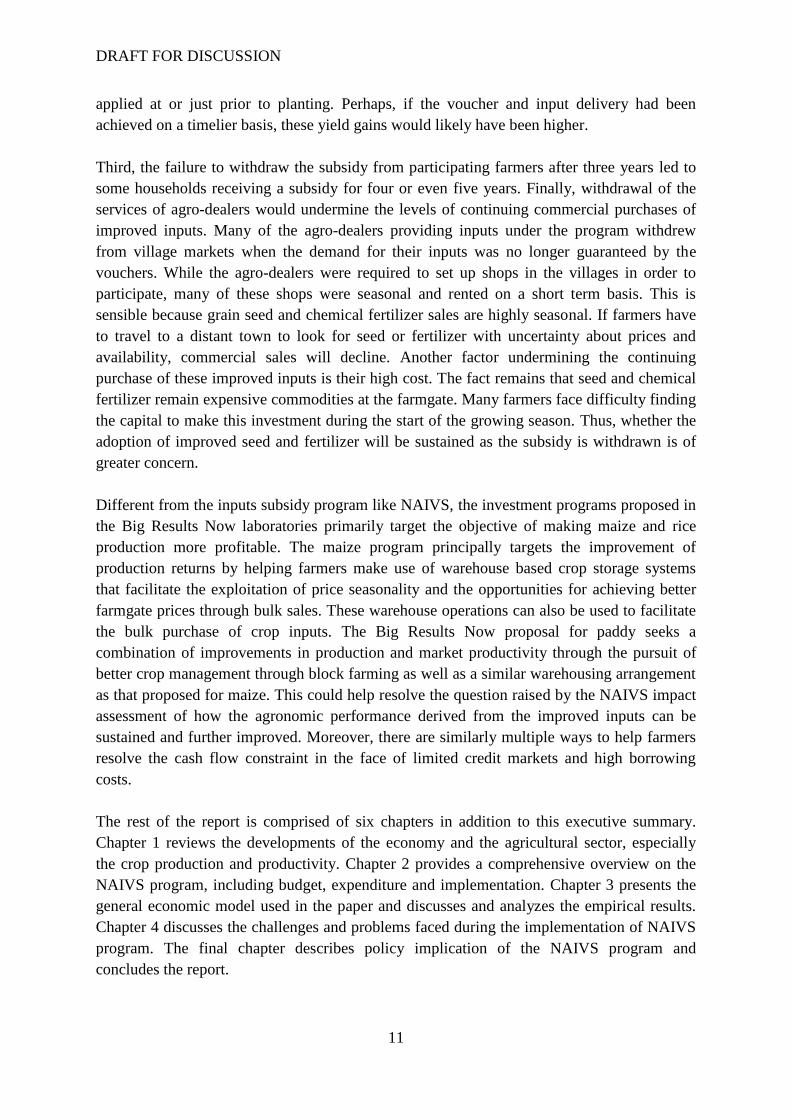
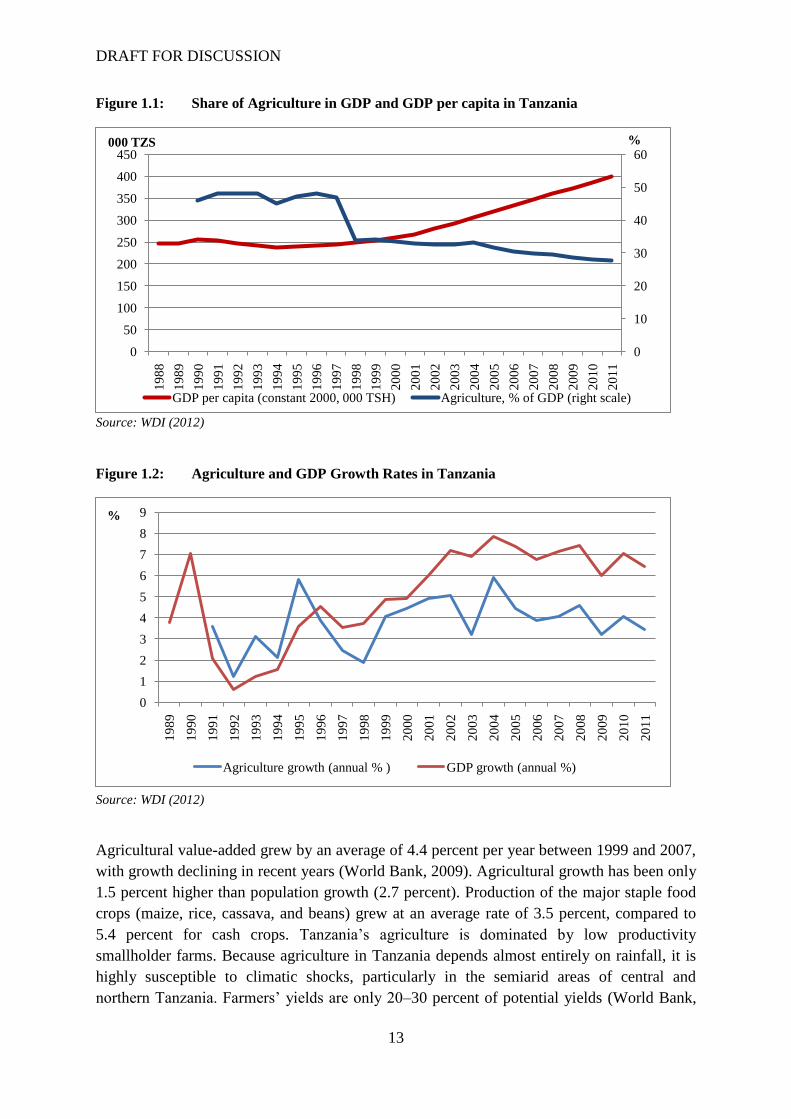
The United Republic of Tanzania is largely an agriculture-based economy, accounting for
more than a quarter of GDP (Figure 1.1) and remains an important contributor to economic
growth (Figure 1.2). More than 73 percent of the population is rural and about two-thirds of
the employed population works in the agricultural sector making this sector extremely
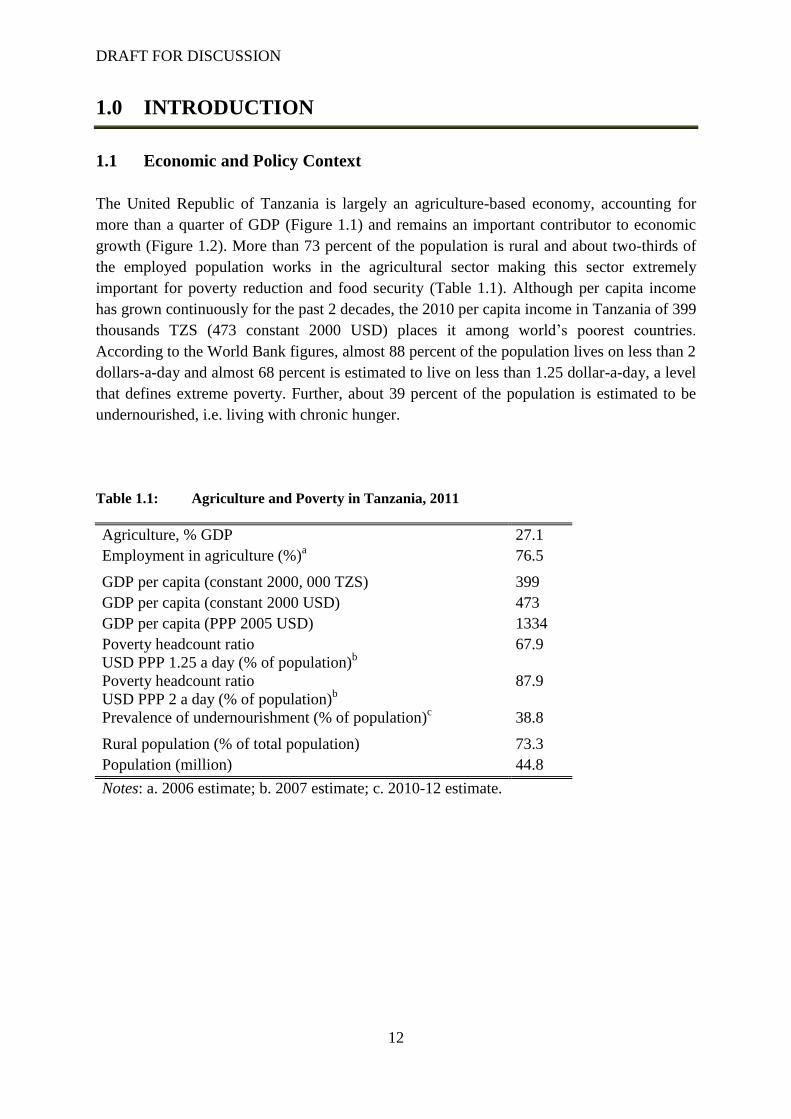
important for poverty reduction and food security (Table 1.1). Although per capita income
has grown continuously for the past 2 decades, the 2010 per capita income in Tanzania of 399
thousands TZS (473 constant 2000 USD) places it among world‟s poorest countries.
According to the World Bank figures, almost 88 percent of the population lives on less than 2
dollars-a-day and almost 68 percent is estimated to live on less than 1.25 dollar-a-day, a level
that defines extreme poverty. Further, about 39 percent of the population is estimated to be
undernourished, i.e. living with chronic hunger.
Table 1.1: Agriculture and Poverty in Tanzania, 2011
Agriculture, % GDP 27.1
Employment in agriculture (%)a 76.5
GDP per capita (constant 2000, 000 TZS) 399
GDP per capita (constant 2000 USD) 473
GDP per capita (PPP 2005 USD) 1334
Poverty headcount ratio
USD PPP 1.25 a day (% of population)b
67.9
Poverty headcount ratio
USD PPP 2 a day (% of population)b
87.9
Prevalence of undernourishment (% of population)c 38.8
Rural population (% of total population) 73.3
Population (million) 44.8
Notes: a. 2006 estimate; b. 2007 estimate; c. 2010-12 estimate.
DRAFT FOR DISCUSSION
13
Figure 1.1: Share of Agriculture in GDP and GDP per capita in Tanzania
Source: WDI (2012)
Figure 1.2: Agriculture and GDP Growth Rates in Tanzania
Source: WDI (2012)
Agricultural value-added grew by an average of 4.4 percent per year between 1999 and 2007,
with growth declining in recent years (World Bank, 2009). Agricultural growth has been only
1.5 percent higher than population growth (2.7 percent). Production of the major staple food
crops (maize, rice, cassava, and beans) grew at an average rate of 3.5 percent, compared to
5.4 percent for cash crops. Tanzania‟s agriculture is dominated by low productivity
smallholder farms. Because agriculture in Tanzania depends almost entirely on rainfall, it is
highly susceptible to climatic shocks, particularly in the semiarid areas of central and
northern Tanzania. Farmers‟ yields are only 20–30 percent of potential yields (World Bank,
0
10
20
30
40
50
60
0
50
100
150
200
250
300
350
400
4501
98
8
19
89
19
90
19
91
19
92
19
93
19
94
19
95
19
96
19
97
19
98
19
99
20
00
20
01
20
02
20
03
20
04
20
05
20
06
20
07
20
08
20
09
20
10
20
11
%000 TZS
GDP per capita (constant 2000, 000 TSH) Agriculture, % of GDP (right scale)
0
1
2
3
4
5
6
7
8
9
19
89
19
90
19
91
19
92
19
93
19
94
19
95
19
96
19
97
19
98
19
99
20
00
20
01
20
02
20
03
20
04
20
05
20
06
20
07
20
08
20
09
20
10
20
11
%
Agriculture growth (annual % ) GDP growth (annual %)
DRAFT FOR DISCUSSION
14
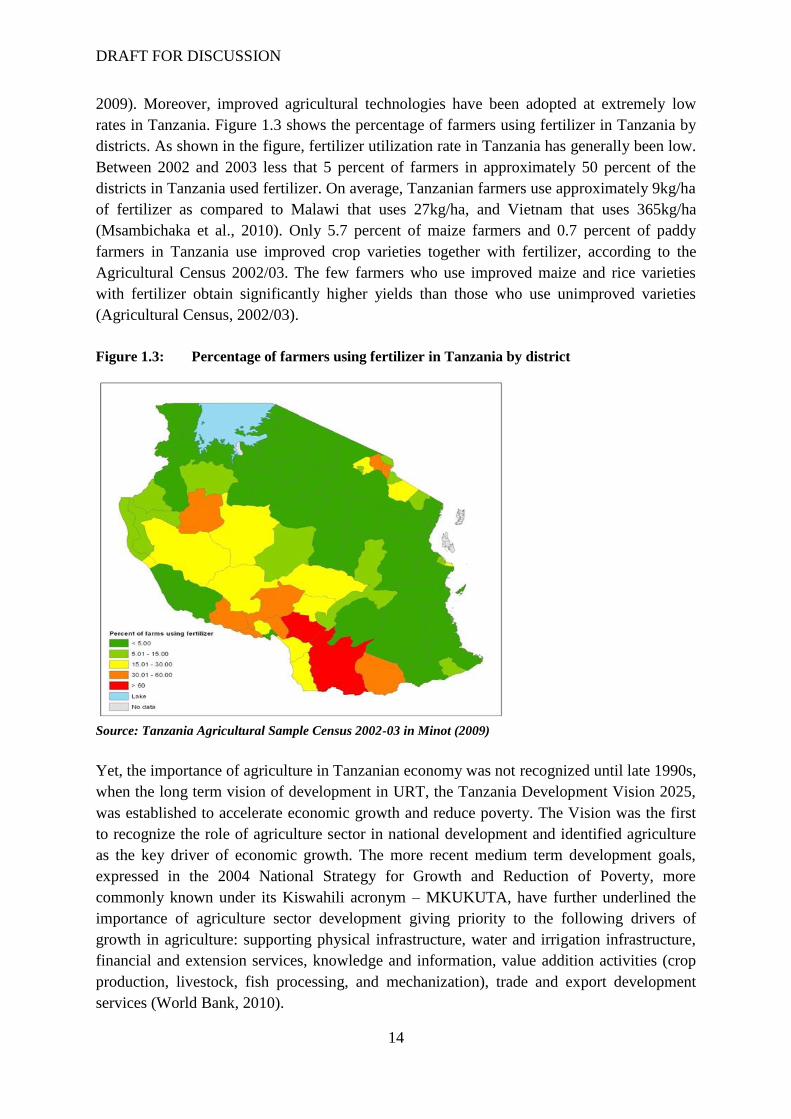
2009). Moreover, improved agricultural technologies have been adopted at extremely low
rates in Tanzania. Figure 1.3 shows the percentage of farmers using fertilizer in Tanzania by
districts. As shown in the figure, fertilizer utilization rate in Tanzania has generally been low.
Between 2002 and 2003 less that 5 percent of farmers in approximately 50 percent of the
districts in Tanzania used fertilizer. On average, Tanzanian farmers use approximately 9kg/ha
of fertilizer as compared to Malawi that uses 27kg/ha, and Vietnam that uses 365kg/ha
(Msambichaka et al., 2010). Only 5.7 percent of maize farmers and 0.7 percent of paddy
farmers in Tanzania use improved crop varieties together with fertilizer, according to the
Agricultural Census 2002/03. The few farmers who use improved maize and rice varieties
with fertilizer obtain significantly higher yields than those who use unimproved varieties
(Agricultural Census, 2002/03).
Figure 1.3: Percentage of farmers using fertilizer in Tanzania by district
Source: Tanzania Agricultural Sample Census 2002-03 in Minot (2009)
Yet, the importance of agriculture in Tanzanian economy was not recognized until late 1990s,
when the long term vision of development in URT, the Tanzania Development Vision 2025,
was established to accelerate economic growth and reduce poverty. The Vision was the first
to recognize the role of agriculture sector in national development and identified agriculture
as the key driver of economic growth. The more recent medium term development goals,
expressed in the 2004 National Strategy for Growth and Reduction of Poverty, more
commonly known under its Kiswahili acronym – MKUKUTA, have further underlined the
importance of agriculture sector development giving priority to the following drivers of
growth in agriculture: supporting physical infrastructure, water and irrigation infrastructure,
financial and extension services, knowledge and information, value addition activities (crop
production, livestock, fish processing, and mechanization), trade and export development
services (World Bank, 2010).
DRAFT FOR DISCUSSION
15
To address these priority areas, the Agricultural Sector Development Strategy (ASDS) was
developed and adopted in 2005. The ASDS provides specific goals, operational targets and
priority action plans aiming at achieving the broad policy objectives. The ASDS main
strategic objectives include: creating an enabling environment for improved productivity and
profitability in the agricultural sector; increasing farm incomes to reduce income poverty and
ensure household food security by enabling farmers to have better access to and use of
agricultural knowledge, technologies, marketing systems and infrastructure; and promoting
private investments based on improved regulatory and policy environment (ASDS, cited from
ESRF 2010).
The strategies described above were translated into more than 170 individual projects and
programs that shaped public expenditures in support of food and agriculture sector
development in URT. The total approved budget1 in the agriculture sector grew by 53
percent, in nominal terms, from 2006/07 to 2010/11 reaching 944.5 billion TZS (Table 1.2).
The peak of budget allocations occurred in the 2009/2010 financial year with the 1198.9
billion TZS allocated in support of agriculture. The total actual spending has grown at a
slower pace: it increased by 30 percent from 2006/07 to 2010/11 reaching 728 billion TZS,
although the highest actual spending value falls in the 2007/08 financial year with 878.4
billion TZS spent in support of agriculture.
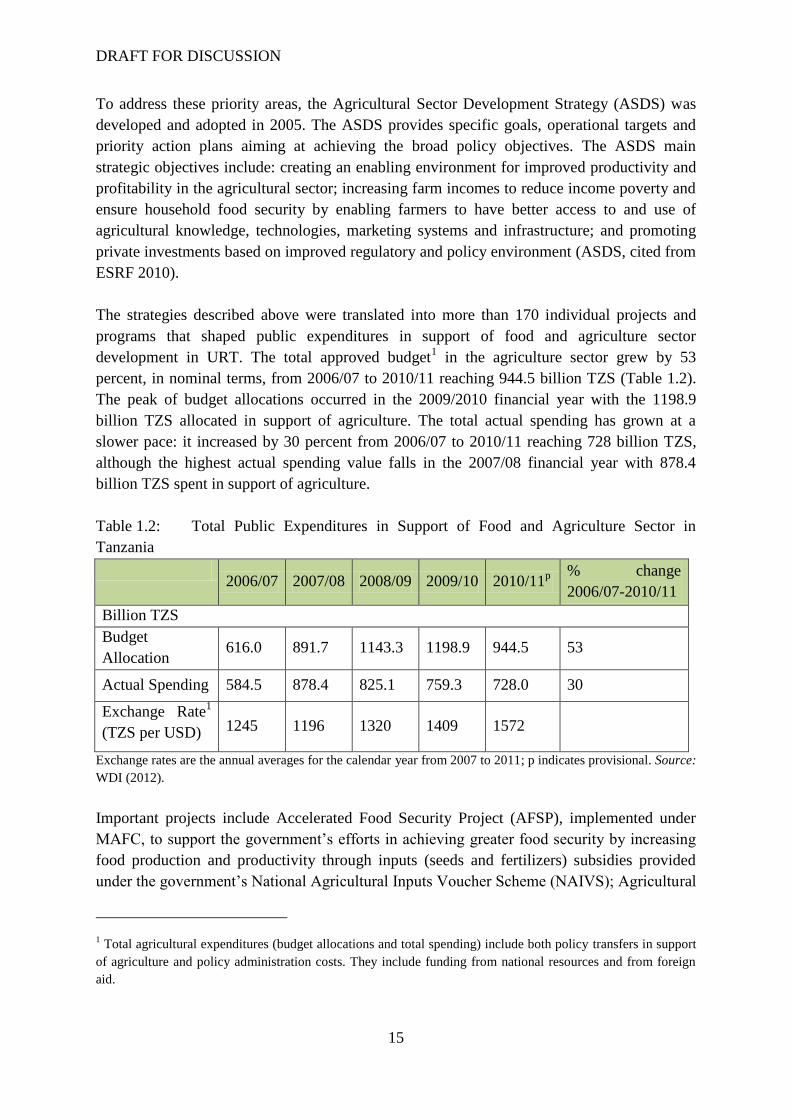
Table 1.2: Total Public Expenditures in Support of Food and Agriculture Sector in
Tanzania
2006/07 2007/08 2008/09 2009/10 2010/11
p
% change
2006/07-2010/11
Billion TZS
Budget
Allocation 616.0 891.7 1143.3 1198.9 944.5 53
Actual Spending 584.5 878.4 825.1 759.3 728.0 30
Exchange Rate1
(TZS per USD) 1245 1196 1320 1409 1572
Exchange rates are the annual averages for the calendar year from 2007 to 2011; p indicates provisional. Source:
WDI (2012).
Important projects include Accelerated Food Security Project (AFSP), implemented under
MAFC, to support the government‟s efforts in achieving greater food security by increasing
food production and productivity through inputs (seeds and fertilizers) subsidies provided
under the government‟s National Agricultural Inputs Voucher Scheme (NAIVS); Agricultural
1 Total agricultural expenditures (budget allocations and total spending) include both policy transfers in support
of agriculture and policy administration costs. They include funding from national resources and from foreign
aid.
DRAFT FOR DISCUSSION
16
Sector Development Program (ASDP), Participatory Agricultural Development and
Empowerment Project (PADEP), also implemented by the MAFC, that supports grants to
communities and farmer groups for investment in agricultural development subprojects and
focusing primarily on improving soil fertility and land management; the Tanzania Social
Action Fund (TASAF) of the President‟s Office that supports implementing food security,
education, roads, water, health, training and environment related projects.
1.2 Trends in Crop Production and Productivity
Maize is considered the most important food crop in Tanzania covering 45 percent of total
arable land and generating close to 50 percent of rural cash income, an average of 100 USD
per maize producing household in 2008 (USAID, 2010). On the basis of Ministry of
Agriculture, Food Security and Cooperatives (MAFC) reports, more than 20 regions in
Tanzania are producing maize annually, mainly of white type. The southern regions of Iringa,
Rukwa, Ruvuma, and Mbeya account for more than 35 percent of the total annual maize
production. The southern highlands produce surplus maize compared to consumption levels,
while there are deficits in the northern highlands, Dar es Salaam, and central regions.
Rice is the third most important food and cash crop after maize; and it‟s among the major
sources of employment, and income for many farming households. According to the
Agricultural census of 2004, 17 percent of all agricultural households grow rice. Rice
production in Tanzania covers approximately 681,000 ha, representing 18 percent of
cultivated land. Almost all rice (99 percent) is grown by smallholder farmers using traditional
seed varieties. Nearly half of the country‟s rice production is concentrated in the regions of
Morogoro, Shinyanga, Tabora, Mwanza and Mbeya. The first four rice producing regions are
located in the northern part of the country and the fifth is located in the south.
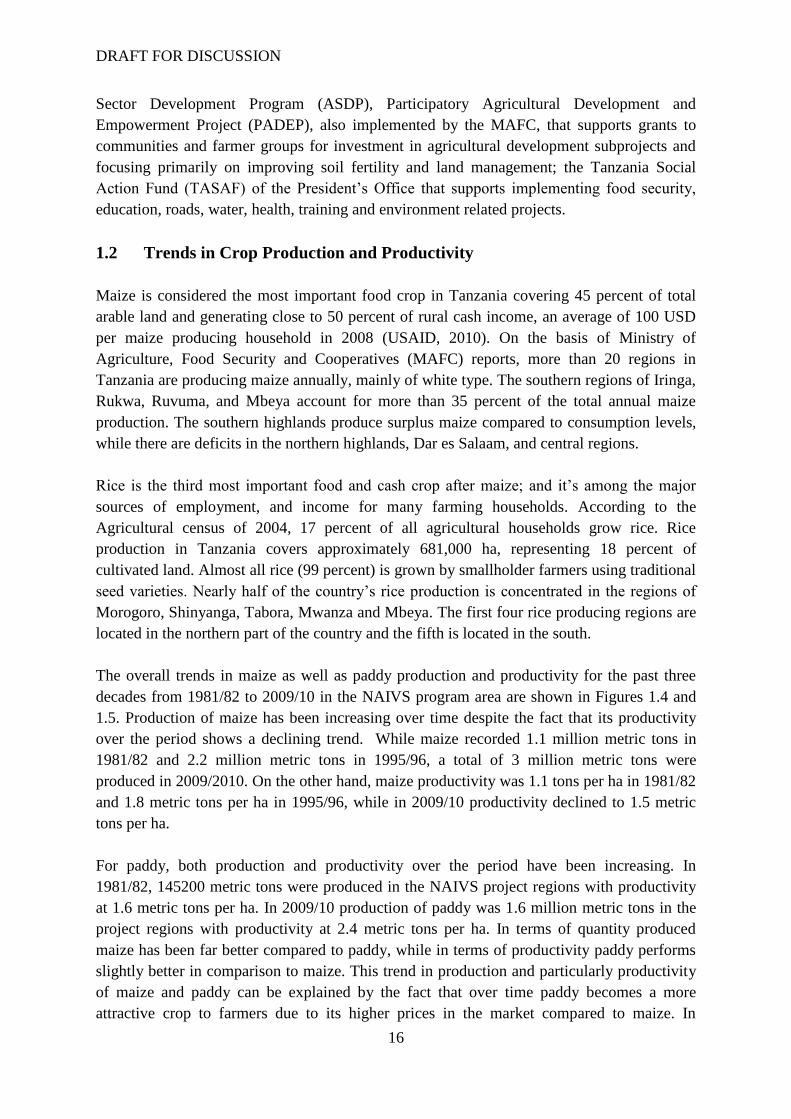
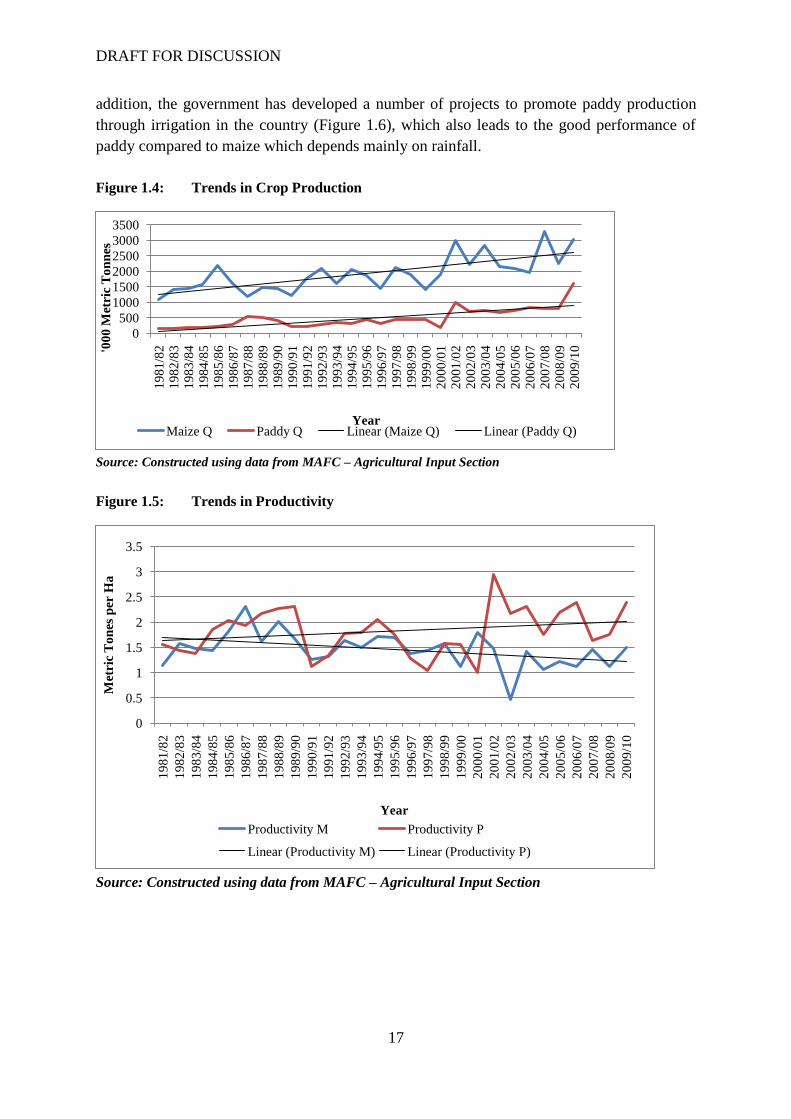
The overall trends in maize as well as paddy production and productivity for the past three
decades from 1981/82 to 2009/10 in the NAIVS program area are shown in Figures 1.4 and
1.5. Production of maize has been increasing over time despite the fact that its productivity
over the period shows a declining trend. While maize recorded 1.1 million metric tons in
1981/82 and 2.2 million metric tons in 1995/96, a total of 3 million metric tons were
produced in 2009/2010. On the other hand, maize productivity was 1.1 tons per ha in 1981/82
and 1.8 metric tons per ha in 1995/96, while in 2009/10 productivity declined to 1.5 metric
tons per ha.
For paddy, both production and productivity over the period have been increasing. In
1981/82, 145200 metric tons were produced in the NAIVS project regions with productivity
at 1.6 metric tons per ha. In 2009/10 production of paddy was 1.6 million metric tons in the
project regions with productivity at 2.4 metric tons per ha. In terms of quantity produced
maize has been far better compared to paddy, while in terms of productivity paddy performs
slightly better in comparison to maize. This trend in production and particularly productivity
of maize and paddy can be explained by the fact that over time paddy becomes a more
attractive crop to farmers due to its higher prices in the market compared to maize. In
DRAFT FOR DISCUSSION
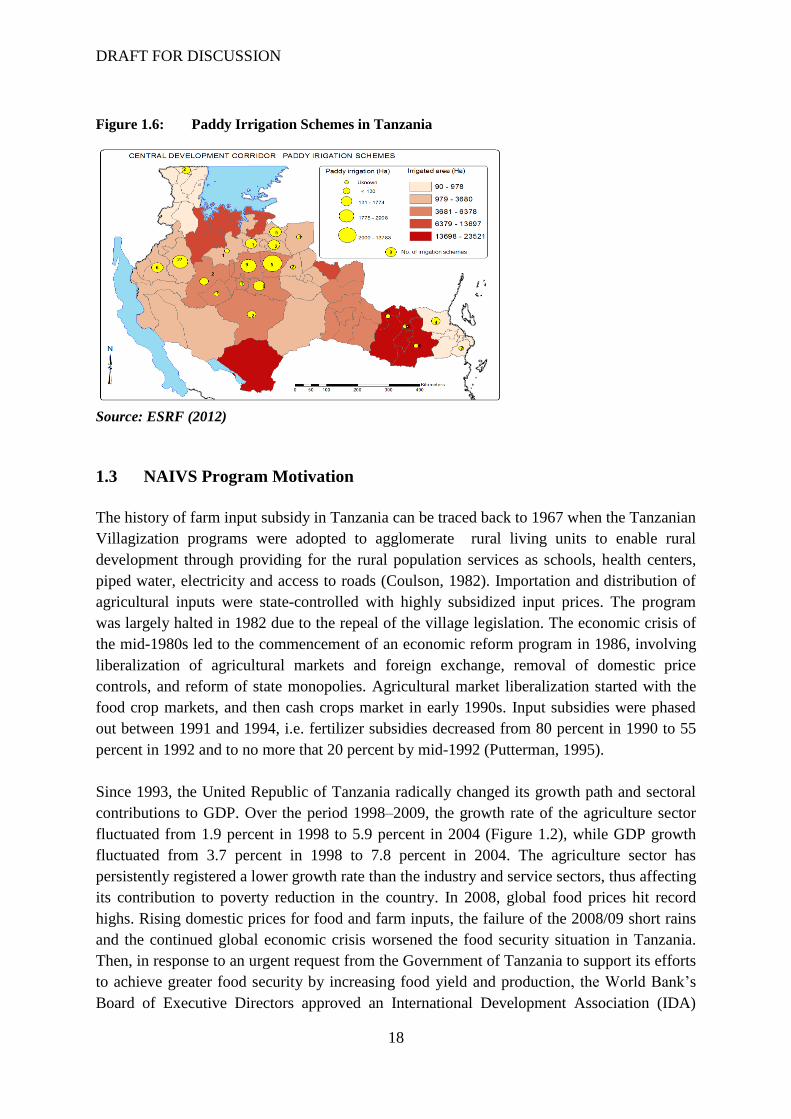
17
addition, the government has developed a number of projects to promote paddy production
through irrigation in the country (Figure 1.6), which also leads to the good performance of
paddy compared to maize which depends mainly on rainfall.
Figure 1.4: Trends in Crop Production
Source: Constructed using data from MAFC – Agricultural Input Section
Figure 1.5: Trends in Productivity
Source: Constructed using data from MAFC – Agricultural Input Section
0
500
1000
1500
2000
2500
3000
3500
19
81
/82
19
82
/83
19
83
/84
19
84
/85
19
85
/86
19
86
/87
19
87
/88
19
88
/89
19
89
/90
19
90
/91
19
91
/92
19
92
/93
19
93
/94
19
94
/95
19
95
/96
19
96
/97
19
97
/98
19
98
/99
19
99
/00
20
00
/01
20
01
/02
20
02
/03
20
03
/04
20
04
/05
20
05
/06
20
06
/07
20
07
/08
20
08
/09
20
09
/10'0
00
Met
ric
To
nn
es
YearMaize Q Paddy Q Linear (Maize Q) Linear (Paddy Q)
0
0.5
1
1.5
2
2.5
3
3.5
19
81
/82
19
82
/83
19
83
/84
19
84
/85
19
85
/86
19
86
/87
19
87
/88
19
88
/89
19
89
/90
19
90
/91
19
91
/92
19
92
/93
19
93
/94
19
94
/95
19
95
/96
19
96
/97
19
97
/98
19
98
/99
19
99
/00
20
00
/01
20
01
/02
20
02
/03
20
03
/04
20
04
/05
20
05
/06
20
06
/07
20
07
/08
20
08
/09
20
09
/10
Met
ric
To
nes
per
Ha
Year
Productivity M Productivity P
Linear (Productivity M) Linear (Productivity P)
DRAFT FOR DISCUSSION
18
Figure 1.6: Paddy Irrigation Schemes in Tanzania
Source: ESRF (2012)
1.3 NAIVS Program Motivation
The history of farm input subsidy in Tanzania can be traced back to 1967 when the Tanzanian
Villagization programs were adopted to agglomerate rural living units to enable rural
development through providing for the rural population services as schools, health centers,
piped water, electricity and access to roads (Coulson, 1982). Importation and distribution of
agricultural inputs were state-controlled with highly subsidized input prices. The program
was largely halted in 1982 due to the repeal of the village legislation. The economic crisis of
the mid-1980s led to the commencement of an economic reform program in 1986, involving
liberalization of agricultural markets and foreign exchange, removal of domestic price
controls, and reform of state monopolies. Agricultural market liberalization started with the
food crop markets, and then cash crops market in early 1990s. Input subsidies were phased
out between 1991 and 1994, i.e. fertilizer subsidies decreased from 80 percent in 1990 to 55
percent in 1992 and to no more that 20 percent by mid-1992 (Putterman, 1995).
Since 1993, the United Republic of Tanzania radically changed its growth path and sectoral
contributions to GDP. Over the period 1998–2009, the growth rate of the agriculture sector
fluctuated from 1.9 percent in 1998 to 5.9 percent in 2004 (Figure 1.2), while GDP growth
fluctuated from 3.7 percent in 1998 to 7.8 percent in 2004. The agriculture sector has
persistently registered a lower growth rate than the industry and service sectors, thus affecting
its contribution to poverty reduction in the country. In 2008, global food prices hit record
highs. Rising domestic prices for food and farm inputs, the failure of the 2008/09 short rains
and the continued global economic crisis worsened the food security situation in Tanzania.
Then, in response to an urgent request from the Government of Tanzania to support its efforts
to achieve greater food security by increasing food yield and production, the World Bank‟s
Board of Executive Directors approved an International Development Association (IDA)
DRAFT FOR DISCUSSION
19
credit of US$220 million to support implementation of Tanzania‟s Accelerated Food Security
Program (AFSP) in 2009. To stimulate a rapid supply response to deal with high food prices,
The National Agricultural Input Voucher Scheme (NAIVS) was adopted to intensify food
production by giving farmers better access to inputs. A detailed description of the NAIVS
program is presented in Chapter 2.
DRAFT FOR DISCUSSION
20
2.0 NAIVS IMPLEMENTATION AND COSTS
2.1 Overview of NAIVS
In response to the food and fertilizer price increases in 2008, the government launched the
Accelerated Food Security Program (AFSP), which aims to boost food production and
productivity in targeted areas, as the URT‟s agricultural input intensity is among the lowest in
the region. A pilot input subsidy program was launched in 2008, and was expanded into the
National Agricultural Input Voucher Scheme (NAIVS) in 2009. The NAIVS initiative uses
vouchers to transfer resources directly to farmers, increasing their purchasing power,
stimulating the development of input supply chains, and fostering competition among input
suppliers and agro-dealers (World Bank, 2009).
The main objective of the program is to improve farmers‟ access to critical agricultural inputs
(fertilizer and improved seeds) for maize and rice production, and it has been implemented by
the Ministry of Agriculture, Food Security and Cooperatives (MAFC) to provide input
vouchers to a total of 2.5 million maize and rice farmers until now. The vouchers that NAIVS
provides to maize and rice farmers subsidize half of the price of a package of improved seed
and fertilizer (the package provides enough of these inputs for one acre of maize or rice) they
obtain with the vouchers from private dealers at market prices. The face value of vouchers
has been adjusted annually due to the increasing inputs price.
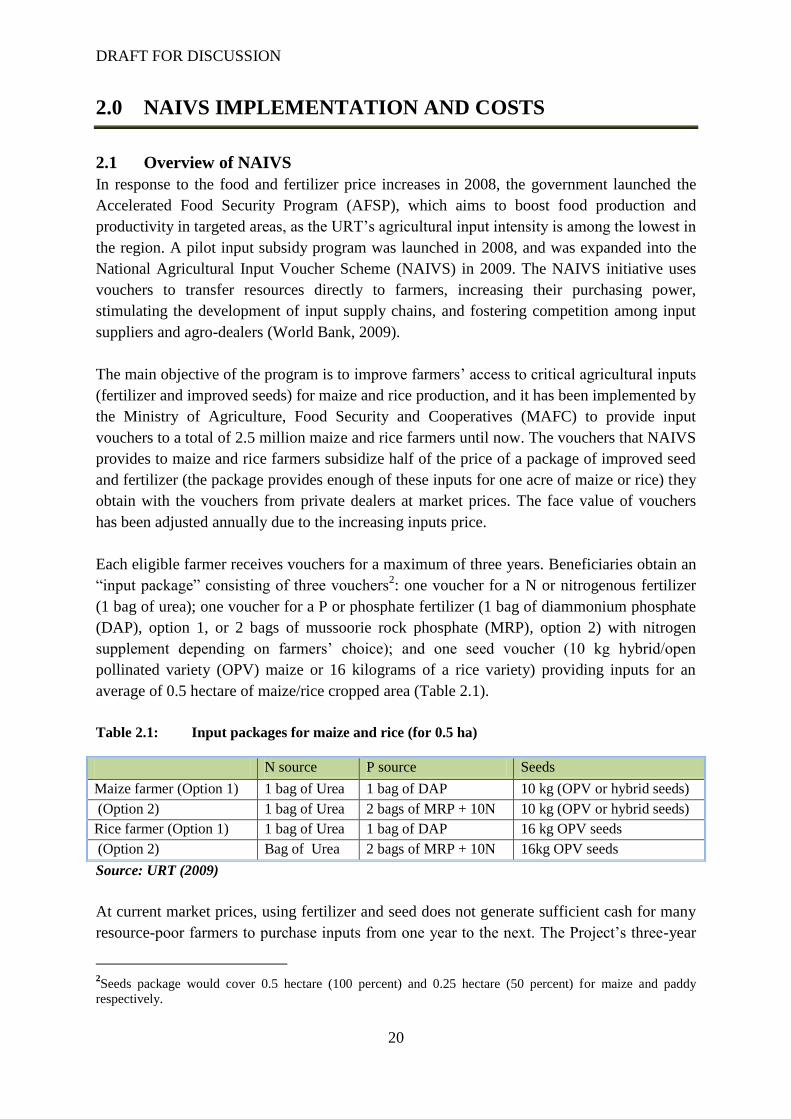
Each eligible farmer receives vouchers for a maximum of three years. Beneficiaries obtain an
“input package” consisting of three vouchers2: one voucher for a N or nitrogenous fertilizer
(1 bag of urea); one voucher for a P or phosphate fertilizer (1 bag of diammonium phosphate
(DAP), option 1, or 2 bags of mussoorie rock phosphate (MRP), option 2) with nitrogen
supplement depending on farmers‟ choice); and one seed voucher (10 kg hybrid/open
pollinated variety (OPV) maize or 16 kilograms of a rice variety) providing inputs for an
average of 0.5 hectare of maize/rice cropped area (Table 2.1).
Table 2.1: Input packages for maize and rice (for 0.5 ha)
N source P source Seeds
Maize farmer (Option 1) 1 bag of Urea 1 bag of DAP 10 kg (OPV or hybrid seeds)
(Option 2) 1 bag of Urea 2 bags of MRP + 10N 10 kg (OPV or hybrid seeds)
Rice farmer (Option 1) 1 bag of Urea 1 bag of DAP 16 kg OPV seeds
(Option 2) Bag of Urea 2 bags of MRP + 10N 16kg OPV seeds
Source: URT (2009)
At current market prices, using fertilizer and seed does not generate sufficient cash for many
resource-poor farmers to purchase inputs from one year to the next. The Project‟s three-year
2Seeds package would cover 0.5 hectare (100 percent) and 0.25 hectare (50 percent) for maize and paddy
respectively.
DRAFT FOR DISCUSSION
21
support for seed and fertilizer purchases should allow farmers to earn enough to continue
purchasing inputs at market prices to sustain their gains in production and productivity.
Moreover, NAIVS also includes critical complementary activities, such as a public awareness
campaign, support to private agro-dealers to improve their capacity to deliver inputs, support
to strengthen the national seed systems, the development and dissemination of integrated soil
fertility management practices (including conservation farming), and rigorous monitoring and
evaluation3 to strengthen the overall effectiveness of the program.
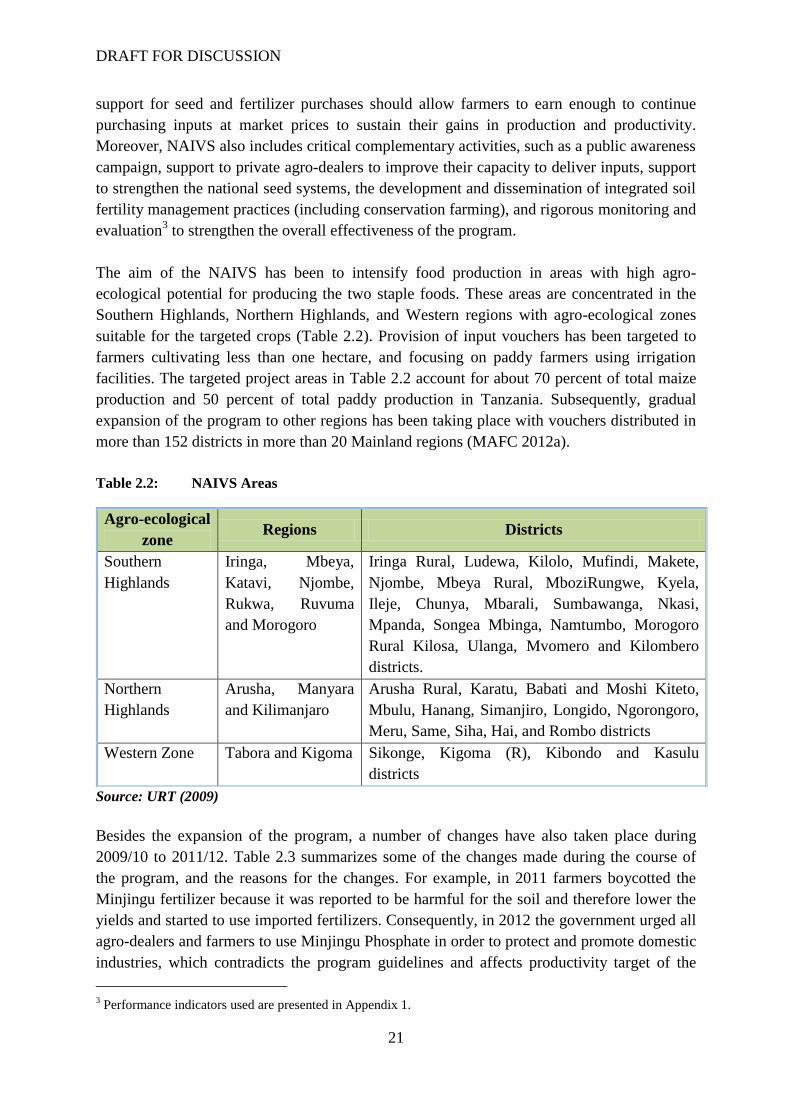
The aim of the NAIVS has been to intensify food production in areas with high agro-
ecological potential for producing the two staple foods. These areas are concentrated in the
Southern Highlands, Northern Highlands, and Western regions with agro-ecological zones
suitable for the targeted crops (Table 2.2). Provision of input vouchers has been targeted to
farmers cultivating less than one hectare, and focusing on paddy farmers using irrigation
facilities. The targeted project areas in Table 2.2 account for about 70 percent of total maize
production and 50 percent of total paddy production in Tanzania. Subsequently, gradual
expansion of the program to other regions has been taking place with vouchers distributed in
more than 152 districts in more than 20 Mainland regions (MAFC 2012a).
Table 2.2: NAIVS Areas
Source: URT (2009)
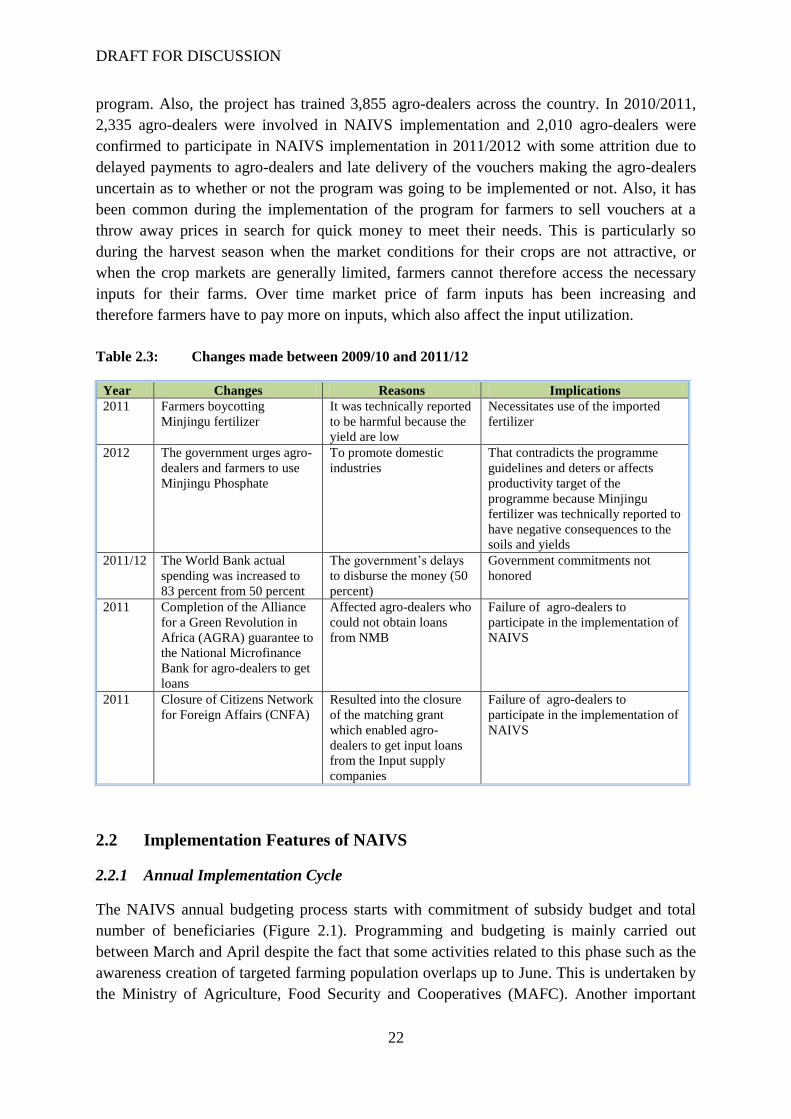
Besides the expansion of the program, a number of changes have also taken place during
2009/10 to 2011/12. Table 2.3 summarizes some of the changes made during the course of
the program, and the reasons for the changes. For example, in 2011 farmers boycotted the
Minjingu fertilizer because it was reported to be harmful for the soil and therefore lower the
yields and started to use imported fertilizers. Consequently, in 2012 the government urged all
agro-dealers and farmers to use Minjingu Phosphate in order to protect and promote domestic
industries, which contradicts the program guidelines and affects productivity target of the
3 Performance indicators used are presented in Appendix 1.
Agro-ecological
zone Regions Districts
Southern
Highlands
Iringa, Mbeya,
Katavi, Njombe,
Rukwa, Ruvuma
and Morogoro
Iringa Rural, Ludewa, Kilolo, Mufindi, Makete,
Njombe, Mbeya Rural, MboziRungwe, Kyela,
Ileje, Chunya, Mbarali, Sumbawanga, Nkasi,
Mpanda, Songea Mbinga, Namtumbo, Morogoro
Rural Kilosa, Ulanga, Mvomero and Kilombero
districts.
Northern
Highlands
Arusha, Manyara
and Kilimanjaro
Arusha Rural, Karatu, Babati and Moshi Kiteto,
Mbulu, Hanang, Simanjiro, Longido, Ngorongoro,
Meru, Same, Siha, Hai, and Rombo districts
Western Zone Tabora and Kigoma Sikonge, Kigoma (R), Kibondo and Kasulu
districts
DRAFT FOR DISCUSSION
22
program. Also, the project has trained 3,855 agro-dealers across the country. In 2010/2011,
2,335 agro-dealers were involved in NAIVS implementation and 2,010 agro-dealers were
confirmed to participate in NAIVS implementation in 2011/2012 with some attrition due to
delayed payments to agro-dealers and late delivery of the vouchers making the agro-dealers
uncertain as to whether or not the program was going to be implemented or not. Also, it has
been common during the implementation of the program for farmers to sell vouchers at a
throw away prices in search for quick money to meet their needs. This is particularly so
during the harvest season when the market conditions for their crops are not attractive, or
when the crop markets are generally limited, farmers cannot therefore access the necessary
inputs for their farms. Over time market price of farm inputs has been increasing and
therefore farmers have to pay more on inputs, which also affect the input utilization.
Table 2.3: Changes made between 2009/10 and 2011/12
Year Changes Reasons Implications
2011 Farmers boycotting
Minjingu fertilizer
It was technically reported
to be harmful because the
yield are low
Necessitates use of the imported
fertilizer
2012 The government urges agro-
dealers and farmers to use
Minjingu Phosphate
To promote domestic
industries
That contradicts the programme
guidelines and deters or affects
productivity target of the
programme because Minjingu
fertilizer was technically reported to
have negative consequences to the
soils and yields
2011/12 The World Bank actual
spending was increased to
83 percent from 50 percent
The government‟s delays
to disburse the money (50
percent)
Government commitments not
honored
2011 Completion of the Alliance
for a Green Revolution in
Africa (AGRA) guarantee to
the National Microfinance
Bank for agro-dealers to get
loans
Affected agro-dealers who
could not obtain loans
from NMB
Failure of agro-dealers to
participate in the implementation of
NAIVS
2011 Closure of Citizens Network
for Foreign Affairs (CNFA)
Resulted into the closure
of the matching grant
which enabled agro-
dealers to get input loans
from the Input supply
companies
Failure of agro-dealers to
participate in the implementation of
NAIVS
2.2 Implementation Features of NAIVS
2.2.1 Annual Implementation Cycle
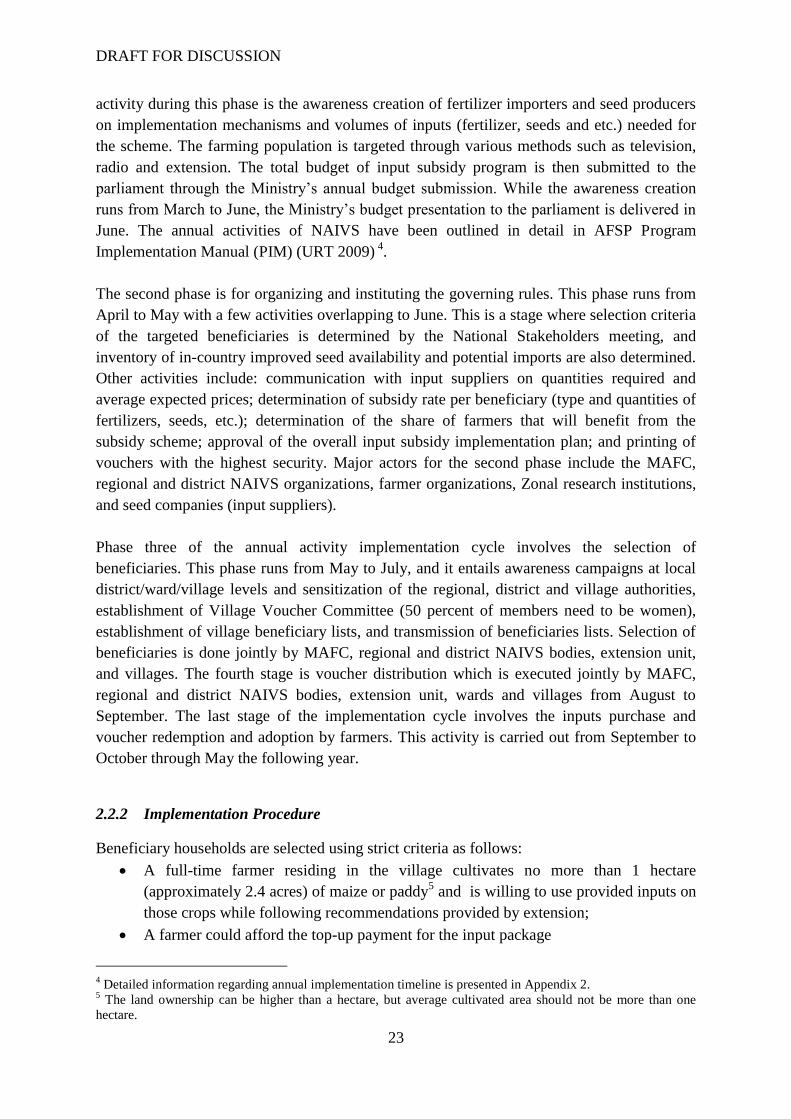
The NAIVS annual budgeting process starts with commitment of subsidy budget and total
number of beneficiaries (Figure 2.1). Programming and budgeting is mainly carried out
between March and April despite the fact that some activities related to this phase such as the
awareness creation of targeted farming population overlaps up to June. This is undertaken by
the Ministry of Agriculture, Food Security and Cooperatives (MAFC). Another important
DRAFT FOR DISCUSSION
23
activity during this phase is the awareness creation of fertilizer importers and seed producers
on implementation mechanisms and volumes of inputs (fertilizer, seeds and etc.) needed for
the scheme. The farming population is targeted through various methods such as television,
radio and extension. The total budget of input subsidy program is then submitted to the
parliament through the Ministry‟s annual budget submission. While the awareness creation
runs from March to June, the Ministry‟s budget presentation to the parliament is delivered in
June. The annual activities of NAIVS have been outlined in detail in AFSP Program
Implementation Manual (PIM) (URT 2009) 4
.
The second phase is for organizing and instituting the governing rules. This phase runs from
April to May with a few activities overlapping to June. This is a stage where selection criteria
of the targeted beneficiaries is determined by the National Stakeholders meeting, and
inventory of in-country improved seed availability and potential imports are also determined.
Other activities include: communication with input suppliers on quantities required and
average expected prices; determination of subsidy rate per beneficiary (type and quantities of
fertilizers, seeds, etc.); determination of the share of farmers that will benefit from the
subsidy scheme; approval of the overall input subsidy implementation plan; and printing of
vouchers with the highest security. Major actors for the second phase include the MAFC,
regional and district NAIVS organizations, farmer organizations, Zonal research institutions,
and seed companies (input suppliers).
Phase three of the annual activity implementation cycle involves the selection of
beneficiaries. This phase runs from May to July, and it entails awareness campaigns at local
district/ward/village levels and sensitization of the regional, district and village authorities,
establishment of Village Voucher Committee (50 percent of members need to be women),
establishment of village beneficiary lists, and transmission of beneficiaries lists. Selection of
beneficiaries is done jointly by MAFC, regional and district NAIVS bodies, extension unit,
and villages. The fourth stage is voucher distribution which is executed jointly by MAFC,
regional and district NAIVS bodies, extension unit, wards and villages from August to
September. The last stage of the implementation cycle involves the inputs purchase and
voucher redemption and adoption by farmers. This activity is carried out from September to
October through May the following year.
2.2.2 Implementation Procedure
Beneficiary households are selected using strict criteria as follows:
A full-time farmer residing in the village cultivates no more than 1 hectare
(approximately 2.4 acres) of maize or paddy5 and is willing to use provided inputs on
those crops while following recommendations provided by extension;
A farmer could afford the top-up payment for the input package
4 Detailed information regarding annual implementation timeline is presented in Appendix 2.
5 The land ownership can be higher than a hectare, but average cultivated area should not be more than one
hectare.
DRAFT FOR DISCUSSION
24
Priority is given to female-headed households and to households that have not used any
fertilizer and improved seeds for targeted crops over the last five years (URT 2009).
Figure 2.1: Annual Activity Implementation Timeline of the Program
Source: Composed based on the information in URT (2009)
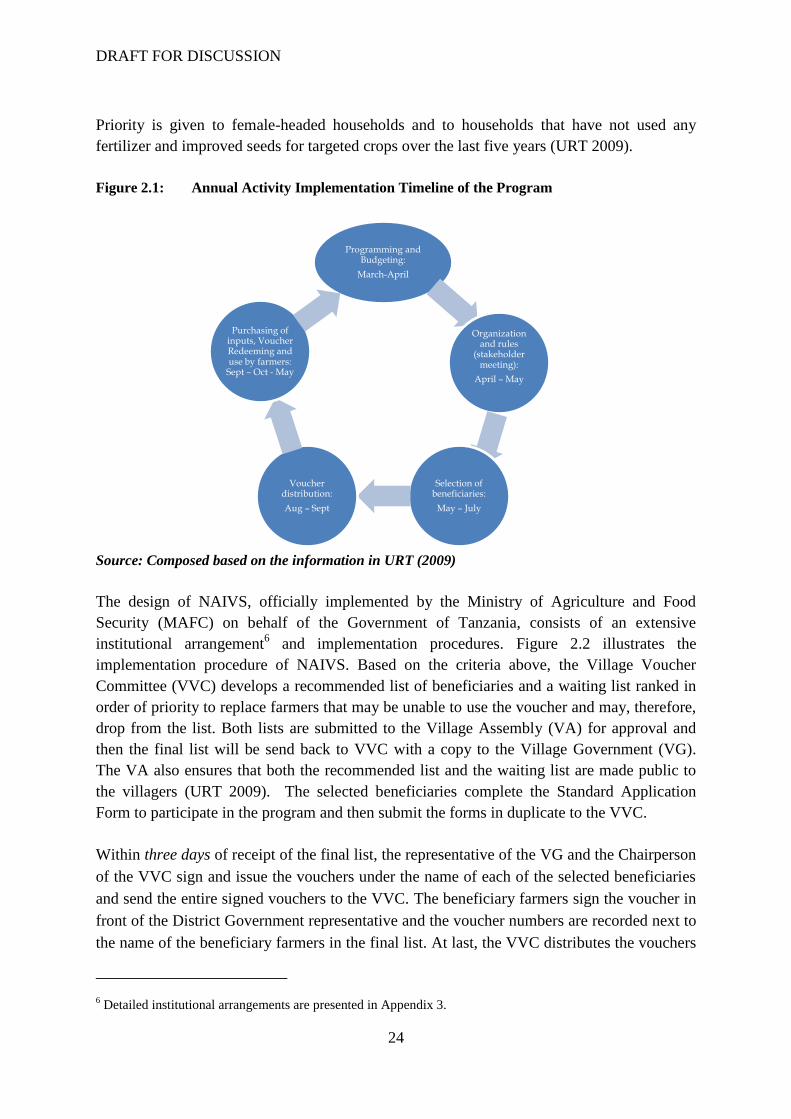
The design of NAIVS, officially implemented by the Ministry of Agriculture and Food
Security (MAFC) on behalf of the Government of Tanzania, consists of an extensive
institutional arrangement6 and implementation procedures. Figure 2.2 illustrates the
implementation procedure of NAIVS. Based on the criteria above, the Village Voucher
Committee (VVC) develops a recommended list of beneficiaries and a waiting list ranked in
order of priority to replace farmers that may be unable to use the voucher and may, therefore,
drop from the list. Both lists are submitted to the Village Assembly (VA) for approval and
then the final list will be send back to VVC with a copy to the Village Government (VG).
The VA also ensures that both the recommended list and the waiting list are made public to
the villagers (URT 2009). The selected beneficiaries complete the Standard Application
Form to participate in the program and then submit the forms in duplicate to the VVC.
Within three days of receipt of the final list, the representative of the VG and the Chairperson
of the VVC sign and issue the vouchers under the name of each of the selected beneficiaries
and send the entire signed vouchers to the VVC. The beneficiary farmers sign the voucher in
front of the District Government representative and the voucher numbers are recorded next to
the name of the beneficiary farmers in the final list. At last, the VVC distributes the vouchers
6 Detailed institutional arrangements are presented in Appendix 3.
Programming and Budgeting:
March-April
Organization and rules
(stakeholder meeting):
April – May
Selection of beneficiaries:
May – July
Voucher distribution:
Aug – Sept
Purchasing of inputs, Voucher Redeeming and use by farmers:
Sept – Oct - May
DRAFT FOR DISCUSSION
25
to the selected beneficiaries who acknowledge receipt of the vouchers by completing and
signing standard form. Vouchers are immediately ready for use by the beneficiary farmers.
Figure 2.2: Implementation Procedure
Source: Adopted from URT (2009)
Farmers can convert vouchers to agricultural inputs with agro-dealers. A farmer who receives
a voucher from the VVC goes to any registered agro-dealer of his choice, redeems the
voucher, pays the difference between the voucher face value and the market price of the
inputs, and collects the inputs. Farmers are advised to go and get inputs from authorized agro-
dealers who accept vouchers and have a good record of supplying inputs that meet
recommended quality standards. Usually agro-dealers ask for identification to match with the
name on the voucher identification and register the voucher number, name of the beneficiary,
and get beneficiary signature. The agro-dealer must check the authenticity of the voucher
with district authorities and VVC, if in doubt. Agro-dealers then convert vouchers to cash
with the National Micro-Finance Bank (NMB). Agro-dealers‟ conversion of vouchers to cash
is based on the conversion procedure set by NMB, the only Bank that has been mandated to
convert vouchers to cash.
2.3 Expenditure on NAIVS
Table 2.4 summarizes costs incurred on NAIVS from 2009/10 to 2011/12 for both planned
and actual expenditures. Under each category the budgets are disaggregated into direct costs,
indirect costs and complementary investments. While the direct costs (scaling up of NAIVS)
entail expenditure on fertilizer and seeds (input subsidy), indirect costs consist of the
resources spent to improve farmers‟ awareness and project management costs.
VVC
•establishes beneficiary list
•rank according to selection criteria; select beneficiaries equal to number of voucher
•send to the Village Assembly (VA) for approval
VA
•review recommendation of the VVC and the "Waiting List"
•send approved list to VVC with copy to the Village Governemnt (VG)
VVC
•approved beneficiaries fill and sign application forms
•VVC send the completed application forms and final list to VG
VG &
VVC
•VVC Chairperson and VG representative sign voucher with the name of beneficiary on it
• write voucher number issued against the name of beneficiary in the master list
VVC•VVC distribute voucher; beneficairy sign on the list acknowledging receipt
DRAFT FOR DISCUSSION
26
Complementary investments mainly include the costs of strengthening agro-dealers‟ network,
strengthening the national seed system, and the project monitoring and evaluation.
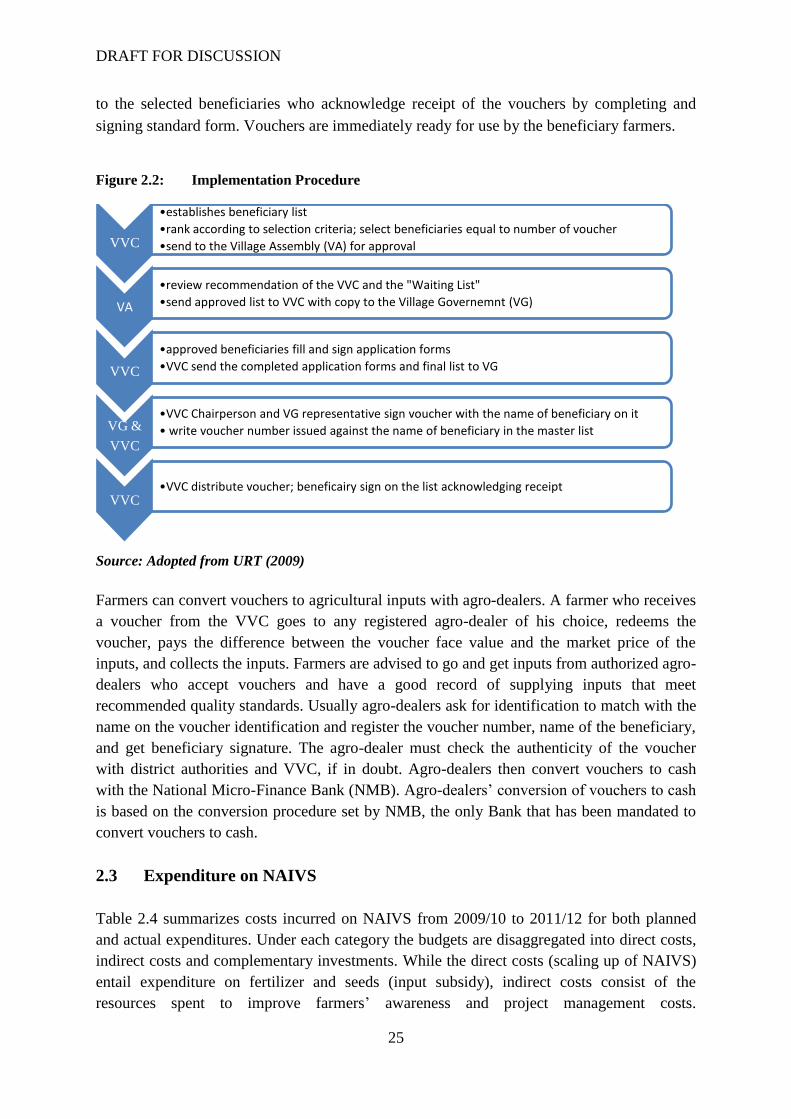
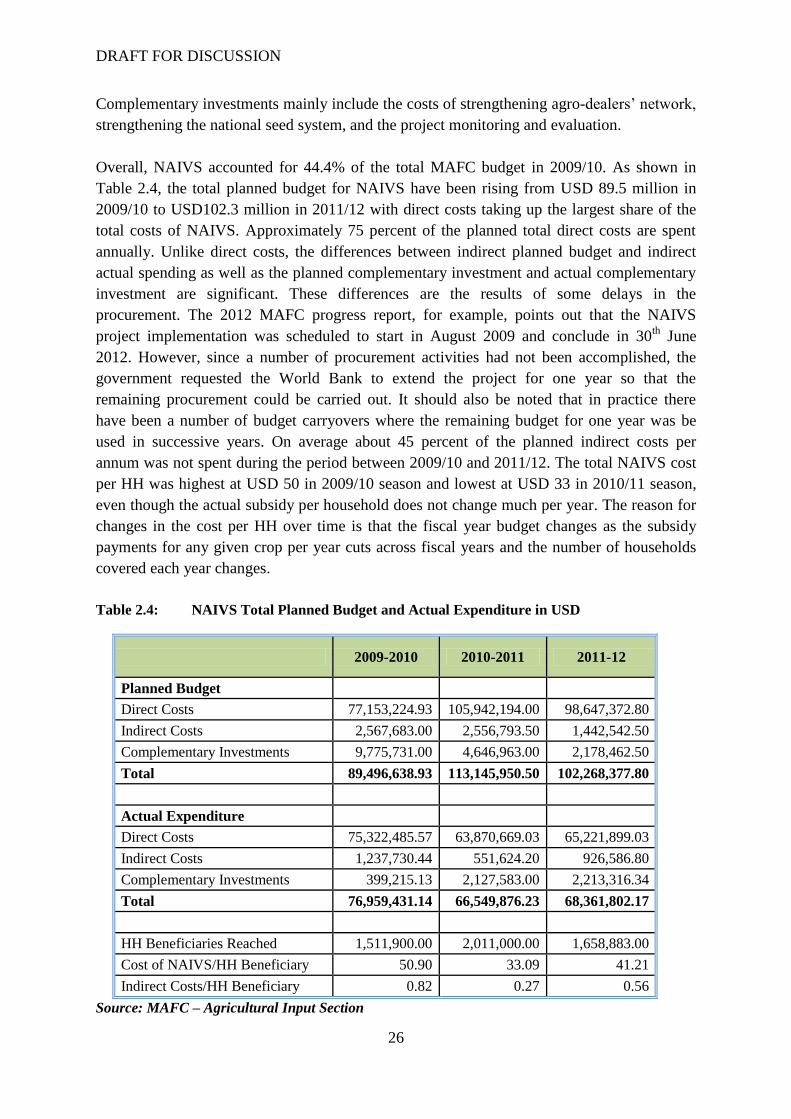
Overall, NAIVS accounted for 44.4% of the total MAFC budget in 2009/10. As shown in
Table 2.4, the total planned budget for NAIVS have been rising from USD 89.5 million in
2009/10 to USD102.3 million in 2011/12 with direct costs taking up the largest share of the
total costs of NAIVS. Approximately 75 percent of the planned total direct costs are spent
annually. Unlike direct costs, the differences between indirect planned budget and indirect
actual spending as well as the planned complementary investment and actual complementary
investment are significant. These differences are the results of some delays in the
procurement. The 2012 MAFC progress report, for example, points out that the NAIVS
project implementation was scheduled to start in August 2009 and conclude in 30th
June
2012. However, since a number of procurement activities had not been accomplished, the
government requested the World Bank to extend the project for one year so that the
remaining procurement could be carried out. It should also be noted that in practice there
have been a number of budget carryovers where the remaining budget for one year was be
used in successive years. On average about 45 percent of the planned indirect costs per
annum was not spent during the period between 2009/10 and 2011/12. The total NAIVS cost
per HH was highest at USD 50 in 2009/10 season and lowest at USD 33 in 2010/11 season,
even though the actual subsidy per household does not change much per year. The reason for
changes in the cost per HH over time is that the fiscal year budget changes as the subsidy
payments for any given crop per year cuts across fiscal years and the number of households
covered each year changes.
Table 2.4: NAIVS Total Planned Budget and Actual Expenditure in USD
2009-2010 2010-2011 2011-12
Planned Budget
Direct Costs 77,153,224.93 105,942,194.00 98,647,372.80
Indirect Costs 2,567,683.00 2,556,793.50 1,442,542.50
Complementary Investments 9,775,731.00 4,646,963.00 2,178,462.50
Total 89,496,638.93 113,145,950.50 102,268,377.80
Actual Expenditure
Direct Costs 75,322,485.57 63,870,669.03 65,221,899.03
Indirect Costs 1,237,730.44 551,624.20 926,586.80
Complementary Investments 399,215.13 2,127,583.00 2,213,316.34
Total 76,959,431.14 66,549,876.23 68,361,802.17
HH Beneficiaries Reached 1,511,900.00 2,011,000.00 1,658,883.00
Cost of NAIVS/HH Beneficiary 50.90 33.09 41.21
Indirect Costs/HH Beneficiary 0.82 0.27 0.56
Source: MAFC – Agricultural Input Section
DRAFT FOR DISCUSSION
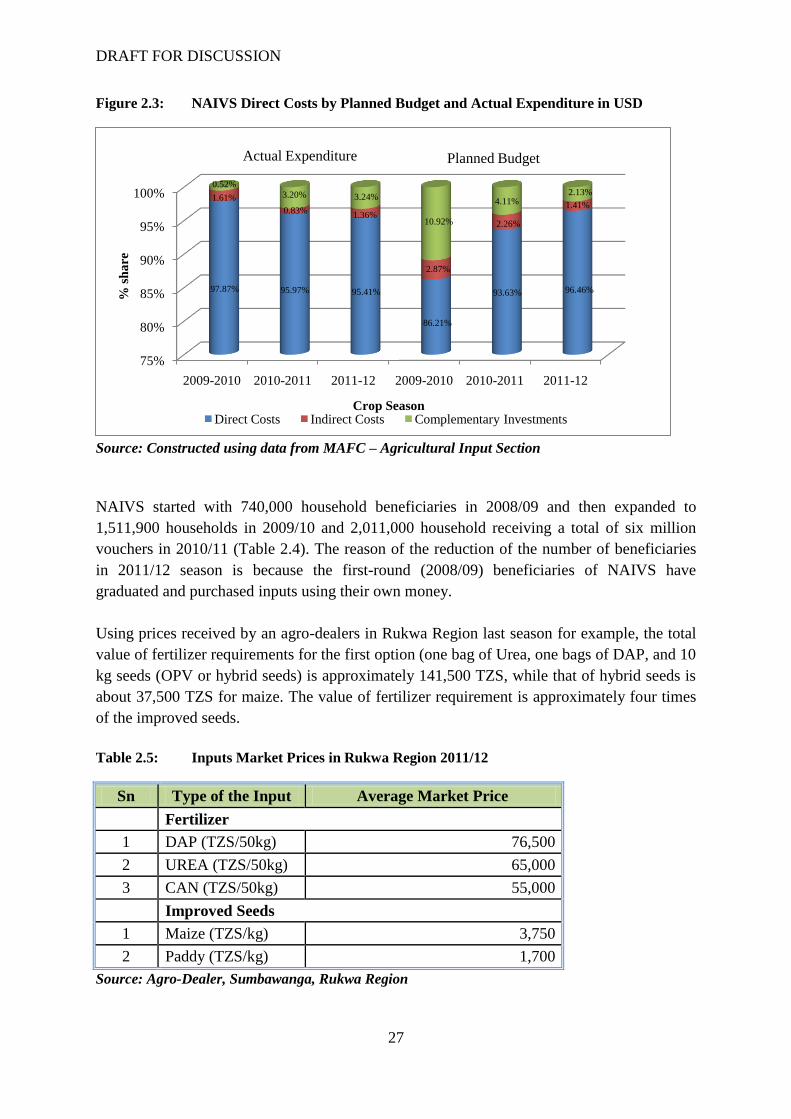
27
Figure 2.3: NAIVS Direct Costs by Planned Budget and Actual Expenditure in USD
Source: Constructed using data from MAFC – Agricultural Input Section
NAIVS started with 740,000 household beneficiaries in 2008/09 and then expanded to
1,511,900 households in 2009/10 and 2,011,000 household receiving a total of six million
vouchers in 2010/11 (Table 2.4). The reason of the reduction of the number of beneficiaries
in 2011/12 season is because the first-round (2008/09) beneficiaries of NAIVS have
graduated and purchased inputs using their own money.
Using prices received by an agro-dealers in Rukwa Region last season for example, the total
value of fertilizer requirements for the first option (one bag of Urea, one bags of DAP, and 10
kg seeds (OPV or hybrid seeds) is approximately 141,500 TZS, while that of hybrid seeds is
about 37,500 TZS for maize. The value of fertilizer requirement is approximately four times
of the improved seeds.
Table 2.5: Inputs Market Prices in Rukwa Region 2011/12
Sn Type of the Input Average Market Price
Fertilizer
1 DAP (TZS/50kg) 76,500
2 UREA (TZS/50kg) 65,000
3 CAN (TZS/50kg) 55,000
Improved Seeds
1 Maize (TZS/kg) 3,750
2 Paddy (TZS/kg) 1,700
Source: Agro-Dealer, Sumbawanga, Rukwa Region
75%
80%
85%
90%
95%
100%
2009-2010 2010-2011 2011-12 2009-2010 2010-2011 2011-12
97.87% 95.97% 95.41%
86.21%
93.63% 96.46%
1.61%
0.83%1.36%
2.87%
2.26%
1.41%
0.52%3.20% 3.24%
10.92%
4.11%2.13%
% s
ha
re
Crop SeasonDirect Costs Indirect Costs Complementary Investments
Actual Expenditure Planned Budget
DRAFT FOR DISCUSSION
28
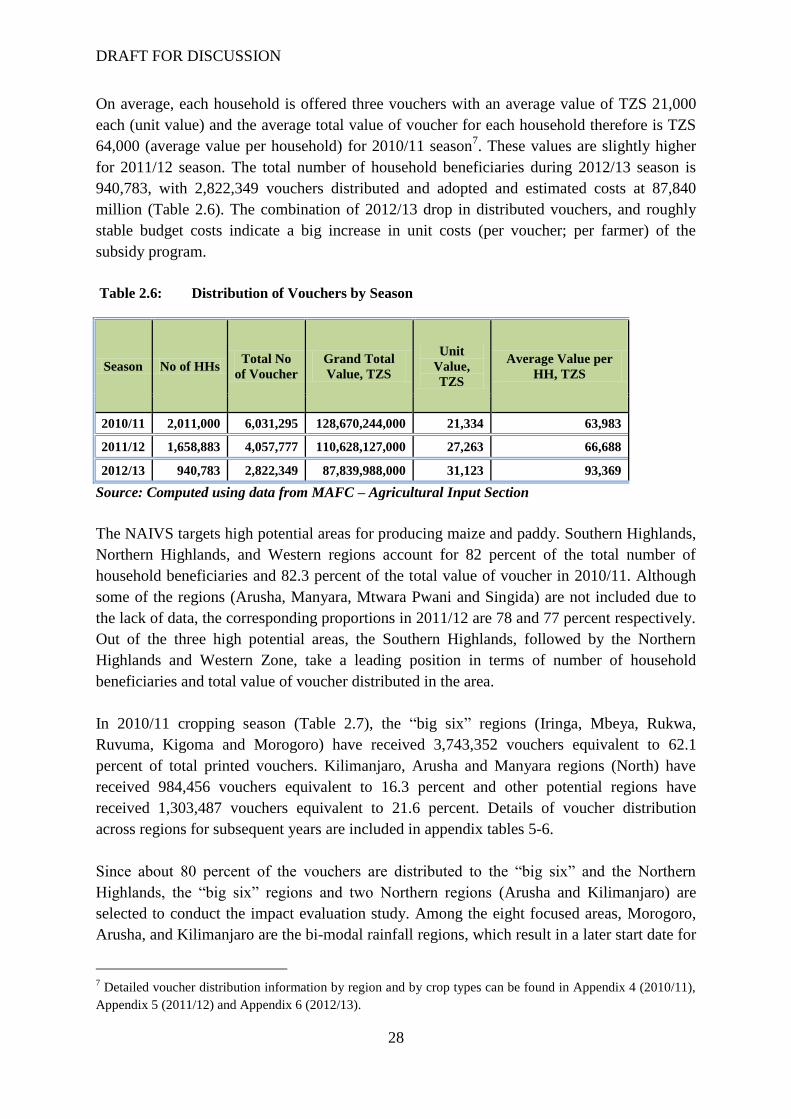
On average, each household is offered three vouchers with an average value of TZS 21,000
each (unit value) and the average total value of voucher for each household therefore is TZS
64,000 (average value per household) for 2010/11 season7. These values are slightly higher
for 2011/12 season. The total number of household beneficiaries during 2012/13 season is
940,783, with 2,822,349 vouchers distributed and adopted and estimated costs at 87,840
million (Table 2.6). The combination of 2012/13 drop in distributed vouchers, and roughly
stable budget costs indicate a big increase in unit costs (per voucher; per farmer) of the
subsidy program.
Table 2.6: Distribution of Vouchers by Season
Season No of HHs Total No
of Voucher
Grand Total
Value, TZS
Unit
Value,
TZS
Average Value per
HH, TZS
2010/11 2,011,000 6,031,295 128,670,244,000 21,334 63,983
2011/12 1,658,883 4,057,777 110,628,127,000 27,263 66,688
2012/13 940,783 2,822,349 87,839,988,000 31,123 93,369
Source: Computed using data from MAFC – Agricultural Input Section
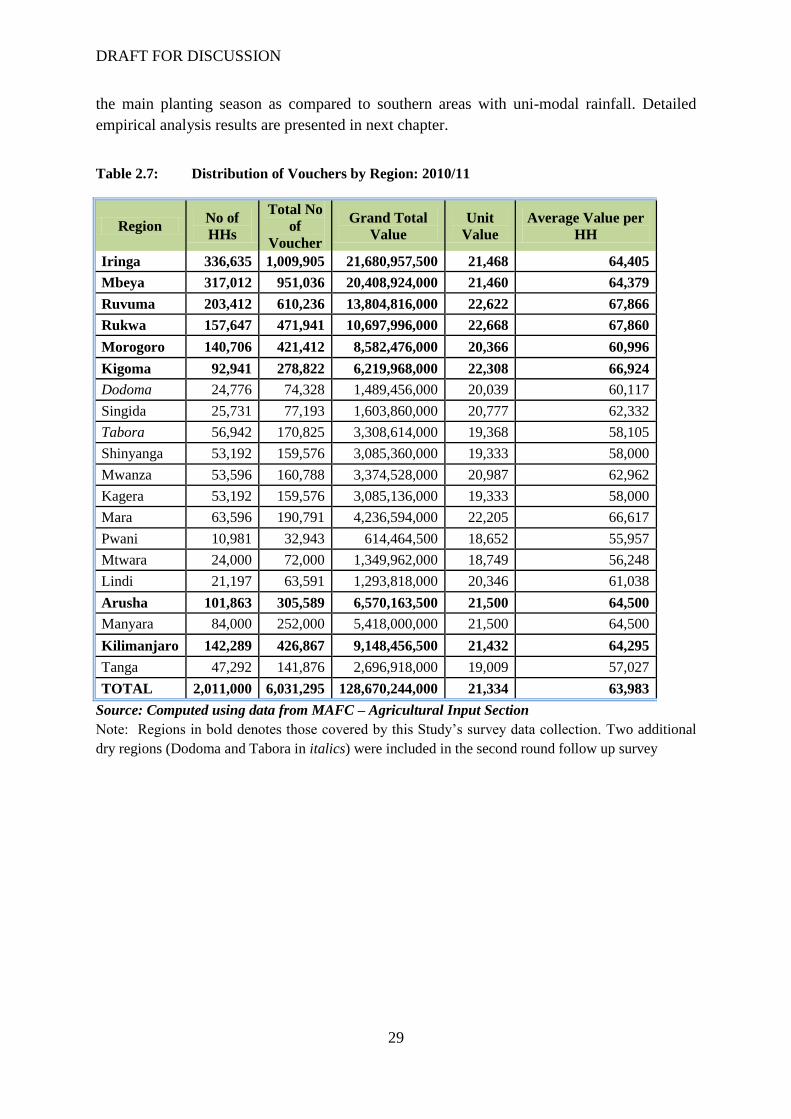
The NAIVS targets high potential areas for producing maize and paddy. Southern Highlands,
Northern Highlands, and Western regions account for 82 percent of the total number of
household beneficiaries and 82.3 percent of the total value of voucher in 2010/11. Although
some of the regions (Arusha, Manyara, Mtwara Pwani and Singida) are not included due to
the lack of data, the corresponding proportions in 2011/12 are 78 and 77 percent respectively.
Out of the three high potential areas, the Southern Highlands, followed by the Northern
Highlands and Western Zone, take a leading position in terms of number of household
beneficiaries and total value of voucher distributed in the area.
In 2010/11 cropping season (Table 2.7), the “big six” regions (Iringa, Mbeya, Rukwa,
Ruvuma, Kigoma and Morogoro) have received 3,743,352 vouchers equivalent to 62.1
percent of total printed vouchers. Kilimanjaro, Arusha and Manyara regions (North) have
received 984,456 vouchers equivalent to 16.3 percent and other potential regions have
received 1,303,487 vouchers equivalent to 21.6 percent. Details of voucher distribution
across regions for subsequent years are included in appendix tables 5-6.
Since about 80 percent of the vouchers are distributed to the “big six” and the Northern
Highlands, the “big six” regions and two Northern regions (Arusha and Kilimanjaro) are
selected to conduct the impact evaluation study. Among the eight focused areas, Morogoro,
Arusha, and Kilimanjaro are the bi-modal rainfall regions, which result in a later start date for
7 Detailed voucher distribution information by region and by crop types can be found in Appendix 4 (2010/11),
Appendix 5 (2011/12) and Appendix 6 (2012/13).
DRAFT FOR DISCUSSION
29
the main planting season as compared to southern areas with uni-modal rainfall. Detailed
empirical analysis results are presented in next chapter.
Table 2.7: Distribution of Vouchers by Region: 2010/11
Region No of
HHs
Total No
of
Voucher
Grand Total
Value Unit
Value Average Value per
HH
Iringa 336,635 1,009,905 21,680,957,500 21,468 64,405
Mbeya 317,012 951,036 20,408,924,000 21,460 64,379
Ruvuma 203,412 610,236 13,804,816,000 22,622 67,866
Rukwa 157,647 471,941 10,697,996,000 22,668 67,860
Morogoro 140,706 421,412 8,582,476,000 20,366 60,996
Kigoma 92,941 278,822 6,219,968,000 22,308 66,924
Dodoma 24,776 74,328 1,489,456,000 20,039 60,117
Singida 25,731 77,193 1,603,860,000 20,777 62,332
Tabora 56,942 170,825 3,308,614,000 19,368 58,105
Shinyanga 53,192 159,576 3,085,360,000 19,333 58,000
Mwanza 53,596 160,788 3,374,528,000 20,987 62,962
Kagera 53,192 159,576 3,085,136,000 19,333 58,000
Mara 63,596 190,791 4,236,594,000 22,205 66,617
Pwani 10,981 32,943 614,464,500 18,652 55,957
Mtwara 24,000 72,000 1,349,962,000 18,749 56,248
Lindi 21,197 63,591 1,293,818,000 20,346 61,038
Arusha 101,863 305,589 6,570,163,500 21,500 64,500
Manyara 84,000 252,000 5,418,000,000 21,500 64,500
Kilimanjaro 142,289 426,867 9,148,456,500 21,432 64,295
Tanga 47,292 141,876 2,696,918,000 19,009 57,027
TOTAL 2,011,000 6,031,295 128,670,244,000 21,334 63,983
Source: Computed using data from MAFC – Agricultural Input Section
Note: Regions in bold denotes those covered by this Study‟s survey data collection. Two additional
dry regions (Dodoma and Tabora in italics) were included in the second round follow up survey
DRAFT FOR DISCUSSION
30
3.0 MEASURING FINANCIAL AND ECONOMIC RETURNS
3.1 Analytical Approach and Study Population
This chapter estimates the NAIVS program impacts. It exploits the roll-out plan of the
program to generate comparable treatment and counterfactual groups. Prior to the original
implementation of the program, it was estimated that 2.5 million households were eligible,
but the government distributed vouchers to only 1.5 million households in 2000/10 and 2
million households in 2010/11. Thus, each year there have been fewer vouchers distributed
than the number of eligible farmers, and we used this shortage to create a comparison group
of farmers made of non-beneficiary households within the same village. The treatment group
is comprised of farming households that began receiving the subsidy for the first time in the
2009/11 planting season and the comparison group consisted of eligible farming households
in the same village that had never received the subsidy. We note that differences in outcomes
between beneficiaries and non-beneficiaries may be due to not only the voucher program but
also the pre-existing differences between these two groups. We describe in Section 3.2 the
strategies we use to attribute differences in yield gains or in fertilizer use to the voucher
program, since in principle yields or input usage could have been different between these two
groups even in the absence of the program.
Additionally, the analysis also compares outcomes between fourth-year beneficiaries – or
graduates – that received the subsidy for the first time in 2008/09 with those that have
received vouchers since 2009/10. Results are presented separately for the two main crops of
the regions, maize and paddy.
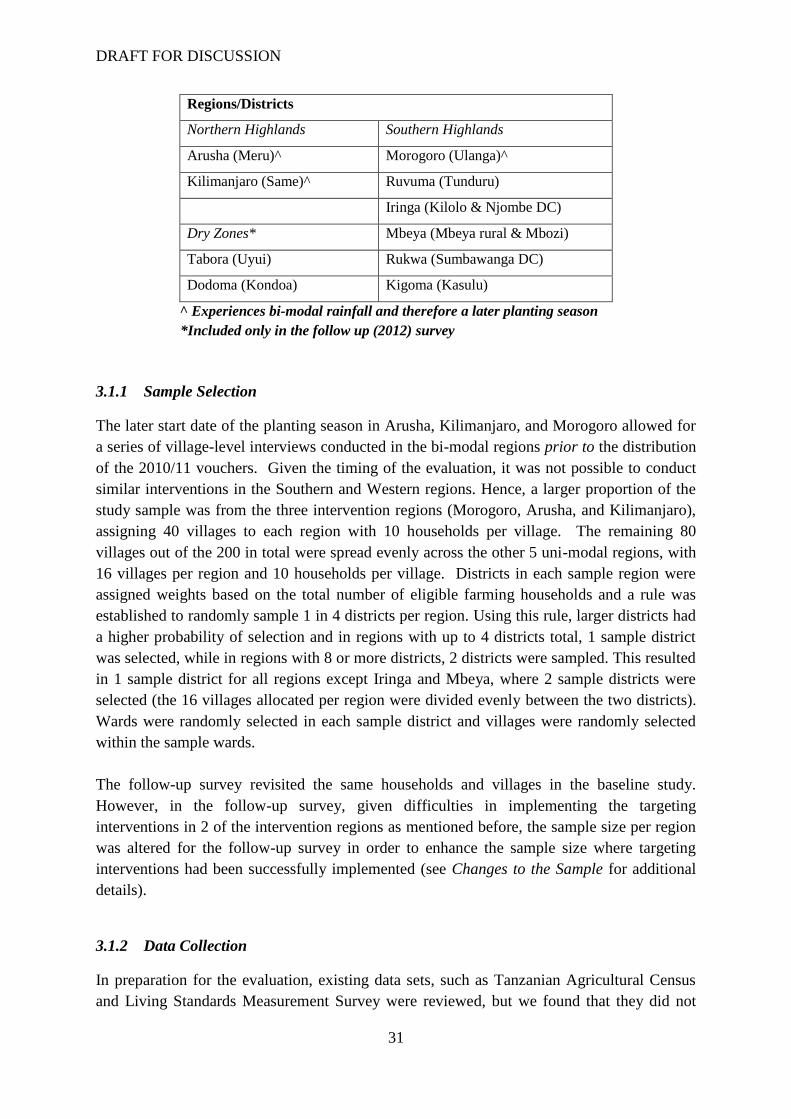
The overall sample for the impact evaluation was selected from eight regions that are
representative of the NAIVS program area, the Southern and Northern Highland zones. These
two zones, to which the majority of NAIVS vouchers were sent, have the highest potential for
maize production. The study focused on 8 of these regions, in particular those across
Tanzania‟s grain belt known as the “big six” that covers the Southern Highlands (Ruvuma,
Iringa, Rukwa, Mbeya) as well as some of the Western Zone (Kigoma) and Central Zone
(Morogoro). The sample also included two regions in the North: Arusha and Kilimanjaro.
Morogoro, Arusha, and Kilimanjaro are distinct in that they experience bi-modal rainfall
patterns, which result in a later start date for the main planting season as compared to
southern areas with uni-modal rainfall. The sample was expanded in the 2012 follow up
survey to include two additional regions – Dodoma and Tabora - that experience less rainfall
to represent the country‟s “dry zones”. These districts were added at the request of the
Ministry of Agriculture to be able to measure and compare the cost-effectiveness of the
program across a wider variety of climatic zones and soil types.
DRAFT FOR DISCUSSION
31
Regions/Districts
Northern Highlands Southern Highlands
Arusha (Meru)^ Morogoro (Ulanga)^
Kilimanjaro (Same)^ Ruvuma (Tunduru)
Iringa (Kilolo & Njombe DC)
Dry Zones* Mbeya (Mbeya rural & Mbozi)
Tabora (Uyui) Rukwa (Sumbawanga DC)
Dodoma (Kondoa) Kigoma (Kasulu)
^ Experiences bi-modal rainfall and therefore a later planting season
*Included only in the follow up (2012) survey
3.1.1 Sample Selection
The later start date of the planting season in Arusha, Kilimanjaro, and Morogoro allowed for
a series of village-level interviews conducted in the bi-modal regions prior to the distribution
of the 2010/11 vouchers. Given the timing of the evaluation, it was not possible to conduct
similar interventions in the Southern and Western regions. Hence, a larger proportion of the
study sample was from the three intervention regions (Morogoro, Arusha, and Kilimanjaro),
assigning 40 villages to each region with 10 households per village. The remaining 80
villages out of the 200 in total were spread evenly across the other 5 uni-modal regions, with
16 villages per region and 10 households per village. Districts in each sample region were
assigned weights based on the total number of eligible farming households and a rule was
established to randomly sample 1 in 4 districts per region. Using this rule, larger districts had
a higher probability of selection and in regions with up to 4 districts total, 1 sample district
was selected, while in regions with 8 or more districts, 2 districts were sampled. This resulted
in 1 sample district for all regions except Iringa and Mbeya, where 2 sample districts were
selected (the 16 villages allocated per region were divided evenly between the two districts).
Wards were randomly selected in each sample district and villages were randomly selected
within the sample wards.
The follow-up survey revisited the same households and villages in the baseline study.
However, in the follow-up survey, given difficulties in implementing the targeting
interventions in 2 of the intervention regions as mentioned before, the sample size per region
was altered for the follow-up survey in order to enhance the sample size where targeting
interventions had been successfully implemented (see Changes to the Sample for additional
details).
3.1.2 Data Collection
In preparation for the evaluation, existing data sets, such as Tanzanian Agricultural Census
and Living Standards Measurement Survey were reviewed, but we found that they did not
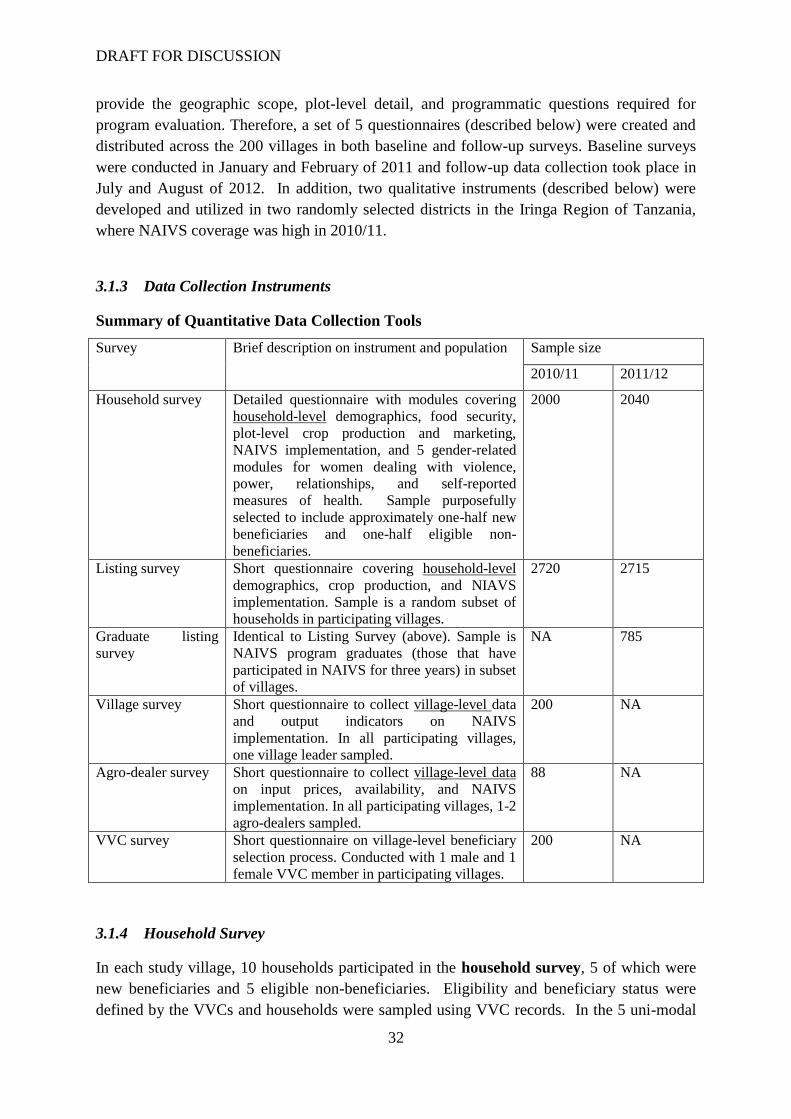
DRAFT FOR DISCUSSION
32
provide the geographic scope, plot-level detail, and programmatic questions required for
program evaluation. Therefore, a set of 5 questionnaires (described below) were created and
distributed across the 200 villages in both baseline and follow-up surveys. Baseline surveys
were conducted in January and February of 2011 and follow-up data collection took place in
July and August of 2012. In addition, two qualitative instruments (described below) were
developed and utilized in two randomly selected districts in the Iringa Region of Tanzania,
where NAIVS coverage was high in 2010/11.
3.1.3 Data Collection Instruments
Summary of Quantitative Data Collection Tools
Survey Brief description on instrument and population Sample size
2010/11 2011/12
Household survey Detailed questionnaire with modules covering
household-level demographics, food security,
plot-level crop production and marketing,
NAIVS implementation, and 5 gender-related
modules for women dealing with violence,
power, relationships, and self-reported
measures of health. Sample purposefully
selected to include approximately one-half new
beneficiaries and one-half eligible non-
beneficiaries.
2000 2040
Listing survey Short questionnaire covering household-level
demographics, crop production, and NIAVS
implementation. Sample is a random subset of
households in participating villages.
2720 2715
Graduate listing
survey
Identical to Listing Survey (above). Sample is
NAIVS program graduates (those that have
participated in NAIVS for three years) in subset
of villages.
NA 785
Village survey Short questionnaire to collect village-level data
and output indicators on NAIVS
implementation. In all participating villages,
one village leader sampled.
200 NA
Agro-dealer survey Short questionnaire to collect village-level data
on input prices, availability, and NAIVS
implementation. In all participating villages, 1-2
agro-dealers sampled.
88 NA
VVC survey Short questionnaire on village-level beneficiary
selection process. Conducted with 1 male and 1
female VVC member in participating villages.
200 NA
3.1.4 Household Survey
In each study village, 10 households participated in the household survey, 5 of which were
new beneficiaries and 5 eligible non-beneficiaries. Eligibility and beneficiary status were
defined by the VVCs and households were sampled using VVC records. In the 5 uni-modal
DRAFT FOR DISCUSSION
33
regions where voucher coverage was generally higher and new beneficiaries were difficult to
find, the new beneficiaries sample consisted of 2 previous beneficiaries (i.e. households that
began receiving vouchers either in the 2008/9 or 2009/10 voucher cycles) and 3 new
beneficiaries. In order to investigate gender-related impacts of the NAIVS, women were
oversampled such that 50 percent of the household survey sample in each village are female-
headed households.
3.1.5 Listing Survey
In order to look at program-related topics over the entire population rather than just eligible
households, the study also included a completely random selected subset of households in
each sample village. A separate sample of 16 households in bi-modal regions (where villages
are more concentrated geographically) and 10 households in uni-modal regions was randomly
selected from one village to conduct a short household survey, referred to as the listing
survey.
3.1.6 Other Surveys
Additionally, a VVC survey looking at voucher operations in the village was conducted with
1 male and 1 female member of the VVC. A community survey was conducted with the
village executive officer (VEO) to record village-level characteristics, and finally an agro-
dealer survey was conducted to all agro-dealers working in the village to understand the
input supply side of the program.
3.1.7 Changes to the Sample
In the bi-modal regions, because targeting interventions were conducted as planned only in
Arusha region, households in the 46 Arusha villages were oversampled (doubled) in the
follow-up survey, resulting in a sample of 920 households. Households for the expanded
sample were selected using the same mechanism utilized in the baseline. Specifically, eligible
beneficiaries were defined as those that began participating in NAIVS prior to the 2010/11
planting season and eligible non-beneficiaries were defined as those that were eligible to
participate in 2010/11 but were not selected. Number of villages from Morogoro and
Kilimanjaro were reduced to compensate for the oversampling in Arusha. This did not
significantly change the overall sample size for the Northern regions or for the overall
household survey.
3.2 Empirical Model and Results
In this section we report the empirical model and evaluation results of the NAIVS program.
First, we look at the impacts of NAIVS on fertilizer and seed use and productivity gains. The
Appendix provides more detail on agricultural investments and food security. We conclude
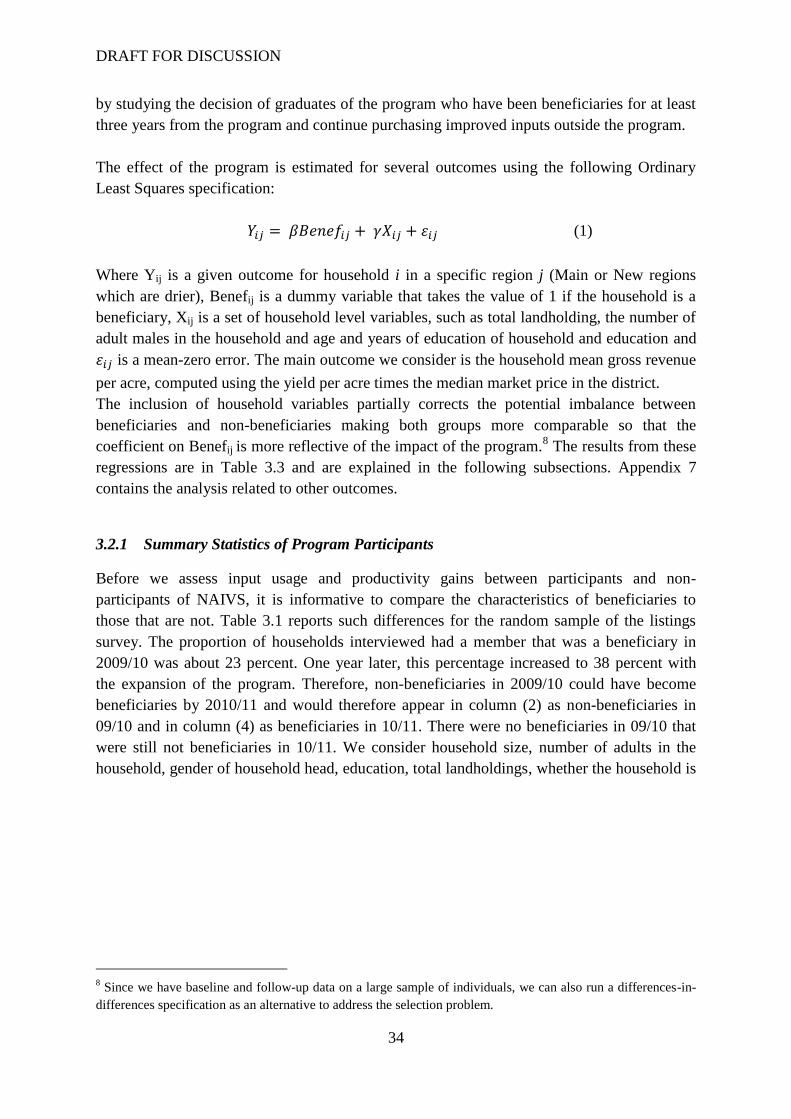
DRAFT FOR DISCUSSION
34
by studying the decision of graduates of the program who have been beneficiaries for at least
three years from the program and continue purchasing improved inputs outside the program.
The effect of the program is estimated for several outcomes using the following Ordinary
Least Squares specification:
(1)
Where Yij is a given outcome for household i in a specific region j (Main or New regions
which are drier), Benefij is a dummy variable that takes the value of 1 if the household is a
beneficiary, Xij is a set of household level variables, such as total landholding, the number of
adult males in the household and age and years of education of household and education and
is a mean-zero error. The main outcome we consider is the household mean gross revenue
per acre, computed using the yield per acre times the median market price in the district.
The inclusion of household variables partially corrects the potential imbalance between
beneficiaries and non-beneficiaries making both groups more comparable so that the
coefficient on Benefij is more reflective of the impact of the program.8 The results from these
regressions are in Table 3.3 and are explained in the following subsections. Appendix 7
contains the analysis related to other outcomes.
3.2.1 Summary Statistics of Program Participants
Before we assess input usage and productivity gains between participants and non-
participants of NAIVS, it is informative to compare the characteristics of beneficiaries to
those that are not. Table 3.1 reports such differences for the random sample of the listings
survey. The proportion of households interviewed had a member that was a beneficiary in
2009/10 was about 23 percent. One year later, this percentage increased to 38 percent with
the expansion of the program. Therefore, non-beneficiaries in 2009/10 could have become
beneficiaries by 2010/11 and would therefore appear in column (2) as non-beneficiaries in
09/10 and in column (4) as beneficiaries in 10/11. There were no beneficiaries in 09/10 that
were still not beneficiaries in 10/11. We consider household size, number of adults in the
household, gender of household head, education, total landholdings, whether the household is
8 Since we have baseline and follow-up data on a large sample of individuals, we can also run a differences-in-
differences specification as an alternative to address the selection problem.
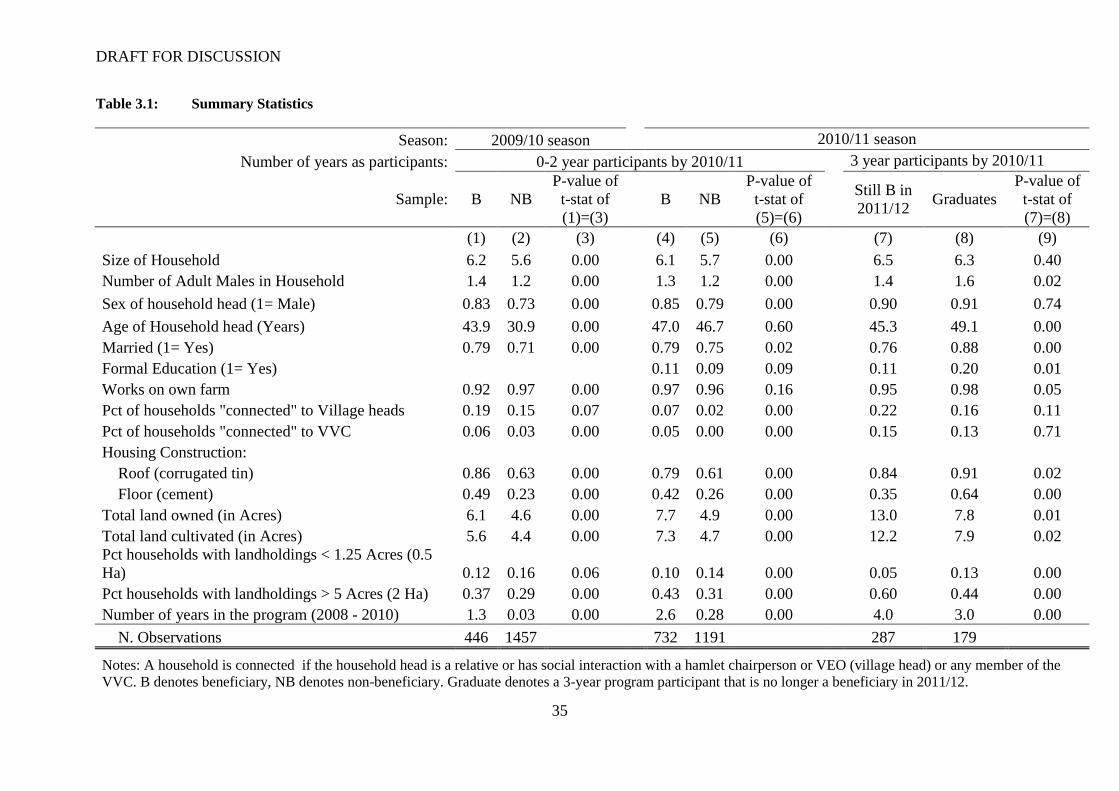
DRAFT FOR DISCUSSION
35
Table 3.1: Summary Statistics
Season: 2009/10 season 2010/11 season
Number of years as participants: 0-2 year participants by 2010/11 3 year participants by 2010/11
Sample: B NB
P-value of
t-stat of
(1)=(3)
B NB
P-value of
t-stat of
(5)=(6)
Still B in
2011/12 Graduates
P-value of
t-stat of
(7)=(8)
(1) (2) (3) (4) (5) (6) (7) (8) (9)
Size of Household 6.2 5.6 0.00 6.1 5.7 0.00 6.5 6.3 0.40
Number of Adult Males in Household 1.4 1.2 0.00 1.3 1.2 0.00 1.4 1.6 0.02
Sex of household head (1= Male) 0.83 0.73 0.00 0.85 0.79 0.00 0.90 0.91 0.74
Age of Household head (Years) 43.9 30.9 0.00 47.0 46.7 0.60 45.3 49.1 0.00
Married (1= Yes) 0.79 0.71 0.00 0.79 0.75 0.02 0.76 0.88 0.00
Formal Education (1= Yes) 0.11 0.09 0.09 0.11 0.20 0.01
Works on own farm 0.92 0.97 0.00 0.97 0.96 0.16 0.95 0.98 0.05
Pct of households "connected" to Village heads 0.19 0.15 0.07 0.07 0.02 0.00 0.22 0.16 0.11
Pct of households "connected" to VVC 0.06 0.03 0.00 0.05 0.00 0.00 0.15 0.13 0.71
Housing Construction:
Roof (corrugated tin) 0.86 0.63 0.00 0.79 0.61 0.00 0.84 0.91 0.02
Floor (cement) 0.49 0.23 0.00 0.42 0.26 0.00 0.35 0.64 0.00
Total land owned (in Acres) 6.1 4.6 0.00 7.7 4.9 0.00 13.0 7.8 0.01
Total land cultivated (in Acres) 5.6 4.4 0.00 7.3 4.7 0.00 12.2 7.9 0.02
Pct households with landholdings < 1.25 Acres (0.5
Ha) 0.12 0.16 0.06 0.10 0.14 0.00 0.05 0.13 0.00
Pct households with landholdings > 5 Acres (2 Ha) 0.37 0.29 0.00 0.43 0.31 0.00 0.60 0.44 0.00
Number of years in the program (2008 - 2010) 1.3 0.03 0.00 2.6 0.28 0.00 4.0 3.0 0.00
N. Observations 446 1457 732 1191 287 179
Notes: A household is connected if the household head is a relative or has social interaction with a hamlet chairperson or VEO (village head) or any member of the
VVC. B denotes beneficiary, NB denotes non-beneficiary. Graduate denotes a 3-year program participant that is no longer a beneficiary in 2011/12.
DRAFT FOR DISCUSSION
36
“connected” to village officials or members of the Village Voucher Committee (VVC) and
years in the program (if beneficiary) as the household characteristics.
One variable of interest that is related to the extent of elite capture is whether households are
connected to the elite. We use survey questions that ask about being a relative of or having
regular social interaction with either the Hamlet chairperson or the village executive officer
(VEO) both of which we label as village officials, or with any member of the VVC. As it
turns out, beneficiaries appear to be more “connected” with either elite than non-
beneficiaries, although the prevalence of being “connected” is low.
Similarly, beneficiaries appear to be better off than non-beneficiaries. Recall that the listing
sample is random and thus it includes non-beneficiaries there are both eligible and non-
eligible. Even among the non-eligible, there are those too rich to be eligible who may
cultivate more than one acre of maize and those that are too poor to afford the top-up. Thus,
given that the non-beneficiaries seem poorer than beneficiaries, the majority of non-
beneficiaries should be the ones that cannot afford the top-up. Indeed, Table 3.1 reports that
the percentage of households with landholdings lower than 0.5 Ha is 16 percent among non-
beneficiaries and about 12 percent among beneficiaries.
Because of the differences between beneficiaries and non-beneficiaries, one cannot in
principle attribute differences in yields and other outcomes solely to NAIVS. Indeed, as
Tables 3.2 show, one suspects that revenue gains among beneficiaries compared to non-
beneficiaries are perhaps larger than those induced by the program and so the corrections
discussed in the preceding subsection are warranted.
Columns 7 and 8 of Table 3.1 report the characteristics of individuals that by 2010/11 had
been beneficiaries for three years and thus should have graduated by 2011/12. The table
suggests that 61 percent of households still claim to be beneficiaries, although this could be
true if another household member had become the beneficiary. Interestingly, the households
that were still beneficiaries in 2011/12 had larger landholdings than those that graduated.
Similarly, when comparing the characteristics of beneficiaries that entered the program 3
years ago relative to those that have only been in the program for up to two years, we find
that older beneficiaries are also better off. Interestingly, this group of program participants
appears to be more “connected” to elites than subsequent program participants.
3.2.2 Impacts of Program on Input Usage and Yields
Table 3.2 report results from the listing survey of the impacts of being a NAIVS beneficiary
on several outcomes. A beneficiary is defined as a respondent that claims to have received the
set of three vouchers. Columns (1)-(4) of Table 3.3 use data from the baseline survey while
columns (5)-(12) use data from the follow-up survey. Columns (1)-(8) report data collected
from the regions where NAIVS was first rolled out while columns (9)-(12) report data from
drier regions where the program was later expanded. Due to the small number of households
DRAFT FOR DISCUSSION
37
that grow paddy in these regions, we only report results for maize growers. As can be seen
from the listings random sample, there are fewer beneficiaries in the new regions than in the
(main) regions where NAIVS was first rolled out.
Panels B and C are for maize and paddy cultivation, respectively. In the baseline sample
(collected in 2010), we have 518 maize beneficiaries and 2,009 maize farmers that were not
beneficiaries. Similarly, there were 108 paddy beneficiaries and 602 paddy growers that were
not beneficiaries. In the follow-up survey, there were relatively more maize beneficiaries in
the main areas (from 20 percent in the 2009/10 season to 40 percent in the 2010/11 season).
For both maize and paddy it is clear that beneficiaries use more improved inputs (in at least
one of their plots) than non-beneficiaries. While we expect that all beneficiaries would use
improved inputs from the vouchers, only about 70 percent of paddy beneficiaries in 2009/10
and an even lower percentage in 2010/11 do so. In contrast, around 90 percent of the maize
beneficiaries use improved inputs, as the program intended. In fact, out of the total of three
vouchers received, they tend to redeem 2.5 for maize and 2.2 for paddy. This increased input
usage translates into better yields overall. Production questions in the survey were asked
about cultivation with and without inputs from vouchers. A small number of non-
beneficiaries report cultivating with vouchers, probably because they were given or bought
inputs from beneficiaries.
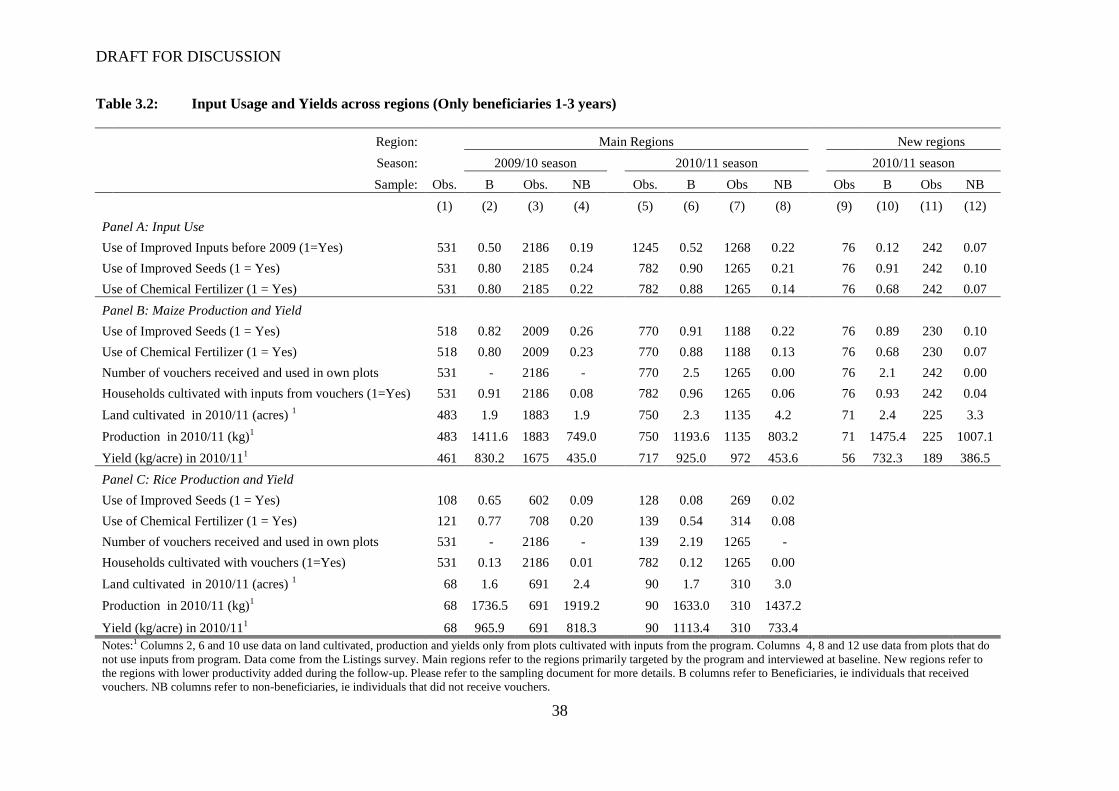
DRAFT FOR DISCUSSION
38
Table 3.2: Input Usage and Yields across regions (Only beneficiaries 1-3 years)
Region: Main Regions New regions
Season: 2009/10 season 2010/11 season 2010/11 season
Sample: Obs. B Obs. NB Obs. B Obs NB Obs B Obs NB
(1) (2) (3) (4) (5) (6) (7) (8) (9) (10) (11) (12)
Panel A: Input Use
Use of Improved Inputs before 2009 (1=Yes) 531 0.50 2186 0.19 1245 0.52 1268 0.22 76 0.12 242 0.07
Use of Improved Seeds (1 = Yes) 531 0.80 2185 0.24 782 0.90 1265 0.21 76 0.91 242 0.10
Use of Chemical Fertilizer (1 = Yes) 531 0.80 2185 0.22 782 0.88 1265 0.14 76 0.68 242 0.07
Panel B: Maize Production and Yield
Use of Improved Seeds (1 = Yes) 518 0.82 2009 0.26 770 0.91 1188 0.22 76 0.89 230 0.10
Use of Chemical Fertilizer (1 = Yes) 518 0.80 2009 0.23 770 0.88 1188 0.13 76 0.68 230 0.07
Number of vouchers received and used in own plots 531 - 2186 - 770 2.5 1265 0.00 76 2.1 242 0.00
Households cultivated with inputs from vouchers (1=Yes) 531 0.91 2186 0.08 782 0.96 1265 0.06 76 0.93 242 0.04
Land cultivated in 2010/11 (acres) 1 483 1.9 1883 1.9 750 2.3 1135 4.2 71 2.4 225 3.3
Production in 2010/11 (kg)1 483 1411.6 1883 749.0 750 1193.6 1135 803.2 71 1475.4 225 1007.1
Yield (kg/acre) in 2010/111 461 830.2 1675 435.0 717 925.0 972 453.6 56 732.3 189 386.5
Panel C: Rice Production and Yield
Use of Improved Seeds (1 = Yes) 108 0.65 602 0.09 128 0.08 269 0.02
Use of Chemical Fertilizer (1 = Yes) 121 0.77 708 0.20 139 0.54 314 0.08
Number of vouchers received and used in own plots 531 - 2186 - 139 2.19 1265 -
Households cultivated with vouchers (1=Yes) 531 0.13 2186 0.01 782 0.12 1265 0.00
Land cultivated in 2010/11 (acres) 1 68 1.6 691 2.4 90 1.7 310 3.0
Production in 2010/11 (kg)1 68 1736.5 691 1919.2 90 1633.0 310 1437.2
Yield (kg/acre) in 2010/111 68 965.9 691 818.3 90 1113.4 310 733.4
Notes:1 Columns 2, 6 and 10 use data on land cultivated, production and yields only from plots cultivated with inputs from the program. Columns 4, 8 and 12 use data from plots that do
not use inputs from program. Data come from the Listings survey. Main regions refer to the regions primarily targeted by the program and interviewed at baseline. New regions refer to
the regions with lower productivity added during the follow-up. Please refer to the sampling document for more details. B columns refer to Beneficiaries, ie individuals that received
vouchers. NB columns refer to non-beneficiaries, ie individuals that did not receive vouchers.
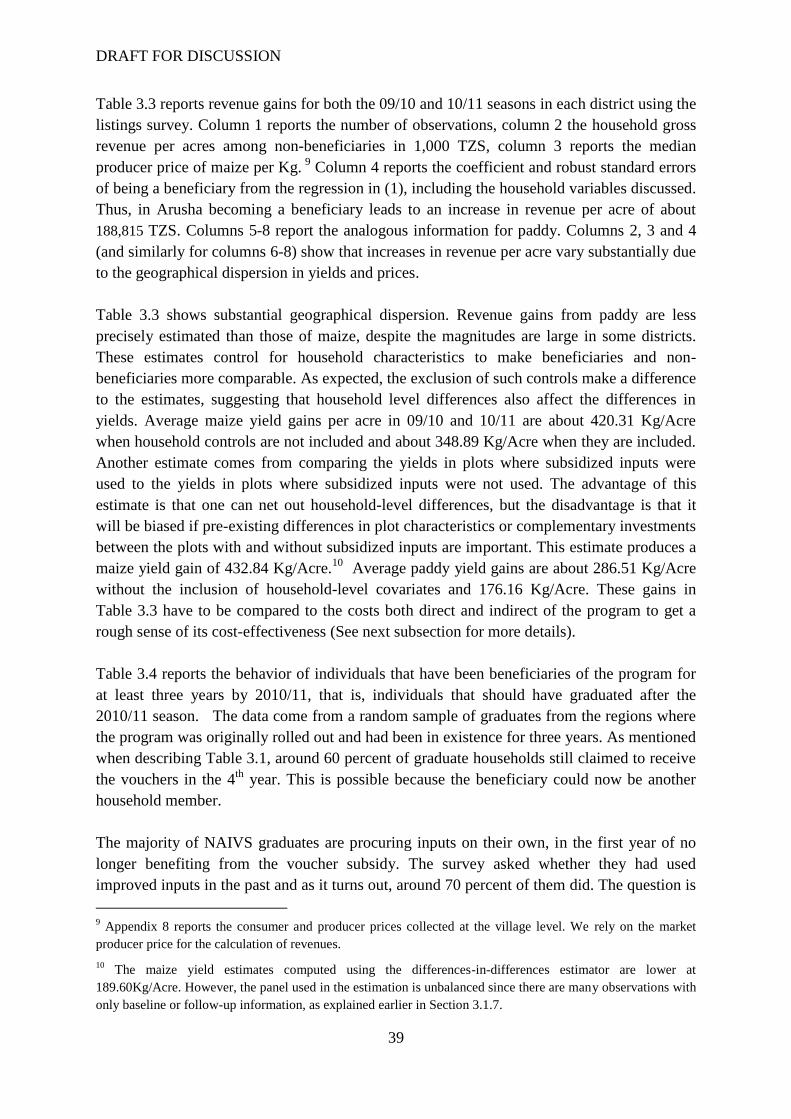
DRAFT FOR DISCUSSION
39
Table 3.3 reports revenue gains for both the 09/10 and 10/11 seasons in each district using the
listings survey. Column 1 reports the number of observations, column 2 the household gross
revenue per acres among non-beneficiaries in 1,000 TZS, column 3 reports the median
producer price of maize per Kg. 9
Column 4 reports the coefficient and robust standard errors
of being a beneficiary from the regression in (1), including the household variables discussed.
Thus, in Arusha becoming a beneficiary leads to an increase in revenue per acre of about
188,815 TZS. Columns 5-8 report the analogous information for paddy. Columns 2, 3 and 4
(and similarly for columns 6-8) show that increases in revenue per acre vary substantially due
to the geographical dispersion in yields and prices.
Table 3.3 shows substantial geographical dispersion. Revenue gains from paddy are less
precisely estimated than those of maize, despite the magnitudes are large in some districts.
These estimates control for household characteristics to make beneficiaries and non-
beneficiaries more comparable. As expected, the exclusion of such controls make a difference
to the estimates, suggesting that household level differences also affect the differences in
yields. Average maize yield gains per acre in 09/10 and 10/11 are about 420.31 Kg/Acre
when household controls are not included and about 348.89 Kg/Acre when they are included.
Another estimate comes from comparing the yields in plots where subsidized inputs were
used to the yields in plots where subsidized inputs were not used. The advantage of this
estimate is that one can net out household-level differences, but the disadvantage is that it
will be biased if pre-existing differences in plot characteristics or complementary investments
between the plots with and without subsidized inputs are important. This estimate produces a
maize yield gain of 432.84 Kg/Acre.10
Average paddy yield gains are about 286.51 Kg/Acre
without the inclusion of household-level covariates and 176.16 Kg/Acre. These gains in
Table 3.3 have to be compared to the costs both direct and indirect of the program to get a
rough sense of its cost-effectiveness (See next subsection for more details).
Table 3.4 reports the behavior of individuals that have been beneficiaries of the program for
at least three years by 2010/11, that is, individuals that should have graduated after the
2010/11 season. The data come from a random sample of graduates from the regions where
the program was originally rolled out and had been in existence for three years. As mentioned
when describing Table 3.1, around 60 percent of graduate households still claimed to receive
the vouchers in the 4th
year. This is possible because the beneficiary could now be another
household member.
The majority of NAIVS graduates are procuring inputs on their own, in the first year of no
longer benefiting from the voucher subsidy. The survey asked whether they had used
improved inputs in the past and as it turns out, around 70 percent of them did. The question is
9 Appendix 8 reports the consumer and producer prices collected at the village level. We rely on the market
producer price for the calculation of revenues.
10 The maize yield estimates computed using the differences-in-differences estimator are lower at
189.60Kg/Acre. However, the panel used in the estimation is unbalanced since there are many observations with
only baseline or follow-up information, as explained earlier in Section 3.1.7.
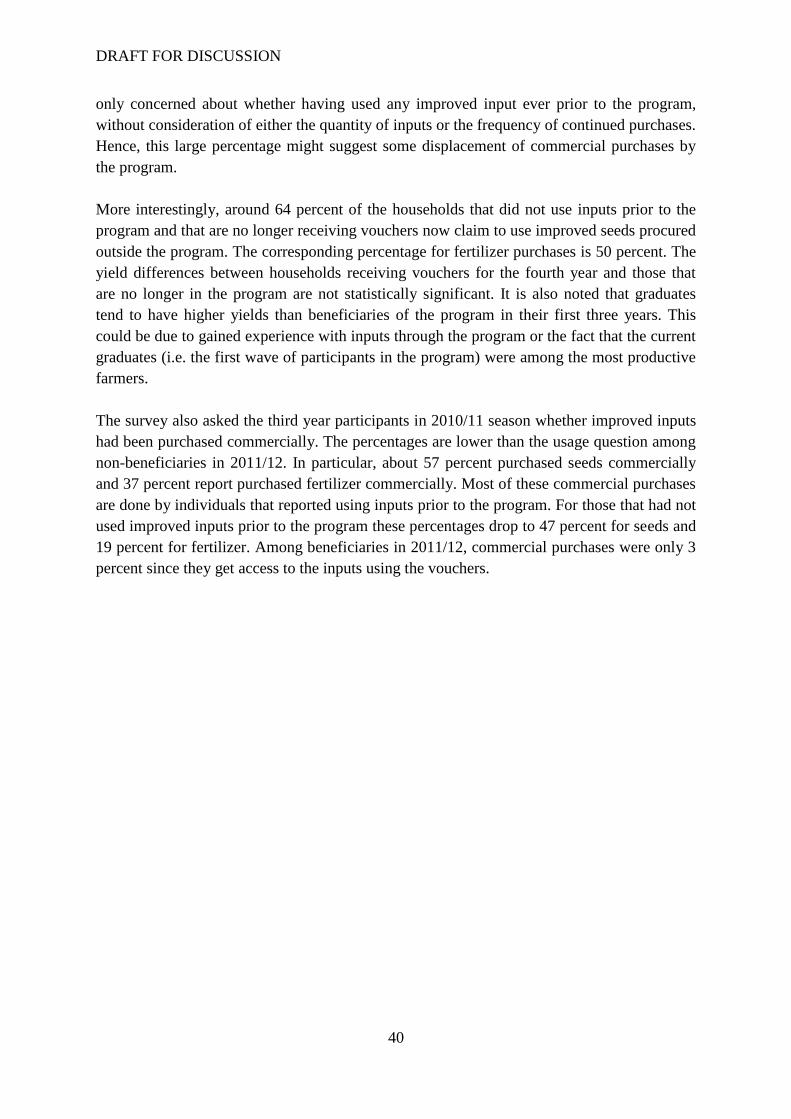
DRAFT FOR DISCUSSION
40
only concerned about whether having used any improved input ever prior to the program,
without consideration of either the quantity of inputs or the frequency of continued purchases.
Hence, this large percentage might suggest some displacement of commercial purchases by
the program.
More interestingly, around 64 percent of the households that did not use inputs prior to the
program and that are no longer receiving vouchers now claim to use improved seeds procured
outside the program. The corresponding percentage for fertilizer purchases is 50 percent. The
yield differences between households receiving vouchers for the fourth year and those that
are no longer in the program are not statistically significant. It is also noted that graduates
tend to have higher yields than beneficiaries of the program in their first three years. This
could be due to gained experience with inputs through the program or the fact that the current
graduates (i.e. the first wave of participants in the program) were among the most productive
farmers.
The survey also asked the third year participants in 2010/11 season whether improved inputs
had been purchased commercially. The percentages are lower than the usage question among
non-beneficiaries in 2011/12. In particular, about 57 percent purchased seeds commercially
and 37 percent report purchased fertilizer commercially. Most of these commercial purchases
are done by individuals that reported using inputs prior to the program. For those that had not
used improved inputs prior to the program these percentages drop to 47 percent for seeds and
19 percent for fertilizer. Among beneficiaries in 2011/12, commercial purchases were only 3
percent since they get access to the inputs using the vouchers.
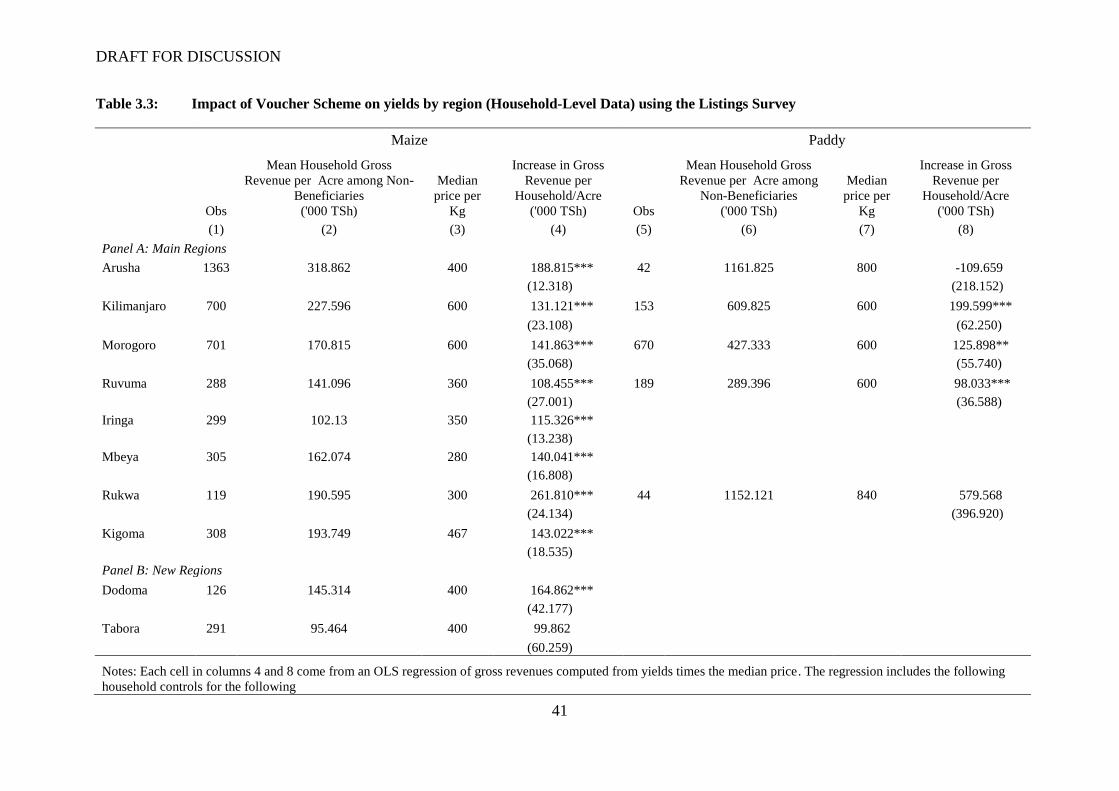
DRAFT FOR DISCUSSION
41
Table 3.3: Impact of Voucher Scheme on yields by region (Household-Level Data) using the Listings Survey
Maize Paddy
Obs
Mean Household Gross
Revenue per Acre among Non-
Beneficiaries
('000 TSh)
Median
price per
Kg
Increase in Gross
Revenue per
Household/Acre
('000 TSh) Obs
Mean Household Gross
Revenue per Acre among
Non-Beneficiaries
('000 TSh)
Median
price per
Kg
Increase in Gross
Revenue per
Household/Acre
('000 TSh)
(1) (2) (3) (4) (5) (6) (7) (8)
Panel A: Main Regions
Arusha 1363 318.862 400 188.815*** 42 1161.825 800 -109.659
(12.318) (218.152)
Kilimanjaro 700 227.596 600 131.121*** 153 609.825 600 199.599***
(23.108) (62.250)
Morogoro 701 170.815 600 141.863*** 670 427.333 600 125.898**
(35.068) (55.740)
Ruvuma 288 141.096 360 108.455*** 189 289.396 600 98.033***
(27.001) (36.588)
Iringa 299 102.13 350 115.326***
(13.238)
Mbeya 305 162.074 280 140.041***
(16.808)
Rukwa 119 190.595 300 261.810*** 44 1152.121 840 579.568
(24.134) (396.920)
Kigoma 308 193.749 467 143.022***
(18.535)
Panel B: New Regions
Dodoma 126 145.314 400 164.862***
(42.177)
Tabora 291 95.464 400 99.862
(60.259)
Notes: Each cell in columns 4 and 8 come from an OLS regression of gross revenues computed from yields times the median price. The regression includes the following
household controls for the following
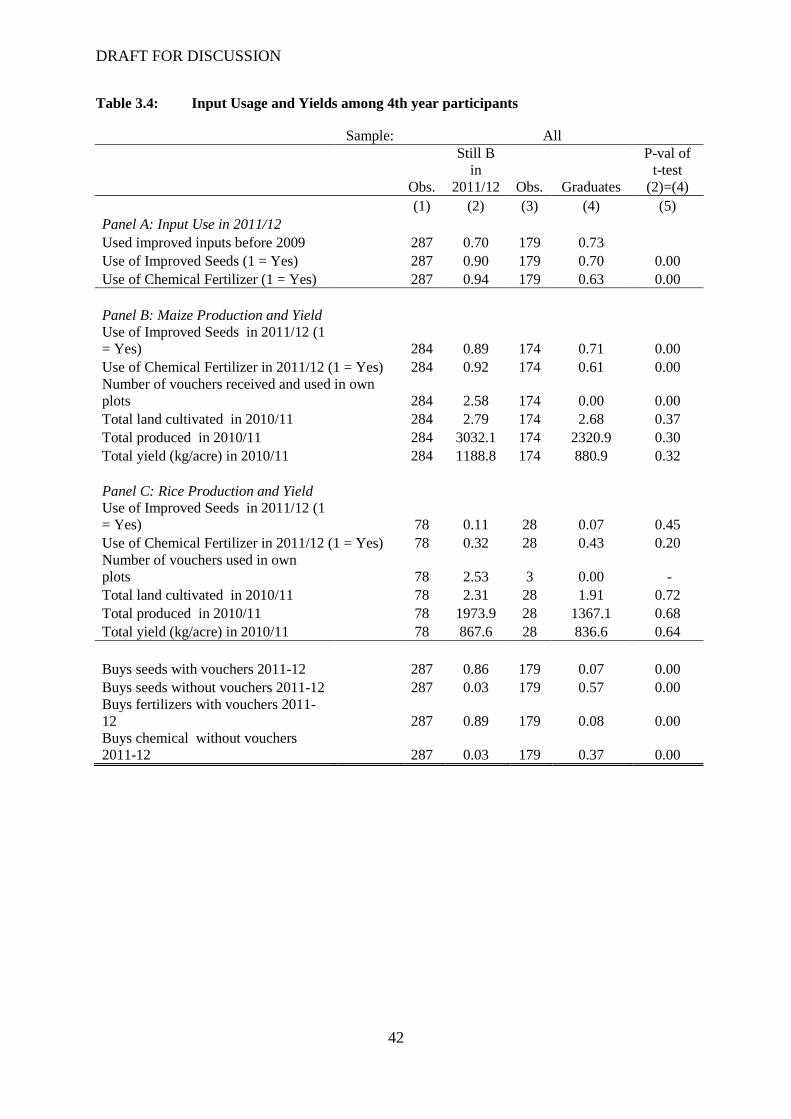
DRAFT FOR DISCUSSION
42
Table 3.4: Input Usage and Yields among 4th year participants
Sample: All
Obs.
Still B
in
2011/12 Obs. Graduates
P-val of
t-test
(2)=(4)
(1) (2) (3) (4) (5)
Panel A: Input Use in 2011/12
Used improved inputs before 2009 287 0.70 179 0.73
Use of Improved Seeds (1 = Yes) 287 0.90 179 0.70 0.00
Use of Chemical Fertilizer (1 = Yes) 287 0.94 179 0.63 0.00
Panel B: Maize Production and Yield Use of Improved Seeds in 2011/12 (1
= Yes) 284 0.89 174 0.71 0.00
Use of Chemical Fertilizer in 2011/12 (1 = Yes) 284 0.92 174 0.61 0.00 Number of vouchers received and used in own
plots 284 2.58 174 0.00 0.00
Total land cultivated in 2010/11 284 2.79 174 2.68 0.37
Total produced in 2010/11 284 3032.1 174 2320.9 0.30
Total yield (kg/acre) in 2010/11 284 1188.8 174 880.9 0.32
Panel C: Rice Production and Yield Use of Improved Seeds in 2011/12 (1
= Yes) 78 0.11 28 0.07 0.45
Use of Chemical Fertilizer in 2011/12 (1 = Yes) 78 0.32 28 0.43 0.20 Number of vouchers used in own
plots 78 2.53 3 0.00 -
Total land cultivated in 2010/11 78 2.31 28 1.91 0.72
Total produced in 2010/11 78 1973.9 28 1367.1 0.68
Total yield (kg/acre) in 2010/11 78 867.6 28 836.6 0.64
Buys seeds with vouchers 2011-12 287 0.86 179 0.07 0.00
Buys seeds without vouchers 2011-12 287 0.03 179 0.57 0.00 Buys fertilizers with vouchers 2011-
12 287 0.89 179 0.08 0.00 Buys chemical without vouchers
2011-12 287 0.03 179 0.37 0.00
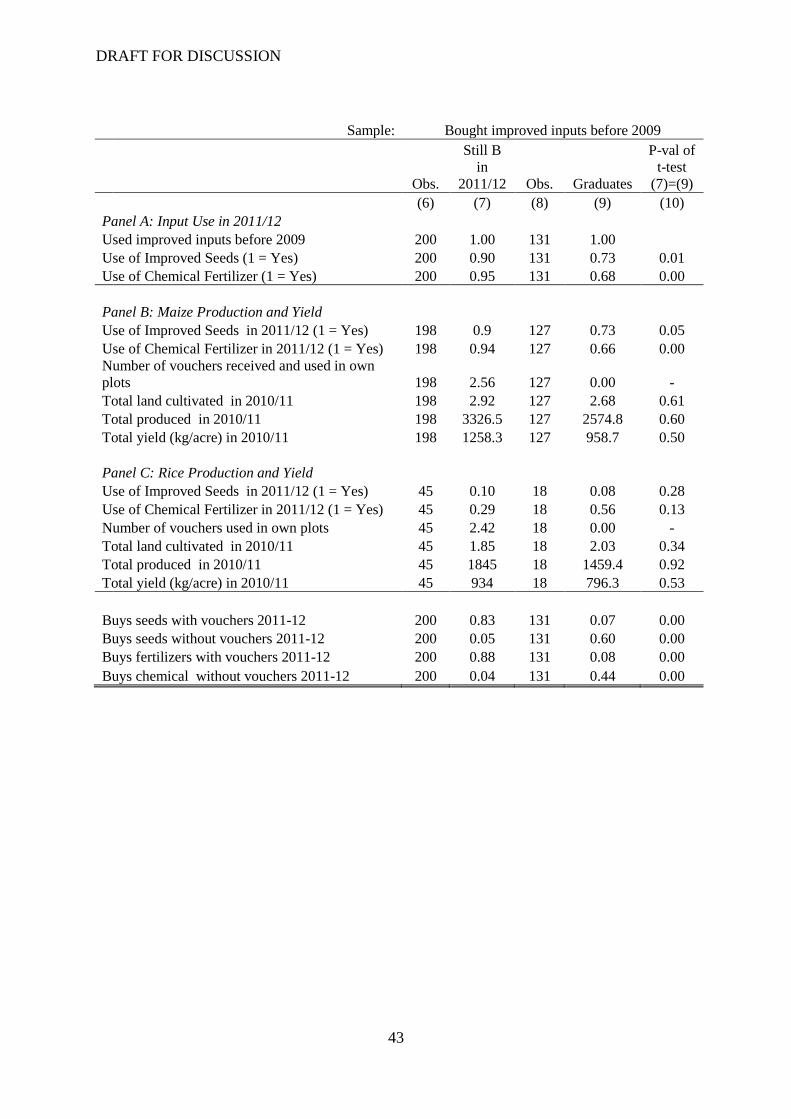
DRAFT FOR DISCUSSION
43
Sample: Bought improved inputs before 2009
Obs.
Still B
in
2011/12 Obs. Graduates
P-val of
t-test
(7)=(9)
(6) (7) (8) (9) (10)
Panel A: Input Use in 2011/12
Used improved inputs before 2009 200 1.00 131 1.00
Use of Improved Seeds (1 = Yes) 200 0.90 131 0.73 0.01
Use of Chemical Fertilizer (1 = Yes) 200 0.95 131 0.68 0.00
Panel B: Maize Production and Yield
Use of Improved Seeds in 2011/12 (1 = Yes) 198 0.9 127 0.73 0.05
Use of Chemical Fertilizer in 2011/12 (1 = Yes) 198 0.94 127 0.66 0.00 Number of vouchers received and used in own
plots 198 2.56 127 0.00 -
Total land cultivated in 2010/11 198 2.92 127 2.68 0.61
Total produced in 2010/11 198 3326.5 127 2574.8 0.60
Total yield (kg/acre) in 2010/11 198 1258.3 127 958.7 0.50
Panel C: Rice Production and Yield
Use of Improved Seeds in 2011/12 (1 = Yes) 45 0.10 18 0.08 0.28
Use of Chemical Fertilizer in 2011/12 (1 = Yes) 45 0.29 18 0.56 0.13
Number of vouchers used in own plots 45 2.42 18 0.00 -
Total land cultivated in 2010/11 45 1.85 18 2.03 0.34
Total produced in 2010/11 45 1845 18 1459.4 0.92
Total yield (kg/acre) in 2010/11 45 934 18 796.3 0.53
Buys seeds with vouchers 2011-12 200 0.83 131 0.07 0.00
Buys seeds without vouchers 2011-12 200 0.05 131 0.60 0.00
Buys fertilizers with vouchers 2011-12 200 0.88 131 0.08 0.00
Buys chemical without vouchers 2011-12 200 0.04 131 0.44 0.00
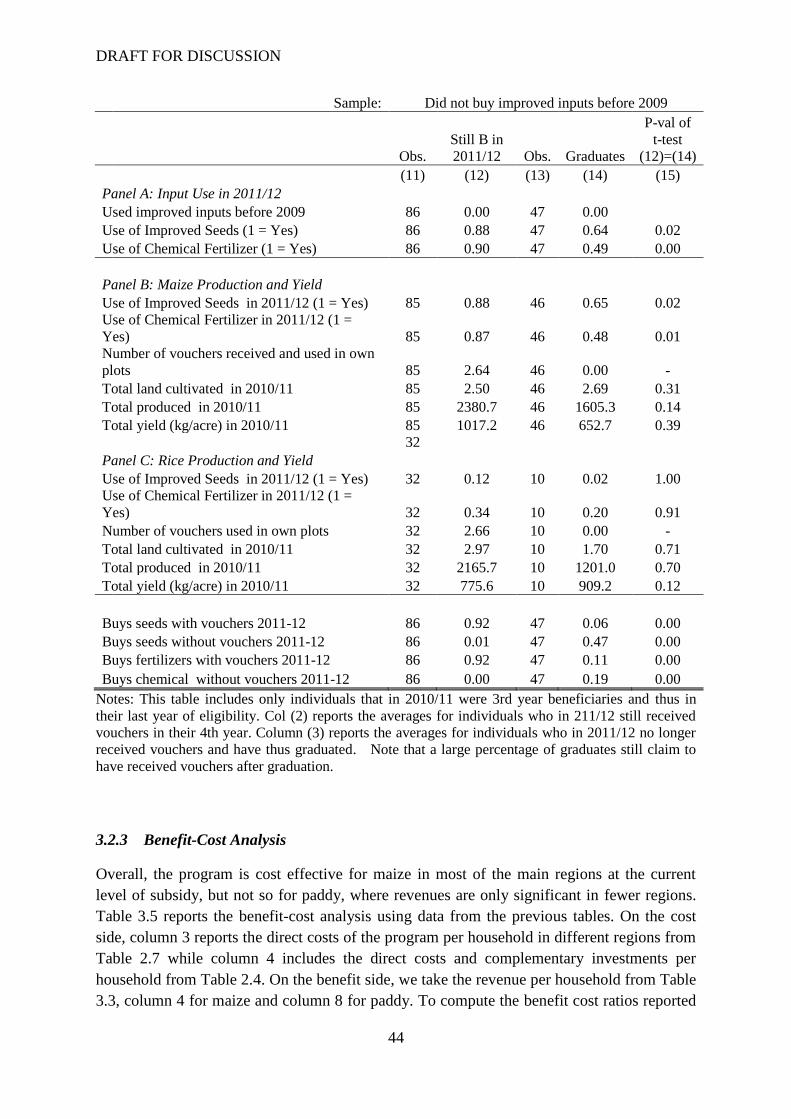
DRAFT FOR DISCUSSION
44
Sample: Did not buy improved inputs before 2009
Obs. Still B in
2011/12 Obs. Graduates
P-val of
t-test
(12)=(14)
(11) (12) (13) (14) (15)
Panel A: Input Use in 2011/12
Used improved inputs before 2009 86 0.00 47 0.00
Use of Improved Seeds (1 = Yes) 86 0.88 47 0.64 0.02
Use of Chemical Fertilizer (1 = Yes) 86 0.90 47 0.49 0.00
Panel B: Maize Production and Yield
Use of Improved Seeds in 2011/12 (1 = Yes) 85 0.88 46 0.65 0.02 Use of Chemical Fertilizer in 2011/12 (1 =
Yes) 85 0.87 46 0.48 0.01 Number of vouchers received and used in own
plots 85 2.64 46 0.00 -
Total land cultivated in 2010/11 85 2.50 46 2.69 0.31
Total produced in 2010/11 85 2380.7 46 1605.3 0.14
Total yield (kg/acre) in 2010/11 85 1017.2 46 652.7 0.39 32
Panel C: Rice Production and Yield
Use of Improved Seeds in 2011/12 (1 = Yes) 32 0.12 10 0.02 1.00 Use of Chemical Fertilizer in 2011/12 (1 =
Yes) 32 0.34 10 0.20 0.91
Number of vouchers used in own plots 32 2.66 10 0.00 -
Total land cultivated in 2010/11 32 2.97 10 1.70 0.71
Total produced in 2010/11 32 2165.7 10 1201.0 0.70
Total yield (kg/acre) in 2010/11 32 775.6 10 909.2 0.12
Buys seeds with vouchers 2011-12 86 0.92 47 0.06 0.00
Buys seeds without vouchers 2011-12 86 0.01 47 0.47 0.00
Buys fertilizers with vouchers 2011-12 86 0.92 47 0.11 0.00
Buys chemical without vouchers 2011-12 86 0.00 47 0.19 0.00
Notes: This table includes only individuals that in 2010/11 were 3rd year beneficiaries and thus in
their last year of eligibility. Col (2) reports the averages for individuals who in 211/12 still received
vouchers in their 4th year. Column (3) reports the averages for individuals who in 2011/12 no longer
received vouchers and have thus graduated. Note that a large percentage of graduates still claim to
have received vouchers after graduation.
3.2.3 Benefit-Cost Analysis
Overall, the program is cost effective for maize in most of the main regions at the current
level of subsidy, but not so for paddy, where revenues are only significant in fewer regions.
Table 3.5 reports the benefit-cost analysis using data from the previous tables. On the cost
side, column 3 reports the direct costs of the program per household in different regions from
Table 2.7 while column 4 includes the direct costs and complementary investments per
household from Table 2.4. On the benefit side, we take the revenue per household from Table
3.3, column 4 for maize and column 8 for paddy. To compute the benefit cost ratios reported
DRAFT FOR DISCUSSION
45
in columns 8 and 9 we subtract the top-up amount needed to purchase the inputs using the
three vouchers from the revenue per household, amounting to 50 percent of the subsidy, and
divide this measure of net revenue by the all-in costs of the program per household of column
4. The results in Panel A suggest positive but disperse benefit-cost ratios for maize in all
regions, where revenues are positive and significant. We note that in two of the 8 main
regions, the benefit-cost ratios are less than 100 percent, suggesting that for every TZS
invested in the program, the return is less than one TZS. Put differently, without the subsidy,
it would not be profitable to invest in improved inputs as columns 10 and 11 compute. For
paddy, revenues are only positive and significant in three out of the 8 main regions. Even
when they are significant, the benefit-cost ratio reveals modest returns. Panel B reports the
results for new regions with poorer agro-climatic conditions. The returns to the program for
maize are positive and significant in Dodoma but not in Tabora. Similarly to Panel A, the
revenues per household for paddy are never statistically significant.
Columns 10 and 11 compute the benefit-cost ratio if the subsidy and hence the program was
removed altogether. The benefit-cost ratio in this case is the revenue net of the full cost of the
inputs divided by the full cost of the inputs. Table 3.5 suggests that while maize is profitable
even without subsidy in 7 of the 10 regions, paddy is only profitable in one region.
Overall, the benefit-cost ratio for maize across all regions is 130.05 percent with a 50 percent
subsidy and 21.26 percent without subsidy. The ratios for paddy are 65.83 percent and -16.02
percent, respectively. Therefore, at least for maize the NAIVS program has met with some
success its education objective by contributing to the increase in adoption rates for improved
seed and fertilizer. This increase in adoption rates has contributed to higher production both
during the program and on a sustained basis after the program (as evidenced by the
experience of graduates that are no longer beneficiaries in 2011/12). In addition, the food
security of participating households has improved.
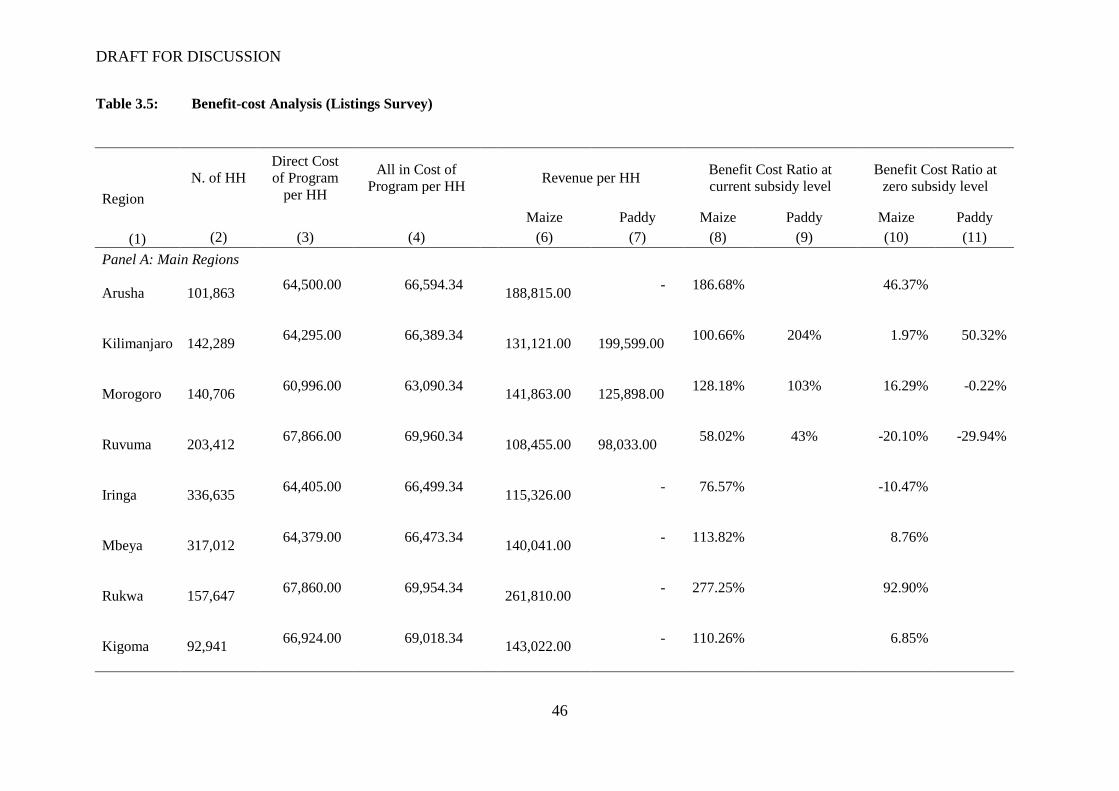
DRAFT FOR DISCUSSION
46
Table 3.5: Benefit-cost Analysis (Listings Survey)
Region
N. of HH Direct Cost
of Program
per HH
All in Cost of
Program per HH Revenue per HH
Benefit Cost Ratio at
current subsidy level Benefit Cost Ratio at
zero subsidy level
Maize Paddy Maize Paddy Maize Paddy
(1) (2) (3) (4) (6) (7) (8) (9) (10) (11)
Panel A: Main Regions
Arusha
101,863 64,500.00 66,594.34
188,815.00 - 186.68% 46.37%
Kilimanjaro
142,289 64,295.00 66,389.34
131,121.00
199,599.00 100.66% 204% 1.97% 50.32%
Morogoro
140,706 60,996.00 63,090.34
141,863.00
125,898.00 128.18% 103% 16.29% -0.22%
Ruvuma
203,412 67,866.00 69,960.34
108,455.00
98,033.00 58.02% 43% -20.10% -29.94%
Iringa
336,635 64,405.00 66,499.34
115,326.00 - 76.57% -10.47%
Mbeya
317,012 64,379.00 66,473.34
140,041.00 - 113.82% 8.76%
Rukwa
157,647 67,860.00 69,954.34
261,810.00 - 277.25% 92.90%
Kigoma
92,941 66,924.00 69,018.34
143,022.00 - 110.26% 6.85%
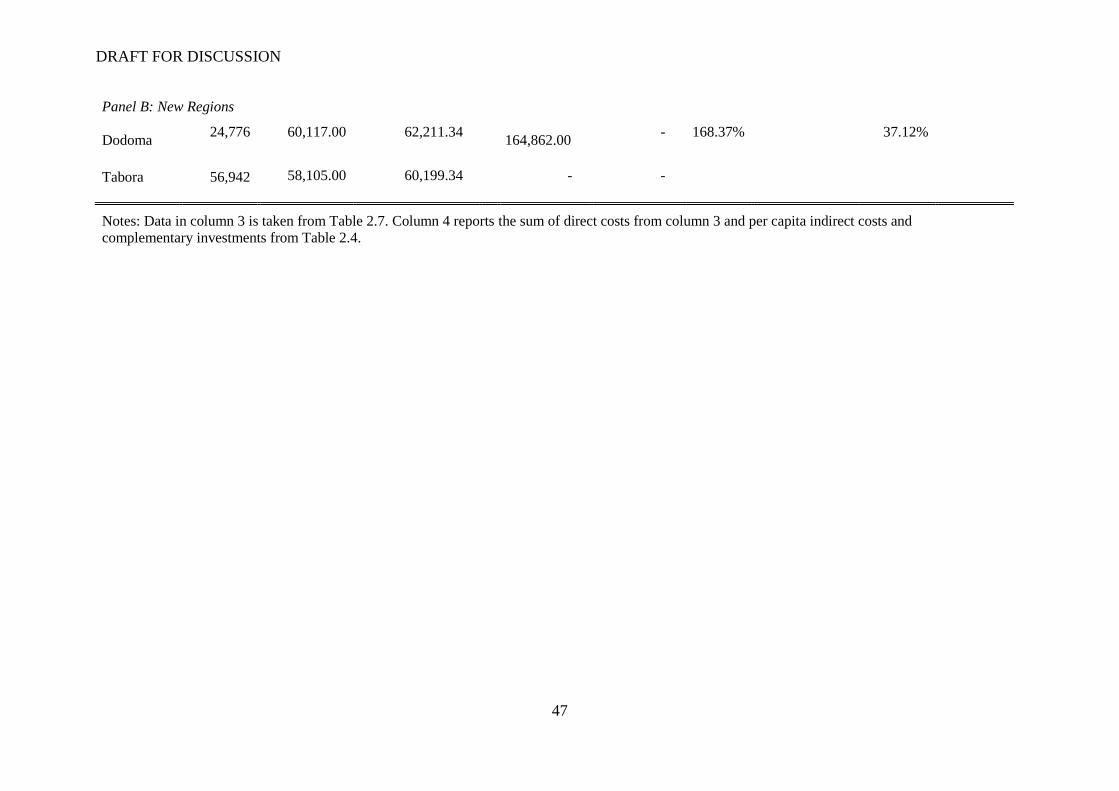
DRAFT FOR DISCUSSION
47
Panel B: New Regions
Dodoma 24,776 60,117.00 62,211.34
164,862.00 - 168.37% 37.12%
Tabora 56,942 58,105.00 60,199.34 - -
Notes: Data in column 3 is taken from Table 2.7. Column 4 reports the sum of direct costs from column 3 and per capita indirect costs and
complementary investments from Table 2.4.
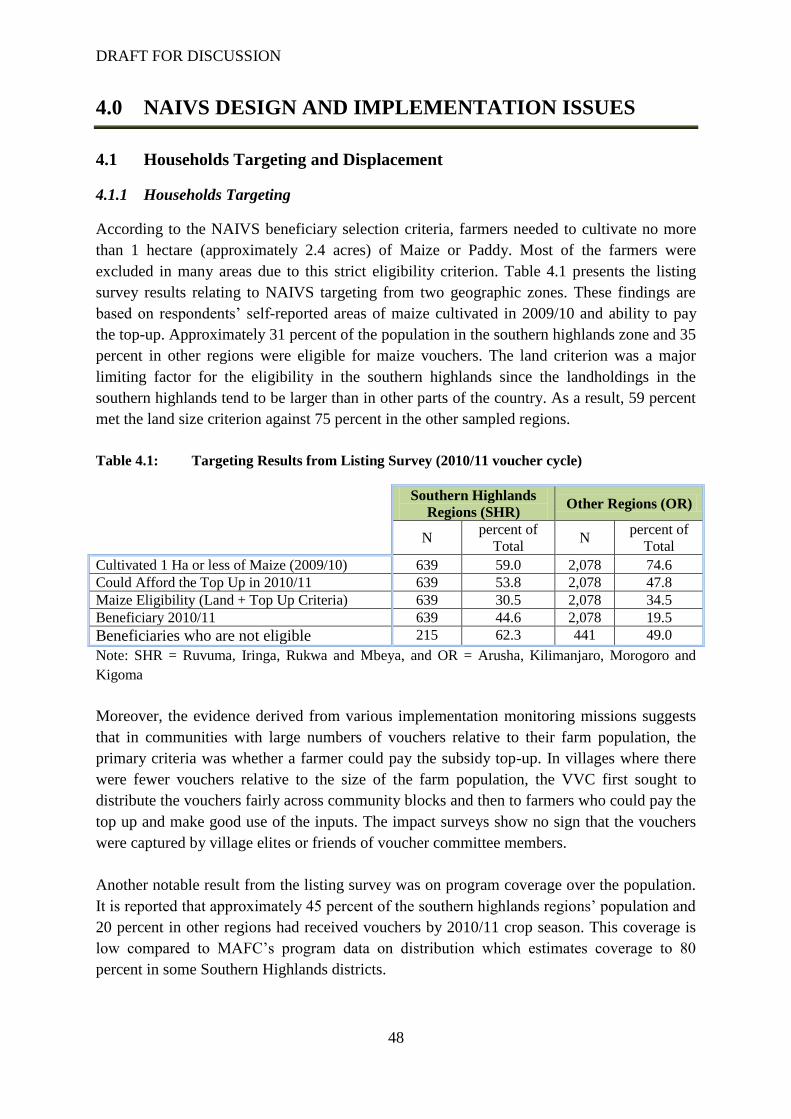
DRAFT FOR DISCUSSION
48
4.0 NAIVS DESIGN AND IMPLEMENTATION ISSUES
4.1 Households Targeting and Displacement
4.1.1 Households Targeting
According to the NAIVS beneficiary selection criteria, farmers needed to cultivate no more
than 1 hectare (approximately 2.4 acres) of Maize or Paddy. Most of the farmers were
excluded in many areas due to this strict eligibility criterion. Table 4.1 presents the listing
survey results relating to NAIVS targeting from two geographic zones. These findings are
based on respondents‟ self-reported areas of maize cultivated in 2009/10 and ability to pay
the top-up. Approximately 31 percent of the population in the southern highlands zone and 35
percent in other regions were eligible for maize vouchers. The land criterion was a major
limiting factor for the eligibility in the southern highlands since the landholdings in the
southern highlands tend to be larger than in other parts of the country. As a result, 59 percent
met the land size criterion against 75 percent in the other sampled regions.
Table 4.1: Targeting Results from Listing Survey (2010/11 voucher cycle)
Southern Highlands
Regions (SHR) Other Regions (OR)
N
percent of
Total N
percent of
Total
Cultivated 1 Ha or less of Maize (2009/10) 639 59.0 2,078 74.6
Could Afford the Top Up in 2010/11 639 53.8 2,078 47.8
Maize Eligibility (Land + Top Up Criteria) 639 30.5 2,078 34.5
Beneficiary 2010/11 639 44.6 2,078 19.5
Beneficiaries who are not eligible 215 62.3 441 49.0
Note: SHR = Ruvuma, Iringa, Rukwa and Mbeya, and OR = Arusha, Kilimanjaro, Morogoro and
Kigoma
Moreover, the evidence derived from various implementation monitoring missions suggests
that in communities with large numbers of vouchers relative to their farm population, the
primary criteria was whether a farmer could pay the subsidy top-up. In villages where there
were fewer vouchers relative to the size of the farm population, the VVC first sought to
distribute the vouchers fairly across community blocks and then to farmers who could pay the
top up and make good use of the inputs. The impact surveys show no sign that the vouchers
were captured by village elites or friends of voucher committee members.
Another notable result from the listing survey was on program coverage over the population.
It is reported that approximately 45 percent of the southern highlands regions‟ population and
20 percent in other regions had received vouchers by 2010/11 crop season. This coverage is
low compared to MAFC‟s program data on distribution which estimates coverage to 80
percent in some Southern Highlands districts.
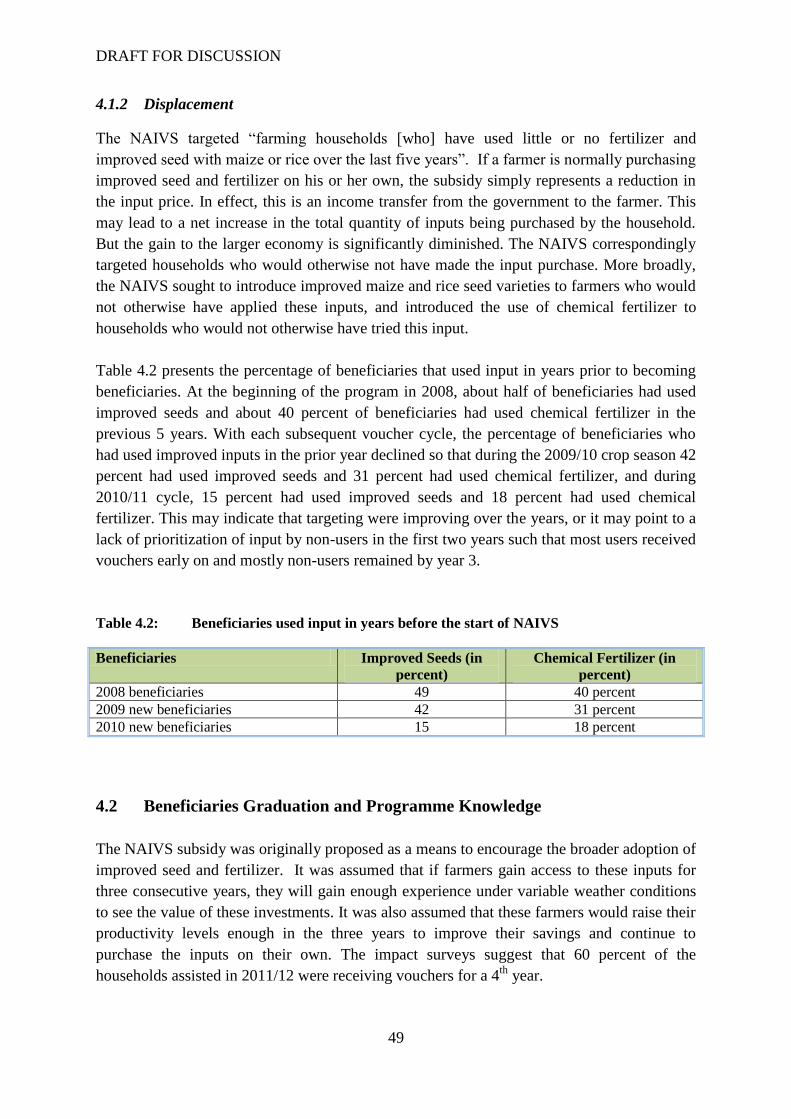
DRAFT FOR DISCUSSION
49
4.1.2 Displacement
The NAIVS targeted “farming households [who] have used little or no fertilizer and
improved seed with maize or rice over the last five years”. If a farmer is normally purchasing
improved seed and fertilizer on his or her own, the subsidy simply represents a reduction in
the input price. In effect, this is an income transfer from the government to the farmer. This
may lead to a net increase in the total quantity of inputs being purchased by the household.
But the gain to the larger economy is significantly diminished. The NAIVS correspondingly
targeted households who would otherwise not have made the input purchase. More broadly,
the NAIVS sought to introduce improved maize and rice seed varieties to farmers who would
not otherwise have applied these inputs, and introduced the use of chemical fertilizer to
households who would not otherwise have tried this input.
Table 4.2 presents the percentage of beneficiaries that used input in years prior to becoming
beneficiaries. At the beginning of the program in 2008, about half of beneficiaries had used
improved seeds and about 40 percent of beneficiaries had used chemical fertilizer in the
previous 5 years. With each subsequent voucher cycle, the percentage of beneficiaries who
had used improved inputs in the prior year declined so that during the 2009/10 crop season 42
percent had used improved seeds and 31 percent had used chemical fertilizer, and during
2010/11 cycle, 15 percent had used improved seeds and 18 percent had used chemical
fertilizer. This may indicate that targeting were improving over the years, or it may point to a
lack of prioritization of input by non-users in the first two years such that most users received
vouchers early on and mostly non-users remained by year 3.
Table 4.2: Beneficiaries used input in years before the start of NAIVS
Beneficiaries Improved Seeds (in
percent)
Chemical Fertilizer (in
percent)
2008 beneficiaries 49 40 percent
2009 new beneficiaries 42 31 percent
2010 new beneficiaries 15 18 percent
4.2 Beneficiaries Graduation and Programme Knowledge
The NAIVS subsidy was originally proposed as a means to encourage the broader adoption of
improved seed and fertilizer. It was assumed that if farmers gain access to these inputs for
three consecutive years, they will gain enough experience under variable weather conditions
to see the value of these investments. It was also assumed that these farmers would raise their
productivity levels enough in the three years to improve their savings and continue to
purchase the inputs on their own. The impact surveys suggest that 60 percent of the
households assisted in 2011/12 were receiving vouchers for a 4th
year.
DRAFT FOR DISCUSSION
50
We also know that in some of the villages where there were far fewer vouchers than eligible
participants, vouchers were rotated across community members. This was simply viewed as a
fairer means to share the subsidy and broaden the understanding of the value of the improved
inputs that helping perhaps 15 percent of the eligible households for three years while 85
percent never benefit. It is difficult to find the graduates in most of the villages partly because
while the subsidy is for farmer for 3 consecutive years, some villages did not follow the rule
and they kept rotating in households. In effect, the three year eligibility rule was commonly,
but inconsistently applied.
In terms of knowledge of the input program, the evidence reveals a persistent gap in
information among the key players particularly at the lower level such as the farming
household and village committees. For example, household survey results show that the
awareness level related to the rules and procedures of the NAIVS among the farmers and
VVC members is low, despite the fact that the general awareness of the voucher program is
high, and that 88 percent of the listing sample had heard of the program. There is some
indication that households were not universally clear about the procedures for program
eligibility and goals. In terms of the 3-year duration of subsidy (or 3-year rule for receiving
the subsidy), the findings show that only 6 percent of households knew of the limit, while 25
percent thought the subsidy would be provided indefinitely. According to ACT (2012) in
some districts such as Moshi rural conflicts arouse because some farmers want to receive
voucher beyond three years. This is mainly because the farmers do not know or they
misunderstand the whole procedure since they were not properly enlightened. Such a
discrepancy is likely to affect implementation performance of the program.
4.3 Input Market Access and Public Awareness
The main constraints faced by farmers in terms of improved input adoption are lack of market
access and the high price of inputs. The three year commitment of NAIVS program, backed
by training of agro-dealers was also viewed adequate to encourage sustained investment in
village retail shops that would continue to sell seed and fertilizer after the subsidy ended. This
is important because the accessibility of these inputs is viewed to be a major determinant of
the levels of commercial purchase. If farmers have to travel to a distant town to look for seed
or fertilizer with uncertainty about prices and availability, commercial sales will decline.
Many of the agro-dealers initially providing inputs under the program have withdrawn their
services from village markets when the demand for their inputs was no longer guaranteed by
the vouchers. While the agro-dealers were required to set up shops in the villages in order to
participate, many of these shops were seasonal and rented on a short term basis. This is
sensible because grain seed and chemical fertilizer sales are highly seasonal, strongest around
the planting season. Agro-dealer investments may also have been undermined by the change
in the rules of the program in the latest 2012/13 season. This past year agro-dealers were
selected by wholesalers rather than the district officials, meaning that some may be new to
the communities. This strategy offers the prospect of a stronger sustained linkage between the
national wholesale to retail supply chain. Further, the success of this chain is more dependent
on a consistent flow of growing quantities of inputs, implying an incentive to work harder to
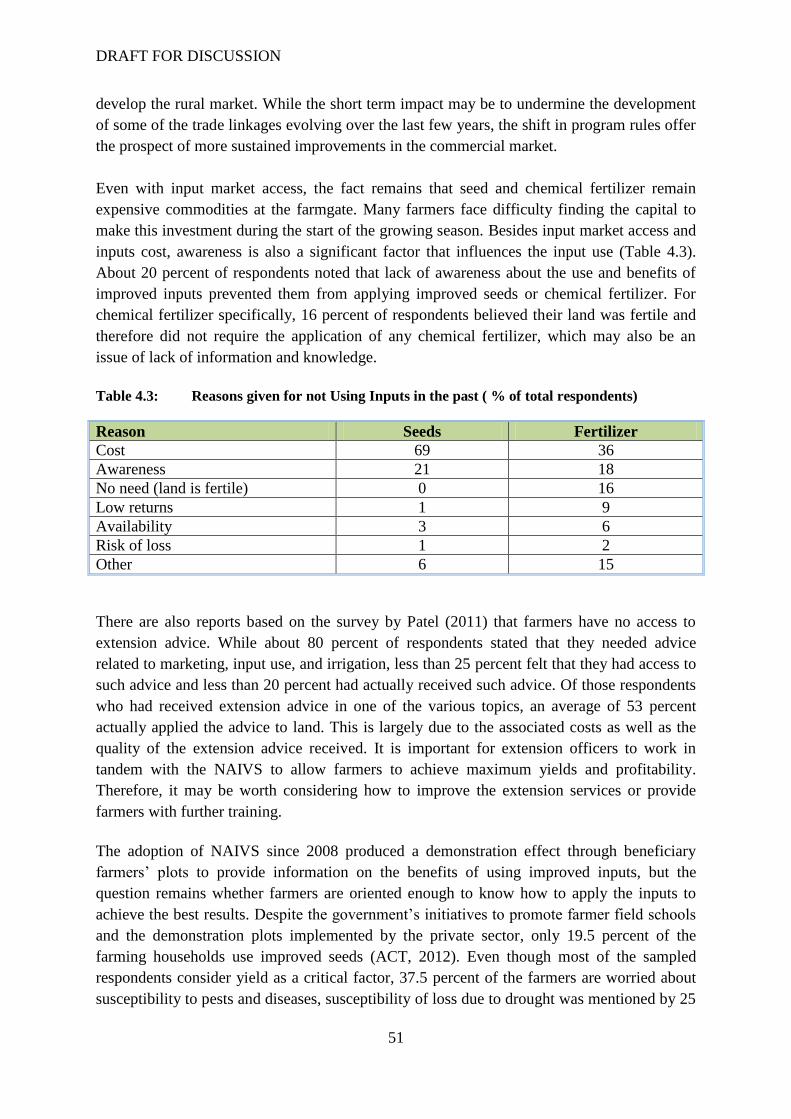
DRAFT FOR DISCUSSION
51
develop the rural market. While the short term impact may be to undermine the development
of some of the trade linkages evolving over the last few years, the shift in program rules offer
the prospect of more sustained improvements in the commercial market.
Even with input market access, the fact remains that seed and chemical fertilizer remain
expensive commodities at the farmgate. Many farmers face difficulty finding the capital to
make this investment during the start of the growing season. Besides input market access and
inputs cost, awareness is also a significant factor that influences the input use (Table 4.3).
About 20 percent of respondents noted that lack of awareness about the use and benefits of
improved inputs prevented them from applying improved seeds or chemical fertilizer. For
chemical fertilizer specifically, 16 percent of respondents believed their land was fertile and
therefore did not require the application of any chemical fertilizer, which may also be an
issue of lack of information and knowledge.
Table 4.3: Reasons given for not Using Inputs in the past ( % of total respondents)
Reason Seeds Fertilizer
Cost 69 36
Awareness 21 18
No need (land is fertile) 0 16
Low returns 1 9
Availability 3 6
Risk of loss 1 2
Other 6 15
There are also reports based on the survey by Patel (2011) that farmers have no access to
extension advice. While about 80 percent of respondents stated that they needed advice
related to marketing, input use, and irrigation, less than 25 percent felt that they had access to
such advice and less than 20 percent had actually received such advice. Of those respondents
who had received extension advice in one of the various topics, an average of 53 percent
actually applied the advice to land. This is largely due to the associated costs as well as the
quality of the extension advice received. It is important for extension officers to work in
tandem with the NAIVS to allow farmers to achieve maximum yields and profitability.
Therefore, it may be worth considering how to improve the extension services or provide
farmers with further training.
The adoption of NAIVS since 2008 produced a demonstration effect through beneficiary
farmers‟ plots to provide information on the benefits of using improved inputs, but the
question remains whether farmers are oriented enough to know how to apply the inputs to
achieve the best results. Despite the government‟s initiatives to promote farmer field schools
and the demonstration plots implemented by the private sector, only 19.5 percent of the
farming households use improved seeds (ACT, 2012). Even though most of the sampled
respondents consider yield as a critical factor, 37.5 percent of the farmers are worried about
susceptibility to pests and diseases, susceptibility of loss due to drought was mentioned by 25
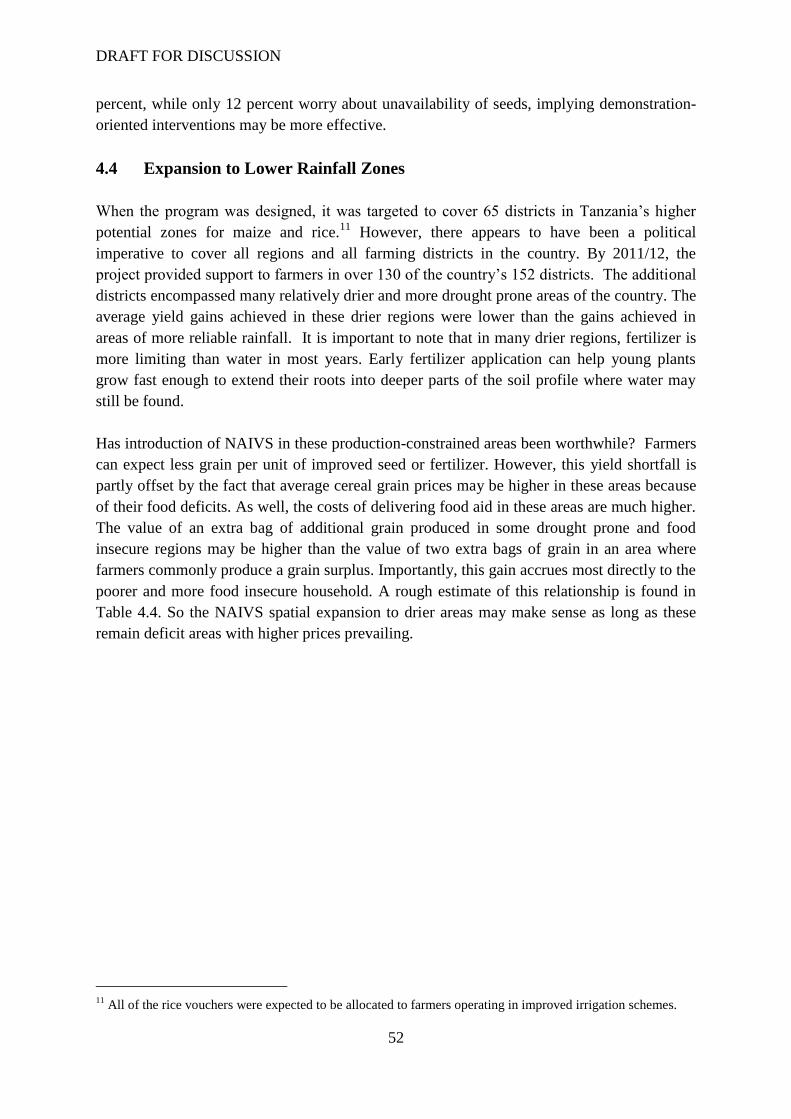
DRAFT FOR DISCUSSION
52
percent, while only 12 percent worry about unavailability of seeds, implying demonstration-
oriented interventions may be more effective.
4.4 Expansion to Lower Rainfall Zones
When the program was designed, it was targeted to cover 65 districts in Tanzania‟s higher
potential zones for maize and rice.11
However, there appears to have been a political
imperative to cover all regions and all farming districts in the country. By 2011/12, the
project provided support to farmers in over 130 of the country‟s 152 districts. The additional
districts encompassed many relatively drier and more drought prone areas of the country. The
average yield gains achieved in these drier regions were lower than the gains achieved in
areas of more reliable rainfall. It is important to note that in many drier regions, fertilizer is
more limiting than water in most years. Early fertilizer application can help young plants
grow fast enough to extend their roots into deeper parts of the soil profile where water may
still be found.
Has introduction of NAIVS in these production-constrained areas been worthwhile? Farmers
can expect less grain per unit of improved seed or fertilizer. However, this yield shortfall is
partly offset by the fact that average cereal grain prices may be higher in these areas because
of their food deficits. As well, the costs of delivering food aid in these areas are much higher.
The value of an extra bag of additional grain produced in some drought prone and food
insecure regions may be higher than the value of two extra bags of grain in an area where
farmers commonly produce a grain surplus. Importantly, this gain accrues most directly to the
poorer and more food insecure household. A rough estimate of this relationship is found in
Table 4.4. So the NAIVS spatial expansion to drier areas may make sense as long as these
remain deficit areas with higher prices prevailing.
11
All of the rice vouchers were expected to be allocated to farmers operating in improved irrigation schemes.
DRAFT FOR DISCUSSION
53
Table 4.4: Average yield gain of farmers with and without vouchers by higher and lower
rainfall district
Higher Rainfall District Lower Rainfall District
Average maize yield without
vouchers (kg/acre) 453.6 386.5
Average maize yield with
vouchers (kg/acre) 925 732.3
Yield gain obtained from the
use of vouchers (kg/acre) 471.4 345.8
Average farmgate price of
grain (Tsh) 300 550
Value of yield gain (Tsh) at
farmgate prices 141,420 190,190
Average cost of food aid
imports (Tsh/kg) - 800
Value of yield gain (Tsh) at
food aid prices - 276,640
Note: Survey results were gathered from the higher rainfall districts (Ruvuma, Iringa, Rukwa, Mbeya,
Kigoma, Morogoro, Arusha and Kilimanjaro) and lower rainfall districts (Tabora and Dodoma) for
the 2011/12 crop seasons.
4.5 Sustainability
Farmers in the country are becoming accustomed to the use of improved maize and rice seed
and chemical fertilizer. But they are also more accustomed to the input subsidy. The growing
interest in these inputs has translated into more loudly voiced concerns that these inputs are
too expensive (especially as the subsidy is withdrawn). Calls for a three year voucher
program designed to promote the adoption of improved inputs have evolved into calls for
continuing subsidies and agricultural credit to help make the inputs „affordable‟ and resolve
farm cash flow constraints. Hence, the most significant question is whether farmers who had
received the vouchers for three consecutive years went on to purchase these inputs on their
own. In particular, what proportion of the households newly introduced to the use of
improved maize seed and fertilizer were now purchasing these inputs on their own.
The impact assessment survey data indicate that 47 percent of the voucher graduates who had
not used improved inputs prior to the program are continuing to purchase improved seed.
This is an unexpectedly high number given that a significant share of the improved seed was
of open pollinated varieties allowing seed to be retained from the previous season‟s harvest.
This suggests a sustained payoff extending well beyond the period of the subsidy program.
The survey data suggest a much smaller proportion of voucher graduates (19 percent) who
had not used fertilizer before the program, decided to purchase this on their own in 2011/12.
This is nonetheless a significant gain. In complement, approximately 44 percent of the
voucher graduates who had previously tried seed or fertilizer before 2009 decided to purchase
DRAFT FOR DISCUSSION
54
chemical fertilizer on their own in 2011/12. Overall, about 57 percent of the graduates
continued to buy improved seed. This coincides with comments received from both fertilizer
and seed companies that their commercial sales were increasing in the aftermath of the
subsidy program.
Even though adoption rates of improved inputs increases both during the program and or a
majority of graduating farmers in the first year after exiting the program, it is difficult to
maintain or improve the results further in a long run considering the cost of the subsidy
program. Thus, we need to ask, Should the government aim to continue subsidizing crop
inputs in order to keep the prices „more affordable” – effectively as an income transfer? Or
are there alternative market based solutions for achieving the similar objectives?
The investment programs proposed in the Big Results Now laboratories12
primarily target the
objective of making maize and rice production more profitable. The maize program
principally targets the improvement of production returns by helping farmers make use of
warehouse based crop storage systems that facilitate the exploitation of price seasonality and
the opportunities for achieving better farmgate prices through bulk sales. These warehouse
operations can also be used to facilitate the bulk purchase of crop inputs.
The Big Results Now proposal for paddy seeks a combination of improvements in production
and market productivity through the pursuit of better crop management through block
farming as well as a similar warehousing arrangement as that proposed for maize. This could
help resolve the questions raised by the NAIVS impact assessment of how the agronomic
performance derived from the improved inputs can be further improved. In either case, if
farmers obtain a higher farmgate price for their production, they will find the crop more
profitable and the input investment more acceptable.
There are similarly multiple ways to help farmers resolve the cash flow constraint in the face
of limited credit markets and high borrowing costs. These include various opportunities to
link input purchases more closely with crop sales – so that when a farmer has the money from
crop sales, he or she can immediately allocate a portion of this to purchasing the next
season‟s inputs. There is also a growing interest in alternative types of rural savings schemes
that may allow a farmer to commit a part of their savings to input purchase ahead of time.
And there is a new wave of experimentation with cellphone based money transfer programs
that improve the linkages between input buyers and sellers – potentially further reducing
these transaction costs and assuring that purchase are possible when money is available.
Therefore, these options merit further evaluation so as to inform choices before any decisions
are be made on program modalities.
12
The agriculture sector is among the six key sectors selected for accelerating delivery of quick results under the
Government‟s recent initiative, the “Big Results Now” (BRN), which is supported by six sector labs. The BRN
Agriculture Lab developed comprehensive investment plans and a comprehensive implementation and
monitoring framework to aid in the achievement of quick results by 2015. The initiative is aimed at accelerating
the implementation of the Agricultural Sector Development Strategy (ASDS, 2001) towards Vision 2025,
focusing on increasing food security, smallholder income and agriculture GDP growth.
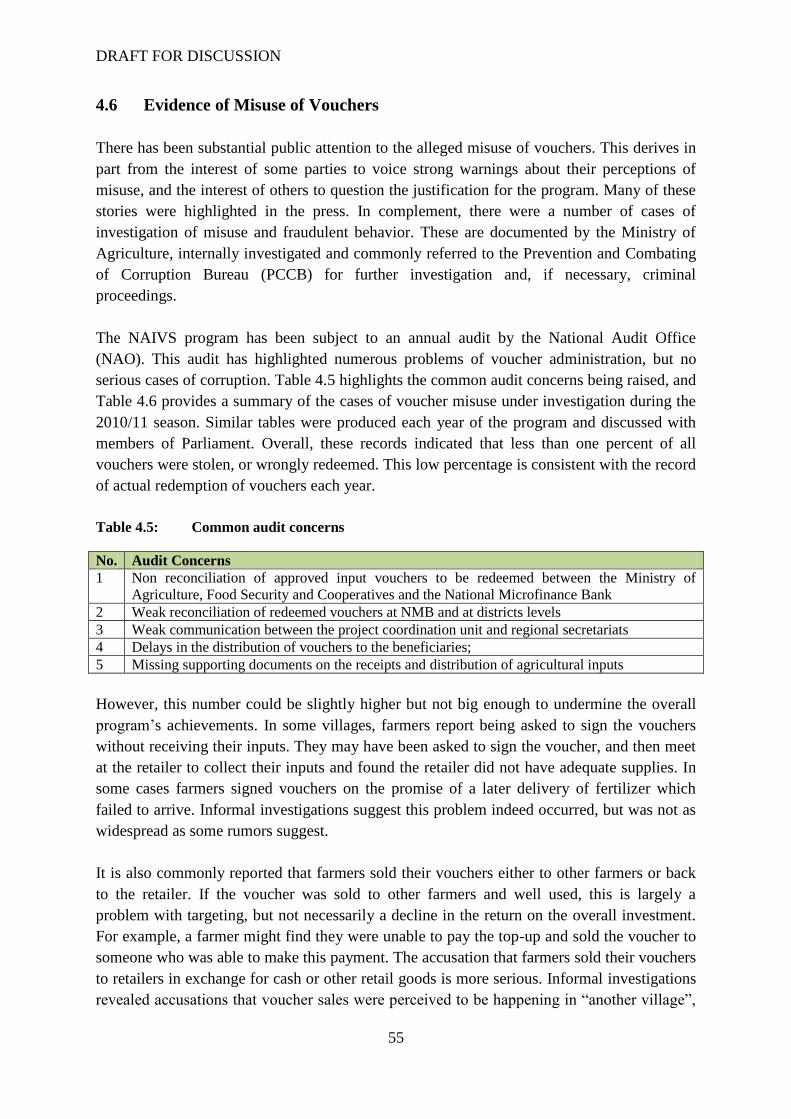
DRAFT FOR DISCUSSION
55
4.6 Evidence of Misuse of Vouchers
There has been substantial public attention to the alleged misuse of vouchers. This derives in
part from the interest of some parties to voice strong warnings about their perceptions of
misuse, and the interest of others to question the justification for the program. Many of these
stories were highlighted in the press. In complement, there were a number of cases of
investigation of misuse and fraudulent behavior. These are documented by the Ministry of
Agriculture, internally investigated and commonly referred to the Prevention and Combating
of Corruption Bureau (PCCB) for further investigation and, if necessary, criminal
proceedings.
The NAIVS program has been subject to an annual audit by the National Audit Office
(NAO). This audit has highlighted numerous problems of voucher administration, but no
serious cases of corruption. Table 4.5 highlights the common audit concerns being raised, and
Table 4.6 provides a summary of the cases of voucher misuse under investigation during the
2010/11 season. Similar tables were produced each year of the program and discussed with
members of Parliament. Overall, these records indicated that less than one percent of all
vouchers were stolen, or wrongly redeemed. This low percentage is consistent with the record
of actual redemption of vouchers each year.
Table 4.5: Common audit concerns
No. Audit Concerns
1 Non reconciliation of approved input vouchers to be redeemed between the Ministry of
Agriculture, Food Security and Cooperatives and the National Microfinance Bank
2 Weak reconciliation of redeemed vouchers at NMB and at districts levels
3 Weak communication between the project coordination unit and regional secretariats
4 Delays in the distribution of vouchers to the beneficiaries;
5 Missing supporting documents on the receipts and distribution of agricultural inputs
However, this number could be slightly higher but not big enough to undermine the overall
program‟s achievements. In some villages, farmers report being asked to sign the vouchers
without receiving their inputs. They may have been asked to sign the voucher, and then meet
at the retailer to collect their inputs and found the retailer did not have adequate supplies. In
some cases farmers signed vouchers on the promise of a later delivery of fertilizer which
failed to arrive. Informal investigations suggest this problem indeed occurred, but was not as
widespread as some rumors suggest.
It is also commonly reported that farmers sold their vouchers either to other farmers or back
to the retailer. If the voucher was sold to other farmers and well used, this is largely a
problem with targeting, but not necessarily a decline in the return on the overall investment.
For example, a farmer might find they were unable to pay the top-up and sold the voucher to
someone who was able to make this payment. The accusation that farmers sold their vouchers
to retailers in exchange for cash or other retail goods is more serious. Informal investigations
revealed accusations that voucher sales were perceived to be happening in “another village”,
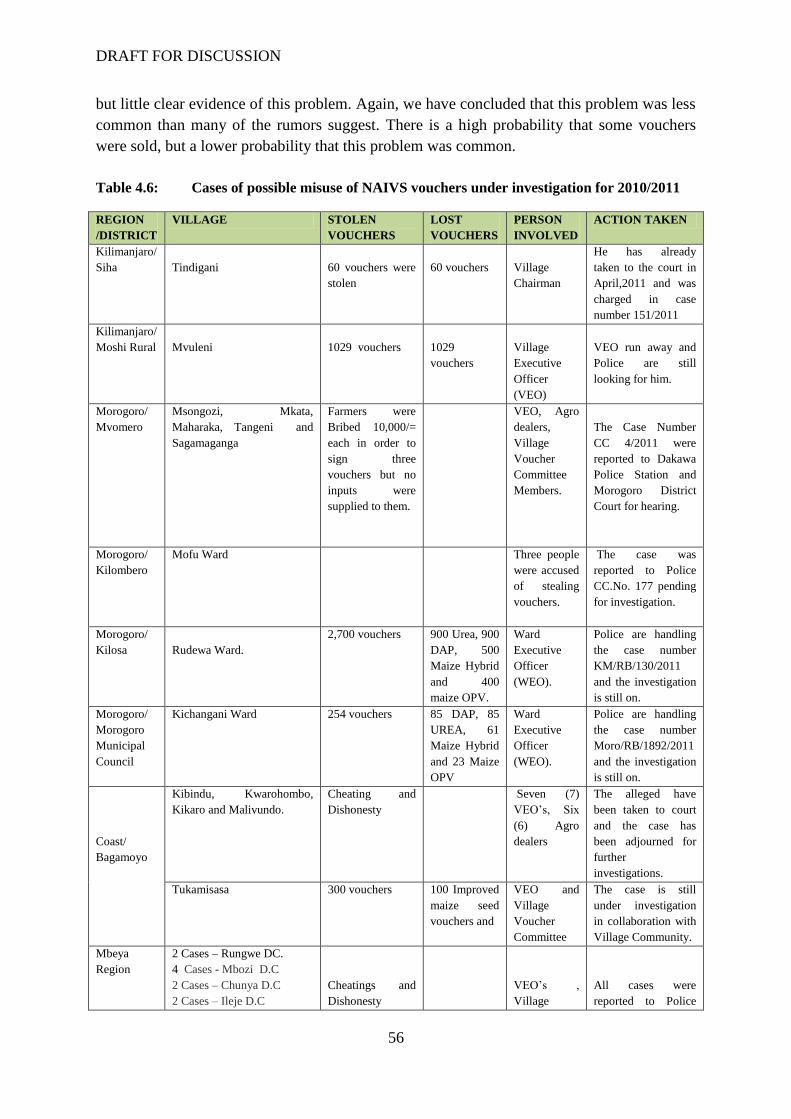
DRAFT FOR DISCUSSION
56
but little clear evidence of this problem. Again, we have concluded that this problem was less
common than many of the rumors suggest. There is a high probability that some vouchers
were sold, but a lower probability that this problem was common.
Table 4.6: Cases of possible misuse of NAIVS vouchers under investigation for 2010/2011
REGION
/DISTRICT
VILLAGE STOLEN
VOUCHERS
LOST
VOUCHERS
PERSON
INVOLVED
ACTION TAKEN
Kilimanjaro/
Siha
Tindigani
60 vouchers were
stolen
60 vouchers
Village
Chairman
He has already
taken to the court in
April,2011 and was
charged in case
number 151/2011
Kilimanjaro/
Moshi Rural
Mvuleni
1029 vouchers
1029
vouchers
Village
Executive
Officer
(VEO)
VEO run away and
Police are still
looking for him.
Morogoro/
Mvomero
Msongozi, Mkata,
Maharaka, Tangeni and
Sagamaganga
Farmers were
Bribed 10,000/=
each in order to
sign three
vouchers but no
inputs were
supplied to them.
VEO, Agro
dealers,
Village
Voucher
Committee
Members.
The Case Number
CC 4/2011 were
reported to Dakawa
Police Station and
Morogoro District
Court for hearing.
Morogoro/
Kilombero
Mofu Ward Three people
were accused
of stealing
vouchers.
The case was
reported to Police
CC.No. 177 pending
for investigation.
Morogoro/
Kilosa
Rudewa Ward.
2,700 vouchers 900 Urea, 900
DAP, 500
Maize Hybrid
and 400
maize OPV.
Ward
Executive
Officer
(WEO).
Police are handling
the case number
KM/RB/130/2011
and the investigation
is still on.
Morogoro/
Morogoro
Municipal
Council
Kichangani Ward 254 vouchers 85 DAP, 85
UREA, 61
Maize Hybrid
and 23 Maize
OPV
Ward
Executive
Officer
(WEO).
Police are handling
the case number
Moro/RB/1892/2011
and the investigation
is still on.
Coast/
Bagamoyo
Kibindu, Kwarohombo,
Kikaro and Malivundo.
Cheating and
Dishonesty
Seven (7)
VEO‟s, Six
(6) Agro
dealers
The alleged have
been taken to court
and the case has
been adjourned for
further
investigations.
Tukamisasa 300 vouchers 100 Improved
maize seed
vouchers and
VEO and
Village
Voucher
Committee
The case is still
under investigation
in collaboration with
Village Community.
Mbeya
Region
2 Cases – Rungwe DC.
4 Cases - Mbozi D.C
2 Cases – Chunya D.C
2 Cases – Ileje D.C
Cheatings and
Dishonesty
VEO‟s ,
Village
All cases were
reported to Police
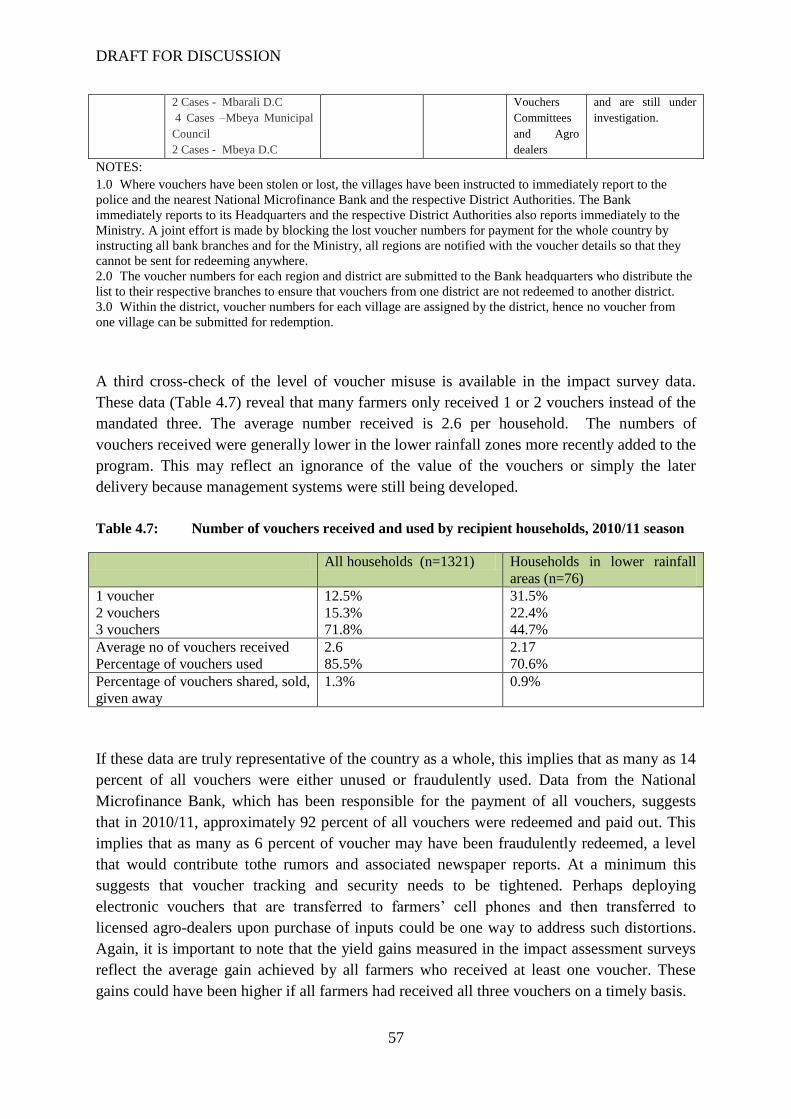
DRAFT FOR DISCUSSION
57
2 Cases - Mbarali D.C
4 Cases –Mbeya Municipal
Council
2 Cases - Mbeya D.C
Vouchers
Committees
and Agro
dealers
and are still under
investigation.
NOTES:
1.0 Where vouchers have been stolen or lost, the villages have been instructed to immediately report to the
police and the nearest National Microfinance Bank and the respective District Authorities. The Bank
immediately reports to its Headquarters and the respective District Authorities also reports immediately to the
Ministry. A joint effort is made by blocking the lost voucher numbers for payment for the whole country by
instructing all bank branches and for the Ministry, all regions are notified with the voucher details so that they
cannot be sent for redeeming anywhere.
2.0 The voucher numbers for each region and district are submitted to the Bank headquarters who distribute the
list to their respective branches to ensure that vouchers from one district are not redeemed to another district.
3.0 Within the district, voucher numbers for each village are assigned by the district, hence no voucher from
one village can be submitted for redemption.
A third cross-check of the level of voucher misuse is available in the impact survey data.
These data (Table 4.7) reveal that many farmers only received 1 or 2 vouchers instead of the
mandated three. The average number received is 2.6 per household. The numbers of
vouchers received were generally lower in the lower rainfall zones more recently added to the
program. This may reflect an ignorance of the value of the vouchers or simply the later
delivery because management systems were still being developed.
Table 4.7: Number of vouchers received and used by recipient households, 2010/11 season
All households (n=1321) Households in lower rainfall
areas (n=76)
1 voucher
2 vouchers
3 vouchers
12.5%
15.3%
71.8%
31.5%
22.4%
44.7%
Average no of vouchers received
Percentage of vouchers used
2.6
85.5%
2.17
70.6%
Percentage of vouchers shared, sold,
given away
1.3% 0.9%
If these data are truly representative of the country as a whole, this implies that as many as 14
percent of all vouchers were either unused or fraudulently used. Data from the National
Microfinance Bank, which has been responsible for the payment of all vouchers, suggests
that in 2010/11, approximately 92 percent of all vouchers were redeemed and paid out. This
implies that as many as 6 percent of voucher may have been fraudulently redeemed, a level
that would contribute tothe rumors and associated newspaper reports. At a minimum this
suggests that voucher tracking and security needs to be tightened. Perhaps deploying
electronic vouchers that are transferred to farmers‟ cell phones and then transferred to
licensed agro-dealers upon purchase of inputs could be one way to address such distortions.
Again, it is important to note that the yield gains measured in the impact assessment surveys
reflect the average gain achieved by all farmers who received at least one voucher. These
gains could have been higher if all farmers had received all three vouchers on a timely basis.
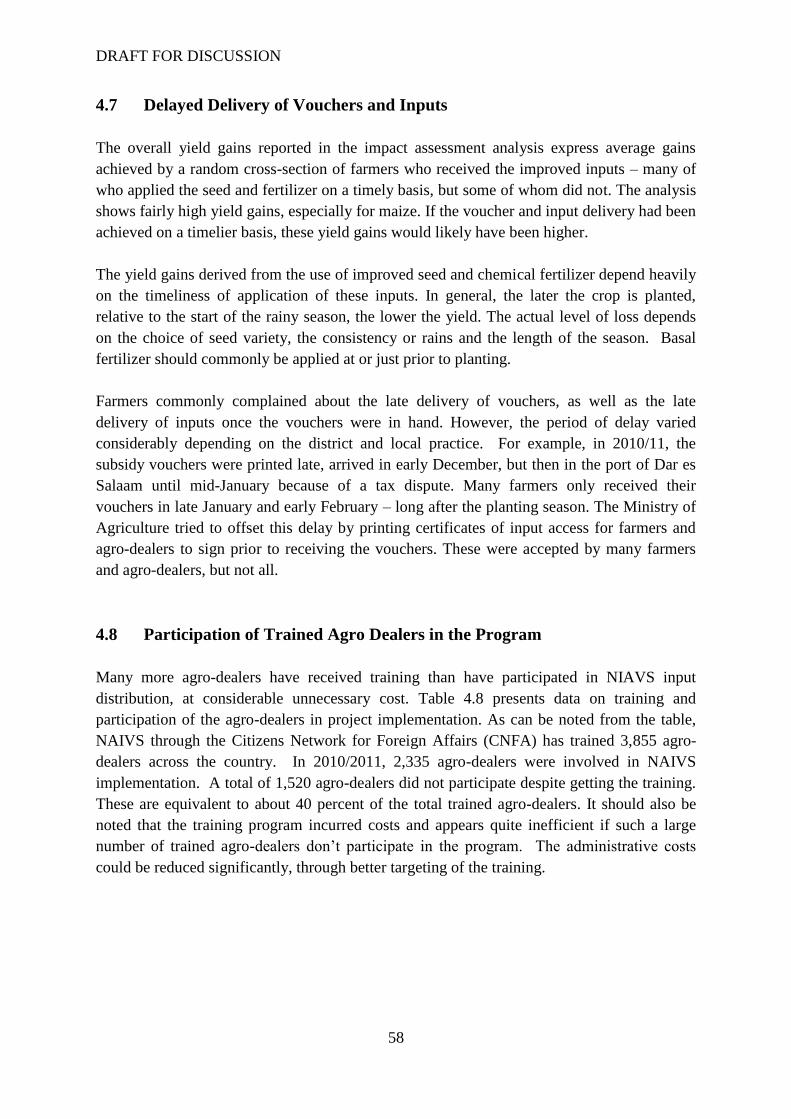
DRAFT FOR DISCUSSION
58
4.7 Delayed Delivery of Vouchers and Inputs
The overall yield gains reported in the impact assessment analysis express average gains
achieved by a random cross-section of farmers who received the improved inputs – many of
who applied the seed and fertilizer on a timely basis, but some of whom did not. The analysis
shows fairly high yield gains, especially for maize. If the voucher and input delivery had been
achieved on a timelier basis, these yield gains would likely have been higher.
The yield gains derived from the use of improved seed and chemical fertilizer depend heavily
on the timeliness of application of these inputs. In general, the later the crop is planted,
relative to the start of the rainy season, the lower the yield. The actual level of loss depends
on the choice of seed variety, the consistency or rains and the length of the season. Basal
fertilizer should commonly be applied at or just prior to planting.
Farmers commonly complained about the late delivery of vouchers, as well as the late
delivery of inputs once the vouchers were in hand. However, the period of delay varied
considerably depending on the district and local practice. For example, in 2010/11, the
subsidy vouchers were printed late, arrived in early December, but then in the port of Dar es
Salaam until mid-January because of a tax dispute. Many farmers only received their
vouchers in late January and early February – long after the planting season. The Ministry of
Agriculture tried to offset this delay by printing certificates of input access for farmers and
agro-dealers to sign prior to receiving the vouchers. These were accepted by many farmers
and agro-dealers, but not all.
4.8 Participation of Trained Agro Dealers in the Program
Many more agro-dealers have received training than have participated in NIAVS input
distribution, at considerable unnecessary cost. Table 4.8 presents data on training and
participation of the agro-dealers in project implementation. As can be noted from the table,
NAIVS through the Citizens Network for Foreign Affairs (CNFA) has trained 3,855 agro-
dealers across the country. In 2010/2011, 2,335 agro-dealers were involved in NAIVS
implementation. A total of 1,520 agro-dealers did not participate despite getting the training.
These are equivalent to about 40 percent of the total trained agro-dealers. It should also be
noted that the training program incurred costs and appears quite inefficient if such a large
number of trained agro-dealers don‟t participate in the program. The administrative costs
could be reduced significantly, through better targeting of the training.
DRAFT FOR DISCUSSION
59
Table 4.8: Participation of Agro-dealers in NAIVS (2010/11 and 2011/12)
Region
Total No of
Trained Agro-
dealers
Trained and
Participated
Agro-dealers
(2010/11)
Trained but
Not
participated
(2010/11)
Not
Participated
as percent of
Trained
(2010/11)
Trained and
Participated
Agro-dealers
(2011/12)
Trained
but Not
participate
(2011/12)
Not
Participated
as percent
of Trained
(2011/12)
Arusha 196 149 47 24 116 80 41
Kilimanjaro 182 173 9 5 146 36 20
Morogoro 275 207 68 25 143 132 48
Iringa 514 390 124 24 395 119 23
Mbeya 518 376 142 27 351 167 32
Ruvuma 268 205 63 24 154 114 43
Rukwa 201 105 96 48 138 63 31
Manyara 88 51 37 42 34 54 61
Kigoma 193 176 17 9 117 76 39
Tabora 100 60 40 40 92 8 8
Mara 119 91 28 24 60 59 50
Tanga 127 26 101 80 35 92 72
Shinyanga 219 87 132 60 27 192 88
Kagera 252 19 233 92 30 222 88
Mwanza 183 103 80 44 80 103 56
Lindi 82 23 59 72 25 57 70
Singida 89 18 71 80 3 86 97
Dodoma 117 18 99 85 21 96 82
Pwani 51 20 31 61 13 38 75
Mtwara 81 38 43 53 30 51 63
Total 3,855 2,335 1,520 39 2,010 1845 48
DRAFT FOR DISCUSSION
60
5.0 CONCLUSIONS AND RECOMMEDATIONS
This report evaluates the effectiveness of the NAIVS program in Tanzania. NAIVS, an input
subsidy program, was launched in 2009 in response to the increased food and fertilizer price
crisis in 2008; and uses vouchers to transfer resources directly to farmers, increasing their
purchasing power, stimulating the development of input supply chains, and fostering
competition among input suppliers and agro-dealers. The main objective of the program is to
improve farmers‟ access to critical agricultural inputs (fertilizer and improved seeds) for
maize and rice production, and it has been implemented by the Ministry of Agriculture, Food
Security and Cooperatives (MAFC) to provide input vouchers to a total of 2.5 million maize
and rice producing farmers.
The vouchers provided to maize and rice farmers under NAIVS subsidize half of the price of
a package of improved seed and fertilizer (the package provides sufficient inputs for one acre
of maize or rice) purchased from private dealers at market prices. Each eligible farmer
receives vouchers for a maximum of three years. At current market prices, using fertilizer and
improved seed does not generate sufficient cash for many resource-poor farmers to purchase
inputs from one year to the next. The Project‟s three-year support for seed and fertilizer
purchases was intended to allow farmers to earn enough to continue purchasing inputs at
market prices and sustain their gains in productivity over time.
To examine the financial and economic returns of the NAIVS program, 2000 households
from 200 villages are surveyed in a baseline survey conducted in 2011 and a follow-up
survey in 2012. Overall, the NAIVS program appears to have contributed to an increase in
the adoption rates of improved seed and fertilizer. This increase in adoption rates contributed
to higher production both during the program and on a sustained basis after the program (as
evidenced by the experience of graduates that are no longer beneficiaries in 2011/12), with
significant cost effectiveness for maize in particular, as compared to rice.
It should be noted that the results reflect the most immediate returns to the investment. These
underestimate the longer term gains derived from training farmers about the value of
improved seed and fertilizer, and developing retail input supply chains extending closer to the
farmgate. A significant number of farmers interviewed suggested that they were seeing some
improved varieties of maize or paddy for the first time. Insofar as they continue to use the
improved varieties, the productivity gains will be sustained. The increase in seed and
fertilizer adoption rates among subsidy graduates, particularly those who had not previously
purchased these inputs, also raises the level of investment gains.
Despite the success of the NAIVS program in terms of increase in adoption rates for
improved seed and fertilizer, yield and food security, there are still some concerns that need
to be addressed. There has been substantial public attention to the misuse of vouchers. Data
reveals that many farmers only received 1 or 2 vouchers instead of the mandated three
suggesting that voucher tracking and security needs to be tightened. Perhaps deploying
DRAFT FOR DISCUSSION
61
electronic vouchers that are transferred to farmers‟ cell phones and then transferred to
licensed agro-dealers upon purchase of inputs could be one way to address such distortions.
Farmers commonly complained about the late delivery of vouchers, as well as the late
delivery of inputs once the vouchers were in hand. The yield gains derived from the use of
improved seed and chemical fertilizer depend heavily on the timeliness of application of
these inputs. Perhaps, if the voucher and input delivery had been achieved on a timelier basis,
perhaps these yield gains would likely have been higher. The failure to withdraw the subsidy
from participating farmers after three years also led to some households receiving a subsidy
for four or even five years. In effect, the three year eligibility rule was commonly, but
inconsistently applied. Moreover, the NAIVS sought to introduce improved maize and rice
seed varieties and fertilizers to farmers who would not otherwise have applied these inputs.
But the evidence derived from the project impact surveys suggests that a substantial number
of households had tried the improved inputs at some time before the start of the program.
This implies that measures should be taken by NAIVS to avoid the possibility of
displacement of commercial input purchases by subsidized purchases.
Withdrawal of the services of agro-dealers would undermine the levels of continuing
commercial purchases of improved inputs. Many of the agro-dealers providing inputs under
the program withdrew from village markets when the demand for their inputs was no longer
guaranteed by the vouchers. While the agro-dealers were required to set up shops in the
villages in order to participate, many of these shops were seasonal and rented on a short term
basis. This is sensible because grain seed and chemical fertilizer sales are highly seasonal. If
farmers have to travel to a distant town to look for seed or fertilizer with uncertainty about
prices and availability, commercial sales will decline. Another factor undermining the
continuing purchase of these improved inputs is their high cost. The fact remains that seed
and chemical fertilizer remain expensive commodities at the farmgate. Many farmers face
difficulty finding the capital to make this investment during the start of the growing season.
Thus, whether the adoption of improved seed and fertilizer will be sustained as the subsidy is
withdrawn is of greater concern.
Different from the inputs subsidy program like NAIVS, the investment programs proposed in
the Big Results Now laboratories primarily target the objective of making maize and rice
production more profitable. The maize program principally targets the improvement of
production returns by helping farmers make use of warehouse based crop storage systems
that facilitate the exploitation of price seasonality and the opportunities for achieving better
farmgate prices through bulk sales. These warehouse operations can also be used to facilitate
the bulk purchase of crop inputs. The Big Results Now proposal for paddy seeks a
combination of improvements in production and market productivity through the pursuit of
better crop management through block farming as well as a similar warehousing arrangement
as that proposed for maize. This could help resolve the question raised by the NAIVS impact
assessment of how the agronomic performance derived from the improved inputs can be
sustained and further improved. The empirical insights provided in this report are intended to
guide the dialogue on policy options and effective decision making for the way forward.
DRAFT FOR DISCUSSION
62
REFERENCES
ACT (Agricultural Council of Tanzania) (2012): Distribution, Access and Application of
Agricultural Inputs, Final Report, ACT, Dar-es-Salaam
Baltzer K and Hansen H (2012): Agricultural Input Subsidies in Sub Saharan Africa, Institute
of Food and Resource Economics, University of Copenhagen
BoT (Bank of Tanzania) (2010): Recent Macroeconomic Development, Directorate of
Economic Policy, BoT, Dar-es-Salaam
Coulson A (1982): TANZANIA: A Political Economy; London: Clarendon Press
Daily News (2013): Rukwa Region calls for voucher system replacement, Local News 18th
of
February, Dar-es-Salaam, Tanzania
Druilhe Z and Barreiro-Hurlé J (2012): Fertilizer subsidies in sub-Saharan Africa, ESA
Working paper No. 12-04, Agricultural Development Economics Division, Food and
Agriculture Organization of the United Nations
ESRF (2010) “Agriculture Sector Review and Public Expenditures Review 2010/2011”
report submitted to the Ministry of Agriculture, Food Security and Cooperatives of the
United republic of Tanzania. November 2010.
ESRF (Economic and Social Research Foundation) (2013): Development of Market-Oriented
Agriculture Infrastructure for Transforming Tanzania‟s Agriculture into a Commercial
Sector: Corridor Based Strategic Interventions and Investments, A Draft Report
Submitted to President‟s Office – Planning Commission (PO-PC), Dar-e-Salaam
Food and Agricultural Policy Decision Analysis Tool (FAPDA) - www.fao.org/tc/fapda-
tool/Main.html
Luhwago R (2011): How the Government loses Billions through the Farm Input Voucher
System, The Guardian 10th
July, Dar-es-Salaam, Tanzania
MAFC (Ministry of Agriculture Food Security) (2012a): Accelerated Food Security Project
(Credit 4619-TA): Progress Report August 2009 - June 2012, MAFC, Dar-es-Salaam
MAFC (Ministry of Agriculture Food Security) (2012b): Accelerated Food Security Project
(Credit 4619-TA): Progress Report April - June 2012, MAFC, Dar-es-Salaam
Majaliwa C (2012): Tanzania: Kabwe Calls For Agricultural Subsidies Audit, Daily News, 30
October, Dar-es-Salaam
DRAFT FOR DISCUSSION
63
Mashindano O. (2011): Adoption of the Climate Based Malaria Epidemic Prediction Model
(MEPM) for Reducing Malaria Incidence in Kenya; A Draft Report Submitted to the
Institute of Development Studies (IDS), Brighton, UK
Minot N (2009): Fertilizer Policy and Use in Tanzania, a paper presented at the Fertilizer
Policy Symposium of the COMESA African Agricultural Markets Programmes
(AAMP), Livingstone, Zambia
Msambichaka et al (2010): Analysis of the performance of agriculture sector and its
contribution to economic growth and poverty reduction; A Commissioned Report
Submitted to the Ministry of Finance and Economic Affairs (MoFEA), Dar-es-Salaam
Patel S (2011): Tanzania National Agricultural Input Voucher Scheme (NAIVS) Impact
Evaluation: Baseline Report, The World Bank, Dar-es-Salaam Office
Putterman L (1995): Economic reform and smallholderAgriculture in Tanzania:A discussion
of recentMarket liberalization,Road rehabilitation, andTechnology dissemination
efforts, World Development, World Development, Vol. 23, No. 2, pp. 311-326
The Citizen (2011): Farm Inputs Voucher System Needs Review, Wednesday – January, Dar-
es-Salaam, Tanzania
USAID (2010). Staple foods value chain analysis. Country report Tanzania. USAID –
COMPETE program document.
URT (2005) “Agricultural Sector Development Programme (ASDP). Support Through
Basket Fund”. Government Programme Document
URT (United Republic of Tanzania): (2009): Tanzania Accelerated Food Security Project:
Project Implementation Manual (PIM), Ministry of Agriculture, Food Security and
Cooperatives (MAFC), Dar-es-Salaam
URT (United Republic of Tanzania): (2006): Agricultural Sector Review (ASR):
Performance, Issues and Operations, Main Report: Ministry of Agriculture, Food
Security and Cooperatives (MAFC), Dar-es-Salaam
URT (United Republic of Tanzania): (2011a): Tanzania Agriculture and Food Security
Investment Plan (TAFSIP): 2011-12 to 2020-21, Ministry of Agriculture, Food Security
and Cooperatives (MAFC), Dar-es-Salaam
URT (United Republic of Tanzania): (2011b): The Tanzania Five year Development Plan
2011/12-2015/16:Unleashing Tanzania‟s Latent GrowthPotentials, President‟s Office –
Planning Commission, Dar-es-Salaam
Wolmer, W. and Scoones, I. (2005): An introduction to policy processes. Institute of
Development Studies (IDS), Brighton, UK
DRAFT FOR DISCUSSION
64
World Bank (2009): Accelerated Food Security Program of the United Republic of Tanzania
under the Global Food Crisis Response Program Emergency Program Paper, Report
No: 48549-TZ, Washington D.C.
World Bank (2009a): Project Information Document (PID), Appraisal Stage, Dar-es-Salaam
World Bank (2010) “Rapid Budget Analysis for Annual Review 2010/2011. Agriculture
Sector”.
World Bank (2011): Tanzania National Agricultural Input Voucher Scheme (NAIVS) Impact
Evaluation, Baseline Report, Dar-es-Salaam
WDI (2012): World Bank World Development Indicators database.
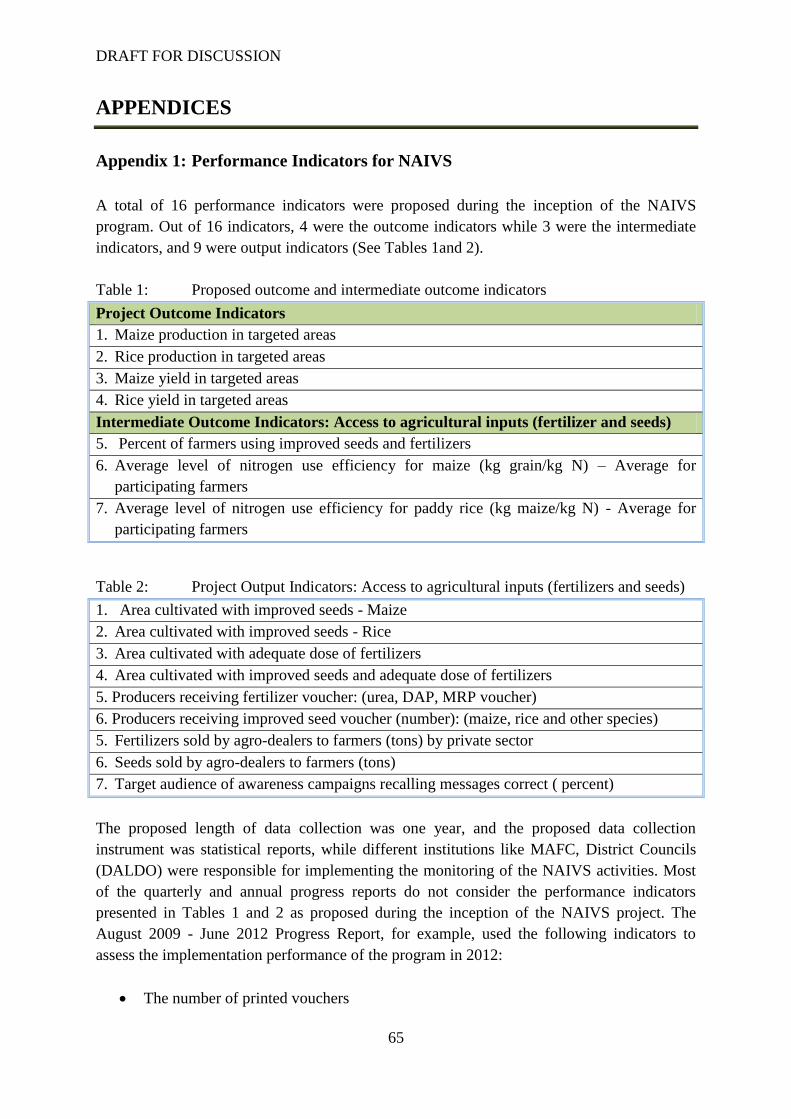
DRAFT FOR DISCUSSION
65
APPENDICES
Appendix 1: Performance Indicators for NAIVS
A total of 16 performance indicators were proposed during the inception of the NAIVS
program. Out of 16 indicators, 4 were the outcome indicators while 3 were the intermediate
indicators, and 9 were output indicators (See Tables 1and 2).
Table 1: Proposed outcome and intermediate outcome indicators
Project Outcome Indicators
1. Maize production in targeted areas
2. Rice production in targeted areas
3. Maize yield in targeted areas
4. Rice yield in targeted areas
Intermediate Outcome Indicators: Access to agricultural inputs (fertilizer and seeds)
5. Percent of farmers using improved seeds and fertilizers
6. Average level of nitrogen use efficiency for maize (kg grain/kg N) – Average for
participating farmers
7. Average level of nitrogen use efficiency for paddy rice (kg maize/kg N) - Average for
participating farmers
Table 2: Project Output Indicators: Access to agricultural inputs (fertilizers and seeds)
1. Area cultivated with improved seeds - Maize
2. Area cultivated with improved seeds - Rice
3. Area cultivated with adequate dose of fertilizers
4. Area cultivated with improved seeds and adequate dose of fertilizers
5. Producers receiving fertilizer voucher: (urea, DAP, MRP voucher)
6. Producers receiving improved seed voucher (number): (maize, rice and other species)
5. Fertilizers sold by agro-dealers to farmers (tons) by private sector
6. Seeds sold by agro-dealers to farmers (tons)
7. Target audience of awareness campaigns recalling messages correct ( percent)
The proposed length of data collection was one year, and the proposed data collection
instrument was statistical reports, while different institutions like MAFC, District Councils
(DALDO) were responsible for implementing the monitoring of the NAIVS activities. Most
of the quarterly and annual progress reports do not consider the performance indicators
presented in Tables 1 and 2 as proposed during the inception of the NAIVS project. The
August 2009 - June 2012 Progress Report, for example, used the following indicators to
assess the implementation performance of the program in 2012:
The number of printed vouchers
DRAFT FOR DISCUSSION
66
The number of distributed vouchers
Household beneficiaries
Outreach e.g. number of farmers reached by the program
Similarly, the April – June 2012 Progress Report used the following indicators to assess the
implementation performance of the program in the second quarter of 2012:
The number of printed vouchers
The number of distributed vouchers
Household beneficiaries
Number of graduates
Outreach e.g. number of farmers reached by the program
Voucher redeeming
Budget allocation: IDA vs. the Government
There is no explanation so far as to why the program progress reports prepared by the Input
Unit of the MAFC do not use the earlier proposed performance indicators.
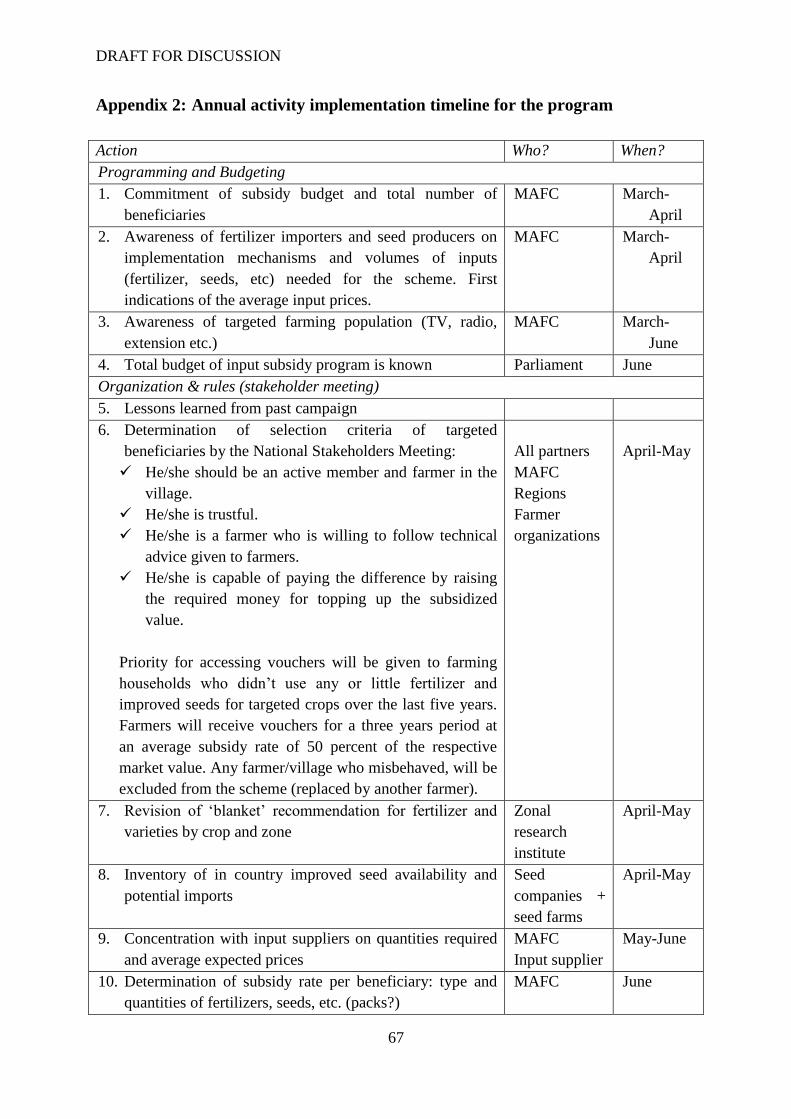
DRAFT FOR DISCUSSION
67
Appendix 2: Annual activity implementation timeline for the program
Action Who? When?
Programming and Budgeting
1. Commitment of subsidy budget and total number of
beneficiaries
MAFC March-
April
2. Awareness of fertilizer importers and seed producers on
implementation mechanisms and volumes of inputs
(fertilizer, seeds, etc) needed for the scheme. First
indications of the average input prices.
MAFC March-
April
3. Awareness of targeted farming population (TV, radio,
extension etc.)
MAFC March-
June
4. Total budget of input subsidy program is known Parliament June
Organization & rules (stakeholder meeting)
5. Lessons learned from past campaign
6. Determination of selection criteria of targeted
beneficiaries by the National Stakeholders Meeting:
He/she should be an active member and farmer in the
village.
He/she is trustful.
He/she is a farmer who is willing to follow technical
advice given to farmers.
He/she is capable of paying the difference by raising
the required money for topping up the subsidized
value.
Priority for accessing vouchers will be given to farming
households who didn‟t use any or little fertilizer and
improved seeds for targeted crops over the last five years.
Farmers will receive vouchers for a three years period at
an average subsidy rate of 50 percent of the respective
market value. Any farmer/village who misbehaved, will be
excluded from the scheme (replaced by another farmer).
All partners
MAFC
Regions
Farmer
organizations
April-May
7. Revision of „blanket‟ recommendation for fertilizer and
varieties by crop and zone
Zonal
research
institute
April-May
8. Inventory of in country improved seed availability and
potential imports
Seed
companies +
seed farms
April-May
9. Concentration with input suppliers on quantities required
and average expected prices
MAFC
Input supplier
May-June
10. Determination of subsidy rate per beneficiary: type and
quantities of fertilizers, seeds, etc. (packs?)
MAFC June
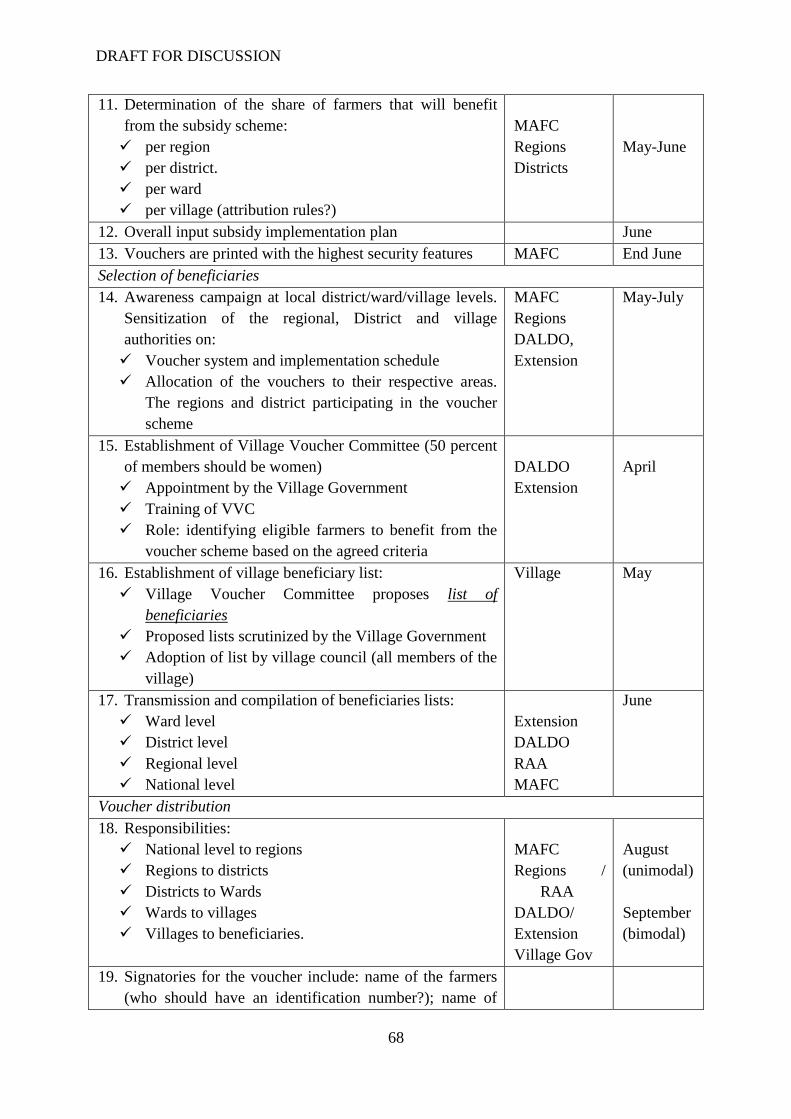
DRAFT FOR DISCUSSION
68
11. Determination of the share of farmers that will benefit
from the subsidy scheme:
per region
per district.
per ward
per village (attribution rules?)
MAFC
Regions
Districts
May-June
12. Overall input subsidy implementation plan June
13. Vouchers are printed with the highest security features MAFC End June
Selection of beneficiaries
14. Awareness campaign at local district/ward/village levels.
Sensitization of the regional, District and village
authorities on:
Voucher system and implementation schedule
Allocation of the vouchers to their respective areas.
The regions and district participating in the voucher
scheme
MAFC
Regions
DALDO,
Extension
May-July
15. Establishment of Village Voucher Committee (50 percent
of members should be women)
Appointment by the Village Government
Training of VVC
Role: identifying eligible farmers to benefit from the
voucher scheme based on the agreed criteria
DALDO
Extension
April
16. Establishment of village beneficiary list:
Village Voucher Committee proposes list of
beneficiaries
Proposed lists scrutinized by the Village Government
Adoption of list by village council (all members of the
village)
Village May
17. Transmission and compilation of beneficiaries lists:
Ward level
District level
Regional level
National level
Extension
DALDO
RAA
MAFC
June
Voucher distribution
18. Responsibilities:
National level to regions
Regions to districts
Districts to Wards
Wards to villages
Villages to beneficiaries.
MAFC
Regions /
RAA
DALDO/
Extension
Village Gov
August
(unimodal)
September
(bimodal)
19. Signatories for the voucher include: name of the farmers
(who should have an identification number?); name of
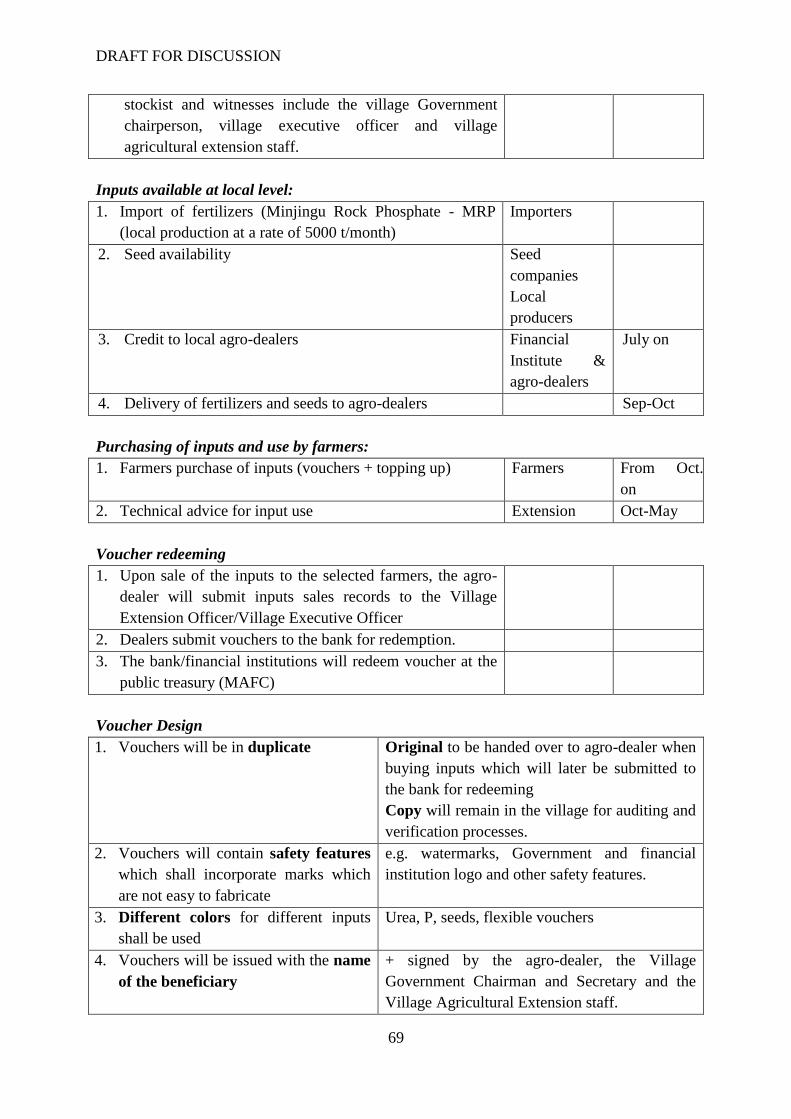
DRAFT FOR DISCUSSION
69
stockist and witnesses include the village Government
chairperson, village executive officer and village
agricultural extension staff.
Inputs available at local level:
1. Import of fertilizers (Minjingu Rock Phosphate - MRP
(local production at a rate of 5000 t/month)
Importers
2. Seed availability Seed
companies
Local
producers
3. Credit to local agro-dealers Financial
Institute &
agro-dealers
July on
4. Delivery of fertilizers and seeds to agro-dealers Sep-Oct
Purchasing of inputs and use by farmers:
1. Farmers purchase of inputs (vouchers + topping up) Farmers From Oct.
on
2. Technical advice for input use Extension Oct-May
Voucher redeeming
1. Upon sale of the inputs to the selected farmers, the agro-
dealer will submit inputs sales records to the Village
Extension Officer/Village Executive Officer
2. Dealers submit vouchers to the bank for redemption.
3. The bank/financial institutions will redeem voucher at the
public treasury (MAFC)
Voucher Design
1. Vouchers will be in duplicate Original to be handed over to agro-dealer when
buying inputs which will later be submitted to
the bank for redeeming
Copy will remain in the village for auditing and
verification processes.
2. Vouchers will contain safety features
which shall incorporate marks which
are not easy to fabricate
e.g. watermarks, Government and financial
institution logo and other safety features.
3. Different colors for different inputs
shall be used
Urea, P, seeds, flexible vouchers
4. Vouchers will be issued with the name
of the beneficiary
+ signed by the agro-dealer, the Village
Government Chairman and Secretary and the
Village Agricultural Extension staff.
DRAFT FOR DISCUSSION
70
Appendix 3: Institutional Arrangement
The design of NAIVS, officially implemented by the Ministry of Agriculture and Food
Security (MAFC) on behalf of the Government of Tanzania, consists of an extensive
institutional arrangement. At the apex there is NAIVS national forum which is mandated to
endorse the voucher share between targeted districts based on the adopted guidelines and
selection criteria guidelines for NAIVS implementation, discuss and endorse proposed
NAIVS annual work plan and budgets; and review implementation progress report and
recommend changes/improvements to the National Voucher Steering Committee (NVSC),
which is the next level of the institutional arrangement.
NVSC is set up by the MAFC and is chaired by the Permanent Secretary of MAFC (URT
2009). This committee is mandated to oversee a number of functions including development
of policies, guidelines and procedures for the implementation of the NAIVS, particularly the
agricultural input vouchers, submit the criteria for allocation of vouchers to regions, ensure
that the scheme is fully financed and funds are released on time, and review progress reports
and take corrective measures where needed. Within the Directorate of Crop Development
Department of the MAFC, Agricultural Input Section (AIS) is responsible for day-to-day
management of the Project and coordination of activities.
At regional level, the Regional Voucher Committee (RVC) is to determine the share of
vouchers between districts and supports districts and monitor the implementation of the
voucher scheme in the respective region (URT 2009). Similarly, Voucher Committee is also
set up at district, ward and village level to monitor and make follow up of implementation of
input voucher scheme. Moreover, like the National Forum, District Agricultural Input
Voucher Scheme Forum (NAIVS-District Forum), is mandated to endorse the voucher share
between targeted villages based on the adopted guidelines and selection criteria guidelines for
NAIVS implementation, discuss and endorse proposed NAIVS annual work plan and budgets
at district level and review implementation progress report and recommend
changes/improvements to NVSC. Detailed information regarding each agency is as follows:
a) NAIVS National Forum
At the apex there is NAIVS national forum which draws 5 members from the National Public
services; 1 district representative from one of the target regions; 9 members from the private
sector (fertilizer companies (3 representatives), seed companies (3 representatives), and agro-
dealer association (3 representatives)); 15 members from farmer organizations and
Community Based Organizations (CBOs); and lastly 5 members from NGOs. This forum is
mandated to endorse the voucher share between targeted districts based on the adopted
guidelines and selection criteria guidelines for NAIVS implementation; discuss and endorse
proposed NAIVS annual work plan and budgets; and review implementation progress report
and recommend changes/improvements to the National Voucher Steering Committee
(NVSC), which is the next level of the institutional arrangement. Chaired by the Minister of
DRAFT FOR DISCUSSION
71
Agriculture, Food Security and Cooperatives (MAFC) the NAIVS National Forum is
supposed to meet twice a year.
b) National Voucher Steering Committee (NVSC)
Immediately after the apex body (NAIVS National Forum) there is a National Voucher
Steering Committee (NVSC) which was set up by the MAFC and is chaired by the Permanent
Secretary of MAFC (URT, 2009). It comprises of 1 representative from each of the Ministry
of Finance, Prime Minister‟s Office, Regional Administration and Local Government (PMO-
RALG), and the National Micro-Finance Bank. In addition there are 4 representatives of
Farmer Groups, 2 members from agribusiness, MAFC Directors from relevant Departments,
2 members from Civil Society Organizations (CSOs), and Head of the Agricultural Inputs
Section at MAFC who is also a secretary to the NVSC. This committee is mandated to
oversee a number of functions including development of policies, guidelines and procedures
for the implementation of the NAIVS, particularly the agricultural input vouchers; submit the
criteria for allocation of vouchers to regions; ensure that the scheme is fully financed and
funds are released on time; and review progress reports and take corrective measures where
needed.
(c) Agricultural Input Section (AIS)
This is a section within the Directorate of Crop Development Department of the MAFC. It is
responsible for day-to-day management of the Project and coordination of activities. The
Head of Agricultural Input Section (HAIS) serves as NVSC Secretary. He is assisted by staffs
that are assigned from other departments and sections of MAFC including the Planning
officer, Fertilizer and soil nutrition management specialist, Monitoring and Evaluation
officer, and Accounting Officer, Procurement Officer, and Communication specialist. The
detailed role and responsibilities of Agricultural input section and the Head of the unit are
clearly spelt out in the AFSP Project Implementation Manual (PIM) (URT, 2009).
(d) The Regional Voucher Committee (RVC)
The Regional Voucher Committee (RVC) is a regional apex body. Each target region has its
own RVC and it is chaired by the Regional Commissioner (RC). It draws 3 members from
the Regional Secretariat. These are the RC, the Regional Administrative Secretary (RAS),
and the Regional Agricultural Advisor (RAA); 4 members from Farmer Groups; 2 members
from Agribusiness; 2 members from the Civil Society Organizations (CSOs); and 1 member
from the National Microfinance Bank (NMB) located in the respective region. The main role
and responsibilities of the RVC is to determine the share of vouchers between districts. The
RVC also supports districts and monitor the implementation of the voucher scheme in their
respective region (URT, 2009).
(e) The District Agricultural Input Voucher Scheme Forum (NAIVS-District Forum)
Each target district has a District Agricultural Input Voucher Scheme Forum (NAIVS-District
Forum) with membership drawn from LGA representatives (5 members); fertilizer companies
(3 members), seed companies (3 members), agro-dealer association (3 members); farmer
organizations and CBOs (15 members); and NGOs (5 members). Like the National Forum,
DRAFT FOR DISCUSSION
72
NAIVS District Forum is mandated to endorse the voucher share between targeted villages
based on the adopted guidelines and selection criteria guidelines for NAIVS implementation;
discuss and endorse proposed NAIVS annual work plan and budgets at district level; and
review implementation progress report and recommend changes/improvements to NVSC.
(f) District Voucher Committee (DVC)
Each target district has a District Voucher Committee (DVC) which is chaired by the District
Commissioner. Committee members include the District Commissioner; District Members of
Parliament; District Council Chairperson; 6 representatives of the Farmer Groups; 2 Agro-
dealer Representatives; 2 representatives of the Civil Society Organizations; and 2 members
from Community Based Organizations.
Others are a representative from NMB located in the respective district and the District
Agriculture and Livestock Officer (DALDO). Roles and responsibilities of DVC are
presented in URT (2009). They include, collect and review information about maize and rice
production, input use and other related information for each village and ward; select wards
and villages that will be included in the voucher scheme (high potentials in terms of soils,
low weather risks, etc.); estimate the number of farmers that grow maize and rice and the
average size of holdings per farmer; and adopt and use the formula/criteria to estimate
vouchers allocated to targeted villages.
(g) Ward Voucher Committee (WVC)
The Ward Voucher Committees (WVC) has been created in the entire target Wards to
monitor and make follow up of implementation of input voucher scheme in selected wards.
WVC is also responsible for distributing the vouchers to selected villages. The membership
of WVC includes the Ward Executive Officer (Chairperson), Ward Extension Officer
(Secretary), Ward Community Development officer, and 1 Farmer Group representative.
(h) The Village Voucher Committee (VVC)
This is the last administrative unit at the lower level. It is formed by the Village Council in
consultation with the Village Assembly (VA). VVC has 6 members (3 men and 3 women). It
is also responsible for recommending beneficiary farmers and, after the endorsement by the
VA, issuing the vouchers to the beneficiaries. Eligibility criteria for VVC membership, roles
and responsibility of VVC are clearly stated in UTR (2009).
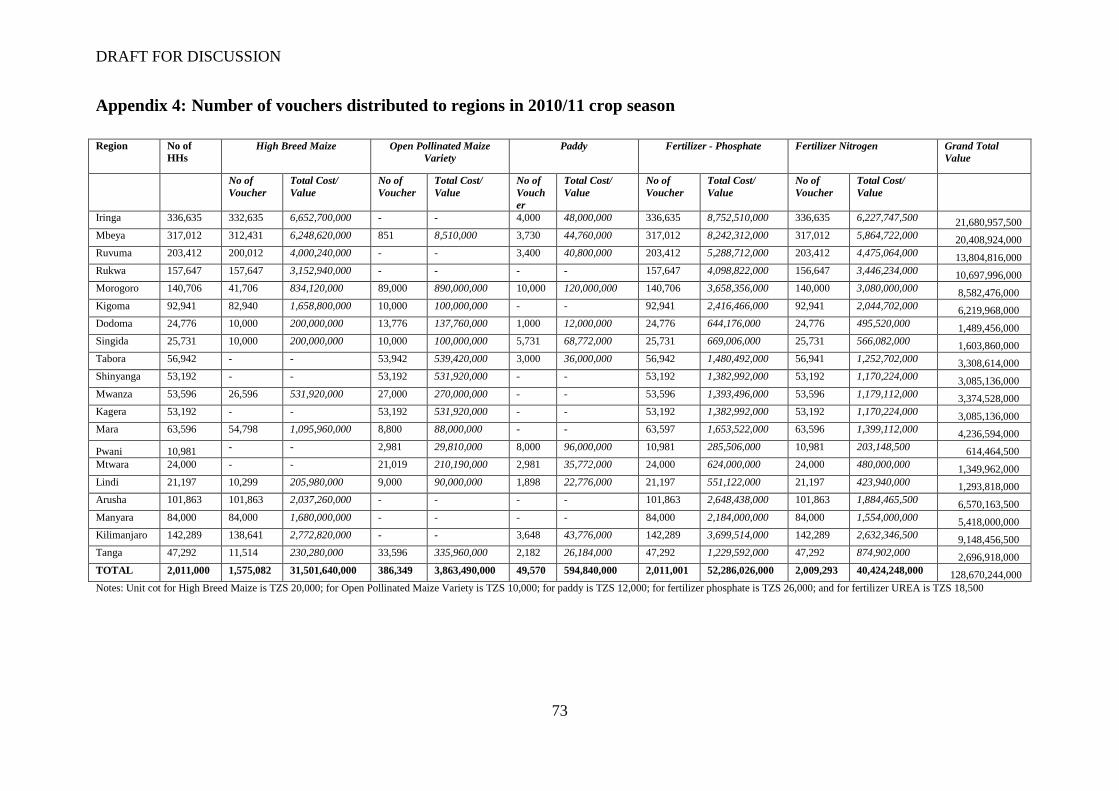
DRAFT FOR DISCUSSION
73
Appendix 4: Number of vouchers distributed to regions in 2010/11 crop season
Region No of
HHs
High Breed Maize Open Pollinated Maize
Variety
Paddy Fertilizer - Phosphate Fertilizer Nitrogen Grand Total
Value
No of
Voucher
Total Cost/
Value
No of
Voucher
Total Cost/
Value
No of
Vouch
er
Total Cost/
Value
No of
Voucher
Total Cost/
Value
No of
Voucher
Total Cost/
Value
Iringa 336,635 332,635 6,652,700,000 - - 4,000 48,000,000 336,635 8,752,510,000 336,635 6,227,747,500 21,680,957,500
Mbeya 317,012 312,431 6,248,620,000 851 8,510,000 3,730 44,760,000 317,012 8,242,312,000 317,012 5,864,722,000 20,408,924,000
Ruvuma 203,412 200,012 4,000,240,000 - - 3,400 40,800,000 203,412 5,288,712,000 203,412 4,475,064,000 13,804,816,000
Rukwa 157,647 157,647 3,152,940,000 - - - - 157,647 4,098,822,000 156,647 3,446,234,000 10,697,996,000
Morogoro 140,706 41,706 834,120,000 89,000 890,000,000 10,000 120,000,000 140,706 3,658,356,000 140,000 3,080,000,000 8,582,476,000
Kigoma 92,941 82,940 1,658,800,000 10,000 100,000,000 - - 92,941 2,416,466,000 92,941 2,044,702,000 6,219,968,000
Dodoma 24,776 10,000 200,000,000 13,776 137,760,000 1,000 12,000,000 24,776 644,176,000 24,776 495,520,000 1,489,456,000
Singida 25,731 10,000 200,000,000 10,000 100,000,000 5,731 68,772,000 25,731 669,006,000 25,731 566,082,000 1,603,860,000
Tabora 56,942 - - 53,942 539,420,000 3,000 36,000,000 56,942 1,480,492,000 56,941 1,252,702,000 3,308,614,000
Shinyanga 53,192 - - 53,192 531,920,000 - - 53,192 1,382,992,000 53,192 1,170,224,000 3,085,136,000
Mwanza 53,596 26,596 531,920,000 27,000 270,000,000 - - 53,596 1,393,496,000 53,596 1,179,112,000 3,374,528,000
Kagera 53,192 - - 53,192 531,920,000 - - 53,192 1,382,992,000 53,192 1,170,224,000 3,085,136,000
Mara 63,596 54,798 1,095,960,000 8,800 88,000,000 - - 63,597 1,653,522,000 63,596 1,399,112,000 4,236,594,000
Pwani 10,981 - - 2,981 29,810,000 8,000 96,000,000 10,981 285,506,000 10,981 203,148,500 614,464,500
Mtwara 24,000 - - 21,019 210,190,000 2,981 35,772,000 24,000 624,000,000 24,000 480,000,000 1,349,962,000
Lindi 21,197 10,299 205,980,000 9,000 90,000,000 1,898 22,776,000 21,197 551,122,000 21,197 423,940,000 1,293,818,000
Arusha 101,863 101,863 2,037,260,000 - - - - 101,863 2,648,438,000 101,863 1,884,465,500 6,570,163,500
Manyara 84,000 84,000 1,680,000,000 - - - - 84,000 2,184,000,000 84,000 1,554,000,000 5,418,000,000
Kilimanjaro 142,289 138,641 2,772,820,000 - - 3,648 43,776,000 142,289 3,699,514,000 142,289 2,632,346,500 9,148,456,500
Tanga 47,292 11,514 230,280,000 33,596 335,960,000 2,182 26,184,000 47,292 1,229,592,000 47,292 874,902,000 2,696,918,000
TOTAL 2,011,000 1,575,082 31,501,640,000 386,349 3,863,490,000 49,570 594,840,000 2,011,001 52,286,026,000 2,009,293 40,424,248,000 128,670,244,000
Notes: Unit cot for High Breed Maize is TZS 20,000; for Open Pollinated Maize Variety is TZS 10,000; for paddy is TZS 12,000; for fertilizer phosphate is TZS 26,000; and for fertilizer UREA is TZS 18,500
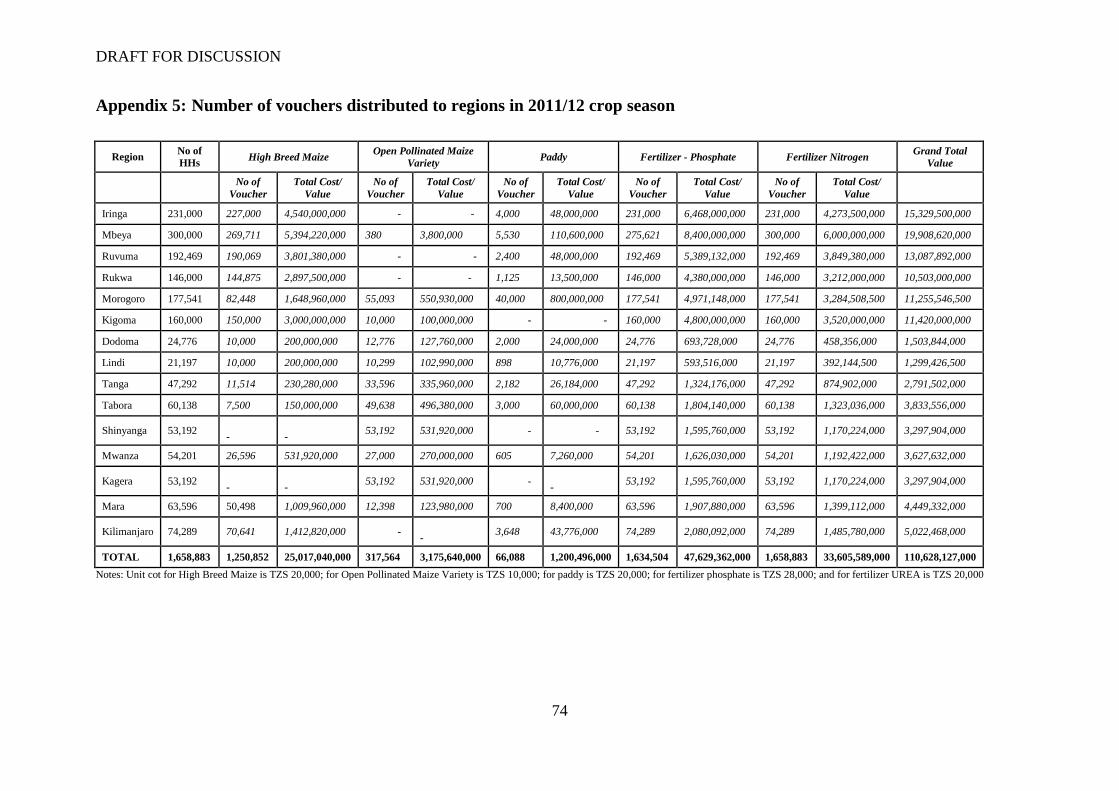
DRAFT FOR DISCUSSION
74
Appendix 5: Number of vouchers distributed to regions in 2011/12 crop season
Region No of
HHs High Breed Maize
Open Pollinated Maize
Variety Paddy Fertilizer - Phosphate Fertilizer Nitrogen
Grand Total
Value
No of
Voucher
Total Cost/
Value
No of
Voucher
Total Cost/
Value
No of
Voucher
Total Cost/
Value
No of
Voucher
Total Cost/
Value
No of
Voucher
Total Cost/
Value
Iringa 231,000 227,000 4,540,000,000 - - 4,000 48,000,000 231,000 6,468,000,000 231,000 4,273,500,000 15,329,500,000
Mbeya 300,000 269,711 5,394,220,000 380 3,800,000 5,530 110,600,000 275,621 8,400,000,000 300,000 6,000,000,000 19,908,620,000
Ruvuma 192,469 190,069 3,801,380,000 - - 2,400 48,000,000 192,469 5,389,132,000 192,469 3,849,380,000 13,087,892,000
Rukwa 146,000 144,875 2,897,500,000 - - 1,125 13,500,000 146,000 4,380,000,000 146,000 3,212,000,000 10,503,000,000
Morogoro 177,541 82,448 1,648,960,000 55,093 550,930,000 40,000 800,000,000 177,541 4,971,148,000 177,541 3,284,508,500 11,255,546,500
Kigoma 160,000 150,000 3,000,000,000 10,000 100,000,000 - - 160,000 4,800,000,000 160,000 3,520,000,000 11,420,000,000
Dodoma 24,776 10,000 200,000,000 12,776 127,760,000 2,000 24,000,000 24,776 693,728,000 24,776 458,356,000 1,503,844,000
Lindi 21,197 10,000 200,000,000 10,299 102,990,000 898 10,776,000 21,197 593,516,000 21,197 392,144,500 1,299,426,500
Tanga 47,292 11,514 230,280,000 33,596 335,960,000 2,182 26,184,000 47,292 1,324,176,000 47,292 874,902,000 2,791,502,000
Tabora 60,138 7,500 150,000,000 49,638 496,380,000 3,000 60,000,000 60,138 1,804,140,000 60,138 1,323,036,000 3,833,556,000
Shinyanga 53,192 -
-
53,192 531,920,000 - - 53,192 1,595,760,000 53,192 1,170,224,000 3,297,904,000
Mwanza 54,201 26,596 531,920,000 27,000 270,000,000 605 7,260,000 54,201 1,626,030,000 54,201 1,192,422,000 3,627,632,000
Kagera 53,192
-
- 53,192 531,920,000 -
- 53,192 1,595,760,000 53,192 1,170,224,000 3,297,904,000
Mara 63,596 50,498 1,009,960,000 12,398 123,980,000 700 8,400,000 63,596 1,907,880,000 63,596 1,399,112,000 4,449,332,000
Kilimanjaro 74,289 70,641 1,412,820,000 -
- 3,648 43,776,000 74,289 2,080,092,000 74,289 1,485,780,000 5,022,468,000
TOTAL 1,658,883 1,250,852 25,017,040,000 317,564 3,175,640,000 66,088 1,200,496,000 1,634,504 47,629,362,000 1,658,883 33,605,589,000 110,628,127,000
Notes: Unit cot for High Breed Maize is TZS 20,000; for Open Pollinated Maize Variety is TZS 10,000; for paddy is TZS 20,000; for fertilizer phosphate is TZS 28,000; and for fertilizer UREA is TZS 20,000
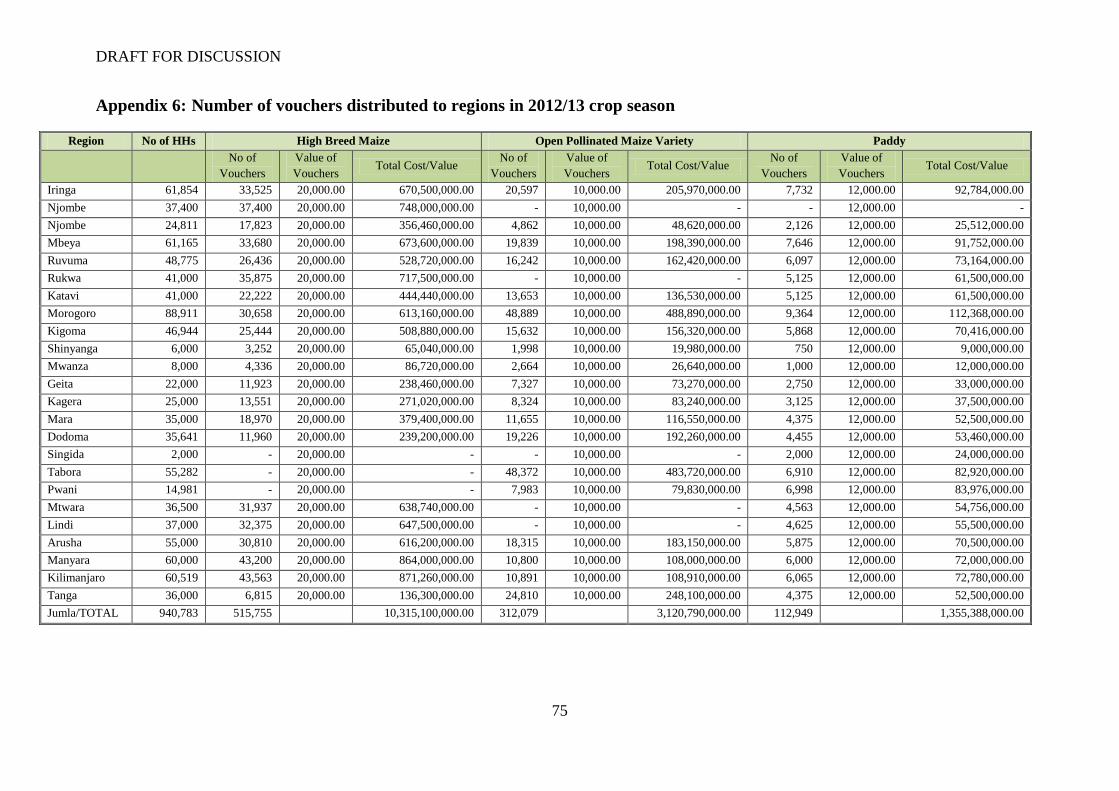
DRAFT FOR DISCUSSION
75
Appendix 6: Number of vouchers distributed to regions in 2012/13 crop season
Region No of HHs High Breed Maize Open Pollinated Maize Variety Paddy
No of
Vouchers
Value of
Vouchers Total Cost/Value
No of
Vouchers
Value of
Vouchers Total Cost/Value
No of
Vouchers
Value of
Vouchers Total Cost/Value
Iringa 61,854 33,525 20,000.00 670,500,000.00 20,597 10,000.00 205,970,000.00 7,732 12,000.00 92,784,000.00
Njombe 37,400 37,400 20,000.00 748,000,000.00 - 10,000.00 - - 12,000.00 -
Njombe 24,811 17,823 20,000.00 356,460,000.00 4,862 10,000.00 48,620,000.00 2,126 12,000.00 25,512,000.00
Mbeya 61,165 33,680 20,000.00 673,600,000.00 19,839 10,000.00 198,390,000.00 7,646 12,000.00 91,752,000.00
Ruvuma 48,775 26,436 20,000.00 528,720,000.00 16,242 10,000.00 162,420,000.00 6,097 12,000.00 73,164,000.00
Rukwa 41,000 35,875 20,000.00 717,500,000.00 - 10,000.00 - 5,125 12,000.00 61,500,000.00
Katavi 41,000 22,222 20,000.00 444,440,000.00 13,653 10,000.00 136,530,000.00 5,125 12,000.00 61,500,000.00
Morogoro 88,911 30,658 20,000.00 613,160,000.00 48,889 10,000.00 488,890,000.00 9,364 12,000.00 112,368,000.00
Kigoma 46,944 25,444 20,000.00 508,880,000.00 15,632 10,000.00 156,320,000.00 5,868 12,000.00 70,416,000.00
Shinyanga 6,000 3,252 20,000.00 65,040,000.00 1,998 10,000.00 19,980,000.00 750 12,000.00 9,000,000.00
Mwanza 8,000 4,336 20,000.00 86,720,000.00 2,664 10,000.00 26,640,000.00 1,000 12,000.00 12,000,000.00
Geita 22,000 11,923 20,000.00 238,460,000.00 7,327 10,000.00 73,270,000.00 2,750 12,000.00 33,000,000.00
Kagera 25,000 13,551 20,000.00 271,020,000.00 8,324 10,000.00 83,240,000.00 3,125 12,000.00 37,500,000.00
Mara 35,000 18,970 20,000.00 379,400,000.00 11,655 10,000.00 116,550,000.00 4,375 12,000.00 52,500,000.00
Dodoma 35,641 11,960 20,000.00 239,200,000.00 19,226 10,000.00 192,260,000.00 4,455 12,000.00 53,460,000.00
Singida 2,000 - 20,000.00 - - 10,000.00 - 2,000 12,000.00 24,000,000.00
Tabora 55,282 - 20,000.00 - 48,372 10,000.00 483,720,000.00 6,910 12,000.00 82,920,000.00
Pwani 14,981 - 20,000.00 - 7,983 10,000.00 79,830,000.00 6,998 12,000.00 83,976,000.00
Mtwara 36,500 31,937 20,000.00 638,740,000.00 - 10,000.00 - 4,563 12,000.00 54,756,000.00
Lindi 37,000 32,375 20,000.00 647,500,000.00 - 10,000.00 - 4,625 12,000.00 55,500,000.00
Arusha 55,000 30,810 20,000.00 616,200,000.00 18,315 10,000.00 183,150,000.00 5,875 12,000.00 70,500,000.00
Manyara 60,000 43,200 20,000.00 864,000,000.00 10,800 10,000.00 108,000,000.00 6,000 12,000.00 72,000,000.00
Kilimanjaro 60,519 43,563 20,000.00 871,260,000.00 10,891 10,000.00 108,910,000.00 6,065 12,000.00 72,780,000.00
Tanga 36,000 6,815 20,000.00 136,300,000.00 24,810 10,000.00 248,100,000.00 4,375 12,000.00 52,500,000.00
Jumla/TOTAL 940,783 515,755 10,315,100,000.00 312,079 3,120,790,000.00 112,949 1,355,388,000.00

DRAFT FOR DISCUSSION
76
Fertilizer - Phosphate Fertilizer - Nitrogen Grand Total
No of Voucher Value of
Vouchers Total Cost/Value No of Voucher Value of Voucher Total Cost/Value
61,854 40,000.00 2,474,160,000.00 61,854 30,000.00 1,855,620,000.00 5,299,034,000.00
37,400 40,000.00 1,496,000,000.00 37,400 30,000.00 1,122,000,000.00 3,366,000,000.00
24,811 50,000.00 1,240,550,000.00 24,811 40,000.00 992,440,000.00 2,663,582,000.00
61,165 50,000.00 3,058,250,000.00 61,165 40,000.00 2,446,600,000.00 6,468,592,000.00
48,775 50,000.00 2,438,750,000.00 48,775 40,000.00 1,951,000,000.00 5,154,054,000.00
41,000 50,000.00 2,050,000,000.00 41,000 40,000.00 1,640,000,000.00 4,469,000,000.00
41,000 50,000.00 2,050,000,000.00 41,000 40,000.00 1,640,000,000.00 4,332,470,000.00
88,911 40,000.00 3,556,440,000.00 88,911 30,000.00 2,667,330,000.00 7,438,188,000.00
46,944 50,000.00 2,347,200,000.00 46,944 40,000.00 1,877,760,000.00 4,960,576,000.00
6,000 50,000.00 300,000,000.00 6,000 40,000.00 240,000,000.00 634,020,000.00
8,000 50,000.00 400,000,000.00 8,000 40,000.00 320,000,000.00 845,360,000.00
22,000 50,000.00 1,100,000,000.00 22,000 40,000.00 880,000,000.00 2,324,730,000.00
25,000 50,000.00 1,250,000,000.00 25,000 40,000.00 1,000,000,000.00 2,641,760,000.00
35,000 50,000.00 1,750,000,000.00 35,000 40,000.00 1,400,000,000.00 3,698,450,000.00
35,641 40,000.00 1,425,640,000.00 35,641 30,000.00 1,069,230,000.00 2,979,790,000.00
2,000 40,000.00 80,000,000.00 2,000 30,000.00 60,000,000.00 164,000,000.00
55,282 40,000.00 2,211,280,000.00 55,282 30,000.00 1,658,460,000.00 4,436,380,000.00
14,981 40,000.00 599,240,000.00 14,981 30,000.00 449,430,000.00 1,212,476,000.00
36,500 40,000.00 1,460,000,000.00 36,500 30,000.00 1,095,000,000.00 3,248,496,000.00
37,000 40,000.00 1,480,000,000.00 37,000 30,000.00 1,110,000,000.00 3,293,000,000.00
55,000 40,000.00 2,200,000,000.00 55,000 30,000.00 1,650,000,000.00 4,719,850,000.00
60,000 40,000.00 2,400,000,000.00 60,000 30,000.00 1,800,000,000.00 5,244,000,000.00
60,519 40,000.00 2,420,760,000.00 60,519 30,000.00 1,815,570,000.00 5,289,280,000.00
36,000 40,000.00 1,440,000,000.00 36,000 30,000.00 1,080,000,000.00 2,956,900,000.00
940,783 41,228,270,000.00 940,783 31,820,440,000.00 87,839,988,000.00
DRAFT FOR DISCUSSION
77
Appendix 7: Technical Details of the Impact Evaluation
This appendix complements Chapter 3 and describes some of the more technical aspects of
the evaluation. It also reports on key outcomes constructed from the household survey. The
results reported are calculated at the plot level with standard errors clustered at the household
level.
1. Sample Size and Power Calculations
Power calculations were conducted only for the household survey, which would be used to
determine program impacts. Based on the calculations using both the 2003 Agricultural
Census and 2008 National Panel Survey data, the necessary sample size for the household
study was estimated to be approximately 200 villages with 10 observations (farming
households) per village, or 2,000 households in total. This sample size allows the detection of
a change in yields of at least 34 percent between treatment and control groups. In order to
maximize power in comparisons between treatment and controls, approximately 120 villages
were sampled in the 3 regions where targeting interventions were conducted, and 80 villages
were sampled in the other regions.
Additional power calculations were conducted following the baseline survey since the
targeting interventions had not been successfully implemented in two of the three northern
highland regions (see Changes to the Sample,in Section 3.1.7. These revised calculations
revealed that if the sample size was doubled in Arusha (from 460 households to 920
households), there would be a power to detect a 30 percent increase in yields, assuming a
conservative intraclass correlation of 0.1 and 46 clusters. Given that the yield changes were
larger than 200 percent in the baseline listing survey, Arusha‟s sample size was indeed
expanded.
2. Other outcomes
Table 1 complements the results based on the listing survey in Table 3.3, by using data from
the household survey. Because the household survey contains plot and crop information on
input usage, we are able to run regressions using only maize plots in 2010/11 (columns 2 –
10) or rice plots (columns 11-13). Interestingly, we find that while the areas planted of maize
by non-beneficiaries are 2.82 acres, participation in NAIVS leads to a lower area planted by
about 1 acre. This reduction in area planted is statistically significant at the 5 percent level.
This effect is mostly concentrated in the northern regions where the reduction in area planted
under maize is about 1.5 acres. The program leads to no change in the area for paddy
cultivation. The program also leads to a reduction in the probability of total crop failure,
defined as the event of planting some area but being unable to harvest any area. The 2010/11
season experienced some drought, so perhaps the improved seeds included varieties that
matured earlier and thus could work with less rainfall, while a later maturing traditional
variety could not. NAIVS also leads to an increase in the probability that a plot receives
improved seeds and fertilizer.
About half of the plots of non-beneficiaries use improved seeds, while the beneficiaries are
20 percent more likely to use improved seeds. The likelihoods of fertilizer usage in the plots
DRAFT FOR DISCUSSION
78
are 25 percent and 56 percent for non-beneficiaries and beneficiaries, respectively. Of course,
some of the beneficiary plots did not received improved seeds and fertilizer, which was due
to the fact that some beneficiaries had about 2 acres and the program only covered inputs for
one acre. Among those beneficiaries that only had one plot, these increases are even larger,
90 percent for seeds and 70 percent for fertilizer. The increase of fertilizer usage is also
statistically significant for beneficiaries, about 47 kg more compared with non-beneficiaries.
The impacts for paddy are smaller and less significant, as also reported in Table A.1. These
increases in improved inputs in maize translate into significant increases in yields, from 5.81
in a log scale to 6.16.13
Panel B reports gains in food security and yields at the household level between beneficiaries
and non-beneficiaries. Household expenditure on food is higher among beneficiaries than
non-beneficiaries but the difference is not significant. Food security is measured with a set of
indicators such as “Number of meals per day in the last 30 days”, etc. We report the first
component of a principal component analysis using all these indicators and find that food
security is significantly higher among beneficiaries than non-beneficiaries for both seasons.
Finally, yields measured at the household level, aggregating the production from all maize
plots also report a 50 percent increase in yield for beneficiaries. The fact that this number is
even higher in North suggests that beneficiaries may also be growing maize in smaller and
less productive plots, lowering the plot-level coefficient for beneficiaries, relative to non-
beneficiaries.
13 Yields are computed as log(1+yield) and thus the regression includes observations with crop failures.
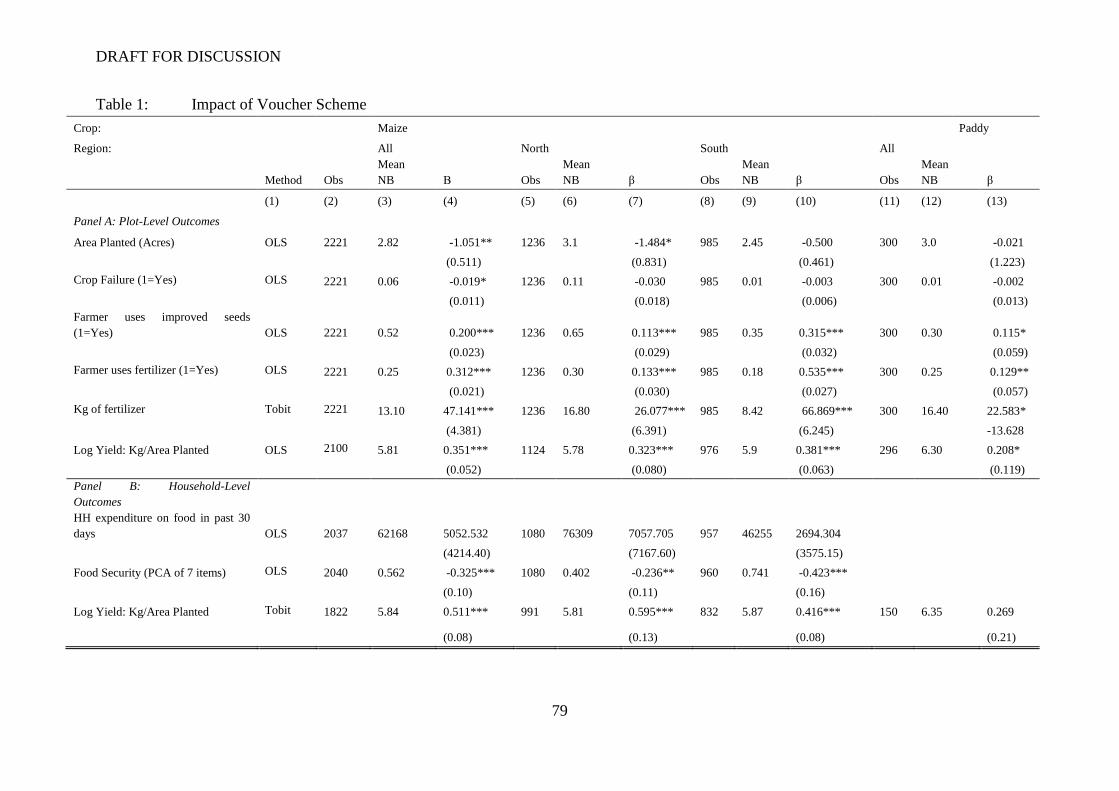
DRAFT FOR DISCUSSION
79
Table 1: Impact of Voucher Scheme
Crop: Maize Paddy
Region: All North South All
Method Obs
Mean
NB Β Obs
Mean
NB β Obs
Mean
NB β Obs
Mean
NB β
(1) (2) (3) (4) (5) (6) (7) (8) (9) (10) (11) (12) (13)
Panel A: Plot-Level Outcomes
Area Planted (Acres) OLS 2221 2.82 -1.051** 1236 3.1 -1.484* 985 2.45 -0.500 300 3.0 -0.021
(0.511) (0.831) (0.461) (1.223)
Crop Failure (1=Yes) OLS 2221 0.06 -0.019* 1236 0.11 -0.030 985 0.01 -0.003 300 0.01 -0.002
(0.011) (0.018) (0.006) (0.013)
Farmer uses improved seeds
(1=Yes) OLS 2221 0.52 0.200*** 1236 0.65 0.113*** 985 0.35 0.315*** 300 0.30 0.115*
(0.023) (0.029) (0.032) (0.059)
Farmer uses fertilizer (1=Yes) OLS 2221 0.25 0.312*** 1236 0.30 0.133*** 985 0.18 0.535*** 300 0.25 0.129**
(0.021) (0.030) (0.027) (0.057)
Kg of fertilizer Tobit 2221 13.10 47.141*** 1236 16.80 26.077*** 985 8.42 66.869*** 300 16.40 22.583*
(4.381) (6.391) (6.245) -13.628
Log Yield: Kg/Area Planted OLS 2100 5.81 0.351*** 1124 5.78 0.323*** 976 5.9 0.381*** 296 6.30 0.208*
(0.052) (0.080) (0.063) (0.119)
Panel B: Household-Level
Outcomes
HH expenditure on food in past 30
days OLS 2037 62168 5052.532 1080 76309 7057.705 957 46255 2694.304
(4214.40) (7167.60) (3575.15)
Food Security (PCA of 7 items) OLS 2040 0.562 -0.325*** 1080 0.402 -0.236** 960 0.741 -0.423***
(0.10) (0.11) (0.16)
Log Yield: Kg/Area Planted Tobit 1822 5.84 0.511*** 991 5.81 0.595*** 832 5.87 0.416*** 150 6.35 0.269
(0.08) (0.13) (0.08) (0.21)
DRAFT FOR DISCUSSION
80
Note: * p<0.10** p<0.05*** p<0.01. An observation in Panel A (Panle B) is a plot (household). In Panel A, standard errors reported in brakets below the coefficients in columns 4, 7, 10 and 13 are
clustered at the household level. The items used to construct the Food security index are as follows: "HH worried about the amount of food at least one time in the last 30 days", "HH forced to eat at
unpreffered food at least one time in the last 30 days", "Meals were smaller during lean period", "Meals per day in last 30 days" "Meals per day in a month during lean period", "Days HH member
went to bed hungry in last 30 days", "Days HH member went to bed hungry in a month during lean period".
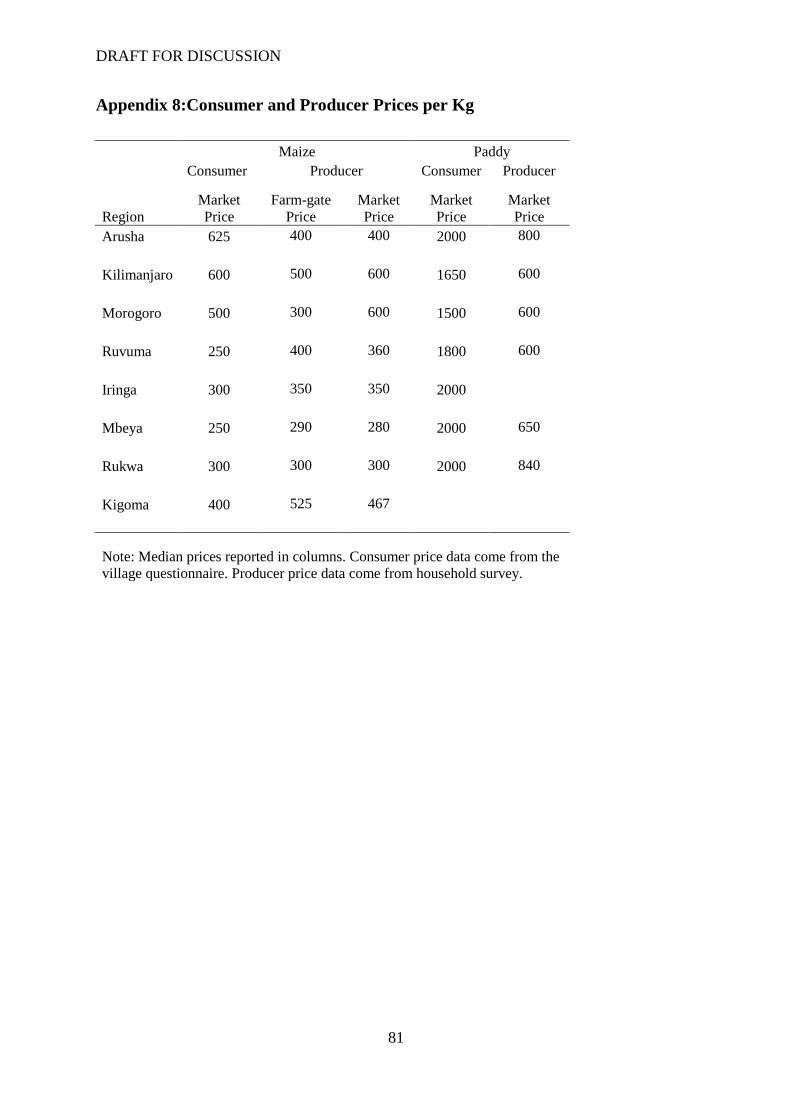
DRAFT FOR DISCUSSION
81
Appendix 8:Consumer and Producer Prices per Kg
Maize Paddy
Consumer Producer Consumer Producer
Region Market
Price Farm-gate
Price Market
Price Market
Price Market
Price
Arusha 625 400 400 2000 800
Kilimanjaro 600 500 600 1650 600
Morogoro 500 300 600 1500 600
Ruvuma 250 400 360 1800 600
Iringa 300 350 350 2000
Mbeya 250 290 280 2000 650
Rukwa 300 300 300 2000 840
Kigoma 400 525 467
Note: Median prices reported in columns. Consumer price data come from the
village questionnaire. Producer price data come from household survey.
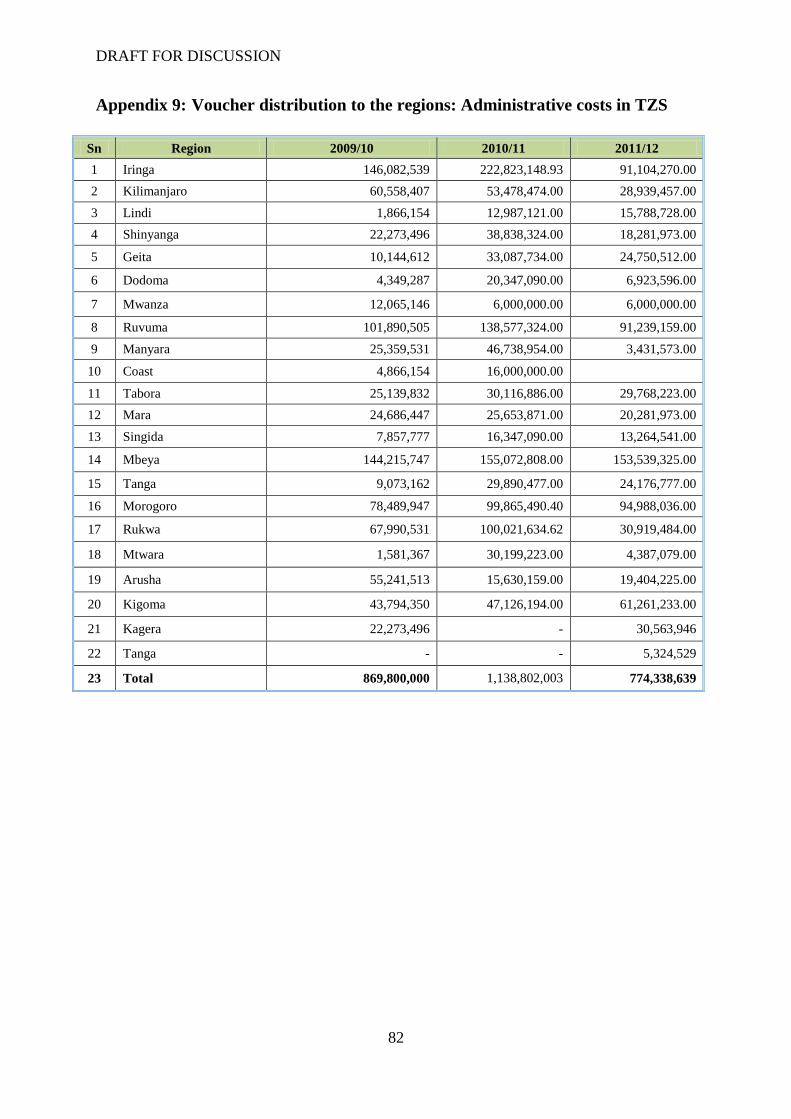
DRAFT FOR DISCUSSION
82
Appendix 9: Voucher distribution to the regions: Administrative costs in TZS
Sn Region 2009/10 2010/11 2011/12
1 Iringa 146,082,539 222,823,148.93 91,104,270.00
2 Kilimanjaro 60,558,407 53,478,474.00 28,939,457.00
3 Lindi 1,866,154 12,987,121.00 15,788,728.00
4 Shinyanga 22,273,496 38,838,324.00 18,281,973.00
5 Geita 10,144,612 33,087,734.00 24,750,512.00
6 Dodoma 4,349,287 20,347,090.00 6,923,596.00
7 Mwanza 12,065,146 6,000,000.00 6,000,000.00
8 Ruvuma 101,890,505 138,577,324.00 91,239,159.00
9 Manyara 25,359,531 46,738,954.00 3,431,573.00
10 Coast 4,866,154 16,000,000.00
11 Tabora 25,139,832 30,116,886.00 29,768,223.00
12 Mara 24,686,447 25,653,871.00 20,281,973.00
13 Singida 7,857,777 16,347,090.00 13,264,541.00
14 Mbeya 144,215,747 155,072,808.00 153,539,325.00
15 Tanga 9,073,162 29,890,477.00 24,176,777.00
16 Morogoro 78,489,947 99,865,490.40 94,988,036.00
17 Rukwa 67,990,531 100,021,634.62 30,919,484.00
18 Mtwara 1,581,367 30,199,223.00 4,387,079.00
19 Arusha 55,241,513 15,630,159.00 19,404,225.00
20 Kigoma 43,794,350 47,126,194.00 61,261,233.00
21 Kagera 22,273,496 - 30,563,946
22 Tanga - - 5,324,529
23 Total 869,800,000 1,138,802,003 774,338,639
DRAFT FOR DISCUSSION
83
Appendix 10: Terms of reference of the district agriculture and livestock
development officer (DALDO)
The District Agricultural and Livestock Development Officers are responsible for all
agricultural and livestock related activities; and are key players in making sure that set
agricultural development activities are achieved. The TOR for the DALDO in relation to the
AFSP (and therefore NAIVS) is as follows:
(a) Knows the number of farm families in his district and those eligible for inputs
subsidy.
(b) Compiles agricultural inputs potential demands (such as chemicals, fertilizer and
seeds) for the region.
(c) Ensures that vouchers allocated to his/her district reaches the farmers.
(d) Ensures that recruitment of agro-dealers is properly done.
(e) Ensures that adequate agro-dealers are available and are well distributed.
(f) Ensures that adequate inputs are available in his/her district and that the agro-dealers
have adequate inputs in the village shops.
(g) Monitors that the inputs being sold by agro-dealers are of good quality by effectively
utilizing the services of the fertilizer and seed inspectors.
(h) Monitors the day to day activities in relation to implementation of the AFSP.
(i) Makes sure that all district committee members effectively participate in the
implementation of the AFSP.
(j) Receives inputs vouchers and distributes them to the villages.
(k) Monitors the implementation of the AFSP by the villages and sends monthly reports
on the general performance of the AFSP to the region.
(l) Evaluates the impact of the NAIVS in increasing production and productivity at
farmer level.
(m) Keeps track of the inputs prices and gives monthly feedbacks to the region.
(n) Provides funds to VAEO to carry out FFS
DRAFT FOR DISCUSSION
84
Appendix 11: Terms of reference of the Village Agricultural Extension
Officer (VAEO)
The VAEO is responsible for all agricultural activities in the village, and thus is entrusted
with the following in relation to the AFSP and therefore NAIVS:
(a) Have a very close working relationship with the VVC
(b) Ensures that the selection criterion set for eligible farmers have been followed.
(c) Keeps a register of the selected farmers and sends the list to the ward, division and
district.
(d) Ensures that agro-dealers are available and have opened shops in his/her village(s).
(e) Keeps a close check on the inputs stock position and sends an alarm to the DALDOs
office as appropriate.
(f) Provides technical backstopping to farmers using inputs.
(g) Makes sure that farmers use inputs as per recommendations
(h) Provides weekly progress reports to the DALDOs office on implementation of
AFSP.
(i) Conducts FFS to facilitate farmers training.