public expose 2014 - chandra asri petrochemical · public expose 2016 pt chandra asri petrochemical...
TRANSCRIPT
Public Expose 2016
PT Chandra Asri Petrochemical Tbk Jakarta, 6 June 2016

1. Company Profile
2. Operational & Financial Performance
3. Project Updates
4. Industry Outlook
2
1. Company Profile 2. Operational & Financial Performance 4. Industry Outlook
3. Project Updates
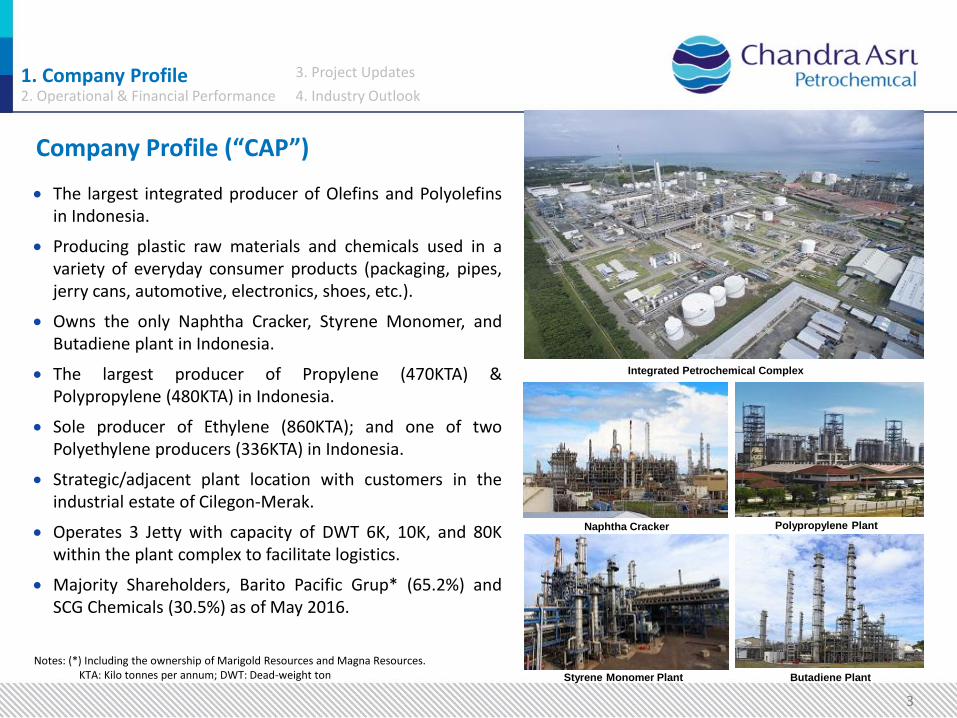
Company Profile (“CAP”)
The largest integrated producer of Olefins and Polyolefins in Indonesia.
Producing plastic raw materials and chemicals used in a variety of everyday consumer products (packaging, pipes, jerry cans, automotive, electronics, shoes, etc.).
Owns the only Naphtha Cracker, Styrene Monomer, and Butadiene plant in Indonesia.
The largest producer of Propylene (470KTA) & Polypropylene (480KTA) in Indonesia.
Sole producer of Ethylene (860KTA); and one of two Polyethylene producers (336KTA) in Indonesia.
Strategic/adjacent plant location with customers in the industrial estate of Cilegon-Merak.
Operates 3 Jetty with capacity of DWT 6K, 10K, and 80K within the plant complex to facilitate logistics.
Majority Shareholders, Barito Pacific Grup* (65.2%) and SCG Chemicals (30.5%) as of May 2016.
Integrated Petrochemical Complex
Styrene Monomer Plant Butadiene Plant
Naphtha Cracker Polypropylene Plant
Notes: (*) Including the ownership of Marigold Resources and Magna Resources. KTA: Kilo tonnes per annum; DWT: Dead-weight ton
3

Integrated Business Operations “Integrated business operations from upstream to downstream resulting in higher efficiency, lower costs, and value-added”.
4
New Generation Synthetic Rubber
Polypropylene Polyethylene Styrene Monomer
Up
stre
am
Pe
tro
che
mic
al
Ethylene Propylene Py-Gas Mixed C4
Mid
stre
am
Pe
tro
che
mic
al
O
il &
Gas
CAP Products Future products by SRI
Crude Oil
Diesel Kerosene Gasoline
Refinery
Naphtha Cracker
Naphtha LPG
Raffinate - 1 Butadiene
Condensate
CAP Facility Legend:
1. Company Profile 2. Operational & Financial Performance 4. Industry Outlook
3. Project Updates

Integrated Business Operations (cont’d)
Notes: (1) LLDPE: Linear Low Density Polyethylene (2) HDPE: High Density Polyethylene
Homopolymer
Random
Copolymer
Impact (Block) Copolymer
Ethylene
Key Products Plant Main Process Key Markets
330 KTPA
860 KTPA
430 KTPA
100 KTPA
Propylene
470 KTPA
Py-Gas
400 KTPA
Crude C4
315 KTPA
Domestic
Exporr
Domestic
Domestic
Export
Export
Domestic
Export
Domestic
Naphtha Cracker
licensed by Lummus and
KBR. Polypropylene
W.R. Grace
480 KTPA
Styrene Monomer
Licensed by Mobil-Badger and Lummus
340 KTPA
LLDPE(1)
HDPE(2)
Polyethylene
Licensed by Univation
336 KTPA
Naphtha
2,300 KTPA
Butadiene
BASF/Lummus
100 KTPA
Improved margins along the integration of the production value chain
5
1. Company Profile 2. Operational & Financial Performance 4. Industry Outlook
3. Project Updates

Strategic Location “Adjacent and interlinked with customer’s facilities (45 km Ethylene pipeline)”.
6
Anyer
Cilegon
Merak
Jetty CAP Pipeline New Toll Road Existing Road
Puloampel-
Serang
Main Plant
Main Plant Capacity (ktpa)
– Ethylene: 860
– Propylene: 470
– Py-Gas: 40 0
– Mixed C4: 315
– Polyethylene: 336
– Polypropylene: 480
Butadiene Plant: 100 ktpa
On-Site Power
Styrene Monomer Plant
Capacity 340 ktpa
Sriwie
Dongjin Lautan Otsuka
Asahimas Polypet PET
Polyprima PTA ARCO PPG
Amoco Mitsui TITAN PE
Mitsubishi Kasei PIPI PS and SBL
Unggul Indah AB Prointail
Statomer PVC Buana Sulfindo
Santa Fe
Rhone Poulenc SBL Sulfindo Adiusaha
NAOH, CL2
Golden Key ABS Multisidia
Risjad Brasali EPS, SAN
Trans Bakrie Cont Carbon CB
Indochlor
Sintetikajaya
Showa Esterindo Sulfindo Adi. PVC
Polychem Redeco
Cabot
Siemens
Hoechst
KS
Dow Chemical
Air Liquide
UAP
Existing customers with pipeline access
NSI
Sulfindo Adi.
EDC, VCM
Indonesia
Cilegon
Main Plant
CAP’s Petrochemical Complexes
N
1. Company Profile 2. Operational & Financial Performance 4. Industry Outlook
3. Project Updates
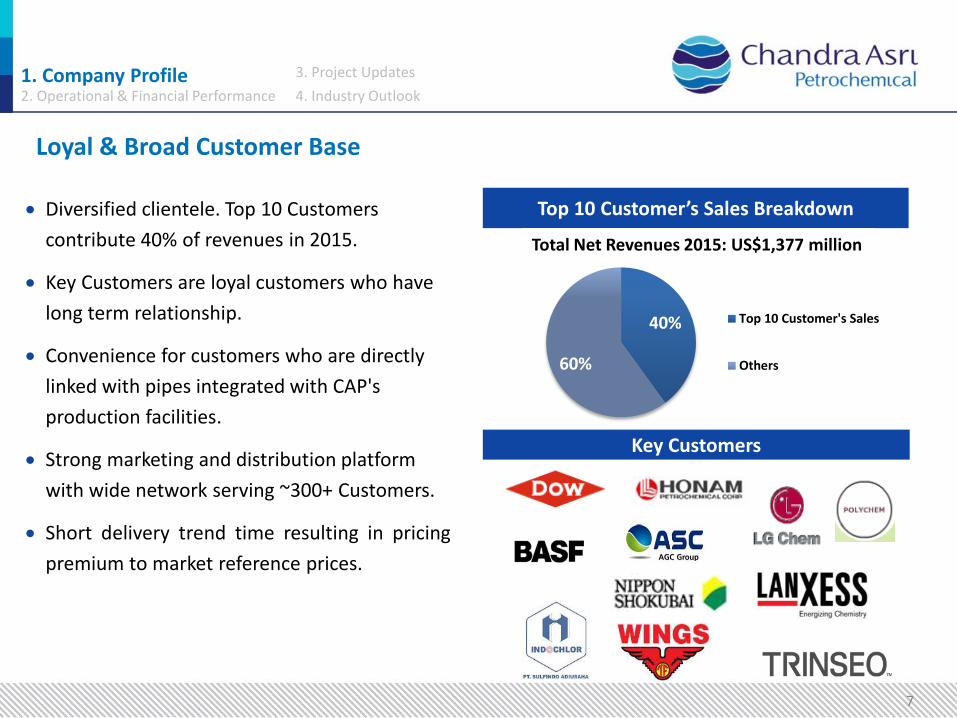
Loyal & Broad Customer Base
7
Top 10 Customer’s Sales Breakdown Diversified clientele. Top 10 Customers
contribute 40% of revenues in 2015.
Key Customers are loyal customers who have
long term relationship.
Convenience for customers who are directly
linked with pipes integrated with CAP's
production facilities.
Strong marketing and distribution platform
with wide network serving ~300+ Customers.
Short delivery trend time resulting in pricing
premium to market reference prices.
Key Customers
40%
60%
Top 10 Customer's Sales
Others
Total Net Revenues 2015: US$1,377 million
1. Company Profile 2. Operational & Financial Performance 4. Industry Outlook
3. Project Updates
1. Company Profile
2. Operational & Financial Performance
3. Project Updates
4. Industry Outlook
8

Ethylene
Plan Utilization Rate
Polyethylene, Polypropylene, Styrene Monomer, Butadiene
Decline of utilization in 2015 was due to shutdowns in the 4th quarter for Tie-in work of the Cracker Expansion project. In addition, within the 85-day shutdowns period were also conducted a Turnaround Maintenance (TAM).
1st Quarter -2016, plant utilization showed an increase post Expansion completion in Dec-2015. Cracker plant has a new capacity of 860 KTA (up to 43%) and ramp up gradually to optimum capacity.
Butadiene Plant operates since Sept-2013.
1. Company Profile
2. Operational & Financial Performance 4. Industry Outlook
3. Project Updates
9
(dalam %)
94 93
80 89
95 99
92 89 95
74 69 72 76 79
47
76
2013 2014 2015 1Q-16
Polyethylene Polypropylene Styrene Monomer Butadiene
99 94
57 66
2013 2014 2015 1Q-16

10
Ethylene
Volume (KT)
Price & spread (US$/ton)
Propylene
Volume (KT)
Price & spread (US$/ton)
109 139
19 51
1Q-15A 1Q-16
296
182
32 32
2014A 2015A
59 78
4 18
1Q-15A 1Q-16
447 479
931
552
1.378
1.031
2014A 2015A
375 550
574 376
949 926
1Q-15A 1Q-16
415 256
931
552
1.345
808
2014A 2015A
182 268
574 376
756 644
1Q-15 1Q-16
561
339
189
82
2014A 2015A
Volume and Price by products Olefins
1. Company Profile
2. Operational & Financial Performance 4. Industry Outlook
3. Project Updates

11
Volume and Price by products Polyolefins
Polypropylene
Volume (KT)
Price & spread (US$/ton)
Polyethylene
Volume (KT)
Price & spread (US$/ton)
477 444
471 449
2014A 2015A
118 105 124 110
1Q-15A 1Q-16
311
224
314
227
2014A 2015A
74 74 74 68
1Q-15A 1Q-16
739 697
931
552
1.670
1.249
2014A 2015A
694 642
574 376
1.268
1.018
Q1-15A Q1-16
711 807
931
552
1.642
1.359
2014A 2015A
712 825
574 376
1.286 1.201
Q1-15A Q1-16
1. Company Profile
2. Operational & Financial Performance 4. Industry Outlook
3. Project Updates

12
Volume and Price by products Styrene Monomer and Butadiene
79
47
82
46
2014A 2015A
Butadiene
Volume (KT)
Price & spread (US$/ton)
(1)Styrene Monomer and by products (Toluene and Ethyl Benzene)
Styrene Monomer(1)
Volume (KT)
Price & spread (US$/ton)
(3)
16 19 13 17
1Q-15A 1Q-16
250 234 257
230
2014A 2015A
52 60 50 62
1Q-15A 1Q-16
398 391
931
552
1.329
943
2014A 2015A
231 370
574 376
805 746
Q1-15A Q1-16
326 373
1.280
721
1.605
1.094
2014A 2015A
238 390
733 567
971 957
Q1-15A Q1-16
1. Company Profile
2. Operational & Financial Performance 4. Industry Outlook
3. Project Updates

Financial Highlights: Financial Position FY-2015 and 1Q-2016
31-Dec-2014 (US$ ‘000)
31-Dec-2015 (US$ ‘000)
31-Mar-2016 (US$ ‘000)
Changes Yoy (%)
Changes Ytd (%)
Cash and cash equivalents 207,939 96,835 141,242 -53.4 45.9
Current Assets (exclude Cash and cash equivalents)
458,495 319,799 339,572 -30.3 6.2
Non Current Assets 1,257,077 1,445,752 1,461,442 15.0 1.1
TOTAL ASSETS 1,923,511 1,862,386 1,942,256 -3.2 4.3
Current Liabilities 477,912 377,753 440,255 -21.0 16.5
Non Current Liabilities 579,737 597,787 579,753 3.1 -3.0
Equity 865,862 886,846 922,248 2.4 4.0
TOTAL LIABILITIES AND EQUITY 1,923,511 1,862,386 1,942,256 -3.2 4.3
13
1. Company Profile
2. Operational & Financial Performance 4. Industry Outlook
3. Project Updates

Financial Highlights: Profit or Loss FY-2015 and 1Q-2016
FY-2014 (US$ ‘000)
FY-2015 (US$ ‘000)
Changes (%)
3M-2015 (US$ ‘000)
3M-2016 (US$ ‘000)
Changes (%)
Net Revenues 2,460,051 1,377,573 -44.0 357,933 358,895 0.3
Cost of Revenues 2,342,587 1,231,844 -47.4 341,186 296,396 -13.1
Gross Profit 117,464 145,729 24.1 16,747 62,499 273.2
Operating Profit (Loss) 50,187 79,222 57.9 (531) 45,894 8,742.9
Profit (Loss) For The Year 18,439 26,256 42.4 2,849 35,402 1,142.6
EBITDA 133,762 154,825 15.7 31,299 68,091 117.6
Gross Profit Margin (%) 4.8 10.6 4.7 17.4
Operating Profit Margin (%) 2.0 5.8 -0.1 12.8
Net Profit Margin (%) 0.7 1.9 0.8 9.9
EBITDA Margin (%) 5.4 11.2 8.7 19.0
14
1. Company Profile
2. Operational & Financial Performance 4. Industry Outlook
3. Project Updates

Diverse Product Portfolio
Olefins Polyolefins Butadiene Styrene Monomer
Ethylene
Py-Gas
Propylene
Mixed C4 Polypropylene
Polyethylene
Established PT Synthetic Rubber Indonesia, JV between SMI and Michelin, to build Styrene Butadiene Rubber plant.
Net Revenues US$869 million
Net Revenues US$171 million
Net Revenues US$256 million
Net Revenues US$78 million
63% 12% 19%
Net Revenues FY-2015: US$1,377 million (100%)
6%
15
1. Company Profile
2. Operational & Financial Performance 4. Industry Outlook
3. Project Updates

358
359
4.7%
17.4%
0,0%
2,0%
4,0%
6,0%
8,0%
10,0%
12,0%
14,0%
16,0%
18,0%
20,0%
357
358
358
358
358
358
359
359
1Q-2015 1Q-2016
18
26
0.7%
1.9%
0,2%0,3%0,4%0,5%0,6%0,7%0,8%0,9%1,0%1,1%1,2%1,3%1,4%1,5%1,6%1,7%1,8%1,9%2,0%
-
4
8
12
16
20
24
28
2014 2015
2.8
35.4
0.8%
9.9%
0,0%
2,0%
4,0%
6,0%
8,0%
10,0%
12,0%
-
5,0
10,0
15,0
20,0
25,0
30,0
35,0
40,0
1Q-2015 1Q-2016
Financial Performance
16
2,460
1,378
4,8%
10.6%
0,0%
2,0%
4,0%
6,0%
8,0%
10,0%
12,0%
- 50 100 150 200 250 300 350 400 450 500 550 600 650 700 750 800 850 900 950 1.000 1.050 1.100 1.150 1.200 1.250 1.300 1.350 1.400 1.450 1.500 1.550 1.600 1.650 1.700 1.750 1.800 1.850 1.900 1.950 2.000 2.050 2.100 2.150 2.200 2.250 2.300 2.350 2.400 2.450 2.500 2.550 2.600
2014 2015
1. Company Profile
2. Operational & Financial Performance 4. Industry Outlook
3. Project Updates
Net Revenues (million US$) & Gross Profit Margin (%)
Net Profit (million US$) & Net Profit Margin (%)
1. Company Profile
2. Operational & Financial Performance
3. Project Updates
4. Industry Outlook
17

1. Company Profile
2. Operational & Financial Performance 4. Industry Outlook 3. Project Updates
18 18
DA-415 New Propylene Tower EBR Compressor BA-109 New Furnace
Achieved Mechanical Completion on 9 December 2015.
TAM/Expansion tie-in works successfully completed on
schedule. Cracker re-started with on-spec products on
19 December, 5-days ahead of plan.
Total spending US$378m vs budget of US$380m as of
31 December 2015.
Cracker facility capacity increased to 860 KTA (up to
43%) since early 2016.
Cracker Expansion Project
"With Cracker capacity equivalent to world-class capacity added with plant
modernization, CAP further established its position in the
petrochemical industry in Indonesia".

19 19
Cracker Expansion Project
1. Company Profile
2. Operational & Financial Performance 4. Industry Outlook 3. Project Updates

20 20
EPC contract awarded to Toyo Engineering & IKPT in
June 2015.
CAP has fully injected total equity of US$54m.
Overall progress 27% as of May 2016.
Drainage work & temporary site facility completed.
Soil improvement work, civil construction work,
structure and building erection, on-going.
Future SBR Plant Facility Area
Soil Improvement CCR & Substation Temporary Site Facility
SBR plant project
1. Company Profile
2. Operational & Financial Performance 4. Industry Outlook 3. Project Updates
1. Company Profile
2. Operational & Financial Performance
3. Project Updates
4. Industry Outlook
21

1. Company Profile
2. Operational & Financial Performance 4. Industry Outlook
3. Project Updates
80%
82%
84%
86%
88%
90%
0
100
200
300
400
500
600
700
2009 2011 2013 2015 2017F 2019F 2021F
% U
tilis
atio
n ra
tes
Gap
ove
r na
phth
a (D
olla
rs p
er to
n)
Ethylene Delta Over Net Raw Material Cost Global utilisation rates
Note:
- 2015 is based on actual on year to date basis (Jan-Nov)
- Forecast price is based on Brent Crude at $30 (2016-2020) and $50 (2021-2022) per barrel
60%
70%
80%
90%
0
200
400
600
800
1000
1200
2009 2011 2013 2015 2017F 2019F 2021F
% U
tilis
atio
n ra
tes
Gap
ove
r na
phth
a (D
olla
rs p
er to
n)
Polyolefins Delta Over Net Raw Material Cost
Global polyolefins utilisation ratesNote:
- 2015 is based on actual on year to date basis (Jan-Nov)
- Forecast price is based on Brent Crude at $30 (2016-2020) and $50 (2021-2022) per barrel
SEA Ethylene price spreads over naphtha
“Demand fundamental remain good for petrochemical industry over the next few years, new capacity additions post 2015 resulting in modest decline in average margins following period of sustained higher profitability”
Source: Nexant (Feb 2016)
SEA Polyolefins price spreads over naphtha
Industry Outlook
22

70%
80%
90%
100%
0
100
200
300
400
500
600
2009 2011 2013 2015 2017F 2019F 2021F
% U
tilis
atio
n ra
tes
Gap
ove
r ne
t raw
mat
eria
l cos
t (D
olla
rs p
er to
n)
Styrene Delta Over Net Raw Material Cost* Global utilisation rates
Note: - 2015 is based on actual on year to date basis (Jan-Nov)
- Forecast price is based on Brent Crude at $30 (2016-2020) and $50 (2021-2022) per barrel
* Styrene market price less net raw material prices (benzene*.0.78 + ethylene*0.28)
23
60%
70%
80%
90%
100%
0
500
1000
1500
2000
2500
2009 2011 2013 2015 2017F 2019F 2021F
% U
tilis
atio
n ra
tes
Gap
ove
r na
phth
a (D
olla
rs p
er to
n)
Butadiene Delta Over Net Raw Material Cost Global utilisation rates
Note:
- 2015 is based on actual on year to date basis (Jan-Nov)
- Forecast price is based on Brent Crude at $30 (2016-2020) and $50 (2021-2022) per barrel
SEA Butadiene price spreads over Net Raw Material Cost SEA SM price spreads over Net Raw Material Cost
Source: Nexant (Feb 2016)
Industry Outlook (Cont’d)
1. Company Profile
2. Operational & Financial Performance 4. Industry Outlook
3. Project Updates
24
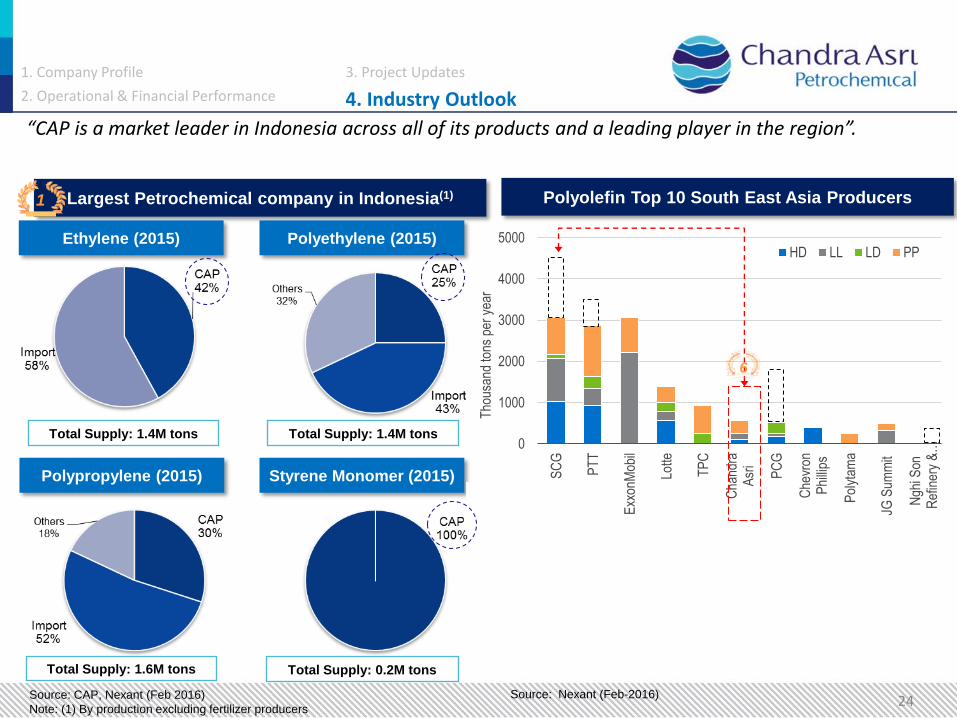
“CAP is a market leader in Indonesia across all of its products and a leading player in the region”.
0
1000
2000
3000
4000
5000
SC
G
PT
T
Exx
onM
obil
Lotte
TP
C
Cha
ndra
Asr
i
PC
G
Che
vron
Phi
llips
Pol
ytam
a
JG S
umm
it
Ngh
i Son
Ref
iner
y &
…
Tho
usan
d to
ns p
er y
ear
HD LL LD PP
Polyolefin Top 10 South East Asia Producers Largest Petrochemical company in Indonesia(1)
Ethylene (2015) Polyethylene (2015)
1
Polypropylene (2015) Styrene Monomer (2015)
Source: CAP, Nexant (Feb 2016)
Note: (1) By production excluding fertilizer producers
Total Supply: 1.4M tons
Total Supply: 1.6M tons Total Supply: 0.2M tons
6
Source: Nexant (Feb-2016)
Total Supply: 1.4M tons
1. Company Profile
2. Operational & Financial Performance 4. Industry Outlook
3. Project Updates

Thank You
Disclaimer: Important Notice • This document was prepared solely and exclusively for the parties presently being invited for the purpose of discussion. Neither this document nor any
of its content may be reproduced, disclosed or used without the prior written consent of PT Chandra Asri Petrochemical Tbk. • This document may contain statements that convey future oriented expectations which represent the Company’s present views on the probable future
events and financial plans. Such views are presented on the basis of current assumptions, are exposed to various risks and are subject to considerable changes at any time. Presented assumptions are presumed correct, and based on the data available on the date, which this document is assembled. The company warrants no assurance that such outlook will, in part of as a whole, eventually be materialized. Actual results may diverge significantly from those projected. The information in this document is subject to change without notice, its accuracy is not verified or guaranteed, it may be incomplete or condensed and it may not contain all material information concerning the Company.
• None of the Company, PT Chandra Asri Petrochemical Tbk or any person connected with any of them accepts any liability whatsoever for any loss howsoever arising from any use of this document or its contents or otherwise arising in connection therewith.
Address: PT Chandra Asri Petrochemical Tbk Wisma Barito Pacific Tower A, Lt. 7 Jl. Let. Jend. S. Parman Kav. 62-63 Jakarta 11410
Contact: Investor Relations Email: [email protected] Tel: +62 21 530 7950 Fax: +62 21 530 8930
Visit our website at www.chandra-asri.com