public health response to page indiana tornadoes, 2012 · public health response to indiana...
TRANSCRIPT

1
Volume 20, Issue 6 November/December 2012
Public Health Response to
Indiana Tornadoes, 2012 Jim Ignaut, MA, MPH, MCHES
Field Epidemiologist, District 9
On March 2, 2012, devastating tornadoes tore through
several counties in southern Indiana. Initial responders
included local and state public health professionals.
The bulk of the damage occurred in District 9,
including Clark, Jefferson, Ripley and Scott counties,
and Washington County in District 8. In some District
9 counties, multiple locations were badly affected and
needed urgent response efforts. Each of these counties
reported at least one tornado-related death.
The following are first-hand perspectives from local
health departments (LHDs) whose counties were
involved in this disaster (Clark, Jefferson, Ripley, Scott and Washington) and from
counties not affected but who sent staff to assist, including Dearborn, Floyd, Harrison and
Jennings.
The first tornado touched down in Henryville in Clark County on March 2. The Henry
County Health Department’s multi-disciplinary approach and collaboration with other
response partners and volunteers allowed them to address a variety of issues including
food and water safety, damage assessment, provision of tetanus vaccinations and
dissemination of information to the public. They noted that collaboration with the
Medical Reserve Corps and neighboring LHD staff enhanced their ability to respond
more effectively. Doug Bentfield, Clark County Environmentalist, noted that some of the
most important things in a response are to “have a plan, be prepared, be
fluid….flexible….know your partners prior to an event.”
Jefferson County Public Health Nurse (PHN), Karen Buchanan, reported that preparing
tetanus clinics and going door to door were highly effective in providing comprehensive
immunization coverage. She noted, “Everybody wanted to tell their story….people may
need some psychological first aid.” Karen remarked that their health officer and
environmental staff were also onsite offering whatever services were needed. In Ripley
County, the Emergency Management Agency was in contact with the LHD prior to the
Article
Page
Public Health Response to
Indiana Tornadoes, 2012
Ratio of Controller to Total
Medications in Indiana’s
Medicaid Population
Hepatitis and Baby
Boomers
Training Room
ISDH Data Reports
HIV Summary
Disease Reports
1
3
5
7
9
9
10

2
tornado touching down. Immediately following the tornado, the LHD staff joined forces
with the Red Cross at their shelter and addressed public health needs. Patti Hall, Scott
County Health Department, summarily noted that “whether we want to or not, we (public
health) will be involved in disasters and many times be front and center.” The health
department proved to be very flexible in providing services throughout the response.
Peggy Scott, Washington County Health Department, noted that the county suffered
significant damage to property and devastating loss of life. She went on to say that
public health played a crucial role in the response. Their mobile tetanus clinics provided
tetanus vaccines and provided emotional comfort to those who suffered losses.
Impressed by the influx of volunteers, Peggy reflected that re-establishment of the local
planning committee would be helpful to prepare for future responses.
Four of the District 9 counties unaffected by the tornadoes proved to be valuable
resources. Dearborn County PHNs Lois Franklin and Debbie Fehling volunteered to
provide services and resources needed by neighboring counties. When Floyd County
Health Department received word of the disaster, Dr. Thomas Harris, Medical Director,
authorized Administrator Charlotte Bass and Environmentalist Jack Travillian to contact
Washington County. That first night they transported a trailer full of supplies to Salem
and Henryville. Throughout the response, they kept in constant communication with the
District 9 preparedness team and LHDs responding to requests for assistance with tetanus
vaccinations and registrar services. Harrison County Health Department staff was
involved in response efforts with neighbors in Salem. They traveled throughout affected
areas, inquiring about injuries, providing tetanus shots and participating in the “One Stop
Shop.” Their PHN, Jeanine Fonda, observed that it would be very helpful to have the
“One Stop Shop” as local as possible. It was also advantageous to exchange after-hours
contact information with PHNs from other departments in case of emergency.
Pam Petry, Jennings County Health Department, provided her thoughts on the response
effort: “I just felt compelled to help. It could have been us.” Ultimately, they assisted
Scott, Clark, and Ripley counties, participating in the “One Stop Shop” and provided
services including administering tetanus shots, volunteering at vital records and traveling
to other counties to provide assistance. Pam concluded, “This was a good chance to
evaluate response efforts and the equipment used. It made us consider what we might do
in a real event in our county.”
Loss of life, serious injuries and large areas of destruction occurred as a result of these
two tornadoes. However, many of the responses were organized immediately following
the disaster. Public health services were quickly incorporated into the response matrix in
a coordinated way. Important aspects of the response included highly effective and
immediate efforts by counties affected and collaboration with neighboring LHDs in
reinforcement of services.
In evaluating the overall response effort, public health staff identified several strategies,
attributes and tactics they viewed as integral to a successful response, including
flexibility, spontaneity, training, partnership development, collaboration with neighboring
jurisdictions, situational and needs assessments, process evaluation, connectivity with
EOC/ICS, communications and inclusiveness.
3
Acknowledgements:
The Indiana State Department of Health (ISDH) wishes to acknowledge the following local
public health professionals who contributed to this article:
Clark County Health Department: Douglas Bentfield, Laura Lindley, Alan Martin, Todd
Webb, Drew Roudenbush; Dearborn County Health Department: Lois Franklin; Floyd
County Health Department: Tamyra Spear; Harrison County Health Department: Jeanine
Fonda; Jefferson County Health Department: Karen Buchanan; Jennings County Health
Department: Pam Petry; Ripley County Health Department: Pat Thomas, Holly Rose; Scott
County Health Department: Patti Hall; and Washington County Health Department: Peggy
Scott.
Ratio of Controller to Total Asthma Medications
in Indiana’s Medicaid Population
Amy Brandt, MPH
Epidemiologist, Chronic Respiratory Disease Section
Asthma is a common chronic disease which causes lung airways to swell and constrict,
leading to shortness of breath, wheezing, chest tightness and wheezing. According to the
2011 Behavioral Risk Factor Surveillance System data, an estimated 9.5 of children in
Indiana currently have asthma.1 The National Heart, Lung and Blood Institute’s
Guidelines for the Diagnosis and Management of Asthma stress the importance of routine
office visits and appropriate use of asthma medications for effective disease
management.2 In Indiana from 2006 to 2010, 24.0% of children with asthma did not see
their health care provider for routine visits concerning their condition.3 Asthma
medications are an essential element in controlling daily asthma symptoms and in rescue
situations. They are also indicators of asthma control and may predict poor health
outcomes, such as emergency department (ED) visits, hospitalizations and, in rare cases,
death. This analysis was conducted to assess medication use among Indiana children with
asthma and how that influenced use of ED services and health outcomes.
Children aged 17 and younger were identified from Indiana's 2011 Medicaid
administrative claims database. This study included children who were continuously
enrolled in a Medicaid program for at least 11 months in the calendar year and met the
definition of persistent asthma in 2010 and 2011. Persistent asthma was defined as having
one or more of the following in the study period: four or more asthma medication
dispensing events, one or more ED visit with asthma as the primary diagnosis, one or
more hospitalizations with asthma as the primary diagnosis, or four or more asthma-
related outpatient visits and two or more asthma medication dispensing events. Statistical
analysis included odds ratios (OR), 95% confidence intervals (95% CI), Wilcoxon rank-
sum tests and logistic regression.
Most children with persistent asthma have symptom-free periods separated by asthma
attacks. Two categories of medications are typically used in asthma care: controller meds
to prevent attacks and rescue meds for use during attacks. The use of controller
medications varies by asthma severity, type of medication and medication supply.
Consequently, tracking the basic count of medications during a calendar year was not
4
practical. To address this challenge, the Healthcare Effectiveness Data and Information
Set (HEDIS) measure called the Asthma Medication Ratio was used.4
The controller-to-total asthma medications ratio (AMR) was defined as the sum of
controller prescription claims divided by the total number of controller and rescue
prescription claims. For the purpose of this analysis, rescue medications were defined as
short-acting beta2-agonist (SABA) prescription claims. Children with an AMR of 0.5 or
more were classified as high ratio and those with an AMR of less than 0.5 were classified
as low ratio. High ratio indicates a greater use of controller medications in relation to all
asthma medications, while low ratio indicates a greater use of rescue medications in
relation to all asthma medications. For children with persistent asthma, the ideal situation
is to use more controller medications than rescue medications.
In 2011, 16,825 Indiana children met the study definition of being continuously enrolled
in Medicaid with persistent asthma. Of these children, 46.2% were classified as low ratio.
Sex, race and mean age were significantly different between AMR groups with a higher
proportion of low AMR children being male (60.0% vs. 58.3%), black (34.5% vs. 25.1%)
and younger (mean 8.3 vs. 8.5 years). Low AMR children had a mean of 6.0 SABA
prescriptions and high AMR children had 2.6 (p<0.0001). The mean AMR for low ratio
children was 0.21 and 0.68 for high ratio children.
A total of 3,017 children with persistent asthma had an asthma-related ED visit in 2011.
Of these children, 55.9% were considered low ratio. Adjusting for demographic
covariates, low AMR children were 1.96 (95% CI: 1.80–2.15) times more likely to have
an asthma ED visit than high AMR children. Other predictors of an ED visit in the
Medicaid population were living in a metropolitan area (OR: 1.15, 95% CI: 1.02–1.31),
black vs. white (OR: 2.32, 95% CI: 2.10–2.56), Hispanic vs. white (OR: 2.07, 95% CI:
1.78–2.41) and age (OR: 0.96, 95% CI: 0.95–0.97).
In 2011, almost half (46.2%) of Indiana’s child Medicaid population used more rescue
medications than long-term controller medications. This analysis demonstrated that
overusing rescue medications is associated with poor asthma-related health outcomes.
Having a low AMR nearly doubled the risk of having an asthma ED visit compared to
children with a high AMR.
Health care providers, parents, school nurses and day care instructors can all contribute to
effective asthma management. High levels of rescue medication use may reveal
opportunities for education, support, reassessment or further intervention. Nearly one out
of four children with persistent asthma in Indiana is not seeing a health care provider for
routine asthma care. Education and increased access to primary care can improve asthma
self-management and help children stay out of the ED. Consistent access to prescribed
medications, and the correct administration of those medications can minimize negative
health outcomes. These strategies coordinated through an asthma action plan can help
children with persistent asthma live active, productive lives.
References:
1. Centers for Disease Control and Prevention. (2012a). Behavioral Risk Factor Surveillance
System, 2011.

5
2. National Heart, Lung and Blood Institute. (2007). Guidelines for the Diagnosis and
Management of Asthma (EPR-3).
3. Centers for Disease Control and Prevention. (2012b). Behavioral Risk Factor Surveillance
System Asthma Call-Back Survey, 2006-2010.
4. National Committee for Quality Assurance. (2011). Proposed Measures for HEDIS 2012:
Asthma Medication Ratio and Medication Management for People with Asthma.
Hepatitis and Baby Boomers
Brittany Gross, MPH
Viral Hepatitis Prevention Coordinator
Hepatitis C is a liver disease caused by the hepatitis C virus (HCV). HCV infection
sometimes results in an acute illness, but typically becomes a chronic condition that can
lead to liver damage, cirrhosis, liver cancer and death. Chronic HCV infection is the
leading indication for liver transplants in the United States.1 The five year (2006–2010)
age-adjusted mortality rate due to HCV in Indiana is 1.4 per 100,000.2
Additionally,
HCV was indicated as having contributed to 2.8 deaths per 100,000 individuals in
Indiana during that same time period.3
Confirmation of HCV infection requires specific serologic testing. In 2012, 121 cases of
acute hepatitis C infection were reported in Indiana.4
Since new infections are typically
asymptomatic, many acute HCV infections go unreported. While some individuals will
clear the virus without treatment or progression to chronic disease, 75–85% of cases will
progress to chronic infection. Chronic HCV infections can go unnoticed without
discernible signs or symptoms for several decades. The Centers for Disease Control and
Prevention (CDC) estimates that 3.2 million individuals in the United States have chronic
HCV infection. The infection is most common in “baby-boomers,” adults born between
1945 and 1965. While the specific reasons why this age group has the highest rates of
HCV are not completely understood, it is believed that the majority were likely infected
during the 1970s and 1980s when rates of infection were much higher than they are now.5
HCV transmission is most commonly associated with percutaneous exposure to infected
blood, such as receipt of blood, blood products or organs prior to 1992, receipt of clotting
factors prior to 1987, injection drug use, birth to an HCV-infected mother or needle-
sticks in the healthcare setting. Infrequent, but still viable methods of HCV transmission
include sex with an HCV-infected individual, sharing personal items, such as razors or
toothbrushes, contaminated with infectious blood or healthcare activities that involve
invasive procedures.
The CDC recommends that all baby-boomers be screened for HCV infection.6
Prior
recommendations for HCV screening focused on individuals with known risk factors.
While testing for HCV, a full viral hepatitis blood panel could also be completed to test
for other forms of hepatitis. Although no vaccine exists for HCV, it is recommended that
infected individuals be vaccinated for hepatitis A and hepatitis B. Health care providers
are encouraged to test this age group and vaccinate when appropriate, as many
individuals may not have received vaccinations previously. For more information on
hepatitis C and baby boomers, please refer to the CDC fact sheet, Chronic Hepatitis C:
Why Baby Boomers Should Get Tested.

6
For additional information about hepatitis in Indiana, contact Brittany Gross at
[email protected] or 317-233-7627.
References:
1. Centers for Disease Control and Prevention. Viral Hepatitis. Accessed at
http://www.cdc.gov/hepatitis/ on March 5, 2013.
2. Centers for Disease Control and Prevention, National Center for Health Statistics. Underlying
Cause of Death 1999–2010 on CDC WONDER Database. Accessed at
http://wonder.cdc.gov/ucd-icd10.html on March 4, 2013.
3. Centers for Disease Control and Prevention, National Center for Health Statistics. Multiple
Cause of Death 1999–2010 on CDC WONDER Database. Accessed at
http://wonder.cdc.gov/mcd-icd10.html on March 4, 2013.
4. Indiana State Department of Health, Epidemiology Resource Center. Hepatitis C: Quick
Facts.
5. Centers for Disease Control and Prevention. Chronic Hepatitis C: Why Baby Boomers Should
Get Tested. Accessed on March 6, 2013 at
http://www.cdc.gov/knowmorehepatitis/Media/PDFs/FactSheet-Boomers.pdf
6. Centers for Disease Control and Prevention. Recommendations for the Identification of
Chronic Hepatitis C Virus Infection Among Persons Born During 1945–1965. MMWR
2012;61(RR04);1-18.

7
TTTrrraaaiiinnniiinnnggg RRRoooooommm
INDIANA STATE DEPARTMENT OF HEALTH IMMUNIZATION PROGRAM PRESENTS:
Immunizations from A to Z
Immunization Health Educators offer this FREE, one-day educational course that
includes:
Principles of Vaccination
Childhood and Adolescent Vaccine—Preventable Diseases
Adult Immunizations—Pandemic Influenza
General Recommendations on Immunization
o Timing and Spacing
o Indiana Immunization Requirements
o Administration Recommendations
o Contraindications and Precautions to Vaccination
Safe and Effective Vaccine Administration
Vaccine Storage and Handling
Vaccine Misconceptions
Reliable Resources
This course is designed for all immunization providers and staff. Training manual,
materials and certificate of attendance are provided to all attendees. Please see the
Training Calendar for presentations throughout Indiana. Registration is required. To
attend, schedule/host a course in your area or for more information, please visit
http://www.in.gov/isdh/17193.htm.
Renewing the Spirit: Refresh, Revitalize, Rejuvenate
2013 ISDH Public Health Nurse Conference
May 9-10, 2013
Sheraton Indianapolis Hotel at Keystone Crossing
8787 Keystone Crossing
Indianapolis, IN 46240
Presented by:
Indiana State Department of Health
and
St. Vincent Health

8
Please mark your calendars for the 2013 ISDH Public Health Nurse Conference.
Conference information will be sent out via email and highlighted in upcoming issues of
Health Officer News, the VacZine and posted on the LHD Resource SharePoint website.
For more information, contact: Dana Greenwood, Chief Nurse Consultant, Indiana State
Department of Health Immunization Division, 317-233-7560 or

9
ISDH Data Reports
The following data reports and the Indiana Epidemiology Newsletter are available on
the ISDH webpage: http://www.IN.gov/isdh/
HIV/STD/Viral Hepatitis Semi-Annual Report
(June 2007–June 2012)
Indiana Mortality Report (1999–2010)
Indiana Cancer Reportss: Incidence; Mortality;
Facts & Figures
Indiana Infant Mortality Report
(1999, 2002, 1990-2003)
Indiana Health Behavior Risk Factors Report
(1999–2010)
Indiana Natality Report (1998–2010)
Indiana Health Behavior Risk Factors (BRFSS)
Newsletter (2003–2013)
Indiana Induced Termination of Pregnancy
Report (1998–2011)
Indiana Hospital Consumer Guide (1996)
Indiana Marriage Report
(1995, 1997-2004)
Public Hospital Discharge Data (1999–2011)
Indiana Infectious Disease Report (1997-2009)
Assessment of Statewide Health Needs (2007)
Indiana Maternal & Child Health Outcomes &
Performance Measures (1989–1998, 1990–
1999, 1991–2000, 1992–2001, 1993–2002,
1994–2003, 1995–2004, 1996–2005, 1997–
2006, 1998–2007, 1999–2008)
HIV Disease Summary
Information as of December 31, 2012*
HIV— without AIDS:
435 New HIV cases from November 1, 2011
thru October 31, 2012
12-month
incidence 7.15 cases/100,000
4,888 Total HIV-positive, alive and without
AIDS on October 31, 2012
Point
prevalence 80.38 cases/100,000
AIDS cases:
392 New AIDS cases from November 1, 2011
thru October 31, 2012
12-month
incidence 6.44 cases/100,000
5,800 Total AIDS cases, alive on October 31,
2012
Point
prevalence 95.38 cases/100,000
11,914 Total AIDS cases, cumulative (alive and dead) on October 31, 2012
*rates based on Indiana 2000 population
10
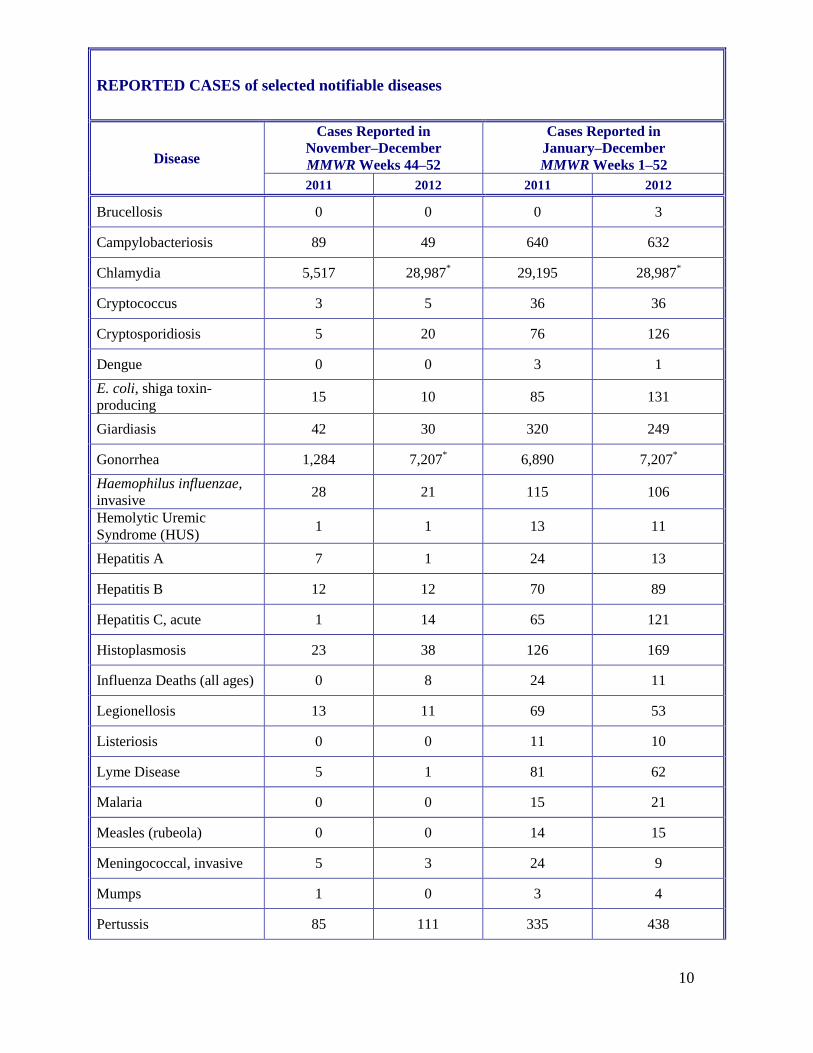
REPORTED CASES of selected notifiable diseases
Disease
Cases Reported in
November–December
MMWR Weeks 44–52
Cases Reported in
January–December
MMWR Weeks 1–52
2011 2012 2011 2012
Brucellosis 0 0 0 3
Campylobacteriosis 89 49 640 632
Chlamydia 5,517 28,987* 29,195 28,987
*
Cryptococcus 3 5 36 36
Cryptosporidiosis 5 20 76 126
Dengue 0 0 3 1
E. coli, shiga toxin-
producing 15 10 85 131
Giardiasis 42 30 320 249
Gonorrhea 1,284 7,207* 6,890 7,207
*
Haemophilus influenzae,
invasive 28 21 115 106
Hemolytic Uremic
Syndrome (HUS) 1 1 13 11
Hepatitis A 7 1 24 13
Hepatitis B 12 12 70 89
Hepatitis C, acute 1 14 65 121
Histoplasmosis 23 38 126 169
Influenza Deaths (all ages) 0 8 24 11
Legionellosis 13 11 69 53
Listeriosis 0 0 11 10
Lyme Disease 5 1 81 62
Malaria 0 0 15 21
Measles (rubeola) 0 0 14 15
Meningococcal, invasive 5 3 24 9
Mumps 1 0 3 4
Pertussis 85 111 335 438

11
Rocky Mountain
Spotted Fever 0 0 3 2
Rubella 0 0 0 1
Salmonellosis 63 65 617 771
Shigellosis 17 6 87 121
Severe Staphylococcous
aureus in Previously
Healthy Person
3 3 14 21
Group A Streptococcus,
invasive 29 19 194 174
Group B, Streptococcus,
Invasive (All ages) 64 62 335 377
Streptococcus pneumoniae
(invasive, all ages) 170 164 799 719
Streptococcus pneumoniae
(invasive, drug resistant) 48 49 219 199
Streptococcus pneumoniae
(invasive, <5 years of age) 8 11 40 38
Syphilis (Primary
and Secondary) 30 221
* 168 221
*
Toxic Shock Syndrome,
streptococcal (STSS) 0 3 8 17
Tuberculosis 20 24 100 102
Tularemia 0 0 0 4
Typhus/Rickettsial disease 0 0 1 1
Varicella 57 111 93 461
Vibriosis 0 0 2 6
West Nile Virus 0 0 11 1
Yersiniosis 0
3 10 10
Animal Rabies 1 (Bats) 0 33 (Bats) 8 (Bats)
Animal Bites New addition to
report 861
New addition to
report 6,703
*Provisional aggregate data for 2012
For information on reporting of communicable diseases in Indiana, call the Surveillance and
Investigation Division at 317.233.7125.

12
State Health Commissioner
William C. VanNess, II, MD
Chief of Staff
Jim Huston
State Epidemiologist
Pam Pontones, MA
Editor
Pam Pontones, MA
Contributing Authors
Andrea Allen, MPH
Amy Brandt, MPH
Laura Gano, MPH
Brittany Gross, MPH
Dan Hillman, MPH
Jim Ignaut, MA, MPH, MCHES
Ryan Ly, MPH
Design/Layout
Champ Thomaskutty, MPH
The Indiana Epidemiology Newsletter
is published bi-monthly by the Indiana
State Department of Health to provide
epidemiologic information to Indiana
health care professionals, public health
officials and communities.