public health wales child measurement programme phwo child meas… · mari jones, leon may, arthur...
TRANSCRIPT
Public Health Wales
Child Measurement ProgrammeReport 2012/13

Child Measurement Programme for Wales Report 2012/13
Author
Linda Bailey Consultant in Public Health / Health Intelligence
Data extraction Louise Richards (NHS Wales Informatics Service)
Data analysis Holly Walsh (Lead Analyst), Mari Jones, Leon May, Arthur Duncan-Jones, Rhys Powell, Ioan Francis
Acknowledgements Many thanks to families and children who participated in the Programme and to the staff in Health Boards who have supported the Programme across Wales.
Thank you to Dr. Judith Greenacre, Dr. Ciaran Humphreys, Dr. Dyfed Huws, Dr. Teri Knight and Nathan Lester in the Public Health Wales Health Intelligence Division for advice during drafting of the report. Thank you also to the Child Measurement Programme staff – Ros Causey, Helen Crowther and Maggie Grayson.
Publication details
Title: Child Measurement Programme for Wales Report 2012/13 Publisher: Public Health Wales NHS Trust Date: July 2014 ISBN: 978-0-9928835-3-9
For further information please contact: Child Measurement Programme Tel: 02920 827630 Email: [email protected] Website: www.publichealthwales.org/childmeasurement
© 2014 Public Health Wales NHS Trust Material contained in this document may be reproduced without prior permission provided it is done so accurately and is not used in a misleading context.
Acknowledgement to Public Health Wales NHS Trust to be stated. Copyright in the typographical arrangement, design and layout belongs to Public Health Wales NHS Trust.
Child Measurement Programme for Wales Report 2012/13 1
Foreword
Overweight and obesity is one of the main risks for shortened life expectancy in the adult population of Wales. Obesity is also a threat to child health. For example more children are being diagnosed at a younger age with type 2 diabetes due to obesity. As well as physical consequences it can cause significant emotional distress in children who are affected. The good news is that the majority of
children measured in the Child Measurement Programme for Wales were of a healthy weight. And although it is too early in the life of
the programme to identify any persistent trends, there has been a small fall in the prevalence of overweight and obesity in reception year children
between 2011/12 and 2012/13.
While individual interventions have a part to play in supporting children to achieve a healthy weight, it is the multiple actions taken at a societal level that have the most impact. There has already been investment in Wales in measures designed to address the obesity challenge. These include the Active Travel Bill and Healthy Eating in Schools Measure as well as programmes such as Flying Start and Change4Life. The Child Measurement Programme should, in time, be able to identify if these measures are halting the rise in child obesity.
The Child Measurement Programme for Wales is an annual surveillance programme. As well as prevalence of overweight and obesity, the programme also identifies a small number of children who are underweight or not as tall as expected. Over time, as more information is gathered, it will reveal a picture of the trends in child growth and inform plans to address the issue.
We are very grateful to all the families in Wales who have allowed their children to be part of the programme and to the staff in the health boards who have supported the programme.
Professor Peter Bradley Executive Director of Public Health Development
Public Health Wales

Child Measurement Programme for Wales Report 2012/132
Contents
Figures 3
Abbreviations 4
1 Summary 5
Key messages 5
2 Introduction 7
3 About the Programme 9
3.1 Aims 9
3.2 Child Measurement Programme 9 Standards and Guidelines
3.3 History of the programme in Wales 9
3.4 Potential extension of the 10 programme
3.5 Factors affecting the Child 10 Measurement Programme in 2012/13
4 Results 11
4.1 Participation 11
4.2 Healthy weight 13
4.3 Overweight and obesity in children 16
4.4 Obesity 19
4.5 Underweight children 20
4.6 Comparison with 2011/12 20
4.7 Gender 22
4.8 Ethnicity 23
4.9 Low height 25
4.10 Comparisons with England 25
5 Methods 28
5.1 The measurement process 28
5.2 BMI in adults 28
5.3 Classifying a child’s BMI 28
5.4 Which records are included? 29
5.5 Small number suppression 29
5.6 Confidence intervals and statistical 30 significance
6 Conclusions 31
Appendix 1 33
Sample centile charts 33
Appendix 2 35
Recording of ethnicity 35
Appendix 3 36
Reference tables 36
Appendix 4 41
Distribution of height, weight 41 and body mass index
Appendix 5 44
Additional maps 44
References 47

Child Measurement Programme for Wales Report 2012/13 3
FiguresChild Measurement Programme Wales 2012/2013
Figure 1 Proportion of children aged 4 11 to 5 years participating Wales and local authorities
Figure 2 Proportion of children aged 4 12 to 5 years participating in child measurement programme by health board
Figure 3 Proportion of children aged 4 13 to 5 years participating in child measurement programme by deprivation quintile
Figure 4 Map – proportion of children 14 aged 4 to 5 years who are healthy weight, Wales
Figure 5 Proportion of children aged 4 15 to 5 years, who are a healthy weight or underweight, by local authority
Figure 6 Proportion of children aged 4 15 to 5 years, who are a healthy weight or underweight, by health board
Figure 7 Proportion of children aged 4 16 to 5 years who are overweight or obese, by local authority
Figure 8 Proportion of children aged 4 17 to 5 years who are overweight or obese, by health board
Figure 9 Proportion of children aged 4 17 to 5 years who are overweight or obese by deprivation quintile
Figure 10 Proportion of girls aged 4 18 to 5 years who are overweight or obese by deprivation quintile
Figure 11 Proportion of boys aged 4 18 to 5 years who are overweight or obese by deprivation quintile
Figure 12 Proportion of children aged 4 19 to 5 years who are obese by local authority
Figure 13 Proportion of children aged 4 19 to 5 years who are obese by health board
Figure 14 Proportion of children aged 4 20 to 5 years who are obese by deprivation quintile
Figure 15 Children aged 4 to 5 years by 20 weight category, comparison 2011/12 and 2012/13
Figure 16 Proportion change in overweight 21 & obesity and obesity, between 2011/12 and 2012/13 in most deprived and least deprived quintiles
Figure 17 Weight category amongst girls 22 aged 4 to 5 years, percentage by local authority
Figure 18 Weight category amongst boys 23 aged 4 to 5 years, percentage by local authority
Figure 19 Ethnicity of children aged 4 24 to 5 years participating in programme
Figure 20 Proportion of children aged 4 25 to 5 years who are overweight or obese by ethnicity
Figure 21 Participation of children aged 4 26 to 5 years, Wales, England and English regions
Figure 22 Proportion of children aged 4 26 to 5 years who are overweight or obese, Wales and English regions
Figure 23 Proportion of children, boys 27 and girls aged 4 to 5 years who are overweight or obese, Wales and England

Child Measurement Programme for Wales Report 2012/134
Abbreviations
BME Black and Minority Ethnic
BMI Body Mass Index
CDC Center for Disease Control (USA)
CI Confidence interval
CMP Child Measurement Programme for Wales
COSI Childhood Obesity Surveillance Initiative
IOTF International Obesity Task Force
LSOA Lower super output area
NCCHD National Community Child Health Database
NCMP National Child Measurement Programme England
NHS National Health Service
NICE National Institute of Health and Clinical Excellence
NWIS NHS Wales Information Service
ONS Office for National Statistics
UK 90 British 1990 Growth Reference (See section 5.3)
WHO World Health Organization
WIMD Welsh Index of Multiple Deprivation

Child Measurement Programme for Wales Report 2012/13 5
Summary
This is the second report of the Child Measurement Programme for Wales. This report contains the findings of the programme of child measurements carried out during the academic year 2012/13 with children who were in the reception year (age four to five) age-group.
Key messages
●● 29,238 (84.3%) of the 34,679 children eligible for inclusion in the programme had measurements taken in line with the Child Measurement Programme standards and guidance, and analysis of their measurements have therefore been included in this report. 51% of the children were boys and 49% were girls.
●● Nearly three quarters of the children measured (73.2%) had a body mass index (BMI) classified as being a healthy weight.
●● The prevalence of those overweight or obese in Wales in reception year (26%) was significantly higher than that for England (22%) and also significantly higher than the English region with the highest prevalence - the north-east, at 24%.
●● Girls had a higher prevalence of healthy weight (73.9%) than boys (72.5%). However obesity prevalence in girls (11.4%) and boys (11.3%) was similar.
●● 11.3% (3,316) of children measured were obese. Prevalence of obesity was highest in Merthyr Tydfil (16.4%), and more than double that of the local authority with the lowest prevalence – Monmouthshire (7.5%)
●● There is a strong relationship between levels of obesity and deprivation – 29.4% of children living in the most deprived areas of Wales were overweight or obese, compared to 21.4% in the least deprived areas. For obesity alone, 13.6% of
children in the most deprived areas were obese, compared to 7.8% in the least deprived areas.
●● While prevalence of obesity appears to have fallen from 12.5% in 2011/12 to 11.3% in 2012/13, these figures should be treated with caution until more information for future years becomes available. What is of concern is that if the information reflects a real fall in prevalence then the fall appears to be greater in the least deprived areas of Wales (from 9.4% to 7.8%) than the fall in the more deprived areas (from 14.3% to 13.6%), and the absolute gap between obesity prevalence between the most and least deprived areas has therefore increased from 4.9% in 2011/12 to 5.8% in 2012/13.
●● This year is the first year that the Child Measurement Programme has looked at the ethnicity of children in relation to their BMI. The ethnicity of nearly 90% of children was available. The highest prevalence of overweight and obesity in reception year in Wales is seen in children of black origin (34.4%), and the lowest in children of Asian origin (23%). However the number of children with an ethnic origin other than white who were measured was comparatively small at 1,768 or 6% of the total number of children in the programme. 10% of the children measured did not have their ethnicity recorded or it was recorded as “not known”.
1

Child Measurement Programme for Wales Report 2012/136
Child Measurement Programme for Wales Report 2012/13 7
Introduction
This is the second report of the Child Measurement Programme for Wales and the first report carried out in line with standards and guidance agreed in 2012. It is also the first year that the data is published as official statistics. The report contains the results of the Child Measurement Programme which was carried out with children who were in the reception year age group (age four to five) during the academic year 2012 to 2013.
The first report, published in 2013, was described as a transitional report as not all the necessary standards, guidance, training or dedicated data collection systems were in place at the start of that school year. Information in this report is presented at a national, local authority and health board level. It is not possible to present information at a lower level (for example by school or school cluster) without running the risk of identifying individual children. Where the number of children in any category is less than five, the figures have not been included in the reference tables in Appendix 3. For prevalence of low height and underweight it has therefore been possible in most instances to present the information only at a national or health board level.
The report describes prevalence of:
●● Healthy weight
●● Overweight and obese
●● Overweight but not obese
●● Obese
●● Underweight
in children born between 1st September 2007 and 31st August 2008, and both resident and attending school in Wales. The categories are based on the body mass index (BMI) of the children taking into account their age and gender at the time they were measured. Information is also given on low height. 95% confidence intervals (CI) have been calculated for the results and where comparisons are made and have been described as ‘significant’, this means that the 95% confidence limits for two related prevalence rates don’t overlap. An explanation of confidence intervals as well as other explanations about methods used is given in Section 5 of this report.
The Child Measurement Programme is a surveillance programme. Results for an individual child are not routinely supplied to parents unless they request them. However staff involved in taking the measurements of children are expected and encouraged to take appropriate action should they identify concerns. The rationale for introducing a surveillance programme on such a large scale is to provide robust information on child growth in Wales, and on childhood obesity, which is an increasing problem across the world. Children who are underweight or of small height will also be identified through the programme, and action taken to address these issues.
2
Child Measurement Programme for Wales Report 2012/138
Children who are obese are more likely to become obese adults and this likelihood increases with age, the degree of obesity and whether they have obese parents1. Childhood obesity has adverse consequences for those children affected while they are still in childhood but also later on in life. The consequences may be directly related to their health but can also impact on their psychological, social and emotional development. As food related behaviour patterns are established early in a child’s life, often before the age of five, it is important to identify and address issues with parents and carers when children are still young.
Prevalence of childhood obesity is an ongoing concern in Wales which has one of the highest prevalence rates in Europe2. As well as increased likelihood of adult obesity and the associated higher risk of premature mortality, increased morbidity and disability in adulthood, children who are obese are reportedly being diagnosed at a much younger age with obesity related diseases such as type 2 diabetes. Adults who are obese are at greater risk of type 2 diabetes, hypertension, liver disease, heart disease and stroke, cancer, respiratory disease, osteoarthritis and female infertility3. The costs both to the NHS and to society of tackling obesity are considerable – a study commissioned by the Welsh Assembly in 2011 put the costs of obesity to the Welsh NHS at £73 million4.

Child Measurement Programme for Wales Report 2012/13 9
3About the Programme
3 .1 Aims
The Child Measurement Programme was established as a surveillance programme, aimed at giving an accurate picture of the growth of children in Wales. The results may be used for surveillance, planning of health and preventative services, research, monitoring or evaluation purposes.
The programme is not a screening programme, however health professionals carrying out measurements who identify concerns about the growth of an individual child would be expected to respond to those concerns in line with locally agreed protocols and pathways. Results for an individual child are not routinely given to parents unless they request them, or the local health board decides to supply them.
In this second full year of the Child Measurement Programme, measurements have been carried out in line with the Standards5 and Guidelines6 which were agreed by the Child Measurement Programme Steering Group and Board in 2012. The Standards and Guidelines are designed to facilitate a standardised way that children are measured so that results are robust and comparable across Wales and over time.
3 .2 Child Measurement Programme Standards and Guidelines
The Child Measurement Programme Standards and Guidelines are available on the internet here in English: http://www.wales.nhs.uk/sitesplus/888/page/67795
And in Welsh: http://www.wales.nhs.uk/sitesplus/888/tudalen/67941
The documents set out information for local health teams about how measurements should be carried out, and how the information about the measurements should be recorded. The information includes guidance on the correct weighing scales and stadiometers (equipment to measure height accurately), and use and maintenance of the equipment. There is also information about calculation and interpretation of BMI measures, staff training and local audit. This information is also available to staff and parents in the form of videos in both Welsh and English on the Public Health Wales internet site. There is a dedicated information collection module on the Community Child Health System.
Local health board teams are responsible for those elements of the programme that are delivered locally such as the weighing and measuring of children, entering information onto the computer system and provision of feedback to parents. They are also responsible for ensuring parents are given information about the programme and the opportunity to opt their children out of the programme. However the Child Measurement Programme Office requests assurance annually that local child health teams are adhering to the standards and guidance agreed.
3 .3 History of the programme in Wales
The Child Measurement Programme in Wales was started in 2011/12 following publication of a feasibility study in 20097.

Child Measurement Programme for Wales Report 2012/1310
The programme includes all children in reception year whose parents have not opted them out. The first report of the programme8 was published in July 2013, and was described as a “transitional year” to reflect that not all the standards and guidance were in place at the time the measurements began. These standards and guidance are now in place and the programme has been carried out in line with them.
The programme was established following Directions9 issued by the then Minister for Health and Social Services. These Directions came into force in August 2011. The programme is governed by the Welsh Government’s Child Measurement Programme (Wales) Regulations10, and it is coordinated by Public Health Wales, supported by the NHS Wales Information Service (NWIS). The programme is delivered by the seven health boards in Wales, with Public Health Wales having responsibility for oversight, data-analysis and reporting.
To support the establishment of the Child Measurement Programme a Steering Group and Board were established in 2011. These two groups contained representation from health boards, Public Health Wales, education, Welsh Government, voluntary sector, and NHS Wales Informatics Service. Once the programme was in place and the first report published in July 2013 it was decided that the programme should be governed by one group and a new Child Measurement Advisory Group is being put in place to provide oversight of the programme.
3 .4 Potential extension of the programme
The programme is currently carried out with children in the reception year age-group (age four to five). A pilot has been carried out measuring children in Year 4 in the Cwm Taf University Health Board, however no decision has been made yet about extending the programme to include Year 4 nationally.
Extending the programme to Year 4 rather than any other year group would allow comparisons to be drawn between Wales and other European countries who participate
in the World Health Organisation’s (WHO) European Childhood Obesity Surveillance Initiative (COSI). Choosing this age group will also mitigate against results being affected by children whose growth is impacted by puberty. Extending the programme to a second cohort of children will also allow for longitudinal comparisons, i.e. the same children will be measured at a four year interval.
In 2015 it is anticipated that the programme will also include some analysis of patterns of child growth by ONS area classification, i.e. examining whether there are different patterns of growth between children living in rural or urban areas.
3 .5 Factors affecting the Child Measurement Programme in 2012/13
There are three main factors which may have affected the numbers of measurements included in the programme this year. These are the effect on health services of a measles outbreak in Wales in Spring 2013; the introduction of a new module for recording measurements for the programme on the National Community Child Health Database (CCH2000); and a specific issue local to measurements in Powys. Both of the first two factors are thought to have impacted upon the ability of staff in all the health boards to deliver elements of the programme in line with the standards and guidance and the participation rate appears to have fallen from 88.4% in 2011/12 to 84.3% this year. For a fuller explanation please see section 4.1. The actual number of children in both years who were measured is broadly similar.
It is difficult to establish whether a fall in participation rates significantly impacts on obesity prevalence figures. However work done in the National Child Measurement Programme for England11 over a number of years suggests that while a change in participation rates can lead to a small underestimation of obesity prevalence for children in Year 6 in England (suggesting children with a higher BMI may be more likely to be opted out in that year group), it had a negligible impact upon the reception year figures in the English programme.

Child Measurement Programme for Wales Report 2012/13 11
Results
4 .1 Participation
There were 34,679 children in Wales deemed eligible for inclusion in the Child Measurement Programme in 2012/13 – that is that they were born between 1st September 2007 and 31st August 2008, and they were both resident and attending school in Wales. Of those children, 29,238 (84.3%) had not opted out and had had valid measurements taken which have been included in this analysis.
Parents/carers are given the opportunity to opt their children out of the Child Measurement Programme and in 2012/13 a total of 286 children were opted out, and accurate measurements could not be carried out on a further 17 children. In 2011/12 497 children were opted out of the programme. There are several possible reasons why accurate measurements may not be obtained, including children being unable to stand unaided on the measuring equipment or children wearing plaster casts.
Figure 1 Proportion of children aged 4 to 5, Wales and local authorities, Child Measurement Programme for Wales 2012/2013
Produced by Public Health Wales Observatory, using CMP data (NWIS).
Wales = 84.3%
Bla
enau
Gw
ent
Co
nw
y
Rh
on
dd
a C
yno
n T
af
Isle
of
An
gle
sey
Cer
edig
ion
Val
e o
f G
lam
org
an
Swan
sea
Car
dif
f
Bri
dg
end
Nea
th P
ort
Tal
bo
t
Mer
thyr
Tyd
fil
Pem
bro
kesh
ire
Den
big
hsh
ire
Car
mar
then
shir
e
Flin
tsh
ire
Wre
xham
Gw
yned
d
Torf
aen
Cae
rph
illy
Mo
nm
ou
thsh
ire
New
po
rt
Pow
ys
96.4 93.1 93.1 91.4 91.4 91.3 90.9 89.1 88.9 88.8 87.9 87.5 85.1 83.8 82.2 82.0 81.7 81.2 79.3 73.9 66.1 42.1
4

Child Measurement Programme for Wales Report 2012/1312
In the transition year of 2011/12 it was reported that there were 33,272 eligible children of whom 29,409 (88.4%) participated. So while a similar number of measurements are included for each of the years, the proportion of eligible children appears to be slightly lower this year at 84.3%. However as 2011/12 was a transition year and the first full year of the programme, there may have been some issues with calculating a rigorous denominator population for that year. The absence of the Child Measurement Programme module in 2011/12 on the National Community Child Health Database, combined with the lack of a national standard for school codes used within the database complicated the task of ensuring that all those (and only those) children in Welsh schools who were also resident in Wales were included.
A schools census is carried out every year in Wales. In January 2013, the schools census recorded that there were 35,756 children in reception year in Wales. However this figure includes children who are resident in England but attending school in Wales, and these children’s measurements would not be included in the Child Measurement
Programme. Both the timing of the school census and the inclusion in the school census of children resident in England could, in part, also explain the difference between the two figures.
There were problems in some geographical areas with participation. As is shown in Figure 1 there was a specific issue with participation in Powys. The school health team had carried out measurements with Year 1 (rather than reception year) children in the transition year. These were included last year because 2011/12 was a transition year. By 2012/13 the Standards and Guidance had been approved and information about them disseminated. These call for all measurements to be carried out in the correct school year, so the measurements obtained from Year 1 children in September 2013 in Powys are not included in this report. However the school health team in Powys will be provided with a short report detailing their full results including the Year 1 measurements. Work has been undertaken by the school health team in Powys to ensure that all measurements in future years will be taken with children in reception year.
Figure 2 Proportion of children aged 4 to 5, Wales and health boards, Child Measurement Programme for Wales 2012/2013
Produced by Public Health Wales Observatory, using CMP data (NWIS)
92.0 89.8 89.7 86.2 85.0 77.2
42.1
Cwm TafUHB
ABMUHB
Cardiff and Vale
UHB
HywelDdaUHB
BetsiCadwaladr
UHB
AneurinBevan UHB
Powys
THB
Wales = 84.3%

Child Measurement Programme for Wales Report 2012/13 13
There was an issue with the introduction of a specific Child Measurement Programme module on the Community Child Health Database – it became apparent that not all the staff in the health boards responsible for entering measurements data were entering it on the Child Measurement Programme module. This has now been addressed and all staff reminded to use the correct module.
Staff from all the health boards reported that they had faced challenges meeting the requirements of the programme because of the increased workload caused by a measles outbreak. This outbreak started in April in Swansea but there were also smaller outbreaks elsewhere in Wales including in north Wales. The impact of the measles outbreak meant that:
●● More children than usual were absent from schools on the days that measurements were being carried out.
●● School health teams were engaged in carrying out “catch up” immunisation programmes, ensuring all children were protected against measles, resulting in lack of time to make repeat visits to schools to carry out the child measurements.
●● The staff working on child health records were involved in ensuring that immunisation data was correct and running reports to identify unimmunised
children. This meant that they did not have enough time to run reports needed to identify gaps in the child measurement programme.
As can be seen from Figure 3 there is no discernible pattern in participation according to deprivation. About the same proportion (84.5%) of children from the most deprived areas in Wales participated in the programme as the Welsh average (84.3%).
4 .2 Healthy weight
A full explanation of how children are classified according to their BMI is given in section 5. Briefly, children are classified as below:
●● Underweight: BMI less than but not including the second centile
●● Healthy weight: BMI second centile up to but not including the 85th centile
●● Overweight but not obese: BMI 85th centile up to and not including 95th centile
●● Obese: 95th centile and above
Slightly different thresholds are used by clinicians and more information about this is given in section 5 – ‘Classifying a child’s BMI’
The majority of children (73.2%) attending reception year and living in Wales are of a healthy weight. However prevalence of healthy weight varies across the country.
Figure 3 Proportion of children aged 4 to 5, Welsh Index of Multiple Deprivation participating in Child Measurement Programme for Wales 2012/2013
Produced by Public Health Wales Observatory, using CMP data (NWIS)
Least deprived fifth
Next least deprived
Middle deprived
Next most deprived
Most deprived fifth
86.6 82.5 85.0 83.0 84.5
Wales = 84.3%
Child Measurement Programme for Wales Report 2012/1314
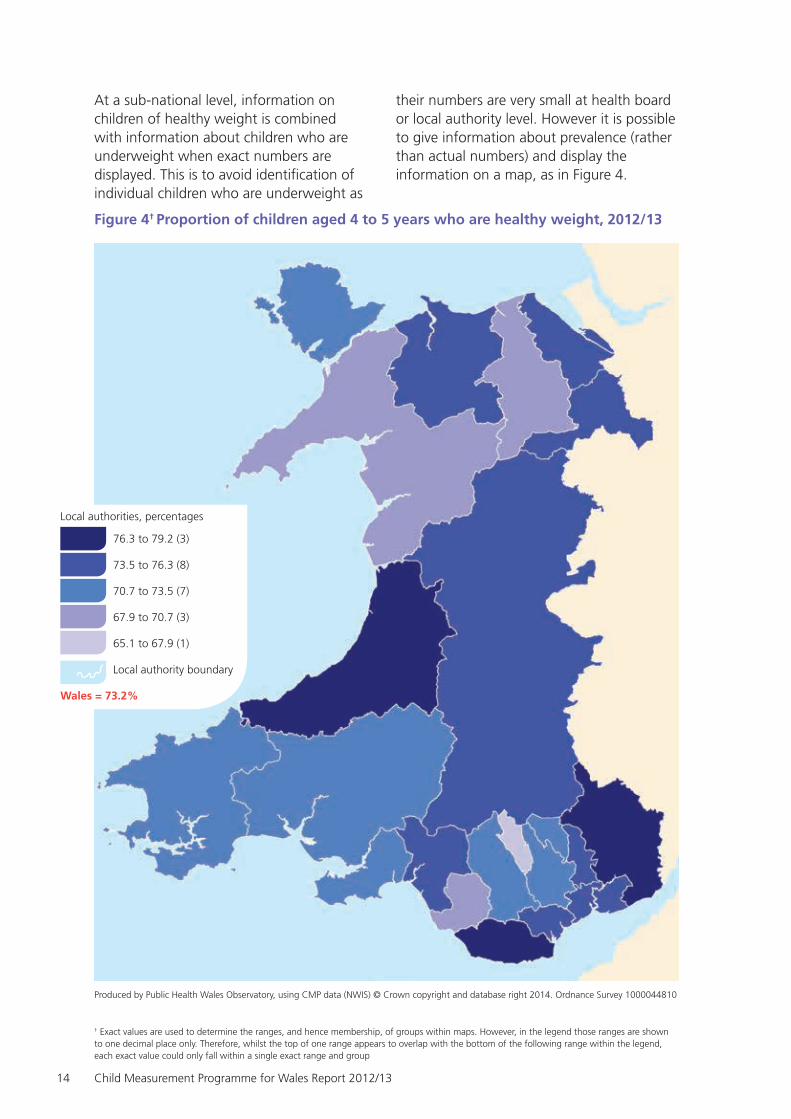
At a sub-national level, information on children of healthy weight is combined with information about children who are underweight when exact numbers are displayed. This is to avoid identification of individual children who are underweight as
their numbers are very small at health board or local authority level. However it is possible to give information about prevalence (rather than actual numbers) and display the information on a map, as in Figure 4.
Figure 4† Proportion of children aged 4 to 5 years who are healthy weight, 2012/13
Produced by Public Health Wales Observatory, using CMP data (NWIS) © Crown copyright and database right 2014. Ordnance Survey 1000044810
Local authorities, percentages
76.3 to 79.2 (3)
73.5 to 76.3 (8)
70.7 to 73.5 (7)
67.9 to 70.7 (3)
65.1 to 67.9 (1)
Local authority boundary
Wales = 73.2%
† Exact values are used to determine the ranges, and hence membership, of groups within maps. However, in the legend those ranges are shown to one decimal place only. Therefore, whilst the top of one range appears to overlap with the bottom of the following range within the legend, each exact value could only fall within a single exact range and group
Child Measurement Programme for Wales Report 2012/13 15
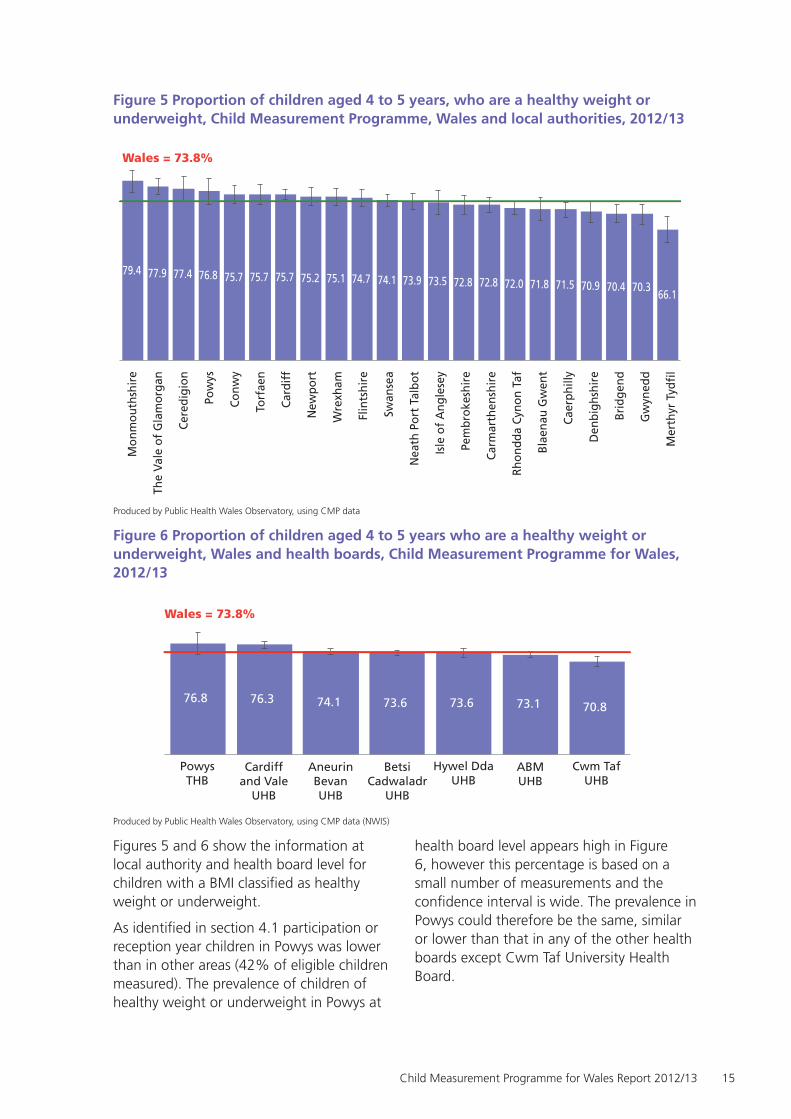
Figure 5 Proportion of children aged 4 to 5 years, who are a healthy weight or underweight, Child Measurement Programme, Wales and local authorities, 2012/13
Produced by Public Health Wales Observatory, using CMP data
Figure 6 Proportion of children aged 4 to 5 years who are a healthy weight or underweight, Wales and health boards, Child Measurement Programme for Wales, 2012/13
Produced by Public Health Wales Observatory, using CMP data (NWIS)
Figures 5 and 6 show the information at local authority and health board level for children with a BMI classified as healthy weight or underweight.
As identified in section 4.1 participation or reception year children in Powys was lower than in other areas (42% of eligible children measured). The prevalence of children of healthy weight or underweight in Powys at
health board level appears high in Figure 6, however this percentage is based on a small number of measurements and the confidence interval is wide. The prevalence in Powys could therefore be the same, similar or lower than that in any of the other health boards except Cwm Taf University Health Board.
Mo
nm
ou
thsh
ire
The
Val
e o
f G
lam
org
an
Cer
edig
ion
Pow
ys
Co
nw
y
Torf
aen
Car
dif
f
New
po
rt
Wre
xham
Flin
tsh
ire
Swan
sea
Nea
th P
ort
Tal
bo
t
Isle
of
An
gle
sey
Pem
bro
kesh
ire
Car
mar
then
shir
e
Rh
on
dd
a C
yno
n T
af
Bla
enau
Gw
ent
Cae
rph
illy
Den
big
hsh
ire
Bri
dg
end
Gw
yned
d
Mer
thyr
Tyd
fil
Wales = 73.8%
79.4 77.9 77.4 76.8 75.7 75.7 75.7 75.2 75.1 74.7 74.1 73.9 73.5 72.8 72.8 72.0 71.8 71.5 70.9 70.4 70.3 66.1
76.8 76.3 74.1 73.6 73.6 73.1 70.8
PowysTHB
Cardiffand Vale
UHB
AneurinBevanUHB
BetsiCadwaladr
UHB
Hywel DdaUHB
ABMUHB
Cwm TafUHB
Wales = 73.8%

Child Measurement Programme for Wales Report 2012/1316
4 .3 Overweight and obesity in children
The majority of children (73.2%) in Wales who were measured are deemed to be of a healthy weight. However 26.2% of children measured in 2012/13 in Wales were either overweight or obese. This proportion varies by local authority (Figure 7), health board (Figure 8) and deprivations levels for the area where the children live (Figure 9). In more affluent local authorities the prevalence was generally lower. Monmouth had the lowest prevalence at 20.6%, however it reached almost 34% in the more deprived area of Merthyr Tydfil.
The cohorts of children measured in both Monmouthshire and Merthyr Tydfil were
quite small, 652 children in each local authority, compared with 3,737 children in Cardiff, the area with the largest number of children participating. But even with a caveat around smaller numbers as can be seen from Figure 7, the confidence interval suggests that prevalence of overweight and obesity in children in Merthyr Tydfil was well above, and in Monmouthshire well below, the Welsh average. This still means that every area in Wales is experiencing appreciable levels of childhood overweight or obesity, with an even greater burden in more deprived areas The information in Figure 7 is also available in a map in Appendix 5.
Figure 7 Proportion of children aged 4 to 5 years who are overweight or obese, Wales and local authorities, Child Measurement Programme for Wales, 2012/13
Produced by Public Health Wales Observatory, using CMP data (NWIS)
Mer
thyr
Tyd
fil
Gw
yned
d
Bri
dg
end
Den
big
hsh
ire
Cae
rph
illy
Bla
enau
Gw
ent
Rh
on
dd
a C
yno
n T
af
Car
mar
then
shir
e
Pem
bro
kesh
ire
Isle
of
An
gle
sey
Nea
th P
ort
Tal
bo
t
Swan
sea
Flin
tsh
ire
Wre
xham
New
po
rt
Car
dif
f
Torf
aen
Co
nw
y
Pow
ys
Cer
edig
ion
Val
e o
f G
lam
org
an
Mo
nm
ou
thsh
ire
33.9 29.7 29.6 29.1 28.5 28.2 28.0 27.2 27.2 26.5 26.1 25.9 25.3 24.9 24.8 24.3 24.3 24.3 23.2 22.6 22.1 20.6
Wales = 26.2%

Child Measurement Programme for Wales Report 2012/13 17
Figure 8 Proportion of children aged 4 to 5 years who are overweight or obese, Wales and health boards, Child Measurement Programme for Wales, 2012/13
Produced by Public Health Wales Observatory, using CMP data (NWIS)
Figure 9 Proportion of children aged 4 to 5 years who are overweight or obese, Welsh Index of Multiple Deprivation quintiles, Child Measurement Programme for Wales, 2012/13
Produced by Public Health Wales Observatory, using CMP data (NWIS)
4 .3.1 Overweight and obese children by deprivation level
The prevalence of overweight and obesity in children in the reception year age group is given by health board and local authority of residence in the previous section. Both obesity prevalence and the prevalence of overweight are known to be higher in adults and children who live in more deprived areas, and figures 9, 10 and 11 give prevalence of ‘overweight or obese’ by deprivation quintile for all children and for girls and boys in Wales.
Deprivation is assessed using the Welsh Index of Multiple Deprivation (WIMD). The WIMD is the official measure of relative deprivation for small areas in Wales. This index is constructed by using a range of indicators to assign a deprivation rank to each of the 1,896 lower super output areas (LSOA) in Wales. An LSOA is a geographical area which may vary in geographical size but each LSOA contains about 1500 people registered as living in that area. In 2011 only Ceredigion and Monmouthshire had no LSOAs in the most deprived 10% of LSOAs in Wales.
Cwm TafUHB
ABMUHB
Cardiff and Vale
UHB
HywelDdaUHB
BetsiCadwaladr
UHB
AneurinBevan UHB
Powys THB
29.2 26.9 26.4 26.4 25.9 23.7 23.2
Wales = 26.2%
Least deprived fifth
Next least deprived
Middle deprived
Next most deprived
Most deprived fifth
21.4 25.1 26.4 27.1 29.4
Wales = 26.2%

Child Measurement Programme for Wales Report 2012/1318
Meanwhile the most deprived local authority was Merthyr Tydfil, with a quarter of its LSOAs in the most deprived 10% in Wales, followed by Blaenau Gwent (23.4%) and
Rhondda Cynon Taff (17.8%)12. However there are pockets of deprivation across Wales, with the most deprived LSOA being in Rhyl west.
Figure 10 Proportion of girls aged 4 to 5 years who are overweight or obese, Welsh Index of Multiple Deprivation quintiles, Child Measurement Programme for Wales, 2012/13
Produced by Public Health Wales Observatory, using CMP data (NWIS)
Figure 11 Proportion of boys aged 4 to 5 years who are overweight or obese, Welsh Index of Multiple Deprivation quintiles, Child Measurement Programme for Wales, 2012/13
Produced by Public Health Wales Observatory, using CMP data (NWIS)
Least deprived fifth
Next least deprived
Middle deprived
Next most deprived
Most deprived fifth
20.9 23.9 26.1 26.6 28.7
Wales = 25.6%
Least deprived fifth
Next least deprived
Middle deprived
Next most deprived
Most deprived fifth
21.9 26.2 26.6 27.6 30.0
Wales = 26.8%
Child Measurement Programme for Wales Report 2012/13 19
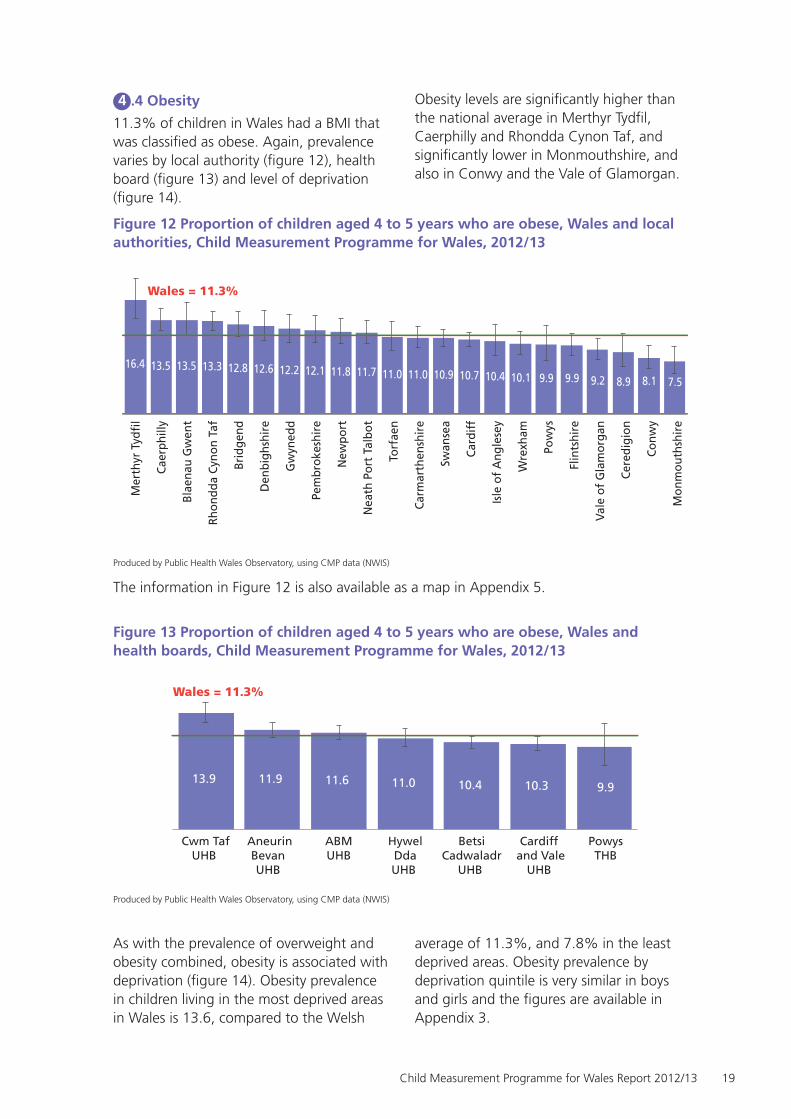
4 .4 Obesity
11.3% of children in Wales had a BMI that was classified as obese. Again, prevalence varies by local authority (figure 12), health board (figure 13) and level of deprivation (figure 14).
Obesity levels are significantly higher than the national average in Merthyr Tydfil, Caerphilly and Rhondda Cynon Taf, and significantly lower in Monmouthshire, and also in Conwy and the Vale of Glamorgan.
Figure 12 Proportion of children aged 4 to 5 years who are obese, Wales and local authorities, Child Measurement Programme for Wales, 2012/13
Produced by Public Health Wales Observatory, using CMP data (NWIS)
The information in Figure 12 is also available as a map in Appendix 5.
Figure 13 Proportion of children aged 4 to 5 years who are obese, Wales and health boards, Child Measurement Programme for Wales, 2012/13
Produced by Public Health Wales Observatory, using CMP data (NWIS)
As with the prevalence of overweight and obesity combined, obesity is associated with deprivation (figure 14). Obesity prevalence in children living in the most deprived areas in Wales is 13.6, compared to the Welsh
average of 11.3%, and 7.8% in the least deprived areas. Obesity prevalence by deprivation quintile is very similar in boys and girls and the figures are available in Appendix 3.
Mer
thyr
Tyd
fil
Cae
rph
illy
Bla
enau
Gw
ent
Rh
on
dd
a C
yno
n T
af
Bri
dg
end
Den
big
hsh
ire
Gw
yned
d
Pem
bro
kesh
ire
New
po
rt
Nea
th P
ort
Tal
bo
t
Torf
aen
Car
mar
then
shir
e
Swan
sea
Car
dif
f
Isle
of
An
gle
sey
Wre
xham
Pow
ys
Flin
tsh
ire
Val
e o
f G
lam
org
an
Cer
edig
ion
Co
nw
y
Mo
nm
ou
thsh
ire
16.4 13.5 13.5 13.3 12.8 12.6 12.2 12.1 11.8 11.7 11.0 11.0 10.9 10.7 10.4 10.1 9.9 9.9 9.2 8.9 8.1 7.5
Wales = 11.3%
Cwm TafUHB
ABMUHB
Cardiff and Vale
UHB
HywelDdaUHB
BetsiCadwaladr
UHB
AneurinBevan UHB
Powys THB
13.9 11.9 11.6 11.0 10.4 10.3 9.9
Wales = 11.3%

Child Measurement Programme for Wales Report 2012/1320
Figure 14 Proportion of children aged 4 to 5 years who are obese, Welsh Index of Multiple Deprivation quintiles, Child Measurement Programme for Wales, 2012/13
Produced by Public Health Wales Observatory, using CMP data (NWIS)
4 .5 Underweight children
Because of the small numbers involved, underweight and healthy weight categories have been combined when the information is presented at health board or local authority level. This is to avoid the potential identification of individual children who are deemed to be underweight. Prevalence of underweight children was 0.6% across Wales, but 0.7% in boys and 0.5% in girls, however this difference was not significant. The highest prevalence of underweight children was 1.5% in Cardiff and Vale
University Health Board. It is not clear why this is but it is also the area with the largest black and minority ethnic (BME) population in Wales and it is possible that this could have impacted on this result. More information about variations by ethnic origin is given in section 4.8.
4 .6 Comparison with 2011/12
There is now information available for the Child Measurement Programme for two consecutive years. (Figure 15). Caution should be used in drawing conclusions until data or more years becomes available.
Figure 15 Children aged 4 to 5 years by weight category, Wales, Child Measurement Programme for Wales, comparison 2011/12 and 2012/13
Produced by Public Health Wales Observatory, using CMP data (NWIS)
71.8 73.8
28.2 26.212.5 11.3
2011/12 2012/13 2011/12 2012/13 2011/12 2012/13
Healthy or underweight Overweight or obese Obese
Least deprived fifth
Next least deprived
Middle deprived
Next most deprived
Most deprived fifth
7.8 10.9 11.5 11.8 13.6
Wales = 11.3%

Child Measurement Programme for Wales Report 2012/13 21
However as already stated 26.2% of children measured in 2012/13 were overweight or obese. This is lower than the previous year (28.2% in 2011/12) and this does appear to be significant. However the apparent fall in prevalence should be treated with caution until data for future years become available. It is only when there is several years’ worth of data that it would be possible to identify any consistent trends.
There appears to have been a fall in overall prevalence of obesity and overweight and obesity in all deprivation groups. However of concern is that the absolute gap (Figure 16) in prevalence of obesity between the least and most deprived areas of Wales has increased by 0.9% (from 4.9% to 5.8%), and for those overweight or obese by 1.7% (from 6.3% to 8.0%). So prevalence of both obesity alone and ‘overweight plus obesity’ appears to have fallen faster in areas with least deprivation, and the latter appears to be statistically significant.
Figure 16 Proportion of children aged 4 to 5 years who are overweight or obese, and obese, by the most and least deprivation fifths, Child Measurement Programme for Wales, 2011/12 and 2012/13
Produced by Public Health Wales Observatory, using CMP data (NWIS)
30.7 29.4
14.3 13.6
24.4 21.4
9.4 7.8
2011/12 2012/13 2011/12 2012/13
Overweight or obese Obese
Most deprived Least deprived
8.0
4.9 5.8
Difference between most and least deprived 6.3

Child Measurement Programme for Wales Report 2012/1322
4 .7 Gender
Although there appears to be a difference in prevalence of ‘overweight or obesity’ between boys and girls, with girls apparently having lower prevalence (25.6%) than boys (26.8%) this is not statistically significant at a national level.
Figures 17 and 18 show the difference between boys and girls in Wales by local
authority for healthy weight, overweight and obesity. Prevalence for all categories, at all levels (local authority, health board and deprivation quintile) for both boys and girls was broadly similar. The exception is that boys are significantly more likely than girls to fall in the category of ‘overweight but not obese’ however this is only significant at an all Wales level.
Figure 17 Weight category amongst girls aged 4 to 5 years, percentage by local authority, Child Measurment Programme for Wales, 2012/13
Produced by Public Health Wales Observatory, using CMP data (NWIS)
Healthy weight and underweight Overweight (but not obese) Obese
Monmouthshire
Powys
Vale of Glamorgan
Cardiff
Ceredigion
Conwy
Torfaen
Pembrokeshire
Newport
Wrexham
Neath Port Talbot
Flintshire
Swansea
Isle of Anglesey
Caerphilly
Gwynedd
Blaenau Gwent
Carmarthenshire
Bridgend
Rhondda Cynon Taf
Denbighshire
Merthyr Tydfil 64
71
71
72
72
73
73
73
74
74
75
75
75
76
76
76
76
77
77
78
80
80
19
15
16
16
15
14
15
13
16
15
15
14
14
13
13
13
15
13
13
12
13
13
17
14
13
12
12
13
13
14
10
11
10
11
11
12
11
11
9
10
10
10
8
7

Child Measurement Programme for Wales Report 2012/13 23
Figure 18 Weight category amongst boys aged 4 to 5 years, percentage by local authority, Child Measurment Programme for Wales, 2012/13
Produced by Public Health Wales Observatory, using CMP data (NWIS)
4 .8 Ethnicity
This year analysis of child growth by ethnicity is available. These figures should be viewed with a certain amount of caution as ethnicity recording on the National Community Child Health Database (NCCHD) is not complete – the ethnicity of just over 10% of children in this age group was either not recorded or recorded as not known. The number of children with an ethnic origin other than white recorded was 1,768 (6%).
A further issue is that just under half (49%) of the children had had their ethnicity recorded according to computer codes that were discontinued in 2002 (despite being born well after 2002). These old codes did not include a code for children of mixed race. Therefore it is not known how children of mixed race were categorised prior to 2002, although the expectation is that they would have been coded into the classification ‘other’. There are separate codes for children of mixed race post-2002.
68
68
69
70
70
71
71
73
73
73
73
74
74
74
75
75
75
75
76
78
78
79
16
20
17
17
17
18
15
15
14
16
17
15
14
16
14
14
16
18
13
14
14
13
16
12
13
13
13
12
14
12
13
11
9
11
12
10
11
12
9
7
11
9
8
8
Healthy weight and underweight Overweight (but not obese) Obese
Monmouthshire
Ceredigion
Vale of Glamorgan
Torfaen
Conwy
Wrexham
Newport
Cardiff
Flintshire
Powys
Swansea
Carmarthenshire
Isle of Anglesey
Rhondda Cynon Taf
Neath Port Talbot
Blaenau Gwent
Denbighshire
Pembrokeshire
Caerphilly
Bridgend
Gwynedd
Merthyr Tydfil

Child Measurement Programme for Wales Report 2012/1324
Figure 19 Ethnicity data from the Child Measurement Programme for Wales, children aged 4 to 5 years, 2012/13
Produced by Public Health Wales Observatory, using CMP data (NWIS)
Because of the small numbers of children from an ethnic background other than white, even at an all Wales level, the 16 categories available have been condensed down to five broader categories (see Appendix 2), and a category for not known/not recorded is included. BMI by ethnicity has also only been classified in two categories – healthy or underweight, and obese or overweight. It is not possible to present information by ethnicity on children who are obese but not overweight or vice versa. Again this is because of the small number of children involved. In future years it will be possible to collate the information for several years at a time to present more detailed information. Children classified as white will include children born outside the UK, or born to parents from elsewhere e.g. Europe.
According to the 2011 Census13 four percent of the total population of Wales were from a Black or Minority Ethnic (BME) background. This was an increase from 2.1% in 2001. The majority of those from a BME background living in Wales were of Asian origin. The age profile of people from a BME background varies, with six percent being aged under 25, compared with 30% of the total population falling within this age group. Meanwhile six percent of the population living in Wales were born outside the UK,
with the greater number (2.4%) being born in Europe followed by Asia (1.6%). Polish is the commonest single language in Wales after English or Welsh.
The majority of people living in Wales from a BME background live in the south east in either Cardiff or Newport. The number of children from a BME background who were eligible to participate in the Child Measurement Programme is small (1,768) so it is not permitted to give information on their BMI at a health board or local authority level, as this could result in identification of individual children. Figure 20 therefore shows the information at an all-Wales level. The highest prevalence of overweight and obesity in reception year in Wales is seen in children of black origin (34.4%) and the lowest in children of Asian origin (23.0%). However only the prevalence in children of black origin is significantly different from the prevalence for Wales (26.2%).
83.5%
2.1%
0.5% 1.6%
1.9%
10.4 % White
Asian
Black
Mixed
Chinese or other
Not recorded

Child Measurement Programme for Wales Report 2012/13 25
Figure 20 Proportion of children aged 4 to 5 years who are overweight or obese, ethnic groups, Child Measurement Programme for Wales, 2012/13
Produced by Public Health Wales Observatory, using CMP data (NWIS)
While the numbers are small, the higher proportion of children of black origin who are classified as obese or overweight (using the UK90 Growth Reference) is similar to information from elsewhere including England14. In 2012/13 29.9% of children described as Black or Black British in the reception year age group in England were classified as overweight or obese compared to the England average of 22%.
The links between childhood obesity and deprivation are well documented, and children from a black or minority ethnic background are more likely to live in the more deprived urban areas. However as discussed elsewhere in this report (Section 5.3 Classifying a Child’s BMI) the growth charts used to calculate a child’s BMI are based on a large sample size of children who are of white origin. Children of differing ethnicity may grow at different rates, and have different body fat distributions. In adolescents for example, there is limited information15 that for the same level of BMI, young people of African ethnicity carry less body fat than the general population.
4 .9 Low height
137 (0.5%) of the children measured in Wales in 2012/13 were found to be of low height. That is, their height was below the 0.4th centile.
The UK National Screening Committee recommend16 that children with a height at
school entry of less than the 0.4th centile should be referred for assessment for short stature. Because the number of children of low height is small, it is not possible to give a breakdown by geographical area. However the prevalence of low height is similar across Wales. There were slightly more boys identified (57%) than girls (43%), however there were more measurements for boys than for girls in the programme and the difference is not statistically significant.
Further guidance will be issued to staff involved in the Child Measurement Programme during 2014 to remind them of the importance of identifying children with low height and appropriate referral pathways.
4 .10 Comparisons with England
A national child measurement programme was commenced in England in 2006. This programme includes child measurements taken in reception year and Year 6. Responsibility for this programme transferred from the NHS to local authorities in England in April 2013. Prior to April 2013 responsibility for the programme was with the NHS, which at the time was split into strategic health authorities, so the measurements were presented at a strategic health authority level. This is useful for drawing comparisons with child growth in reception year in Wales, as strategic health authorities had a population size of
26.7 23.0
34.4 25.3 25.7 22.9
White Asian Black Mixed Chinese or other
Not recorded
Wales = 26.2%
Child Measurement Programme for Wales Report 2012/1326
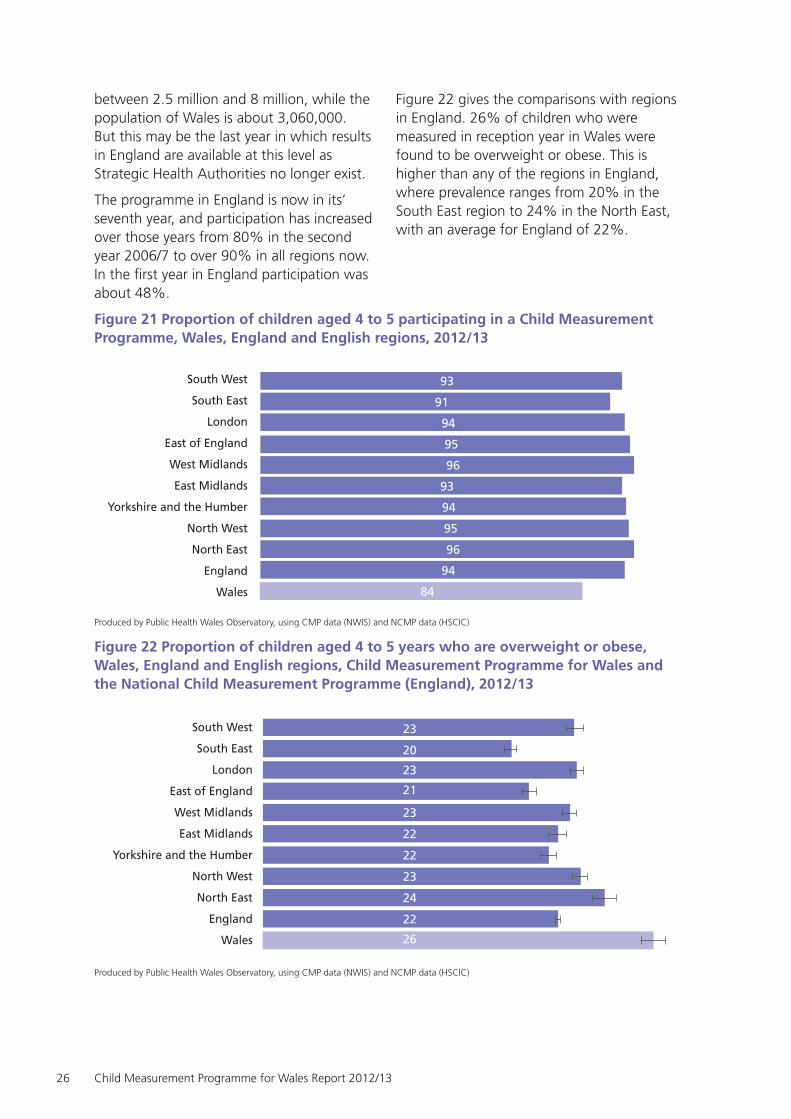
between 2.5 million and 8 million, while the population of Wales is about 3,060,000. But this may be the last year in which results in England are available at this level as Strategic Health Authorities no longer exist.
The programme in England is now in its’ seventh year, and participation has increased over those years from 80% in the second year 2006/7 to over 90% in all regions now. In the first year in England participation was about 48%.
Figure 22 gives the comparisons with regions in England. 26% of children who were measured in reception year in Wales were found to be overweight or obese. This is higher than any of the regions in England, where prevalence ranges from 20% in the South East region to 24% in the North East, with an average for England of 22%.
Figure 21 Proportion of children aged 4 to 5 participating in a Child Measurement Programme, Wales, England and English regions, 2012/13
Produced by Public Health Wales Observatory, using CMP data (NWIS) and NCMP data (HSCIC)
Figure 22 Proportion of children aged 4 to 5 years who are overweight or obese, Wales, England and English regions, Child Measurement Programme for Wales and the National Child Measurement Programme (England), 2012/13
Produced by Public Health Wales Observatory, using CMP data (NWIS) and NCMP data (HSCIC)
84
94
96
95
94
93
96
95
94
91
93
Wales
England
North East
North West
Yorkshire and the Humber
East Midlands
West Midlands
East of England
London
South East
South West
26
22
24
23
22
22
23
21
23
20
23
Wales
England
North East
North West
Yorkshire and the Humber
East Midlands
West Midlands
East of England
London
South East
South West

Child Measurement Programme for Wales Report 2012/13 27
Figure 23 compares obesity prevalence by sex across England and Wales. Both girls and boys in Wales have significantly higher prevalence of obesity or overweight than children in England.
Figure 23 Proportion of children aged 4 to 5 years who are overweight or obese, Wales and England, Child Measurement Programme for Wales and the National Child Measurement Programme (England), 2012/13
Produced by Public Health Wales Observatory, using CMP data (NWIS) and NCMP data (HSCIC)
22.2 26.2 23.2 26.8 21.2 25.6
England Wales England Wales England Wales
Boys Girls

Child Measurement Programme for Wales Report 2012/1328
Methods
All measurements were taken during the academic year 2012/13 in line with the Child Measurement Programme Standards and Guidance. Measurements of height and weight were recorded to the nearest 0.1 cm and 0.1 kg resepectively in order to establish an accurate BMI measurement.
5 .1 The measurement process
Most School Health teams have routinely weighed and measured children in reception year for many years. With the introduction of the Child Measurement Programme this is now being done in a standardised way, with all health professionals given additional training and equipment.
5 .2 BMI in adults
Once someone has reached adulthood, the thresholds at which they are deemed to be of normal weight, under or overweight or obese remain the same. BMI is calculated by dividing a person’s weight in kilograms by their height in metres squared (kg/m2). The BMI thresholds for adults are as follows:
●● BMI of less than 18.5 is deemed underweight
●● BMI of 18.5 and above, but less than 25 is deemed normal weight
●● BMI of 25 and above, but less than 30 is deemed overweight
●● BMI of 30 and above, but less than 40 is deemed obese
●● BMI of 40 or more is deemed morbidly obese
5 .3 Classifying a child’s BMI
The classification of children’s BMI differs from the classification of adult BMI as it changes as they mature. It also differs between boys and girls as the rates at which the different sexes grow differs.
In children the BMI is categorised using variable thresholds that alter depending on a child’s age and sex. Each child’s BMI is then assessed against a reference population or growth reference derived from the measurements of a large sample of children of the same age and sex. There are a number of different growth reference scales available, but for this programme UK90 was selected. The reference scale is divided into 100 units known as centiles (see Appendix 1 for a sample centile chart). Depending on where on this UK90 growth / centile chart each child is, they are assigned to one of the following categories in population studies:
●● Underweight: less than but not including the second centile
●● Healthy weight: second centile up to but not including the 85th centile
●● Overweight but not obese: 85th centile up to and not including 95th centile
●● Obese: 95th centile and above
There is no standard definition of morbid obesity in children in common use. Slightly different thresholds are used for clinical purposes rather than population surveillance purposes, i.e. NICE recommend interventions for children with a BMI on or above the 91st
5

Child Measurement Programme for Wales Report 2012/13 29
centile17 rather than the 85th centile which is the threshold for obesity in clinical settings.
Prevalence rates were calculated using age and sex-specific BMI centiles, using the British 1990 growth reference (UK90) from a method proposed by Cole et al18. The BMI was calculated using a method proposed by Keys et al19. The British 1990 growth reference (UK90) is also used in the National Child Measurement Programme for England. The measurements which informed UK90 were drawn from seven major studies of growth in the UK, and comprise measurements of over 30,000 children20 and young people between 33 weeks of gestation and age 23 years. One criticism of this growth reference is that measurements of only a small number of children from ethnic minority backgrounds were available in the studies and these were not included, although there are known variations in growth patterns between children from different ethnic groups21.
Other growth references used internationally include those developed by the World Health Organization (WHO), Center for Disease Control in the USA (CDC) and the International Obesity Task Force (IOTF). Comparisons between obesity prevalence across populations should only be made if the same growth reference has been used, as they do differ. The National Obesity Observatory in England have published a useful guide22 which gives more information about each of the above growth references.
The distributions of height, weight and BMI are shown in Appendix 4. There is a symmetrical distribution for height and a skewed distribution for weight and BMI, and this follows the pattern shown in the Child Measurement Programme published in 2013.
5 .4 Which records are included?
Records have been included in the Programme if they meet all of the following criteria:
●● The location of residence can be determined.
●● The child is resident in Wales.
●● The school is located in Wales.
●● They were born in the period September 2007 to August 2008.
●● The child’s sex is recorded.
Eligible records were included in the number measured, if they met all of the following criteria:
●● The height measurement is recorded and is not an implausible measurement‡.
●● The weight measurement is recorded and is not an implausible measurement‡.
●● Consent has not been withdrawn.
●● The measurement was collected during the academic year 2012/13.
5 .5 Small number suppression
When information is released in detail there is the risk that individuals could be identified even though their names, addresses or dates of birth have been removed. This risk is exacerbated if two or more sources of data are compared or the data is describing uncommon events. When the data is describing events or information that only applies to very few people in the information set, or to people living in a small geographical area, people’s identities can be protected by adding in safeguards such as “small number suppression”.
In this report, small numbers between 0 and 4 have been suppressed to avoid potential identification of individuals. In this report, this mainly relates to children who were underweight or of low height. Suppression of related data has also been performed where suppressed numbers could have been derived from totals.
In order to avoid potentially identifying individual children in local authority or health board areas, the information about children who are seen as underweight is combined with children seen as being of healthy weight.
‡ In some cases it was apparent that human error had resulted in the wrong figures being entered into the wrong fields. Although it appeared as if the height and weight measurements had been switched there was no way to confirm this so the measurements were not included.

Child Measurement Programme for Wales Report 2012/1330
5 .6 Confidence intervals and statistical significance
When looking at any information it is important to make an assessment of reliability of that information, and this is usually done in one of two ways:
●● By calculating confidence intervals (CIs).
●● By carrying out a test for statistical significance.
Confidence intervals are indications of the natural variation that would be expected around a rate and they should be considered when assessing or interpreting a rate. The size of the confidence interval is dependent on the number of events occurring and the size of the population from which the events came. Generally speaking, rates based on small numbers of events and small populations are likely to have wider confidence intervals. Conversely, rates based on large populations are likely to have narrower confidence intervals.
In this report, 95% CIs were calculated using a method proposed by Wilson et al as described by Altman et al23 (2000).
A simple explanation of the confidence interval is that we can be 95% confident that the true figure is within the range given for prevalence of overweight and obesity (for example) if all eligible children in Wales had been included in the programme.
A “statistically significant” finding suggests that the difference between two values might not be due to chance. In this publication, statistical significance is evaluated by the comparison of the 95% CIs of given values instead of carrying out a statistical test for significance. If CIs do not overlap then the value is considered to be statistically significantly different. Deeming a local value as statistically significant suggests that there is only 5% chance of it being different to the Wales average due to natural variation alone. The phrase ‘similar to’ is used within the report when values were not statistically significantly different.

Child Measurement Programme for Wales Report 2012/13 31
Conclusions
●● This second report of the Child Measurement Programme for Wales adds to existing knowledge about child growth in children age four to five in Wales.
●● Prevalence of obesity and overweight in this cohort of children appears to be higher than in any one of the regions in England.
●● There has been an apparent fall in prevalence of overweight and obesity in children in this age group since the first report of the Programme. However more information is needed for future years to establish whether this is in fact a trend that will continue.
●● This is the first year that some analysis of growth by ethnic origin of children in Wales, has been included and the results suggest that children of black ethnic origin are at higher risk of being overweight or obese than any other group including white origin. However the number of children of any ethnic origin other than white is small, and information for future years is needed before firm conclusions can be made.
●● The information in this report may be useful to assist staff working in health boards and local authorities to target scarce resources towards enhancing and developing services aimed at combating obesity.
●● It is hoped that the 2015 report on children measured in 2013/14 will include analysis looking at children living in urban or rural settings.
6

Appendices
Child Measurement Programme for Wales Report 2012/1332

Child Measurement Programme for Wales Report 2012/13 33
Appendix 1 Sample centile charts
©2012/13 Royal College of Paediatrics and Child Health. Reproduced with kind permission of the Royal College of Paediatrics and Child Health

Child Measurement Programme for Wales Report 2012/1334
Appendix 1 Sample centile charts
©2012/13 Royal College of Paediatrics and Child Health. Reproduced with kind permission of the Royal College of Paediatrics and Child Health
Child Measurement Programme for Wales Report 2012/13 35
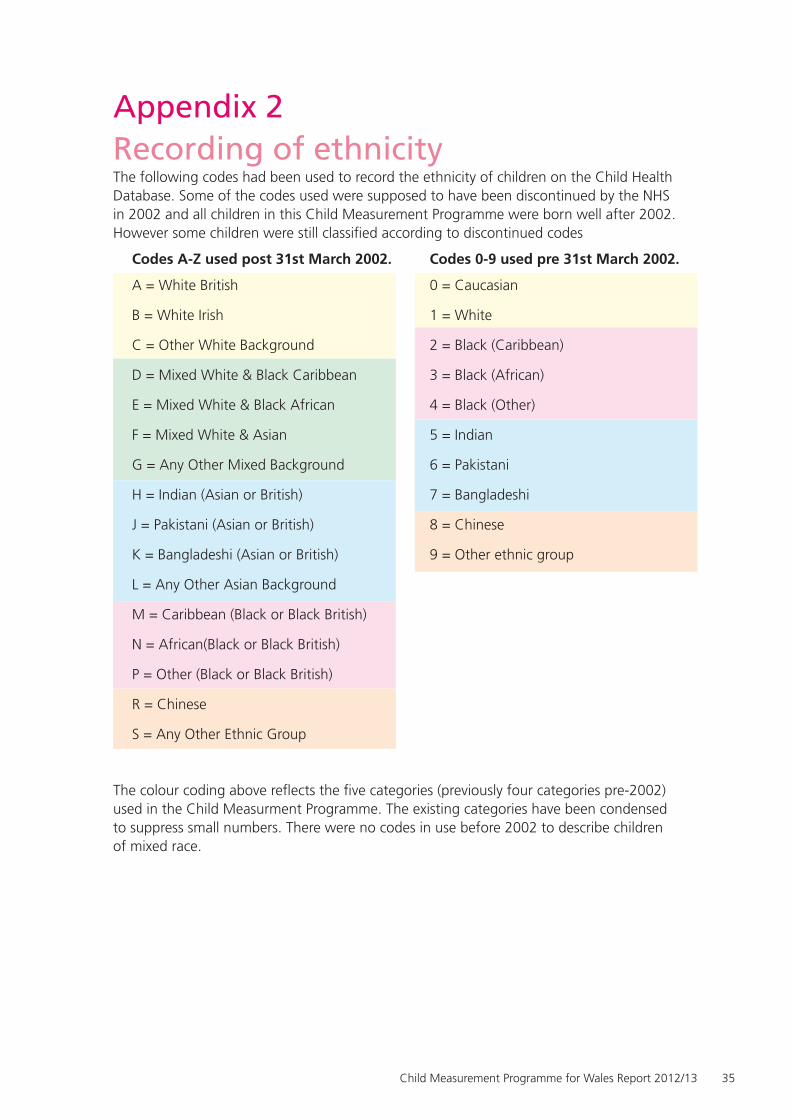
Appendix 2Recording of ethnicityThe following codes had been used to record the ethnicity of children on the Child Health Database. Some of the codes used were supposed to have been discontinued by the NHS in 2002 and all children in this Child Measurement Programme were born well after 2002. However some children were still classified according to discontinued codes
Codes A-Z used post 31st March 2002. Codes 0-9 used pre 31st March 2002.
A = White British 0 = Caucasian
B = White Irish 1 = White
C = Other White Background 2 = Black (Caribbean)
D = Mixed White & Black Caribbean 3 = Black (African)
E = Mixed White & Black African 4 = Black (Other)
F = Mixed White & Asian 5 = Indian
G = Any Other Mixed Background 6 = Pakistani
H = Indian (Asian or British) 7 = Bangladeshi
J = Pakistani (Asian or British) 8 = Chinese
K = Bangladeshi (Asian or British) 9 = Other ethnic group
L = Any Other Asian Background
M = Caribbean (Black or Black British)
N = African(Black or Black British)
P = Other (Black or Black British)
R = Chinese
S = Any Other Ethnic Group
The colour coding above reflects the five categories (previously four categories pre-2002) used in the Child Measurment Programme. The existing categories have been condensed to suppress small numbers. There were no codes in use before 2002 to describe children of mixed race.

Child Measurement Programme for Wales Report 2012/1336
Ap
pen
dix
3 R
efer
ence
Tab
les
Pa
rtic
ipat
ion
in t
he
Ch
ild M
easu
rem
ent
Pro
gra
mm
e fo
r W
ales
§ , c
hild
ren
ag
ed 4
to
5 y
ears
, 201
2/20
13
All
Ch
ildre
nA
llB
oys
Gir
ls
Elig
ible
Mea
sure
dN
ot
Mea
sure
d%
Up
take
Elig
ible
Mea
sure
dN
ot
Mea
sure
d%
Up
take
Elig
ible
Mea
sure
dN
ot
Mea
sure
d%
Up
take
Wal
es 3
4,67
9 2
9,23
8 5
,441
84
.3 1
7,72
3 1
4,89
1 2
,832
84
.0 1
6,95
6 1
4,34
7 2
,609
84
.6
Leas
t de
priv
ed fi
fth
5,8
73
5,0
88
785
86
.6 3
,005
2
,583
4
22
86.0
2,8
68
2,5
05
363
87
.3
Nex
t le
ast
depr
ived
6,0
45
4,9
89
1,0
56
82.5
3,1
02
2,5
38
564
81
.8 2
,943
2
,451
4
92
83.3
Mid
dle
depr
ived
6,6
32
5,6
37
995
85
.0 3
,388
2
,868
5
20
84.7
3,2
44
2,7
69
475
85
.4
Nex
t m
ost
depr
ived
7,3
14
6,0
71
1,2
43
83.0
3,6
92
3,0
67
625
83
.1 3
,622
3
,004
6
18
82.9
Mos
t de
priv
ed fi
fth
8,8
15
7,4
53
1,3
62
84.5
4,5
36
3,8
35
701
84
.5 4
,279
3
,618
6
61
84.6
Bet
si C
adw
alad
r U
HB
7,6
15
6,4
75
1,1
40
85.0
3,8
65
3,2
73
592
84
.7 3
,750
3
,202
5
48
85.4
Isle
of
Ang
lese
y 7
55
690
6
5 91
.4 3
60
332
2
8 92
.2 3
95
358
3
7 90
.6
Gw
yned
d 1
,232
1
,006
2
26
81.7
646
5
16
130
79
.9 5
86
490
9
6 83
.6
Con
wy
1,1
46
1,0
67
79
93.1
565
5
31
34
94.0
581
5
36
45
92.3
Den
bigh
shire
1,0
90
928
1
62
85.1
576
4
81
95
83.5
514
4
47
67
87.0
Flin
tshi
re 1
,720
1
,413
3
07
82.2
887
7
33
154
82
.6 8
33
680
1
53
81.6
Wre
xham
1,6
72
1,3
71
301
82
.0 8
31
680
1
51
81.8
841
6
91
150
82
.2
Pow
ys T
HB
1,2
67
534
7
33
42.1
664
2
80
384
42
.2 6
03
254
3
49
42.1
Hyw
el D
da
UH
B 3
,865
3
,333
5
32
86.2
1,9
18
1,6
39
279
85
.5 1
,947
1
,694
2
53
87.0
Cer
edig
ion
615
5
62
53
91.4
311
2
77
34
89.1
304
2
85
19
93.8
Pem
brok
eshi
re 1
,279
1
,119
1
60
87.5
640
5
57
83
87.0
639
5
62
77
87.9
Car
mar
then
shire
1,9
71
1,6
52
319
83
.8 9
67
805
1
62
83.2
1,0
04
847
1
57
84.4
AB
M U
HB
5,8
33
5,2
37
596
89
.8 3
,010
2
,692
3
18
89.4
2,8
23
2,5
45
278
90
.2
Swan
sea
2,7
32
2,4
83
249
90
.9 1
,377
1
,238
1
39
89.9
1,3
55
1,2
45
110
91
.9
Nea
th P
ort
Talb
ot 1
,522
1
,351
1
71
88.8
813
7
19
94
88.4
709
6
32
77
89.1
Brid
gend
1,5
79
1,4
03
176
88
.9 8
20
735
8
5 89
.6 7
59
668
9
1 88
.0
Car
dif
f an
d V
ale
UH
B 5
,693
5
,106
5
87
89.7
2,9
25
2,6
04
321
89
.0 2
,768
2
,502
2
66
90.4
The
Vale
of
Gla
mor
gan
1,4
99
1,3
69
130
91
.3 7
85
703
8
2 89
.6 7
14
666
4
8 93
.3
Car
diff
4,1
94
3,7
37
457
89
.1 2
,140
1
,901
2
39
88.8
2,0
54
1,8
36
218
89
.4
Cw
m T
af U
HB
3,5
24
3,2
41
283
92
.0 1
,794
1
,664
1
30
92.8
1,7
30
1,5
77
153
91
.2
Rhon
dda
Cyn
on T
af 2
,782
2
,589
1
93
93.1
1,4
00
1,3
12
88
93.7
1,3
82
1,2
77
105
92
.4
Mer
thyr
Tyd
fil 7
42
652
9
0 87
.9 3
94
352
4
2 89
.3 3
48
300
4
8 86
.2
An
eurn
Bev
an U
HB
6,8
82
5,3
12
1,5
70
77.2
3,5
47
2,7
39
808
77
.2 3
,335
2
,573
7
62
77.2
Cae
rphi
lly 2
,202
1
,746
4
56
79.3
1,1
40
896
2
44
78.6
1,0
62
850
2
12
80.0
Blae
nau
Gw
ent
802
7
73
29
96.4
424
4
11
13
96.9
378
3
62
16
95.8
Torf
aen
1,0
60
861
1
99
81.2
552
4
43
109
80
.3 5
08
418
9
0 82
.3
Mon
mou
thsh
ire 8
82
652
2
30
73.9
443
3
32
111
74
.9 4
39
320
1
19
72.9
New
port
1,9
36
1,2
80
656
66
.1 9
88
657
3
31
66.5
948
6
23
325
65
.7
§ Pr
oduc
ed b
y Pu
blic
Hea
lth W
ales
Obs
erva
tory
, usi
ng C
MP
data
(NW
IS),
WIM
D 2
011
(WG
)

Child Measurement Programme for Wales Report 2012/13 37
Key
dat
a fr
om
th
e C
hild
Mea
sure
men
t Pr
og
ram
me
for
Wal
es**
, ch
ildre
n a
ged
4 t
o 5
yea
rs, 2
012/
2013
All
Ch
ildre
nH
ealt
hy
wei
gh
t o
r u
nd
erw
eig
ht
Ove
rwei
gh
t o
r o
bes
eU
nd
erw
eig
ht
Hea
lth
y w
eig
ht
Ove
rwei
gh
t n
ot
ob
ese
Ob
ese
n%
(95%
CI)1
n%
(95%
CI)1
n%
(95%
CI)1
n%
(95%
CI)1
n%
(95%
CI)1
n%
(95%
CI)1
Wal
es21
,579
73
.8(7
3.3,
74.3
)7,
659
26.2
(25.
7,26
.7)
179
0.6
(0.5
,0.7
)21
,400
73
.2(7
2.7,
73.7
)4,
343
14.9
(14.
5,15
.3)
3,31
6 11
.3(1
1.0,
11.7
)
Leas
t de
priv
ed fi
fth
3,99
9 78
.6(7
7.4,
79.7
)1,
089
21.4
(20.
3,22
.6)
33
0.6
(0.5
,0.9
)3,
966
77.9
(76.
8,79
.1)
691
13.6
(12.
7,14
.5)
398
7.8
(7.1
,8.6
)
Nex
t le
ast
depr
ived
3,73
9 74
.9(7
3.7,
76.1
)1,
250
25.1
(23.
9,26
.3)
29
0.6
(0.4
,0.8
)3,
710
74.4
(73.
1,75
.6)
708
14.2
(13.
3,15
.2)
542
10.9
(10.
0,11
.8)
Mid
dle
depr
ived
4,15
0 73
.6(7
2.5,
74.8
)1,
487
26.4
(25.
2,27
.5)
27
0.5
(0.3
,0.7
)4,
123
73.1
(72.
0,74
.3)
836
14.8
(13.
9,15
.8)
651
11.5
(10.
7,12
.4)
Nex
t m
ost
depr
ived
4,42
8 72
.9(7
1.8,
74.0
)1,
643
27.1
(26.
0,28
.2)
35
0.6
(0.4
,0.8
)4,
393
72.4
(71.
2,73
.5)
929
15.3
(14.
4,16
.2)
714
11.8
(11.
0,12
.6)
Mos
t de
priv
ed fi
fth
5,26
3 70
.6(6
9.6,
71.6
)2,
190
29.4
(28.
4,30
.4)
55
0.7
(0.6
,1.0
)5,
208
69.9
(68.
8,70
.9)
1,17
9 15
.8(1
5.0,
16.7
)1,
011
13.6
(12.
8,14
.4)
Bet
si C
adw
alad
r U
HB
4,76
5 73
.6(7
2.5,
74.7
)1,
710
26.4
(25.
3,27
.5)
24
0.4
(0.2
,0.6
)4,
741
73.2
(72.
1,74
.3)
1,03
4 16
.0(1
5.1,
16.9
)67
6 10
.4(9
.7,1
1.2)
Isle
of
Ang
lese
y50
7 73
.5(7
0.1,
76.6
)18
3 26
.5(2
3.4,
29.9
)-
--
--
-11
1 16
.1(1
3.5,
19.0
)72
10
.4(8
.4,1
2.9)
Gw
yned
d70
7 70
.3(6
7.4,
73.0
)29
9 29
.7(2
7.0,
32.6
)-
--
--
-17
6 17
.5(1
5.3,
20.0
)12
3 12
.2(1
0.3,
14.4
)
Con
wy
808
75.7
(73.
1,78
.2)
259
24.3
(21.
8,26
.9)
--
--
--
173
16.2
(14.
1,18
.5)
86
8.1
(6.6
,9.8
)
Den
bigh
shire
658
70.9
(67.
9,73
.7)
270
29.1
(26.
3,32
.1)
--
--
--
153
16.5
(14.
2,19
.0)
117
12.6
(10.
6,14
.9)
Flin
tshi
re1,
056
74.7
(72.
4,76
.9)
357
25.3
(23.
1,27
.6)
7 0.
5(0
.2,1
.0)
1,04
9 74
.2(7
1.9,
76.5
)21
7 15
.4(1
3.6,
17.3
)14
0 9.
9(8
.5,1
1.6)
Wre
xham
1,02
9 75
.1(7
2.7,
77.3
)34
2 24
.9(2
2.7,
27.3
)6
0.4
(0.2
,1.0
)1,
023
74.6
(72.
2,76
.8)
204
14.9
(13.
1,16
.9)
138
10.1
(8.6
,11.
8)
Pow
ys T
HB
410
76.8
(73.
0,80
.2)
124
23.2
(19.
8,27
.0)
5 0.
9(0
.4,2
.2)
405
75.8
(72.
0,79
.3)
71
13.3
(10.
7,16
.4)
53
9.9
(7.7
,12.
8)
Hyw
el D
da
UH
B2,
452
73.6
(72.
0,75
.0)
881
26.4
(25.
0,28
.0)
13
0.4
(0.2
,0.7
)2,
439
73.2
(71.
6,74
.7)
515
15.5
(14.
3,16
.7)
366
11.0
(10.
0,12
.1)
Cer
edig
ion
435
77.4
(73.
8,80
.7)
127
22.6
(19.
3,26
.2)
--
--
--
77
13.7
(11.
1,16
.8)
50
8.9
(6.8
,11.
5)
Pem
brok
eshi
re81
5 72
.8(7
0.2,
75.4
)30
4 27
.2(2
4.6,
29.8
)-
--
--
-16
9 15
.1(1
3.1,
17.3
)13
5 12
.1(1
0.3,
14.1
)
Car
mar
then
shire
1,20
2 72
.8(7
0.6,
74.9
)45
0 27
.2(2
5.1,
29.4
)7
0.4
(0.2
,0.9
)1,
195
72.3
(70.
1,74
.4)
269
16.3
(14.
6,18
.1)
181
11.0
(9.5
,12.
6)
AB
M U
HB
3,82
6 73
.1(7
1.8,
74.2
)1,
411
26.9
(25.
8,28
.2)
29
0.6
(0.4
,0.8
)3,
797
72.5
(71.
3,73
.7)
802
15.3
(14.
4,16
.3)
609
11.6
(10.
8,12
.5)
Swan
sea
1,84
0 74
.1(7
2.3,
75.8
)64
3 25
.9(2
4.2,
27.7
)21
0.
8(0
.6,1
.3)
1,81
9 73
.3(7
1.5,
75.0
)37
2 15
.0(1
3.6,
16.4
)27
1 10
.9(9
.7,1
2.2)
Nea
th P
ort
Talb
ot99
8 73
.9(7
1.5,
76.1
)35
3 26
.1(2
3.9,
28.5
)-
--
--
-19
5 14
.4(1
2.7,
16.4
)15
8 11
.7(1
0.1,
13.5
)
Brid
gend
988
70.4
(68.
0,72
.8)
415
29.6
(27.
2,32
.0)
--
--
--
235
16.7
(14.
9,18
.8)
180
12.8
(11.
2,14
.7)
Car
dif
f an
d V
ale
UH
B3,
895
76.3
(75.
1,77
.4)
1,21
1 23
.7(2
2.6,
24.9
)57
1.
1(0
.9,1
.4)
3,83
8 75
.2(7
4.0,
76.3
)68
5 13
.4(1
2.5,
14.4
)52
6 10
.3(9
.5,1
1.2)
The
Vale
of
Gla
mor
gan
1,06
6 77
.9(7
5.6,
80.0
)30
3 22
.1(2
0.0,
24.4
)9
0.7
(0.3
,1.2
)1,
057
77.2
(74.
9,79
.4)
177
12.9
(11.
3,14
.8)
126
9.2
(7.8
,10.
9)
Car
diff
2,82
9 75
.7(7
4.3,
77.1
)90
8 24
.3(2
2.9,
25.7
)48
1.
3(1
.0,1
.7)
2,78
1 74
.4(7
3.0,
75.8
)50
8 13
.6(1
2.5,
14.7
)40
0 10
.7(9
.8,1
1.7)
Cw
m T
af U
HB
2,29
5 70
.8(6
9.2,
72.4
)94
6 29
.2(2
7.6,
30.8
)21
0.
6(0
.4,1
.0)
2,27
4 70
.2(6
8.6,
71.7
)49
4 15
.2(1
4.0,
16.5
)45
2 13
.9(1
2.8,
15.2
)
Rhon
dda
Cyn
on T
af1,
864
72.0
(70.
2,73
.7)
725
28.0
(26.
3,29
.8)
15
0.6
(0.4
,1.0
)1,
849
71.4
(69.
6,73
.1)
380
14.7
(13.
4,16
.1)
345
13.3
(12.
1,14
.7)
Mer
thyr
Tyd
fil43
1 66
.1(6
2.4,
69.6
)22
1 33
.9(3
0.4,
37.6
)6
0.9
(0.4
,2.0
)42
5 65
.2(6
1.4,
68.7
)11
4 17
.5(1
4.8,
20.6
)10
7 16
.4(1
3.8,
19.4
)
An
euri
n B
evan
UH
B3,
936
74.1
(72.
9,75
.3)
1,37
6 25
.9(2
4.7,
27.1
)30
0.
6(0
.4,0
.8)
3,90
6 73
.5(7
2.3,
74.7
)74
2 14
.0(1
3.1,
14.9
)63
4 11
.9(1
1.1,
12.8
)
Cae
rphi
lly1,
249
71.5
(69.
4,73
.6)
497
28.5
(26.
4,30
.6)
9 0.
5(0
.3,1
.0)
1,24
0 71
.0(6
8.8,
73.1
)26
2 15
.0(1
3.4,
16.8
)23
5 13
.5(1
1.9,
15.1
)
Blae
nau
Gw
ent
555
71.8
(68.
5,74
.9)
218
28.2
(25.
1,31
.5)
--
--
--
114
14.7
(12.
4,17
.4)
104
13.5
(11.
2,16
.0)
Torf
aen
652
75.7
(72.
8,78
.5)
209
24.3
(21.
5,27
.2)
--
--
--
114
13.2
(11.
1,15
.7)
95
11.0
(9.1
,13.
3)
Mon
mou
thsh
ire51
8 79
.4(7
6.2,
82.4
)13
4 20
.6(1
7.6,
23.8
)-
--
--
-85
13
.0(1
0.7,
15.8
)49
7.
5(5
.7,9
.8)
New
port
962
75.2
(72.
7,77
.4)
318
24.8
(22.
6,27
.3)
11
0.9
(0.5
,1.5
)95
1 74
.3(7
1.8,
76.6
)16
7 13
.0(1
1.3,
15.0
)15
1 11
.8(1
0.1,
13.7
)
** P
rodu
ced
by P
ublic
Hea
lth W
ales
Obs
erva
tory
, usi
ng C
MP
data
(NW
IS),
WIM
D (W
G).
1 95
% c
onfid
ence
inte
rval
. - T
o av
oid
disc
losu
re s
mal
l num
bers
(0-4
) and
som
e la
rger
com
plem
enta
ry n
umbe
rs h
ave
been
sup
pres
sed.

Child Measurement Programme for Wales Report 2012/1338
Key
dat
a fr
om
th
e C
hild
Mea
sure
men
t Pr
og
ram
me
for
Wal
es††
, bo
ys a
ged
4 t
o 5
yea
rs, 2
012/
2013
Bo
ysH
ealt
hy
wei
gh
t o
r u
nd
erw
eig
ht
Ove
rwei
gh
t o
r o
bes
eU
nd
erw
eig
ht
Hea
lth
y w
eig
ht
Ove
rwei
gh
t n
ot
ob
ese
Ob
ese
n%
(95%
CI)1
n%
(95%
CI)1
n%
(95%
CI)1
n%
(95%
CI)1
n%
(95%
CI)1
n%
(95%
CI)1
Wal
es10
,900
73
.2(7
2.5,
73.9
)3,
991
26.8
(26.
1,27
.5)
108
0.7
(0.6
,0.9
)10
,792
72
.5(7
1.8,
73.2
)2,
310
15.5
(14.
9,16
.1)
1,68
1 11
.3(1
0.8,
11.8
)
Leas
t de
priv
ed fi
fth
2,01
8 78
.1(7
6.5,
79.7
)56
5 21
.9(2
0.3,
23.5
)20
0.
8(0
.5,1
.2)
1,99
8 77
.4(7
5.7,
78.9
)36
6 14
.2(1
2.9,
15.6
)19
9 7.
7(6
.7,8
.8)
Nex
t le
ast
depr
ived
1,87
3 73
.8(7
2.1,
75.5
)66
5 26
.2(2
4.5,
27.9
)19
0.
7(0
.5,1
.2)
1,85
4 73
.0(7
1.3,
74.7
)38
8 15
.3(1
3.9,
16.7
)27
7 10
.9(9
.8,1
2.2)
Mid
dle
depr
ived
2,10
4 73
.4(7
1.7,
74.9
)76
4 26
.6(2
5.1,
28.3
)11
0.
4(0
.2,0
.7)
2,09
3 73
.0(7
1.3,
74.6
)44
2 15
.4(1
4.1,
16.8
)32
2 11
.2(1
0.1,
12.4
)
Nex
t m
ost
depr
ived
2,22
2 72
.4(7
0.8,
74.0
)84
5 27
.6(2
6.0,
29.2
)20
0.
7(0
.4,1
.0)
2,20
2 71
.8(7
0.2,
73.4
)48
5 15
.8(1
4.6,
17.1
)36
0 11
.7(1
0.6,
12.9
)
Mos
t de
priv
ed fi
fth
2,68
3 70
.0(6
8.5,
71.4
)1,
152
30.0
(28.
6,31
.5)
38
1.0
(0.7
,1.4
)2,
645
69.0
(67.
5,70
.4)
629
16.4
(15.
3,17
.6)
523
13.6
(12.
6,14
.8)
Bet
si C
adw
alad
r U
HB
2,38
6 72
.9(7
1.4,
74.4
)88
7 27
.1(2
5.6,
28.6
)14
0.
4(0
.3,0
.7)
2,37
2 72
.5(7
0.9,
74.0
)56
3 17
.2(1
5.9,
18.5
)32
4 9.
9(8
.9,1
1.0)
Isle
of
Ang
lese
y24
3 73
.2(6
8.2,
77.7
)89
26
.8(2
2.3,
31.8
)-
--
--
-54
16
.3(1
2.7,
20.6
)35
10
.5(7
.7,1
4.3)
Gw
yned
d35
1 68
.0(6
3.9,
71.9
)16
5 32
.0(2
8.1,
36.1
)-
--
--
-10
4 20
.2(1
6.9,
23.8
)61
11
.8(9
.3,1
4.9)
Con
wy
399
75.1
(71.
3,78
.6)
132
24.9
(21.
4,28
.7)
--
--
--
93
17.5
(14.
5,21
.0)
39
7.3
(5.4
,9.9
)
Den
bigh
shire
340
70.7
(66.
5,74
.6)
141
29.3
(25.
4,33
.5)
--
--
--
85
17.7
(14.
5,21
.3)
56
11.6
(9.1
,14.
8)
Flin
tshi
re54
5 74
.4(7
1.1,
77.4
)18
8 25
.6(2
2.6,
28.9
)-
--
--
-11
7 16
.0(1
3.5,
18.8
)71
9.
7(7
.8,1
2.0)
Wre
xham
508
74.7
(71.
3,77
.8)
172
25.3
(22.
2,28
.7)
--
--
--
110
16.2
(13.
6,19
.1)
62
9.1
(7.2
,11.
5)
Pow
ys T
HB
208
74.3
(68.
9,79
.1)
72
25.7
(20.
9,31
.1)
--
--
--
39
13.9
(10.
4,18
.5)
33
11.8
(8.5
,16.
1)
Hyw
el D
da
UH
B1,
195
72.9
(70.
7,75
.0)
444
27.1
(25.
0,29
.3)
--
--
--
275
16.8
(15.
0,18
.7)
169
10.3
(8.9
,11.
9)
Cer
edig
ion
216
78.0
(72.
7,82
.5)
61
22.0
(17.
5,27
.3)
--
--
--
40
14.4
(10.
8,19
.1)
21
7.6
(5.0
,11.
3)
Pem
brok
eshi
re38
9 69
.8(6
5.9,
73.5
)16
8 30
.2(2
6.5,
34.1
)-
--
--
-96
17
.2(1
4.3,
20.6
)72
12
.9(1
0.4,
16.0
)
Car
mar
then
shire
590
73.3
(70.
1,76
.2)
215
26.7
(23.
8,29
.9)
--
--
--
139
17.3
(14.
8,20
.0)
76
9.4
(7.6
,11.
7)
AB
M U
HB
1,94
8 72
.4(7
0.6,
74.0
)74
4 27
.6(2
6.0,
29.4
)20
0.
7(0
.5,1
.1)
1,92
8 71
.6(6
9.9,
73.3
)42
4 15
.8(1
4.4,
17.2
)32
0 11
.9(1
0.7,
13.2
)
Swan
sea
915
73.9
(71.
4,76
.3)
323
26.1
(23.
7,28
.6)
--
--
--
188
15.2
(13.
3,17
.3)
135
10.9
(9.3
,12.
8)
Nea
th P
ort
Talb
ot52
3 72
.7(6
9.4,
75.9
)19
6 27
.3(2
4.1,
30.6
)-
--
--
-10
9 15
.2(1
2.7,
18.0
)87
12
.1(9
.9,1
4.7)
Brid
gend
510
69.4
(66.
0,72
.6)
225
30.6
(27.
4,34
.0)
--
--
--
127
17.3
(14.
7,20
.2)
98
13.3
(11.
1,16
.0)
Car
dif
f an
d V
ale
UH
B1,
965
75.5
(73.
8,77
.1)
639
24.5
(22.
9,26
.2)
38
1.5
(1.1
,2.0
)1,
927
74.0
(72.
3,75
.7)
362
13.9
(12.
6,15
.3)
277
10.6
(9.5
,11.
9)
The
Vale
of
Gla
mor
gan
548
78.0
(74.
7,80
.9)
155
22.0
(19.
1,25
.3)
--
--
--
95
13.5
(11.
2,16
.2)
60
8.5
(6.7
,10.
8)
Car
diff
1,41
7 74
.5(7
2.5,
76.4
)48
4 25
.5(2
3.6,
27.5
)-
--
--
-26
7 14
.0(1
2.6,
15.7
)21
7 11
.4(1
0.1,
12.9
)
Cw
m T
af U
HB
1,19
4 71
.8(6
9.5,
73.9
)47
0 28
.2(2
6.1,
30.5
)14
0.
8(0
.5,1
.4)
1,18
0 70
.9(6
8.7,
73.0
)23
9 14
.4(1
2.8,
16.1
)23
1 13
.9(1
2.3,
15.6
)
Rhon
dda
Cyn
on T
af95
5 72
.8(7
0.3,
75.1
)35
7 27
.2(2
4.9,
29.7
)-
--
--
-18
1 13
.8(1
2.0,
15.8
)17
6 13
.4(1
1.7,
15.4
)
Mer
thyr
Tyd
fil23
9 67
.9(6
2.8,
72.6
)11
3 32
.1(2
7.4,
37.2
)-
--
--
-58
16
.5(1
3.0,
20.7
)55
15
.6(1
2.2,
19.8
)
An
euri
n B
evan
UH
B2,
004
73.2
(71.
5,74
.8)
735
26.8
(25.
2,28
.5)
11
0.4
(0.2
,0.7
)1,
993
72.8
(71.
1,74
.4)
408
14.9
(13.
6,16
.3)
327
11.9
(10.
8,13
.2)
Cae
rphi
lly62
5 69
.8(6
6.7,
72.7
)27
1 30
.2(2
7.3,
33.3
)-
--
--
-15
5 17
.3(1
5.0,
19.9
)11
6 12
.9(1
0.9,
15.3
)
Blae
nau
Gw
ent
292
71.0
(66.
5,75
.2)
119
29.0
(24.
8,33
.5)
--
--
--
63
15.3
(12.
2,19
.1)
56
13.6
(10.
6,17
.3)
Torf
aen
335
75.6
(71.
4,79
.4)
108
24.4
(20.
6,28
.6)
--
--
--
59
13.3
(10.
5,16
.8)
49
11.1
(8.5
,14.
3)
Mon
mou
thsh
ire26
2 78
.9(7
4.2,
83.0
)70
21
.1(1
7.0,
25.8
)-
--
--
-42
12
.7(9
.5,1
6.7)
28
8.4
(5.9
,11.
9)
New
port
490
74.6
(71.
1,77
.8)
167
25.4
(22.
2,28
.9)
6 0.
9(0
.4,2
.0)
484
73.7
(70.
2,76
.9)
89
13.5
(11.
1,16
.4)
78
11.9
(9.6
,14.
6)
†† P
rodu
ced
by P
ublic
Hea
lth W
ales
Obs
erva
tory
, usi
ng C
MP
data
(NW
IS),
WIM
D (W
G).
1 95
% c
onfid
ence
inte
rval
. - T
o av
oid
disc
losu
re s
mal
l num
bers
(0-4
) and
som
e la
rger
com
plem
enta
ry n
umbe
rs h
ave
been
sup
pres
sed.

Child Measurement Programme for Wales Report 2012/13 39
Key
dat
a fr
om
th
e C
hild
Mea
sure
men
t Pr
og
ram
me
for
Wal
es, g
irls
◊ ag
ed 4
to
5 y
ears
, 201
2/20
13
Gir
lsH
ealt
hy
wei
gh
t o
r u
nd
erw
eig
ht
Ove
rwei
gh
t o
r o
bes
eU
nd
erw
eig
ht
Hea
lth
y w
eig
ht
Ove
rwei
gh
t n
ot
ob
ese
Ob
ese
n%
(95%
CI)1
n%
(95%
CI)1
n%
(95%
CI)1
n%
(95%
CI)1
n%
(95%
CI)1
n%
(95%
CI)1
Wal
es 1
0,67
9 74
.4(7
3.7,
75.1
)3,
668
25.6
(24.
9,26
.3)
71
0.5
(0.4
,0.6
)10
,608
73
.9(7
3.2,
74.7
)2,
033
14.2
(13.
6,14
.8)
1,63
5 11
.4(1
0.9,
11.9
)
Leas
t de
priv
ed fi
fth
1,9
81
79.1
(77.
4,80
.6)
524
20.9
(19.
4,22
.6)
13
0.5
(0.3
,0.9
)1,
968
78.6
(76.
9,80
.1)
325
13.0
(11.
7,14
.3)
199
7.9
(6.9
,9.1
)
Nex
t le
ast
depr
ived
1,8
66
76.1
(74.
4,77
.8)
585
23.9
(22.
2,25
.6)
10
0.4
(0.2
,0.7
)1,
856
75.7
(74.
0,77
.4)
320
13.1
(11.
8,14
.4)
265
10.8
(9.6
,12.
1)
Mid
dle
depr
ived
2,0
46
73.9
(72.
2,75
.5)
723
26.1
(24.
5,27
.8)
16
0.6
(0.4
,0.9
)2,
030
73.3
(71.
6,74
.9)
394
14.2
(13.
0,15
.6)
329
11.9
(10.
7,13
.1)
Nex
t m
ost
depr
ived
2,2
06
73.4
(71.
8,75
.0)
798
26.6
(25.
0,28
.2)
15
0.5
(0.3
,0.8
)2,
191
72.9
(71.
3,74
.5)
444
14.8
(13.
6,16
.1)
354
11.8
(10.
7,13
.0)
Mos
t de
priv
ed fi
fth
2,5
80
71.3
(69.
8,72
.8)
1,03
8 28
.7(2
7.2,
30.2
)17
0.
5(0
.3,0
.8)
2,56
3 70
.8(6
9.3,
72.3
)55
0 15
.2(1
4.1,
16.4
)48
8 13
.5(1
2.4,
14.6
)
Bet
si C
adw
alad
r U
HB
2,3
79
74.3
(72.
8,75
.8)
823
25.7
(24.
2,27
.2)
10
0.3
(0.2
,0.6
)2,
369
74.0
(72.
4,75
.5)
471
14.7
(13.
5,16
.0)
352
11.0
(10.
0,12
.1)
Isle
of
Ang
lese
y 2
64
73.7
(68.
9,78
.0)
94
26.3
(22.
0,31
.1)
--
--
--
57
15.9
(12.
5,20
.1)
37
10.3
(7.6
,13.
9)
Gw
yned
d 3
56
72.7
(68.
5,76
.4)
134
27.3
(23.
6,31
.5)
--
--
--
72
14.7
(11.
8,18
.1)
62
12.7
(10.
0,15
.9)
Con
wy
409
76
.3(7
2.5,
79.7
)12
7 23
.7(2
0.3,
27.5
)-
--
--
-80
14
.9(1
2.2,
18.2
)47
8.
8(6
.7,1
1.5)
Den
bigh
shire
318
71
.1(6
6.8,
75.1
)12
9 28
.9(2
4.9,
33.2
)-
--
--
-68
15
.2(1
2.2,
18.8
)61
13
.6(1
0.8,
17.1
)
Flin
tshi
re 5
11
75.1
(71.
8,78
.2)
169
24.9
(21.
8,28
.2)
--
--
--
100
14.7
(12.
2,17
.6)
69
10.1
(8.1
,12.
6)
Wre
xham
521
75
.4(7
2.1,
78.5
)17
0 24
.6(2
1.5,
27.9
)-
--
--
-94
13
.6(1
1.2,
16.4
)76
11
.0(8
.9,1
3.6)
Pow
ys T
HB
202
79
.5(7
4.1,
84.0
)52
20
.5(1
6.0,
25.9
)-
--
--
-32
12
.6(9
.1,1
7.2)
20
7.9
(5.2
,11.
8)
Hyw
el D
da
UH
B 1
,257
74
.2(7
2.1,
76.2
)43
7 25
.8(2
3.8,
27.9
)-
--
--
-24
0 14
.2(1
2.6,
15.9
)19
7 11
.6(1
0.2,
13.2
)
Cer
edig
ion
219
76
.8(7
1.6,
81.4
)66
23
.2(1
8.6,
28.4
)-
--
--
-37
13
.0(9
.6,1
7.4)
29
10.2
(7.2
,14.
2)
Pem
brok
eshi
re 4
26
75.8
(72.
1,79
.2)
136
24.2
(20.
8,27
.9)
--
--
--
73
13.0
(10.
5,16
.0)
63
11.2
(8.9
,14.
1)
Car
mar
then
shire
612
72
.3(6
9.1,
75.2
)23
5 27
.7(2
4.8,
30.9
)-
--
--
-13
0 15
.3(1
3.1,
17.9
)10
5 12
.4(1
0.3,
14.8
)
AB
M U
HB
1,8
78
73.8
(72.
0,75
.5)
667
26.2
(24.
5,28
.0)
9 0.
4(0
.2,0
.7)
1,86
9 73
.4(7
1.7,
75.1
)37
8 14
.9(1
3.5,
16.3
)28
9 11
.4(1
0.2,
12.6
)
Swan
sea
925
74
.3(7
1.8,
76.6
)32
0 25
.7(2
3.4,
28.2
)-
--
--
-18
4 14
.8(1
2.9,
16.9
)13
6 10
.9(9
.3,1
2.8)
Nea
th P
ort
Talb
ot 4
75
75.2
(71.
6,78
.4)
157
24.8
(21.
6,28
.4)
--
--
--
86
13.6
(11.
2,16
.5)
71
11.2
(9.0
,13.
9)
Brid
gend
478
71
.6(6
8.0,
74.8
)19
0 28
.4(2
5.2,
32.0
)-
--
--
-10
8 16
.2(1
3.6,
19.2
)82
12
.3(1
0.0,
15.0
)
Car
dif
f an
d V
ale
UH
B 1
,930
77
.1(7
5.5,
78.7
)57
2 22
.9(2
1.3,
24.5
)19
0.
8(0
.5,1
.2)
1,91
1 76
.4(7
4.7,
78.0
)32
3 12
.9(1
1.7,
14.3
)24
9 10
.0(8
.8,1
1.2)
The
Vale
of
Gla
mor
gan
518
77
.8(7
4.5,
80.8
)14
8 22
.2(1
9.2,
25.5
)-
--
--
-82
12
.3(1
0.0,
15.0
)66
9.
9(7
.9,1
2.4)
Car
diff
1,4
12
76.9
(74.
9,78
.8)
424
23.1
(21.
2,25
.1)
--
--
--
241
13.1
(11.
7,14
.7)
183
10.0
(8.7
,11.
4)
Cw
m T
af U
HB
1,1
01
69.8
(67.
5,72
.0)
476
30.2
(28.
0,32
.5)
7 0.
4(0
.2,0
.9)
1,09
4 69
.4(6
7.1,
71.6
)25
5 16
.2(1
4.4,
18.1
)22
1 14
.0(1
2.4,
15.8
)
Rhon
dda
Cyn
on T
af 9
09
71.2
(68.
6,73
.6)
368
28.8
(26.
4,31
.4)
--
--
--
199
15.6
(13.
7,17
.7)
169
13.2
(11.
5,15
.2)
Mer
thyr
Tyd
fil 1
92
64.0
(58.
4,69
.2)
108
36.0
(30.
8,41
.6)
--
--
--
56
18.7
(14.
7,23
.5)
52
17.3
(13.
5,22
.0)
An
euri
n B
evan
UH
B 1
,932
75
.1(7
3.4,
76.7
)64
1 24
.9(2
3.3,
26.6
)19
0.
7(0
.5,1
.2)
1,91
3 74
.3(7
2.6,
76.0
)33
4 13
.0(1
1.7,
14.3
)30
7 11
.9(1
0.7,
13.2
)
Cae
rphi
lly 6
24
73.4
(70.
3,76
.3)
226
26.6
(23.
7,29
.7)
--
--
--
107
12.6
(10.
5,15
.0)
119
14.0
(11.
8,16
.5)
Blae
nau
Gw
ent
263
72
.7(6
7.8,
77.0
)99
27
.3(2
3.0,
32.2
)-
--
--
-51
14
.1(1
0.9,
18.1
)48
13
.3(1
0.1,
17.1
)
Torf
aen
317
75
.8(7
1.5,
79.7
)10
1 24
.2(2
0.3,
28.5
)-
--
--
-55
13
.2(1
0.3,
16.7
)46
11
.0(8
.4,1
4.4)
Mon
mou
thsh
ire 2
56
80.0
(75.
3,84
.0)
64
20.0
(16.
0,24
.7)
--
--
--
43
13.4
(10.
1,17
.6)
21
6.6
(4.3
,9.8
)
New
port
472
75
.8(7
2.2,
79.0
)15
1 24
.2(2
1.0,
27.8
)5
0.8
(0.3
,1.9
)46
7 75
.0(7
1.4,
78.2
)78
12
.5(1
0.1,
15.4
)73
11
.7(9
.4,1
4.5)
◊ Pr
oduc
ed b
y Pu
blic
Hea
lth W
ales
Obs
erva
tory
, usi
ng C
MP
data
(NW
IS),
WIM
D (W
G).
1 95
% c
onfid
ence
inte
rval
. - T
o av
oid
disc
losu
re s
mal
l num
bers
(0-4
) and
som
e la
rger
com
plem
enta
ry n
umbe
rs h
ave
been
sup
pres
sed.

Child Measurement Programme for Wales Report 2012/1340
Hei
gh
t d
ata§§
fro
m t
he
Ch
ild M
easu
rem
ent
Pro
gra
mm
e fo
r W
ales
, ch
ildre
n a
ged
4 t
o 5
yea
rs, 2
012/
2013
All
Bo
ysG
irls
Mea
sure
dLo
w h
eig
ht
Mea
sure
dLo
w h
eig
ht
Mea
sure
dLo
w h
eig
ht
Nn
%(9
5% C
I)1N
n%
(95%
CI)1
Nn
%(9
5% C
I)1
Wal
es29
,238
13
7 0.
5(0
.4,0
.6)
14,8
91
78
0.5
(0.4
,0.7
)14
,347
59
0.
4(0
.3,0
.5)
Leas
t de
priv
ed fi
fth
5,08
8 16
0.
3(0
.2,0
.5)
2,58
3 10
0.
4(0
.2,0
.7)
2,50
5 6
0.2
(0.1
,0.5
)
Nex
t le
ast
depr
ived
4,98
9 21
0.
4(0
.3,0
.6)
2,53
8 13
0.
5(0
.3,0
.9)
2,45
1 8
0.3
(0.2
,0.6
)
Mid
dle
depr
ived
5,63
7 25
0.
4(0
.3,0
.7)
2,86
8 13
0.
5(0
.3,0
.8)
2,76
9 12
0.
4(0
.2,0
.8)
Nex
t m
ost
depr
ived
6,07
1 23
0.
4(0
.3,0
.6)
3,06
7 11
0.
4(0
.2,0
.6)
3,00
4 12
0.
4(0
.2,0
.7)
Mos
t de
priv
ed fi
fth
7,45
3 52
0.
7(0
.5,0
.9)
3,83
5 31
0.
8(0
.6,1
.1)
3,61
8 21
0.
6(0
.4,0
.9)
Bet
si C
adw
alad
r U
HB
6,47
5 32
0.
5(0
.4,0
.7)
3,27
3 15
0.
5(0
.3,0
.8)
3,20
2 17
0.
5(0
.3,0
.8)
Isle
of
Ang
lese
y69
0 -
--
332
--
-35
8 -
--
Gw
yned
d1,
006
--
-51
6 -
--
490
--
-
Con
wy
1,06
7 -
--
531
--
-53
6 -
--
Den
bigh
shire
928
10
1.1
(0.6
,2.0
)48
1 -
--
447
--
-
Flin
tshi
re1,
413
6 0.
4(0
.2,0
.9)
733
--
-68
0 -
--
Wre
xham
1,37
1 6
0.4
(0.2
,1.0
)68
0 -
--
691
--
-
Pow
ys T
HB
534
--
-28
0 -
--
254
--
-
Hyw
el D
da
UH
B3,
333
21
0.6
(0.4
,1.0
)1,
639
16
1.0
(0.6
,1.6
)1,
694
5 0.
3(0
.1,0
.7)
Cer
edig
ion
562
--
-27
7 -
--
285
--
-
Pem
brok
eshi
re1,
119
--
-55
7 -
--
562
--
-
Car
mar
then
shire
1,65
2 12
0.
7(0
.4,1
.3)
805
--
-84
7 -
--
AB
M U
HB
5,23
7 -
--
2,69
2 -
--
2,54
5 -
--
Swan
sea
2,48
3 5
0.2
(0.1
,0.5
)1,
238
--
-1,
245
--
-
Nea
th P
ort
Talb
ot1,
351
6 0.
4(0
.2,1
.0)
719
--
-63
2 -
--
Brid
gend
1,40
3 -
--
735
--
-66
8 -
--
Car
dif
f an
d V
ale
UH
B5,
106
24
0.5
(0.3
,0.7
)2,
604
15
0.6
(0.3
,0.9
)2,
502
9 0.
4(0
.2,0
.7)
The
Vale
of
Gla
mor
gan
1,36
9 -
--
703
--
-66
6 -
--
Car
diff
3,73
7 -
--
1,90
1 -
--
1,83
6 -
--
Cw
m T
af U
HB
3,24
1 21
0.
6(0
.4,1
.0)
1,66
4 14
0.
8(0
.5,1
.4)
1,57
7 7
0.4
(0.2
,0.9
)
Rhon
dda
Cyn
on T
af2,
589
16
0.6
(0.4
,1.0
)1,
312
--
-1,
277
--
-
Mer
thyr
Tyd
fil65
2 5
0.8
(0.3
,1.8
)35
2 -
--
300
--
-
An
euri
n B
evan
UH
B5,
312
23
0.4
(0.3
,0.6
)2,
739
13
0.5
(0.3
,0.8
)2,
573
10
0.4
(0.2
,0.7
)
Cae
rphi
lly1,
746
10
0.6
(0.3
,1.1
)89
6 5
0.6
(0.2
,1.3
)85
0 5
0.6
(0.3
,1.4
)
Blae
nau
Gw
ent
773
--
-41
1 -
--
362
--
-
Torf
aen
861
--
-44
3 -
--
418
--
-
Mon
mou
thsh
ire65
2 -
--
332
--
-32
0 -
--
New
port
1,28
0 7
0.5
(0.3
,1.1
)65
7 -
--
623
--
-
§§ P
rodu
ced
by P
ublic
Hea
lth W
ales
Obs
erva
tory
, usi
ng C
MP
data
(NW
IS),
WIM
D (W
G).
- To
avo
id d
iscl
osur
e sm
all n
umbe
rs (0
-4) a
nd s
ome
larg
er c
ompl
emen
tary
num
bers
hav
e be
en s
uppr
esse
d.

Child Measurement Programme for Wales Report 2012/13 41
Appendix 4Distribution of height, weight and body mass indexDistribution of weight and BMI in both boys and girls in the Child Measurement Programme is skewed to the right. Distribution of height shows a symmetrical pattern in boys and girls.
Weight distribution (kg) in boys aged 4 to 5 years, Child Measurement Programme, 2012/13
Produced by Public Health Wales Observatory, using CMP data (NWIS)
Weight distribution (kg) in girls aged 4 to 5 years, Child Measurement Programme, 2012/13
Produced by Public Health Wales Observatory, using CMP data (NWIS)
0
500
1000
1500
2000
2500
3000
11 12 13 14 15 16 17 18 19 20 21 22 23 24 25 26 27 28 29 30 31 32 33 34 35 36 37 38 39 40 41 42 43 44 45 46 47 48
Nu
mb
er o
f b
oys
Weight (kg)
0
500
1000
1500
2000
2500
10 11 12 13 14 15 16 17 18 19 20 21 22 23 24 25 26 27 28 29 30 31 32 33 34 35 36 37 38 39 40 41 42
Nu
mb
er o
f g
irls
Weight (kg)

Child Measurement Programme for Wales Report 2012/1342
Height distribution (cm) in boys aged 4 to 5 years, Child Measurement Programme, 2012/13
Produced by Public Health Wales Observatory, using CMP data (NWIS)
Height distribution (cm) in girls aged 4 to 5 years, Child Measurement Programme, 2012/13
Produced by Public Health Wales Observatory, using CMP data (NWIS)
0
200
400
600
800
1000
1400
1200
88 89 90 91 92 93 94 95 96 97 98 99 100
101
102
103
104
105
106
107
108
109
110
111
112
113
114
115
116
117
118
119
120
121
122
123
124
125
126
127
128
129
130
Height (cm)
Nu
mb
er o
f b
oys
0
200
400
600
800
1000
1200
85 86 87 88 89 90 91 92 93 94 95 96 97 98 99 100
101
102
103
104
105
106
107
108
109
110
111
112
113
114
115
116
117
118
119
120
121
122
123
124
125
126
127
128
129
130
131
132
133
134
135
136
137
138
139
140
141
142
143
144
Height (cm)
Nu
mb
er o
f g
irls

Child Measurement Programme for Wales Report 2012/13 43
Body mass index (BMI) distribution in boys aged 4 to 5 years, Child Measurement Programme, 2012/13
Produced by Public Health Wales Observatory, using CMP data (NWIS)
Body mass index (BMI) distribution in girls aged 4 to 5 years, Child Measurement Programme, 2012/13
Produced by Public Health Wales Observatory, using CMP data (NWIS)
9 10 11 12 13 14 15 16 17 18 19 20 21 22 23 24 25 26 27 28 29 30 31
Nu
mb
er o
f b
oys
BMI
0
500
1000
1500
2000
2500
3000
3500
4000
4500
5000
8 9 10 11 12 13 14 15 16 17 18 19 20 21 22 23 24 25 26 27 28 29 30 31 32
Nu
mb
er o
f g
irls
BMI
0
500
1000
1500
2000
2500
3000
3500
4000
4500

Child Measurement Programme for Wales Report 2012/1344
Appendix 5 Additional maps
Proportion of children aged 4 to 5 years who are overweight or obese, 2012/13
Produced by Public Health Wales Observatory, using CMP data (NWIS) © Crown copyright and database right 2014. Ordnance Survey 1000044810
Local authorities, percentages
31.3 to 33.9 (1)
28.6 to 31.3 (3)
25.9 to 28.6 (7)
23.2 to 25.9 (8)
20.5 to 23.2 (3)
Local authority boundary
Wales = 26.2%

Child Measurement Programme for Wales Report 2012/13 45
Proportion of children aged 4 to 5 years who are obese, 2012/13
Produced by Public Health Wales Observatory, using CMP data (NWIS) © Crown copyright and database right 2014. Ordnance Survey 1000044810
Local authorities, percentages
14.7 to 16.5 (1)
12.9 to 14.7 (3)
11.1 to 12.9 (6)
9.3 to 11.1 (8)
7.5 to 9.3 (4)
Local authority boundary
Wales = 11.3%

Child Measurement Programme for Wales Report 2012/1346
Proportion of children aged 4 to 5 years who are underweight or a healthy weight, 2012/13
Produced by Public Health Wales Observatory, using CMP data (NWIS) © Crown copyright and database right 2014. Ordnance Survey 1000044810
Local authorities, percentages
76.9 to 79.5 (3)
74.2 to 76.9 (7)
71.5 to 74.2 (8)
68.8 to 71.5 (3)
66.1 to 68.8 (1)
Local authority boundary
Wales = 73.8%

Child Measurement Programme for Wales Report 2012/13 47
References
1 Hall, D., Williams, J,. Elliman, D. (2009) “The Child Surveillance Handbook” Oxford: Radcliffe Publishing
2 World Health Organisation / ENHIS (December 2009) “Prevalence Of Overweight And Obesity In Children And Adolescents, Fact Sheet 2.3” Code: RPG2_Hous_E2
3 Butland B et al (2007) “Foresight Tackling Obesities: Future Choices – Project report” London Government Office for Science.
4 http://wales.gov.uk/newsroom/healthandsocialcare/2011/110331obesity/?lang=en accessed 6th June 2014
5 Public Health Wales (2012) “Standards For Implementing The Child Measurement Programme For Wales” available at: http://www2.nphs.wales.nhs.uk:8080/ChildMeasurementDocs.nsf/5633c1d141208e8880256f2a004937d1/86918aa37f5ddb7780257b9c0051ed19/$FILE/CMP%20Standards%202012_13%20V1%20Final%20English%20.pdf accessed 24th April 2014
6 Public Health Wales (2012) “Guidelines Template For Implementing Child Measurement Programme For Wales” available at http://www2.nphs.wales.nhs.uk:8080/ChildMeasurementDocs.nsf/5633c1d141208e8880256f2a004937d1/e78beb5c13d4bdbd80257b9c00588df9/$FILE/CMP%20Guidelines%20Template%202012_13%20v1%20%20Final%20311012%20.pdf accessed 24th April 2014
7 Public Health Observatory for Wales (2009) “Measuring childhood heights and weights in Wales” National Public Health Service for Wales & Wales Centre for Health.
8 Public Health Wales (2013) “Child Measurement Programme for Wales: Report 2011/12” Public Health Wales NHS Trust
9 Welsh Government (2011) “Directions to Local Health Boards in Wales and Public Health Wales National Health Service Trust (2011 No. 14)” available at http://wales.gov.uk/legislation/subordinate/nonsi/nhswales/2011/4927618/?lang=en [accessed 24th April 2014].
10 Welsh Government (2011) “The Child Measurement Programme (Wales) Regulations (2011 No. 985 W.142)” available at http://www.legislation.gov.uk/wsi/2011/985/contents/made [accessed 24th April 2014]
11 Health and Social Care Information Centre (2013) “National Child Measurement Programme: England, 2012/13 school year” HSCIC London.
12 Statistics for Wales (2011)”Welsh Index of Multiple Deprivation 2011 – summary report” Welsh Government, Cardiff.
13 Statistics for Wales (February 2014) “2011 Census data – characteristics of households in Wales” Cardiff.
14 Gatineau M, Mathrani S. (2011) “Obesity and Ethnicity” Oxford: National Obesity Observatory
15 Harding S, Teyhan A, Maynard MJ, Cruickshank JK. (2008) “Ethnic differences in overweight and obesity in early adolescence in the MRC DASH study: the role of adolescent and parental lifestyle”. International Journal of Epidemiology 37(1):162–72.
16 UK National Screening Committee (2006) “UK National Policy on Growth Screening in Children” at http://www.screening.nhs.uk/growth accessed 24th April 2014
17 National Institute for Health and Clinical Excellence (2006) “Clinical guideline 43 Guidance on the prevention, identification, assessment and management of overweight and obesity in adults and children” NICE London, page 38
18 Cole, T., Freeman, J.V., and Preece M.A. (1995) “Body mass index reference curves for the UK, 1990” Archive of Diseases in Childhood 73: 25-9.
19 Keys, A. et al (1972) “Indices of relative weight and obesity” Journal of Chronic Diseases, 25:329-343.
20 Freeman, J.V., Cole, T.J., Chinn, S. et al (1995) “Cross sectional stature and weight reference curves for the UK, 1990” Archives of Disease in Childhood 1995; 73: 17-24
21 Cole, T.J., Bellizzi, M.C., Flegal, K.M. and Dietz, W.H. (2000) “Establishing a standard definition for child overweight and obesity worldwide: international survey” BMJ 2000;320:1240
22 Dinsdale H., Ridler, C. and Ells, L. (2011) “A simple guide to classifying body mass index in children” Oxford, National Obesity Observatory.
23 Altman D.G., Machin, D., Bryant, T.N., Gardner, M.,J. (eds) (2000) “Statistics with Confidence, 2nd edition” London, BMJ Books.
