public perception of variable retention harvesting · public perception of variable retention...
TRANSCRIPT

PUBLIC PERCEPTION OF VARIABLE RETENTION HARVESTING:
A RESEARCH REPORT INVESTIGATING PUBLIC PERCEPTIONS OF ACCEPTABILITY,SCENIC BEAUTY, AND CLEARCUTTING PERCEPTIONS OF VARIABLE RETENTION
Research report presented to:
William J. Beese, MF, RPFForest Ecologist
BC Coastal GroupNanaimo Woodlands
Weyerhaeuser
By
Collaborative for Advanced Landscape Planning (CALP),Faculty of Forestry, UBCwww.calp.forestry.ubc.ca
Monday, April 07, 2003

ii
TABLE OF CONTENT
1.0 INTRODUCTION ...............................................................................................................11.1 Project purpose ..............................................................................................................11.2 Project objectives ...........................................................................................................21.3 Background information and conceptual rationale..........................................................2
2.0 METHODS.........................................................................................................................62.1 Research questions asked to the respondents...............................................................6
2.1.1 Question A ..............................................................................................................62.1.2 Question B ..............................................................................................................62.1.3 Question C ..............................................................................................................7
2.2 Image selection ..............................................................................................................72.3 Human subjects and experimental setting....................................................................10
2.3.1 Subject recruiting ..................................................................................................102.3.2 Physical experimental setup..................................................................................102.3.3 Presentation format...............................................................................................112.3.4 Experimental design..............................................................................................12
3.0 RESULTS ........................................................................................................................133.1.1 Question order ......................................................................................................133.1.2 Within group reliability ...........................................................................................143.1.3 Between question correlation ................................................................................14
4.0 DISCUSSION...................................................................................................................214.1 Methodology used ........................................................................................................214.2 Results obtained...........................................................................................................214.3 Recommendations for future research endeavors........................................................224.4 Caveats and limitations of the present study................................................................23
5.0 CONCLUSIONS...............................................................................................................256.0 REFERENCES ................................................................................................................26APPENDIX 1: SAMPLE QUESTIONNAIRE (#2) ........................................................................27

1
1.0 INTRODUCTION
1.1 Project purpose
Variable retention (VR) was in part developed to address the public desire for more sustainableforestry. On the ground, foresters apply the “BCTV test” (i.e., will the public view a cutblock as anon-clearcut approach) to gauge the likelihood of achieving public acceptability. While there issome guidance in the literature on levels of removal and percent alteration, in practice it is veryhard to predict the final visual outcome. Designing VR to meet public acceptability withoutincurring higher costs, forgoing volume, or conflicting with ecological or other sustainable forestmanagement objectives is currently a very subjective endeavor.
The present report summarizes work undertaken as part of a pilot research project aimed atinvestigating public acceptability thresholds in conjunction with the use of variable retention. Thepilot nature of the present work should be kept in mind, and in this regard the present researchproject was undertaken as such: keeping in mind the need to identify strengths and possibleweaknesses along the way in order to provide better guidance for future research endeavors onthis topic, while providing preliminary results and data analysis, and a discussion on potentialimplications for forest managers. Studies such as that presented in this report are intended todevelop practical, scientifically based guidelines for managers on thresholds of visualacceptability using a variety of operationally feasible variable retention harvesting methods.
Drawing on Weyerhaeuser’s unique and extensive database of VR blocks and photographicdocumentation, CALP researchers (using perception-testing facilities at UBC) collectedscientifically valid measures of public perceptual responses, in order to shed light on validatingand “nailing down” the “BCTV test” thresholds as the basis for initial discussion of practicalguidelines. Such research projects will contribute to providing more definite standards againstwhich ecological and economic indicators should be balanced.
More specifically, the questions of public acceptability and of scenic beauty of variousharvesting practices, were investigated, as well as the question of public perceptions regardingthe practice of clearcutting, in order to shed light on some of these crucial thresholds. Section1.3 below provides a more detailed description of these thresholds, along with a briefbackground and rationale for the present research project.
As for the structure of the report, it goes as follows. The present section (Section 1.0) consists ofthe report introduction, while the methodology used for the perception experiment is containedin Section 2.0. Section 3.0 presents initial results of the public perception experimentundertaken at UBC as part of this pilot research project. A discussion of the results obtained,including potential implications for forest managers, and recommendations for future researchendeavors is included Section 4.0. Conclusions are included in Section 5.0.

2
1.2 Project objectives
Some specific objectives of the present research project include the following:
• Review variable retention projects and existing photography as provided byWeyerhaeuser in order to flag possible data gaps that could be addressed in futureresearch endeavors;
• Review variable retention projects and existing photography as provided byWeyerhaeuser in order to identify an image dataset based on specific parameters to betested.
• Develop a specific methodology and research design for the testing of public perceptionstailored to the scenic beauty, acceptability and clearcutting questions to be investigated.This method should be developed in such a way that the option to use this method forfuture work on much broader public perception testing is possible if desired.
• Initial perception testing at CALP using a small number of human subjects as a pre-test/pilot project, with structured responses to photographic imagery as an initialindication of perceptual thresholds. The research questions explored will focus on theconcepts of visual acceptability of various harvesting approaches, on scenic beauty ofvarious harvesting approaches, and on the concept of clearcutting.
• Perform preliminary statistical analysis of the data collected, in order to shed light on theresults obtained and on the response from the subjects towards the variety of imagerypresented relative to the questions asked.
• Perform preliminary statistical analysis of the data collected, in order to shed light onstrengths and potential weaknesses of the method developed in the present pilot project.and e.g. typical topographic conditions and types, levels of visual dominance and visiblestewardship, VQO compatibility, etc.);
• Report on the methodology used, on the image dataset, on the initial perception testingresults, and on guidelines for perceptual testing of images for future research endeavors.
• Discuss potential implications for forest managers, based on the preliminary resultsobtained.
1.3 Background information and conceptual rationale
Public perception testing of timber harvesting has been undertaken repeatedly over the lastthree decades. It has been shown on several occasions that when using a clearcut, the percentalteration (% alt.) measure is one of the better predictors of visual quality. This can be extendedto the cases where variable retention (VR or retention system) is used as long as the retention isaggregated: from a purely visual perspective, VR with aggregated retention (aggregated VR)can be considered as similar to a designed clearcut or a variant of the clearcut approach, sincethere are clearings and denuded areas that are clearly visible.
Consequently, the percent alteration variable may be a good general predictor of visual qualityin those aggregated retention cases (as shown by recent yet-to-be-published BCMoF results).However, these cases are not within the scope of the present research project, as other crucialresearch questions, both to Weyerhaeuser and the research community, still need to beaddressed. These research questions pertain to the public perceptions of variable retention

3
when dispersed retention is left on site. More specifically, questions to be answered include: atwhich dispersed retention removal level does the cut block start to be visually discernible, atwhich dispersed retention removal level does the cut block start to be visually unacceptable, andat which dispersed retention removal level does the cut block start to be perceived as a clearcut(in which case the percent alteration figure/measure could be applied/used).
This research project builds upon past BCMoF research, which provides several key conceptsand premises. First, the public perceives clearcuts very differently from partial cuts (dispersedretention cuts) as shown by the two sets of volume removal figures that are provided for TSRmodeling calculations (BCMoF, 1998), themselves based on past BCMoF perception studies(BCMoF, 1996; 1997). These show that what can be harvested both under a clearcut approach(or VR with aggregated retention) and under partial cutting (VR with dispersed retention or“Dispersed Retention cutting”) is highly variable and dependent upon the harvesting techniqueused for each VQO class (among other things). The significant differences (shown in Table 1)between the two sets of figures stresses even more the importance of investigating the abovequestions. Basically, for a given timber volume harvested, people prefer the use of dispersedretention cutting (from a visual perspective) over the use of clearcutting. However, as oneincreases the percent removal within the dispersed retention cut, there will come a point wherethe logging operation will stop looking like a dispersed retention cut and will take on some of theoften visually adverse characteristics usually associated with a clearcut, potentially provoking asharp drop in visual quality (as suggested by the BCMoF data published to date). This thresholdis what managers need to pin-point in order to make decisions regarding public acceptability oftimber harvesting and compliance with VQOs.
Clearcutting Dispersed retention cuttingVQOs Allowed percent (%)
denudation (in plan)Percent (%) Basal Areaavailable with a 70% or
higher probability ofachieving the VQO
Preservation 0-1 N/ARetention 1.1-5 5-45Partial Retention 5.1-15 65-70Modification 15.1-25 95MaximumModification
25.1-40 N/A
No VQO 100 (if no constraintother than visual quality
is considered)
100 (if no constraint otherthan visual quality is
considered)Table 1: VQOs associated with different levels of timber removal underclearcutting and dispersed retention cutting. Derived from BCMoF (1998)1.
1 See also Picard (2002), Picard and Sheppard (2001a, 2001b) for more information on the relationship betweenVQOs and timber supply under both a clearcut approach and a partial cut approach.
4
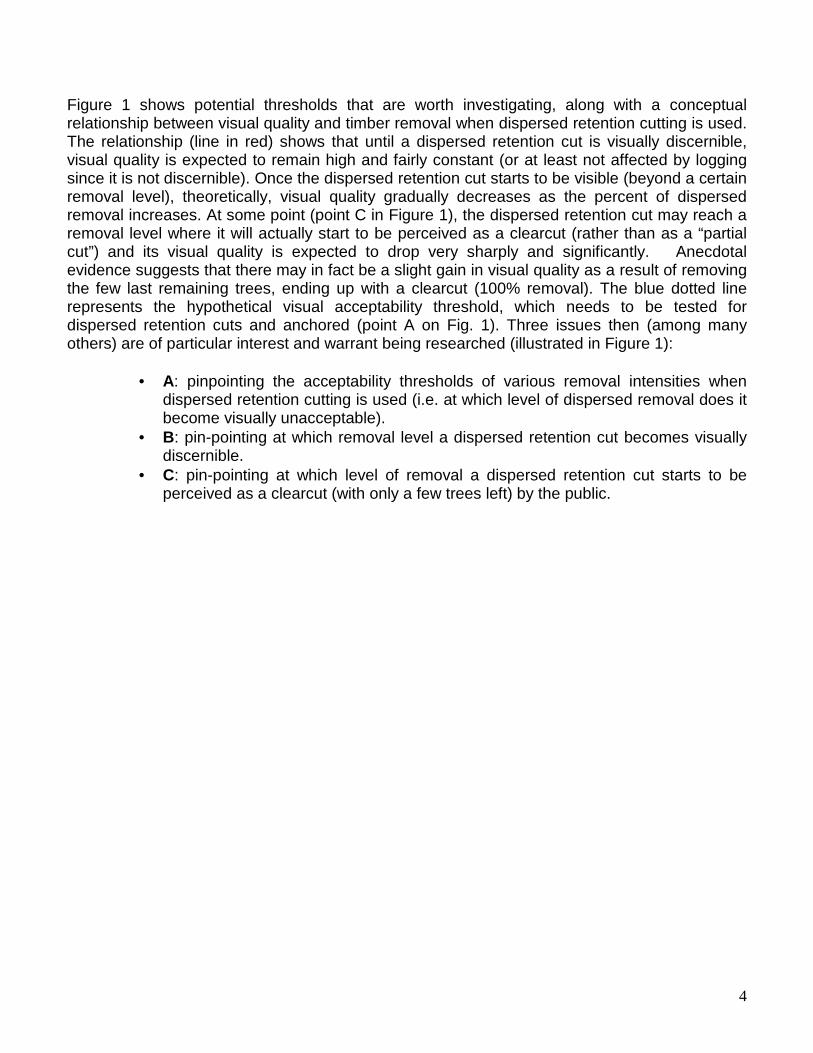
Figure 1 shows potential thresholds that are worth investigating, along with a conceptualrelationship between visual quality and timber removal when dispersed retention cutting is used.The relationship (line in red) shows that until a dispersed retention cut is visually discernible,visual quality is expected to remain high and fairly constant (or at least not affected by loggingsince it is not discernible). Once the dispersed retention cut starts to be visible (beyond a certainremoval level), theoretically, visual quality gradually decreases as the percent of dispersedremoval increases. At some point (point C in Figure 1), the dispersed retention cut may reach aremoval level where it will actually start to be perceived as a clearcut (rather than as a “partialcut”) and its visual quality is expected to drop very sharply and significantly. Anecdotalevidence suggests that there may in fact be a slight gain in visual quality as a result of removingthe few last remaining trees, ending up with a clearcut (100% removal). The blue dotted linerepresents the hypothetical visual acceptability threshold, which needs to be tested fordispersed retention cuts and anchored (point A on Fig. 1). Three issues then (among manyothers) are of particular interest and warrant being researched (illustrated in Figure 1):
• A: pinpointing the acceptability thresholds of various removal intensities whendispersed retention cutting is used (i.e. at which level of dispersed removal does itbecome visually unacceptable).
• B: pin-pointing at which removal level a dispersed retention cut becomes visuallydiscernible.
• C: pin-pointing at which level of removal a dispersed retention cut starts to beperceived as a clearcut (with only a few trees left) by the public.

5
Figure 1: Three potential thresholds that are worth investigating, along witha conceptual relationship between visual quality and timber removal whendispersed retention cutting is used.

6
2.0 METHODS
The method used can be summarized into 3 key steps. First, to select key research questionsthat would contribute to the understanding of the issues mentioned above. Second, to select keytimber harvesting images/photographs to be shown to respondents in order to get perceptualresponses on those images for the research questions of interest. Third, to present thoseimages to a pool of human subjects and to collect perceptual ratings for each question based onthe images presented.
In the case of the above three thresholds (from Figure 1), possible avenues to obtain theinformation sought include asking the respondents directly (e.g. which scenes are visuallyunacceptable, in the case of threshold A in Figure 1), or simply by collecting scenic beautyestimates using a scale that allows for interpretation of the visual acceptability/unacceptabilitythreshold (as done in several past BCMoF perception studies). Another approach would be toask respondents about whether or not they believe the image shown represents clearcutting.This is what was undertaken in this research project and is behind the three questionspresented to the respondents.
2.1 Research questions asked to the respondents
Three questions were identified as being highly relevant to the present pilot research project.These questions were on the issues of scenic beauty, acceptability, and on the concept ofclearcutting in relation to the practice of variable retention. The exact questions asked arepresented here, while Appendix 1 contains a sample questionnaire (questionnaire #2, whichasked questions A and B respectively). The sample questionnaire also includes the instructionsread to each group of subject prior to the beginning of the experiment.
2.1.1 Question AIf logging were to look like what is shown on the image, would it be acceptable to you?
2.1.2 Question BQuestion B1:
How familiar do you consider yourself to be with the concept of clearcutting as a timberharvesting approach?
I know what clearcutting is: ______
I am not completely sure what clearcutting is: ______
I do not know what clearcutting is: ______
Question B2:
Do you think the timber harvesting approach shown in the image is clearcutting? Indicate alsofor each image, the degree of confidence that you have in your answer.

7
2.1.3 Question CHow beautiful would you rate the scene in this image on a scale of 1 to 10, with 1 being very lowscenic beauty (“very ugly”) and 10 being very high scenic beauty (“very beautiful”)?
2.2 Image selection
Approximately 2000 to 2500 images (slides, photographs, and/or digital files) were receivedfrom Weyerhaeuser, which were all screened individually based on several selection criteria.Image selection criteria include the following:
• Foreground scenes where the picture is taken from within the block, from the blockboundary or from very close were removed since the focus of this research project is onmiddle ground perceptions.
• Background scenes where the picture is taken from such a distance that the harvestingoperation is hard to see (because of atmospheric haze, etc.).
• Removal of scenes with people in the foreground or where there is foreground vegetationobstructing part of the view.
• Removal of portrait-oriented scenes (too few of them) as opposed to landscape-orientedscenes, and removal of duplicates.
• Removal of most (not all) scenes with inconsistent weather making them unclear, foggy,with the objective being to retain clear-weather photos (or at least fairly consistentweather/lighting).
• Images with visible sky and/or with a scenic ridgeline were removed as much as possible.• Images with visible water (lake, ocean, etc.) were removed as much as possible since the
scientific literature shows that the presence of water results in higher ratings for theseimages.
• The treated/harvested area is visible within a fairly consistent range of viewing angles. Inother words, photographs where all the block is visible (or where it looks like all the blockis included/visible), and where the logging is seen from an oblique angle ranging fromapproximately 30 to 45 degree (as much as possible). Vertical (plan) views and very lowangle views were removed as well.
• The treated area is visible at a distance of about 1000 meters (1 km), or middlegrounddistance, which appears to be the most crucial distance for perception studies based onthe current literature (for more detail, see Picard, 2002).
• The treated area represents (as much as possible) a fairly homogenous percentalteration or percent of the image size (in other words, an attempt was made to have allthe images showing harvesting operations affecting approximately the same percentageof the total image size).
• Most of the block or harvesting operation must be visible, in order to convey the messagethat what is seen is what the harvesting consists of, avoiding cases such as logged ridgelines where the full extent of the block may not all be visible, etc.
• When several images of the same harvesting operation were available but from differentangles, the image most representative (while meeting the other above criteria) wasretained. In some instances where two images of the same block met all the criteriaabove yet looked quite different, they would be both retained in the selection process.

8
• Most images where more than one harvesting operation was visible were removed,especially if these harvesting operations were different approaches (old clearcutsinterspersed with newer VR blocks, etc.). There were a few images with several differentharvesting approaches visible at the same time were identified as being editable (“fixed”digitally) and consequently were edited and included in the data set.
• A deliberate attempt was made to try and represent all 6 “visual” harvesting types(described below) approximately evenly, with the exception of the “strip cut” and“clearcut” categories on which less emphasis was placed.
Based on these criteria, a 1st selection was undertaken and resulted in 115 images beingflagged as potentially very good candidates. These then went through a second round ofselection process (refining the selection based on the same criteria, in order to remove as muchvariation as possible between the images with the exception of the variation due to theharvesting practice, which is the variation this research projects attempts to have respondentsreact to). This final selection process resulted in 38 slides being selected and classified by“visual” harvesting types.
The classification on the images based on expert assessment of their “visual” appearance ratherthan based on their planimetric classification (or their silvicultural classification) was preferredsince the visual appearance of a harvesting operation is highly dependant on the viewing angleand position, on slope conditions, etc. These “visual” harvesting types, along with the number ofimages in each of these types are as follow:
• Dispersed retention: 7 images• Hybrid/”blended”: 8 images• Group retention images with a few single trees retained as well : 8 images• Group retention images: 10 images• Strip cut images: 4 images• Clearcut images: 1 image
Figure 2 shows the image distribution used for all 38 images and based on the “visual”classification undertaken.
As mentioned earlier, in addition to this image selection process, some images were identifiedas highly relevant for the current research project, but had issues with one or more of theselection criteria (e.g. a very good image, but with logging equipment visible, etc.). In suchcases, the decision was made to undertake some image re-touching (digitally) in order toremove those components of the image that may result in bias being introduced in theexperiment. A total of 15 images were digitally altered using image editing software(Photoshop). Specific examples of image re-touching included ensuring that the harvestingapproach represented was properly identified (remove adjacent clearcuts, etc.), or to removedsigns of human presence such as people, trucks, logging equipment, etc. Figure 3 shows anexample of an image that was edited for the purpose of the present research project.

9
Image type distribution
0
2
4
6
8
10D
ispe
rsed
rete
ntio
n
Hyb
rid/”b
lend
ed”
Gro
up re
tent
ion
imag
es w
ith a
few
sin
gle
trees
reta
ined
Gro
up re
tent
ion
Strip
cut
Cle
arcu
t
"Visual" harvesting types
Num
ber o
f slid
es u
sed
Figure 2: Distribution of the various types of images used.
Figure 3: Original image (left), and photo-edited image (right) where the ocean was removed toavoid introducing bias in the responses since the scientific literature shows that the presence ofwater results in much higher scenic beauty ratings.

10
2.3 Human subjects and experimental setting
2.3.1 Subject recruitingGiven the scientific literature showing that students ratings of landscape scenes arerepresentative of those of the general population, the decision was made to recruit studentsfrom the UBC student community. Other advantages of recruiting students are that they arefairly readily available, and fairly inexpensive to recruit. Consequently, the experiment wasadvertised throughout the UBC campus, mainly via numerous student e-mail lists (broadaudience relative to the time/cost needed), and a Hotmail account was set up toreceive/administer the potential subjects. The initial response was very good (over 100 “letters”of interest within the first 24 hours of advertising), and the respondents were screened andbooked into a time slot once they qualified for the experiment until enough subjects wereobtained.
Two categories of students were not allowed to participate in the experiment. They arelandscape architecture students and forestry students. Landscape architecture students werenot allowed to participate in the experiment because they have received (or are in the process ofreceiving) "specialized" training and education in landscapes, which includes training in how to"read" and "interpret" the landscape, which would affect their view of the landscape. As forforestry students, they were excluded because they have received (or are receiving) a"specialized" training in harvest practices, and in landscape interpretations as well. For thesereasons, and because of the need for "un-trained" opinions, restrictions such as those abovewere applied to the participation of the potential subjects.
2.3.2 Physical experimental setup
The physical experimental setup used for the experiment was fairly standard, in the sense thatthe subjects were brought into UBC’s Landscape Immersion Lab (LIL) in the Faculty of Forestryand assigned numbered seats in front of a projection screen. Only 3 seats were used at a time,placed in a row parallel to the screen, located approximately 9 feet 4 inches from the screen,taped to the ground, and centered in front of the screen. These measurements and the seatpositioning was based on Sheppard (1989) which provides clear guidelines on suchexperimental setups based on screen size and the need to have the image projected in such away that the image edges form a 40 degree view cone with the observer’s eyes (see Sheppard[1989] for more details). Each seat was also numbered, in order to be able to test whether theratings were affected by the respondents seat number (e.g., whether the center seat providesdifferent ratings than the other 2 seats located respectively to its immediate left and right).Results show that the seat number (seat #1, seat #2, or seat #3, etc.) did not have an effect onthe ratings, which was expected given the proximity of the seats relative to their distance to thescreen. Figure 4 shows the experimental setup used (without subjects).

11
Figure 4: Experimental setup used showing respectively, chair #1 to the left, chair #2 in thecenter, and chair #3 to the right.
2.3.3 Presentation formatDespite having a total of 3 questions of interest, a decision was made to ask only 2 questions ata time, considering that 38 images need to be rated for each question. This decision was madebased on scientific literature indicating that respondents’ fatigue starts to be noticeable in thequality of the ratings after about 60 ratings, and that the data starts to be much less reliablebeyond 100 ratings.
As for the presentation of the images during the experiment, the images were inserted into 6(one for each experimental condition) PowerPoint presentations that we presented to therespondents in the form of a controlled (each slide on a timer, etc.) slide show. The imageswithin each presentation were ordered first based on a random selection of the “visual”harvesting type, and then based on a random selection of one image within this “visual”harvesting type until all images were selected and ordered in the presentation. Each image wasseparated by a blank slide indicating the number of the next slide (matching with the responseforms) so the respondents can keep track of which question is to be rated. These blank slideswere shown for 2 seconds, while the images to be rated (and the preview images) were shownfor 10 seconds when scenic beauty was to be rated and for 15 seconds when acceptability andwhen the question on whether the images was a clearcut (with a confidence interval) wereasked. The increased time for the later two questions was due to the anticipation that thesequestions would require more thinking/cognitive process on the part of the respondents.
The final layout for the PowerPoint presentations was as follow:
• 10 preview images (not the same ones as those in the experimental dataset but similarand representative of the experimental dataset) meant for the respondents to get familiarwith the pace of the presentation, and to expose the respondents to the full spectrum ofimagery contained in the dataset. For the last 5 of these 10 preview images, the

12
respondents had to provide ratings in order to get them familiar with the rating processspecific to the first question asked.
• 38 images consisting of the experimental images dataset and for which ratings wereprovided based on the first question asked (which varied from one experimental conditionto the other).
• 5 preview images for which the respondents had to provide ratings in order to get themfamiliar with the rating process specific to the second question asked.
• 38 images consisting of the experimental images dataset and for which ratings wereprovided based on the second question asked (which varied from one experimentalcondition to the other).
This resulted in the respondents having to view a total of 91 images but rate only 85 images (asopposed to having to rate 134 images if all three questions would have been asked at the sametime).
2.3.4 Experimental designThe decision to ask 2 questions out of 3, also resulted in an experimental design which included6 different experimental conditions, based on the questions asked and on the ordering, whichwas alternated in order to test whether the order (1st or 2nd) in which a question was answeredhad an impact on the respondents’ responses (e.g. does asking for acceptability 1st then forscenic beauty provides different ratings than does asking for scenic beauty 1st and then foracceptability, etc.). Figure 5 shows the specific experimental design used,
Session # Image order (presentation) 1st question asked 2nd question askedSession 1Experimental Condition 1Session 5
Presentation 1 Clearcutting question("B")
Scenic Beauty question("C")
Session 3Experimental Condition 2Session 4
Presentation 2 Acceptability question("A")
Clearcutting question("B")
Session 6Experimental Condition 3Session 7
Presentation 3 Scenic Beauty question("C")
Acceptability question("A")
Session 8Experimental Condition 4Session 9
Presentation 4 Clearcutting question("B")
Scenic Beauty question("C")
Session 10Experimental Condition 5Session 11
Presentation 5 Acceptability question("A")
Clearcutting question("B")
Session 12Experimental Condition 6Session 13
Presentation 6 Scenic Beauty question("C")
Acceptability question("A")
Figure 5: Experimental design used.

13
3.0 RESULTS
The present section presents the results of this pilot project in summarized form, in order tokeep the size and length of the present report to an acceptable level. However, considering thatdetailed results summarized for each image presented to the subjects are often very useful andmeaningful, a PowerPoint presentation was produced that present the aggregated raw resultsfor each image, and for each question asked. This presentation is available upon request butwas not included in the present report in order to keep its length to a manageable size.However, a sample image/slide of this presentation is included here (see Figure 6 below).
Figure 6: Sample slide from the PowerPoint presentation showing how the data collected foreach image is aggregated and presented for all 38 images used in the pilot public perceptionexperiment described in the present report.
3.1.1 Question orderOne of the first things to test, given the experimental design used (asking only 2 questions out of3 in different order) was to assess whether or not the order in which a question was asked hadan impact on the ratings obtained. In the eventuality where the order would have an impact,

14
then the data would have to be analyzed separately, based on whether a question was asked1st or 2nd. Otherwise, the data could be collapsed and the results would then benefit from abigger sample pool.
In this regard, results show that the order in which the questions were asked did not appear tohave much of an effect on the ratings obtained. For example, the question on acceptability(question A) when asked as the 1st question correlated (Pearson's R = 0.824, correlationsignificant at the 0.01 level [2-tailed]) with the ratings on the same question when asked as the2nd question. Similarly, the ratings for the scenic beauty question (question C) correlated(Pearson's R = 0.771, correlation significant at the 0.01 level [2-tailed]) with the ratings on thesame question whether it was asked as the 1st question or as the 2nd question.
These results mean that the ratings for the questions can be collapsed and analyzed togetherindependent of the order in which the questions were asked.
3.1.2 Within group reliabilitySimilar to testing for a question order effect, it is important to test for reliability between eachgroup (between each experimental conditions) to test whether or not the sample used was bigenough (fairly reliable ratings between groups) or if a bigger sample would be needed withineach experimental condition (e.g. if the ratings’ reliability is low between each experimentalconditions).
In this regard, results show that the group to group (e.g. experimental condition “X” toexperimental condition “Y”) reliability was quite high and that our sample size was big enough toobtain fairly reliable ratings. For example, for the question on acceptability (question A), resultsshow that group to group reliability was 0.910 (Cronbach's Alpha), which is considered quitehigh and should be interpreted as that sufficient subjects we sampled in this experiment.Similarly, for the question on scenic beauty (question C), results show that group to groupreliability was 0.894 (Cronbach's Alpha), which is also considered quite high and should beinterpreted as that sufficient subjects we sampled in this experiment for this question as well.
3.1.3 Between question correlationAnother key point of interest is whether or not the questions were testing for different things. Inother words, were all 3 questions needed, or were they all asking roughly the same thing. Inorder to assess this issue, correlation was assessed between each question as an attempt toassess whether or not all 3 questions are needed or whether they overlap (potentially creatingsome redundancy).
In this regard, results show that acceptability ratings and scenic beauty ratings correlated witheach other quite strongly (Pearson's R = 0.882, correlation significant at the 0.01 level [2-tailed]). Therefore in this context acceptability and scenic beauty are essentially measuring thesame things, and could be considered equivalent in future research endeavors. As for whetherthe clearcutting concept question correlates with the other two, results show more moderatecorrelations (yet still significant at the 0.01 level [2-tailed]) both against scenic beauty andacceptability as well as with the UBC “visual” harvesting type classification. In other words,whether the image was seen as a clearcut or not was correlated with its scenic beauty, with its

15
acceptability, and with its UBC “visual” harvesting type classification. Figure 7 to 10 below showthese correlation results in more detail.
Other key research results are the investigation of possible links between the percent retentionwithin the variable retention scenes and the perceptual responses of the public. The resultspertaining to these issues are presented below (Figures 11 to 13) and discussed in section 4.0.
1 .071 -.615 ** .600 ** -.780 ** . .671 .000 .000 .000
38 38 38 38 38 .071 1 .008 .002 -.213 .671 . .963 .991 .200
38 38 38 38 38 -.615 ** .008 1 -.043 .889 ** .000 .963 . .796 .000
38 38 38 38 38 .600 ** .002 -.043 1 -.237 .000 .991 .796 . .152
38 38 38 38 38 -.780 ** -.213 .889 ** -.237 1 .000 .200 .000 .152 .
38 38 38 38 38
Pearson Sig. (2-N Pearson Sig. (2-N Pearson Sig. (2-N Pearson Sig. (2-
)N Pearson Sig. (2-N
CLEARCUT
CONFIDENCE
SB
IMAGECATEGORIES
ACCEPTABILITY
Clearcut Confidence Scenic Beauty IMAGECAT ACCEPT
Correlation is significant at the 0.01 level (2-**.
SCENIC BEAUTY
Figure 7: Correlation table between the perception of a given image as a clearcut (“average CCanswer”), and scenic beauty (“SB”), acceptability (“Accept”). Note that all correlations aresignificant at the 0.01 level [2-tailed]) with the exception of the confidence ratings (“confidenceaverage”) which is to be expected since this is the confidence of the respondents in theirassessment of a given image being a clearcut.

16
Proportion of respondents saying that a given image is a clearcut
100% 80% 60% 40% 20% 0%
8
7
6
5
4
3
2
Figure 8: Scatter plot showing the relationship between respondents’ perception of whether agiven image is a clearcut and the acceptability ratings for that same image. As would beexpected, the more an image is seen (whether it is a clearcut or not) as a clearcut, the lessacceptable it is, and vice-versa.
Average ScenicBeauty ratings

17
Proportion of respondents saying that a given image is a clearcut
100% 80% 60% 40% 20% 0%
5.0
4.5
4.0
3.5
3.0
2.5
2.0
1.5
1.0
Figure 9: Scatter plot showing the relationship between respondents’ perception of whether agiven image is a clearcut and the acceptability ratings for that same image. As would beexpected, the more an image is seen (whether it is a clearcut or not) as a clearcut, the lessacceptable it is, and vice-versa.
AverageAcceptabilityratings

18
100% 80% 60% 40% 20% 0%
Clearcut images Strip cut Images Gr. Ret. Images Gr. Ret. + ind. tree Images Hybrid cut Images Disp. Ret. Cut Images
Figure 10: Proportion of respondents (in percentages on the “X” axis) saying that a givenimage is a clearcut, for each “visual” harvesting image types (presented on the “Y” axis).The scatter plot shows a clear tendency towards labeling “group retention cuts” and “groupretention cuts with a few single trees retained” as clearcuts, at least based on the UBC“visual” labeling system used.

19
Acceptability versus percent retention
0.00
0.50
1.00
1.50
2.00
2.50
3.00
3.50
4.00
4.50
5.00
0% 7% 11%
12%
14%
17%
18%
18%
20%
21%
22%
24%
29%
32%
34%
40%
48%
53%
Percent retention
Ave
rage
acc
epta
bilit
y ra
ting
Figure 11: Average acceptability ratings in relation to the percent retention (assumed to bemeasured by area). Correlation: 0.481.
"It is a clearcut" versus percent retention
0%
10%
20%
30%
40%
50%
60%
70%
80%
90%
100%
0% 7% 11%
12%
14%
17%
18%
18%
20%
21%
22%
24%
29%
32%
34%
40%
48%
53%
Percent retention
Perc
ent o
f res
pond
ents
say
ing
the
imag
e is
a
clea
rcut
Figure 12: Percent of respondents saying the given image is a clearcut in relation to the percentretention (assumed to be measured by area). Correlation: -0.275.

20
Scenic Beauty versus percent retention
0.00
1.00
2.00
3.00
4.00
5.00
6.00
7.00
8.00
9.00
10.00
0% 7% 11%
12%
14%
17%
18%
18%
20%
21%
22%
24%
29%
32%
34%
40%
48%
53%
Percent retention
Ave
rage
Sce
nic
Bea
uty
ratin
g
Figure 13: Average scenic beauty ratings in relation to the percent retention (assumed to bemeasured by area). Correlation: 0.550.
21
4.0 DISCUSSION
4.1 Methodology used
Despite the pilot nature of this research projects, multiple key findings were obtained and will bediscussed here. First, it appears that the number of respondents sampled, combined with theexperimental design used proved sufficient enough to derive key results from the experiment.However, it appears that the scenic beauty question and the acceptability question measuredessentially the same thing, which means that one of those two questions could be removed infuture research endeavors. It is the opinion of the author of the present report that the scenicbeauty question could be left aside in favor of the acceptability question since, ultimately, this iswhat forest managers are likely to be after. However, the scenic beauty question has theadvantage of being know, tested, and proven. Also, it appears that the chair number/positiondid not have any effect, nor did the question ordering which means that the same setup andquestionnaire format could be used again. Based on these findings, future research endeavorscould also explore the possibility of expanding the row of chairs (using 5 chairs instead of the 3chairs shown on Figure 4) and explore the possibility of using a second row (perhaps with 3chairs) behind the 1st row in order to allow for more subjects to be running the experiment at atime (possibly 8 or more subjects at a time). This would allow for significantly less time to bespent on data collection, possibly leaving more time for data analysis, etc.
4.2 Results obtained
Results presented in section 3.0 above allow for some very interesting discussion andrecommendations to be put forward.
One of the most interesting finding, is the correlation between the respondents perception that ascene is a clearcut with the scenic beauty and acceptability ratings this same image. In otherwords, the more a scene is seen as a clearcut, the less acceptable (or less beautiful) it is (asseen in Figures 6 to 8). More over, 66% of the images were perceived as clearcuts by a majorityof people (as seen on Figure 8, and using 50% + 1 as a threshold). The implication of thisfinding for Weyerhaeuser and forest managers, is that there appears to be a difference betweenthe silvicultural and/or ecological definition of a clearcut versus the visual definition of a clearcutthat the respondents seemed to be using (with the exception of a few scenes, all the imagesused were various types of variable retention harvesting). In others words, it appears that thepublic does not follow neither the silvicultural definition nor the ecological definition of a clearcutwhen making visual assessments, but rather a visual definition. This information is crucial,especially if one desires to undertake steps to be perceived by the public as not using thepractice of clearcutting anymore, and this visual definition of a clearcut apparently used by thepublic needs to be further investigated and pin-pointed in order to ensure one is not perceivedas undertaking clearcut harvesting if one does not desire to be perceived as such.
Other very interesting results include the correlation between the UBC “visual” harvesting typeand the perception that a scene is clearcutting (as seen in Figures 6 and 9) and the clear

22
tendency for the public to perceive group retention scenes as clearcuts, and for the dispersedretention scenes and hybrid scenes to be perceived as non-clearcut scenes. However, it shouldbe kept in mind that these results may be due to the fact that a large part of the respondentsindicated that they were not quite sure of what clearcutting was2. This latest point clearly impliesthat more public education on the concept of clearcutting could provide different perceptionresults.
When correlated against the percent removal figures provided by Weyerhaeuser, the resultsshow a tendency for increased acceptability (and scenic beauty) as the percent of retentionincreases (see Figures 11 and 13), but this tendency is not as pronounced as expected (this iscorroborated by the low correlations obtained). This is most likely due to the fact that some ofthe retention figures are expressed in terms of area (plan measure, while the images are seen inperspective), and due to the absence of controlled and constant harvesting pattern againstwhich to measure the effect of various retention levels in relation to public acceptability andscenic beauty. These results stress the importance of not only focusing on the retention level,but also on the retention/harvesting pattern, and on the interaction between these two variables.
Figure 12 is probably one of the most interesting figure obtained as part of this research project,in the sense that it clearly indicates that the retention level has nothing to do with whether animage is perceived as a clearcut or not. As shown in Figure 12, aggregated retention sceneswith as much as 28% and 40% retention were perceived as clearcuts by 100% of therespondents, while some dispersed retention scenes with as little as 12% and 17% retentionwere perceived as clearcuts by 30% and 20% of the respondents respectively. When combinedwith the results shown in Figure 9, these findings underline even more the importance of thepattern of retention to public perceptions.
4.3 Recommendations for future research endeavors
The results obtained as part of the present pilot research project contribute to the creation ofcrucial tools and guidelines to aid decision-making for variable retention cutblock design. Assuch, and despite its pilot nature, the present research project stands on its own without furtherwork. However, the value of this work could be significantly enhanced by the undertaking offurther research work as briefly described here.
• More systematic and controlled field photography need to be obtained followed by theapplication of state-of-the-art visualization techniques in order to replicate the existingphotography and to provide controlled sets of images with varying levels of retention andslope/angle of view, for more definitive identification of perceptual thresholds. This step iscrucial in any attempt at pin-pointing the perceptual thresholds discussed throughout thepresent research report.
2 50 % of the respondents indicated that they knew what clearcutting was, while 45% indicated that they were notsure (this could be due to the fact that they are being asked in an experimental setting which could lead them toapply a higher knowledge standard but this point needs further investigation). 5% of the respondents indicated thatthey did not know what clearcutting was.

23
• Additional comprehensive perception testing at CALP using a sample of typical humansubjects, with structured responses to photographic and computer-generated imagery isneeded. Particular attention should be given to the representativeness of the sampleused and sampling a larger number of people should be considered despite resultsreported above in order to confirm these results. Consideration should be given tocorroborating the ratings of students with that of a sample of adults representative of theBC population (based on census data for example) since such samples have alreadybeen used by the BCMoF (e.g. BCMoF, 1996, 1997). This would allow for potentialbridging of several research efforts, and could allow for comparisons to be madeovertime, since the BCMoF data is 5-7 years old. Such comparisons would allow theinvestigation of potential trends in the BC perceptual opinions which would prove veryvaluable to forest managers.
• Development of management/design guidelines for meeting visual thresholds withvariable retention, jointly developed with Weyerhaeuser operations and managementstaff to make the findings as useful and communicable as possible. Visualizations will beused to convey the intended design outcomes as further guidance to managers.
• Further investigate the various variables used in expressing the level and pattern ofretention left on a given block in order to refine our understanding of the interactionbetween those variables (e.g. retention by area, retention by basal area, retention byvolume, etc.) and to pin-point the best predictor variables for public perceptions of variousintensities and types of variable retention harvesting.
4.4 Caveats and limitations of the present study
Some caveats, limitations and assumptions should be kept in mind when reviewing the resultsobtained and recommendations made. Two of these caveats are summarized below, as theyaddress some of the main areas where improvements could be made for future researchendeavors.
First, the use of un-controlled photography resulted in a dataset consisting of not only a widearray of harvesting types and patterns (which was the variable to test) but also (and despite thethorough image selection process undertaken) contained a wide variety of landscapes, slopes,view angles, forest types, etc.). These variations, all have the potential to introduce unwantedvariability in the dataset and should be minimized as much as possible. These variations arealso behind the recommendation for more systematic and controlled field photography, and forthe use of state-of-the-art visualization techniques provide controlled sets of images (see abovefor more details). The present study also assumed that all the imagery used was taken with astandard 50 mm lens, which may not be the case, and which may have influenced the resultsobtained. Also, some slide types were identified as being under-represented (too few) andfurther controlled imagery of those slide types would be needed in future research endeavors.These include the need for more slides showing clearcutting (oddly enough), and the need formore slides showing strip cutting.

24
Second, the percent retention figures used in the present analysis were assumed to bemeasured by area (as suggested by Weyerhaeuser staff), which is a planimetric measure. Whileone of the best measure to use when clearcutting or aggregated retention are used (since areatreated/cut is at the root of the percent alteration figures, via the plan-to-perspective concept),this measure may hold less predictability when dispersed retention is considered as seen insome of the results presented above. Consequently, and since past BCMoF research found thepercent basal area retained to be the best predictor of scenic beauty when available (BCMoF,1997) and when partial cutting was used, the work contained in the present research reportcould possibly be improved by the use of such basal area retention figures for harvesting typesshowing dispersed retention.

25
5.0 CONCLUSIONS
In conclusion, the pilot research project described in this report allowed for the review variableretention projects and existing photography and contributed to identifying data gaps thatdeserve attention for future research endeavors. A specific methodology and research designfor the testing of public perceptions tailored to the variables of interest in this research projectand to the variable retention harvesting approach used by Weyerhaeuser was also developedand successfully tested.
Results from the analysis undertaken as part of this pilot project shed light on public perceptionsof variable retention harvesting and provide guidance for future research endeavors. It appearsfrom the results obtained in this pilot research project that the retention level alone cannot becorrelated to public perceptions, and that the pattern of retention plays a crucial role in the waythe public perceives a given harvesting scene. This stresses the need for systematic andcontrolled field photography followed by the use of advanced visualization techniques to providecontrolled sets of images with varying levels of retention and slope/angle of view, for moredefinitive identification of perceptual thresholds. This is crucial to pin-pointing the perceptualthresholds discussed throughout the present research report and is also crucial to themonitoring and assessment of social criteria and indicators in ongoing certification and adaptivemanagement programs for sustainable forestry.

26
6.0 REFERENCES
B.C. Ministry of Forests (BCMoF). 1996. Clearcutting and Visual Quality: A public PerceptionStudy. Victoria, BC: Recreation Section, Range, Recreation and Forest Practices Branch,B.C. Ministry of Forests.
B.C. Ministry of Forests (BCMoF). 1997. Visual impacts of partial cutting: summary report.Technical analysis and public perception study. Victoria, BC: Forest Development Section,Forest Practices Branch, B.C. Ministry of Forests.
B.C. Ministry of Forests (BCMoF). 1998. Procedures for factoring visual resources into timbersupply analyses. Victoria, BC: Forest Development Section, Forest Practices Branch, B.C.Ministry of Forests.
Picard, Paul. 2002. Do Visual Quality Objectives necessarily constrain timber harvest levels?Exploring the potential of partial cutting. M. Sc. Thesis, University of British Columbia,Vancouver, BC. 132 p., 122 refs.
Picard, Paul and Sheppard, Stephen R. J. 2001a. Visual Resource Management in BritishColumbia: Part I. The effects of visual resource management on timber availability: a reviewof case studies and policy. Research Report, B.C. Journal of Ecosystem and Management,Volume 1, No. 2. http://www.siferp.org/jem/2001/vol1/no2/art1.pdf
Picard, Paul and Sheppard, Stephen R. J. 2001b. Visual Resource Management in BritishColumbia: Part II. Partial cutting in the front-country: a win-win solution for short-term timberavailability and aesthetics?. Research Report, B.C. Journal of Ecosystem and Management,Volume 1, No. 2. http://www.siferp.org/jem/2001/vol1/no2/art3.pdf
Sheppard, S. R. J. 1989. Visual simulation: A user’s guide for architects, engineers, andplanners. New York, NY: Van Nostrand Reinhold.

27
APPENDIX 1: SAMPLE QUESTIONNAIRE (#2)

28
UBC LANDSCAPE PERCEPTION EXPERIMENT
INTRODUCTION:
Welcome and thank you very much for participating in our study today. Our research dependsupon the cooperation of people like yourselves, and we are very grateful for your help. Theoutcome of these studies will contribute to the scientific understanding of public responses toalternative environmental policies and practices.
This study is part of a program of research to learn about differences in people's levels ofacceptability of various forest management alternatives and we greatly appreciate your time inthis effort.Please Read Carefully:Before beginning this experiment it is important that you know that if at any time you do not feelcompletely comfortable participating in this experiment you should feel free to get up quietly andleave--no explanations will be necessary. The door to the lab will be closed to reducedisturbance, but this in no way restricts your opportunity to leave if you should choose to do so.
Thank you again for your participation.
INSTRUCTIONS:
During this experiment, you will be viewing 2 sets of 40 slides of forested landscapes. You willbe asked two questions. The first question will address the 1st set of slides, while the secondquestion will address the 2nd and last set of slides. You will be informed when we switch to thesecond question.
The first set of slide will be preceded by 10 preview slides, 5 of which you will not have to rate,and 5 of which you will have to rate as a warm-up exercise. The preview slides are meant toshow you a range of the type of images that you will be seeing, as well as to allow you to getfamiliar with the pace of the slide show and the rating. After these 10 test images, and before westart the experiment, you will have the chance to ask any questions you may have.
The second set of slide will be preceded by 5 preview slides, which you will have to rate as awarm-up exercise. The preview slides are meant to show you a range of the type of images thatyou will be seeing, as well as to allow you to get familiar with the pace of the slide show and therating. After these 10 test images, and before we start the experiment, you will have the chanceto ask any questions you may have.

EXAMPLE OF HOW TO ANSWER QUESTION A
If logging were to look like what is shown on the image, would it be acceptable to you?(Please circle or mark the appropriate value under the appropriate heading for eachimage shown, 1 being very unacceptable and 5 being very acceptable)
IMAGENUMBER
Veryunacceptable
1
Mostlyunacceptable
2
Neutral orNot sure
3
Mostlyacceptable
4
Veryacceptable
5
Ima e # 1 1 2 3 4 5
Ima
Ima
Ima
Ima
gX
e # 2 1 2 3 4 5 gX e # 3 1 2 3 4 5X gg # 4 1 2 3 4 5
g
eX
# 5 1 2 3 4 5 eX29
30
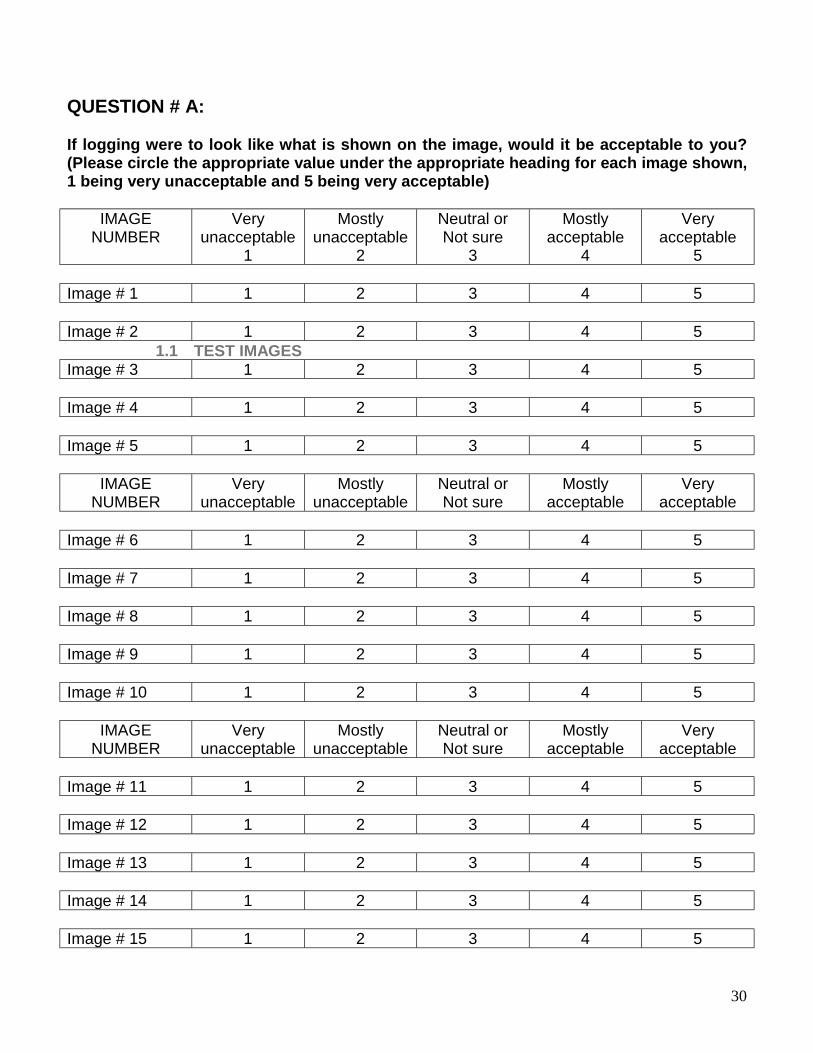
QUESTION # A:
If logging were to look like what is shown on the image, would it be acceptable to you?(Please circle the appropriate value under the appropriate heading for each image shown,1 being very unacceptable and 5 being very acceptable)
IMAGENUMBER
Veryunacceptable
1
Mostlyunacceptable
2
Neutral orNot sure
3
Mostlyacceptable
4
Veryacceptable
5
Image # 1 1 2 3 4 5
Image # 2 1 2 3 4 5
Image # 3 1 2 3 4 5
Image # 4 1 2 3 4 5
Image # 5 1 2 3 4 5
IMAGENUMBER
Veryunacceptable
Mostlyunacceptable
Neutral orNot sure
Mostlyacceptable
Veryacceptable
Image # 6 1 2 3 4 5
Image # 7 1 2 3 4 5
Image # 8 1 2 3 4 5
Image # 9 1 2 3 4 5
Image # 10 1 2 3 4 5
IMAGENUMBER
Veryunacceptable
Mostlyunacceptable
Neutral orNot sure
Mostlyacceptable
Veryacceptable
Image # 11 1 2 3 4 5
Image # 12 1 2 3 4 5
Image # 13 1 2 3 4 5
Image # 14 1 2 3 4 5
Image # 15 1 2 3 4 5
1.1 TEST IMAGES

31
IMAGENUMBER
Veryunacceptable
Mostlyunacceptable
Neutral orNot sure
Mostlyacceptable
Veryacceptable
Image # 16 1 2 3 4 5
Image # 17 1 2 3 4 5
Image # 18 1 2 3 4 5
Image # 19 1 2 3 4 5
Image # 20 1 2 3 4 5
IMAGENUMBER
Veryunacceptable
Mostlyunacceptable
Neutral orNot sure
Mostlyacceptable
Veryacceptable
Image # 21 1 2 3 4 5
Image # 22 1 2 3 4 5
Image # 23 1 2 3 4 5
Image # 24 1 2 3 4 5
Image # 25 1 2 3 4 5
IMAGENUMBER
Veryunacceptable
Mostlyunacceptable
Neutral orNot sure
Mostlyacceptable
Veryacceptable
Image # 26 1 2 3 4 5
Image # 27 1 2 3 4 5
Image # 28 1 2 3 4 5
Image # 29 1 2 3 4 5
Image # 30 1 2 3 4 5

32
IMAGENUMBER
Veryunacceptable
Mostlyunacceptable
Neutral orNot sure
Mostlyacceptable
Veryacceptable
Image # 31 1 2 3 4 5
Image # 32 1 2 3 4 5
Image # 33 1 2 3 4 5
Image # 34 1 2 3 4 5
Image # 35 1 2 3 4 5
IMAGENUMBER
Veryunacceptable
Mostlyunacceptable
Neutral orNot sure
Mostlyacceptable
Veryacceptable
Image # 36 1 2 3 4 5
Image # 37 1 2 3 4 5
Image # 38 1 2 3 4 5
Image # 39 1 2 3 4 5
Image # 40 1 2 3 4 5
IMAGENUMBER
Veryunacceptable
Mostlyunacceptable
Neutral orNot sure
Mostlyacceptable
Veryacceptable
Image # 41 1 2 3 4 5
Image # 42 1 2 3 4 5
Image # 43 1 2 3 4 5
Image # 44 1 2 3 4 5
Image # 45 1 2 3 4 5

33
IMAGENUMBER
Veryunacceptable
Mostlyunacceptable
Neutral orNot sure
Mostlyacceptable
Veryacceptable
Image # 46 1 2 3 4 5
Image # 47 1 2 3 4 5
Image # 48 1 2 3 4 5

34
QUESTION # B1:
How familiar do you consider yourself to be with the concept of clearcutting as a timberharvesting approach? (Please place a mark next to the statement most appropriate toyour situation)
I know what clearcutting is: ______
I am not completely sure what clearcutting is: ______
I do not know what clearcutting is: ______

EXAMPLE OF HOW TO ANSWER QUESTION B2
Do you think the timber harvesting approach shown in the image is clearcutting? (Pleaseanswer as best you can, even if you indicated above that you do not know whatclearcutting is, by putting a mark under the appropriate YES/NO column. Indicate also foreach image, the degree of confidence that you have in your answer, by either circling ormarking the appropriate value under the confidence scale. With 1 being not confident,and 5 being very confident)
IMAGENUMBER
YES,this is aclearcut
NO,this is not a
clearcut
How confident are you on a scale from 1 to 5?(1 is not confident and 5 is very confident)
Not confident Very confidentImage # 1 2 3 4 5
Image
Image
Image
Imag
X
X # 2 1 2 3 4 5# 3 1 2 3 4 5
# 4 1 2 3 4 5
XX
XX
# 5 1 2 3 4 5
eX1
X
35

36
QUESTION # B2:
Do you think the timber harvesting approach shown in the image is clearcutting? (Pleaseanswer as best you can, even if you indicated above that you do not know whatclearcutting is, by putting a mark under the appropriate YES/NO column. Indicate also foreach image, the degree of confidence that you have in your answer, by either circling ormarking the appropriate value under the confidence scale. With 1 being not confident,and 5 being very confident)
IMAGENUMBER
YES,this is aclearcut
NO,this is not a
clearcut
How confident are you on a scale from 1 to 5?(1 is not confident and 5 is very confident)
Not confident Very confidentImage # 1 1 2 3 4 5
Image # 2 1 2 3 4 5
Image # 3 1 2 3 4 5
Image # 4 1 2 3 4 5
Image # 5 1 2 3 4 5
IMAGENUMBER
YES,this is aclearcut
NO,this is not a
clearcut
How confident are you on a scale from 1 to 5?(1 is not confident and 5 is very confident)
Not confident Very confidentImage # 6 1 2 3 4 5
Image # 7 1 2 3 4 5
Image # 8 1 2 3 4 5
Image # 9 1 2 3 4 5
Image # 10 1 2 3 4 5

37
IMAGENUMBER
YES,this is aclearcut
NO,this is not a
clearcut
How confident are you on a scale from 1 to 5?(1 is not confident and 5 is very confident)
Not confident Very confidentImage # 11 1 2 3 4 5
Image # 12 1 2 3 4 5
Image # 13 1 2 3 4 5
Image # 14 1 2 3 4 5
Image # 15 1 2 3 4 5
IMAGENUMBER
YES,this is aclearcut
NO,this is not a
clearcut
How confident are you on a scale from 1 to 5?(1 is not confident and 5 is very confident)
Not confident Very confidentImage # 16 1 2 3 4 5
Image # 17 1 2 3 4 5
Image # 18 1 2 3 4 5
Image # 19 1 2 3 4 5
Image # 20 1 2 3 4 5
IMAGENUMBER
YES,this is aclearcut
NO,this is not a
clearcut
How confident are you on a scale from 1 to 5?(1 is not confident and 5 is very confident)
Not confident Very confidentImage # 21 1 2 3 4 5
Image # 22 1 2 3 4 5
Image # 23 1 2 3 4 5
Image # 24 1 2 3 4 5
Image # 25 1 2 3 4 5

38
IMAGENUMBER
YES,this is aclearcut
NO,this is not a
clearcut
How confident are you on a scale from 1 to 5?(1 is not confident and 5 is very confident)
Not confident Very confidentImage # 26 1 2 3 4 5
Image # 27 1 2 3 4 5
Image # 28 1 2 3 4 5
Image # 29 1 2 3 4 5
Image # 30 1 2 3 4 5
IMAGENUMBER
YES,this is aclearcut
NO,this is not a
clearcut
How confident are you on a scale from 1 to 5?(1 is not confident and 5 is very confident)
Not confident Very confidentImage # 31 1 2 3 4 5
Image # 32 1 2 3 4 5
Image # 33 1 2 3 4 5
Image # 34 1 2 3 4 5
Image # 35 1 2 3 4 5
IMAGENUMBER
YES,this is aclearcut
NO,this is not a
clearcut
How confident are you on a scale from 1 to 5?(1 is not confident and 5 is very confident)
Not confident Very confidentImage # 36 1 2 3 4 5
Image # 37 1 2 3 4 5
Image # 38 1 2 3 4 5
Image # 39 1 2 3 4 5
Image # 40 1 2 3 4 5

39
IMAGENUMBER
YES,this is aclearcut
NO,this is not a
clearcut
How confident are you on a scale from 1 to 5?(1 is not confident and 5 is very confident)
Not confident Very confidentImage # 41 1 2 3 4 5
Image # 42 1 2 3 4 5
Image # 43 1 2 3 4 5