public-place smoking laws and exposure to...
TRANSCRIPT

1
Public-Place Smoking Laws and Exposure to Environmental
Tobacco Smoke (ETS)
By Christopher Carpenter, Sabina Postolek, and Casey Warman*
Public-place smoking restrictions are the most important non-price tobacco control measures worldwide, yet surprisingly little is known about their effects on exposure to environmental tobacco smoke (ETS). We study these laws in Canada using data with questions about respondents’ ETS exposure in public and private places. In fixed-effects models we find these laws had no effects on smoking but induced large and statistically significant reductions in public-place ETS exposure, especially in bars and restaurants. We do not find significant evidence of ETS displacement to private homes. Our results indicate wide latitude for health improvements from banning smoking in public places. (JEL I1)
Environmental tobacco smoke (ETS) is estimated to kill 600,000 people worldwide each
year through increased heart disease, respiratory ailments, asthma, and lung cancer (Mattias
Oberg et al. 2011).1 Reducing population exposure to ETS is a key public health priority of
many governments, and increasingly cites and countries have been adopting clean indoor air
policies that restrict or completely prohibit smoking in a variety of public places such as
restaurants and bars (EPHA 2010). Indeed, research based on a recent World Bank report
informed by a panel of tobacco control experts in World Health Organization member countries
* Carpenter: The Paul Merage School of Business, University of California, Irvine, 428 SB, Irvine CA 92697-3125, (e-mail: [email protected]); Postolek: Queen’s University; Dunning Hall Room 209, 94 University Avenue, Kingston, ON K7L 3N6, (e-mail: [email protected]); Warman: Queen’s University; Dunning Hall Room 209, 94 University Avenue, Kingston, ON K7L 3N6, (e-mail: [email protected]). We thank Marianne Bitler, Claire de Oliveira, Susumu Imai, Ian Irvine, Dean Lillard, Madeline Zavodny, three anonymous referees, and seminar participants at UC Berkeley ARE, UC Irvine, NBER, the 2010 American Society of Health Economists Conference, and the 2009 Canadian Economics Association meetings for useful comments. Some of the results in this paper are based on confidential data accessed at the Queen’s RDC which are available in the Canadian Research Data Centres; interested readers can contact Warman for details on gaining access. A previous version of this paper circulated under the title “Public-Place Smoking Laws and Exposure to Environmental Tobacco Smoke (ETS) in Public Places.” While the research and analysis are based on data from Statistics Canada, the opinions expressed do not represent the views of Statistics Canada. All errors are our own. 1 As a point of comparison, active tobacco use is estimated to be responsible for 5.1 million deaths per year worldwide (Oberg et al. 2011). Throughout, we refer to environmental tobacco smoke or ETS. Depending on the setting and context, this is also sometimes referred to as second-hand smoke or SHS.

2
ranks public-place smoking restrictions as the most important non-price policy to reduce death
and disease caused by tobacco use, ahead of advertising bans, information campaigns, warning
labels, and quit-assistance for current smokers (Luk Joossens and Martin Raw 2006).
Several peer-reviewed public health and medical studies link public-place smoking bans
to reductions in acute myocardial infarctions (AMI) (i.e., heart attacks), and a 2009 report by the
Institute of Medicine (IOM) finds the evidence is sufficient to conclude that smoking bans—
including those that apply to public places such as bars and restaurants—have causal effects at
reducing AMI.2 According to the IOM report, even brief exposure to environmental tobacco
smoke (ETS) can physiologically trigger AMI, making it plausible that public-place smoking
bans could reduce AMI through reducing exposure to ETS.3 If true, the conclusions of the IOM
report suggest wide latitude for public health improvements for many jurisdictions in the US and
elsewhere that have not yet banned smoking in public places.4
Notably, however, we know very little about whether, how, and to what extent public-
place smoking laws actually affect exposure to ETS, and we know even less about whether these
effects differ by smoking status. The IOM explicitly notes this fact as a key limitation to
research in this area, writing in their report that a key gap in our understanding of the health
effects of these policies is a “lack of information on changes in secondhand-smoke exposure”
(IOM 2009). Most previous studies focus on own-smoking behavior (Mariane P. Bitler,
2 Not all research has reached the same conclusion, however. Kanaka D. Shetty et al. (2011), for example, find that evidence for a relationship between smoking bans and AMI in the US is sensitive to choice of cities and specification. 3 The scientific basis for this relationship is summarized in the most recent Surgeon General’s report on smoking, in which it is stated that “[f]or cardiovascular disease, the immediate effects of even short exposures to secondhand smoke on some functions of the circulatory system appear to be as large as those seen in association with active smoking of one pack of cigarettes per day” (USDHHS 2010). 4 The Americans for Non-Smokers’ Rights Foundation (ANRF), a group that tracks clean indoor air coverage across the United States, notes that only 22 states have laws that completely prohibit smoking in all workplaces, bars, and restaurants (the three main venues they track) without provisions for designated smoking rooms or firm size exemptions (ANRF 2010).

3
Christopher S. Carpenter, and Madeline Zavodny 2010a, John A. Tauras 2006), with a few
notable exceptions. Carpenter (2009) examines the effects of laws restricting smoking in private
workplaces on exposure to ETS at work, but he does not study exposure in other places. Jerome
Adda and Francesca Cornaglia (2010) study the effects of public-place smoking laws on
population exposure to ETS using saliva cotinine levels (a biological marker for nicotine
metabolite), but their data do not permit them to observe where individuals were exposed.
Several other public health studies use ambient nicotine measurements or other biological
markers to study ETS exposure before and after smoking bans (usually in bars and restaurants).
These studies generally find large reductions in exposure but are limited to a very small number
of sites and suffer from the usual concerns about other unobserved characteristics about those
sites that caused them to implement a smoking ban and that may be independently correlated
with smoking-related outcomes.5 Consistent with the IOM report, we are aware of no large-scale
quasi-experimental evaluations of the effects of public-place smoking laws that use direct
information on the location of ETS exposure.
We fill this gap in the literature by studying the rapid diffusion of public-place smoking
laws across Canada on smoking outcomes and exposure to ETS. Our main contribution is that
we leverage unique confidential data from the 2002-2008 Canadian Tobacco Use Monitoring
Surveys which contain detailed questions on the precise location of exposure to ETS, such as
bars, restaurants, and homes.6 We also draw on an independent source of confidential data from
5 See, for example, IOM (2009), Farhang Akbar-Khanzadeh et al. (2004), Dag G. Ellingsen et al. (2006), Giuseppe Gorini et al. (2008), Maurice Mulcahy et al. (2005), Wael Al-Delaimy, Trish Fraser, and Alistair Woodward (2001), Daniel Menzies et al. (2006), Pasquale Valente et al. (2007), Jill P. Pell et al. (2008), and others. William N. Evans, Matthew C. Farrelly, and Edward Montgomery (1999) discuss these issues in detail. 6 The validity of self-reports of ETS exposure is supported by previous research which demonstrates that these outcomes are strongly correlated with other biological markers of ETS such as ambient nicotine measurements (Jacalyn Coghlin, S. Katharine Hammond, and Peter H. Gann 1999, Chizimuzo T.C. Okoli, Thomas Kelly, and Ellen J. Hahn 2007). Self-reports also have the advantage that we can make consistent comparisons of ETS exposure outcomes across space and time using very large samples of outcome data.

4
the Canadian Community Health Surveys (CCHS) from 2000 to 2008 which contains alternate
measures of ETS exposure. The venue-specific ETS exposure information in the CTUMS
affords us the literature’s first direct tests of how public place smoking laws affect exposure to
ETS in the venues explicitly covered by the laws (public places). We also use both datasets to
test the possibility that these laws may have induced displacement of smoking from public places
to private places such as cars and homes (as suggested by Adda and Cornaglia 2010). All of our
models include city and year fixed effects (i.e., a difference-in-differences framework), thus
identifying the effects of the public-place smoking laws on outcomes using within-city changes
over time in outcomes for individuals residing in places that adopted a law, controlling for the
associated within-city changes in outcomes for individuals residing in places that did not adopt a
law at that same time.
To preview, we find that public-place smoking laws in Canada had no economically or
statistically significant effects at reducing population smoking participation or intensity.7 This
suggests that public-place smoking laws are unlikely to improve cardiovascular health by
inducing existing smokers to quit or reduce the number of cigarettes smoked. We do, however,
find that public-place smoking laws significantly reduced ETS exposure in a variety of public
places, especially inside bars/taverns, inside restaurants, and on outdoor patios of bars and
restaurants. These estimated reductions in public-place ETS exposure are: 1) observed for both
non-smokers and smokers; 2) very large in magnitude (on the order of 65 percent for bars and 75
percent for restaurants); 3) highly robust to a variety of specification checks (e.g., trends, leads,
etc.); and 4) confirmed in independent analyses of the CCHS. The ETS exposure reductions also
exhibit a plausible monotonicity associated with the strength of the law in place (i.e., stronger
laws induced larger reductions in ETS exposure). We find important effects of public-place 7 Throughout, we use smoking ‘intensity’ to refer to the number of cigarettes smoked among smokers.

5
smoking laws using both variation from individuals living in cities that adopted restrictions prior
to provincial laws and variation from individuals living in cities that did not adopt such laws
prior to a provincial law (i.e., the ‘reverse’ experiment), and we also show that the timing of the
estimated reductions in public-place ETS exposure is consistent with our causal interpretation.
Finally, we do not find consistent evidence of significant displacement of ETS to cars, other
people’s homes, or the respondent’s own home. We do, however, find that public-place smoking
laws significantly increased the probability non-smokers report being exposed to ETS at building
entrances, presumably reflecting displacement.
Over our sample period, total exposure to ETS in public places was cut by more than
half, and exposure to ETS in bars and restaurants in Canada was essentially eliminated. We
estimate that public-place smoking laws are responsible for most of these improvements. Our
results are the first to show that public-place smoking laws significantly reduce ETS exposure in
a range of public places for both smokers and non-smokers. Thus, we document multiple
plausible mechanisms through which such laws may improve cardiovascular health. Given that a
large fraction of the US and other countries still do not ban smoking in public places, our results
suggest the potential for significant public health improvements if smoking were universally
banned in public places.
The paper proceeds as follows. We provide a literature review in Section I and present
the data, institutional background, and methods in Section II. Section III presents the main
results on smoking and exposure to ETS, Section IV offers evidence on displacement of smoking
from public places, and Section V offers a discussion and concludes.
I. PREVIOUS RESEARCH

6
Several recent studies in economics have used quasi-experimental methods to study the effects of
clean indoor air policies, with most focusing on smoking behavior. Ayda A. Yurekli and Ping
Zhang (2000) used aggregate data on cigarette consumption in the US from 1970-1995 and
found that smoke-free legislation significantly reduced cigarette consumption in models with
state and year fixed effects. Taurus (2006) used data from the 1992-1999 Tobacco Use
Supplements to the Current Population Survey (CPS-TUS) and estimated models with state and
year fixed effects. He found that a summary index of clean indoor air laws was estimated to
reduce smoking intensity but not smoking participation. Bitler et al. (2010a, 2010b forthcoming)
used data from 1992-2007 CPS-TUS and examined the effects of venue-specific state clean
indoor air laws on smoking outcomes. Their quasi-experimental results returned no evidence
that clean indoor air laws reduced smoking either in the full population or for workers who
should have been directly affected because they worked in the venues targeted by the clean
indoor air laws, with the exception that laws restricting smoking in bars were estimated to
significantly reduce the share of bartenders who smoked. Silke Anger, Michael Kvasnicka, and
Thomas Siedler (2010) study the effects of public-place smoking laws on smoking behavior in
Germany from 2002-2008 using difference-in-differences models and find no effects of the
policies on smoking overall but some evidence of smoking reductions for young, unmarried,
urban dwellers and for stricter bans.
Although most studies of the effects of these types of laws focus on smoking outcomes,
two quasi-experimental studies have tested for effects on ETS exposure. Carpenter (2009)
studied local smoking laws in Ontario, Canada from 1997-2004 (before implementation of the
province’s strong provincial law) using data from the Centre for Addiction and Mental Health
(CAMH) Monitor. He estimated models with year and county fixed effects and found that local

7
workplace smoking laws significantly reduced ETS exposure at work among blue collar workers.
Carpenter (2009) did not examine ETS exposure in other public or private places.
Adda and Cornaglia (2010) also studied the effects of workplace and bar/restaurant
smoking laws on exposure to ETS using novel data on cotinine—a metabolite of nicotine—from
saliva measurements in the National Health and Nutrition Examination Survey (NHANES III).
Their quasi-experimental models with state and year fixed effects showed: 1) no effects of the
laws on smoking cessation; 2) significant effects of the laws on reducing the amount of time that
smokers spent in bars and restaurants; and 3) significant increases in ETS exposure for children
living with smokers. They suggest that these patterns can best be explained by displacement of
ETS from public places to private places. They do not, however, directly observe where
individuals were exposed to ETS.
We build on the work of Carpenter (2009) and Adda and Cornaglia (2010) in several
important ways. First and most importantly, we observe direct measures of exposure to ETS in a
variety of public and private places. Carpenter (2009) only observes ETS exposure at work, and
Adda and Cornaglia (2010) infer changes in ETS exposure indirectly from relationships between
public-place smoking laws and cotinine measures. Second, we provide several useful robustness
tests of the effects of public-place smoking laws, for example by directly testing for endogenous
policy adoption (by controlling for leads of the public-place laws and by comparing the effects of
public-place smoking laws for individuals living in cities that did or did not adopt a local
smoking restriction prior to a stronger province-wide law). We are also able to explicitly test for
differential effects of laws based on the strength of the law adopted. Adda and Cornaglia’s
policy data from the Americans for Non-smokers’ Rights Foundation (ANRF) only includes
variation from strong 100% smoke-free laws, and Carpenter (2009) similarly restricts attention to
8
strong 100% smoke-free laws in Ontario. Since many strong laws were preceded by weaker
laws (which may have had incremental effects at reducing ETS exposure), our empirical
specifications are more comprehensive than have been estimated in previous work. Third, our
outcome data from the CTUMS and CCHS includes detailed information on the respondent’s full
six-digit postal code of residence. This allows us to very precisely match the policies in place to
each individual observation. In contrast, Adda and Cornaglia (2010) use as their dependent
variable of interest the fraction of a state’s residents covered by 100% smoke-free policies but do
not directly match the local or state policy in effect to each respondent. In these ways our
research complements and extends the previous quasi-experimental studies of ETS exposure in
Adda and Cornaglia (2010) and Carpenter (2009).
II. DATA, INSTITUTIONAL BACKGROUND, AND EMPIRICAL APPROACH
A. Data
In order to analyze the effects of public-place smoking laws on smoking and ETS
outcomes in Canada, we use confidential data from the Canadian Tobacco Use Monitoring
Survey (CTUMS) from 2002-2008 and the Canadian Community Health Surveys (CCHS) from
2000-2008.8 The CTUMS and the CCHS are both large repeated cross-sectional surveys used to
gather health-related information on Canadians living in private households, excluding people on
Indian reserves and on Canadian Forces bases. The main difference between the two datasets is
that the CTUMS focuses entirely on smoking-related outcomes while the CCHS covers a broad
range of health topics. As a result, the CTUMS contains a larger number of more detailed
8 For the CTUMS we use the annual file that combines Cycles 1 and 2 within each year. The CTUMS was also carried out in 1999, 2000, and 2001, but in these years there is no geographic information below province. Since a key contribution of our work is to test for the effects of numerous city-level laws prior to adoption of provincial laws, we focus on data from 2002-2008. For the CCHS, we use data from Cycle 1.1 (conducted in 2000/2001), Cycle 2.1 (conducted in 2003), Cycle 3.1 (conducted in 2005) and 4.1 (conducted in 2007/2008).

9
questions about smoking behavior and ETS exposure, while the CCHS contains only a handful
of ETS exposure questions. The ETS exposure questions in the CCHS, however, cover a longer
time period, and the CCHS has four times the sample size as compared to the CTUMS. Our
main specifications restrict attention to respondents between the ages of 18 and 64 who have no
missing data on the outcome variables or individual demographic covariates.
We construct several outcomes on own-smoking behavior using information that is
available over the entire sample period in both datasets. First, we study the probability the
respondent is a current smoker. All respondents are asked “At the present time, do you smoke
cigarettes daily, occasionally, or not at all?” We create an outcome variable called “current
smoker” that is equal to one if the individual reports smoking cigarettes daily or occasionally.
Individuals who report being daily or occasional smokers are then asked about their smoking
intensity; we create a variable equal to the number of cigarettes smoked in the previous month.9
Our primary information on ETS exposure comes from the CTUMS, which from 2005-
2008 asked about each respondent’s exposure to ETS in a variety of venues. Individual self-
reports have been shown to be highly correlated with other biological markers of ETS exposure,
such as saliva cotinine levels (Coghlin et al. 1999) and ambient nicotine measures (Okoli et al.
2007).10 Specifically, individuals in the CTUMS are asked: “The next questions are about
exposure to second-hand smoke in places other than your own home. Second-hand smoke is
9 In the CTUMS, individuals are administered the ‘smoking wheel’ which asks them about the number of cigarettes smoked on each of the previous seven days, beginning with the day just before the interview and working backwards. We define smoking intensity as the number of cigarettes a smoker reports smoking in the past week multiplied by four. In the CTUMS, the smoking information is available from 2002 to 2008. In the CCHS (which does not administer the smoking wheel) we define this as the usual number of cigarettes smoked each day by daily smokers multiplied by thirty. For occasional smokers we compute past month consumption by multiplying the respondent’s reported usual number of cigarettes smoked on the days she smoked multiplied by the number of days in the previous month she reported smoking at least one cigarette. This two-part model of smoking behavior is standard in the literature. See, for example, John G. Cragg (1971), Willard G.Manning et al. (1981), Naihua Duan et al. (1983), John Mullahy (1998), and others. In the CCHS, the smoking information is available from 2000 to 2008. 10 We are not aware of any data in Canada that cover the period in which the smoking laws were adopted and that include biological markers of ETS exposure (e.g., saliva cotinine).
10
what smokers exhale and the smoke from a burning cigarette. In the past month, (excluding your
own smoking), were you exposed to second-hand smoke: … inside a car or other vehicle?”
Subsequent questions ask about exposure to ETS: 1) “inside someone else’s home”; 2) “on an
outdoor patio of a restaurant or bar”; 3) “inside a restaurant”; 4) “inside a bar or tavern”; 5) “at a
bus-stop or shelter”; 6) “at an entrance to a building”; 7) “at your workplace”; 8) “at your
school”; 9) “at any other public place such as a shopping mall, arena, bingo hall, concert, or
sporting event”; and 10) “outdoors such as on a sidewalk or in a park”. We code separate
indicator variables equal to one if the respondent reports she was exposed in each specific
location and zero otherwise.
Several features of the core CTUMS ETS exposure outcomes are worth noting. First, the
question is concrete. It explicitly defines ETS and asks respondents to think about locations
other than their own home. Importantly, it also directs individuals to respond about other
people’s smoke; thus, the question is informative for both smokers and non-smokers. Finally,
note that these questions are unlikely to suffer from desirability bias or related false reporting
since there is no penalty to the respondent from reporting ETS exposure in these venues (unlike,
say, surveys of bar or restaurant owners following adoption of smoking laws covering those
venues). We rely on these CTUMS outcomes as our main measures of ETS exposure.
The information on public-place ETS exposure in the CCHS is more limited, so we use
those data mainly to corroborate the findings in the CTUMS. For example, the CCHS only asks
questions about ETS exposure to non-smokers. More importantly, these data do not ask about
ETS exposure in each location/venue separately, so we instead create an outcome variable equal
to one if the respondent reports being exposed to ETS in public places (defined in the CCHS as

11
bars, restaurants, shopping malls, arenas, bingo halls, and bowling alleys) on all or most days in
the previous month.11
B. Institutional Background
We study the effects of public-place smoking laws using variation in the timing of policy
adoption across cities and provinces in Canada over the past decade. The policies we study
generally prohibit smoking in a variety of public places, including restaurants, bars, bingo halls,
bowling alleys, shopping malls, and sporting arenas. Enforcement of these laws varies across
cities and provinces, but generally the penalty for violating a public-place smoking ordinance is a
modest to severe fine (e.g., $200 in Toronto, $2000 in Nova Scotia, and up to $10,000 in
Saskatchewan) (CBC News 2009). The laws we study typically do not restrict smoking in
private places such as cars, homes, or apartment buildings. Some of the laws we study do
include language that prohibits smoking in private workplaces, though previous research has
shown that these provisions were not binding for the vast majority of workers because most
industries in North America voluntarily went smoke-free without the push of government
intervention many years before the first public-place smoking restrictions were adopted
(Carpenter 2009, Bitler et al. 2010a).
The public-place smoking restrictions we study were tracked by Health Canada,12 which
reports the specific public places covered by each city or province law, any relevant exemptions
11 The wording of the ETS exposure questions in the CCHS changed slightly over the sample period. Specifically, Cycle 1.1 of the CCHS asked all current respondents who did not report being a current smoker whether they were exposed to second-hand smoke (i.e., ETS) on most days in the previous month. Respondents who reported that they were exposed on most days then were asked a series of questions about where they were exposed, including “in a car or other private vehicle” and “in public places (bars, restaurants, shopping malls, arenas, bingo halls, bowling alleys)”. Beginning with Cycle 2.1 and onward, the screener question about any exposure was eliminated, and non-smokers were explicitly asked about exposure “every day or almost every day” for the two venues (i.e., “in a car or other private vehicle” and “in public places” (with the identical venues listed in the question as in Cycle 1.1)). Our main CCHS results are unchanged if we restrict attention to data from Cycle 2.1 onward only. Also, note that all of our models include cycle-specific dummy variables. 12 Health Canada is the federal department responsible for maintaining and improving the health of Canadians.

12
or provisions for Designated Smoking Areas (DSAs), and the date the law took effect.13 In
addition, Health Canada assigns to each policy a ‘strength’ rating, and below we describe how
we use this additional variation to test whether stronger, more restrictive policies induced larger
changes in outcomes than weaker, less restrictive policies. Gold laws are 100% smoke-free
policies with no venue-specific exemptions. Silver laws allow for one venue-specific exemption
(most commonly this exemption pertained to bars).14 Bronze laws allow for two or more venue-
specific exemptions. Designated Smoking Areas are allowed under both Silver and Bronze laws
but are prohibited under Gold laws.15
There is a great deal of variation in the presence and timing of public-place smoking
restrictions across Canada. A handful of cities adopted public-place smoking restrictions at the
very beginning of our sample period, including Victoria and Vancouver, British Columbia, in
1999 and 2000, respectively, as well as the capital city of Ottawa and the most populated city,
Toronto, both in 2001. By July 2005, seven of the top ten most populous cities had adopted a
law, including: Toronto, Vancouver, Edmonton, Ottawa, Hamilton, Winnipeg, and London.16
Ontario had the largest number of city-wide public-place smoking restrictions, particularly in
towns and cities around Toronto, London, and Windsor. Every province adopted a public-place
smoking law at some point from 2000 to 2008. British Columbia was the first province to do so
13 In the US, smoking laws vary substantially with respect to the venues covered (e.g., private workplaces, bars, restaurants, schools, government buildings, child care centers, transit facilities, shopping malls, and others) (Bitler et al. 2010a). In practice, most US-based research focuses on laws covering private workplaces, bars, and restaurants. 14 According to Health Canada, Gold, Silver, and Bronze laws all prohibit smoking in restaurants. We understand the exempted venues in Silver and Bronze laws to include venues such as bars, casinos, bowling alleys, billiard halls, and bingo halls. 15 Clean indoor air laws in the United States also vary with respect to the strength of the laws adopted, and some previous research has used this variation (Tauras 2006, Bitler et al. 2010a, and others). One of the more commonly used policy tracking systems in the US, Robert Wood Johnson’s ImpacTeen Database, for example, gives each covered venue in each state a rating from, say, 0 to 3, where 0 indicates no restrictions in smoking and 3 indicates a complete ban on smoking. We allow the gold/silver/bronze ratings to have independent relationships with our outcomes of interest, thus using the variation in the strength of the restrictions in a more flexible way. 16 Montreal, Calgary and Quebec City did not adopt a city law prior to their respective provincial laws.

13
in 2002, and Ontario and Quebec (the two other most highly populated provinces) followed suit
in 2006.
Figures 1 and 2 show trends in the proportion of the CTUMS and CCHS samples,
respectively, that we identify as living in an area covered by a public-place smoking law, as well
as the proportion of people living in areas covered by the strongest 100% smoke-free gold laws.
Both figures confirm that our samples cover the period of widespread adoption of public-place
smoking restrictions. Figure 1 using the CTUMS data, for example, shows that only 35% (10%)
of the country’s population was covered by any (a gold) public-place smoking law in 2002
compared with 100% of Canadians covered by such a law in 2008. [[[Figure 1 about here]]]
Figure 2 (which uses an independently drawn sample from the CCHS) confirms these trends and
extends the time series back to 2000 when just over 10% of Canadians lived in an area covered
by any public-place smoking law. [[[Figure 2 about here]]] Notably, both figures show that
while the increase in the probability of being covered by any law was gradual over this period,
there was a sharp break in the probability individuals were covered by stronger 100% smoke-free
gold public-place smoking laws beginning in 2006 when many of the large provincial laws began
taking effect.17 Coincident with this sharp upturn in gold law coverage in Figure 1, we also
observe corresponding reductions in ETS exposure inside bars and restaurants. Over this same
period Figure 2 shows a very large proportional reduction in the fraction of non-smoking
Canadians who reported being exposed to ETS in public places on all or most days of the
previous month (from 23 to 11 percent) between 2000 and 2008. Both figures show declines in
smoking participation.
17 The fact that the "any law" trend does not increase sharply at the same time illustrates that these strong province-wide laws were in many cases replacing weaker city-specific silver or bronze-level restrictions.

14
This general pattern of adoption whereby cities and towns adopted public-place smoking
laws prior to more expansive province-wide laws in Canada generally mirrors the pattern of
policy adoption in the United States as well, though the adoption across Canada has occurred
much faster. European countries began adopting public-place smoking restrictions around the
same time as Canada, with Ireland going completely smoke-free (including in bars and
restaurants) in 2004. Norway soon followed suit with its own bar and restaurant smoking ban
later that year, and Italy adopted a similar law in 2005. Since then, laws completely restricting
smoking in public places (including bars and restaurants) have been adopted in a variety of
European countries, including: Scotland (in 2006), England (in 2007), Finland (in 2007), and
France (in 2008) (EPHA 2010).18 A proposal to ban smoking in all public places throughout the
European Union is to be put forth by the European Commission in 2011. Many factors are
thought to influence policy adoption, including an increase in worldwide anti-smoking sentiment
and associated reductions in smoking prevalence (IOM 2010). We are not aware of good
evidence on the prevalence of or trends in antismoking sentiment across countries, though
smoking rates in Canada (about 20-25% over our sample period) are similar to those in the US
and are similar to or slightly lower than those in much of western Europe.19
c. Approach
To assess the impact of the public-place smoking laws, we use a standard difference-in-
differences (DD) approach that controls for unobserved time invariant area-specific
18 Several European countries have exceptions for ventilated smoking rooms and/or bar/restaurant exemptions, while other countries have minimal enforcement of public-place smoking restrictions. 19 A 2008 report by the Centers for Disease Control indicates the adult smoking rate in the United States is about 20%. The 2002 Tobacco Atlas by the World Health Organization reports the following adult smoking rates: Canada 25%; USA 23.6%; Ireland 31.5%; Norway 31.5%; Italy 24.9%; United Kingdom 26.5%; Finland 23.5%; and France 34.5% (Judith Mackay and Michael P. Eriksen 2002).

15
heterogeneity through the inclusion of city (i.e., Canada’s statistical area classification20) fixed
effects and time fixed effects. Specifically, we estimate the following:
(1) Yiat = α + β1 Xiat + β2 Zat + β3 (Public-Place Smoking Law)at + Areaa + Yeart + εiat
where Yiat refers to the various smoking and ETS exposure outcomes for individual i in
statistical area a in survey year t.21 Xiat is a vector of individual demographic controls for age
and its square, a male dummy, two marital status dummies (single never married and
widowed/divorced/separated, with married/common-law as the reference group), and seven
dummies for educational attainment (secondary school, some postsecondary school, some
college, bachelors degree, graduate degree, and education missing, with less than high school as
the reference group). Zat is a vector of time-varying province-specific characteristics and
policies that may be correlated with adoption of public-place smoking by-laws, including: the
provincial unemployment rate and the real tax-inclusive provincial cigarette price. Areaa is a
vector of statistical area dummies, and Yeart is a vector of survey year dummies. We also
include month-of-interview dummies in all specifications to account for seasonality.
Public-Place Smoking Lawat is an indicator variable which equals one if the respondent
lives in an area which is covered by a law restricting or prohibiting smoking in public places and
zero otherwise. We construct the law variables by matching the local smoking policy in effect at
the time of the CTUMS and CCHS interviews in the respondent’s postal code of residence,
similar to Carpenter’s (2009) study of Ontario.22 The coefficient of interest in equation (1) is β3,
20 Statistical area classifications are the combination of census metropolitan areas (population greater than 100,000 people) and census agglomerations (population between 10,000 and 100,000 people). 21 We use linear probability models for ease of interpretation, but probit models returned very similar results. We use OLS for the smoking intensity models where the dependent variable of the natural log of the number of cigarettes smoked in the previous month. 22 Information on these local smoking restrictions comes from Health Canada. For most individuals we match on Statistical Areas (SAs) or province, but if the bylaw is below the SA level of geography (e.g., the subdivision level) we code according to the lower level of geography since we observe the respondent’s full six-digit postal code.
16
which identifies the effect of public-place smoking laws as measured by the change in outcomes
for individuals living in an affected area relative to the associated change in outcomes for
individuals living in a non-affected area coincident with policy adoption. The key identifying
assumption of the model is that there are no shocks other than the public-place smoking laws that
affected relative outcomes of individuals in adopting places versus non-adopting places.
Throughout, εiat is assumed to be a well-behaved error term. All models use sampling weights
provided by the CTUMS and CCHS, and standard errors are clustered at the statistical area level
(Marianne Bertrand, Esther Duflo, and Sendhil Mullainathan 2004).23
III. RESULTS
Table 1 presents the basic results for smoking participation (columns 1 and 2) and smoking
intensity (columns 3 and 4) for both the CTUMS and CCHS.24 [[[Table 1 about here]]] Each
column represents a separate model, and in each case we present the coefficient on the “public-
place smoking law” indicator from the preferred city and year fixed effects specification as in
equation (1). All models include the individual level demographic controls, provincial level real
cigarette prices, and provincial unemployment rates. The results in Table 1 provide no evidence
that public-place smoking laws significantly reduced smoking participation or intensity. Our
Results are robust to dropping individuals in locations that are covered by more than one level of bylaws. We drop a very small number of individuals whose postal code spans multiple SAs irrespective of the presence of a policy. We use the current policy in effect at the time of interview for all outcomes except the questions about exposure to ETS which ask about exposure over the past month. For these outcomes, we drop the small number of individuals who were interviewed within 30 days immediately following adoption of a public-place smoking policy. 23 Note that all provinces adopted laws over our sample period. We code the strongest relevant policy in effect for each respondent. For example, many localities adopted a silver law prior to adoption of a province-wide gold law. Individuals in these cities are first coded as being subject to a silver law and subsequently as being subject to a gold law when the provincial law takes effect. In contrast, if a city first adopted a gold law and then the province later adopted a silver law, an individual residing in that city is coded as being subject to a gold law for the entire period beginning when the local law takes effect. 24 We provide basic weighted descriptive statistics for adult respondents in the CTUMS and CCHS in Appendix Tables 1 and 2, respectively.

17
preferred estimate using the larger samples of the CCHS data, for example, indicates that there
was virtually no relationship between adoption of public-place smoking laws and the probability
an individual reports being a smoker (column 2), and the estimate is sufficiently precise that the
95% confidence interval rules out smoking reductions larger than 0.3 percentage points.25 These
null findings on smoking participation are consistent with recent research on similar policies in
the US (Bitler et al. 2010a, Adda and Cornaglia 2010).26 We find qualitatively identical patterns
in columns 3 and 4 for smoking intensity. Overall, we conclude that public-place smoking laws
in Canada had no meaningful effects on population smoking prevalence.27 These null findings
on smoking prevalence suggest that any improvements in cardiovascular health associated with
smoking bans are unlikely to be attributed to reductions in smoking by existing smokers.28
We turn to our main ETS exposure outcomes from the CTUMS in Table 2. Each entry is
the coefficient on the “public-place smoking law” indicator in the preferred city and year fixed
effects specification (i.e., equation (1)). We present the relevant coefficient of interest for eight
of the public-place venues. The results in Table 2 return strong evidence that public-place
25 Relative to a mean smoking rate of 30.7 percent in the CCHS (using the average from individuals in 2000 living in places without a law), this estimate rules out effect sizes of larger than about 1 percent [0.3/30.7=0.01] for public-place smoking laws on smoking participation. These null findings on smoking behavior are also inconsistent with endogenous policy adoption imparting serious bias to our estimates. It is also possible that it may take some time before the public-place smoking laws reduce smoking participation or intensity. Examining this issue by including a dummy for time greater than one year after the initial law, we still do not find much evidence of any effects of the law on either smoking participation or intensity. 26 These null findings on smoking also suggest that our CCHS models of ETS exposure that restrict attention to non-smokers are not seriously contaminated by composition bias (since smoking status is not correlated with adoption of public-place smoking laws). Recall that the ETS questions in the CCHS were only asked of non-smokers. 27 In results not reported but available upon request, these null findings were robust to including linear city trends. We also did not find evidence that real tax-inclusive provincial cigarette prices had significant effects on smoking participation or intensity. We similarly found no economically or statistically significant relationship between provincial unemployment rates and smoking prevalence. With respect to demographic characteristics, we found the usual patterns: men are more likely to smoke than women, smoking increases with age, married individuals are less likely to smoke than unmarried individuals, and highly educated individuals are less likely to smoke than individuals with less education. The full set of coefficient estimates is available upon request. 28 We do not know, however, how much of each cigarette is smoked by smokers, so it could be that public-place smoking restrictions reduce the amount of smoke inhaled and exhaled without reducing the total number of cigarettes reported. This would be the case, for example, if smokers smoke part of a cigarette on their way from a parking lot to the entrance of a bar or restaurant instead of finishing the cigarette indoors.

18
smoking laws significantly reduced exposure to ETS on outdoor patios of restaurants or bars
(column 1), inside restaurants (column 2), and inside bars or taverns (column 3). [[[Table 2
about here]]] Each of the estimated effects is statistically significant at the one percent level,
and the estimated reductions are also very large in magnitude. The estimate in column 2, for
example, indicates that adoption of a public-place smoking law reduced the probability a
respondent reports being exposed to ETS inside a restaurant in the previous month by almost 40
percentage points, or by about 75 percent relative to a mean ETS exposure rate of 54 percent for
individuals not covered by a public-place smoking law in 2005. Similarly, the estimate in
column 3 of Table 2 indicates that a public-place smoking law reduced exposure to ETS inside a
bar or tavern by 23.9 percentage points, or by about 64 percent relative to the associated 2005
exposure rate for individuals not covered by a public-place smoking law (23.9/37.6=0.64). For
the other venues in Table 2 we find much smaller and statistically insignificant effects of public-
place smoking laws. Interestingly, we find no substantive or statistically significant relationship
between exposure at one’s workplace (column 5) or school (column 6) and the presence of a
public-place smoking law. This is not surprising, given that the laws we study pertain to public
places and not workplaces per se (though clearly bars, restaurants, and other public places are
workplaces for some small share of workers)29 and given other research that has documented that
the vast majority of private workplaces went smoke-free without the push of government
intervention far before the start of our sample period (Carpenter 2009, Bitler et al. 2010a, and
others). We do, however, find that public-place smoking laws significantly reduced ETS
29 We do not have sufficient occupation data in the CTUMS to test whether these ETS exposure effects differ by occupation. We also considered estimating models that dropped individuals for whom the relevant venues are irrelevant (e.g., drop non-students for the question about exposure at school; drop non-workers for the question about exposure at the workplace) and making use of responses other than "Yes" or "No" in the CTUMS (e.g., "don't know"). However, 98% of the responses to the exposure questions in the CTUMS are "Yes" or "No", leaving us little power to do anything meaningful in this respect.
19
exposure in a summary measure of other public venues that includes shopping malls, arenas,
bingo halls, concerts, or sporting events (column 7). For these venues, we estimate that the laws
reduce exposure by 5.1 percentage points, or about 15 percent relative to the proportion of
individuals living in places without these laws who reported such exposure in 2005
(5.1/33.8=0.15). Finally, in column 8 we find that the laws significantly reduced ETS exposure
in other places not explicitly asked about in the CTUMS. Specifically, we estimate that a public-
place smoking law reduced exposure to someone else’s ETS “anywhere else” (i.e., other than in
the locations explicitly asked previously) by 3 percentage points.30
In Table 3 we examine whether the reductions in ETS exposure observed in bars and
restaurants in Table 2 are driven by exposure reductions experienced by non-smokers, smokers,
or both. Reduced smoking in public places could convey important cardiovascular health
benefits to both non-smokers and smokers, but previous research has not addressed this question.
Recall from Table 1 that current smoking status was unaffected by adoption of public-place
smoking laws, so this exercise is not likely to be contaminated by systematic composition biases.
The results in Table 3 reveal strong evidence that the improvements in cardiovascular health
from lower ETS exposure associated with public-place smoking laws accrue to both smokers and
non-smokers. [[[Table 3 about here]]] For example, we estimate reductions in ETS exposure
inside a restaurant in columns 1 and 2 that are very similar in magnitude (and both statistically
significant at the one percent level) for smokers and non-smokers, respectively. We find larger
estimated absolute reductions in reported ETS exposure inside a bar or tavern for smokers
compared with the associated reductions at those same types of venues reported by non-smokers,
though the implied proportional reductions relative to the 2005 mean for individuals living in
30 The results in Table 2 are very similar when we add controls for linear city-specific time trends.

20
places without a law are very similar in magnitude (65% reduction for smokers and 63%
reduction for non-smokers) and both are statistically significant.31
In Table 4 we examine the robustness of the main findings that public-place smoking
laws significantly reduced exposure to other people’s ETS in public places, particularly inside
restaurants (top panel) and inside bars or taverns (bottom panel). In each column we present the
results from an alternative specification check. First, we reprint the basic difference-in-
differences estimates (corresponding to those printed in Table 2) for each venue in column 1. In
column 2 we add controls for linear city-specific time trends. In these models, we identify the
effects of public-place smoking laws from sharp deviations off of smooth trends in outcomes
coincident with adoption of the public-place smoking law. In column 3 we directly address
concerns about possible policy endogeneity by controlling for a one-year lead of the public-place
smoking law variable. If large shocks to outcomes systematically precede rather than follow
public-place smoking laws, this could suggest that the laws were endogenously adopted or that
there is some other specification error. Finally, in column 4 we report coefficient estimates from
an alternative specification in which we replace the single public-place smoking law variable
with separate indicators for laws of varying strength or restrictiveness (i.e., gold, silver, and
bronze-level laws). In the presence of a true causal effect of the laws at reducing ETS in these
venues, we might expect a plausible monotonicity in the strength of the law adopted.
The results in Table 4 confirm that the reductions in ETS exposure estimated in the
previous tables are highly robust. [[[Table 4 about here]]] For example, examining the top
panel for exposure to ETS inside restaurants, we find that the coefficient estimate on the public-
place smoking law variable remains large, negative, and highly significant once we include city-
31 Results for other venues are available upon request. We do not present them here to conserve space. The patterns were qualitatively identical (i.e., significant reductions for both smokers and non-smokers) for ETS exposure: on outdoor patios of bars and restaurants; at public places such as malls, arenas, etc.; and ‘anywhere else’.

21
specific trends (column 2) or control for the one-year lead of the policy variable (column 3).
Notably, the coefficient on the policy lead for the restaurant exposure variable is negative and
statistically significant, but it is much smaller than the associated public-place smoking law
coefficient estimate.32 Finally, we observe a plausible monotonicity in the strength of the law
specification in column 4 (though the estimates for the gold and silver laws are very similar in
magnitude).
For exposure to ETS inside bars and taverns in the bottom panel, we find that the effects
of public-place smoking laws are also robust. The inclusion of city-specific time trends does
little to the relevant coefficient estimate in the bottom panel (as for restaurant exposure), and we
do not find evidence of a statistically significant lead effect in the bottom panel of column 3.
Moreover, even with the control for the one-year lead, we continue to estimate that public-place
smoking laws significantly reduced ETS exposure inside bars and taverns. In column 4 we
observe stronger evidence of monotonicity in the effects according to the strength of the law
adopted.33 Overall, these results confirm that the estimated reductions in ETS exposure are
highly robust, especially for exposure inside bars and taverns.34
32 A small negative and significant lead effect could arise, for example, if restaurant owners anticipated the law coming into effect and decided to comply in advance of the actual implementation date. Announcement effects would also produce the observed small lead coefficient for restaurant ETS exposure, particularly if there were uncertainty by smokers about when such laws took effect. 33 As noted above, Health Canada's coding indicates that smoking in restaurants is prohibited in Gold, Silver, and Bronze Laws; the venue-specific exemptions for Silver (one exemption) and Bronze (two or more exemptions) can include bars, casinos, bowling alleys, billiard halls, and bingo halls. This suggests we should observe a weaker Gold/Silver/Bronze gradient in the effects of public-place smoking laws on ETS exposure in restaurants as compared to bars. Indeed, this is what the patterns in Table 4 indicate. In results not reported but available upon request we found qualitatively similar results of the robustness exercises for the other venues. Exposure to ETS on outdoor patios of bars and restaurants exhibited patterns that were qualitatively identical to those for exposure to ETS in bars in the bottom panel of Table 4, for example. 34 An important consideration for welfare analyses is whether and to what extent people change where they spend their time in response to public-place smoking laws. We are not aware of data that span adoption of the policies to test for this in quasi-experimental models. We can, however, provide descriptive evidence indicating that a substantial share of the population spends time in bars and restaurants and that individuals who patronize these establishments spend a meaningful amount of time there. Specifically, we examined confidential data from cycle 19 of the Canadian General Social Survey (GSS) on Time Use. These data provide information on individual time use over a 24-hour period. Interviews for cycle 19 of the GSS were conducted between January and December 2005,

22
In Table 5 we examine the robustness of the ETS exposure reductions in a different way.
Specifically, we turn to the independently drawn CCHS data that contains an alternative measure
of such exposure: the probability an individual reports being exposed to ETS in public places
(not separately by venue) on all or most days of the previous month. The format of Table 5
follows Table 4: we present the baseline difference-in-differences results in column 1, and in the
remaining columns we assess robustness by: adding city-specific trends (column 2), controlling
for a one-year policy lead (column 3), and controlling for the strength of the law adopted
(column 4). [[[Table 5 about here]]] The results in the first four columns of Table 5 confirm
that the estimated reductions in public-place ETS exposure associated with adoption of a public-
place smoking law are also found in the CCHS data. Specifically, we estimate that a public-
place smoking law reduces exposure to ETS in public places by about 6 to 10 percentage points.
These effect sizes are large as a proportion of the sample mean for individuals in 2000 living in
places without a law, and all of the estimates are statistically significant at the one percent level.
Thus, while the CCHS lacks detailed information on the precise location of exposure, the main
which corresponds to the beginning of our CTUMS sample with questions on ETS exposure. The GSS data indicate that approximately 20 and 5 percent of the sample whose reference day was either Friday or Saturday went to a restaurant for a meal or to a bar to socialize on the reference day, respectively. An even higher proportion of young adults age 19-35 whose reference day was a Friday or a Saturday attended a bar on that day: 8 percent of this group did so. These age-specific differences in time spent in a bar correspond with the mean exposure in bars from the CTUMS sample, were we found that in 2005 34 percent of the respondents age 19 to 35 said they were exposed to ETS in a bar, while only 16 percent of respondents age 36 to 64 said they were exposed to ETS in a bar (recall these CTUMS exposure outcomes are measured over the previous month). Moreover, the GSS data indicate that among individuals patronizing these establishments, large amounts of time are spent at bars and restaurants. Among respondents who reported going to a bar and whose reference day was Friday or Saturday, the average time spent socializing was approximately 165 minutes; the associated figure for eating a meal at a restaurant was approximately 93 minutes. Overall, then, the GSS data indicate that in 2005 (before the widespread adoption of strong provincial public-place smoking laws) a substantial share of individuals attended bars and restaurants—especially on the weekends—and spent multiple hours there on each occasion. These descriptive patterns show that the reductions in ETS exposure attributable to public-place smoking laws are consistent with meaningful health improvements documented in other studies.

23
finding that public-place smoking laws significantly reduced exposure to ETS in public places is
confirmed.35
Having confirmed that the independently drawn CCHS data replicate our basic findings
on public-place smoking laws and ETS exposure in public places, we take advantage of the
longer CCHS time series to implement two additional analyses that speak to the validity of our
identification strategy.36 First, in column 5 of Table 5 we test whether the effects of public-place
smoking laws are different for individuals living in cities that adopted such policies prior to a
more expansive provincial law as compared to individuals living in cities that did not adopt a law
prior to the province-wide law. This latter ‘reverse experiment’ variation for cities that were
compelled by the stronger province-wide laws to go smoke-free in public places provides useful
information on whether and to what extent the ‘early adopters’ were positively selected: if this
were the case, the effects of ‘city-level policies’ would be larger than the effects of ‘province-
induced policies’ (see Elizabeth O. Ananat et al. 2009 and Jonathan Gruber, Philip B. Levine,
and Douglas Staiger 1999 for a related discussion in the abortion literature). A finding that the
effects of public-place smoking laws are largely similar using these two different sources of
35 In results not reported but available upon request, we performed several other robustness checks to the main findings on public-place ETS exposure. First, our main results on reductions in ETS exposure in public places are robust to using a probit model for the dichotomous nature of the outcome instead of OLS; estimated marginal effects were virtually identical. Second, our main ETS results are also robust to excluding each of the highly populated provinces individually (Ontario, Quebec, British Columbia, and Alberta). Third, our main ETS results are robust to excluding Toronto and Vancouver. Fourth, our main ETS results are robust to excluding the small proportion of individuals living in cities that straddle province boundaries (e.g., Ottawa). 36 There are a couple of practical issues that complicate the additional robustness tests in the CCHS that pertain to individuals living in cities with multiple policy adoptions (e.g., people in places that first adopted a bronze and then a silver local law). One issue is that the timing effects for individuals in those cities are confounded by differences in the strengths of laws adopted since cities almost always went from weaker to stronger laws. For simplicity, we have excluded individuals in cities with multiple adoption dates for the additional tests in column 5 of Table 5 and Figure 3. When we re-estimated the baseline CCHS model from column 1 of Table 5 removing individuals who lived in cities with multiple adoption dates, the Public-place smoking law coefficient is slightly larger in magnitude relative to our full sample results (-0.094** versus -0.074**) due to the fact that a larger proportion of cities that adapted only one law adopted a gold law and only multiple adoption cities ever adopted a weaker bronze law. When we re-estimated the model in column 4 of Table 5 on the sample of individuals living in cities with at most one adoption date, we find that the magnitude of the Gold law and Silver law coefficients are very similar for the restricted and full sample (-0.095** versus -0.096** and -0.069* versus -0.077**, respectively).

24
variation would indicate that the variation driving our identification is not substantially tainted
from these selection concerns. In column 5 we find that the estimated effects of public-place
smoking laws on ETS exposure in public places is generally similar when we use variation from
the city adoptions as compared to estimates using variation from the wider province laws. Both
point estimates indicate large and statistically significant reductions in public-place ETS
exposure, and the effects of the city-level policies are not larger than the effects of the province-
level policies. Thus, we conclude that the estimated effects of public-place smoking laws
described above are not substantially biased from selection concerns associated with endogenous
policy adoption.37
Finally, we address the validity of the research design using an event study framework
that traces out the dynamic effects of the policies relative to the year prior to adoption. Doing so
allows us to assess the extent to which the observed effects are simple continuation of pre-
existing trends, as well as whether there were systematic shocks to ETS exposure outcomes prior
to policy adoption that would call into question the exogeneity of the timing of policy adoption.
Figure 3 presents these results visually (using point estimates and 95% confidence intervals from
models shown in Appendix Table 3) and further supports our interpretation that the laws are
responsible for the dramatic improvements in public-place ETS exposure. [[[Figure 3 about
here]]] There is no evidence of systematic spikes in public-place ETS exposure just prior to
policy adoption, and our estimated policy effects do not simply reflect continuation of long-run
pre-existing trends. Instead, there is a discrete, sustained reduction in ETS exposure coincident
with policy adoption.
37 Using an F-Test, we reject the equality of the City-level adoptions and the Province-level adoptions coefficients at the one percent level (p-value=0.002).

25
IV. EVIDENCE ON DISPLACEMENT
Thus far our results show that public-place smoking laws in Canada were responsible for very
large reductions in ETS exposure in public places, particularly in bars and restaurants. An
important issue for welfare analysis is: how did these restrictions affect exposure to smoke in
other venues not directly targeted by the laws. In particular, is there evidence of systematic
displacement of smoking from public buildings to either just outside those buildings or to private
places (such as cars and homes), as suggested by Adda and Cornaglia (2010)?
Notably, the list of venues in the CTUMS ETS exposure questionnaire does include at
least four specific places that could reflect displacement. Two are clearly private places: inside a
car and inside someone else’s home, and two are other types of places that could also reflect
displacement: outside (such as on a sidewalk or in a park) and at the entrance to a building. We
present difference-in-difference estimates for these outcomes in Table 6, the format of which
follows Table 2. [[[Table 6 about here]]] If the smoking restrictions induced displacement, we
would expect positive and significant coefficients on the public-place smoking law indicators for
ETS exposure in these places. The results in columns 1 through 3 for ETS exposure inside cars,
inside other people’s homes, and outside such as on a sidewalk or in a park, respectively, show
no evidence that public-place smoking laws displace smoking to these places. The point
estimates for these three venues are negative and statistically insignificant. Interestingly, in
column 4 of Table 6 we estimate that public-place smoking laws significantly increased the
probability an individual reports she was exposed to someone else’s smoke at the entrance to a
building, suggesting that smoking is displaced from inside public places to just outside the
entrance of those places. We investigate this result further in columns 5 and 6 of Table 6 in
which we disaggregate the sample in column 4 by smoking status. This analysis reveals clearer

26
evidence for displacement: while public-place smoking laws are not significantly related to the
probability smokers report being exposed to ETS at building entrances in the past month (column
5), the laws significantly increase the probability non-smokers report being exposed to ETS at
building entrances by 4.7 percentage points. We interpret this finding as suggesting that public-
place smoking laws displace some smokers from inside public venues to just outside those
venues.38
Of course, because people spend most of their time at their own home, it is also important
to examine possible displacement of ETS from public places to the respondent’s own homes.
Fortunately, the CTUMS data contain this information. Specifically, from 2002-2008 in the
household screener portion of the survey, respondents living with others were asked “Does
anyone in your household smoke cigarettes, cigars, or pipes?”39 All respondents are then asked
“Including both family members and regular visitors, how many people smoke inside your home
every day or almost every day?” Finally, respondents reporting that someone smokes inside the
home every day or almost every day are asked: “On a typical day, about how many cigarettes are
smoked inside your home?” Responses are recoded into categories, including: None, 1-10, 11-
20, 21-30, 31-40, and 41 or more.40
Using this information, we can create two meaningful outcomes: an indicator for whether
any positive number of cigarettes is smoked inside the home, as well as the number of cigarettes
smoked inside the home on a typical day.41 We can also use information on whether there is a
38 One possibility for why we only observe the evidence of displacement for non-smokers is that smokers might be displaced to building entrances by themselves (recall the ETS exposure question explicitly asks about other people's smoke). 39 Smoking information for individuals living alone is ascertained later in the individual portion of the survey. 40 One might be concerned about the ability of non-smokers who live with smokers to meaningfully estimate the number of cigarettes smoked inside the home. Despite this, only about 3.5 percent of these individuals said they did not know how many cigarettes were smoked inside the home on a typical day. 41 By construction, the information on number of cigarettes smoked inside the home is restricted to people who report a positive number of people smoking inside the home on every or almost every day. We could also examine

27
smoker in the respondent’s household to examine whether the effects differ between individuals
in households without any smokers and individuals in households with at least one smoker. If
the public-place smoking laws induce displacement from public places to private homes, we
would expect to see increases in reported smoking inside homes after the laws are adopted, and
these effects should be particularly pronounced for individuals in households with smokers (note
this includes smokers living alone). We estimated equation (1) on these home smoking
outcomes and present the results in Tables 7 for the dichotomous “someone smokes inside the
home every day or almost every day” (columns 1-3) and the continuous “number of cigarettes
smoked inside the home on a typical day” outcomes (columns 4-6). For each outcome we report
the full sample estimate followed by estimates for individuals in households with no smokers and
estimates for individuals in households with at least one smoker.42
The results in Table 7 regarding potential ETS exposure in private homes are inconsistent
with substantial displacement. [[[Table 7 about here]]] Specifically, for the outcome reflecting
the presence of an every-day-or-almost-every day smoker inside the home, we find no evidence
as an outcome the number of people the respondent reports who smoke inside the home on every or almost every day, though we choose to use information on the number of cigarettes smoked inside the home because it is the ultimate construct of interest. Note that if the laws induce displacement to home smoking on “some” or “a few” days (e.g., if the law induces displacement for ‘weekend’ smokers), the CTUMS question will not detect this. This is a limitation of the self-reported data relative to objective information on cotinine. 42 In the 2002 survey, the CTUMS editing procedures coded everyone in a single-person household who reported being a smoker as having someone in the household who smokes. Starting in 2003, the question wording was changed slightly to read “Do you/does anyone in your household smoke cigarettes, cigars, or pipes?” From 2003 onward, the CTUMS did not recode the “presence of a household smoker” variable to be consistent with the respondent’s own smoking status for single-person households. Thus, from 2003 onward (and in 2002 for people in households with multiple persons) a small number of people who report being current smokers also report that there is nobody in the household who smokes. This could either be due to desirability bias or to mis-interpretation of the household screener question. In any event, it is unlikely that such biases are correlated with adoption of public-place smoking restrictions. Note also that all of our specifications include year dummies to account for survey differences common to any single year. In robustness analyses in Table 7, however, these internally-inconsistent respondents are eliminated from the sample when we restrict attention to respondents reporting that there are no smokers in the household (since for these individuals it is not at all clear if their reports about the number of cigarettes smoked inside the house are valid). This explains the small difference in sample size when we split the sample by the presence of a household smoker (i.e., in theory the sample size in columns 2 and 3 of Table 7 should add up to the sample size in column 1; they do not because we have eliminated a small number of smoking respondents who report that there are no smokers in their household.

28
that public-place smoking laws increase smoking inside homes. In fact, the sign of the point
estimate on the “any law” variable is negative (and significant), suggesting a protective
association. Moreover, when we cut the data by whether there is a smoker in the respondent’s
household (including, potentially, the respondent), we find no systematic evidence favoring
displacement in the group where it should be especially salient: households with smokers. Of
course, the displacement tests in columns 1-3 of Table 7 may not be very powerful given that
smokers may have smoked cigarettes inside the home even prior to public-place smoking
restrictions being adopted. Indeed, we report in the top row of Table 7 that 58.9% of people
living in households with at least one smoker in cities without a law in 2002 reported that a
positive number of cigarettes are smoked inside the home, while the associated figure for people
living in household without smokers was just 1.3%.
In columns 4-6 of Table 7 we therefore test for displacement measured by the number of
cigarettes that the respondent reports are smoked inside the home on a typical day.43 This table
replicates these same basic patterns and on the whole is inconsistent with systematic, significant
displacement of smoking from public places to private homes in response to public-place
smoking laws. Again, we find statistically insignificant estimates that are wrong-signed for the
full sample and for the sample that should be most likely to exhibit displacement: individuals in
households with smokers. In column 6 of Table 7 we estimate that a public-place smoking law is
associated with a reduction in the number of cigarettes smoked by 0.175 cigarettes.44 The 95%
43 We estimate the models in columns 4-6 of Table 7 using OLS on the midpoints of the ranges in the question (see Wooldridge 2002), using a value of 45.5 cigarettes for the small proportion of respondents reporting more 40 or more cigarettes smoked inside the home on a typical day. More sophisticated methods, including interval regression, returned qualitatively identical results. 44 We found qualitatively identical results in the CCHS (available upon request). In the CCHS, the question about smoking inside homes is only asked of individuals who live with others or of non-smokers who live by themselves. (In Cycle 1.1, the question is asked of all respondents. We restricted the Cycle 1.1 sample to match that of the other cycles.) Also, there is no way in the CCHS to determine whether the respondent’s household contains a regular smoker (only the smoking status of the respondent is directly ascertained). Finally, the home smoking question in

29
confidence interval around this estimate means that we can rule out displacement effects of
larger than about 0.617 cigarettes. Relative to the associated average for people living in places
without a law in 2002 of 9.473, this means that we can rule out displacement effect sizes larger
than about 0.617/9.473=0.065, or about 6.5 percent.45 Overall, these patterns in the CTUMS
data do not return strong evidence of systematic displacement of smoking from public places to
private homes.46
V. DISCUSSION AND CONCLUSION
We examined the effects of numerous local and provincial public-place smoking laws adopted
across Canada over the past decade on a variety of smoking-related outcomes, including a direct
measure of exposure to ETS in the venues explicitly targeted by the laws. We also directly test
for displacement of smoking from public places to private and other places. Most previous work
has focused mainly on smoking prevalence, despite that the explicit goal of public-place smoking
laws was to reduce population ETS exposure in public places. Moreover, previous research has
lacked direct information on where individuals were exposed to ETS.
Our results indicate that public-place smoking laws in Canada did not have meaningful
effects on smoking participation or intensity. We do find, however, that the laws significantly
the CCHS (which refers to the presence of someone who “regularly” smokes inside the home) is less concrete than in the CTUMS (which refers to smoking inside the home “every day or almost every day”). Despite these challenges, fixed-effects estimates of the effect of public-place smoking restrictions on the probability of having a regular smoker inside the home were extremely small in magnitude, statistically indistinguishable from zero, and as likely to suggest protective associations as they were to suggest displacement effects. 45 Table 7 also shows, not surprisingly, that individuals in households without smokers living in places without these laws in 2002 report far fewer cigarettes smoked inside their homes on a typical day relative to individuals in households with at least one smoker (0.17 vs. 9.47 cigarettes, respectively). 46 We also further explored the possibility of displacement of smoke from public places to private vehicles by estimating models of ETS exposure inside cars separately by whether the respondent lives in a household with a smoker (as in Table 7). Among non-smokers in the 2005-2008 CTUMS who live in households with at least one smoker, we found substantial evidence of law-induced displacement to private vehicles in the CTUMS (effect sizes on the order of 25-50%) These same patterns did not replicate in the 2000-2008 CCHS, however. These results are available upon request.

30
reduced exposure to ETS in a variety of public places—especially bars, restaurants, and outdoor
patios of bars and restaurants. These reductions in public-place ETS exposure are observed for
both smokers and non-smokers, are highly robust to a variety of important specification checks,
and are replicated in an independently drawn sample (CCHS). Interestingly, we also estimate
that public-place smoking laws significantly increased non-smokers' exposure to ETS at building
entrances, suggesting that the laws displace some smokers from inside public venues to just
outside those places. We did not, however, find that the laws had significant effects on ETS
exposure in several other venues, including in the respondent’s home.
How large are these effects? Recall that the summary measure of public-place ETS
exposure among non-smokers in Canada in the CCHS fell about 12 percentage points from 2000
to 2008 in the CCHS (from 23 percent of the sample to 11 percent being exposed on all or most
days in public places). Our fixed-effects estimate in Table 5 suggests that public-place smoking
laws can account for 7.4 percentage points (i.e., the majority) of this improvement. Measured
differently using the venue-specific exposure outcomes in the CTUMS, we estimate that public-
place smoking laws can account for the vast majority of the near elimination of ETS in bars and
restaurants observed from 2005-2008. Importantly, our results uncover multiple plausible
mechanisms through which public-place smoking laws may be expected to improve
cardiovascular health for both smokers and non-smokers, as reported in a recent IOM report on
smoking bans and heart attacks. Finally, our null findings on smoking prevalence suggest that
any improvements in cardiovascular health associated with adoption of smoking bans are not
likely attributable to reductions in own-smoking.
Our study is subject to several limitations. First, our outcome data are self-reported
exposure outcomes and are not biological markers of exposure to ETS. Given our direct

31
knowledge about location of exposure and the increase in external validity and generalizability,
this seems a reasonable trade-off, particularly since the epidemiological literature using
biomarker data is now full of single-site evaluations of public-place ETS exposure that focus on
select samples (e.g., bar workers). Our results demonstrate that the effects of public-place
smoking laws are economically and statistically significant across the population. A second
limitation is that although we can identify the venues from which smoking is being displaced
(e.g., bars, restaurants, outdoor patios, other public-places), we are unable to identify all of the
venues towards which smoking is being reallocated. One possibility is that there is displacement
to venues that do not fit nicely into the list of places in the CTUMS question (e.g., walking from
one’s car to a building). Another possibility is that smoke could be displaced to front porches or
backyards of homes instead of inside homes. Third, we do not observe information on where
respondents spend their time. Since one rational response by smokers and non-smokers alike is
to change the amount of time spent in various places in response to public-place smoking
restrictions, we cannot rule out that these behavioral changes are important responses to the laws.
Despite these limitations, our results offer the strongest evidence to date that public-place
smoking laws are effective tools at reducing non-smokers’ and smokers’ exposure to ETS in a
variety of public places on a broad, population-wide scale. In so doing, these findings—coupled
with the lack of evidence of large displacement effects to private homes—suggest wide latitude
for significant public health improvements if the United States and other countries were to
universally ban smoking in public places.

32
REFERENCES
Adda, Jerome and Francesca Cornaglia. 2010. “The Effects of Bans and Taxes on Passive
Smoking”. American Economic Journal – Applied Economics 2(1), 1-32.
Akbar-Khanzadeh, Farhang, Sheryl Milz, April Ames, Sara Spino, and Christopher Tex. 2004.
“Effectiveness of clean indoor air ordinances in controlling environmental tobacco smoke
in restaurants”. Archives of Environmental Health 59(12), 677-685.
Al-Delaimy, Wael, Trish Fraser, and Alistair Woodward. 2001. “Nicotine in hair of bar and
restaurant workers”. New Zealand Medical Journal 114(1127), 80-83.
Americans for Non-smokers Rights Foundation. 2010. “States and Commonwealths with 100%
Smoke-free Laws in All Workplaces, Restaurants, AND Bars currently in effect as of
October 1, 2010”. Report available online at: http://www.no-
smoke.org/pdf/WRBLawsMap.pdf. Last accessed November 10, 2010.
Ananat, Elizabeth O., Jonathan Gruber, Philip B. Levine, and Douglas Staiger. 2009. “Abortion
and Selection”. Review of Economics and Statistics 91(1), 124-136.
Anger, Silke, Michael Kvasnicka, and Thomas Siedler. 2010. “One Last Puff? Public Smoking
Bans and Smoking Behavior”. Ruhr Economic Papers #180.

33
Bertrand, Marianne, Esther Duflo, and Sendhil Mullainathan 2004. “How much should we trust
difference in difference estimates?” Quarterly Journal of Economics 119(1), 249-275.
Bitler, Marianne P., Christopher S Carpenter, and Madeline Zavodny. 2010a. “Venue-Specific
Clean Indoor Air Laws and Occupation-Specific Smoking Outcomes”. Health Economics
19(12), 1425-1440.
Bitler, Marianne P., Christopher S Carpenter, and Madeline Zavodny. 2010b, forthcoming.
“Smoking Restrictions in Bars and Bartender Smoking in the US, 1992-2007”. Tobacco
Control, forthcoming.
CBC News. 2009. “Global anti-smoking efforts”. accessed online February 19, 2010 at:
http://www.cbc.ca/health/story/2009/09/29/f-smoking-bans-tobacco.html.
Cal EPA, (California Environmental Protection Agency). 2005a. Proposed identification of
environmental tobacco smoke as a toxic air contaminant. Part a: Exposure assessment.
Cal EPA, (California Environmental Protection Agency). 2005b. Proposed identification of
environmental tobacco smoke as a toxic air contaminant. Part b: Health effects.
Carpenter, Christopher S. 2009. “The Effects of Local Workplace Smoking Laws on Exposure to
Smoke at Work”. Journal of Human Resources 44(4), 1023-1046.

34
Centers for Disease Control. 2008. “Cigarette Smoking Among Adults --- United States, 2007”.
Morbidity and Mortality Weekly Report 57(45), 1221-1226.
Coghlin, Jacalyn, S. Katharine Hammond, and Peter H. Gann. 1999. “Development of
Epidemiologic Tools for Measuring Environmental Tobacco Smoke Exposure”.
American Journal of Epidemiology 130, 696-704.
Cragg John G. 1971. “Some statistical methods for limited dependent variables with application
to the demand for durable goods”. Econometrica 39, 829-844.
Duan, Naihua, Willard G. Manning, Carl N. Morris, and Joseph P. Newhouse. 1983. “A
comparison of alternative models for the demand for medical care”. Journal of Business
and Economic Statistics 1, 115-126.
Evans, William N., Matthew C. Farrelly, and Edward Montgomery. 1999. “Do workplace
smoking bans reduce smoking?” The American Economic Review 89(4), 728-747.
Ellingsen, Dag G., Geir Fladseth, Hanne L. Daae, Merete Gjolstad, Kristina Kjaerheim, Marit
Skogstad, Raymond Olsen, Syvert Thorud, and Paal Molander. 2006. “Airborne exposure
and biological monitoring of bar and restaurant workers before and after the introduction
of a smoking ban”. Journal of Environmental Monitoring 8(3), 362-368.

35
European Public Health Alliance. 2010. “European smoking bans – Evolution of the legislation.
Website available at: http://www.epha.org/a/1941. Last accessed November 10, 2010.
Gorini, Giuseppe, Hanns Moshammer, L. Sbrogio, Antonio Gasparrini, Manel Nebot, M.
Neuberger, Elizabeth Tamang, Maria J. Lopez, D. Galeone, Eulalia Serrahima, Italy &
Austria and G. After Study Working Group. 2008. “Italy and Austria before and after
study: Second-hand smoke exposure in hospitality premises before and after 2 years from
the introduction of the Italian smoking ban”. Indoor Air 18(4), 328-334.
Gruber, Jonathan, Philip B. Levine, and Douglas Staiger. 1999. “Abortion Legalization and
Child Living Circumstances: Who is the “Marginal Child”?”. Quarterly Journal of
Economics 114(1), 263-291.
Health Canada. 2008. Canadian Municipal By-laws Banning Smoking in Public Places. Last
accessed online January 24, 2009 at http: www.hc-sc.gc.ca/hl-vs/tobac-tabac/about-
apropos/role/municip/ban-interdiction_e.html.
Institute of Medicine (IOM). 2009. “Secondhand Smoke Exposure and Cardiovascular Effects:
Making Sense of the Evidence”. Institute of Medicine. October 15, 2009.
Joossens, Luk and Martin Raw. 2006. “The Tobacco Control Scale: a new scale to measure
country activity.” Tobacco Control 15: 247-253.

36
Mackay, Judith and Michael P. Eriksen. 2002. The Tobacco Atlas. Produced for the World
Health Organization. Myriad Editions Limited, Brighton UK, 94-102.
Manning, Willard G., Carl N. Morris, Joseph P. Newhouse, Larry L. Orr, Naihua Duan, Emmett
B. Keller, Arleen Leibowitz, Kenth H. Marquis, M. Susan Marquis, and Charles E.
Phelps. 1981. “A two-part model of the demand for medical care: Preliminary results
from the Health Insurance Study”. In: van der Gaag J, Perlman M, eds. Health,
Economics, and Health Economics. North Holland, Amsterdam, 102-123.
Menzies, Daniel, Arun Nair, Peter A. Williamson, Stuart Schembri, Mudher Z. H. Al-Khairalla,
Martyn Barnes, Tom C. Fardon, Lesley McFarlane, Gareth J. Magee, and Brian J.
Lipworth. 2006. “Respiratory symptoms, pulmonary function, and markers of
inflammation among bar workers before and after a legislative ban on smoking in public
places”. Journal of the American Medical Association 296(14), 1742-1748.
Mulcahy, Maurice, David S. Evans, S. Katharine Hammond, James L. Repace, and Miriam
Byrne. 2005. “Secondhand smoke exposure and risk following the Irish smoking ban: An
assessment of salivary cotinine concentrations in hotel workers and air nicotine levels in
bars”. Tobacco Control 14(6):384-388.
Mullahy John. 1998. “Much ado about two: Reconsidering retransformation and two-part model
in health econometrics”. Journal of Health Economics 17: 247-281.

37
Non-Smokers’ Rights Association. 2005. “Compendium of 100% Smoke-Free Public Place
Municipal Bylaws”. July 2005 report.
Oberg, Mattias, Maritta S. Jaakkola, Alistair Woodward, Armando Peruga, and Annette Pruss-
Ustun. 2011. “Worldwide burden of disease from exposure to second-hand smoke: a
retrospective analysis of data from 192 countries”. The Lancet, 377(9760): 139-146.
Okoli, Chizimuzo T.C., Thomas Kelly, and Ellen J. Hahn. 2007. “Secondhand smoke and
nicotine exposure: A brief review”. Addictive Behaviors 32, 1977-1988.
Pell, Jill P., Sally Haw, Stuart Cobbe, David E. Newby, Alastair C. H. Pell, Colin Fischbacher,
Alex McConnachie, Stuart Pringle, David Murdoch, Frank Dunn, Keith Oldroyd, Paul
Macintyre, Brian O'Rourke, and William Borland. 2008. “Smoke-free legislation and
hospitalizations for acute coronary syndrome”. New England Journal of Medicine 359(5),
482-491.
Shetty, Kanaka D., Thomas DeLeire, Chpain White, and Jayanta Bhattacharya. 2011. “Changes
in US Hospitalization and Mortality Rates following Smoking Bans”. Journal of Policy
Analysis & Management 30(1), 6-28.
Tauras, John A. 2006. “Smoke-Free air laws, cigarette prices, and adult cigarette demand”.
Economic Inquiry 44(2), 333–342.

38
U.S. Department of Health and Human Services. 2010. How Tobacco Smoke Causes Disease:
The Biology and Behavioral Basis for Smoking-Attributable Disease: A Report of the
Surgeon General [Executive Summary]. Rockville, MD: U.S. Department of Health and
Human Services, Office of the Surgeon General.
Valente, Pasquale, Francesco Forastiere, Antonella Bacosi, Giorgio Cattani, Simonetta Di Carlo,
Monica Ferri, Irene Figa-Talamanca, Achille Marconi, Luigi Paoletti, Carlo Perucci, and
Piergiorgio Zuccaro. 2007. “Exposure to fine and ultrafine particles from secondhand
smoke in public places before and after the smoking ban, Italy 2005”. Tobacco Control
16(5), 312-317.
Wooldridge, Jeffrey. 2002. Econometric Analysis of Cross Section and Panel Data. MIT Press,
Cambridge Massachusetts.
Yurekli, Ayda A., and Ping Zhang. 2000. “The Impact of Clean indoor air laws and cigarette
smuggling on demand for cigarettes: An empirical model”. Health Economics 9, 159-
170.

39
Figure 1: Trends in public-place smoking laws, ETS exposure inside bars/taverns, inside restaurants, on outdoor patios of restaurants/bars, and at building entrances, CTUMS 2002-2008
0.2
.4.6
.81
prop
ortio
n of
sam
ple
2002 2003 2004 2005 2006 2007 2008Year
Any lawGold law
Current smokerExposed to ETS inside bar/tavernExposed to ETS inside a restaurantExposed to ETS on outdoor patio of restaurant/bar
Exposed to ETS at an entrance to a building
Source: CTUMS 2002-2008

40
Figure 2: Trends in public-place smoking laws, ETS exposure in a public place and smoking status, CCHS 2000-2008
0
.2
.4
.6
.8
1
prop
ortio
n of
sam
ple
2000 2001 2003 2005 2007 2008Year
Any law Gold lawCurrent smoker ETS exposure in a public place
Source: CCHS 1.1, 2.1, 3.1 and 4.1

41
Figure 3: Event study estimates of the effects of public-place smoking laws on ETS exposure in public places on all or most days of the previous month, CCHS 2000-2008
-.14
-.12
-.1
-.08
-.06
-.04
-.02
0
.02
.04
.06
3+ yrs before2-3 yrs before
1-2 yrs before0-1 yrs before
0-1 yrs after1-2 yrs after
2-3 yrs after3+ yrs after
Years prior and after law
Notes: Coefficients and 95% confidence intervals. The reference category is year prior to the enactment of a law. The sample includes places that had at most one type of law and is restricted to non-smokers. Source: CCHS 1.1, 2.1, 3.1 and 4.1.

42
Table 1: Public-place smoking laws and smoking behaviors, CTUMS and CCHS, 2000-2008
Outcome is: Smoking
Log (# cigarettes smoked among smokers)
Sample is: CTUMS
2002-2008CCHS 2000-
2008CTUMS
2002-2008 CCHS 2000-
2008 (1) (2) (3) (4) Mean of dep var in first year of sample, no law 0.261 0.307 6.04 5.62 Public-place smoking law -0.016 0.001 -0.007 0.010
[0.009] {-6.5%}
[0.004] {0.3%}
[0.038]
[0.017]
Observations 67,142 238,477 11,647 66,640 R-Squared 0.07 0.07 0.12 0.13 Individual and provincial controls? Yes Yes Yes Yes City and year fixed effects? Yes Yes Yes Yes
Notes: Sample in columns 1 and 3 includes adults age 18-64 in the CTUMS 2002-2008. Sample in columns 2 and 4 includes adults age 18-64 in the CCHS Cycles 1.1-4.1. The dependent variable in columns 1 and 2 is an indicator variable equal to 1 if the person reports being a current smoker. The dependent variable in columns 3 and 4 is the natural log of the number of cigarettes smoked last month. In the CTUMS we use information on number of cigarettes smoked over the last seven days to construct a monthly variable. Since a large number of occasional smokers in the CTUMS did not smoke in the last week, the sample in column 3 is restricted to daily smokers. In the CCHS, the information on smoking was on the past month, and so we are able to use all current smokers. Individual demographic controls include: age and its square, a male dummy, two marital status dummies, and six education dummies (see text). All models also control for the provincial cigarette excise tax and the provincial unemployment rate. Robust standard errors in brackets are clustered on statistical areas (SAs). Implied percent impact as a proportion of base year average value of dependent variable for people living in places without a law in curly braces. * significant at 5%; ** significant at 1%.

43
Table 2: Public-place smoking laws and exposure to ETS in specific public places, CTUMS 2005-2008
(1) (2) (3) (4) (5) (6) (7) (8)
Exposed to ETS:
On an outdoor
patio of a restaurant or
bar
Inside a restaurant
Inside a bar or tavern
At a bus stop or shelter
At your workplace
At your school
At any other public
place…†
Anywhere else
Mean of dep var in 2005, no law: 0.394 0.539 0.376 0.138 0.274 0.069 0.338 0.044
Public-place smoking law -0.113** -0.396** -0.239** -0.024 -0.012 0.001 -0.051** -0.030**
[0.016]
{-28.7%} [0.049]
{-73.5%} [0.015]
{-63.6%} [0.019]
{-17.4%} [0.015] {-4.4%}
[0.005] {1.4%}
[0.012] {-15.1%}
[0.008] {-68.2%}
Observations 37,693 37,693 37,693 37,693 37,693 37,693 37,693 37,693
R-Squared 0.08 0.23 0.15 0.08 0.05 0.19 0.04 0.02 Individual and provincial controls?
Yes Yes Yes Yes Yes Yes Yes Yes
City and year fixed effects? Yes Yes Yes Yes Yes Yes Yes Yes
Notes: Sample includes adults age 18-64 in the CTUMS 2002-2008. The dependent variable in each column is an indicator equal to one if the individual reports being exposed to someone else’s smoke in each of the specific areas. See notes to Table 1 for control variables. Robust standard errors in brackets are clustered on statistical areas (SAs). Implied percent impact as a proportion of base year average value of dependent variable for people living in places without a law in curly braces. * significant at 5%; ** significant at 1%. †The remainder of the question reads “…such as a shopping mall, arena, bingo hall, concert, or sporting event”.
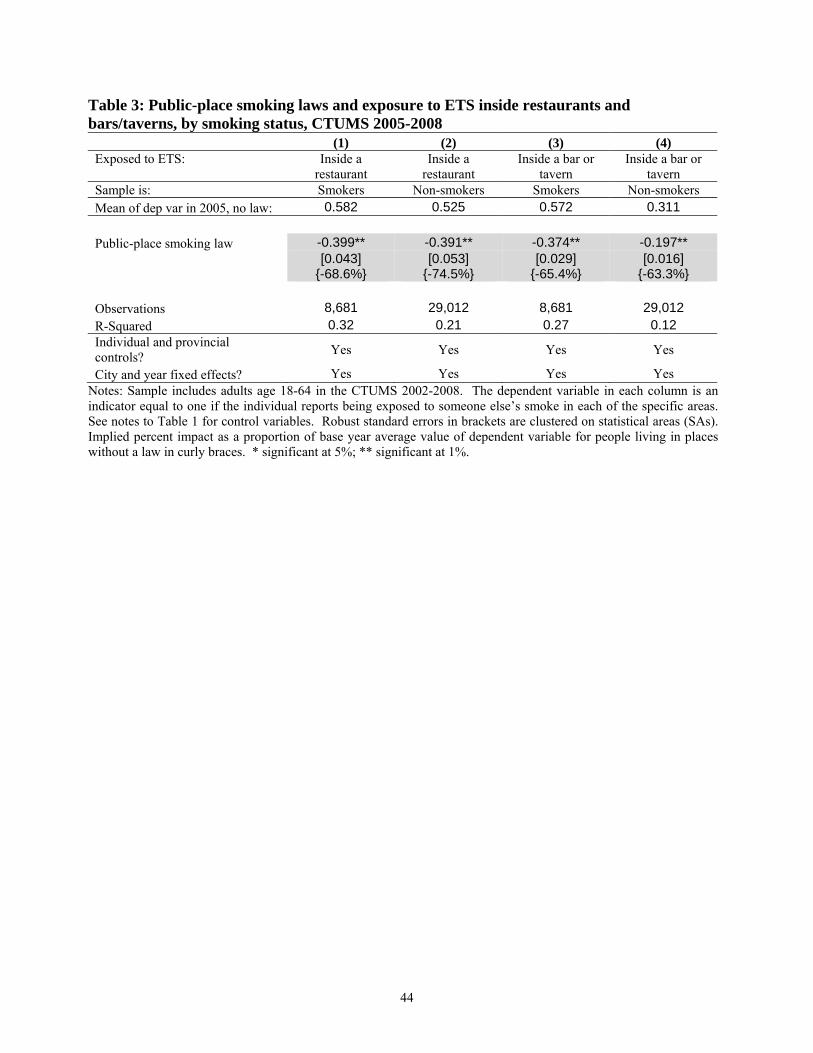
44
Table 3: Public-place smoking laws and exposure to ETS inside restaurants and bars/taverns, by smoking status, CTUMS 2005-2008
(1) (2) (3) (4) Exposed to ETS:
Inside a restaurant
Inside a restaurant
Inside a bar or tavern
Inside a bar or tavern
Sample is: Smokers Non-smokers Smokers Non-smokers Mean of dep var in 2005, no law: 0.582 0.525 0.572 0.311
Public-place smoking law -0.399** -0.391** -0.374** -0.197**
[0.043]
{-68.6%} [0.053]
{-74.5%} [0.029]
{-65.4%} [0.016]
{-63.3%} Observations 8,681 29,012 8,681 29,012 R-Squared 0.32 0.21 0.27 0.12 Individual and provincial controls?
Yes Yes Yes Yes
City and year fixed effects? Yes Yes Yes Yes Notes: Sample includes adults age 18-64 in the CTUMS 2002-2008. The dependent variable in each column is an indicator equal to one if the individual reports being exposed to someone else’s smoke in each of the specific areas. See notes to Table 1 for control variables. Robust standard errors in brackets are clustered on statistical areas (SAs). Implied percent impact as a proportion of base year average value of dependent variable for people living in places without a law in curly braces. * significant at 5%; ** significant at 1%.

45
Table 4: Robustness analyses, exposure to ETS inside restaurants and bars/taverns, CTUMS 2005-2008
(1) (2) (3) (4)
Specification is: Baseline DD (1) + city trends
(1) + one year lead
(1), strength of laws
Exposed to ETS inside a restaurant
Mean of dep var in 2005, no law: 0.539 0.539 0.539 0.539
Year prior to adoption of law -- -- -0.060** --
[0.022] {-11.1%}
Public-place smoking law -0.396** -0.339** -0.438** --
[0.049]
{-73.5%} [0.069]
{-62.9%} [0.063]
{-81.3%}
Gold law -- -- -- -0.403**
[0.048] {-74.8%}
Silver law -- -- -- -0.398**
[0.046] {-73.8%}
Bronze law -- -- -- -0.271**
[0.058] {-50.3%}
Observations 37,694 37,694 37,694 37,694
R-squared 0.23 0.24 0.23 0.23
Exposed to ETS inside a bar/tavern
Mean of dep var in 2005, no law: 0.376 0.376 0.376 0.376
Year prior to adoption of law -- -- -0.055 --
[0.042] { -14.6%}
Public-place smoking law -0.239** -0.213** -0.278** --
[0.015]
{-63.6%} [0.023]
{-56.6%} [0.032]
{-73.9%}
Gold law -- -- -- -0.258**
[0.015] {-68.6%}
Silver law -- -- -- -0.218**
[0.024] {-58.0%}
Bronze law -- -- -- -0.069
[0.054] {-18.4%}
Observations 37,694 37,694 37,694 37,694
R-Squared 0.15 0.16 0.15 0.22
Individual/provincial controls? Yes Yes Yes Yes
City and year fixed effects? Yes Yes Yes Yes Notes: Sample includes adults age 18-64 in the CTUMS 2005-2008. The dependent variable in each model is an indicator equal to one if the individual reports being exposed to someone else’s smoke in each of the specific areas (inside a restaurant in the top panel; inside a bar/tavern in the bottom panel). See notes to Table 1 for control variables. Robust standard errors in brackets are clustered on statistical areas (SAs). Implied percent impact as a proportion of base year average value of dependent variable for people living in places without a law in curly braces. * significant at 5%; ** significant at 1%.

46
Table 5: Public-place smoking laws and exposure to ETS in public places, CCHS non-smokers 2000-2008
(1) (2) (3) (4) (5)
Specification is: Baseline DD (1) + city trends (1) + one year lead (1), strength of laws
(1), city vs. province laws
Mean of dep var in 2000, no law: 0.246 0.246 0.246 0.246 0.194
Year prior to adoption of law -- -- -0.039** -- --
[0.007] {-15.8%}
Public-place smoking law -0.074** -0.058** -0.110** -- --
[0.017]
{-30.1%} [0.018]
{-23.6%} [0.018]
{-44.7%}
Gold law -- -- -- -0.096** --
[0.012] {-39.0%}
Silver law -- -- -- -0.077** --
[0.009] {-31.3%}
Bronze law -- -- -- -0.046* --
[0.018] {-18.7%}
City-level adoptions (experiment)
-- -- -- -- -0.076** [0.016]
{-39.2%} Province-level adoptions (reverse experiment)
-- -- -- -- -0.115** [0.010]
{-56.7%}
Observations 168,263 168,263 168,263 168,263 93,332
R-Squared 0.06 0.05 0.06 0.06 0.07
Individual/provincial controls? Yes Yes Yes Yes Yes
City and year fixed effects? Yes Yes Yes Yes Yes Notes: Sample includes adults age 18-64 who are non-smokers in the CCHS Cycles 1.1-4.1. The sample in column 5 is restricted to individuals living in cities that adopted at most one law. The dependent variable is an indicator equal to 1 if the person reports being exposed to ETS in public places on most or all days of the previous month. Individual demographic controls include: age and its square, a male dummy, two marital status dummies, and six education dummies (see text). All models also control for the provincial cigarette excise tax and the provincial unemployment rate. Robust standard errors in brackets are clustered on statistical areas (SAs). Implied percent impact as a proportion of base year average value of dependent variable for people living in places without a law in curly braces. * significant at 5%; ** significant at 1%.
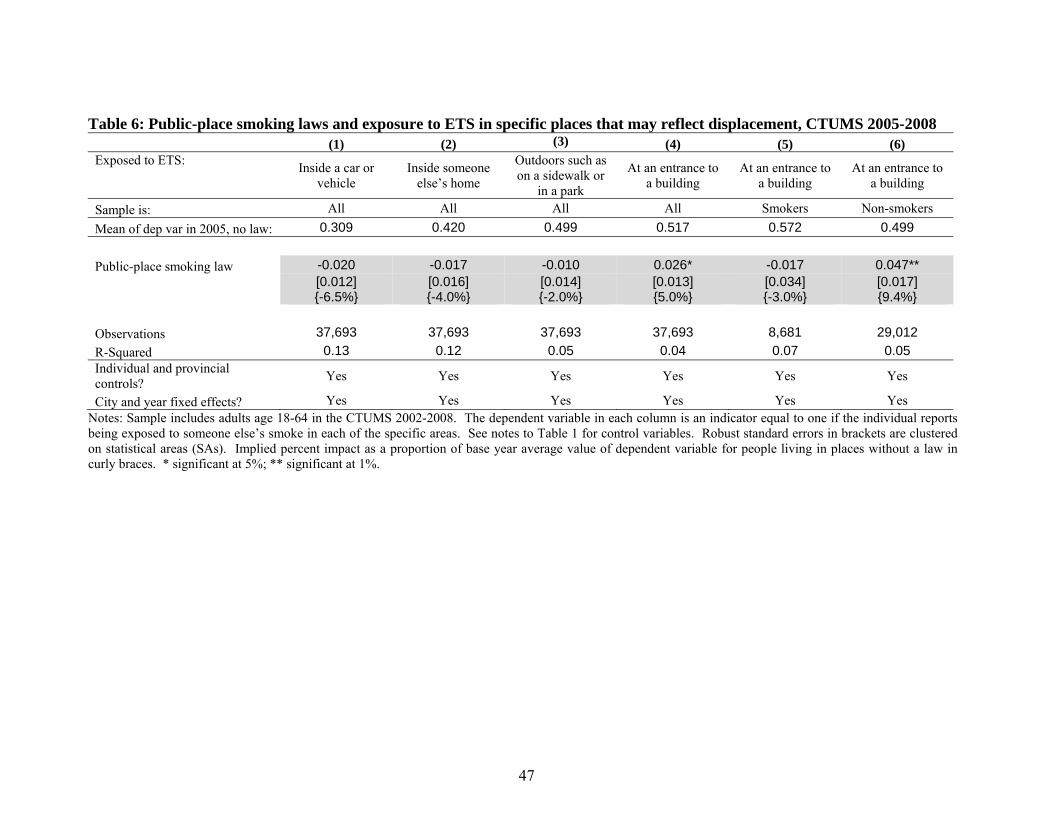
47
Table 6: Public-place smoking laws and exposure to ETS in specific places that may reflect displacement, CTUMS 2005-2008
(1) (2) (3) (4) (5) (6) Exposed to ETS:
Inside a car or vehicle
Inside someone else’s home
Outdoors such as on a sidewalk or
in a park
At an entrance to a building
At an entrance to a building
At an entrance to a building
Sample is: All All All All Smokers Non-smokers
Mean of dep var in 2005, no law: 0.309 0.420 0.499 0.517 0.572 0.499
Public-place smoking law -0.020 -0.017 -0.010 0.026* -0.017 0.047**
[0.012] {-6.5%}
[0.016] {-4.0%}
[0.014] {-2.0%}
[0.013] {5.0%}
[0.034] {-3.0%}
[0.017] {9.4%}
Observations 37,693 37,693 37,693 37,693 8,681 29,012
R-Squared 0.13 0.12 0.05 0.04 0.07 0.05 Individual and provincial controls?
Yes Yes Yes Yes Yes Yes
City and year fixed effects? Yes Yes Yes Yes Yes Yes Notes: Sample includes adults age 18-64 in the CTUMS 2002-2008. The dependent variable in each column is an indicator equal to one if the individual reports being exposed to someone else’s smoke in each of the specific areas. See notes to Table 1 for control variables. Robust standard errors in brackets are clustered on statistical areas (SAs). Implied percent impact as a proportion of base year average value of dependent variable for people living in places without a law in curly braces. * significant at 5%; ** significant at 1%.
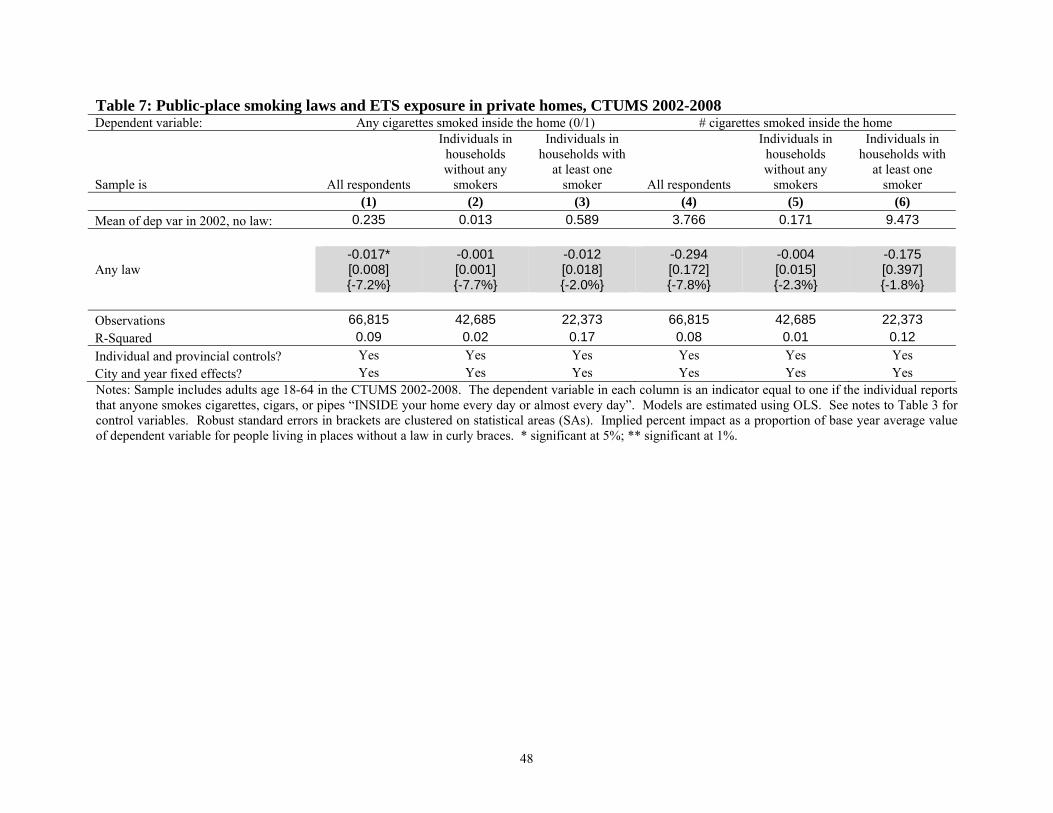
48
Table 7: Public-place smoking laws and ETS exposure in private homes, CTUMS 2002-2008 Dependent variable: Any cigarettes smoked inside the home (0/1) # cigarettes smoked inside the home
Sample is All respondents
Individuals in households without any
smokers
Individuals in households with
at least one smoker All respondents
Individuals in households without any
smokers
Individuals in households with
at least one smoker
(1) (2) (3) (4) (5) (6)
Mean of dep var in 2002, no law: 0.235 0.013 0.589 3.766 0.171 9.473
Any law
-0.017* [0.008] {-7.2%}
-0.001 [0.001] {-7.7%}
-0.012 [0.018] {-2.0%}
-0.294 [0.172] {-7.8%}
-0.004 [0.015] {-2.3%}
-0.175 [0.397] {-1.8%}
Observations 66,815 42,685 22,373 66,815 42,685 22,373 R-Squared 0.09 0.02 0.17 0.08 0.01 0.12
Individual and provincial controls? Yes Yes Yes Yes Yes Yes
City and year fixed effects? Yes Yes Yes Yes Yes Yes Notes: Sample includes adults age 18-64 in the CTUMS 2002-2008. The dependent variable in each column is an indicator equal to one if the individual reports that anyone smokes cigarettes, cigars, or pipes “INSIDE your home every day or almost every day”. Models are estimated using OLS. See notes to Table 3 for control variables. Robust standard errors in brackets are clustered on statistical areas (SAs). Implied percent impact as a proportion of base year average value of dependent variable for people living in places without a law in curly braces. * significant at 5%; ** significant at 1%.

Public Place Smoking Laws and Exposure to Environmental Tobacco Smoke (ETS) Christopher Carpenter, Sabina Postolek, and Casey Warman
Web Appendix Appendix Table 1: Descriptive Statistics, CTUMS Full sample
Public-place smoking law 0.712
Gold public-place smoking law 0.437
Silver public-place smoking law 0.196
Bronze public-place smoking law 0.080
Exposed to second hand smoke*
- inside a bar/tavern 0.130
- inside a restaurant 0.116
- on the patio of a bar or restaurant 0.355
- at the entrance to a building 0.579
- inside a car or vehicle 0.261
- inside someone else’s home 0.293
- at a bus stop or shelter 0.186
- at your workplace 0.271
- at your school 0.070
- at any other public place such as a shopping mall, arena, etc 0.348
- outdoors such as on a sidewalk or in a park 0.568
- anywhere else 0.045
Current smoker 0.211
Number of cigarettes smoked last month (among smokers) 380.7
Age 39.70
Male 0.497
Education
Less than high school 0.089
High school 0.231
Some post secondary 0.154
College 0.202
University 0.301
Other 0.011
Missing 0.012
Marital status
Single never married 0.274
Not currently married (i.e., widowed, divorced, or separated) 0.081
Missing 0.013
Observations 67,142 Notes: Weighted means, CTUMS 2002-2008, adults age 18-64. * Weighted means, CTUMS 2005-2008, adults age 18-64.

Appendix Table 2: Descriptive Statistics, CCHS
Full sample
Public-place smoking law 0.584
Gold public-place smoking law 0.325
Silver public-place smoking law 0.177
Bronze public-place smoking law 0.081
Exposed to ETS in public places on most or all days in previous month (among non smokers)
0.174
Current smoker 0.261
Number of cigarettes smoked last month (among smokers) 377.6
Age 39.9
Male 0.498
Education
Less than high school 0.047
High school 0.100
Some post secondary 0.063
College 0.379
Bachelor 0.224
Graduate school 0.125
Missing 0.062
Marital status
Single never married 0.277
Not currently married (i.e., widowed, divorced, or separated) 0.093
Province
Newfoundland 0.009
PEI 0.003
Nova Scotia 0.023
New Brunswick 0.018
Quebec 0.236
Ontario 0.409
Manitoba 0.030
Saskatchewan 0.023
Alberta 0.102
British Columbia 0.145
Yukon 0.001
North West Territories 0.001
Observations 238,503 Notes: Weighted means, CCHS Cycles 1.1-2008, adults age 18-64.
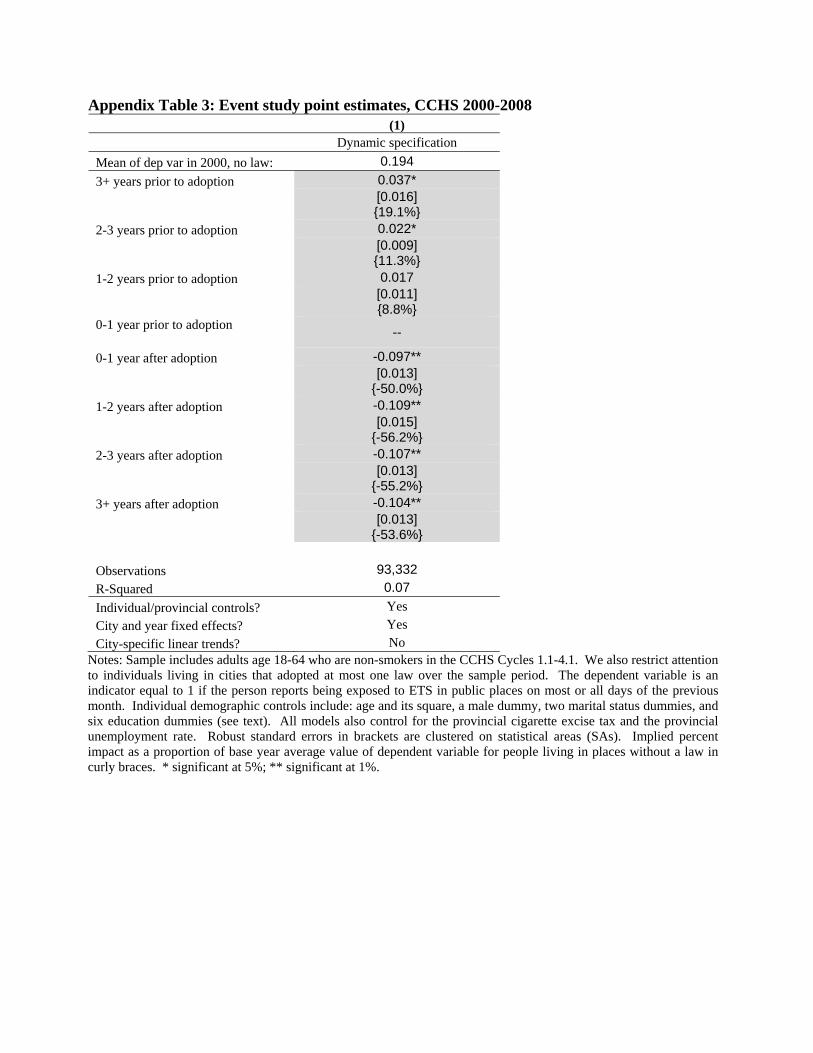
Appendix Table 3: Event study point estimates, CCHS 2000-2008
(1)
Dynamic specification
Mean of dep var in 2000, no law: 0.194
3+ years prior to adoption 0.037*
[0.016] {19.1%}
2-3 years prior to adoption 0.022*
[0.009] {11.3%}
1-2 years prior to adoption 0.017
[0.011] {8.8%}
0-1 year prior to adoption
--
0-1 year after adoption -0.097**
[0.013]
{-50.0%} 1-2 years after adoption -0.109**
[0.015]
{-56.2%} 2-3 years after adoption -0.107**
[0.013]
{-55.2%} 3+ years after adoption -0.104**
[0.013]
{-53.6%}
Observations 93,332
R-Squared 0.07
Individual/provincial controls? Yes
City and year fixed effects? Yes
City-specific linear trends? No Notes: Sample includes adults age 18-64 who are non-smokers in the CCHS Cycles 1.1-4.1. We also restrict attention to individuals living in cities that adopted at most one law over the sample period. The dependent variable is an indicator equal to 1 if the person reports being exposed to ETS in public places on most or all days of the previous month. Individual demographic controls include: age and its square, a male dummy, two marital status dummies, and six education dummies (see text). All models also control for the provincial cigarette excise tax and the provincial unemployment rate. Robust standard errors in brackets are clustered on statistical areas (SAs). Implied percent impact as a proportion of base year average value of dependent variable for people living in places without a law in curly braces. * significant at 5%; ** significant at 1%.