public pulse report - undp · public pulse report november 2014 6 similar to the di indicators, the...
TRANSCRIPT

PUBLIC PULSE REPORT 8
PUBLIC PULSE REPORT -VIII- November 2014
Prepared by UNDP Kosovo1- Public Pulse Project team:
Atdhe Hetemi,Public Pulse Project Manager
Iris Duri,Statistician – Policy, Research, Gender and Communication Team
Erëblina Elezaj,Research Analyst – Policy, Research, Gender and Communication Team
Aida Emini and Christine Vlasic,Interns – Policy, Research, Gender and Communication Team
Quality Assurance,Policy, Research, Gender and Communication Team
Prishtinë/PrištinaNovember 2014
1For UNDP, all references to Kosovo on this document are made in the context of UN Security Council Resolution 1244 (1999).

3
PUBLIC PULSE REPORTNovember 2014
The Public Pulse Brief document provides a con-cise overview of key indicators and results of the Public Pulse Poll. This brief covers the period from April to November 2014 and follows the tradition of previous reports by examining the evolving situ-ation in Kosovo in the areas of political, economic, security, and development issues. Additional data obtained through this poll will be made available through Public Pulse Analysis and Action Paper documents.
Public Pulse Main Indicators
Satisfaction with the performance of Koso-vo Institutions
The present Public Pulse Poll results show a significant decrease in people’s satisfaction with the work of Kosovo’s key executive, legislative, and judicial institutions. Only around 25% of Kosovans declared to be satisfied with the leg-islative, executive, and judiciary institutions combined.
Between April and November 2014, satisfac-tion levels with the work of Executive Institu-tions have decreased by 25 percentage points, reaching their lowest level since March 2007. Less than 20% of Kosovans are satisfied with
the work of Kosovo Executive Institutions. In addition, only 34% of Kosovans are satisfied with the work of the Prime Minister compared to 48.5% in April 2014. The legislative institutions, such as the Parlia-ment and the Speaker of the Parliament, have both seen their levels of satisfaction drop by about 31 and 35 percentage points. These bod-ies also reached their lowest levels of satisfac-tion since March 2007. Only 16% of Kosovans are satisfied with the work of the Parliament, whereas 23% are satisfied with the performance of the Speaker of the Parliament. Although the President enjoys the highest level of satisfaction among citizens, this satisfaction level has also decreased over time. Around 41% of Kosovans are satisfied with the work of the President (as compared to 48.8% in April 2014).
The judiciary is no exception to the decrease in the level of satisfaction with its performance. The percentage of Kosovans who are satisfied with the work of Kosovo courts has decreased from 38% to 23% between April and Novem-ber 2014. A decrease of around 17 percentage points marked the level of satisfaction with the work of the Prosecutor’s Office as well, bringing it to an all-time low of 21% of Kosovans (com-pared to 38% in April 2014) (see Table 1).
07-Mar 08-May 09-Jun 10-Apr 10-Nov 11-Jun 12-Oct 13-Apr 14-Apr Nov-14 Trend
Satisfaction with executive government
Govern-ment
30.5% 46.9% 53.1% 29.2% 25.1% 32.6% 27.2% 27.0% 44.2% 19.3%
Prime minister
54.0% 72.0% 53.8% 36.4% 30.7% 37.6% 27.3% 30.4% 48.5% 34.1%
Satisfaction with legislative
Parliament 31.0% 51.4% 53.2% 34.1% 32.1% 41.0% 32.1% 32.3% 46.5% 16.1%
Speaker of parliament
35.4% 56.5% 51.6% 36.0% 33.3% 60.9% 44.7% 45.8% 57.8% 23.3%
President 52.0% 74.0% 61.7% 54.9% 30.8% 54.1% 47.1% 45.1% 48.8% 40.7%
Satisfaction with judiciary
Court 20.0% 21.0% 32.7% 27.2% 18.5% 26.9% 24.3% 16.7% 37.5% 22.8%
Prosecu-tor's office
22.7% 22.7% 31.7% 26.9% 15.1% 20.0% 15.0% 17.7% 38.1% 21.0%
Table 1: Satisfaction level with Kosovo’s key executive, legislative, and judicial institutions
PUBLIC PULSE REPORTNovember 2014
4
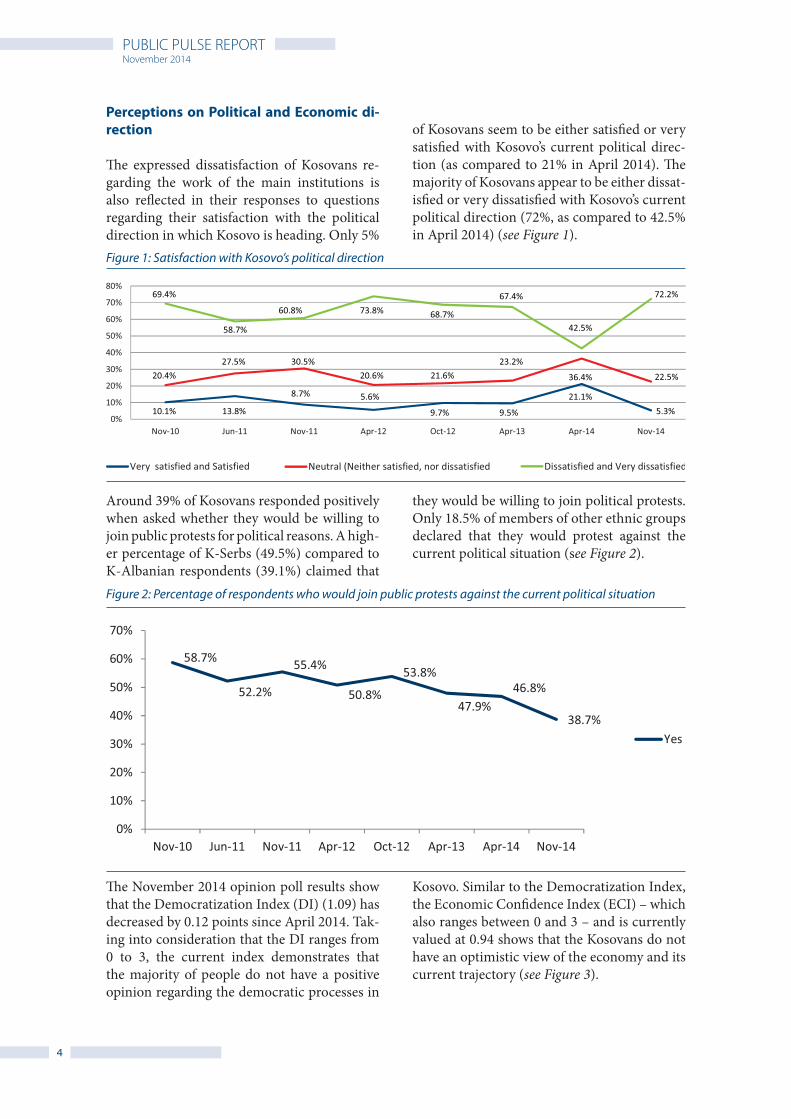
Around 39% of Kosovans responded positively when asked whether they would be willing to join public protests for political reasons. A high-er percentage of K-Serbs (49.5%) compared to K-Albanian respondents (39.1%) claimed that
The November 2014 opinion poll results show that the Democratization Index (DI) (1.09) has decreased by 0.12 points since April 2014. Tak-ing into consideration that the DI ranges from 0 to 3, the current index demonstrates that the majority of people do not have a positive opinion regarding the democratic processes in
they would be willing to join political protests. Only 18.5% of members of other ethnic groups declared that they would protest against the current political situation (see Figure 2).
Kosovo. Similar to the Democratization Index, the Economic Confidence Index (ECI) – which also ranges between 0 and 3 – and is currently valued at 0.94 shows that the Kosovans do not have an optimistic view of the economy and its current trajectory (see Figure 3).
69.4%
20.4%
10.1% 13.8%
8.7% 5.6%
9.7% 9.5%
21.1%5.3%
27.5% 30.5%20.6% 21.6%
23.2%
36.4% 22.5%
58.7%
60.8% 73.8% 68.7%
67.4%
42.5%
72.2%
Figure 1: Satisfaction with Kosovo’s political direction
Figure 2: Percentage of respondents who would join public protests against the current political situation
Perceptions on Political and Economic di-rection
The expressed dissatisfaction of Kosovans re-garding the work of the main institutions is also reflected in their responses to questions regarding their satisfaction with the political direction in which Kosovo is heading. Only 5%
of Kosovans seem to be either satisfied or very satisfied with Kosovo’s current political direc-tion (as compared to 21% in April 2014). The majority of Kosovans appear to be either dissat-isfied or very dissatisfied with Kosovo’s current political direction (72%, as compared to 42.5% in April 2014) (see Figure 1).

5
PUBLIC PULSE REPORTNovember 2014
0.92
0.92
0.95
0.90
0.91
0.79
0.91
0.81
0.89
0.82
0.87
0.68
1.22
1.03
1.09
0.94
A trend analysis comparing the values of ele-ments composited to create the DI was con-ducted in order to determine what factors led to the decrease in the index’s value. There has been a decrease in the values of all the com-ponents when compounded form this index. The percentage of Kosovans who believe that the Constitution and Laws in power are dem-ocratic and respect human rights experienced the greatest decrease, from 35% in April 2014 to 24% in November 2014. Other components that showed a significant decrease are the in-dependence of the judiciary system as well as belief that civil society in Kosovo serves as a truthful monitor of democratic developments in Kosovo. In April 2014, 25% of citizens be-
lieved in the independence of the judiciary system in Kosovo, whereas the current survey shows that only 16% of them have faith in its independence. Similarly, in April 2014, about 29% of citizens believed that civil society serves as a truthful monitor of democratic develop-ments in Kosovo, while the latest poll shows that only 21% of Kosovans think so. Other de-mocratization indicators for which the Public Pulse poll gathered data also demonstrate a de-crease in citizens’ trust in media’s freedom of expression (40%, as compared to 45% in April 2014), and the parliament’s ability to monitor the central institutions’ performance (21.5% as compared to 28.5% in April 2014) etc. (see Table 2).
Figure 3: Democratization and Economic Confidence Indexes2
2See the last page of the document for more information about the calculation of indexes

PUBLIC PULSE REPORTNovember 2014
6
Similar to the DI indicators, the current affir-mative responses of the ECI components were also compared with those of April 2014. Here it is also noted that most of the components had a part to play in the general decrease of the ECI. The results reveal that only the percent-age of Kosovans who believe that their families’ total incomes will increase in the short term (six months) has increased, from 15% in April
to 20% in November 2014. Only 8% and 9% of Kosovans hold a favourable opinion of current employment and business conditions, respec-tively. The percentage of Kosovans with positive expectations regarding employment conditions in the near future (six months) experienced the largest decrease, from 13.7% in April to 7.3% in November 2014 (see Table 3).
Table 2: Trend analysis of Democratization Index components - Percentage of affirmative responses to Democ-ratization Index questions (percent of respondents that “fully agree” or “mainly agree”)
Yes Mainly and Yes fully Nov-10 Jun-11 Nov-11 Apr-12 Oct-12 Apr-13 Apr-14 Nov-14 Trend
Are the elections in Kosovo democratic and in accordance with international standards?
31.05% 29.29% 23.06% 17.03% 16.20% 15.05% 36.38% 34.00%
Does the Parliament monitor the Government performance?
20.72% 20.75% 19.37% 16.72% 17.72% 17.50% 28.45% 21.46%
Is Judiciary System in Kosovo independent on its decisions?
13.17% 15.62% 11.28% 12.33% 15.66% 10.64% 24.79% 15.95%
Does media in Kosovo enjoys the freedom of expression?
29.16% 33.92% 33.33% 34.67% 37.32% 24.61% 45.36% 39.59%
Does Civil Society in Kosovo serve as, a truthful monitor of democratic developments in Kosovo?
22.57% 18.94% 20.31% 18.97% 24.42% 18.27% 28.78% 21.35%
Is your Local (municipal) Government working according to priorities of Kosovo citizens?
27.66% 26.69% 29.03% 25.73% 27.26% 26.14% 32.57% 29.54%
Is Kosovo Government working according to priorities of Kosovo citizens?
14.32% 16.14% 14.55% 12.94% 15.29% 16.36% 26.44% 18.24%
Is Kosovo Constitution as well as Laws in power democratic and do they respect the Human Rights?
32.62% 27.95% 26.47% 25.94% 25.96% 33.02% 35.28% 24.21%
Regardless of daily politics and looking forward to the future, do you agree that the democratic processes in Kosovo are instituted and are going towards the right direction?
25.55% 24.48% 17.92% 18.08% 18.64% 22.98% 33.00% 33.00%
Table 3: Trend analysis in percentage of affirmative responses to ECI component questions (percent of respon-dents who deem them “favourable”)
Favourable Nov-10
Jun-11
Nov-11
Apr-12
Oct-12
Apr-13
Apr-14
Nov-14 Trend
What are your expectations regarding your family’s total income six months from now
16.8% 12.1% 8.5% 9.9% 9.6% 7.6% 17.0% 19.7%
What is your assessment of the current business conditions
10.7% 9.7% 6.0% 7.9% 6.7% 4.8% 11.6% 8.8%
What is your assessment of the current employment condition
4.0% 3.3% 3.8% 3.4% 3.8% 5.1% 9.2% 7.7%
What are your expectations regarding employment condition six months from now
14.3% 12.4% 8.0% 7.6% 7.4% 6.4% 13.7% 7.3%

7
PUBLIC PULSE REPORTNovember 2014
21.3%
70.6%
23.9%
67.1%
16.8%
74.1%
17.9%
76.5%
13.1%
82.9%
17.8%
77.6%
18.3%
77.7%
13.0%
78.7%
74.1%
71.4%
20.0%
8.6%
73.0%
21.6%
5.3%
79.4%
16.9%3.7%
76.3%
17.5%6.2%
75.6%
18.5%5.9%
62.1%
25.8%
12.1%
78.6%
16.2%5.2%
19.5%
6.5%
Public dissatisfaction with Kosovo’s economic direction is even higher than dissatisfaction with its political direction: around 79% of all respondents are either dissatisfied or very dis-satisfied with Kosovo’s current economic direc-
Perceived Paramount Problems
According to respondents, the largest problem Kosovo faces is unemployment, followed by poverty (24%) and corruption (5%). Fifty five percent of Kosovans consider unemployment to be the main problem in Kosovo. In addi-tion to this, the respondents also remain un-convinced of merit-based employment in the public sector. The results of the current poll
tion, while only about 5% are satisfied with it. The data collected from the opinion poll indi-cate that the dissatisfaction of other commu-nities (81%) and K-Albanians (79%) is higher than that of K-Serbs (73%) (see Figure 4).
show that 79% of Kosovans believe that fami-ly connections, bribes, party alliance and other non-merit bases combined are the most im-portant factors in gaining employment in the public sector. Only 13% of respondents believe that education, professional experience and vocational training combined are important when to gain employment in the public sec-tor (see Figure 5).
Figure 4: Level of satisfaction with Kosovo’s economic direction
Figure 5: Perceptions of meritocracy in gaining employment in the public sector

PUBLIC PULSE REPORTNovember 2014
8
Corruption remains one of the most import-ant problems for Kosovans. A large number of Kosovans think that large-scale corruption is prevalent in many institutions and this fig-ure has even increased compared to April 2014 results. The institutions that are perceived to have the highest prevalence of large-scale cor-ruption include: healthcare providers 56% (as
compared to 40% in April 2014), courts 42% (as compared 32% in April 2014), KEC 39% (as compared to 24% in April 2014), the cen-tral administration/institutions 37.5% (as com-pared to 24% in April 2014), the Privatization Agency of Kosovo 35% (as compared to 25% in April 2014), and Customs 33% (as compared to 23% in April 2014) (see Table 4).
Perceptions on Discrimination
Respondents were also asked to express their opinions about which groups are most subject to discrimination in Kosovo. The majority of
respondents identified the following: the elder-ly (23.5%), women/girls and individuals with disabilities - including those who have long-term physical, mental, intellectual or sensory impairments (19% each) (see Figure 6).
Figure 6: Groups perceived as most commonly subject to discrimination in Kosovo
Table 4: Perceptions on prevalence of large-scale corruption in institutions in Kosovo
Nov-10
Jun-11
Nov-11
Apr-12
Sep-12
Apr-13
Apr-14
Nov-14 Trend
Healthcare (hospitals) 47.9% 40.7% 49.8% 43.3% 51.6% 50.4% 40.4% 56.2%
Courts 49.7% 41.6% 55.6% 44.5% 47.5% 56.4% 32.2% 42.1%
KEC 52.4% 47.9% 61.2% 47.8% 53.8% 48.8% 24.4% 39.1%
Central administration/government 47.5% 41.4% 43.3% 39.5% 35.7% 46.1% 24.0% 37.5%
PAK (Privatization Agency of Kosovo) 52.0% 40.5% 51.9% 49.4% 46.4% 48.7% 24.6% 34.8%
Customs 45.1% 42.3% 53.7% 43.2% 49.9% 58.9% 22.5% 33.4%
Municipalities (local government) 32.9% 30.4% 31.9% 30.1% 32.2% 38.9% 20.6% 33.2%
TAK (Tax administration of Kosovo) 24.9% 36.5% 38.1% 33.6% 42.5% 16.5% 28.0%
Education (schools, University) 14.4% 13.1% 17.3% 26.2% 23.5% 31.6% 13.0% 24.3%
PTK 34.0% 32.4% 46.6% 41.8% 45.1% 41.4% 15.4% 21.3%
Banks 14.4% 14.9% 22.0% 20.5% 22.8% 37.5% 12.0% 17.0%
EULEX police (CIVPOL) 22.9% 26.2% 27.1% 28.3% 28.7% 38.3% 11.1% 16.5%
International organizations 14.7% 12.3% 20.3% 19.3% 20.8% 24.8% 10.8% 16.2%
Kosovo Police (KPS) 15.2% 15.5% 19.5% 19.4% 28.0% 30.3% 11.5% 16.1%

9
PUBLIC PULSE REPORTNovember 2014
Figure 7: Bases of discrimination among respondents who felt discriminated in the near past
Figure 8: Perceptions on the tripartite coalition’s plans to form the new Kosovo Institutions
The opinion poll also asked respondents wheth-er they have felt discriminated against at any point in the recent past, and if so, on what ba-sis. The current poll results show that Kosovans feel discriminated against for the following top reasons: political or other opinions (31%) sex/
gender (29%) and age (24%). A lower number of respondents declared that ethnicity (12%), disability and (7%) and religious beliefs (3%) are the most common bases for discrimination in Kosovo (see Figure 7).
Political stalemate and voting behaviour
Almost six months on from the elections, the pressure grows to end Kosovo’s political stale-mate. When asked about whether the new tri-partite coalition - intended to form the new Kosovo Institutions - would be good or bad for Kosovo, a large share of respondents (37.5%)
refused to answer or declared that they do not know. On the other hand, 25% of Kosovans be-lieve that if the coalition comes into power it will be beneficial for Kosovo, while 23% believe the opposite. Fifteen percent of those surveyed consider it to be too early to have an opinion on the coalition (see Figure 8).

PUBLIC PULSE REPORTNovember 2014
10
Figure 9: Perceptions on the abilities of the new Kosovo Institutions formed by the tripartite coalition to serve a full mandate until next regular elections
Figure 10: Perceptions on the power of voting as a mean of changing the current political situation in Kosovo
Over 53% of Kosovans did not know or refused to answer when asked whether – if formed by this tripartite coalition – Kosovo Institutions would be able to serve a full mandate until the
As the elections are also considered to be a vi-able solution to the current political crisis in Kosovo, citizens were also asked about their voting attitudes. The latest survey shows that voting attitudes among Kosovans are pretty pessimistic, with a significantly high number of respondents believing that their vote can-
next elections. Twenty five percent of the re-spondents declared that such Institutions are likely or very likely to serve a full mandate, while 21% believe the opposite (see Figure 9).
not change the situation in Kosovo (45%, as compared to 37% in April 2014), or do not know whether their vote can change it (22%, as compared to 16% in April 2014). Only 31% of potential voters (as compared to 47% in April 2014) believe that their vote can change the sit-uation in Kosovo (see Figure 10).

11
PUBLIC PULSE REPORTNovember 2014
Public Pulse also asked Kosovans about their voting preferences in case of elections, and findings reveal that only 29% of them (as com-pared to 54% in April 2014) declared that they will vote for a particular political party or coa-lition if elections take place, while 14% of them stated they have no political preferences. Fur-
Perceptions on religious radicalism
Thirty-seven percent of Kosovans think that the Muslims in Kosovo have become much more or somewhat more influenced by extreme radical forms of Islam during the last two years. On the other hand, 33% of respondents de-clared that they do not know or simply refused
thermore, what stood out in this line of ques-tioning was the high percentage of those who stated that they will not vote (17%, as compared to 13% in April 2014), and those that did not answer the question at all (40%, as compared to 21% in April 2014) (see Figure 11).
to give an answer to this question. While only 16% of respondents declared that these levels of influence have remained the same, 14% stated that during the last two years Muslims in Koso-vo have become much less or somewhat less influenced by extreme or radical forms of Islam (see Figure 12).
Figure 11: Voting preferences
Figure 12: Percentage of respondents who think that Muslims in Kosovo have become More and Much more influenced by extreme or radical forms of Islam, by age groups

PUBLIC PULSE REPORTNovember 2014
12
Figure 13: Perceptions on influence by religious radical groups, by ethnicity, age group and gender
Figure 14: Percentage of respondents who believe that Kosovo is Likely or Very likely to become a target of terrorist attacks, by gender, age group and ethnicity
When analysed on ethnical basis, the results re-veal that a higher percentage of K-Serbs (78%) believe that Kosovans are likely or very likely to be influenced by radical religious groups compared to K-Albanians (40%) and K-Oth-
Kosovans were also asked about their opinions related to the likelihood of Kosovo to become a target of terrorist attacks. The findings reveal that a large share of Kosovans (42%) considers it very unlikely or unlikely that Kosovo will become a target of terrorist attacks. However, there is also a large portion of those (32.5%) who consider it likely for Kosovo to become a target of terrorist attacks. Disaggregation of
ers (32.5%). The findings also show that 52% of those who consider Kosovans as likely to be influenced by radical religious groups belong to the age group of 18-24 year-olds (see Figure 13).
results by gender shows that a higher percent-age of men (37%) compared to women (29%) think that Kosovo is likely to become a target of terrorist attacks. Ethnically disaggregated data shows that the majority of those who think that Kosovo is likely to become a target of terrorist attacks are K-Serbs (70.5%), followed by K-Al-banians (31%) and then K-Others (22.5%) (see Figure 14).

13
PUBLIC PULSE REPORTNovember 2014
In order to understand what has shaped the perceptions of Kosovans regarding religious extremism, the respondents were asked where they obtained information on this issue. The findings reveal that almost an absolute ma-jority (93.5%) of them formed their opinions through: print and electronic media (52%), conversations with friends and relatives (34%) and online portals as well as social media sites such as Facebook and Twitter (10%). However,
When asked about the recent police operations in Kosovo which involved arrests of a number of Imams as well as individuals who were sus-pected of engaging in conflicts in the Middle East and supporting terrorist organizations, the majority of Kosovans (88%) declared that they had heard a lot, some or at least little about
4% of respondents declared that they formed their opinions based on personal experiences – seeing or hearing people promote extrem-ism and religious teachings. Disaggregation of results by age group shows that a comparably higher share of respondents belonging to the age groups 25-30 years and 31-36 years (7% each) have formed their opinion on religious extremism based on personal experiences (see Figure 15).
these arrests in Kosovo. Only about 8% of those surveyed did not know or declared that they did not hear about these arrests. Ethnically disaggregated data confirms that a higher per-centage of K-Others (17%) and K-Serbs (16%) compared to K-Albanians (3%) had not heard about these arrests (see Figure 16).
Figure 15: Reported sources of information that have shaped the opinions of Kosovans on religious extremism in Kosovo, by age groups
Figure 16: Information on the recent arrests of Imams in Kosovo, by ethnicity

PUBLIC PULSE REPORTNovember 2014
14
74.2%
24.6%
55.3%
43.9%
79.2%
18.3%
53.4%
44.5%
66.9%
26.0%
73.5%
17.9%
61.8%
27.6%
66.4%
29.9%
62.3%
30.6%
63.4%
31.4%
74.2%
20.7%
82.0%
16.1%
84.4%
12.1%
82.1%
15.2%
59.6%
33.1%
67.3%
25.9%
Safe Unsafe
Figure 17: Perceptions on recent arrests of Imams in Kosovo, by ethnicity
Figure 18: Safety while on the streets
Half of the respondents who have heard of these arrests declared that they approve or strongly approve of the arrests of these groups of Imams regardless of how much information they have on them. When analysed on an ethnical basis, the results reveal that about 92% of K-Serbs approved or strongly approved of these arrests, followed by 49% of K-Albanians and 37% of
Perceptions on safety and security in Koso-vo
As an indicator for security, the respondents were asked whether they feel safe or unsafe while out on the streets. Even though there is a generally positive trend in this regard, the No-vember 2014 data show that: 67% of Kosovans
K-Others. On the other hand, 26% of respon-dents disapproved or strongly disapproved of these arrests no matter how much information they had on the issue. It must be noted that al-most one fourth of respondents did not know or simply refused to give an opinion related to this question (see Figure 17).
feel safe when outdoors, whereas about 26% (as opposed to 33% in April 2014) feel gener-ally unsafe. When this data was analyzed on a gender basis, no significant differences were noted between the percentage of women and men that feel safe when out on the streets (see Figure 18).
15
PUBLIC PULSE REPORTNovember 2014
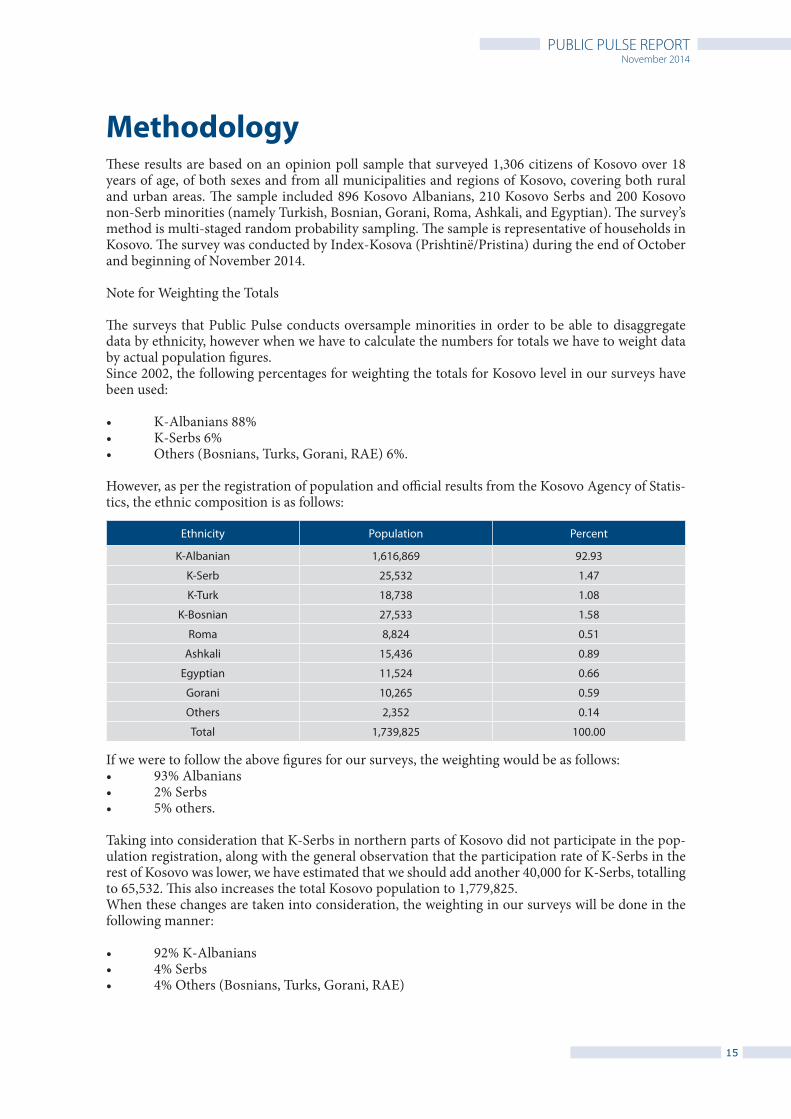
Methodology These results are based on an opinion poll sample that surveyed 1,306 citizens of Kosovo over 18 years of age, of both sexes and from all municipalities and regions of Kosovo, covering both rural and urban areas. The sample included 896 Kosovo Albanians, 210 Kosovo Serbs and 200 Kosovo non-Serb minorities (namely Turkish, Bosnian, Gorani, Roma, Ashkali, and Egyptian). The survey’s method is multi-staged random probability sampling. The sample is representative of households in Kosovo. The survey was conducted by Index-Kosova (Prishtinë/Pristina) during the end of October and beginning of November 2014.
Note for Weighting the Totals
The surveys that Public Pulse conducts oversample minorities in order to be able to disaggregate data by ethnicity, however when we have to calculate the numbers for totals we have to weight data by actual population figures. Since 2002, the following percentages for weighting the totals for Kosovo level in our surveys have been used:
• K-Albanians 88%• K-Serbs 6%• Others (Bosnians, Turks, Gorani, RAE) 6%.
However, as per the registration of population and official results from the Kosovo Agency of Statis-tics, the ethnic composition is as follows:
If we were to follow the above figures for our surveys, the weighting would be as follows:• 93% Albanians• 2% Serbs• 5% others.
Taking into consideration that K-Serbs in northern parts of Kosovo did not participate in the pop-ulation registration, along with the general observation that the participation rate of K-Serbs in the rest of Kosovo was lower, we have estimated that we should add another 40,000 for K-Serbs, totalling to 65,532. This also increases the total Kosovo population to 1,779,825.When these changes are taken into consideration, the weighting in our surveys will be done in the following manner:
• 92% K-Albanians • 4% Serbs • 4% Others (Bosnians, Turks, Gorani, RAE)
Ethnicity Population Percent
K-Albanian 1,616,869 92.93
K-Serb 25,532 1.47
K-Turk 18,738 1.08
K-Bosnian 27,533 1.58
Roma 8,824 0.51
Ashkali 15,436 0.89
Egyptian 11,524 0.66
Gorani 10,265 0.59
Others 2,352 0.14
Total 1,739,825 100.00

PUBLIC PULSE REPORTNovember 2014
16
Calculation of Indexes
The Democratization Index is a composite average based on the evaluation of the respondents of their level of agreement or disagreement regarding the development of the following processes in Kosovo: free and fair elections, parliament monitoring the performance of central institutions, an in-dependent judiciary system, freedom of expression and media, existence of a watchdog civil society in Kosovo, institutions operating based on the priorities of citizens, constitution and laws based on human rights, and whether local governments work according to the priorities of citizens. The index is a continuous measure which can range from 3 (maximum), meaning that all respondents fully agree that democratization is on the right track, to 0 (min) meaning, that all respondents disagree that democratization is on the right track.
The Economic Confidence Index is a composite average which is calculated based on the evaluation of the respondents on how favourable or unfavourable prevailing economic conditions are in Koso-vo. Specifically, respondents evaluate the following conditions: expectations regarding their family’s total income and employment conditions for the next six months and an assessment of the current business and employment conditions. The values can range from 0 (minimum) to 3 (maximum) with the range of 0-1.5 indicating unfavourable assessments of the economic situation and values 1.5 - 3 indicating mostly favourable assessments.