public report te106(6) demand management through water retrofit projects
TRANSCRIPT
7/25/2019 Public Report TE106(6) Demand Management Through Water Retrofit Projects
http://slidepdf.com/reader/full/public-report-te1066-demand-management-through-water-retrofit-projects 1/41
TE106/6
Demand Management through Water
Retrofit Projects
Final
A report prepared for Beacon Pathway Limited
Apri l 2007
The work reported here was
funded by Beacon Pathway
Limited and the Foundation
for Research, Science and
Technology
7/25/2019 Public Report TE106(6) Demand Management Through Water Retrofit Projects
http://slidepdf.com/reader/full/public-report-te1066-demand-management-through-water-retrofit-projects 2/41

7/25/2019 Public Report TE106(6) Demand Management Through Water Retrofit Projects
http://slidepdf.com/reader/full/public-report-te1066-demand-management-through-water-retrofit-projects 3/41
Demand Management through Water
Retrofit Projects: TE106/6
Page iii
Contents
1 Executive Summary................................................................................................................ 4
2 Introduction............................................................................................................................. 3
3 Research Material Sources ..................................................................................................... 7
4 Results .................................................................................................................................... 7
4.1 Summary of Local Government Water Saving Initiatives in New Zealand.................... 7
4.2 Waitakere’s Ecowise Water Survey .............................................................................. 12
4.3 Kapiti District Council................................................................................................... 13
4.4 Tauranga City Council................................................................................................... 14
4.5 New Zealand Government Water Programmes............................................................. 15
4.6 The Sydney Water Experience ...................................................................................... 16
4.7 End Use Monitoring ...................................................................................................... 17
5 Conclusions .......................................................................................................................... 18
6 References............................................................................................................................. 20
APPENDIX 1: Waitakere City Council’s Water Wiseup Survey Results .................................. 21
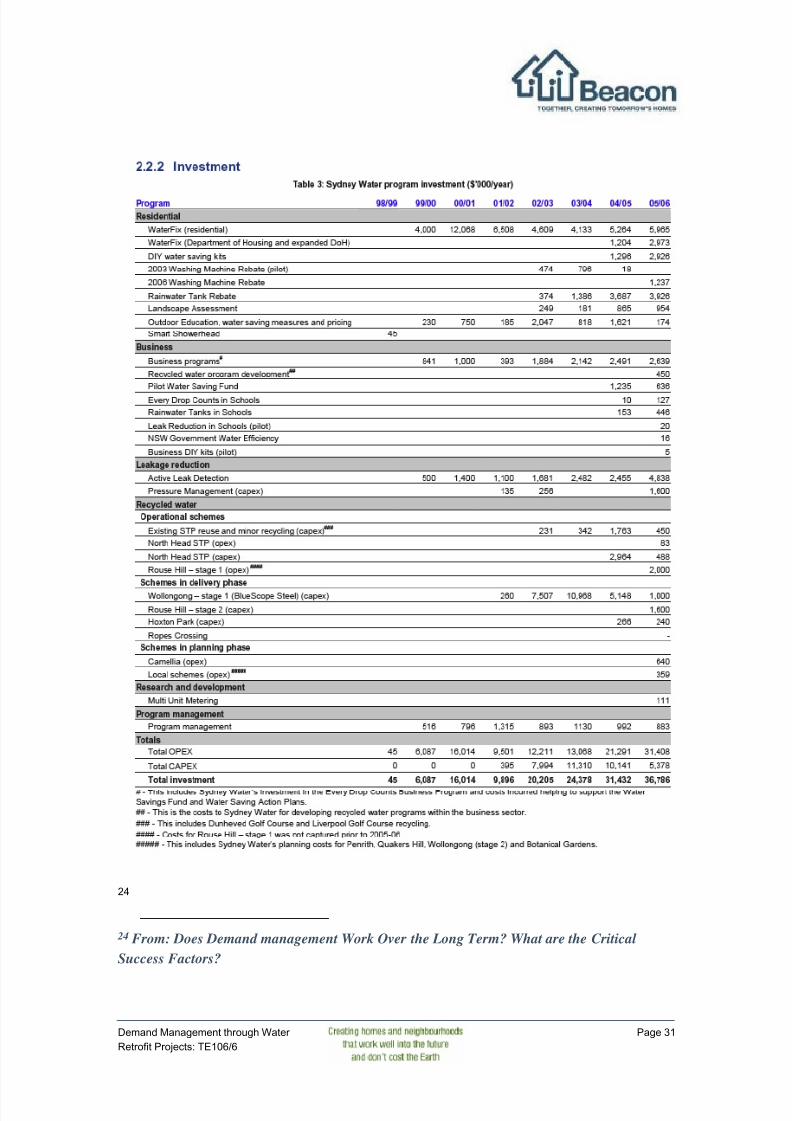
APPENDIX 2: Results from the Sydney Water Demand Management Programme ................. 28
APPENDIX 3: Privatisation and Conservation in New Zealand ................................................ 32
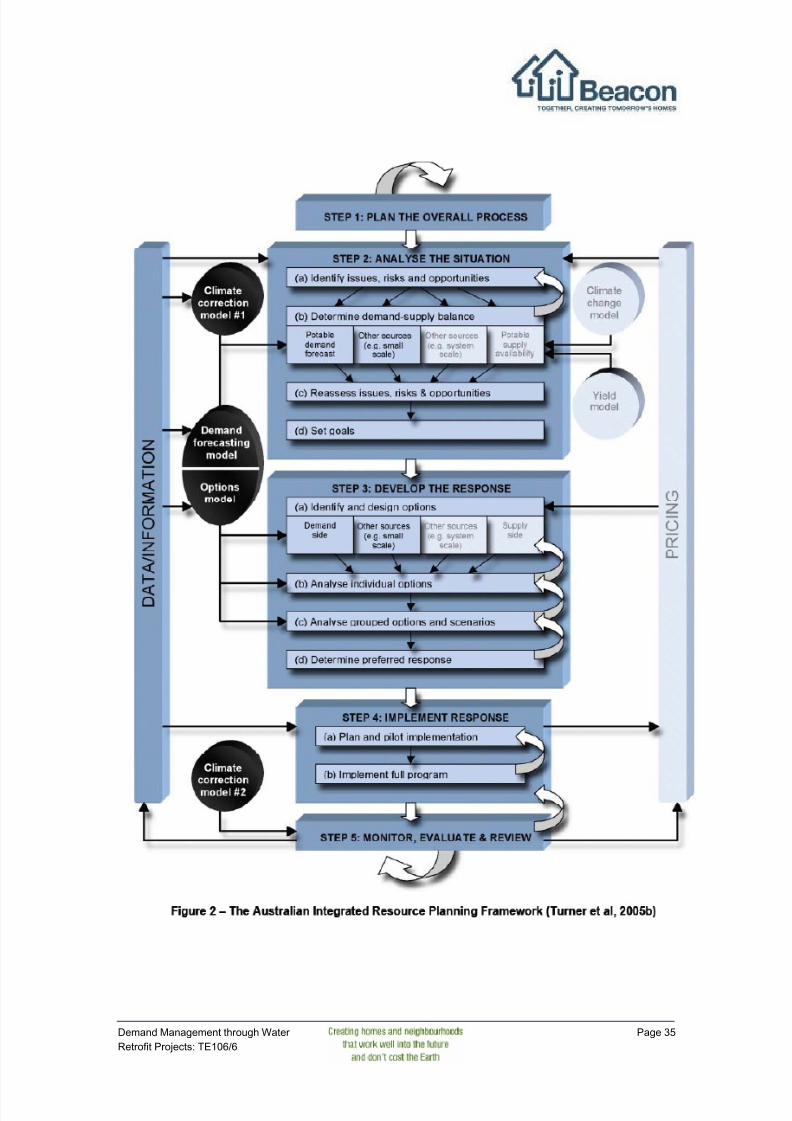
APPENDIX 4: Least Cost Planning and Integrated Resource Planning..................................... 34
APPENDIX 5: Demand Management Measures ........................................................................ 36
APPENDIX 6: Water Savings from Seattle ................................................................................ 38
Tables
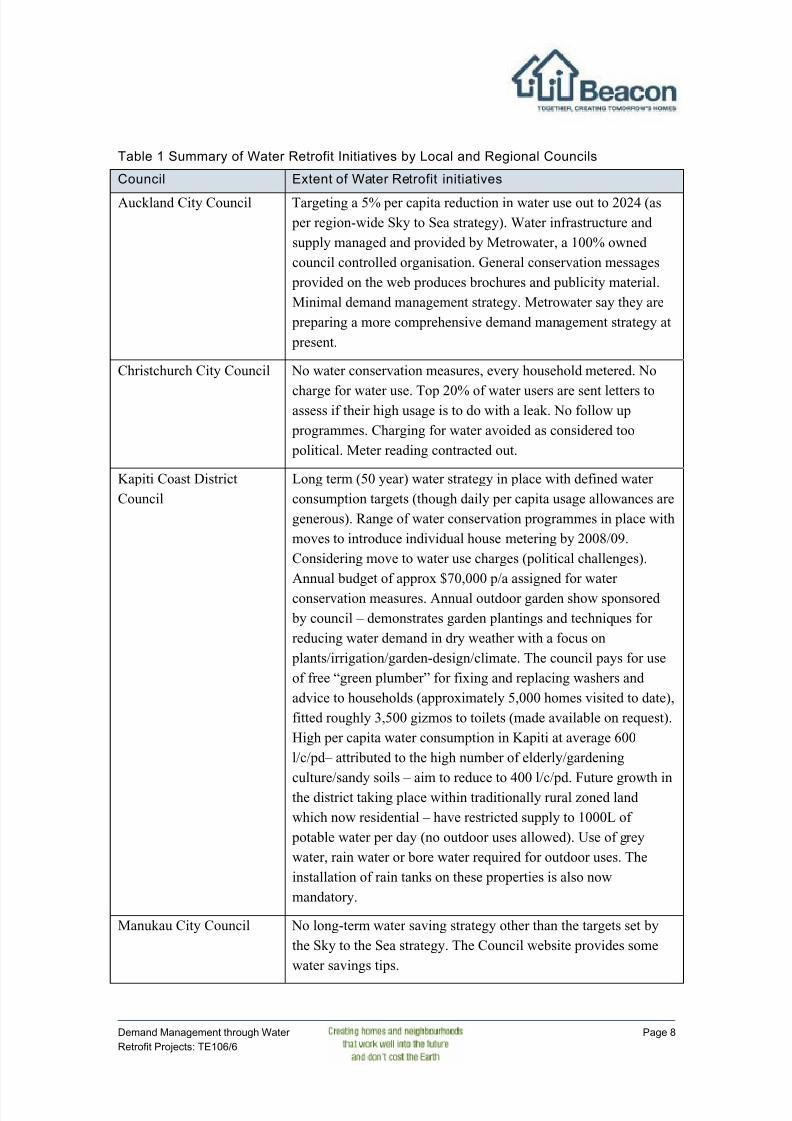
Table 1 Summary of Water Retrofit Initiatives by Local and Regional Councils …………….8
7/25/2019 Public Report TE106(6) Demand Management Through Water Retrofit Projects
http://slidepdf.com/reader/full/public-report-te1066-demand-management-through-water-retrofit-projects 4/41
Demand Management through Water
Retrofit Projects: TE106/6
Page iv
1 Executive SummaryThe focus of this research was to establish the scope and level of demand management work
being undertaken by local and central government in New Zealand to reduce water consumption
at a domestic level through the use of water retrofitting programmes. It was found that, while a
number of councils face water scarcity and supply issues, there has been little attempt to use
strategic programmes and well-implemented demand management methods at a residential
scale, to act as a means of addressing anticipated longer-term water scarcity issues.
In New Zealand, only Waitakere City and Kapiti City Councils have comprehensive and
ongoing long-term programmes to reduce water consumption per capita with relatively
significant resources allocated to ensuring the programme is successful. Waitakere Council’starget is a 25% reduction in per capita water use by 2025. This compares very favourably
against the regional target set by the Auckland water authorities which is presently only a 5%
reduction per capita by 20241. Kapiti has established a target of reducing their present water
consumption levels of 600l/c/pd down to 400l/c/pd over the medium term using a number of
innovative and progressive water conservation methods.
Neither Waitakere nor Kapiti’s targets are unrealistic or without precedent. In Sydney and
Melbourne, for example, even more aggressive targets have been set. The Sydney Water
Conservation and Recycling Implementation Report has a goal for the region of a 35% saving
per capita against a 1991 baseline2, a figure which if achieved will provide a saving of 145
billion litres of water per year by 2015 (this is close to 20 million litres more water than
Auckland consumes in total annually) (see also section 3.5.1)3. Significant Federal Government
resources are provided to run the programme and ensure its success.
North Shore City Council and Tauranga City Council are other councils that have invested
resources into water conservation programmes although North Shore City Council has been
mostly focused on stormwater amelioration rather than supply and demand management.
Findings and research from overseas highlight the benefits of well thought through and
implemented water conservation programmes that integrate supply side management with
demand management targets.
Other findings from the report include:
Well implemented demand side water management programmes offer New Zealand local
governments’ significant financial, environmental, social and cultural benefits. That these
benefits are not well understood is evidenced by their lack of use nationally.
1 Watercare Services Limited, 2004. “From the Sky to the Sea – the Auckland Water
Management Plan”.
2 Of note Sydney’s water use per capita is relatively high. The baseline target is 506 l/c/d.
3 Sydney Water, 2006. Water Conservation & Recycling Implementation Report 2005-06
7/25/2019 Public Report TE106(6) Demand Management Through Water Retrofit Projects
http://slidepdf.com/reader/full/public-report-te1066-demand-management-through-water-retrofit-projects 5/41
Demand Management through Water
Retrofit Projects: TE106/6
Page 2
Most New Zealand councils lack clearly defined per capita water use targets and few have
comprehensive and targeted long-term strategies to reduce water consumption per capita.
There appears to be a lack of imperative with respect to water efficiency in New Zealand, perhaps due to a perception of the resource being relatively abundant. The price of water is
also relatively low, even for high volume users.
There is a lack of consensus or even discussion as to how much water is enough per capita
in the New Zealand context and the establishment of national targets would provide an
important benchmarking tool for water resource managers.
Demand side management programmes for water conservation are relatively new and still
evolving locally. At present there is a lack of empirical local data documenting actual
savings through before/after programmes. However, there are a number of easy to
implement initiatives which are known to significantly reduce water consumption, even if it
is as yet unclear exactly how much.
Australia has significantly more advanced water conservation programmes and there is an
opportunity for New Zealand to leverage off their experience.
The installation of water metering coupled with water pricing based on actual use as
opposed to a fixed annual fee within annual rates, drives almost immediate and substantial
savings in water consumption at a household level and appears to drive longer-term
behavioural change.4
Direct user charging for water in areas where it has not yet been implemented remains
contentious - due possibly to its status as a “necessity” as opposed to a “luxury” resource
and New Zealanders’ historic access rights to water as a free good. As such, political
opposition to water pricing is a major obstacle for many councils wanting to meter and price
the resource according to use. The passing of national legislation requiring mandatory water
metering and charging might address this.
In some cases councils have a disincentive to conserve water as profits generated from
throughput are used to fund significant capital investment made to provide water
infrastructure.
Further monitoring of end users’ behaviour with respect to water use is required to be able
to offer more cost effective and targeted demand management and supply side programmes.
There are equity issues with respect to the pricing of water. Securing affordable supply to
lower-economic socio groups without underpricing the resource needs to be carefullyconsidered and is an important policy issue
The decision to privatise water supply operations, whether through Council Controlled
Organisations (CCO’s) or Public Private Partnerships (PPP) as has happened in many places
may be an impediment to achieving water efficiency savings targets. Nationally legislated
targets for reducing water consumption per capita would be the most effective way to
achieve a level that could be considered ambitious.
4 See for example: Nelson City Council, 2006. Water Supply Asset Management Plan 2006 –
2008, p26.
7/25/2019 Public Report TE106(6) Demand Management Through Water Retrofit Projects
http://slidepdf.com/reader/full/public-report-te1066-demand-management-through-water-retrofit-projects 6/41
Demand Management through Water
Retrofit Projects: TE106/6
Page 3
2 Introduction
Beacon Pathway is a research consortium, established in May 2004, with the aim of
encouraging and improving New Zealand’s sustainability in the residential built environment. In
accordance with Beacon’s goal of achieving a high standard of sustainability in 90% of New
Zealand homes by 2012, the organisation has created the following water demand target:
90% of homes reduce demand for reticulated water by 40% per capita and council supply to
domestic uses is reduced by 50% per capita by 2012; and
use of water within dwellings is appropriate for the quality and use.
This research contributes towards the development of strategies to achieve this target.
The underlying premise of Beacon’s water research work is that water supply and water
resource management will become a major issue for New Zealand resource managers during the
course of this century and that water use efficiency is a key element in any effort to improve the
sustainability of New Zealand’s housing stock.
There are a number of reasons for a growing imperative in New Zealand but some of the
principal drivers include:
A combination of increasing and competing demands for water resources at the same time
as the resource is becoming increasingly scarce. This is especially so in some areas of the
country where drought has been a continual and ongoing problem in recent years.
Internationally water scarcity is becoming an area of serious concern so, relatively, New
Zealand has abundant resources while being located in one of the most water deprived
regions in the world.
The effects of climate change and the likelihood of more variable and extreme climatic
events over the course of this century which are likely to have unknown and unprecedented
repercussions.
Collectively these and other trends will ensure that the days of profligate and free water use in
the New Zealand context will, and indeed in many places already has, come to an end.
At present New Zealand still enjoys relatively abundant water resources in many areas and
perhaps it is tempting to view water scarcity as being a future issue and that our focus should be
on more immediately pressing issues. However, as our neighbours across the Tasman and many
other countries are discovering, climatic conditions and their consequences can change quickly.
The opportunity currently exists for New Zealand to develop a more resilient and sustainable
system for the delivery and use of water resources, but only if we address the issues.
The shift to such a system requires a wide range of investment and strategic decisions made
over time. Priorities also need to be set. For example, if existing per capita water use trends in
Auckland are not significantly reduced over the next 15 years, then in roughly 20 years the city
7/25/2019 Public Report TE106(6) Demand Management Through Water Retrofit Projects
http://slidepdf.com/reader/full/public-report-te1066-demand-management-through-water-retrofit-projects 7/41
7/25/2019 Public Report TE106(6) Demand Management Through Water Retrofit Projects
http://slidepdf.com/reader/full/public-report-te1066-demand-management-through-water-retrofit-projects 8/41

7/25/2019 Public Report TE106(6) Demand Management Through Water Retrofit Projects
http://slidepdf.com/reader/full/public-report-te1066-demand-management-through-water-retrofit-projects 9/41
Demand Management through Water
Retrofit Projects: TE106/6
Page 6
What is demand management?
Demand management measures aim to minimise either the overall or peak demand for water
(or energy or other resource). Measures can be categorised as shown below.
Increase system efficiency: No change in resource usage by consumers but less system
losses. Examples: leakage detection and repair; change in system operations such as pressure
reduction and changes to mains flushing and reservoir cleaning; installing peak balancing
capacity.
Increase end use efficiency: Less resource used by the consumer to provide the same
service. Examples: Regulating for AAA rated shower heads and dual flush toilets in new
developments; enforce minimum performance standards on new appliances (dishwashingmachines, clothes washing machines); offering financial incentives for water efficient
purchase and installation; programmes to retrofit efficient equipment into existing buildings.
Promoting distributed sources of supply: Provide services via a locally sourced resource
not currently being used. Examples: encouraging household rainwater tanks and greywater
reuse systems; provide recycled effluent for non-potable uses via dual reticulation.
Substitute resource use: Provide same service without use of the resource in question.
Examples: Planting indigenous plants adapted to local rainfall; use of waterless sanitation.
Improve the market in resource usage: Inform the consumer about the full costs of their
resource use. Examples: full cost recovery charges for water use; volume-based pricing set at
or above the long run marginal cost; providing better feedback on the level and cost of
ongoing water usage by universal metering with at least quarterly billing or smart metering
with instant feedback; remove perverse incentive for increased resource use such as declining
block tariffs; provide comprehensive information on the environmental impacts of water use,
run education campaigns; conduct detailed water use analysis (audits) for water customers in
key sectors.
Reference: from “Designing Cost Effective Water Demand Management Programs in
Australia”, by S.B White and S.A. Fane, 2001.
7/25/2019 Public Report TE106(6) Demand Management Through Water Retrofit Projects
http://slidepdf.com/reader/full/public-report-te1066-demand-management-through-water-retrofit-projects 10/41
Demand Management through Water
Retrofit Projects: TE106/6
Page 7
3 Research Material SourcesBeacon approached councils with large stocks of residential housing (where change is needed if
Beacon’s sustainability goals are to be met) and also those councils for whom there was some
reason to believe that work in the water conservation area had been undertaken. The work was
undertaken between December and January in 2006/07. Subsequent research may expand the
survey to additional councils. Following are the councils approached for information:
Auckland City Council
Canterbury Regional Council
Kapiti Coast District Council
Manukau City Council Nelson City Council
North Shore City Council
Queenstown Lakes District Council
Rodney District Council
Tauranga District Council
Waitakere City Council
Wellington City Council
Wellington Regional Council
An overview and summary of the extent of programmes in the jurisdictions for each of these
councils is provided in section 3.1.1 of this report below.
Beacon also contacted the Ministry for the Environment in Wellington and CSIRO in Australia
for the purposes of this report and conducted a literature survey.
4 Results
4.1 Summary of Local Government Water Saving Init iatives in
New Zealand
The table below provides a summary of the programmes and initiatives being run by some of
the local governments across the country. The information was gathered through a combination
of personal interviews with water asset managers or similar, as well as through a review of
councils’ strategic documents or pages posted on websites or otherwise provided.
7/25/2019 Public Report TE106(6) Demand Management Through Water Retrofit Projects
http://slidepdf.com/reader/full/public-report-te1066-demand-management-through-water-retrofit-projects 11/41
7/25/2019 Public Report TE106(6) Demand Management Through Water Retrofit Projects
http://slidepdf.com/reader/full/public-report-te1066-demand-management-through-water-retrofit-projects 12/41
Demand Management through Water
Retrofit Projects: TE106/6
Page 9
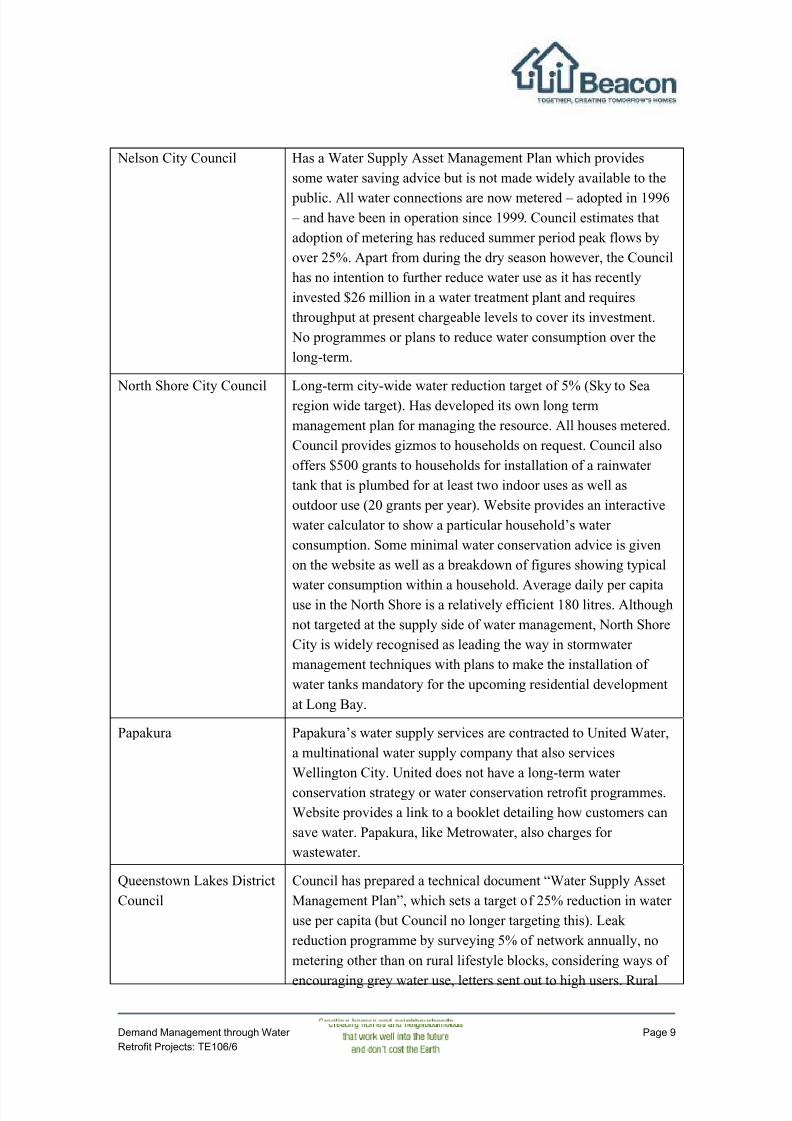
Nelson City Council Has a Water Supply Asset Management Plan which provides
some water saving advice but is not made widely available to the
public. All water connections are now metered – adopted in 1996
– and have been in operation since 1999. Council estimates that
adoption of metering has reduced summer period peak flows by
over 25%. Apart from during the dry season however, the Council
has no intention to further reduce water use as it has recently
invested $26 million in a water treatment plant and requires
throughput at present chargeable levels to cover its investment.
No programmes or plans to reduce water consumption over the
long-term.
North Shore City Council Long-term city-wide water reduction target of 5% (Sky to Searegion wide target). Has developed its own long term
management plan for managing the resource. All houses metered.
Council provides gizmos to households on request. Council also
offers $500 grants to households for installation of a rainwater
tank that is plumbed for at least two indoor uses as well as
outdoor use (20 grants per year). Website provides an interactive
water calculator to show a particular household’s water
consumption. Some minimal water conservation advice is given
on the website as well as a breakdown of figures showing typical
water consumption within a household. Average daily per capitause in the North Shore is a relatively efficient 180 litres. Although
not targeted at the supply side of water management, North Shore
City is widely recognised as leading the way in stormwater
management techniques with plans to make the installation of
water tanks mandatory for the upcoming residential development
at Long Bay.
Papakura Papakura’s water supply services are contracted to United Water,
a multinational water supply company that also services
Wellington City. United does not have a long-term waterconservation strategy or water conservation retrofit programmes.
Website provides a link to a booklet detailing how customers can
save water. Papakura, like Metrowater, also charges for
wastewater.
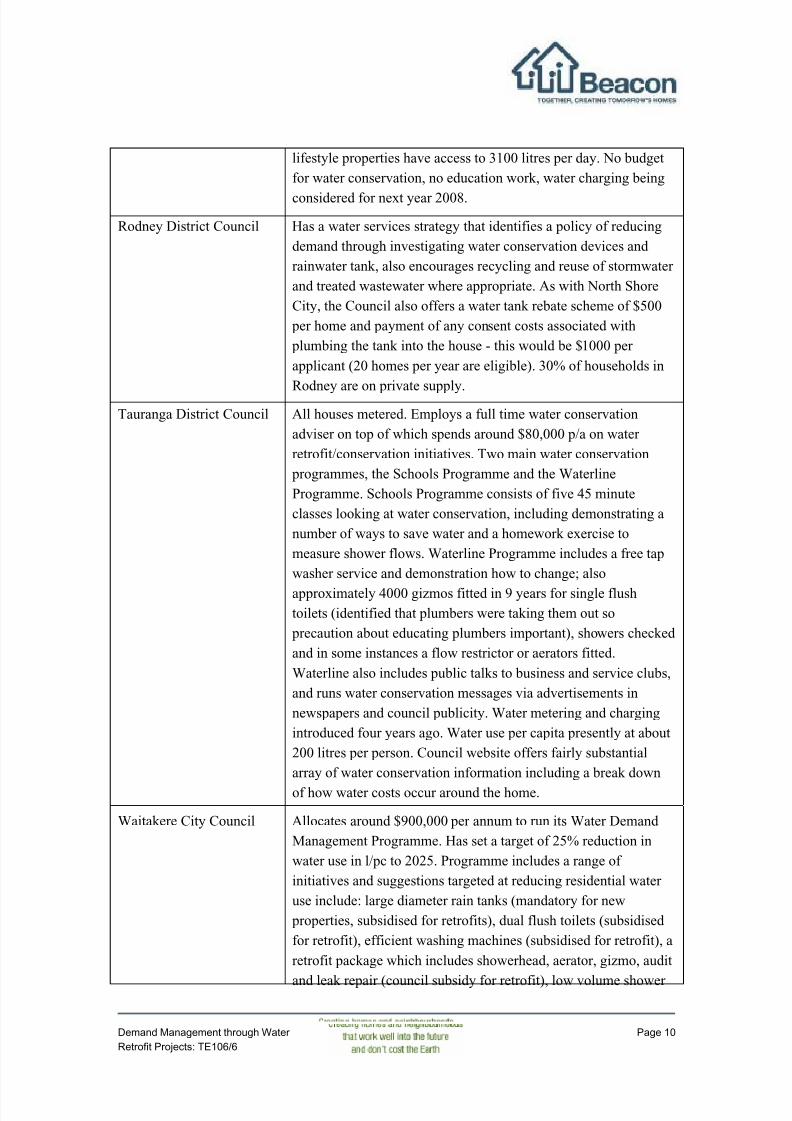
Queenstown Lakes District
Council
Council has prepared a technical document “Water Supply Asset
Management Plan”, which sets a target of 25% reduction in water
use per capita (but Council no longer targeting this). Leak
reduction programme by surveying 5% of network annually, no
metering other than on rural lifestyle blocks, considering ways of
encouraging grey water use, letters sent out to high users. Rural
7/25/2019 Public Report TE106(6) Demand Management Through Water Retrofit Projects
http://slidepdf.com/reader/full/public-report-te1066-demand-management-through-water-retrofit-projects 13/41
7/25/2019 Public Report TE106(6) Demand Management Through Water Retrofit Projects
http://slidepdf.com/reader/full/public-report-te1066-demand-management-through-water-retrofit-projects 14/41
7/25/2019 Public Report TE106(6) Demand Management Through Water Retrofit Projects
http://slidepdf.com/reader/full/public-report-te1066-demand-management-through-water-retrofit-projects 15/41
Demand Management through Water
Retrofit Projects: TE106/6
Page 12
water consumption reduction targets out to 2025. The key elements of the plan include a
principle objective of the Council which is to reduce water consumption within the city by 25%
per capita by 2025.
The Management Plan outlines two options for implementation for Council, the principal
difference between the two being that one provides a cost estimate if wastewater charging is
introduced while the other does not. The two options both use rain tanks as a primary means of
reducing water.
The package of initiatives targeted at residential water users include:
Large Diameter Rain Tanks (mandatory for new properties, subsidised for retrofits)
Dual flush toilets (subsidised for retrofit)
Efficient washing machines (subsidised for retrofit)
House to house survey
A package which includes showerhead, aerator, gizmo, audit and leak repair (Council
subsidy for retrofit).
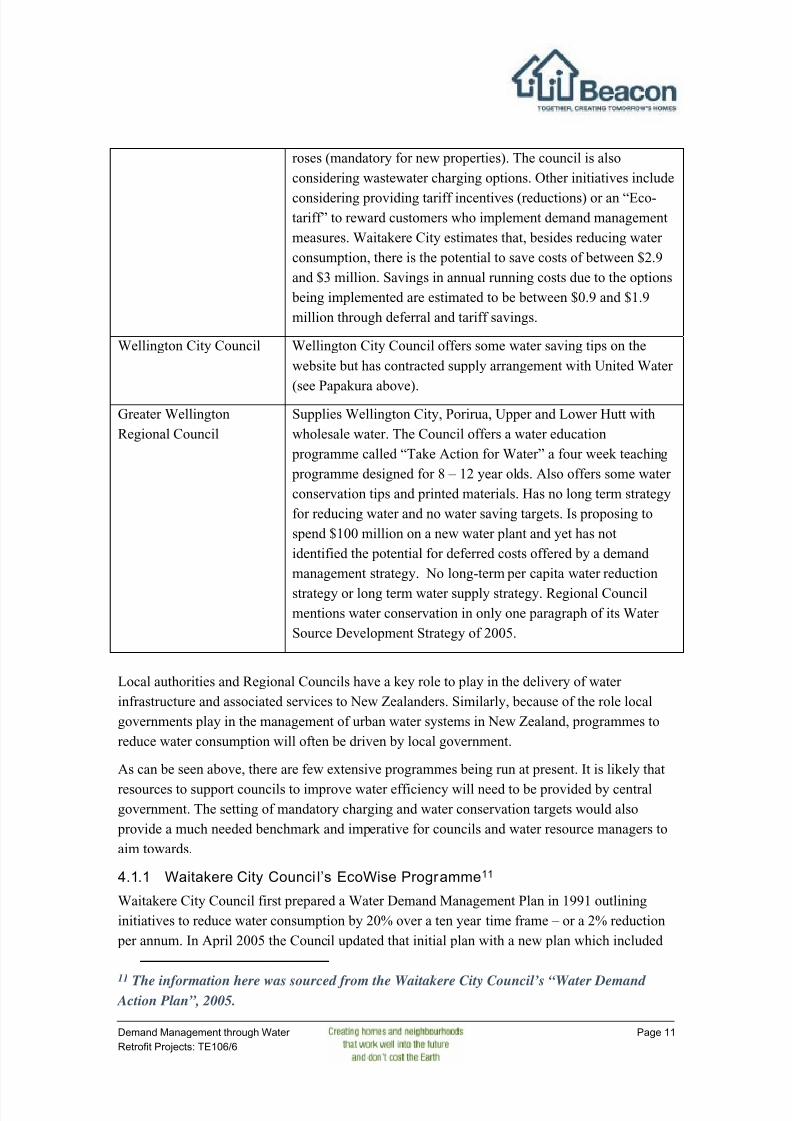
Low volume shower roses (mandatory for new properties)12
The effect of introducing wastewater charging is a reduction in the cost of running the
programmes through the addition of an extra revenue stream and reduction in overhead cost.
Waitakere City estimates that, besides reducing water consumption, both the scenarios that they
have developed will save costs of between $2.9M and 3.0 million. Savings in annual running
costs due to the options being implemented are estimated to be between $0.9M and $1.9M
through deferral and tariff savings.
The annual cost of funding the Water Demand Management Programme is approximately
$900,000. The Council is considering providing tariff incentives (reductions) or an ‘Eco-tariff’
to reward customers who implement demand management measures.
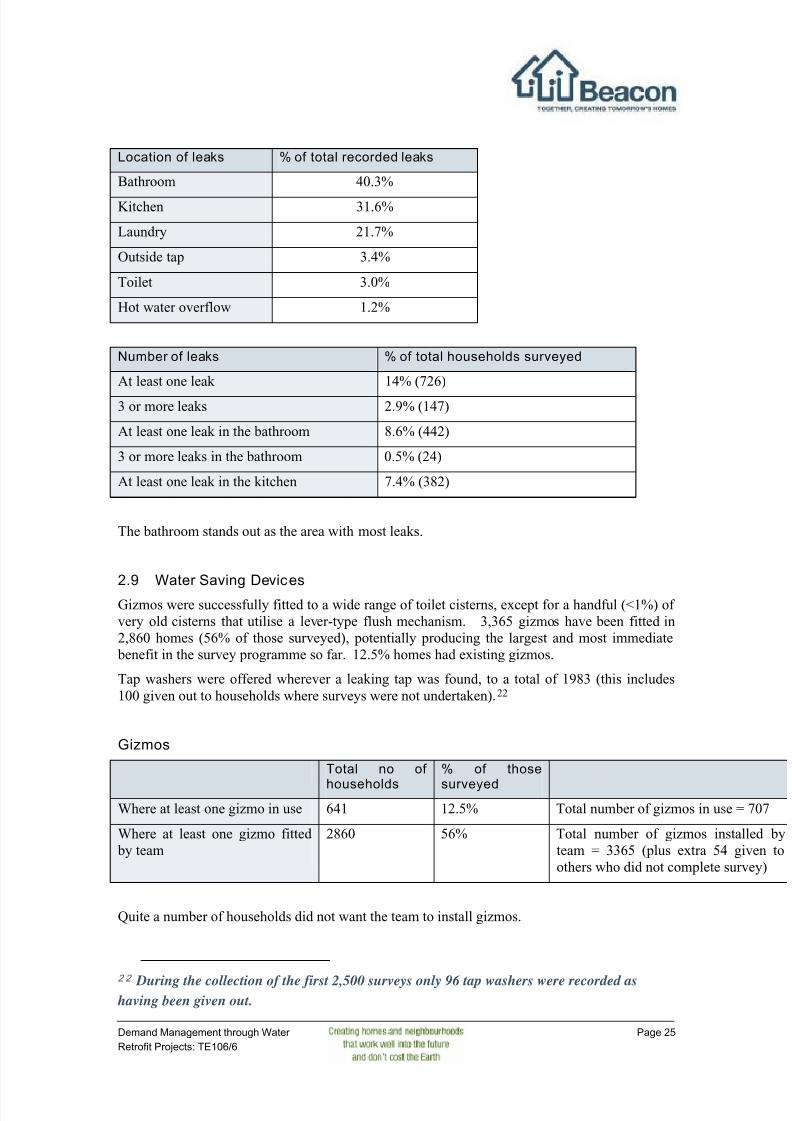
4.2 Waitakere’s Ecowise Water Survey13
The Ecowise Waitakere Water survey provides a representative sample of nearly 10% of all
Waitakere City householders’ water habits. Over 5000 surveys were collected between January2004 and July 2005 making this quite likely the most comprehensive survey of urban
households’ water use in the country.
According to the survey results, water use per capita in Waitakere is relatively low. Some 9.2%
of people used 300 litres or more pc/d while 19% used less than 100 litres. Six houses were
using over 900 litres pc/pd.
12 For further details about how these particular initiatives are able to reduce water
consumption at the household level readers are referred to Beacon paper TE160 “Water
Efficiencies – Report on Existing Technology/Expertise in New Zealand”.
13 A full copy of the survey is provided in Appendix 1.
7/25/2019 Public Report TE106(6) Demand Management Through Water Retrofit Projects
http://slidepdf.com/reader/full/public-report-te1066-demand-management-through-water-retrofit-projects 16/41
Demand Management through Water
Retrofit Projects: TE106/6
Page 13
Waitakere City Council sees other key findings as being:
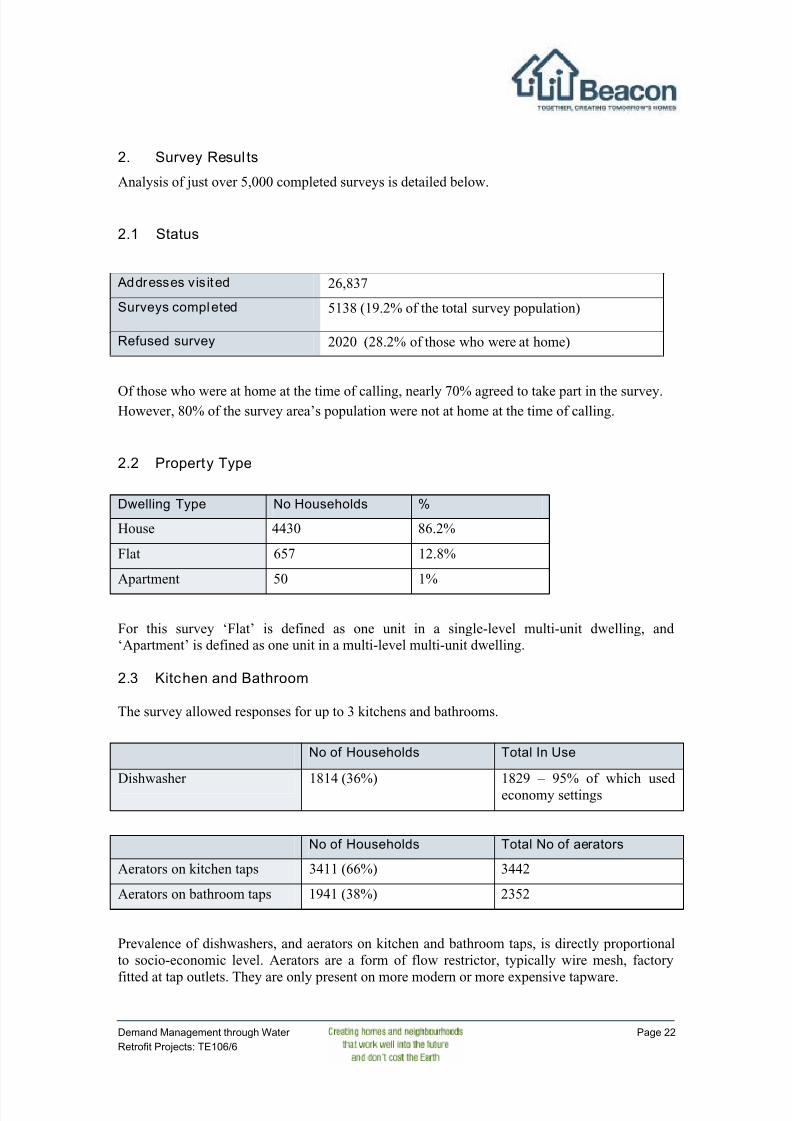
32% of houses surveyed have dishwashers
64% of houses surveyed have aerators (flow restrictors) on kitchen taps
1/3 of houses surveyed had gizmos still in use
Only 6% of houses surveyed used front load washing machines, with a perception that front
loaders (which are far more water efficient) are more expensive to purchase
There was a strong interest in rain tanks, mainly for garden watering purposes
1/2 of surveyed houses used some form of garden watering system
Publicity and awareness lacked in latter stages of the project – highlighting the need for
continued campaigns.
Housing New Zealand properties used 1/3 more water than the sample average (Housing
New Zealand pays water rates on all its properties).
Of those who were at home at the time of calling, nearly 70% agreed to take part in the survey.
However, 80% of the survey area’s population were not at home at the time of calling. As such
the survey largely reflects the behaviours of residents who are at home during the day; it is
possible water use patterns of those who are not at home during the day could differ. That said,
the survey still provides a relatively comprehensive and clear line in the sand for the Council. In
total 26,837 homes were visited with 5138 surveys completed (19.2% of the total survey
population).
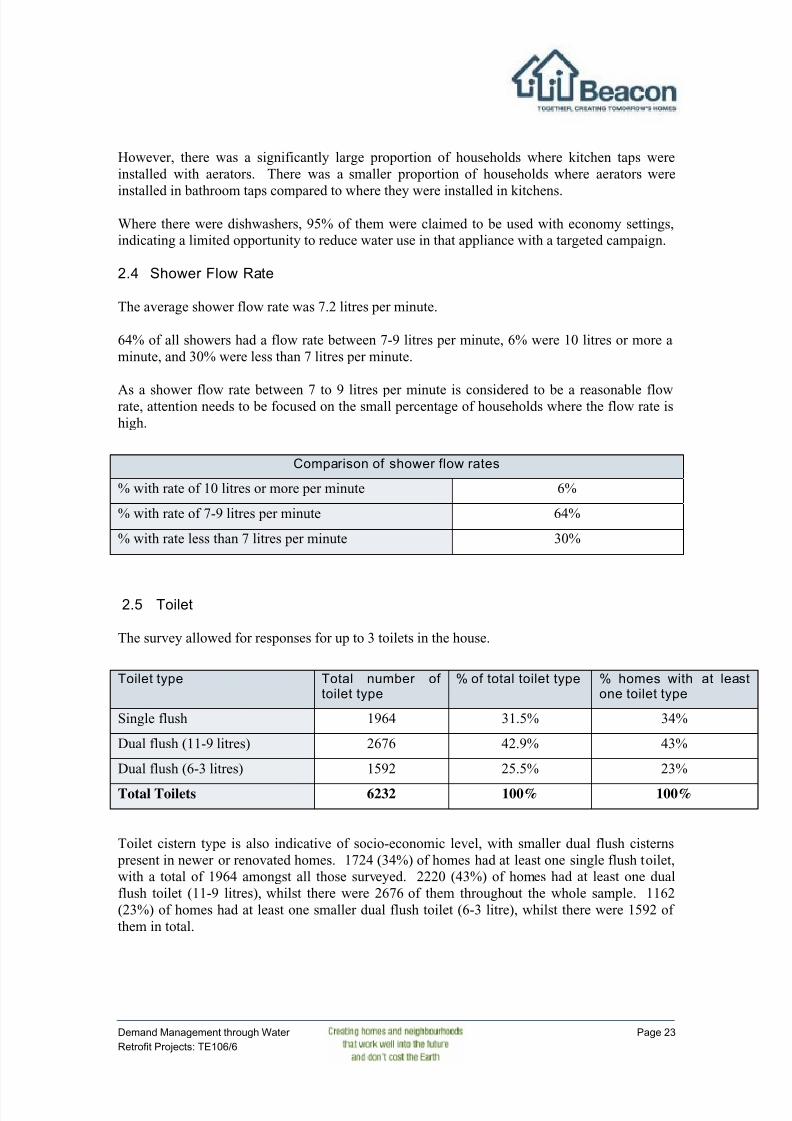
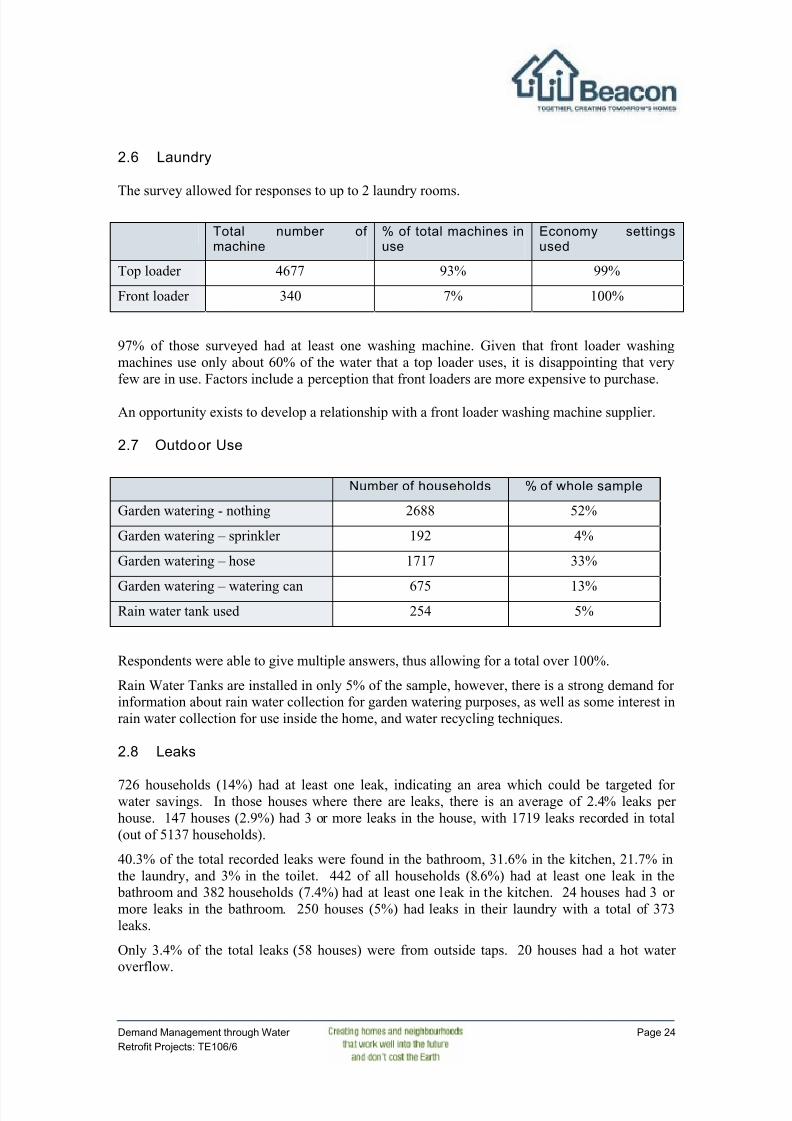
The survey also measured shower flow rates, toilet types and flush volumes, types of washing
machines being used and whether or not economy settings were used (yes in nearly 99% cases),
the types of outdoor uses, location and number of leaks (see Appendix 1).
4.3 Kapiti Distric t Council14
Kapiti District Council faces some particular water-use challenges. The combination of an
elderly population, sandy soil types, and a thriving gardening culture, has led to high daily water
use per capita of around 600l/c. The council has set a target of reducing the demand on
articulated supply down to 400l/c/pd. This figure allows for 250l/c for “essential” uses –
ordinary household water activities and drinking water - and 150l/pd for “non-essential” usessuch as gardening.
For residents in rural or lifestyle situations, a total water use limit of 1000 litres per household
per day has been set with the use of an outdoor rainwater tank mandatory. The use of grey water
is also encouraged and rebates are offered on water tanks where they are plumbed to at least two
indoor uses such as for washing machines or flushing toilets.
14 Information for this section of the report draws on personal communication and Kapiti
District Council’s strategic water document: “Water Matters – Kapiti Coast District
Sustainable Water Use Strategy”, 2003.
7/25/2019 Public Report TE106(6) Demand Management Through Water Retrofit Projects
http://slidepdf.com/reader/full/public-report-te1066-demand-management-through-water-retrofit-projects 17/41
Demand Management through Water
Retrofit Projects: TE106/6
Page 14
This target and other water use targets and strategies are outlined in the Council’s long-term
sustainable water use strategy, a document that takes a 50 year view and which identifies and
works with a principal assumption that water is a finite resource requiring a significant changein mindset if a reasonable standard of sustainable management is to be achieved.
The strategy identifies demand management as being the key component to its long-term water
management strategy:
“In effect, the key long term issue is that of demand management. The strategy takes the view
that the community’s role, via the Council, is to support basic water needs and some lifestyle
use – within the capacity of natural systems. This strategy therefore is built on the principle that
a key role for community investment in water management, is to reduce demand levels in high
consumption catchments.
“Supply will be secured within this framework of demand reduction. This is very different from
an approach that sees demand management and water conservation as an addition to the normal
focus on securing supply. The level of demand for which the community will take direct
responsibility, provides for basic needs and some lifestyle activities that have been a traditional
focus for some communities on the coast.”
The Council also intends to introduce individual house metering by 2008/09 along with water
use charges – however there are the associated political tensions and pressures related to
instigating such a policy which could as yet derail the proposal, especially in an election year.
The Council also allocates an annual budget of approx $70,000 to water conservation measures.
The principle expenditure item is the annual outdoor garden show which is sponsored by the
council. The show demonstrates garden plantings and techniques for reducing water use in dry
weather with a focus on water efficient plants, irrigation systems, and more economical garden
design that takes better account of climate factors such as dry periods.
Other initiatives include the provision of a council funded “green plumber”. The plumber visits
houses on request and will fix and replace leaky washers while providing water conservation
advice to households (the programme has seen approximately 5,000 homes visited to date). The
initiative has also seen roughly 3,500 gizmos fitted to toilet systems to date.
4.4 Tauranga City CouncilTauranga City Council runs two principal water conservation programmes. These are the
Schools Programme and the Waterline Programme.
The Schools Programme is an educative programme which consists of five 45 minute classes
that provide learning opportunities for students to consider water conservation measures that can
be employed around the house. Students are also given homework exercises relating to water
use such as measuring the flow rate for their shower at home.
The second programme, the Waterline Programme, includes a “green plumber” service which
includes a complimentary tap washer service and demonstration of how to change them. When
requested, the Council will also fit gizmos into toilet systems for free. To date the programme
has seen about 4000 gizmos fitted in 9 years into single flush toilets. One of the obstacles the

7/25/2019 Public Report TE106(6) Demand Management Through Water Retrofit Projects
http://slidepdf.com/reader/full/public-report-te1066-demand-management-through-water-retrofit-projects 18/41
7/25/2019 Public Report TE106(6) Demand Management Through Water Retrofit Projects
http://slidepdf.com/reader/full/public-report-te1066-demand-management-through-water-retrofit-projects 19/41
7/25/2019 Public Report TE106(6) Demand Management Through Water Retrofit Projects
http://slidepdf.com/reader/full/public-report-te1066-demand-management-through-water-retrofit-projects 20/41
7/25/2019 Public Report TE106(6) Demand Management Through Water Retrofit Projects
http://slidepdf.com/reader/full/public-report-te1066-demand-management-through-water-retrofit-projects 21/41
7/25/2019 Public Report TE106(6) Demand Management Through Water Retrofit Projects
http://slidepdf.com/reader/full/public-report-te1066-demand-management-through-water-retrofit-projects 22/41
7/25/2019 Public Report TE106(6) Demand Management Through Water Retrofit Projects
http://slidepdf.com/reader/full/public-report-te1066-demand-management-through-water-retrofit-projects 23/41
7/25/2019 Public Report TE106(6) Demand Management Through Water Retrofit Projects
http://slidepdf.com/reader/full/public-report-te1066-demand-management-through-water-retrofit-projects 24/41
7/25/2019 Public Report TE106(6) Demand Management Through Water Retrofit Projects
http://slidepdf.com/reader/full/public-report-te1066-demand-management-through-water-retrofit-projects 25/41
7/25/2019 Public Report TE106(6) Demand Management Through Water Retrofit Projects
http://slidepdf.com/reader/full/public-report-te1066-demand-management-through-water-retrofit-projects 26/41
7/25/2019 Public Report TE106(6) Demand Management Through Water Retrofit Projects
http://slidepdf.com/reader/full/public-report-te1066-demand-management-through-water-retrofit-projects 27/41
7/25/2019 Public Report TE106(6) Demand Management Through Water Retrofit Projects
http://slidepdf.com/reader/full/public-report-te1066-demand-management-through-water-retrofit-projects 28/41
7/25/2019 Public Report TE106(6) Demand Management Through Water Retrofit Projects
http://slidepdf.com/reader/full/public-report-te1066-demand-management-through-water-retrofit-projects 29/41
Demand Management through Water
Retrofit Projects: TE106/6
Page 26
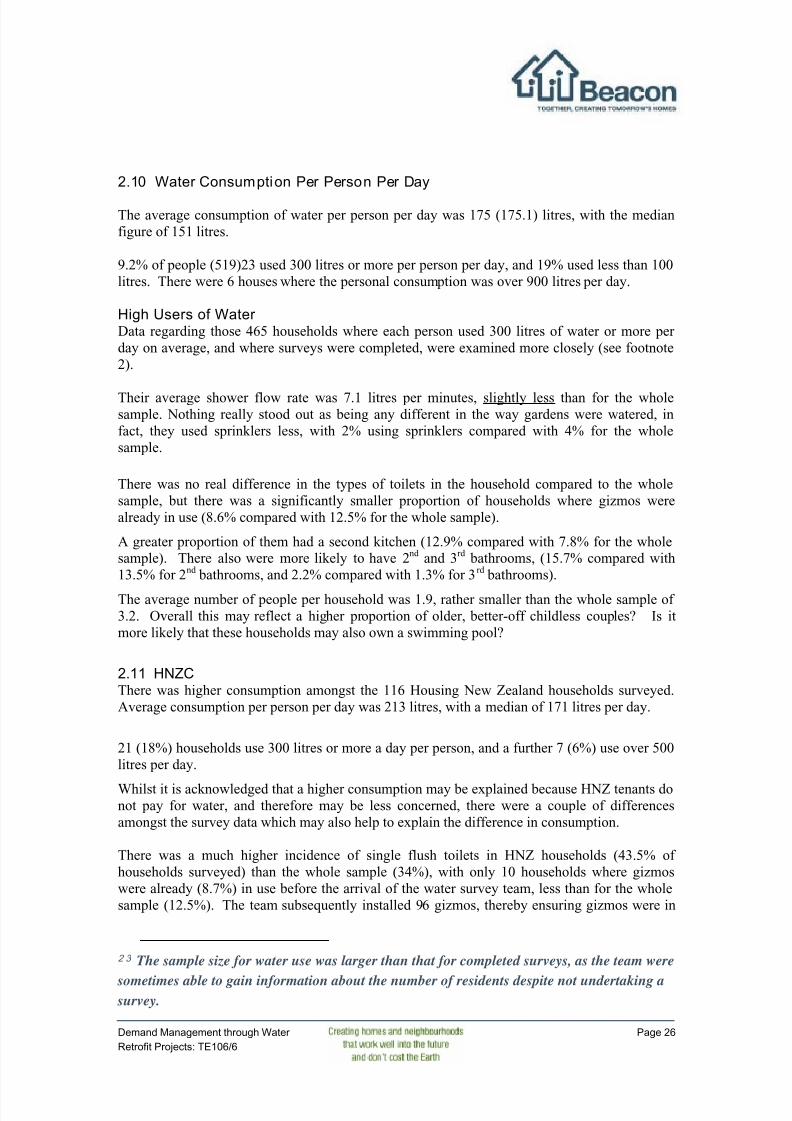
2.10 Water Consumption Per Person Per Day
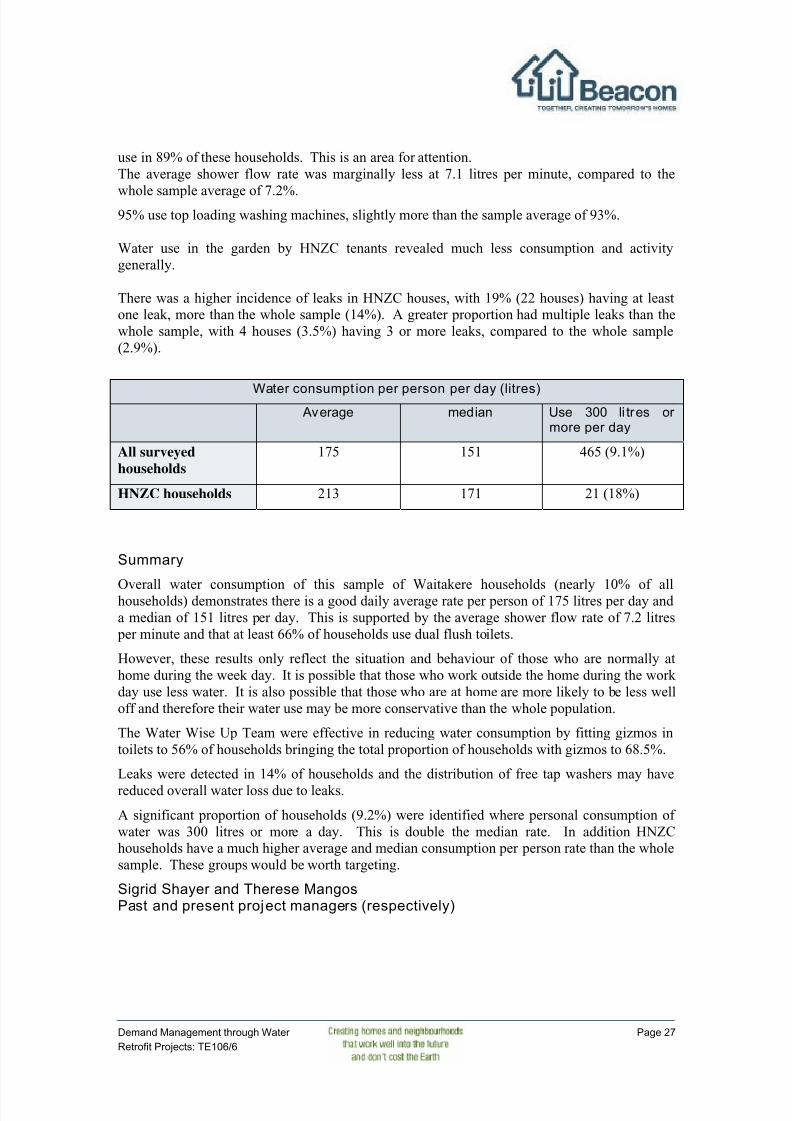
The average consumption of water per person per day was 175 (175.1) litres, with the medianfigure of 151 litres.
9.2% of people (519)23 used 300 litres or more per person per day, and 19% used less than 100litres. There were 6 houses where the personal consumption was over 900 litres per day.
High Users of WaterData regarding those 465 households where each person used 300 litres of water or more perday on average, and where surveys were completed, were examined more closely (see footnote2).
Their average shower flow rate was 7.1 litres per minutes, slightly less than for the wholesample. Nothing really stood out as being any different in the way gardens were watered, infact, they used sprinklers less, with 2% using sprinklers compared with 4% for the wholesample.
There was no real difference in the types of toilets in the household compared to the wholesample, but there was a significantly smaller proportion of households where gizmos werealready in use (8.6% compared with 12.5% for the whole sample).
A greater proportion of them had a second kitchen (12.9% compared with 7.8% for the wholesample). There also were more likely to have 2nd and 3rd bathrooms, (15.7% compared with13.5% for 2nd bathrooms, and 2.2% compared with 1.3% for 3rd bathrooms).
The average number of people per household was 1.9, rather smaller than the whole sample of3.2. Overall this may reflect a higher proportion of older, better-off childless couples? Is itmore likely that these households may also own a swimming pool?
2.11 HNZC There was higher consumption amongst the 116 Housing New Zealand households surveyed.Average consumption per person per day was 213 litres, with a median of 171 litres per day.
21 (18%) households use 300 litres or more a day per person, and a further 7 (6%) use over 500litres per day.
Whilst it is acknowledged that a higher consumption may be explained because HNZ tenants donot pay for water, and therefore may be less concerned, there were a couple of differencesamongst the survey data which may also help to explain the difference in consumption.
There was a much higher incidence of single flush toilets in HNZ households (43.5% ofhouseholds surveyed) than the whole sample (34%), with only 10 households where gizmoswere already (8.7%) in use before the arrival of the water survey team, less than for the wholesample (12.5%). The team subsequently installed 96 gizmos, thereby ensuring gizmos were in
2 3 The sample size for water use was larger than that for completed surveys, as the team were
sometimes able to gain information about the number of residents despite not undertaking a
survey.
7/25/2019 Public Report TE106(6) Demand Management Through Water Retrofit Projects
http://slidepdf.com/reader/full/public-report-te1066-demand-management-through-water-retrofit-projects 30/41

7/25/2019 Public Report TE106(6) Demand Management Through Water Retrofit Projects
http://slidepdf.com/reader/full/public-report-te1066-demand-management-through-water-retrofit-projects 31/41
7/25/2019 Public Report TE106(6) Demand Management Through Water Retrofit Projects
http://slidepdf.com/reader/full/public-report-te1066-demand-management-through-water-retrofit-projects 32/41

7/25/2019 Public Report TE106(6) Demand Management Through Water Retrofit Projects
http://slidepdf.com/reader/full/public-report-te1066-demand-management-through-water-retrofit-projects 33/41
7/25/2019 Public Report TE106(6) Demand Management Through Water Retrofit Projects
http://slidepdf.com/reader/full/public-report-te1066-demand-management-through-water-retrofit-projects 34/41
7/25/2019 Public Report TE106(6) Demand Management Through Water Retrofit Projects
http://slidepdf.com/reader/full/public-report-te1066-demand-management-through-water-retrofit-projects 35/41
7/25/2019 Public Report TE106(6) Demand Management Through Water Retrofit Projects
http://slidepdf.com/reader/full/public-report-te1066-demand-management-through-water-retrofit-projects 36/41
7/25/2019 Public Report TE106(6) Demand Management Through Water Retrofit Projects
http://slidepdf.com/reader/full/public-report-te1066-demand-management-through-water-retrofit-projects 37/41
7/25/2019 Public Report TE106(6) Demand Management Through Water Retrofit Projects
http://slidepdf.com/reader/full/public-report-te1066-demand-management-through-water-retrofit-projects 38/41
7/25/2019 Public Report TE106(6) Demand Management Through Water Retrofit Projects
http://slidepdf.com/reader/full/public-report-te1066-demand-management-through-water-retrofit-projects 39/41
7/25/2019 Public Report TE106(6) Demand Management Through Water Retrofit Projects
http://slidepdf.com/reader/full/public-report-te1066-demand-management-through-water-retrofit-projects 40/41

7/25/2019 Public Report TE106(6) Demand Management Through Water Retrofit Projects
http://slidepdf.com/reader/full/public-report-te1066-demand-management-through-water-retrofit-projects 41/41
APPENDIX 6: Water Savings from Seattle
Growth in Population and Water ConsumptionSeattle Regional Water System: 1975-2005
0
100,000
200,000
300,000
400,000
500,000
600,000
700,000
800,000
900,000
1,000,000
1,100,000
1,200,000
1,300,000
1,400,000
1 9
7 5
1 9
7 7
1 9
7 9
1 9
8 1
1 9
8 3
1 9
8 5
1 9
8 7
1 9
8 9
1 9
9 1
1 9
9 3
1 9
9 5
1 9
9 7
1 9
9 9
2 0
0 1
2 0
0 3
2 0
0 5
0
20
40
60
80
100
120
140
160
180
200
220
240
260
280
Non-Revenue
Billed Consumption
Total Consumption
Population
P o p u l a t i o n
C o n s u m p t i o n i n M i l l i o n s o f G a l l o n s p e r D a y
( A n n u a l A v e r a g e
)
Whil