public school district total cohort graduation rate and enrollment outcome summary - 2008-09 by...
TRANSCRIPT
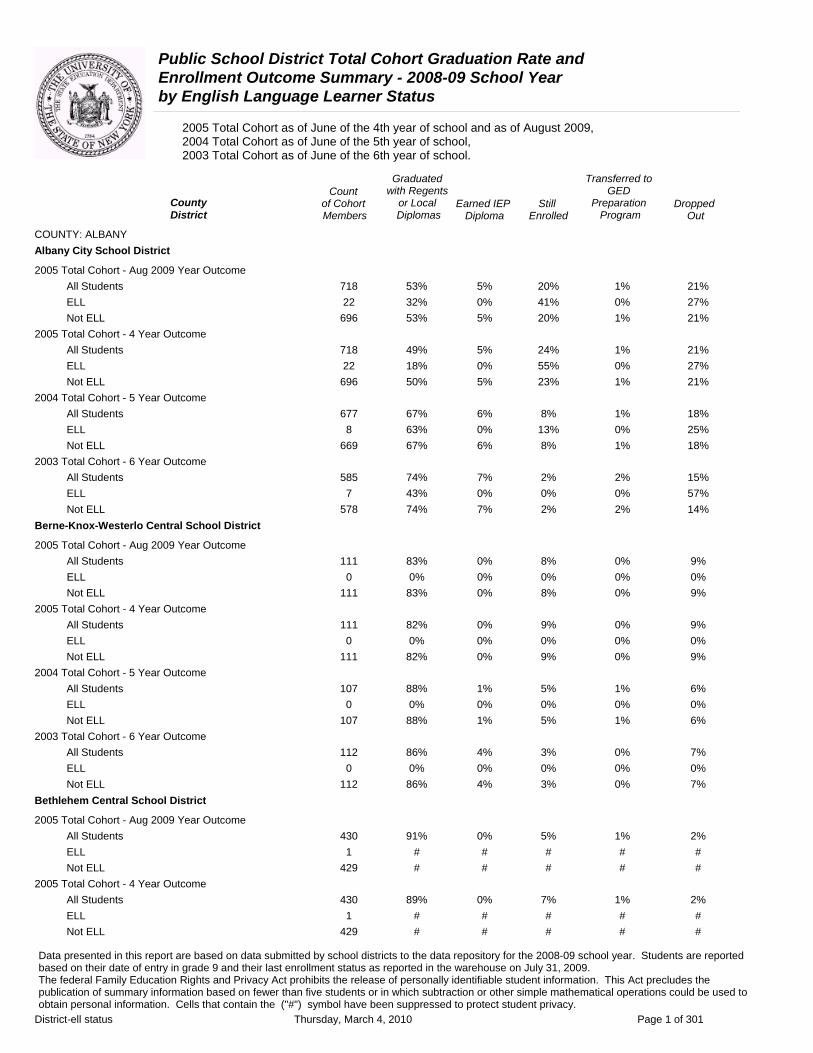
Public School District Total Cohort Graduation Rate and Enrollment Outcome Summary - 2008-09 School Year by English Language Learner Status
2005 Total Cohort as of June of the 4th year of school and as of August 2009, 2004 Total Cohort as of June of the 5th year of school, 2003 Total Cohort as of June of the 6th year of school.
Graduated Transferred to Count with Regents GED
County District
of Cohort Members
or Local Diplomas
Earned IEP Diploma
Still Enrolled
Preparation Program
Dropped Out
COUNTY: ALBANY Albany City School District
2005 Total Cohort - Aug 2009 Year Outcome All Students 718 53% 5% 20% 1% 21% ELL 22 32% 0% 41% 0% 27% Not ELL 696 53% 5% 20% 1% 21%
2005 Total Cohort - 4 Year Outcome All Students 718 49% 5% 24% 1% 21% ELL 22 18% 0% 55% 0% 27% Not ELL 696 50% 5% 23% 1% 21%
2004 Total Cohort - 5 Year Outcome All Students 677 67% 6% 8% 1% 18% ELL 8 63% 0% 13% 0% 25% Not ELL 669 67% 6% 8% 1% 18%
2003 Total Cohort - 6 Year Outcome All Students 585 74% 7% 2% 2% 15% ELL 7 43% 0% 0% 0% 57% Not ELL 578 74% 7% 2% 2% 14%
Berne-Knox-Westerlo Central School District
2005 Total Cohort - Aug 2009 Year Outcome All Students 111 83% 0% 8% 0% 9% ELL 0 0% 0% 0% 0% 0% Not ELL 111 83% 0% 8% 0% 9%
2005 Total Cohort - 4 Year Outcome All Students 111 82% 0% 9% 0% 9% ELL 0 0% 0% 0% 0% 0% Not ELL 111 82% 0% 9% 0% 9%
2004 Total Cohort - 5 Year Outcome All Students 107 88% 1% 5% 1% 6% ELL 0 0% 0% 0% 0% 0% Not ELL 107 88% 1% 5% 1% 6%
2003 Total Cohort - 6 Year Outcome All Students 112 86% 4% 3% 0% 7% ELL 0 0% 0% 0% 0% 0% Not ELL 112 86% 4% 3% 0% 7%
Bethlehem Central School District
2005 Total Cohort - Aug 2009 Year Outcome All Students 430 91% 0% 5% 1% 2% ELL 1 # # # # # Not ELL 429 # # # # #
2005 Total Cohort - 4 Year Outcome All Students 430 89% 0% 7% 1% 2% ELL 1 # # # # # Not ELL 429 # # # # #
Data presented in this report are based on data submitted by school districts to the data repository for the 2008-09 school year. Students are reported based on their date of entry in grade 9 and their last enrollment status as reported in the warehouse on July 31, 2009. The federal Family Education Rights and Privacy Act prohibits the release of personally identifiable student information. This Act precludes the publication of summary information based on fewer than five students or in which subtraction or other simple mathematical operations could be used to obtain personal information. Cells that contain the ("#") symbol have been suppressed to protect student privacy.
District-ell status Thursday, March 4, 2010 Page 1 of 301
Public School District Total Cohort Graduation Rate and Enrollment Outcome Summary - 2008-09 School Year by English Language Learner Status
2005 Total Cohort as of June of the 4th year of school and as of August 2009, 2004 Total Cohort as of June of the 5th year of school, 2003 Total Cohort as of June of the 6th year of school.
Graduated Transferred to Count with Regents GED
County District
of Cohort Members
or Local Diplomas
Earned IEP Diploma
Still Enrolled
Preparation Program
Dropped Out
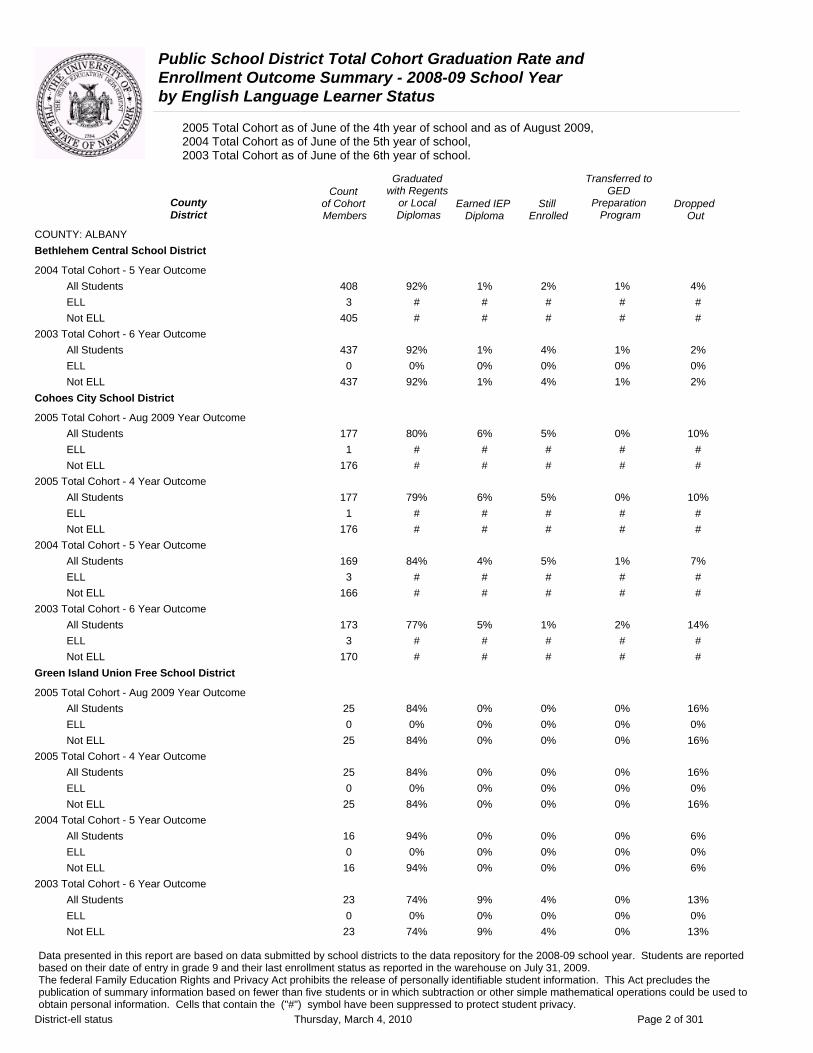
COUNTY: ALBANY Bethlehem Central School District
2004 Total Cohort - 5 Year Outcome All Students 408 92% 1% 2% 1% 4% ELL 3 # # # # # Not ELL 405 # # # # #
2003 Total Cohort - 6 Year Outcome All Students 437 92% 1% 4% 1% 2% ELL 0 0% 0% 0% 0% 0% Not ELL 437 92% 1% 4% 1% 2%
Cohoes City School District
2005 Total Cohort - Aug 2009 Year Outcome All Students 177 80% 6% 5% 0% 10% ELL 1 # # # # # Not ELL 176 # # # # #
2005 Total Cohort - 4 Year Outcome All Students 177 79% 6% 5% 0% 10% ELL 1 # # # # # Not ELL 176 # # # # #
2004 Total Cohort - 5 Year Outcome All Students 169 84% 4% 5% 1% 7% ELL 3 # # # # # Not ELL 166 # # # # #
2003 Total Cohort - 6 Year Outcome All Students 173 77% 5% 1% 2% 14% ELL 3 # # # # # Not ELL 170 # # # # #
Green Island Union Free School District
2005 Total Cohort - Aug 2009 Year Outcome All Students 25 84% 0% 0% 0% 16% ELL 0 0% 0% 0% 0% 0% Not ELL 25 84% 0% 0% 0% 16%
2005 Total Cohort - 4 Year Outcome All Students 25 84% 0% 0% 0% 16% ELL 0 0% 0% 0% 0% 0% Not ELL 25 84% 0% 0% 0% 16%
2004 Total Cohort - 5 Year Outcome All Students 16 94% 0% 0% 0% 6% ELL 0 0% 0% 0% 0% 0% Not ELL 16 94% 0% 0% 0% 6%
2003 Total Cohort - 6 Year Outcome All Students 23 74% 9% 4% 0% 13% ELL 0 0% 0% 0% 0% 0% Not ELL 23 74% 9% 4% 0% 13%
Data presented in this report are based on data submitted by school districts to the data repository for the 2008-09 school year. Students are reported based on their date of entry in grade 9 and their last enrollment status as reported in the warehouse on July 31, 2009. The federal Family Education Rights and Privacy Act prohibits the release of personally identifiable student information. This Act precludes the publication of summary information based on fewer than five students or in which subtraction or other simple mathematical operations could be used to obtain personal information. Cells that contain the ("#") symbol have been suppressed to protect student privacy.
District-ell status Thursday, March 4, 2010 Page 2 of 301
Public School District Total Cohort Graduation Rate and Enrollment Outcome Summary - 2008-09 School Year by English Language Learner Status
2005 Total Cohort as of June of the 4th year of school and as of August 2009, 2004 Total Cohort as of June of the 5th year of school, 2003 Total Cohort as of June of the 6th year of school.
Graduated Transferred to Count with Regents GED
County of Cohort or Local Earned IEP Still Preparation DroppedDistrict Members Diplomas Diploma Enrolled Program Out
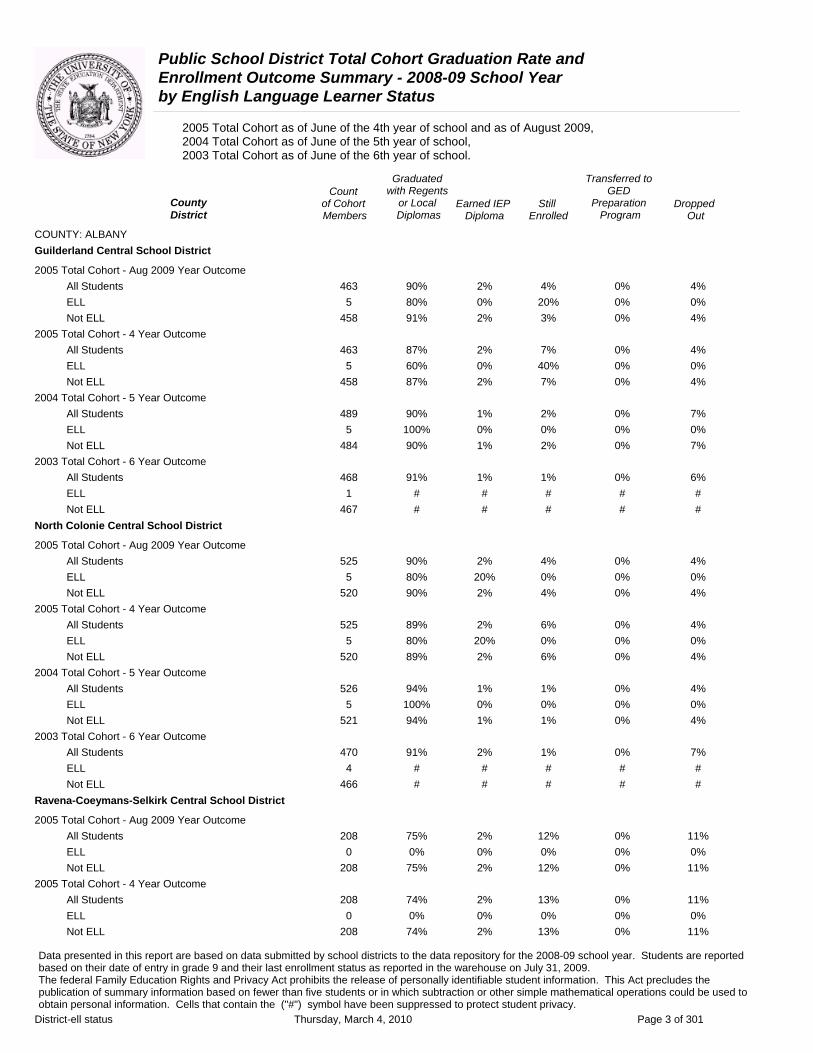
COUNTY: ALBANY Guilderland Central School District
2005 Total Cohort - Aug 2009 Year Outcome All Students 463 90% 2% 4% 0% 4% ELL 5 80% 0% 20% 0% 0% Not ELL 458 91% 2% 3% 0% 4%
2005 Total Cohort - 4 Year Outcome All Students 463 87% 2% 7% 0% 4% ELL 5 60% 0% 40% 0% 0% Not ELL 458 87% 2% 7% 0% 4%
2004 Total Cohort - 5 Year Outcome All Students 489 90% 1% 2% 0% 7% ELL 5 100% 0% 0% 0% 0% Not ELL 484 90% 1% 2% 0% 7%
2003 Total Cohort - 6 Year Outcome All Students 468 91% 1% 1% 0% 6% ELL 1 # # # # # Not ELL 467 # # # # #
North Colonie Central School District
2005 Total Cohort - Aug 2009 Year Outcome All Students 525 90% 2% 4% 0% 4% ELL 5 80% 20% 0% 0% 0% Not ELL 520 90% 2% 4% 0% 4%
2005 Total Cohort - 4 Year Outcome All Students 525 89% 2% 6% 0% 4% ELL 5 80% 20% 0% 0% 0% Not ELL 520 89% 2% 6% 0% 4%
2004 Total Cohort - 5 Year Outcome All Students 526 94% 1% 1% 0% 4% ELL 5 100% 0% 0% 0% 0% Not ELL 521 94% 1% 1% 0% 4%
2003 Total Cohort - 6 Year Outcome All Students 470 91% 2% 1% 0% 7% ELL 4 # # # # # Not ELL 466 # # # # #
Ravena-Coeymans-Selkirk Central School District
2005 Total Cohort - Aug 2009 Year Outcome All Students 208 75% 2% 12% 0% 11% ELL 0 0% 0% 0% 0% 0% Not ELL 208 75% 2% 12% 0% 11%
2005 Total Cohort - 4 Year Outcome All Students 208 74% 2% 13% 0% 11% ELL 0 0% 0% 0% 0% 0% Not ELL 208 74% 2% 13% 0% 11%
Data presented in this report are based on data submitted by school districts to the data repository for the 2008-09 school year. Students are reported based on their date of entry in grade 9 and their last enrollment status as reported in the warehouse on July 31, 2009. The federal Family Education Rights and Privacy Act prohibits the release of personally identifiable student information. This Act precludes the publication of summary information based on fewer than five students or in which subtraction or other simple mathematical operations could be used to obtain personal information. Cells that contain the ("#") symbol have been suppressed to protect student privacy.
District-ell status Thursday, March 4, 2010 Page 3 of 301
Public School District Total Cohort Graduation Rate and Enrollment Outcome Summary - 2008-09 School Year by English Language Learner Status
2005 Total Cohort as of June of the 4th year of school and as of August 2009, 2004 Total Cohort as of June of the 5th year of school, 2003 Total Cohort as of June of the 6th year of school.
Graduated Transferred to Count with Regents GED
County of Cohort or Local Earned IEP Still Preparation DroppedDistrict Members Diplomas Diploma Enrolled Program Out
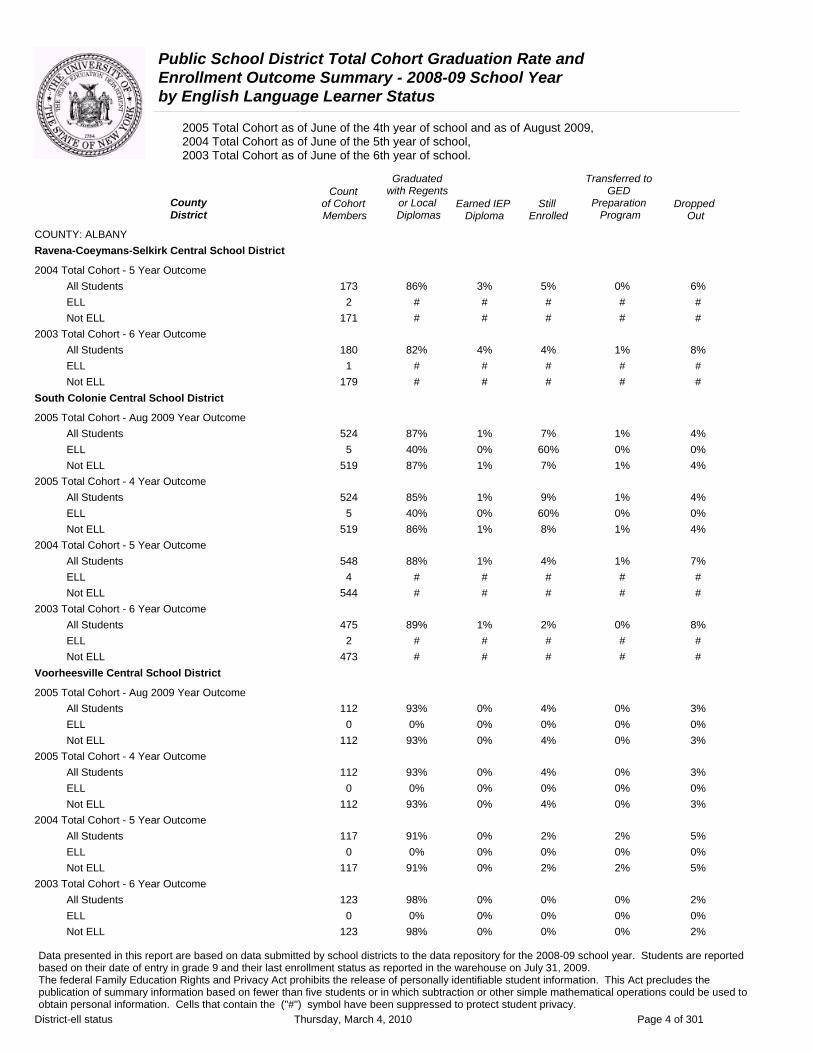
COUNTY: ALBANY Ravena-Coeymans-Selkirk Central School District
2004 Total Cohort - 5 Year Outcome All Students 173 86% 3% 5% 0% 6% ELL 2 # # # # # Not ELL 171 # # # # #
2003 Total Cohort - 6 Year Outcome All Students 180 82% 4% 4% 1% 8% ELL 1 # # # # # Not ELL 179 # # # # #
South Colonie Central School District
2005 Total Cohort - Aug 2009 Year Outcome All Students 524 87% 1% 7% 1% 4% ELL 5 40% 0% 60% 0% 0% Not ELL 519 87% 1% 7% 1% 4%
2005 Total Cohort - 4 Year Outcome All Students 524 85% 1% 9% 1% 4% ELL 5 40% 0% 60% 0% 0% Not ELL 519 86% 1% 8% 1% 4%
2004 Total Cohort - 5 Year Outcome All Students 548 88% 1% 4% 1% 7% ELL 4 # # # # # Not ELL 544 # # # # #
2003 Total Cohort - 6 Year Outcome All Students 475 89% 1% 2% 0% 8% ELL 2 # # # # # Not ELL 473 # # # # #
Voorheesville Central School District
2005 Total Cohort - Aug 2009 Year Outcome All Students 112 93% 0% 4% 0% 3% ELL 0 0% 0% 0% 0% 0% Not ELL 112 93% 0% 4% 0% 3%
2005 Total Cohort - 4 Year Outcome All Students 112 93% 0% 4% 0% 3% ELL 0 0% 0% 0% 0% 0% Not ELL 112 93% 0% 4% 0% 3%
2004 Total Cohort - 5 Year Outcome All Students 117 91% 0% 2% 2% 5% ELL 0 0% 0% 0% 0% 0% Not ELL 117 91% 0% 2% 2% 5%
2003 Total Cohort - 6 Year Outcome All Students 123 98% 0% 0% 0% 2% ELL 0 0% 0% 0% 0% 0% Not ELL 123 98% 0% 0% 0% 2%
Data presented in this report are based on data submitted by school districts to the data repository for the 2008-09 school year. Students are reported based on their date of entry in grade 9 and their last enrollment status as reported in the warehouse on July 31, 2009. The federal Family Education Rights and Privacy Act prohibits the release of personally identifiable student information. This Act precludes the publication of summary information based on fewer than five students or in which subtraction or other simple mathematical operations could be used to obtain personal information. Cells that contain the ("#") symbol have been suppressed to protect student privacy.
District-ell status Thursday, March 4, 2010 Page 4 of 301
Public School District Total Cohort Graduation Rate and Enrollment Outcome Summary - 2008-09 School Year by English Language Learner Status
2005 Total Cohort as of June of the 4th year of school and as of August 2009, 2004 Total Cohort as of June of the 5th year of school, 2003 Total Cohort as of June of the 6th year of school.
Graduated Transferred to Count with Regents GED
County of Cohort or Local Earned IEP Still Preparation DroppedDistrict Members Diplomas Diploma Enrolled Program Out
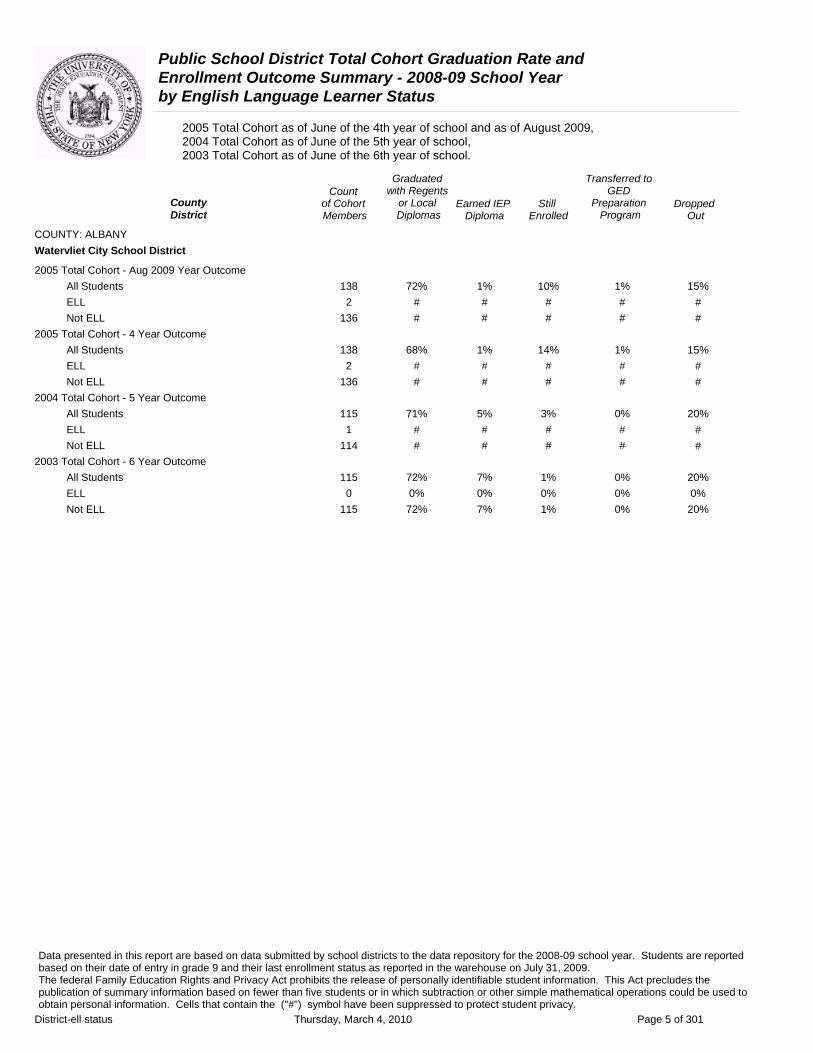
COUNTY: ALBANY Watervliet City School District
2005 Total Cohort - Aug 2009 Year Outcome All Students 138 72% 1% 10% 1% 15% ELL 2 # # # # # Not ELL 136 # # # # #
2005 Total Cohort - 4 Year Outcome All Students 138 68% 1% 14% 1% 15% ELL 2 # # # # # Not ELL 136 # # # # #
2004 Total Cohort - 5 Year Outcome All Students 115 71% 5% 3% 0% 20% ELL 1 # # # # # Not ELL 114 # # # # #
2003 Total Cohort - 6 Year Outcome All Students 115 72% 7% 1% 0% 20% ELL 0 0% 0% 0% 0% 0% Not ELL 115 72% 7% 1% 0% 20%
Data presented in this report are based on data submitted by school districts to the data repository for the 2008-09 school year. Students are reported based on their date of entry in grade 9 and their last enrollment status as reported in the warehouse on July 31, 2009. The federal Family Education Rights and Privacy Act prohibits the release of personally identifiable student information. This Act precludes the publication of summary information based on fewer than five students or in which subtraction or other simple mathematical operations could be used to obtain personal information. Cells that contain the ("#") symbol have been suppressed to protect student privacy.
District-ell status Thursday, March 4, 2010 Page 5 of 301

Public School District Total Cohort Graduation Rate and Enrollment Outcome Summary - 2008-09 School Year by English Language Learner Status
2005 Total Cohort as of June of the 4th year of school and as of August 2009, 2004 Total Cohort as of June of the 5th year of school, 2003 Total Cohort as of June of the 6th year of school.
Graduated Transferred to Count with Regents GED
County of Cohort or Local Earned IEP Still Preparation DroppedDistrict Members Diplomas Diploma Enrolled Program Out
COUNTY: ALLEGANY Alfred-Almond Central School District
2005 Total Cohort - Aug 2009 Year Outcome All Students 63 89% 2% 5% 0% 5% ELL 0 0% 0% 0% 0% 0% Not ELL 63 89% 2% 5% 0% 5%
2005 Total Cohort - 4 Year Outcome All Students 63 89% 2% 5% 0% 5% ELL 0 0% 0% 0% 0% 0% Not ELL 63 89% 2% 5% 0% 5%
2004 Total Cohort - 5 Year Outcome All Students 55 91% 2% 4% 0% 4% ELL 0 0% 0% 0% 0% 0% Not ELL 55 91% 2% 4% 0% 4%
2003 Total Cohort - 6 Year Outcome All Students 56 91% 2% 0% 0% 7% ELL 0 0% 0% 0% 0% 0% Not ELL 56 91% 2% 0% 0% 7%
Andover Central School District
2005 Total Cohort - Aug 2009 Year Outcome All Students 40 88% 3% 8% 0% 3% ELL 0 0% 0% 0% 0% 0% Not ELL 40 88% 3% 8% 0% 3%
2005 Total Cohort - 4 Year Outcome All Students 40 85% 3% 10% 0% 3% ELL 0 0% 0% 0% 0% 0% Not ELL 40 85% 3% 10% 0% 3%
2004 Total Cohort - 5 Year Outcome All Students 30 90% 0% 3% 0% 7% ELL 0 0% 0% 0% 0% 0% Not ELL 30 90% 0% 3% 0% 7%
2003 Total Cohort - 6 Year Outcome All Students 37 84% 5% 3% 3% 5% ELL 0 0% 0% 0% 0% 0% Not ELL 37 84% 5% 3% 3% 5%
Belfast Central School District
2005 Total Cohort - Aug 2009 Year Outcome All Students 41 95% 2% 0% 0% 2% ELL 0 0% 0% 0% 0% 0% Not ELL 41 95% 2% 0% 0% 2%
2005 Total Cohort - 4 Year Outcome All Students 41 95% 2% 0% 0% 2% ELL 0 0% 0% 0% 0% 0% Not ELL 41 95% 2% 0% 0% 2%
Data presented in this report are based on data submitted by school districts to the data repository for the 2008-09 school year. Students are reported based on their date of entry in grade 9 and their last enrollment status as reported in the warehouse on July 31, 2009. The federal Family Education Rights and Privacy Act prohibits the release of personally identifiable student information. This Act precludes the publication of summary information based on fewer than five students or in which subtraction or other simple mathematical operations could be used to obtain personal information. Cells that contain the ("#") symbol have been suppressed to protect student privacy.
District-ell status Thursday, March 4, 2010 Page 6 of 301

Public School District Total Cohort Graduation Rate and Enrollment Outcome Summary - 2008-09 School Year by English Language Learner Status
2005 Total Cohort as of June of the 4th year of school and as of August 2009, 2004 Total Cohort as of June of the 5th year of school, 2003 Total Cohort as of June of the 6th year of school.
Graduated Transferred to Count with Regents GED
County of Cohort or Local Earned IEP Still Preparation DroppedDistrict Members Diplomas Diploma Enrolled Program Out
COUNTY: ALLEGANY Belfast Central School District
2004 Total Cohort - 5 Year Outcome All Students 34 82% 0% 9% 3% 6% ELL 0 0% 0% 0% 0% 0% Not ELL 34 82% 0% 9% 3% 6%
2003 Total Cohort - 6 Year Outcome All Students 35 91% 0% 0% 6% 3% ELL 0 0% 0% 0% 0% 0% Not ELL 35 91% 0% 0% 6% 3%
Bolivar-Richburg Central School District
2005 Total Cohort - Aug 2009 Year Outcome All Students 53 87% 2% 4% 2% 6% ELL 0 0% 0% 0% 0% 0% Not ELL 53 87% 2% 4% 2% 6%
2005 Total Cohort - 4 Year Outcome All Students 53 87% 2% 4% 2% 6% ELL 0 0% 0% 0% 0% 0% Not ELL 53 87% 2% 4% 2% 6%
2004 Total Cohort - 5 Year Outcome All Students 79 86% 5% 1% 0% 8% ELL 0 0% 0% 0% 0% 0% Not ELL 79 86% 5% 1% 0% 8%
2003 Total Cohort - 6 Year Outcome All Students 74 85% 4% 0% 1% 9% ELL 0 0% 0% 0% 0% 0% Not ELL 74 85% 4% 0% 1% 9%
Canaseraga Central School District
2005 Total Cohort - Aug 2009 Year Outcome All Students 23 78% 0% 9% 0% 13% ELL 0 0% 0% 0% 0% 0% Not ELL 23 78% 0% 9% 0% 13%
2005 Total Cohort - 4 Year Outcome All Students 23 78% 0% 9% 0% 13% ELL 0 0% 0% 0% 0% 0% Not ELL 23 78% 0% 9% 0% 13%
2004 Total Cohort - 5 Year Outcome All Students 27 89% 7% 0% 0% 4% ELL 0 0% 0% 0% 0% 0% Not ELL 27 89% 7% 0% 0% 4%
2003 Total Cohort - 6 Year Outcome All Students 27 93% 0% 0% 0% 7% ELL 0 0% 0% 0% 0% 0% Not ELL 27 93% 0% 0% 0% 7%
Data presented in this report are based on data submitted by school districts to the data repository for the 2008-09 school year. Students are reported based on their date of entry in grade 9 and their last enrollment status as reported in the warehouse on July 31, 2009. The federal Family Education Rights and Privacy Act prohibits the release of personally identifiable student information. This Act precludes the publication of summary information based on fewer than five students or in which subtraction or other simple mathematical operations could be used to obtain personal information. Cells that contain the ("#") symbol have been suppressed to protect student privacy.
District-ell status Thursday, March 4, 2010 Page 7 of 301

Public School District Total Cohort Graduation Rate and Enrollment Outcome Summary - 2008-09 School Year by English Language Learner Status
2005 Total Cohort as of June of the 4th year of school and as of August 2009, 2004 Total Cohort as of June of the 5th year of school, 2003 Total Cohort as of June of the 6th year of school.
Graduated Transferred to Count with Regents GED
County of Cohort or Local Earned IEP Still Preparation DroppedDistrict Members Diplomas Diploma Enrolled Program Out
COUNTY: ALLEGANY Cuba-Rushford Central School District
2005 Total Cohort - Aug 2009 Year Outcome All Students 98 78% 2% 10% 0% 10% ELL 0 0% 0% 0% 0% 0% Not ELL 98 78% 2% 10% 0% 10%
2005 Total Cohort - 4 Year Outcome All Students 98 78% 2% 10% 0% 10% ELL 0 0% 0% 0% 0% 0% Not ELL 98 78% 2% 10% 0% 10%
2004 Total Cohort - 5 Year Outcome All Students 96 81% 4% 3% 1% 10% ELL 0 0% 0% 0% 0% 0% Not ELL 96 81% 4% 3% 1% 10%
2003 Total Cohort - 6 Year Outcome All Students 86 85% 6% 2% 0% 7% ELL 0 0% 0% 0% 0% 0% Not ELL 86 85% 6% 2% 0% 7%
Fillmore Central School District
2005 Total Cohort - Aug 2009 Year Outcome All Students 52 96% 2% 0% 0% 2% ELL 0 0% 0% 0% 0% 0% Not ELL 52 96% 2% 0% 0% 2%
2005 Total Cohort - 4 Year Outcome All Students 52 96% 2% 0% 0% 2% ELL 0 0% 0% 0% 0% 0% Not ELL 52 96% 2% 0% 0% 2%
2004 Total Cohort - 5 Year Outcome All Students 57 77% 7% 9% 0% 7% ELL 0 0% 0% 0% 0% 0% Not ELL 57 77% 7% 9% 0% 7%
2003 Total Cohort - 6 Year Outcome All Students 54 85% 6% 2% 6% 2% ELL 0 0% 0% 0% 0% 0% Not ELL 54 85% 6% 2% 6% 2%
Friendship Central School District
2005 Total Cohort - Aug 2009 Year Outcome All Students 30 70% 17% 0% 0% 13% ELL 0 0% 0% 0% 0% 0% Not ELL 30 70% 17% 0% 0% 13%
2005 Total Cohort - 4 Year Outcome All Students 30 67% 17% 3% 0% 13% ELL 0 0% 0% 0% 0% 0% Not ELL 30 67% 17% 3% 0% 13%
Data presented in this report are based on data submitted by school districts to the data repository for the 2008-09 school year. Students are reported based on their date of entry in grade 9 and their last enrollment status as reported in the warehouse on July 31, 2009. The federal Family Education Rights and Privacy Act prohibits the release of personally identifiable student information. This Act precludes the publication of summary information based on fewer than five students or in which subtraction or other simple mathematical operations could be used to obtain personal information. Cells that contain the ("#") symbol have been suppressed to protect student privacy.
District-ell status Thursday, March 4, 2010 Page 8 of 301
Public School District Total Cohort Graduation Rate and Enrollment Outcome Summary - 2008-09 School Year by English Language Learner Status
2005 Total Cohort as of June of the 4th year of school and as of August 2009, 2004 Total Cohort as of June of the 5th year of school, 2003 Total Cohort as of June of the 6th year of school.
Graduated Transferred to Count with Regents GED
County of Cohort or Local Earned IEP Still Preparation DroppedDistrict Members Diplomas Diploma Enrolled Program Out
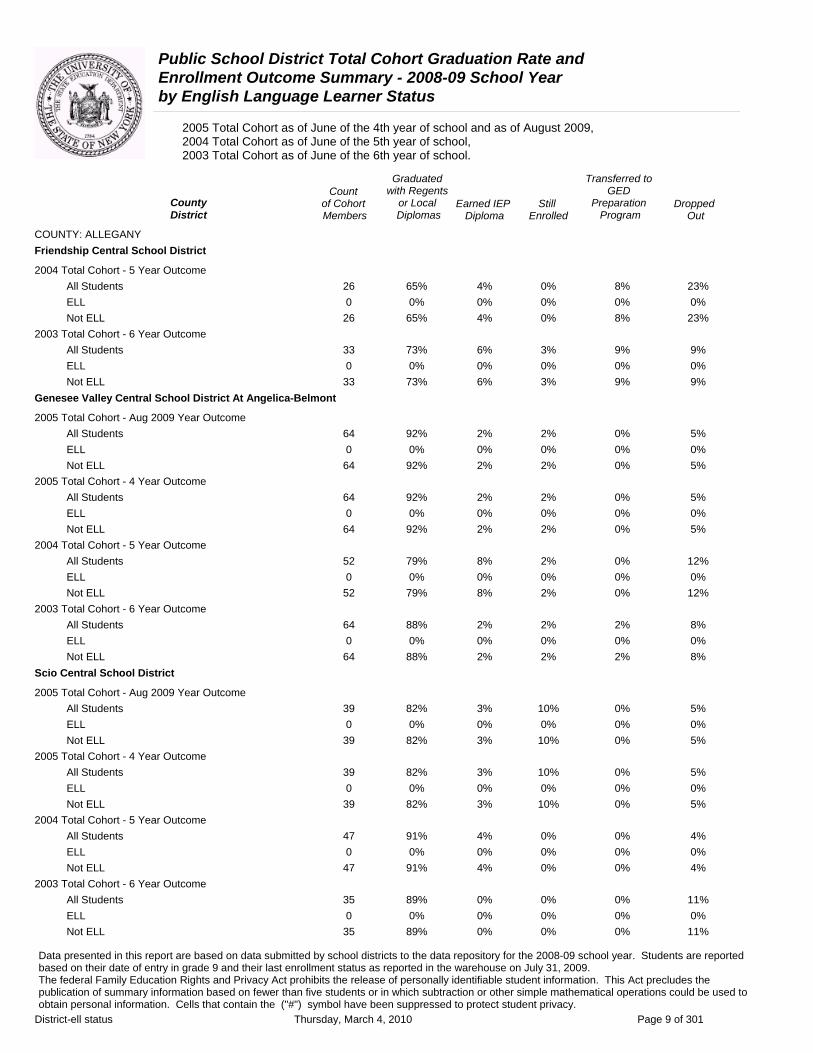
COUNTY: ALLEGANY Friendship Central School District
2004 Total Cohort - 5 Year Outcome All Students 26 65% 4% 0% 8% 23% ELL 0 0% 0% 0% 0% 0% Not ELL 26 65% 4% 0% 8% 23%
2003 Total Cohort - 6 Year Outcome All Students 33 73% 6% 3% 9% 9% ELL 0 0% 0% 0% 0% 0% Not ELL 33 73% 6% 3% 9% 9%
Genesee Valley Central School District At Angelica-Belmont
2005 Total Cohort - Aug 2009 Year Outcome All Students 64 92% 2% 2% 0% 5% ELL 0 0% 0% 0% 0% 0% Not ELL 64 92% 2% 2% 0% 5%
2005 Total Cohort - 4 Year Outcome All Students 64 92% 2% 2% 0% 5% ELL 0 0% 0% 0% 0% 0% Not ELL 64 92% 2% 2% 0% 5%
2004 Total Cohort - 5 Year Outcome All Students 52 79% 8% 2% 0% 12% ELL 0 0% 0% 0% 0% 0% Not ELL 52 79% 8% 2% 0% 12%
2003 Total Cohort - 6 Year Outcome All Students 64 88% 2% 2% 2% 8% ELL 0 0% 0% 0% 0% 0% Not ELL 64 88% 2% 2% 2% 8%
Scio Central School District
2005 Total Cohort - Aug 2009 Year Outcome All Students 39 82% 3% 10% 0% 5% ELL 0 0% 0% 0% 0% 0% Not ELL 39 82% 3% 10% 0% 5%
2005 Total Cohort - 4 Year Outcome All Students 39 82% 3% 10% 0% 5% ELL 0 0% 0% 0% 0% 0% Not ELL 39 82% 3% 10% 0% 5%
2004 Total Cohort - 5 Year Outcome All Students 47 91% 4% 0% 0% 4% ELL 0 0% 0% 0% 0% 0% Not ELL 47 91% 4% 0% 0% 4%
2003 Total Cohort - 6 Year Outcome All Students 35 89% 0% 0% 0% 11% ELL 0 0% 0% 0% 0% 0% Not ELL 35 89% 0% 0% 0% 11%
Data presented in this report are based on data submitted by school districts to the data repository for the 2008-09 school year. Students are reported based on their date of entry in grade 9 and their last enrollment status as reported in the warehouse on July 31, 2009. The federal Family Education Rights and Privacy Act prohibits the release of personally identifiable student information. This Act precludes the publication of summary information based on fewer than five students or in which subtraction or other simple mathematical operations could be used to obtain personal information. Cells that contain the ("#") symbol have been suppressed to protect student privacy.
District-ell status Thursday, March 4, 2010 Page 9 of 301

Public School District Total Cohort Graduation Rate and Enrollment Outcome Summary - 2008-09 School Year by English Language Learner Status
2005 Total Cohort as of June of the 4th year of school and as of August 2009, 2004 Total Cohort as of June of the 5th year of school, 2003 Total Cohort as of June of the 6th year of school.
Graduated Transferred to Count with Regents GED
County of Cohort or Local Earned IEP Still Preparation DroppedDistrict Members Diplomas Diploma Enrolled Program Out
COUNTY: ALLEGANY Wellsville Central School District
2005 Total Cohort - Aug 2009 Year Outcome All Students 144 81% 2% 5% 1% 10% ELL 0 0% 0% 0% 0% 0% Not ELL 144 81% 2% 5% 1% 10%
2005 Total Cohort - 4 Year Outcome All Students 144 79% 2% 7% 1% 10% ELL 0 0% 0% 0% 0% 0% Not ELL 144 79% 2% 7% 1% 10%
2004 Total Cohort - 5 Year Outcome All Students 99 74% 6% 2% 1% 17% ELL 0 0% 0% 0% 0% 0% Not ELL 99 74% 6% 2% 1% 17%
2003 Total Cohort - 6 Year Outcome All Students 115 89% 2% 1% 1% 8% ELL 0 0% 0% 0% 0% 0% Not ELL 115 89% 2% 1% 1% 8%
Whitesville Central School District
2005 Total Cohort - Aug 2009 Year Outcome All Students 23 87% 0% 9% 0% 4% ELL 0 0% 0% 0% 0% 0% Not ELL 23 87% 0% 9% 0% 4%
2005 Total Cohort - 4 Year Outcome All Students 23 87% 0% 9% 0% 4% ELL 0 0% 0% 0% 0% 0% Not ELL 23 87% 0% 9% 0% 4%
2004 Total Cohort - 5 Year Outcome All Students 17 82% 12% 0% 0% 6% ELL 0 0% 0% 0% 0% 0% Not ELL 17 82% 12% 0% 0% 6%
2003 Total Cohort - 6 Year Outcome All Students 27 85% 4% 0% 0% 7% ELL 0 0% 0% 0% 0% 0% Not ELL 27 85% 4% 0% 0% 7%
Data presented in this report are based on data submitted by school districts to the data repository for the 2008-09 school year. Students are reported based on their date of entry in grade 9 and their last enrollment status as reported in the warehouse on July 31, 2009. The federal Family Education Rights and Privacy Act prohibits the release of personally identifiable student information. This Act precludes the publication of summary information based on fewer than five students or in which subtraction or other simple mathematical operations could be used to obtain personal information. Cells that contain the ("#") symbol have been suppressed to protect student privacy.
District-ell status Thursday, March 4, 2010 Page 10 of 301
Public School District Total Cohort Graduation Rate and Enrollment Outcome Summary - 2008-09 School Year by English Language Learner Status
2005 Total Cohort as of June of the 4th year of school and as of August 2009, 2004 Total Cohort as of June of the 5th year of school, 2003 Total Cohort as of June of the 6th year of school.
Graduated Transferred to Count with Regents GED
County of Cohort or Local Earned IEP Still Preparation DroppedDistrict Members Diplomas Diploma Enrolled Program Out
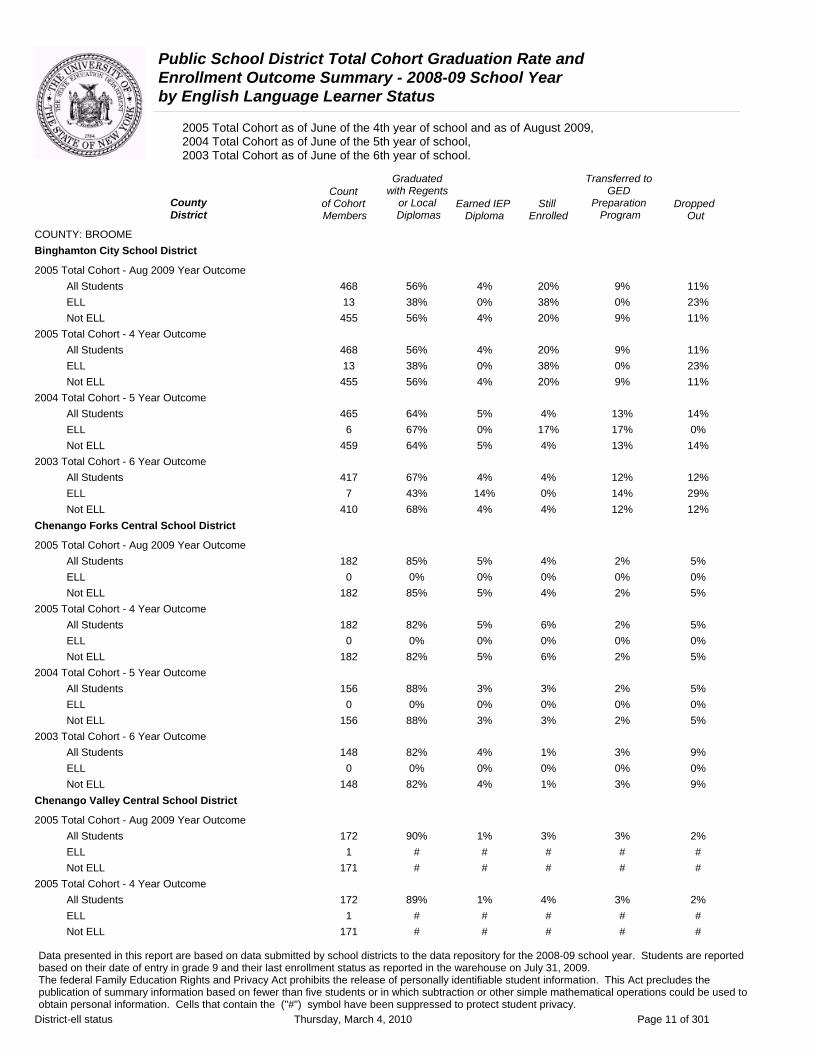
COUNTY: BROOME Binghamton City School District
2005 Total Cohort - Aug 2009 Year Outcome All Students 468 56% 4% 20% 9% 11% ELL 13 38% 0% 38% 0% 23% Not ELL 455 56% 4% 20% 9% 11%
2005 Total Cohort - 4 Year Outcome All Students 468 56% 4% 20% 9% 11% ELL 13 38% 0% 38% 0% 23% Not ELL 455 56% 4% 20% 9% 11%
2004 Total Cohort - 5 Year Outcome All Students 465 64% 5% 4% 13% 14% ELL 6 67% 0% 17% 17% 0% Not ELL 459 64% 5% 4% 13% 14%
2003 Total Cohort - 6 Year Outcome All Students 417 67% 4% 4% 12% 12% ELL 7 43% 14% 0% 14% 29% Not ELL 410 68% 4% 4% 12% 12%
Chenango Forks Central School District
2005 Total Cohort - Aug 2009 Year Outcome All Students 182 85% 5% 4% 2% 5% ELL 0 0% 0% 0% 0% 0% Not ELL 182 85% 5% 4% 2% 5%
2005 Total Cohort - 4 Year Outcome All Students 182 82% 5% 6% 2% 5% ELL 0 0% 0% 0% 0% 0% Not ELL 182 82% 5% 6% 2% 5%
2004 Total Cohort - 5 Year Outcome All Students 156 88% 3% 3% 2% 5% ELL 0 0% 0% 0% 0% 0% Not ELL 156 88% 3% 3% 2% 5%
2003 Total Cohort - 6 Year Outcome All Students 148 82% 4% 1% 3% 9% ELL 0 0% 0% 0% 0% 0% Not ELL 148 82% 4% 1% 3% 9%
Chenango Valley Central School District
2005 Total Cohort - Aug 2009 Year Outcome All Students 172 90% 1% 3% 3% 2% ELL 1 # # # # # Not ELL 171 # # # # #
2005 Total Cohort - 4 Year Outcome All Students 172 89% 1% 4% 3% 2% ELL 1 # # # # # Not ELL 171 # # # # #
Data presented in this report are based on data submitted by school districts to the data repository for the 2008-09 school year. Students are reported based on their date of entry in grade 9 and their last enrollment status as reported in the warehouse on July 31, 2009. The federal Family Education Rights and Privacy Act prohibits the release of personally identifiable student information. This Act precludes the publication of summary information based on fewer than five students or in which subtraction or other simple mathematical operations could be used to obtain personal information. Cells that contain the ("#") symbol have been suppressed to protect student privacy.
District-ell status Thursday, March 4, 2010 Page 11 of 301

Public School District Total Cohort Graduation Rate and Enrollment Outcome Summary - 2008-09 School Year by English Language Learner Status
2005 Total Cohort as of June of the 4th year of school and as of August 2009, 2004 Total Cohort as of June of the 5th year of school, 2003 Total Cohort as of June of the 6th year of school.
Graduated Transferred to Count with Regents GED
County of Cohort or Local Earned IEP Still Preparation DroppedDistrict Members Diplomas Diploma Enrolled Program Out
COUNTY: BROOME Chenango Valley Central School District
2004 Total Cohort - 5 Year Outcome All Students 176 94% 2% 1% 1% 3% ELL 0 0% 0% 0% 0% 0% Not ELL 176 94% 2% 1% 1% 3%
2003 Total Cohort - 6 Year Outcome All Students 179 89% 2% 1% 4% 4% ELL 0 0% 0% 0% 0% 0% Not ELL 179 89% 2% 1% 4% 4%
Deposit Central School District
2005 Total Cohort - Aug 2009 Year Outcome All Students 63 81% 3% 0% 6% 10% ELL 0 0% 0% 0% 0% 0% Not ELL 63 81% 3% 0% 6% 10%
2005 Total Cohort - 4 Year Outcome All Students 63 81% 3% 0% 6% 10% ELL 0 0% 0% 0% 0% 0% Not ELL 63 81% 3% 0% 6% 10%
2004 Total Cohort - 5 Year Outcome All Students 65 83% 2% 0% 6% 9% ELL 0 0% 0% 0% 0% 0% Not ELL 65 83% 2% 0% 6% 9%
2003 Total Cohort - 6 Year Outcome All Students 53 91% 4% 0% 2% 4% ELL 0 0% 0% 0% 0% 0% Not ELL 53 91% 4% 0% 2% 4%
Harpursville Central School District
2005 Total Cohort - Aug 2009 Year Outcome All Students 87 82% 3% 8% 0% 7% ELL 0 0% 0% 0% 0% 0% Not ELL 87 82% 3% 8% 0% 7%
2005 Total Cohort - 4 Year Outcome All Students 87 82% 3% 8% 0% 7% ELL 0 0% 0% 0% 0% 0% Not ELL 87 82% 3% 8% 0% 7%
2004 Total Cohort - 5 Year Outcome All Students 92 79% 7% 7% 0% 8% ELL 0 0% 0% 0% 0% 0% Not ELL 92 79% 7% 7% 0% 8%
2003 Total Cohort - 6 Year Outcome All Students 90 83% 4% 3% 0% 9% ELL 0 0% 0% 0% 0% 0% Not ELL 90 83% 4% 3% 0% 9%
Data presented in this report are based on data submitted by school districts to the data repository for the 2008-09 school year. Students are reported based on their date of entry in grade 9 and their last enrollment status as reported in the warehouse on July 31, 2009. The federal Family Education Rights and Privacy Act prohibits the release of personally identifiable student information. This Act precludes the publication of summary information based on fewer than five students or in which subtraction or other simple mathematical operations could be used to obtain personal information. Cells that contain the ("#") symbol have been suppressed to protect student privacy.
District-ell status Thursday, March 4, 2010 Page 12 of 301
Public School District Total Cohort Graduation Rate and Enrollment Outcome Summary - 2008-09 School Year by English Language Learner Status
2005 Total Cohort as of June of the 4th year of school and as of August 2009, 2004 Total Cohort as of June of the 5th year of school, 2003 Total Cohort as of June of the 6th year of school.
Graduated Transferred to Count with Regents GED
County of Cohort or Local Earned IEP Still Preparation DroppedDistrict Members Diplomas Diploma Enrolled Program Out
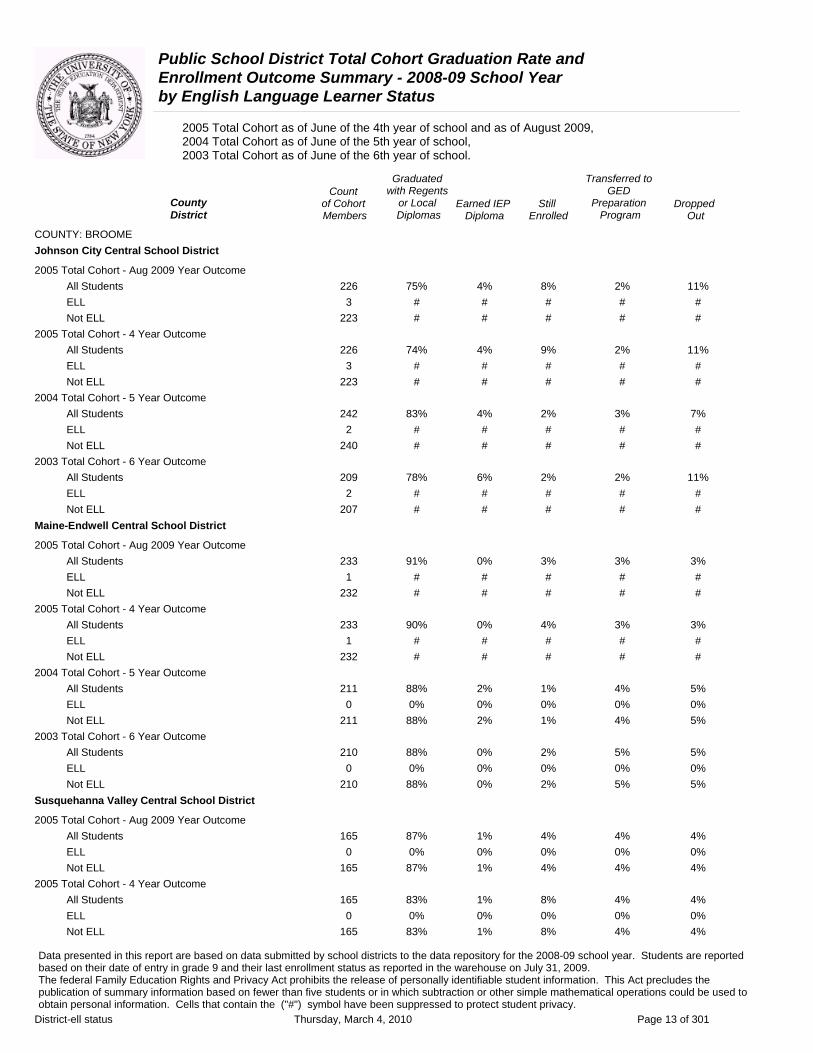
COUNTY: BROOME Johnson City Central School District
2005 Total Cohort - Aug 2009 Year Outcome All Students 226 75% 4% 8% 2% 11% ELL 3 # # # # # Not ELL 223 # # # # #
2005 Total Cohort - 4 Year Outcome All Students 226 74% 4% 9% 2% 11% ELL 3 # # # # # Not ELL 223 # # # # #
2004 Total Cohort - 5 Year Outcome All Students 242 83% 4% 2% 3% 7% ELL 2 # # # # # Not ELL 240 # # # # #
2003 Total Cohort - 6 Year Outcome All Students 209 78% 6% 2% 2% 11% ELL 2 # # # # # Not ELL 207 # # # # #
Maine-Endwell Central School District
2005 Total Cohort - Aug 2009 Year Outcome All Students 233 91% 0% 3% 3% 3% ELL 1 # # # # # Not ELL 232 # # # # #
2005 Total Cohort - 4 Year Outcome All Students 233 90% 0% 4% 3% 3% ELL 1 # # # # # Not ELL 232 # # # # #
2004 Total Cohort - 5 Year Outcome All Students 211 88% 2% 1% 4% 5% ELL 0 0% 0% 0% 0% 0% Not ELL 211 88% 2% 1% 4% 5%
2003 Total Cohort - 6 Year Outcome All Students 210 88% 0% 2% 5% 5% ELL 0 0% 0% 0% 0% 0% Not ELL 210 88% 0% 2% 5% 5%
Susquehanna Valley Central School District
2005 Total Cohort - Aug 2009 Year Outcome All Students 165 87% 1% 4% 4% 4% ELL 0 0% 0% 0% 0% 0% Not ELL 165 87% 1% 4% 4% 4%
2005 Total Cohort - 4 Year Outcome All Students 165 83% 1% 8% 4% 4% ELL 0 0% 0% 0% 0% 0% Not ELL 165 83% 1% 8% 4% 4%
Data presented in this report are based on data submitted by school districts to the data repository for the 2008-09 school year. Students are reported based on their date of entry in grade 9 and their last enrollment status as reported in the warehouse on July 31, 2009. The federal Family Education Rights and Privacy Act prohibits the release of personally identifiable student information. This Act precludes the publication of summary information based on fewer than five students or in which subtraction or other simple mathematical operations could be used to obtain personal information. Cells that contain the ("#") symbol have been suppressed to protect student privacy.
District-ell status Thursday, March 4, 2010 Page 13 of 301

Public School District Total Cohort Graduation Rate and Enrollment Outcome Summary - 2008-09 School Year by English Language Learner Status
2005 Total Cohort as of June of the 4th year of school and as of August 2009, 2004 Total Cohort as of June of the 5th year of school, 2003 Total Cohort as of June of the 6th year of school.
Graduated Transferred to Count with Regents GED
County of Cohort or Local Earned IEP Still Preparation DroppedDistrict Members Diplomas Diploma Enrolled Program Out
COUNTY: BROOME Susquehanna Valley Central School District
2004 Total Cohort - 5 Year Outcome All Students 188 82% 1% 1% 2% 15% ELL 0 0% 0% 0% 0% 0% Not ELL 188 82% 1% 1% 2% 15%
2003 Total Cohort - 6 Year Outcome All Students 164 82% 3% 2% 3% 9% ELL 0 0% 0% 0% 0% 0% Not ELL 164 82% 3% 2% 3% 9%
Union-Endicott Central School District
2005 Total Cohort - Aug 2009 Year Outcome All Students 393 79% 3% 9% 3% 6% ELL 5 20% 0% 40% 0% 40% Not ELL 388 79% 3% 9% 3% 5%
2005 Total Cohort - 4 Year Outcome All Students 393 74% 3% 14% 3% 6% ELL 5 20% 0% 40% 0% 40% Not ELL 388 74% 3% 14% 3% 5%
2004 Total Cohort - 5 Year Outcome All Students 388 82% 2% 2% 4% 10% ELL 2 # # # # # Not ELL 386 # # # # #
2003 Total Cohort - 6 Year Outcome All Students 373 85% 3% 0% 5% 7% ELL 2 # # # # # Not ELL 371 # # # # #
Vestal Central School District
2005 Total Cohort - Aug 2009 Year Outcome All Students 337 85% 1% 5% 5% 4% ELL 2 # # # # # Not ELL 335 # # # # #
2005 Total Cohort - 4 Year Outcome All Students 337 83% 1% 7% 5% 4% ELL 2 # # # # # Not ELL 335 # # # # #
2004 Total Cohort - 5 Year Outcome All Students 371 94% 1% 0% 4% 2% ELL 0 0% 0% 0% 0% 0% Not ELL 371 94% 1% 0% 4% 2%
2003 Total Cohort - 6 Year Outcome All Students 350 87% 3% 0% 6% 4% ELL 2 # # # # # Not ELL 348 # # # # #
Data presented in this report are based on data submitted by school districts to the data repository for the 2008-09 school year. Students are reported based on their date of entry in grade 9 and their last enrollment status as reported in the warehouse on July 31, 2009. The federal Family Education Rights and Privacy Act prohibits the release of personally identifiable student information. This Act precludes the publication of summary information based on fewer than five students or in which subtraction or other simple mathematical operations could be used to obtain personal information. Cells that contain the ("#") symbol have been suppressed to protect student privacy.
District-ell status Thursday, March 4, 2010 Page 14 of 301

Public School District Total Cohort Graduation Rate and Enrollment Outcome Summary - 2008-09 School Year by English Language Learner Status
2005 Total Cohort as of June of the 4th year of school and as of August 2009, 2004 Total Cohort as of June of the 5th year of school, 2003 Total Cohort as of June of the 6th year of school.
Graduated Transferred to Count with Regents GED
County of Cohort or Local Earned IEP Still Preparation DroppedDistrict Members Diplomas Diploma Enrolled Program Out
COUNTY: BROOME Whitney Point Central School District
2005 Total Cohort - Aug 2009 Year Outcome All Students 132 80% 2% 8% 5% 5% ELL 0 0% 0% 0% 0% 0% Not ELL 132 80% 2% 8% 5% 5%
2005 Total Cohort - 4 Year Outcome All Students 132 77% 2% 11% 5% 5% ELL 0 0% 0% 0% 0% 0% Not ELL 132 77% 2% 11% 5% 5%
2004 Total Cohort - 5 Year Outcome All Students 175 79% 3% 7% 5% 5% ELL 1 # # # # # Not ELL 174 # # # # #
2003 Total Cohort - 6 Year Outcome All Students 147 84% 3% 0% 6% 7% ELL 0 0% 0% 0% 0% 0% Not ELL 147 84% 3% 0% 6% 7%
Windsor Central School District
2005 Total Cohort - Aug 2009 Year Outcome All Students 153 88% 5% 3% 1% 3% ELL 0 0% 0% 0% 0% 0% Not ELL 153 88% 5% 3% 1% 3%
2005 Total Cohort - 4 Year Outcome All Students 153 87% 5% 4% 1% 3% ELL 0 0% 0% 0% 0% 0% Not ELL 153 87% 5% 4% 1% 3%
2004 Total Cohort - 5 Year Outcome All Students 154 82% 7% 0% 6% 5% ELL 0 0% 0% 0% 0% 0% Not ELL 154 82% 7% 0% 6% 5%
2003 Total Cohort - 6 Year Outcome All Students 160 85% 4% 1% 3% 8% ELL 0 0% 0% 0% 0% 0% Not ELL 160 85% 4% 1% 3% 8%
Data presented in this report are based on data submitted by school districts to the data repository for the 2008-09 school year. Students are reported based on their date of entry in grade 9 and their last enrollment status as reported in the warehouse on July 31, 2009. The federal Family Education Rights and Privacy Act prohibits the release of personally identifiable student information. This Act precludes the publication of summary information based on fewer than five students or in which subtraction or other simple mathematical operations could be used to obtain personal information. Cells that contain the ("#") symbol have been suppressed to protect student privacy.
District-ell status Thursday, March 4, 2010 Page 15 of 301
Public School District Total Cohort Graduation Rate and Enrollment Outcome Summary - 2008-09 School Year by English Language Learner Status
2005 Total Cohort as of June of the 4th year of school and as of August 2009, 2004 Total Cohort as of June of the 5th year of school, 2003 Total Cohort as of June of the 6th year of school.
Graduated Transferred to Count with Regents GED
County of Cohort or Local Earned IEP Still Preparation DroppedDistrict Members Diplomas Diploma Enrolled Program Out
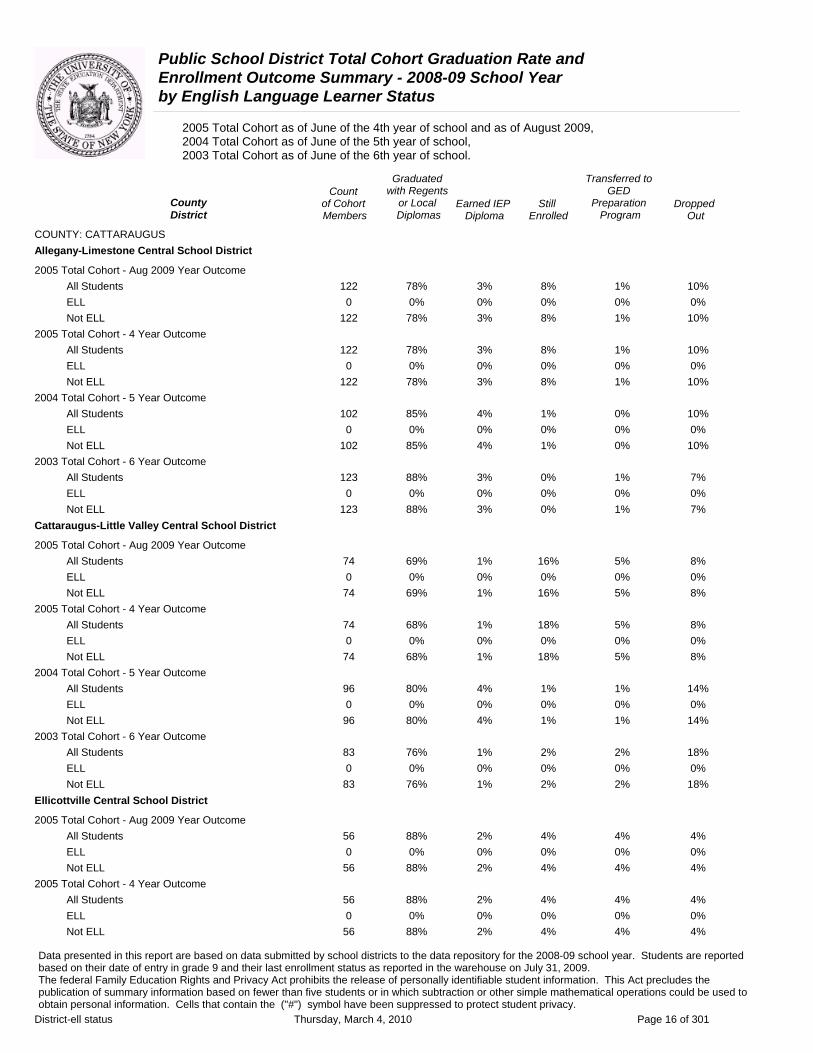
COUNTY: CATTARAUGUS Allegany-Limestone Central School District
2005 Total Cohort - Aug 2009 Year Outcome All Students 122 78% 3% 8% 1% 10% ELL 0 0% 0% 0% 0% 0% Not ELL 122 78% 3% 8% 1% 10%
2005 Total Cohort - 4 Year Outcome All Students 122 78% 3% 8% 1% 10% ELL 0 0% 0% 0% 0% 0% Not ELL 122 78% 3% 8% 1% 10%
2004 Total Cohort - 5 Year Outcome All Students 102 85% 4% 1% 0% 10% ELL 0 0% 0% 0% 0% 0% Not ELL 102 85% 4% 1% 0% 10%
2003 Total Cohort - 6 Year Outcome All Students 123 88% 3% 0% 1% 7% ELL 0 0% 0% 0% 0% 0% Not ELL 123 88% 3% 0% 1% 7%
Cattaraugus-Little Valley Central School District
2005 Total Cohort - Aug 2009 Year Outcome All Students 74 69% 1% 16% 5% 8% ELL 0 0% 0% 0% 0% 0% Not ELL 74 69% 1% 16% 5% 8%
2005 Total Cohort - 4 Year Outcome All Students 74 68% 1% 18% 5% 8% ELL 0 0% 0% 0% 0% 0% Not ELL 74 68% 1% 18% 5% 8%
2004 Total Cohort - 5 Year Outcome All Students 96 80% 4% 1% 1% 14% ELL 0 0% 0% 0% 0% 0% Not ELL 96 80% 4% 1% 1% 14%
2003 Total Cohort - 6 Year Outcome All Students 83 76% 1% 2% 2% 18% ELL 0 0% 0% 0% 0% 0% Not ELL 83 76% 1% 2% 2% 18%
Ellicottville Central School District
2005 Total Cohort - Aug 2009 Year Outcome All Students 56 88% 2% 4% 4% 4% ELL 0 0% 0% 0% 0% 0% Not ELL 56 88% 2% 4% 4% 4%
2005 Total Cohort - 4 Year Outcome All Students 56 88% 2% 4% 4% 4% ELL 0 0% 0% 0% 0% 0% Not ELL 56 88% 2% 4% 4% 4%
Data presented in this report are based on data submitted by school districts to the data repository for the 2008-09 school year. Students are reported based on their date of entry in grade 9 and their last enrollment status as reported in the warehouse on July 31, 2009. The federal Family Education Rights and Privacy Act prohibits the release of personally identifiable student information. This Act precludes the publication of summary information based on fewer than five students or in which subtraction or other simple mathematical operations could be used to obtain personal information. Cells that contain the ("#") symbol have been suppressed to protect student privacy.
District-ell status Thursday, March 4, 2010 Page 16 of 301

Public School District Total Cohort Graduation Rate and Enrollment Outcome Summary - 2008-09 School Year by English Language Learner Status
2005 Total Cohort as of June of the 4th year of school and as of August 2009, 2004 Total Cohort as of June of the 5th year of school, 2003 Total Cohort as of June of the 6th year of school.
Graduated Transferred to Count with Regents GED
County of Cohort or Local Earned IEP Still Preparation DroppedDistrict Members Diplomas Diploma Enrolled Program Out
COUNTY: CATTARAUGUS Ellicottville Central School District
2004 Total Cohort - 5 Year Outcome All Students 60 87% 3% 3% 3% 3% ELL 0 0% 0% 0% 0% 0% Not ELL 60 87% 3% 3% 3% 3%
2003 Total Cohort - 6 Year Outcome All Students 58 88% 2% 2% 3% 5% ELL 0 0% 0% 0% 0% 0% Not ELL 58 88% 2% 2% 3% 5%
Franklinville Central School District
2005 Total Cohort - Aug 2009 Year Outcome All Students 70 76% 4% 7% 6% 7% ELL 0 0% 0% 0% 0% 0% Not ELL 70 76% 4% 7% 6% 7%
2005 Total Cohort - 4 Year Outcome All Students 70 76% 4% 7% 6% 7% ELL 0 0% 0% 0% 0% 0% Not ELL 70 76% 4% 7% 6% 7%
2004 Total Cohort - 5 Year Outcome All Students 73 89% 1% 0% 4% 5% ELL 0 0% 0% 0% 0% 0% Not ELL 73 89% 1% 0% 4% 5%
2003 Total Cohort - 6 Year Outcome All Students 70 81% 1% 0% 6% 11% ELL 0 0% 0% 0% 0% 0% Not ELL 70 81% 1% 0% 6% 11%
Gowanda Central School District
2005 Total Cohort - Aug 2009 Year Outcome All Students 126 82% 1% 7% 1% 10% ELL 0 0% 0% 0% 0% 0% Not ELL 126 82% 1% 7% 1% 10%
2005 Total Cohort - 4 Year Outcome All Students 126 78% 1% 11% 1% 10% ELL 0 0% 0% 0% 0% 0% Not ELL 126 78% 1% 11% 1% 10%
2004 Total Cohort - 5 Year Outcome All Students 119 75% 3% 3% 0% 20% ELL 0 0% 0% 0% 0% 0% Not ELL 119 75% 3% 3% 0% 20%
2003 Total Cohort - 6 Year Outcome All Students 144 81% 1% 0% 0% 18% ELL 0 0% 0% 0% 0% 0% Not ELL 144 81% 1% 0% 0% 18%
Data presented in this report are based on data submitted by school districts to the data repository for the 2008-09 school year. Students are reported based on their date of entry in grade 9 and their last enrollment status as reported in the warehouse on July 31, 2009. The federal Family Education Rights and Privacy Act prohibits the release of personally identifiable student information. This Act precludes the publication of summary information based on fewer than five students or in which subtraction or other simple mathematical operations could be used to obtain personal information. Cells that contain the ("#") symbol have been suppressed to protect student privacy.
District-ell status Thursday, March 4, 2010 Page 17 of 301

Public School District Total Cohort Graduation Rate and Enrollment Outcome Summary - 2008-09 School Year by English Language Learner Status
2005 Total Cohort as of June of the 4th year of school and as of August 2009, 2004 Total Cohort as of June of the 5th year of school, 2003 Total Cohort as of June of the 6th year of school.
Graduated Transferred to Count with Regents GED
County of Cohort or Local Earned IEP Still Preparation DroppedDistrict Members Diplomas Diploma Enrolled Program Out
COUNTY: CATTARAUGUS Hinsdale Central School District
2005 Total Cohort - Aug 2009 Year Outcome All Students 38 82% 3% 5% 0% 11% ELL 0 0% 0% 0% 0% 0% Not ELL 38 82% 3% 5% 0% 11%
2005 Total Cohort - 4 Year Outcome All Students 38 82% 3% 5% 0% 11% ELL 0 0% 0% 0% 0% 0% Not ELL 38 82% 3% 5% 0% 11%
2004 Total Cohort - 5 Year Outcome All Students 51 76% 8% 2% 4% 10% ELL 0 0% 0% 0% 0% 0% Not ELL 51 76% 8% 2% 4% 10%
2003 Total Cohort - 6 Year Outcome All Students 31 74% 10% 3% 3% 10% ELL 0 0% 0% 0% 0% 0% Not ELL 31 74% 10% 3% 3% 10%
Olean City School District
2005 Total Cohort - Aug 2009 Year Outcome All Students 159 69% 1% 12% 6% 13% ELL 1 # # # # # Not ELL 158 # # # # #
2005 Total Cohort - 4 Year Outcome All Students 159 68% 1% 13% 6% 13% ELL 1 # # # # # Not ELL 158 # # # # #
2004 Total Cohort - 5 Year Outcome All Students 195 77% 5% 5% 4% 10% ELL 0 0% 0% 0% 0% 0% Not ELL 195 77% 5% 5% 4% 10%
2003 Total Cohort - 6 Year Outcome All Students 176 79% 5% 2% 1% 14% ELL 0 0% 0% 0% 0% 0% Not ELL 176 79% 5% 2% 1% 14%
Portville Central School District
2005 Total Cohort - Aug 2009 Year Outcome All Students 63 86% 2% 2% 2% 10% ELL 0 0% 0% 0% 0% 0% Not ELL 63 86% 2% 2% 2% 10%
2005 Total Cohort - 4 Year Outcome All Students 63 86% 2% 2% 2% 10% ELL 0 0% 0% 0% 0% 0% Not ELL 63 86% 2% 2% 2% 10%
Data presented in this report are based on data submitted by school districts to the data repository for the 2008-09 school year. Students are reported based on their date of entry in grade 9 and their last enrollment status as reported in the warehouse on July 31, 2009. The federal Family Education Rights and Privacy Act prohibits the release of personally identifiable student information. This Act precludes the publication of summary information based on fewer than five students or in which subtraction or other simple mathematical operations could be used to obtain personal information. Cells that contain the ("#") symbol have been suppressed to protect student privacy.
District-ell status Thursday, March 4, 2010 Page 18 of 301

Public School District Total Cohort Graduation Rate and Enrollment Outcome Summary - 2008-09 School Year by English Language Learner Status
2005 Total Cohort as of June of the 4th year of school and as of August 2009, 2004 Total Cohort as of June of the 5th year of school, 2003 Total Cohort as of June of the 6th year of school.
Graduated Transferred to Count with Regents GED
County of Cohort or Local Earned IEP Still Preparation DroppedDistrict Members Diplomas Diploma Enrolled Program Out
COUNTY: CATTARAUGUS Portville Central School District
2004 Total Cohort - 5 Year Outcome All Students 80 95% 0% 0% 3% 3% ELL 0 0% 0% 0% 0% 0% Not ELL 80 95% 0% 0% 3% 3%
2003 Total Cohort - 6 Year Outcome All Students 81 86% 1% 0% 4% 9% ELL 0 0% 0% 0% 0% 0% Not ELL 81 86% 1% 0% 4% 9%
Randolph Academy Union Free School District
2005 Total Cohort - Aug 2009 Year Outcome All Students 5 0% 20% 60% 20% 0% ELL 0 0% 0% 0% 0% 0% Not ELL 5 0% 20% 60% 20% 0%
2005 Total Cohort - 4 Year Outcome All Students 5 0% 20% 60% 20% 0% ELL 0 0% 0% 0% 0% 0% Not ELL 5 0% 20% 60% 20% 0%
2004 Total Cohort - 5 Year Outcome All Students 4 # # # # # ELL 0 # # # # # Not ELL 4 # # # # #
2003 Total Cohort - 6 Year Outcome All Students 1 # # # # # ELL 0 # # # # # Not ELL 1 # # # # #
Randolph Central School District
2005 Total Cohort - Aug 2009 Year Outcome All Students 60 83% 2% 5% 2% 8% ELL 0 0% 0% 0% 0% 0% Not ELL 60 83% 2% 5% 2% 8%
2005 Total Cohort - 4 Year Outcome All Students 60 83% 2% 5% 2% 8% ELL 0 0% 0% 0% 0% 0% Not ELL 60 83% 2% 5% 2% 8%
2004 Total Cohort - 5 Year Outcome All Students 85 87% 2% 2% 0% 8% ELL 1 # # # # # Not ELL 84 # # # # #
2003 Total Cohort - 6 Year Outcome All Students 76 80% 4% 3% 0% 13% ELL 0 0% 0% 0% 0% 0% Not ELL 76 80% 4% 3% 0% 13%
Data presented in this report are based on data submitted by school districts to the data repository for the 2008-09 school year. Students are reported based on their date of entry in grade 9 and their last enrollment status as reported in the warehouse on July 31, 2009. The federal Family Education Rights and Privacy Act prohibits the release of personally identifiable student information. This Act precludes the publication of summary information based on fewer than five students or in which subtraction or other simple mathematical operations could be used to obtain personal information. Cells that contain the ("#") symbol have been suppressed to protect student privacy.
District-ell status Thursday, March 4, 2010 Page 19 of 301
Public School District Total Cohort Graduation Rate and Enrollment Outcome Summary - 2008-09 School Year by English Language Learner Status
2005 Total Cohort as of June of the 4th year of school and as of August 2009, 2004 Total Cohort as of June of the 5th year of school, 2003 Total Cohort as of June of the 6th year of school.
Graduated Transferred to Count with Regents GED
County of Cohort or Local Earned IEP Still Preparation DroppedDistrict Members Diplomas Diploma Enrolled Program Out
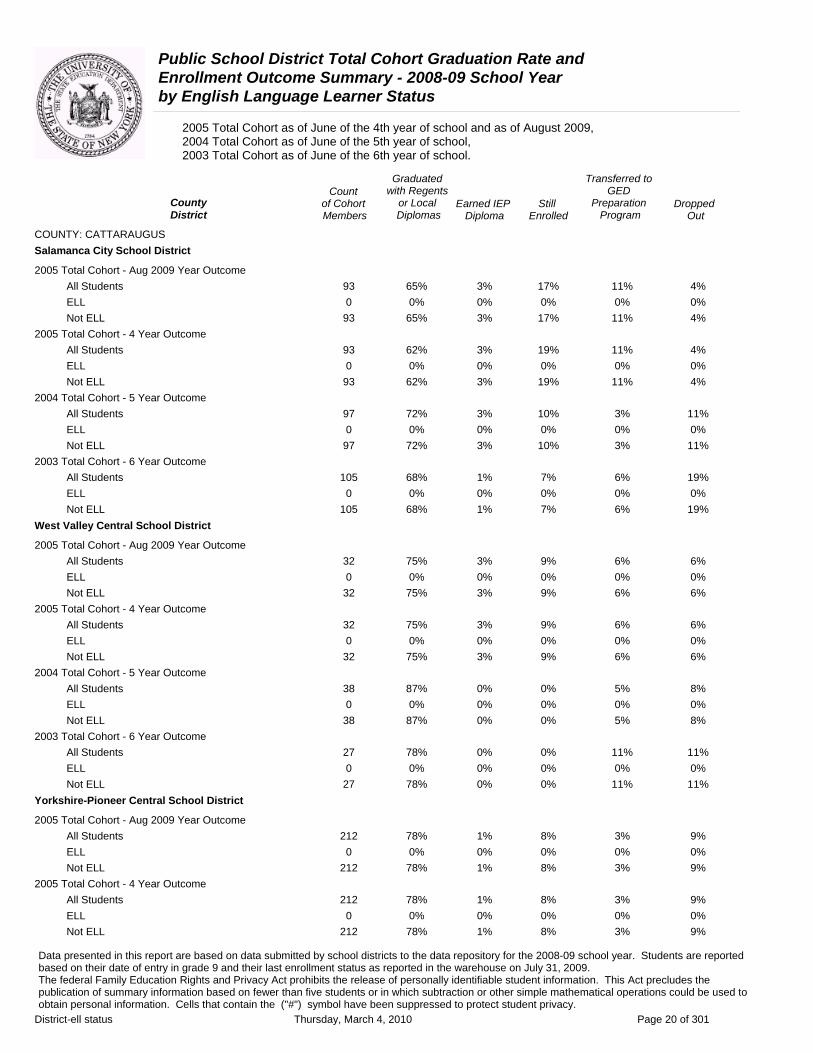
COUNTY: CATTARAUGUS Salamanca City School District
2005 Total Cohort - Aug 2009 Year Outcome All Students 93 65% 3% 17% 11% 4% ELL 0 0% 0% 0% 0% 0% Not ELL 93 65% 3% 17% 11% 4%
2005 Total Cohort - 4 Year Outcome All Students 93 62% 3% 19% 11% 4% ELL 0 0% 0% 0% 0% 0% Not ELL 93 62% 3% 19% 11% 4%
2004 Total Cohort - 5 Year Outcome All Students 97 72% 3% 10% 3% 11% ELL 0 0% 0% 0% 0% 0% Not ELL 97 72% 3% 10% 3% 11%
2003 Total Cohort - 6 Year Outcome All Students 105 68% 1% 7% 6% 19% ELL 0 0% 0% 0% 0% 0% Not ELL 105 68% 1% 7% 6% 19%
West Valley Central School District
2005 Total Cohort - Aug 2009 Year Outcome All Students 32 75% 3% 9% 6% 6% ELL 0 0% 0% 0% 0% 0% Not ELL 32 75% 3% 9% 6% 6%
2005 Total Cohort - 4 Year Outcome All Students 32 75% 3% 9% 6% 6% ELL 0 0% 0% 0% 0% 0% Not ELL 32 75% 3% 9% 6% 6%
2004 Total Cohort - 5 Year Outcome All Students 38 87% 0% 0% 5% 8% ELL 0 0% 0% 0% 0% 0% Not ELL 38 87% 0% 0% 5% 8%
2003 Total Cohort - 6 Year Outcome All Students 27 78% 0% 0% 11% 11% ELL 0 0% 0% 0% 0% 0% Not ELL 27 78% 0% 0% 11% 11%
Yorkshire-Pioneer Central School District
2005 Total Cohort - Aug 2009 Year Outcome All Students 212 78% 1% 8% 3% 9% ELL 0 0% 0% 0% 0% 0% Not ELL 212 78% 1% 8% 3% 9%
2005 Total Cohort - 4 Year Outcome All Students 212 78% 1% 8% 3% 9% ELL 0 0% 0% 0% 0% 0% Not ELL 212 78% 1% 8% 3% 9%
Data presented in this report are based on data submitted by school districts to the data repository for the 2008-09 school year. Students are reported based on their date of entry in grade 9 and their last enrollment status as reported in the warehouse on July 31, 2009. The federal Family Education Rights and Privacy Act prohibits the release of personally identifiable student information. This Act precludes the publication of summary information based on fewer than five students or in which subtraction or other simple mathematical operations could be used to obtain personal information. Cells that contain the ("#") symbol have been suppressed to protect student privacy.
District-ell status Thursday, March 4, 2010 Page 20 of 301

Public School District Total Cohort Graduation Rate and Enrollment Outcome Summary - 2008-09 School Year by English Language Learner Status
2005 Total Cohort as of June of the 4th year of school and as of August 2009, 2004 Total Cohort as of June of the 5th year of school, 2003 Total Cohort as of June of the 6th year of school.
Graduated Transferred to Count with Regents GED
County of Cohort or Local Earned IEP Still Preparation DroppedDistrict Members Diplomas Diploma Enrolled Program Out
COUNTY: CATTARAUGUS Yorkshire-Pioneer Central School District
2004 Total Cohort - 5 Year Outcome All Students 273 82% 2% 1% 4% 10% ELL 0 0% 0% 0% 0% 0% Not ELL 273 82% 2% 1% 4% 10%
2003 Total Cohort - 6 Year Outcome All Students 249 80% 3% 0% 1% 16% ELL 0 0% 0% 0% 0% 0% Not ELL 249 80% 3% 0% 1% 16%
Data presented in this report are based on data submitted by school districts to the data repository for the 2008-09 school year. Students are reported based on their date of entry in grade 9 and their last enrollment status as reported in the warehouse on July 31, 2009. The federal Family Education Rights and Privacy Act prohibits the release of personally identifiable student information. This Act precludes the publication of summary information based on fewer than five students or in which subtraction or other simple mathematical operations could be used to obtain personal information. Cells that contain the ("#") symbol have been suppressed to protect student privacy.
District-ell status Thursday, March 4, 2010 Page 21 of 301

Public School District Total Cohort Graduation Rate and Enrollment Outcome Summary - 2008-09 School Year by English Language Learner Status
2005 Total Cohort as of June of the 4th year of school and as of August 2009, 2004 Total Cohort as of June of the 5th year of school, 2003 Total Cohort as of June of the 6th year of school.
Graduated Transferred to Count with Regents GED
County District
of Cohort Members
or Local Diplomas
Earned IEP Diploma
Still Enrolled
Preparation Program
Dropped Out
COUNTY: CAYUGA Auburn City School District
2005 Total Cohort - Aug 2009 Year Outcome All Students 406 69% 3% 5% 7% 15% ELL 0 0% 0% 0% 0% 0% Not ELL 406 69% 3% 5% 7% 15%
2005 Total Cohort - 4 Year Outcome All Students 406 67% 3% 8% 7% 15% ELL 0 0% 0% 0% 0% 0% Not ELL 406 67% 3% 8% 7% 15%
2004 Total Cohort - 5 Year Outcome All Students 391 71% 5% 3% 6% 16% ELL 0 0% 0% 0% 0% 0% Not ELL 391 71% 5% 3% 6% 16%
2003 Total Cohort - 6 Year Outcome All Students 397 68% 3% 1% 7% 21% ELL 0 0% 0% 0% 0% 0% Not ELL 397 68% 3% 1% 7% 21%
Cato-Meridian Central School District
2005 Total Cohort - Aug 2009 Year Outcome All Students 92 82% 2% 8% 7% 2% ELL 1 # # # # # Not ELL 91 # # # # #
2005 Total Cohort - 4 Year Outcome All Students 92 77% 2% 12% 7% 2% ELL 1 # # # # # Not ELL 91 # # # # #
2004 Total Cohort - 5 Year Outcome All Students 105 83% 7% 4% 2% 5% ELL 1 # # # # # Not ELL 104 # # # # #
2003 Total Cohort - 6 Year Outcome All Students 90 78% 3% 0% 6% 13% ELL 0 0% 0% 0% 0% 0% Not ELL 90 78% 3% 0% 6% 13%
Moravia Central School District
2005 Total Cohort - Aug 2009 Year Outcome All Students 87 76% 9% 6% 2% 7% ELL 0 0% 0% 0% 0% 0% Not ELL 87 76% 9% 6% 2% 7%
2005 Total Cohort - 4 Year Outcome All Students 87 76% 9% 6% 2% 7% ELL 0 0% 0% 0% 0% 0% Not ELL 87 76% 9% 6% 2% 7%
Data presented in this report are based on data submitted by school districts to the data repository for the 2008-09 school year. Students are reported based on their date of entry in grade 9 and their last enrollment status as reported in the warehouse on July 31, 2009. The federal Family Education Rights and Privacy Act prohibits the release of personally identifiable student information. This Act precludes the publication of summary information based on fewer than five students or in which subtraction or other simple mathematical operations could be used to obtain personal information. Cells that contain the ("#") symbol have been suppressed to protect student privacy.
District-ell status Thursday, March 4, 2010 Page 22 of 301

Public School District Total Cohort Graduation Rate and Enrollment Outcome Summary - 2008-09 School Year by English Language Learner Status
2005 Total Cohort as of June of the 4th year of school and as of August 2009, 2004 Total Cohort as of June of the 5th year of school, 2003 Total Cohort as of June of the 6th year of school.
Graduated Transferred to Count with Regents GED
County of Cohort or Local Earned IEP Still Preparation DroppedDistrict Members Diplomas Diploma Enrolled Program Out
COUNTY: CAYUGA Moravia Central School District
2004 Total Cohort - 5 Year Outcome All Students 82 73% 5% 1% 4% 17% ELL 0 0% 0% 0% 0% 0% Not ELL 82 73% 5% 1% 4% 17%
2003 Total Cohort - 6 Year Outcome All Students 93 72% 6% 2% 8% 12% ELL 0 0% 0% 0% 0% 0% Not ELL 93 72% 6% 2% 8% 12%
Port Byron Central School District
2005 Total Cohort - Aug 2009 Year Outcome All Students 103 80% 6% 6% 2% 7% ELL 0 0% 0% 0% 0% 0% Not ELL 103 80% 6% 6% 2% 7%
2005 Total Cohort - 4 Year Outcome All Students 103 80% 6% 6% 2% 7% ELL 0 0% 0% 0% 0% 0% Not ELL 103 80% 6% 6% 2% 7%
2004 Total Cohort - 5 Year Outcome All Students 88 73% 2% 3% 6% 16% ELL 0 0% 0% 0% 0% 0% Not ELL 88 73% 2% 3% 6% 16%
2003 Total Cohort - 6 Year Outcome All Students 99 69% 5% 1% 9% 16% ELL 0 0% 0% 0% 0% 0% Not ELL 99 69% 5% 1% 9% 16%
Southern Cayuga Central School District
2005 Total Cohort - Aug 2009 Year Outcome All Students 82 82% 4% 0% 7% 7% ELL 0 0% 0% 0% 0% 0% Not ELL 82 82% 4% 0% 7% 7%
2005 Total Cohort - 4 Year Outcome All Students 82 80% 4% 1% 7% 7% ELL 0 0% 0% 0% 0% 0% Not ELL 82 80% 4% 1% 7% 7%
2004 Total Cohort - 5 Year Outcome All Students 88 81% 5% 5% 2% 8% ELL 0 0% 0% 0% 0% 0% Not ELL 88 81% 5% 5% 2% 8%
2003 Total Cohort - 6 Year Outcome All Students 86 79% 2% 1% 5% 13% ELL 0 0% 0% 0% 0% 0% Not ELL 86 79% 2% 1% 5% 13%
Data presented in this report are based on data submitted by school districts to the data repository for the 2008-09 school year. Students are reported based on their date of entry in grade 9 and their last enrollment status as reported in the warehouse on July 31, 2009. The federal Family Education Rights and Privacy Act prohibits the release of personally identifiable student information. This Act precludes the publication of summary information based on fewer than five students or in which subtraction or other simple mathematical operations could be used to obtain personal information. Cells that contain the ("#") symbol have been suppressed to protect student privacy.
District-ell status Thursday, March 4, 2010 Page 23 of 301

Public School District Total Cohort Graduation Rate and Enrollment Outcome Summary - 2008-09 School Year by English Language Learner Status
2005 Total Cohort as of June of the 4th year of school and as of August 2009, 2004 Total Cohort as of June of the 5th year of school, 2003 Total Cohort as of June of the 6th year of school.
Graduated Transferred to Count with Regents GED
County of Cohort or Local Earned IEP Still Preparation DroppedDistrict Members Diplomas Diploma Enrolled Program Out
COUNTY: CAYUGA Union Springs Central School District
2005 Total Cohort - Aug 2009 Year Outcome All Students 91 85% 2% 5% 0% 8% ELL 0 0% 0% 0% 0% 0% Not ELL 91 85% 2% 5% 0% 8%
2005 Total Cohort - 4 Year Outcome All Students 91 84% 2% 7% 0% 8% ELL 0 0% 0% 0% 0% 0% Not ELL 91 84% 2% 7% 0% 8%
2004 Total Cohort - 5 Year Outcome All Students 91 84% 3% 2% 0% 11% ELL 0 0% 0% 0% 0% 0% Not ELL 91 84% 3% 2% 0% 11%
2003 Total Cohort - 6 Year Outcome All Students 89 75% 7% 1% 4% 12% ELL 0 0% 0% 0% 0% 0% Not ELL 89 75% 7% 1% 4% 12%
Weedsport Central School District
2005 Total Cohort - Aug 2009 Year Outcome All Students 78 82% 4% 0% 8% 6% ELL 0 0% 0% 0% 0% 0% Not ELL 78 82% 4% 0% 8% 6%
2005 Total Cohort - 4 Year Outcome All Students 78 81% 4% 1% 8% 6% ELL 0 0% 0% 0% 0% 0% Not ELL 78 81% 4% 1% 8% 6%
2004 Total Cohort - 5 Year Outcome All Students 92 86% 3% 3% 5% 2% ELL 0 0% 0% 0% 0% 0% Not ELL 92 86% 3% 3% 5% 2%
2003 Total Cohort - 6 Year Outcome All Students 90 92% 1% 1% 3% 2% ELL 0 0% 0% 0% 0% 0% Not ELL 90 92% 1% 1% 3% 2%
Data presented in this report are based on data submitted by school districts to the data repository for the 2008-09 school year. Students are reported based on their date of entry in grade 9 and their last enrollment status as reported in the warehouse on July 31, 2009. The federal Family Education Rights and Privacy Act prohibits the release of personally identifiable student information. This Act precludes the publication of summary information based on fewer than five students or in which subtraction or other simple mathematical operations could be used to obtain personal information. Cells that contain the ("#") symbol have been suppressed to protect student privacy.
District-ell status Thursday, March 4, 2010 Page 24 of 301
Public School District Total Cohort Graduation Rate and Enrollment Outcome Summary - 2008-09 School Year by English Language Learner Status
2005 Total Cohort as of June of the 4th year of school and as of August 2009, 2004 Total Cohort as of June of the 5th year of school, 2003 Total Cohort as of June of the 6th year of school.
Graduated Transferred to Count with Regents GED
County of Cohort or Local Earned IEP Still Preparation DroppedDistrict Members Diplomas Diploma Enrolled Program Out
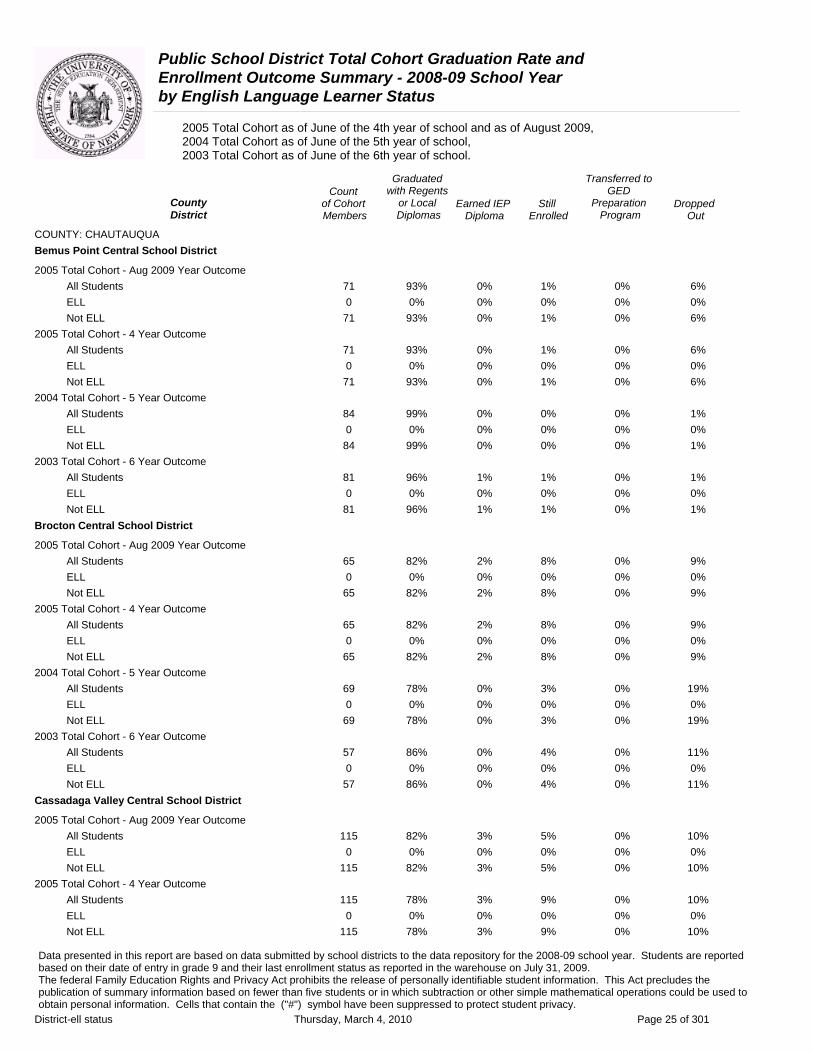
COUNTY: CHAUTAUQUA Bemus Point Central School District
2005 Total Cohort - Aug 2009 Year Outcome All Students 71 93% 0% 1% 0% 6% ELL 0 0% 0% 0% 0% 0% Not ELL 71 93% 0% 1% 0% 6%
2005 Total Cohort - 4 Year Outcome All Students 71 93% 0% 1% 0% 6% ELL 0 0% 0% 0% 0% 0% Not ELL 71 93% 0% 1% 0% 6%
2004 Total Cohort - 5 Year Outcome All Students 84 99% 0% 0% 0% 1% ELL 0 0% 0% 0% 0% 0% Not ELL 84 99% 0% 0% 0% 1%
2003 Total Cohort - 6 Year Outcome All Students 81 96% 1% 1% 0% 1% ELL 0 0% 0% 0% 0% 0% Not ELL 81 96% 1% 1% 0% 1%
Brocton Central School District
2005 Total Cohort - Aug 2009 Year Outcome All Students 65 82% 2% 8% 0% 9% ELL 0 0% 0% 0% 0% 0% Not ELL 65 82% 2% 8% 0% 9%
2005 Total Cohort - 4 Year Outcome All Students 65 82% 2% 8% 0% 9% ELL 0 0% 0% 0% 0% 0% Not ELL 65 82% 2% 8% 0% 9%
2004 Total Cohort - 5 Year Outcome All Students 69 78% 0% 3% 0% 19% ELL 0 0% 0% 0% 0% 0% Not ELL 69 78% 0% 3% 0% 19%
2003 Total Cohort - 6 Year Outcome All Students 57 86% 0% 4% 0% 11% ELL 0 0% 0% 0% 0% 0% Not ELL 57 86% 0% 4% 0% 11%
Cassadaga Valley Central School District
2005 Total Cohort - Aug 2009 Year Outcome All Students 115 82% 3% 5% 0% 10% ELL 0 0% 0% 0% 0% 0% Not ELL 115 82% 3% 5% 0% 10%
2005 Total Cohort - 4 Year Outcome All Students 115 78% 3% 9% 0% 10% ELL 0 0% 0% 0% 0% 0% Not ELL 115 78% 3% 9% 0% 10%
Data presented in this report are based on data submitted by school districts to the data repository for the 2008-09 school year. Students are reported based on their date of entry in grade 9 and their last enrollment status as reported in the warehouse on July 31, 2009. The federal Family Education Rights and Privacy Act prohibits the release of personally identifiable student information. This Act precludes the publication of summary information based on fewer than five students or in which subtraction or other simple mathematical operations could be used to obtain personal information. Cells that contain the ("#") symbol have been suppressed to protect student privacy.
District-ell status Thursday, March 4, 2010 Page 25 of 301

Public School District Total Cohort Graduation Rate and Enrollment Outcome Summary - 2008-09 School Year by English Language Learner Status
2005 Total Cohort as of June of the 4th year of school and as of August 2009, 2004 Total Cohort as of June of the 5th year of school, 2003 Total Cohort as of June of the 6th year of school.
Graduated Transferred to Count with Regents GED
County of Cohort or Local Earned IEP Still Preparation DroppedDistrict Members Diplomas Diploma Enrolled Program Out
COUNTY: CHAUTAUQUA Cassadaga Valley Central School District
2004 Total Cohort - 5 Year Outcome All Students 98 84% 3% 1% 0% 12% ELL 0 0% 0% 0% 0% 0% Not ELL 98 84% 3% 1% 0% 12%
2003 Total Cohort - 6 Year Outcome All Students 84 80% 7% 0% 0% 13% ELL 0 0% 0% 0% 0% 0% Not ELL 84 80% 7% 0% 0% 13%
Chautauqua Lake Central School District
2005 Total Cohort - Aug 2009 Year Outcome All Students 88 83% 3% 2% 0% 11% ELL 0 0% 0% 0% 0% 0% Not ELL 88 83% 3% 2% 0% 11%
2005 Total Cohort - 4 Year Outcome All Students 88 81% 3% 5% 0% 11% ELL 0 0% 0% 0% 0% 0% Not ELL 88 81% 3% 5% 0% 11%
2004 Total Cohort - 5 Year Outcome All Students 75 92% 1% 0% 0% 7% ELL 0 0% 0% 0% 0% 0% Not ELL 75 92% 1% 0% 0% 7%
2003 Total Cohort - 6 Year Outcome All Students 88 86% 3% 1% 0% 9% ELL 0 0% 0% 0% 0% 0% Not ELL 88 86% 3% 1% 0% 9%
Clymer Central School District
2005 Total Cohort - Aug 2009 Year Outcome All Students 28 100% 0% 0% 0% 0% ELL 0 0% 0% 0% 0% 0% Not ELL 28 100% 0% 0% 0% 0%
2005 Total Cohort - 4 Year Outcome All Students 28 100% 0% 0% 0% 0% ELL 0 0% 0% 0% 0% 0% Not ELL 28 100% 0% 0% 0% 0%
2004 Total Cohort - 5 Year Outcome All Students 31 94% 3% 0% 0% 3% ELL 0 0% 0% 0% 0% 0% Not ELL 31 94% 3% 0% 0% 3%
2003 Total Cohort - 6 Year Outcome All Students 39 95% 0% 0% 0% 5% ELL 0 0% 0% 0% 0% 0% Not ELL 39 95% 0% 0% 0% 5%
Data presented in this report are based on data submitted by school districts to the data repository for the 2008-09 school year. Students are reported based on their date of entry in grade 9 and their last enrollment status as reported in the warehouse on July 31, 2009. The federal Family Education Rights and Privacy Act prohibits the release of personally identifiable student information. This Act precludes the publication of summary information based on fewer than five students or in which subtraction or other simple mathematical operations could be used to obtain personal information. Cells that contain the ("#") symbol have been suppressed to protect student privacy.
District-ell status Thursday, March 4, 2010 Page 26 of 301
Public School District Total Cohort Graduation Rate and Enrollment Outcome Summary - 2008-09 School Year by English Language Learner Status
2005 Total Cohort as of June of the 4th year of school and as of August 2009, 2004 Total Cohort as of June of the 5th year of school, 2003 Total Cohort as of June of the 6th year of school.
County District
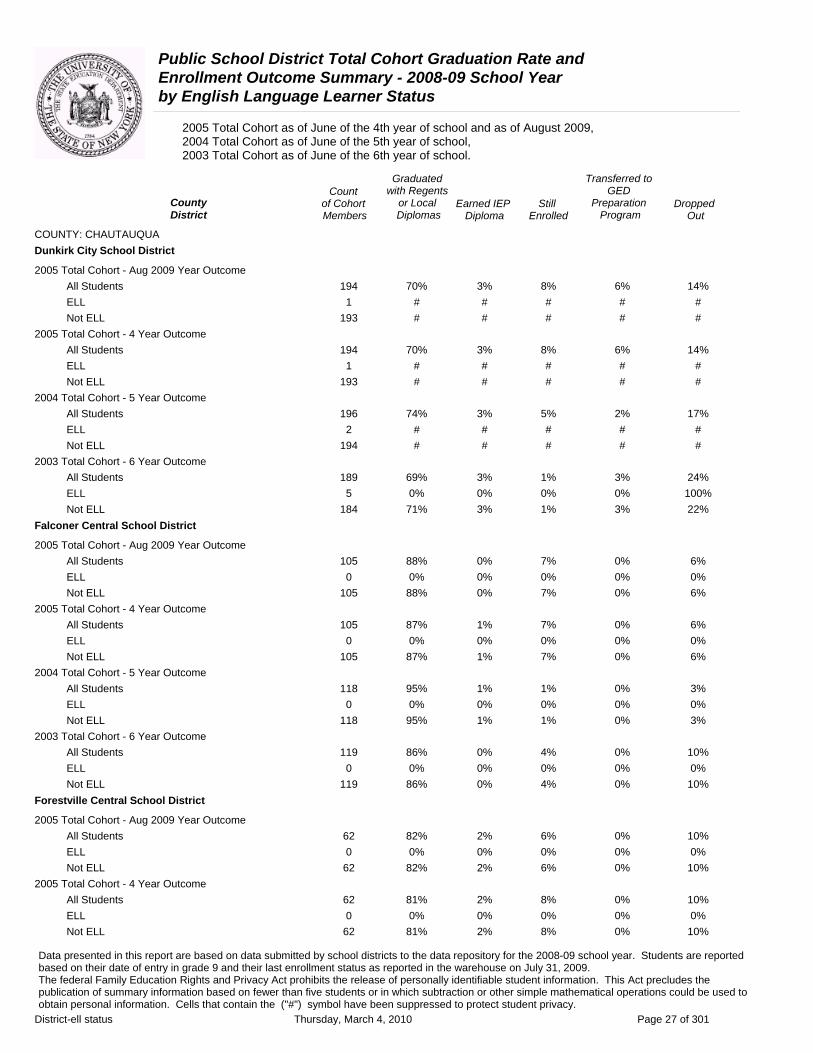
COUNTY: CHAUTAUQUA Dunkirk City School District
2005 Total Cohort - Aug 2009 Year Outcome All Students ELL Not ELL
2005 Total Cohort - 4 Year Outcome All Students ELL Not ELL
2004 Total Cohort - 5 Year Outcome All Students ELL Not ELL
2003 Total Cohort - 6 Year Outcome All Students ELL Not ELL
Falconer Central School District
2005 Total Cohort - Aug 2009 Year Outcome All Students ELL Not ELL
2005 Total Cohort - 4 Year Outcome All Students ELL Not ELL
2004 Total Cohort - 5 Year Outcome All Students ELL Not ELL
2003 Total Cohort - 6 Year Outcome All Students ELL Not ELL
Forestville Central School District
2005 Total Cohort - Aug 2009 Year Outcome All Students ELL Not ELL
2005 Total Cohort - 4 Year Outcome All Students ELL Not ELL
Count of Cohort Members
194 1
193
194 1
193
196 2
194
189 5
184
105 0
105
105 0
105
118 0
118
119 0
119
62 0 62
62 0 62
Graduated with Regents
or Local Diplomas
70%
#
#
70%
#
#
74%
#
#
69%
0%
71%
88%
0%
88%
87%
0%
87%
95%
0%
95%
86%
0%
86%
82%
0%
82%
81%
0%
81%
Earned IEP Diploma
3% # #
3% # #
3% # #
3% 0% 3%
0% 0% 0%
1% 0% 1%
1% 0% 1%
0% 0% 0%
2% 0% 2%
2% 0% 2%
Still Enrolled
8% # #
8% # #
5% # #
1% 0% 1%
7% 0% 7%
7% 0% 7%
1% 0% 1%
4% 0% 4%
6% 0% 6%
8% 0% 8%
Transferred to GED
Preparation Program
Dropped Out
6% 14% # # # #
6% 14% # # # #
2% 17% # # # #
3% 24% 0% 100% 3% 22%
0% 6% 0% 0% 0% 6%
0% 6% 0% 0% 0% 6%
0% 3% 0% 0% 0% 3%
0% 10% 0% 0% 0% 10%
0% 10% 0% 0% 0% 10%
0% 10% 0% 0% 0% 10%
Data presented in this report are based on data submitted by school districts to the data repository for the 2008-09 school year. Students are reported based on their date of entry in grade 9 and their last enrollment status as reported in the warehouse on July 31, 2009. The federal Family Education Rights and Privacy Act prohibits the release of personally identifiable student information. This Act precludes the publication of summary information based on fewer than five students or in which subtraction or other simple mathematical operations could be used to obtain personal information. Cells that contain the ("#") symbol have been suppressed to protect student privacy.
District-ell status Thursday, March 4, 2010 Page 27 of 301

Public School District Total Cohort Graduation Rate and Enrollment Outcome Summary - 2008-09 School Year by English Language Learner Status
2005 Total Cohort as of June of the 4th year of school and as of August 2009, 2004 Total Cohort as of June of the 5th year of school, 2003 Total Cohort as of June of the 6th year of school.
Graduated Transferred to Count with Regents GED
County of Cohort or Local Earned IEP Still Preparation DroppedDistrict Members Diplomas Diploma Enrolled Program Out
COUNTY: CHAUTAUQUA Forestville Central School District
2004 Total Cohort - 5 Year Outcome All Students 56 88% 2% 4% 0% 7% ELL 0 0% 0% 0% 0% 0% Not ELL 56 88% 2% 4% 0% 7%
2003 Total Cohort - 6 Year Outcome All Students 52 87% 8% 0% 0% 6% ELL 0 0% 0% 0% 0% 0% Not ELL 52 87% 8% 0% 0% 6%
Fredonia Central School District
2005 Total Cohort - Aug 2009 Year Outcome All Students 178 80% 1% 8% 0% 11% ELL 1 # # # # # Not ELL 177 # # # # #
2005 Total Cohort - 4 Year Outcome All Students 178 79% 1% 10% 0% 11% ELL 1 # # # # # Not ELL 177 # # # # #
2004 Total Cohort - 5 Year Outcome All Students 153 92% 1% 0% 0% 8% ELL 1 # # # # # Not ELL 152 # # # # #
2003 Total Cohort - 6 Year Outcome All Students 153 91% 1% 1% 0% 7% ELL 1 # # # # # Not ELL 152 # # # # #
Frewsburg Central School District
2005 Total Cohort - Aug 2009 Year Outcome All Students 69 94% 3% 3% 0% 0% ELL 0 0% 0% 0% 0% 0% Not ELL 69 94% 3% 3% 0% 0%
2005 Total Cohort - 4 Year Outcome All Students 69 94% 3% 3% 0% 0% ELL 0 0% 0% 0% 0% 0% Not ELL 69 94% 3% 3% 0% 0%
2004 Total Cohort - 5 Year Outcome All Students 88 91% 2% 2% 0% 5% ELL 0 0% 0% 0% 0% 0% Not ELL 88 91% 2% 2% 0% 5%
2003 Total Cohort - 6 Year Outcome All Students 77 91% 4% 1% 0% 4% ELL 0 0% 0% 0% 0% 0% Not ELL 77 91% 4% 1% 0% 4%
Data presented in this report are based on data submitted by school districts to the data repository for the 2008-09 school year. Students are reported based on their date of entry in grade 9 and their last enrollment status as reported in the warehouse on July 31, 2009. The federal Family Education Rights and Privacy Act prohibits the release of personally identifiable student information. This Act precludes the publication of summary information based on fewer than five students or in which subtraction or other simple mathematical operations could be used to obtain personal information. Cells that contain the ("#") symbol have been suppressed to protect student privacy.
District-ell status Thursday, March 4, 2010 Page 28 of 301
Public School District Total Cohort Graduation Rate and Enrollment Outcome Summary - 2008-09 School Year by English Language Learner Status
2005 Total Cohort as of June of the 4th year of school and as of August 2009, 2004 Total Cohort as of June of the 5th year of school, 2003 Total Cohort as of June of the 6th year of school.
Graduated Transferred to Count with Regents GED
County of Cohort or Local Earned IEP Still Preparation DroppedDistrict Members Diplomas Diploma Enrolled Program Out
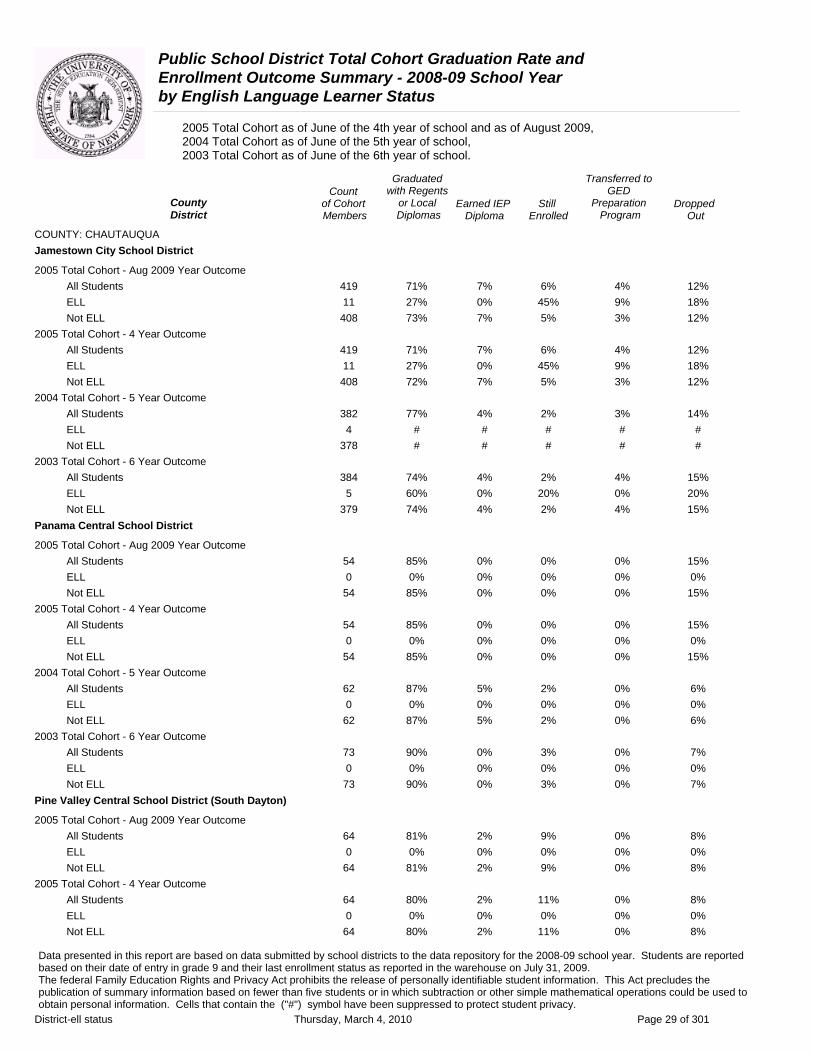
COUNTY: CHAUTAUQUA Jamestown City School District
2005 Total Cohort - Aug 2009 Year Outcome All Students 419 71% 7% 6% 4% 12% ELL 11 27% 0% 45% 9% 18% Not ELL 408 73% 7% 5% 3% 12%
2005 Total Cohort - 4 Year Outcome All Students 419 71% 7% 6% 4% 12% ELL 11 27% 0% 45% 9% 18% Not ELL 408 72% 7% 5% 3% 12%
2004 Total Cohort - 5 Year Outcome All Students 382 77% 4% 2% 3% 14% ELL 4 # # # # # Not ELL 378 # # # # #
2003 Total Cohort - 6 Year Outcome All Students 384 74% 4% 2% 4% 15% ELL 5 60% 0% 20% 0% 20% Not ELL 379 74% 4% 2% 4% 15%
Panama Central School District
2005 Total Cohort - Aug 2009 Year Outcome All Students 54 85% 0% 0% 0% 15% ELL 0 0% 0% 0% 0% 0% Not ELL 54 85% 0% 0% 0% 15%
2005 Total Cohort - 4 Year Outcome All Students 54 85% 0% 0% 0% 15% ELL 0 0% 0% 0% 0% 0% Not ELL 54 85% 0% 0% 0% 15%
2004 Total Cohort - 5 Year Outcome All Students 62 87% 5% 2% 0% 6% ELL 0 0% 0% 0% 0% 0% Not ELL 62 87% 5% 2% 0% 6%
2003 Total Cohort - 6 Year Outcome All Students 73 90% 0% 3% 0% 7% ELL 0 0% 0% 0% 0% 0% Not ELL 73 90% 0% 3% 0% 7%
Pine Valley Central School District (South Dayton)
2005 Total Cohort - Aug 2009 Year Outcome All Students 64 81% 2% 9% 0% 8% ELL 0 0% 0% 0% 0% 0% Not ELL 64 81% 2% 9% 0% 8%
2005 Total Cohort - 4 Year Outcome All Students 64 80% 2% 11% 0% 8% ELL 0 0% 0% 0% 0% 0% Not ELL 64 80% 2% 11% 0% 8%
Data presented in this report are based on data submitted by school districts to the data repository for the 2008-09 school year. Students are reported based on their date of entry in grade 9 and their last enrollment status as reported in the warehouse on July 31, 2009. The federal Family Education Rights and Privacy Act prohibits the release of personally identifiable student information. This Act precludes the publication of summary information based on fewer than five students or in which subtraction or other simple mathematical operations could be used to obtain personal information. Cells that contain the ("#") symbol have been suppressed to protect student privacy.
District-ell status Thursday, March 4, 2010 Page 29 of 301

Public School District Total Cohort Graduation Rate and Enrollment Outcome Summary - 2008-09 School Year by English Language Learner Status
2005 Total Cohort as of June of the 4th year of school and as of August 2009, 2004 Total Cohort as of June of the 5th year of school, 2003 Total Cohort as of June of the 6th year of school.
Graduated Transferred to Count with Regents GED
County of Cohort or Local Earned IEP Still Preparation DroppedDistrict Members Diplomas Diploma Enrolled Program Out
COUNTY: CHAUTAUQUA Pine Valley Central School District (South Dayton)
2004 Total Cohort - 5 Year Outcome All Students 75 84% 4% 1% 0% 11% ELL 0 0% 0% 0% 0% 0% Not ELL 75 84% 4% 1% 0% 11%
2003 Total Cohort - 6 Year Outcome All Students 70 73% 7% 1% 0% 19% ELL 0 0% 0% 0% 0% 0% Not ELL 70 73% 7% 1% 0% 19%
Ripley Central School District
2005 Total Cohort - Aug 2009 Year Outcome All Students 37 68% 5% 3% 0% 24% ELL 0 0% 0% 0% 0% 0% Not ELL 37 68% 5% 3% 0% 24%
2005 Total Cohort - 4 Year Outcome All Students 37 68% 5% 3% 0% 24% ELL 0 0% 0% 0% 0% 0% Not ELL 37 68% 5% 3% 0% 24%
2004 Total Cohort - 5 Year Outcome All Students 40 78% 10% 3% 0% 10% ELL 0 0% 0% 0% 0% 0% Not ELL 40 78% 10% 3% 0% 10%
2003 Total Cohort - 6 Year Outcome All Students 30 80% 10% 7% 0% 3% ELL 0 0% 0% 0% 0% 0% Not ELL 30 80% 10% 7% 0% 3%
Sherman Central School District
2005 Total Cohort - Aug 2009 Year Outcome All Students 42 86% 12% 2% 0% 0% ELL 0 0% 0% 0% 0% 0% Not ELL 42 86% 12% 2% 0% 0%
2005 Total Cohort - 4 Year Outcome All Students 42 86% 12% 2% 0% 0% ELL 0 0% 0% 0% 0% 0% Not ELL 42 86% 12% 2% 0% 0%
2004 Total Cohort - 5 Year Outcome All Students 27 89% 4% 0% 0% 7% ELL 0 0% 0% 0% 0% 0% Not ELL 27 89% 4% 0% 0% 7%
2003 Total Cohort - 6 Year Outcome All Students 41 85% 0% 0% 0% 15% ELL 0 0% 0% 0% 0% 0% Not ELL 41 85% 0% 0% 0% 15%
Data presented in this report are based on data submitted by school districts to the data repository for the 2008-09 school year. Students are reported based on their date of entry in grade 9 and their last enrollment status as reported in the warehouse on July 31, 2009. The federal Family Education Rights and Privacy Act prohibits the release of personally identifiable student information. This Act precludes the publication of summary information based on fewer than five students or in which subtraction or other simple mathematical operations could be used to obtain personal information. Cells that contain the ("#") symbol have been suppressed to protect student privacy.
District-ell status Thursday, March 4, 2010 Page 30 of 301

Public School District Total Cohort Graduation Rate and Enrollment Outcome Summary - 2008-09 School Year by English Language Learner Status
2005 Total Cohort as of June of the 4th year of school and as of August 2009, 2004 Total Cohort as of June of the 5th year of school, 2003 Total Cohort as of June of the 6th year of school.
Graduated Transferred to Count with Regents GED
County of Cohort or Local Earned IEP Still Preparation DroppedDistrict Members Diplomas Diploma Enrolled Program Out
COUNTY: CHAUTAUQUA Silver Creek Central School District
2005 Total Cohort - Aug 2009 Year Outcome All Students 97 79% 6% 4% 0% 10% ELL 0 0% 0% 0% 0% 0% Not ELL 97 79% 6% 4% 0% 10%
2005 Total Cohort - 4 Year Outcome All Students 97 79% 6% 4% 0% 10% ELL 0 0% 0% 0% 0% 0% Not ELL 97 79% 6% 4% 0% 10%
2004 Total Cohort - 5 Year Outcome All Students 99 80% 3% 0% 0% 17% ELL 0 0% 0% 0% 0% 0% Not ELL 99 80% 3% 0% 0% 17%
2003 Total Cohort - 6 Year Outcome All Students 109 85% 4% 0% 0% 11% ELL 0 0% 0% 0% 0% 0% Not ELL 109 85% 4% 0% 0% 11%
Southwestern Central School District At Jamestown
2005 Total Cohort - Aug 2009 Year Outcome All Students 169 89% 2% 2% 1% 6% ELL 0 0% 0% 0% 0% 0% Not ELL 169 89% 2% 2% 1% 6%
2005 Total Cohort - 4 Year Outcome All Students 169 88% 2% 3% 1% 6% ELL 0 0% 0% 0% 0% 0% Not ELL 169 88% 2% 3% 1% 6%
2004 Total Cohort - 5 Year Outcome All Students 146 86% 3% 4% 0% 7% ELL 0 0% 0% 0% 0% 0% Not ELL 146 86% 3% 4% 0% 7%
2003 Total Cohort - 6 Year Outcome All Students 131 90% 6% 0% 2% 2% ELL 0 0% 0% 0% 0% 0% Not ELL 131 90% 6% 0% 2% 2%
Westfield Central School District
2005 Total Cohort - Aug 2009 Year Outcome All Students 71 76% 6% 3% 0% 15% ELL 0 0% 0% 0% 0% 0% Not ELL 71 76% 6% 3% 0% 15%
2005 Total Cohort - 4 Year Outcome All Students 71 76% 6% 3% 0% 15% ELL 0 0% 0% 0% 0% 0% Not ELL 71 76% 6% 3% 0% 15%
Data presented in this report are based on data submitted by school districts to the data repository for the 2008-09 school year. Students are reported based on their date of entry in grade 9 and their last enrollment status as reported in the warehouse on July 31, 2009. The federal Family Education Rights and Privacy Act prohibits the release of personally identifiable student information. This Act precludes the publication of summary information based on fewer than five students or in which subtraction or other simple mathematical operations could be used to obtain personal information. Cells that contain the ("#") symbol have been suppressed to protect student privacy.
District-ell status Thursday, March 4, 2010 Page 31 of 301

Public School District Total Cohort Graduation Rate and Enrollment Outcome Summary - 2008-09 School Year by English Language Learner Status
2005 Total Cohort as of June of the 4th year of school and as of August 2009, 2004 Total Cohort as of June of the 5th year of school, 2003 Total Cohort as of June of the 6th year of school.
Graduated Transferred to Count with Regents GED
County of Cohort or Local Earned IEP Still Preparation DroppedDistrict Members Diplomas Diploma Enrolled Program Out
COUNTY: CHAUTAUQUA Westfield Central School District
2004 Total Cohort - 5 Year Outcome All Students 63 73% 11% 0% 0% 16% ELL 0 0% 0% 0% 0% 0% Not ELL 63 73% 11% 0% 0% 16%
2003 Total Cohort - 6 Year Outcome All Students 82 77% 5% 2% 0% 16% ELL 0 0% 0% 0% 0% 0% Not ELL 82 77% 5% 2% 0% 16%
Data presented in this report are based on data submitted by school districts to the data repository for the 2008-09 school year. Students are reported based on their date of entry in grade 9 and their last enrollment status as reported in the warehouse on July 31, 2009. The federal Family Education Rights and Privacy Act prohibits the release of personally identifiable student information. This Act precludes the publication of summary information based on fewer than five students or in which subtraction or other simple mathematical operations could be used to obtain personal information. Cells that contain the ("#") symbol have been suppressed to protect student privacy.
District-ell status Thursday, March 4, 2010 Page 32 of 301

Public School District Total Cohort Graduation Rate and Enrollment Outcome Summary - 2008-09 School Year by English Language Learner Status
2005 Total Cohort as of June of the 4th year of school and as of August 2009, 2004 Total Cohort as of June of the 5th year of school, 2003 Total Cohort as of June of the 6th year of school.
Graduated Transferred to Count with Regents GED
County District
of Cohort Members
or Local Diplomas
Earned IEP Diploma
Still Enrolled
Preparation Program
Dropped Out
COUNTY: CHEMUNG Elmira City School District
2005 Total Cohort - Aug 2009 Year Outcome All Students 608 65% 6% 13% 0% 16% ELL 0 0% 0% 0% 0% 0% Not ELL 608 65% 6% 13% 0% 16%
2005 Total Cohort - 4 Year Outcome All Students 608 61% 6% 17% 0% 16% ELL 0 0% 0% 0% 0% 0% Not ELL 608 61% 6% 17% 0% 16%
2004 Total Cohort - 5 Year Outcome All Students 610 68% 7% 4% 1% 20% ELL 0 0% 0% 0% 0% 0% Not ELL 610 68% 7% 4% 1% 20%
2003 Total Cohort - 6 Year Outcome All Students 589 64% 7% 4% 3% 22% ELL 2 # # # # # Not ELL 587 # # # # #
Elmira Heights Central School District
2005 Total Cohort - Aug 2009 Year Outcome All Students 84 70% 5% 17% 0% 8% ELL 0 0% 0% 0% 0% 0% Not ELL 84 70% 5% 17% 0% 8%
2005 Total Cohort - 4 Year Outcome All Students 84 69% 5% 18% 0% 8% ELL 0 0% 0% 0% 0% 0% Not ELL 84 69% 5% 18% 0% 8%
2004 Total Cohort - 5 Year Outcome All Students 99 81% 0% 4% 0% 15% ELL 1 # # # # # Not ELL 98 # # # # #
2003 Total Cohort - 6 Year Outcome All Students 86 76% 2% 3% 0% 19% ELL 0 0% 0% 0% 0% 0% Not ELL 86 76% 2% 3% 0% 19%
Horseheads Central School District
2005 Total Cohort - Aug 2009 Year Outcome All Students 337 85% 2% 6% 2% 6% ELL 0 0% 0% 0% 0% 0% Not ELL 337 85% 2% 6% 2% 6%
2005 Total Cohort - 4 Year Outcome All Students 337 82% 2% 9% 2% 6% ELL 0 0% 0% 0% 0% 0% Not ELL 337 82% 2% 9% 2% 6%
Data presented in this report are based on data submitted by school districts to the data repository for the 2008-09 school year. Students are reported based on their date of entry in grade 9 and their last enrollment status as reported in the warehouse on July 31, 2009. The federal Family Education Rights and Privacy Act prohibits the release of personally identifiable student information. This Act precludes the publication of summary information based on fewer than five students or in which subtraction or other simple mathematical operations could be used to obtain personal information. Cells that contain the ("#") symbol have been suppressed to protect student privacy.
District-ell status Thursday, March 4, 2010 Page 33 of 301

Public School District Total Cohort Graduation Rate and Enrollment Outcome Summary - 2008-09 School Year by English Language Learner Status
2005 Total Cohort as of June of the 4th year of school and as of August 2009, 2004 Total Cohort as of June of the 5th year of school, 2003 Total Cohort as of June of the 6th year of school.
Graduated Transferred to Count with Regents GED
County of Cohort or Local Earned IEP Still Preparation DroppedDistrict Members Diplomas Diploma Enrolled Program Out
COUNTY: CHEMUNG Horseheads Central School District
2004 Total Cohort - 5 Year Outcome All Students 395 85% 3% 2% 2% 9% ELL 0 0% 0% 0% 0% 0% Not ELL 395 85% 3% 2% 2% 9%
2003 Total Cohort - 6 Year Outcome All Students 380 86% 2% 1% 2% 9% ELL 0 0% 0% 0% 0% 0% Not ELL 380 86% 2% 1% 2% 9%
Data presented in this report are based on data submitted by school districts to the data repository for the 2008-09 school year. Students are reported based on their date of entry in grade 9 and their last enrollment status as reported in the warehouse on July 31, 2009. The federal Family Education Rights and Privacy Act prohibits the release of personally identifiable student information. This Act precludes the publication of summary information based on fewer than five students or in which subtraction or other simple mathematical operations could be used to obtain personal information. Cells that contain the ("#") symbol have been suppressed to protect student privacy.
District-ell status Thursday, March 4, 2010 Page 34 of 301

Public School District Total Cohort Graduation Rate and Enrollment Outcome Summary - 2008-09 School Year by English Language Learner Status
2005 Total Cohort as of June of the 4th year of school and as of August 2009, 2004 Total Cohort as of June of the 5th year of school, 2003 Total Cohort as of June of the 6th year of school.
Graduated Transferred to Count with Regents GED
County of Cohort or Local Earned IEP Still Preparation DroppedDistrict Members Diplomas Diploma Enrolled Program Out
COUNTY: CHENANGO Afton Central School District
2005 Total Cohort - Aug 2009 Year Outcome All Students 54 76% 6% 7% 2% 9% ELL 0 0% 0% 0% 0% 0% Not ELL 54 76% 6% 7% 2% 9%
2005 Total Cohort - 4 Year Outcome All Students 54 76% 6% 7% 2% 9% ELL 0 0% 0% 0% 0% 0% Not ELL 54 76% 6% 7% 2% 9%
2004 Total Cohort - 5 Year Outcome All Students 55 84% 4% 4% 0% 9% ELL 0 0% 0% 0% 0% 0% Not ELL 55 84% 4% 4% 0% 9%
2003 Total Cohort - 6 Year Outcome All Students 65 78% 5% 2% 2% 14% ELL 0 0% 0% 0% 0% 0% Not ELL 65 78% 5% 2% 2% 14%
Bainbridge-Guilford Central School District
2005 Total Cohort - Aug 2009 Year Outcome All Students 79 89% 0% 5% 0% 6% ELL 0 0% 0% 0% 0% 0% Not ELL 79 89% 0% 5% 0% 6%
2005 Total Cohort - 4 Year Outcome All Students 79 89% 0% 5% 0% 6% ELL 0 0% 0% 0% 0% 0% Not ELL 79 89% 0% 5% 0% 6%
2004 Total Cohort - 5 Year Outcome All Students 90 89% 2% 1% 0% 8% ELL 0 0% 0% 0% 0% 0% Not ELL 90 89% 2% 1% 0% 8%
2003 Total Cohort - 6 Year Outcome All Students 103 87% 3% 0% 0% 10% ELL 0 0% 0% 0% 0% 0% Not ELL 103 87% 3% 0% 0% 10%
Georgetown-South Otselic Central School District
2005 Total Cohort - Aug 2009 Year Outcome All Students 49 90% 0% 6% 4% 0% ELL 0 0% 0% 0% 0% 0% Not ELL 49 90% 0% 6% 4% 0%
2005 Total Cohort - 4 Year Outcome All Students 49 90% 0% 6% 4% 0% ELL 0 0% 0% 0% 0% 0% Not ELL 49 90% 0% 6% 4% 0%
Data presented in this report are based on data submitted by school districts to the data repository for the 2008-09 school year. Students are reported based on their date of entry in grade 9 and their last enrollment status as reported in the warehouse on July 31, 2009. The federal Family Education Rights and Privacy Act prohibits the release of personally identifiable student information. This Act precludes the publication of summary information based on fewer than five students or in which subtraction or other simple mathematical operations could be used to obtain personal information. Cells that contain the ("#") symbol have been suppressed to protect student privacy.
District-ell status Thursday, March 4, 2010 Page 35 of 301

Public School District Total Cohort Graduation Rate and Enrollment Outcome Summary - 2008-09 School Year by English Language Learner Status
2005 Total Cohort as of June of the 4th year of school and as of August 2009, 2004 Total Cohort as of June of the 5th year of school, 2003 Total Cohort as of June of the 6th year of school.
Graduated Transferred to Count with Regents GED
County of Cohort or Local Earned IEP Still Preparation DroppedDistrict Members Diplomas Diploma Enrolled Program Out
COUNTY: CHENANGO Georgetown-South Otselic Central School District
2004 Total Cohort - 5 Year Outcome All Students 47 85% 4% 4% 0% 6% ELL 0 0% 0% 0% 0% 0% Not ELL 47 85% 4% 4% 0% 6%
2003 Total Cohort - 6 Year Outcome All Students 37 84% 8% 3% 0% 5% ELL 0 0% 0% 0% 0% 0% Not ELL 37 84% 8% 3% 0% 5%
Greene Central School District
2005 Total Cohort - Aug 2009 Year Outcome All Students 98 88% 1% 4% 0% 7% ELL 0 0% 0% 0% 0% 0% Not ELL 98 88% 1% 4% 0% 7%
2005 Total Cohort - 4 Year Outcome All Students 98 88% 1% 4% 0% 7% ELL 0 0% 0% 0% 0% 0% Not ELL 98 88% 1% 4% 0% 7%
2004 Total Cohort - 5 Year Outcome All Students 130 80% 0% 8% 2% 11% ELL 0 0% 0% 0% 0% 0% Not ELL 130 80% 0% 8% 2% 11%
2003 Total Cohort - 6 Year Outcome All Students 124 90% 0% 2% 0% 8% ELL 0 0% 0% 0% 0% 0% Not ELL 124 90% 0% 2% 0% 8%
Norwich City School District
2005 Total Cohort - Aug 2009 Year Outcome All Students 191 71% 1% 16% 2% 10% ELL 0 0% 0% 0% 0% 0% Not ELL 191 71% 1% 16% 2% 10%
2005 Total Cohort - 4 Year Outcome All Students 191 71% 1% 16% 2% 10% ELL 0 0% 0% 0% 0% 0% Not ELL 191 71% 1% 16% 2% 10%
2004 Total Cohort - 5 Year Outcome All Students 171 78% 3% 4% 1% 15% ELL 1 # # # # # Not ELL 170 # # # # #
2003 Total Cohort - 6 Year Outcome All Students 188 77% 5% 2% 3% 12% ELL 0 0% 0% 0% 0% 0% Not ELL 188 77% 5% 2% 3% 12%
Data presented in this report are based on data submitted by school districts to the data repository for the 2008-09 school year. Students are reported based on their date of entry in grade 9 and their last enrollment status as reported in the warehouse on July 31, 2009. The federal Family Education Rights and Privacy Act prohibits the release of personally identifiable student information. This Act precludes the publication of summary information based on fewer than five students or in which subtraction or other simple mathematical operations could be used to obtain personal information. Cells that contain the ("#") symbol have been suppressed to protect student privacy.
District-ell status Thursday, March 4, 2010 Page 36 of 301
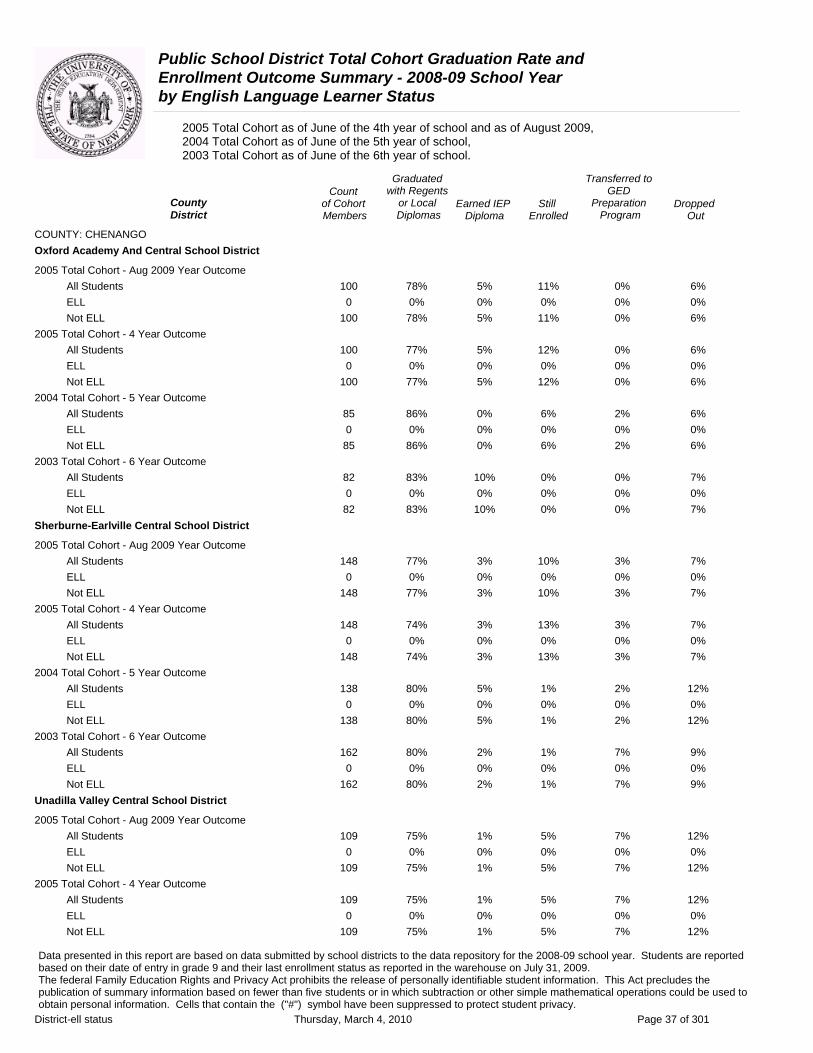
Public School District Total Cohort Graduation Rate and Enrollment Outcome Summary - 2008-09 School Year by English Language Learner Status
2005 Total Cohort as of June of the 4th year of school and as of August 2009, 2004 Total Cohort as of June of the 5th year of school, 2003 Total Cohort as of June of the 6th year of school.
Graduated Transferred to Count with Regents GED
County of Cohort or Local Earned IEP Still Preparation DroppedDistrict Members Diplomas Diploma Enrolled Program Out
COUNTY: CHENANGO Oxford Academy And Central School District
2005 Total Cohort - Aug 2009 Year Outcome All Students 100 78% 5% 11% 0% 6% ELL 0 0% 0% 0% 0% 0% Not ELL 100 78% 5% 11% 0% 6%
2005 Total Cohort - 4 Year Outcome All Students 100 77% 5% 12% 0% 6% ELL 0 0% 0% 0% 0% 0% Not ELL 100 77% 5% 12% 0% 6%
2004 Total Cohort - 5 Year Outcome All Students 85 86% 0% 6% 2% 6% ELL 0 0% 0% 0% 0% 0% Not ELL 85 86% 0% 6% 2% 6%
2003 Total Cohort - 6 Year Outcome All Students 82 83% 10% 0% 0% 7% ELL 0 0% 0% 0% 0% 0% Not ELL 82 83% 10% 0% 0% 7%
Sherburne-Earlville Central School District
2005 Total Cohort - Aug 2009 Year Outcome All Students 148 77% 3% 10% 3% 7% ELL 0 0% 0% 0% 0% 0% Not ELL 148 77% 3% 10% 3% 7%
2005 Total Cohort - 4 Year Outcome All Students 148 74% 3% 13% 3% 7% ELL 0 0% 0% 0% 0% 0% Not ELL 148 74% 3% 13% 3% 7%
2004 Total Cohort - 5 Year Outcome All Students 138 80% 5% 1% 2% 12% ELL 0 0% 0% 0% 0% 0% Not ELL 138 80% 5% 1% 2% 12%
2003 Total Cohort - 6 Year Outcome All Students 162 80% 2% 1% 7% 9% ELL 0 0% 0% 0% 0% 0% Not ELL 162 80% 2% 1% 7% 9%
Unadilla Valley Central School District
2005 Total Cohort - Aug 2009 Year Outcome All Students 109 75% 1% 5% 7% 12% ELL 0 0% 0% 0% 0% 0% Not ELL 109 75% 1% 5% 7% 12%
2005 Total Cohort - 4 Year Outcome All Students 109 75% 1% 5% 7% 12% ELL 0 0% 0% 0% 0% 0% Not ELL 109 75% 1% 5% 7% 12%
Data presented in this report are based on data submitted by school districts to the data repository for the 2008-09 school year. Students are reported based on their date of entry in grade 9 and their last enrollment status as reported in the warehouse on July 31, 2009. The federal Family Education Rights and Privacy Act prohibits the release of personally identifiable student information. This Act precludes the publication of summary information based on fewer than five students or in which subtraction or other simple mathematical operations could be used to obtain personal information. Cells that contain the ("#") symbol have been suppressed to protect student privacy.
District-ell status Thursday, March 4, 2010 Page 37 of 301
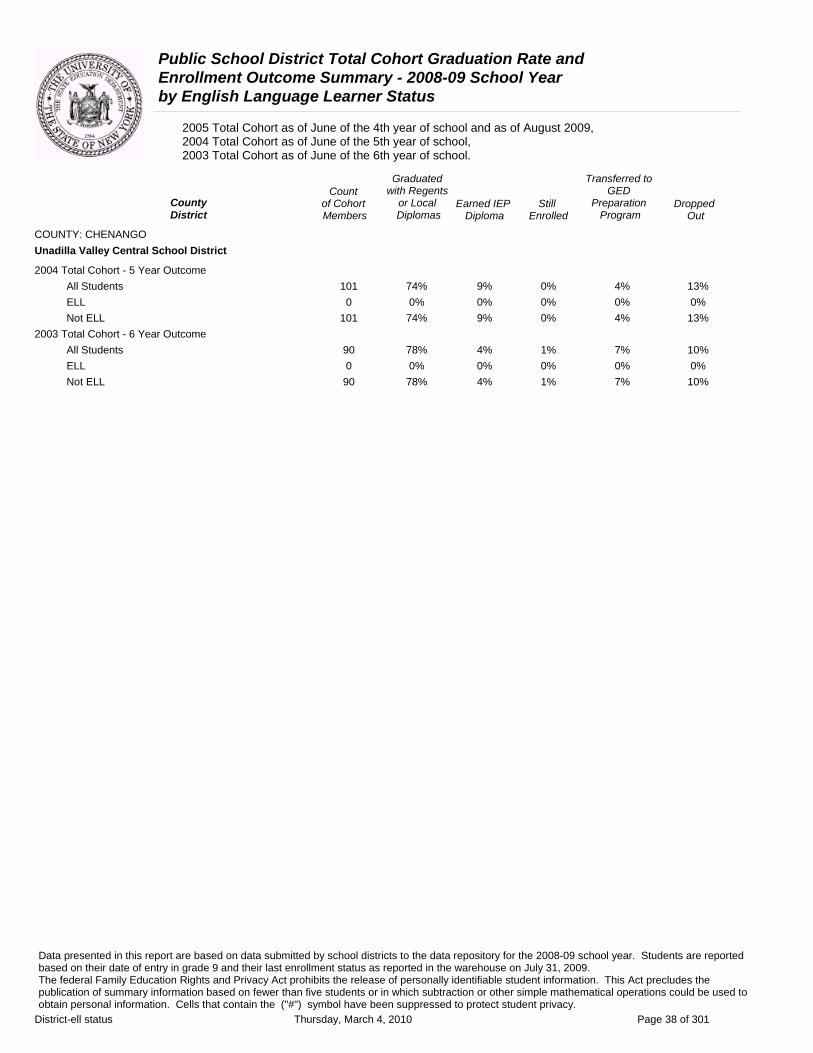
Public School District Total Cohort Graduation Rate and Enrollment Outcome Summary - 2008-09 School Year by English Language Learner Status
2005 Total Cohort as of June of the 4th year of school and as of August 2009, 2004 Total Cohort as of June of the 5th year of school, 2003 Total Cohort as of June of the 6th year of school.
Graduated Transferred to Count with Regents GED
County of Cohort or Local Earned IEP Still Preparation DroppedDistrict Members Diplomas Diploma Enrolled Program Out
COUNTY: CHENANGO Unadilla Valley Central School District
2004 Total Cohort - 5 Year Outcome All Students 101 74% 9% 0% 4% 13% ELL 0 0% 0% 0% 0% 0% Not ELL 101 74% 9% 0% 4% 13%
2003 Total Cohort - 6 Year Outcome All Students 90 78% 4% 1% 7% 10% ELL 0 0% 0% 0% 0% 0% Not ELL 90 78% 4% 1% 7% 10%
Data presented in this report are based on data submitted by school districts to the data repository for the 2008-09 school year. Students are reported based on their date of entry in grade 9 and their last enrollment status as reported in the warehouse on July 31, 2009. The federal Family Education Rights and Privacy Act prohibits the release of personally identifiable student information. This Act precludes the publication of summary information based on fewer than five students or in which subtraction or other simple mathematical operations could be used to obtain personal information. Cells that contain the ("#") symbol have been suppressed to protect student privacy.
District-ell status Thursday, March 4, 2010 Page 38 of 301

Public School District Total Cohort Graduation Rate and Enrollment Outcome Summary - 2008-09 School Year by English Language Learner Status
2005 Total Cohort as of June of the 4th year of school and as of August 2009, 2004 Total Cohort as of June of the 5th year of school, 2003 Total Cohort as of June of the 6th year of school.
Graduated Transferred to Count with Regents GED
County of Cohort or Local Earned IEP Still Preparation DroppedDistrict Members Diplomas Diploma Enrolled Program Out
COUNTY: CLINTON Ausable Valley Central School District
2005 Total Cohort - Aug 2009 Year Outcome All Students 135 84% 2% 4% 2% 7% ELL 0 0% 0% 0% 0% 0% Not ELL 135 84% 2% 4% 2% 7%
2005 Total Cohort - 4 Year Outcome All Students 135 83% 2% 5% 2% 7% ELL 0 0% 0% 0% 0% 0% Not ELL 135 83% 2% 5% 2% 7%
2004 Total Cohort - 5 Year Outcome All Students 102 68% 11% 5% 6% 10% ELL 0 0% 0% 0% 0% 0% Not ELL 102 68% 11% 5% 6% 10%
2003 Total Cohort - 6 Year Outcome All Students 111 79% 2% 0% 2% 17% ELL 0 0% 0% 0% 0% 0% Not ELL 111 79% 2% 0% 2% 17%
Beekmantown Central School District
2005 Total Cohort - Aug 2009 Year Outcome All Students 183 78% 1% 8% 1% 14% ELL 0 0% 0% 0% 0% 0% Not ELL 183 78% 1% 8% 1% 14%
2005 Total Cohort - 4 Year Outcome All Students 183 78% 1% 8% 1% 14% ELL 0 0% 0% 0% 0% 0% Not ELL 183 78% 1% 8% 1% 14%
2004 Total Cohort - 5 Year Outcome All Students 181 77% 2% 3% 1% 17% ELL 0 0% 0% 0% 0% 0% Not ELL 181 77% 2% 3% 1% 17%
2003 Total Cohort - 6 Year Outcome All Students 174 76% 6% 0% 2% 15% ELL 0 0% 0% 0% 0% 0% Not ELL 174 76% 6% 0% 2% 15%
Chazy Union Free School District
2005 Total Cohort - Aug 2009 Year Outcome All Students 42 76% 12% 5% 0% 7% ELL 0 0% 0% 0% 0% 0% Not ELL 42 76% 12% 5% 0% 7%
2005 Total Cohort - 4 Year Outcome All Students 42 76% 12% 5% 0% 7% ELL 0 0% 0% 0% 0% 0% Not ELL 42 76% 12% 5% 0% 7%
Data presented in this report are based on data submitted by school districts to the data repository for the 2008-09 school year. Students are reported based on their date of entry in grade 9 and their last enrollment status as reported in the warehouse on July 31, 2009. The federal Family Education Rights and Privacy Act prohibits the release of personally identifiable student information. This Act precludes the publication of summary information based on fewer than five students or in which subtraction or other simple mathematical operations could be used to obtain personal information. Cells that contain the ("#") symbol have been suppressed to protect student privacy.
District-ell status Thursday, March 4, 2010 Page 39 of 301
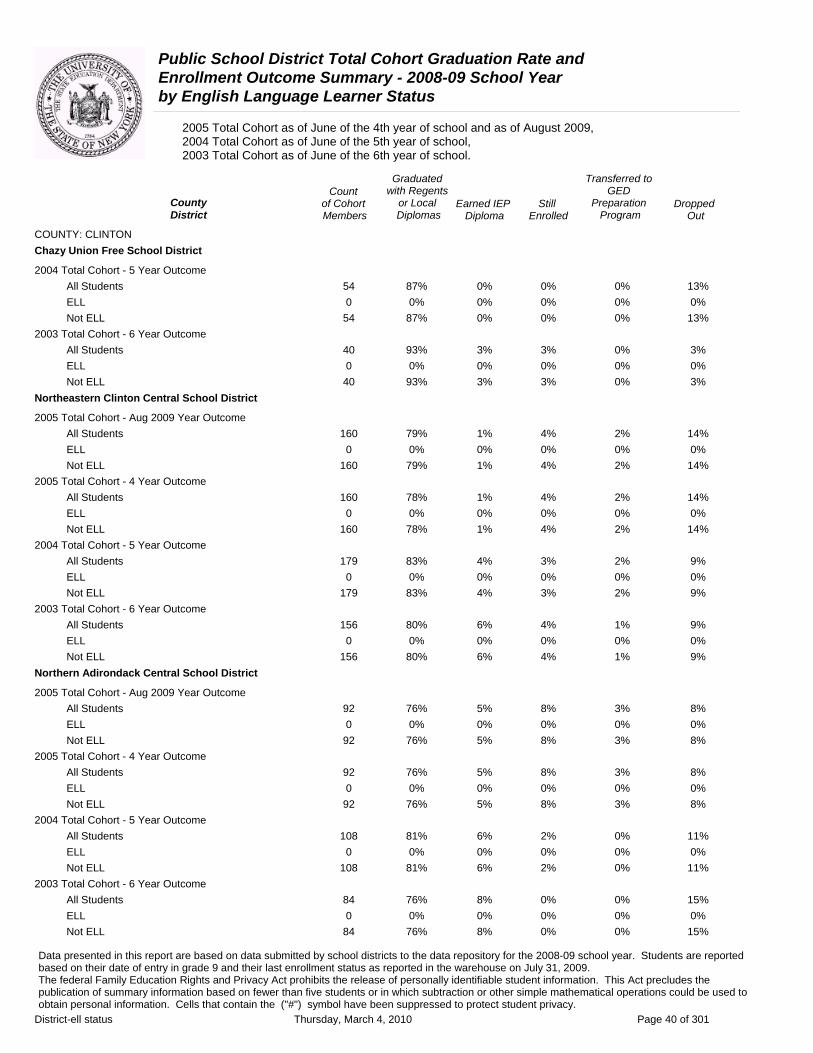
Public School District Total Cohort Graduation Rate and Enrollment Outcome Summary - 2008-09 School Year by English Language Learner Status
2005 Total Cohort as of June of the 4th year of school and as of August 2009, 2004 Total Cohort as of June of the 5th year of school, 2003 Total Cohort as of June of the 6th year of school.
Graduated Transferred to Count with Regents GED
County of Cohort or Local Earned IEP Still Preparation DroppedDistrict Members Diplomas Diploma Enrolled Program Out
COUNTY: CLINTON Chazy Union Free School District
2004 Total Cohort - 5 Year Outcome All Students 54 87% 0% 0% 0% 13% ELL 0 0% 0% 0% 0% 0% Not ELL 54 87% 0% 0% 0% 13%
2003 Total Cohort - 6 Year Outcome All Students 40 93% 3% 3% 0% 3% ELL 0 0% 0% 0% 0% 0% Not ELL 40 93% 3% 3% 0% 3%
Northeastern Clinton Central School District
2005 Total Cohort - Aug 2009 Year Outcome All Students 160 79% 1% 4% 2% 14% ELL 0 0% 0% 0% 0% 0% Not ELL 160 79% 1% 4% 2% 14%
2005 Total Cohort - 4 Year Outcome All Students 160 78% 1% 4% 2% 14% ELL 0 0% 0% 0% 0% 0% Not ELL 160 78% 1% 4% 2% 14%
2004 Total Cohort - 5 Year Outcome All Students 179 83% 4% 3% 2% 9% ELL 0 0% 0% 0% 0% 0% Not ELL 179 83% 4% 3% 2% 9%
2003 Total Cohort - 6 Year Outcome All Students 156 80% 6% 4% 1% 9% ELL 0 0% 0% 0% 0% 0% Not ELL 156 80% 6% 4% 1% 9%
Northern Adirondack Central School District
2005 Total Cohort - Aug 2009 Year Outcome All Students 92 76% 5% 8% 3% 8% ELL 0 0% 0% 0% 0% 0% Not ELL 92 76% 5% 8% 3% 8%
2005 Total Cohort - 4 Year Outcome All Students 92 76% 5% 8% 3% 8% ELL 0 0% 0% 0% 0% 0% Not ELL 92 76% 5% 8% 3% 8%
2004 Total Cohort - 5 Year Outcome All Students 108 81% 6% 2% 0% 11% ELL 0 0% 0% 0% 0% 0% Not ELL 108 81% 6% 2% 0% 11%
2003 Total Cohort - 6 Year Outcome All Students 84 76% 8% 0% 0% 15% ELL 0 0% 0% 0% 0% 0% Not ELL 84 76% 8% 0% 0% 15%
Data presented in this report are based on data submitted by school districts to the data repository for the 2008-09 school year. Students are reported based on their date of entry in grade 9 and their last enrollment status as reported in the warehouse on July 31, 2009. The federal Family Education Rights and Privacy Act prohibits the release of personally identifiable student information. This Act precludes the publication of summary information based on fewer than five students or in which subtraction or other simple mathematical operations could be used to obtain personal information. Cells that contain the ("#") symbol have been suppressed to protect student privacy.
District-ell status Thursday, March 4, 2010 Page 40 of 301
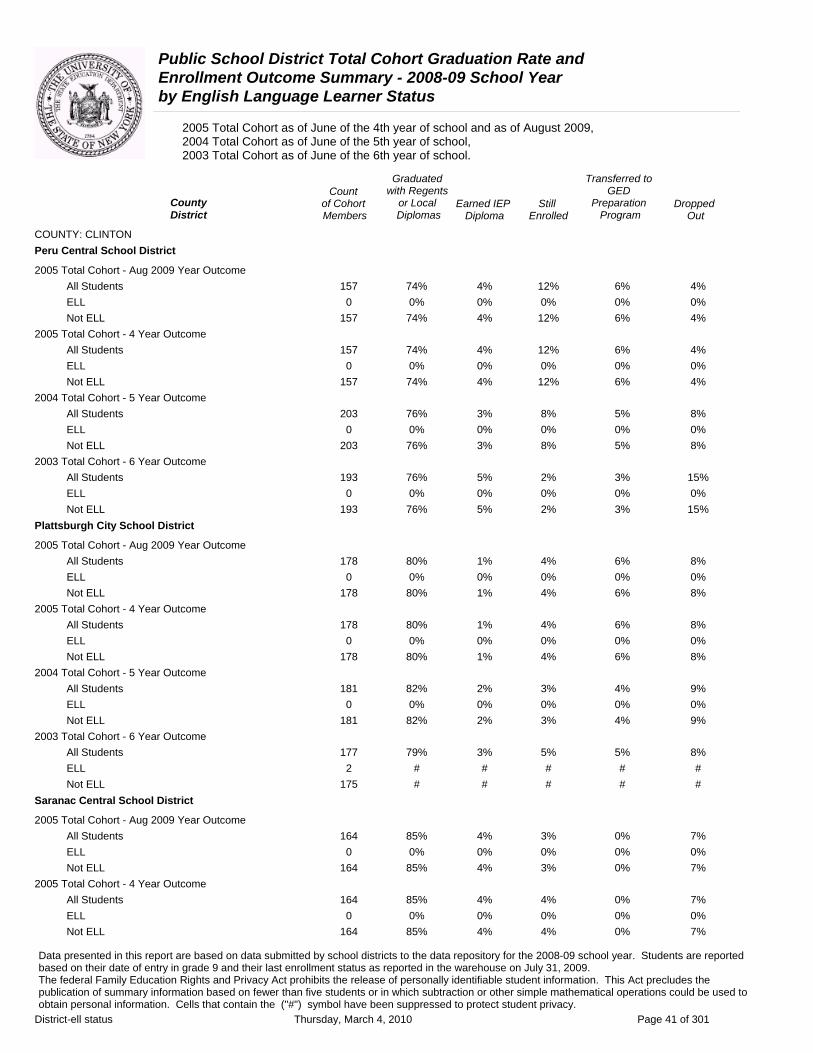
Public School District Total Cohort Graduation Rate and Enrollment Outcome Summary - 2008-09 School Year by English Language Learner Status
2005 Total Cohort as of June of the 4th year of school and as of August 2009, 2004 Total Cohort as of June of the 5th year of school, 2003 Total Cohort as of June of the 6th year of school.
Graduated Transferred to Count with Regents GED
County District
of Cohort Members
or Local Diplomas
Earned IEP Diploma
Still Enrolled
Preparation Program
Dropped Out
COUNTY: CLINTON Peru Central School District
2005 Total Cohort - Aug 2009 Year Outcome All Students 157 74% 4% 12% 6% 4% ELL 0 0% 0% 0% 0% 0% Not ELL 157 74% 4% 12% 6% 4%
2005 Total Cohort - 4 Year Outcome All Students 157 74% 4% 12% 6% 4% ELL 0 0% 0% 0% 0% 0% Not ELL 157 74% 4% 12% 6% 4%
2004 Total Cohort - 5 Year Outcome All Students 203 76% 3% 8% 5% 8% ELL 0 0% 0% 0% 0% 0% Not ELL 203 76% 3% 8% 5% 8%
2003 Total Cohort - 6 Year Outcome All Students 193 76% 5% 2% 3% 15% ELL 0 0% 0% 0% 0% 0% Not ELL 193 76% 5% 2% 3% 15%
Plattsburgh City School District
2005 Total Cohort - Aug 2009 Year Outcome All Students 178 80% 1% 4% 6% 8% ELL 0 0% 0% 0% 0% 0% Not ELL 178 80% 1% 4% 6% 8%
2005 Total Cohort - 4 Year Outcome All Students 178 80% 1% 4% 6% 8% ELL 0 0% 0% 0% 0% 0% Not ELL 178 80% 1% 4% 6% 8%
2004 Total Cohort - 5 Year Outcome All Students 181 82% 2% 3% 4% 9% ELL 0 0% 0% 0% 0% 0% Not ELL 181 82% 2% 3% 4% 9%
2003 Total Cohort - 6 Year Outcome All Students 177 79% 3% 5% 5% 8% ELL 2 # # # # # Not ELL 175 # # # # #
Saranac Central School District
2005 Total Cohort - Aug 2009 Year Outcome All Students 164 85% 4% 3% 0% 7% ELL 0 0% 0% 0% 0% 0% Not ELL 164 85% 4% 3% 0% 7%
2005 Total Cohort - 4 Year Outcome All Students 164 85% 4% 4% 0% 7% ELL 0 0% 0% 0% 0% 0% Not ELL 164 85% 4% 4% 0% 7%
Data presented in this report are based on data submitted by school districts to the data repository for the 2008-09 school year. Students are reported based on their date of entry in grade 9 and their last enrollment status as reported in the warehouse on July 31, 2009. The federal Family Education Rights and Privacy Act prohibits the release of personally identifiable student information. This Act precludes the publication of summary information based on fewer than five students or in which subtraction or other simple mathematical operations could be used to obtain personal information. Cells that contain the ("#") symbol have been suppressed to protect student privacy.
District-ell status Thursday, March 4, 2010 Page 41 of 301

Public School District Total Cohort Graduation Rate and Enrollment Outcome Summary - 2008-09 School Year by English Language Learner Status
2005 Total Cohort as of June of the 4th year of school and as of August 2009, 2004 Total Cohort as of June of the 5th year of school, 2003 Total Cohort as of June of the 6th year of school.
Graduated Transferred to Count with Regents GED
County of Cohort or Local Earned IEP Still Preparation DroppedDistrict Members Diplomas Diploma Enrolled Program Out
COUNTY: CLINTON Saranac Central School District
2004 Total Cohort - 5 Year Outcome All Students 188 81% 3% 4% 0% 12% ELL 0 0% 0% 0% 0% 0% Not ELL 188 81% 3% 4% 0% 12%
2003 Total Cohort - 6 Year Outcome All Students 155 79% 6% 2% 0% 13% ELL 0 0% 0% 0% 0% 0% Not ELL 155 79% 6% 2% 0% 13%
Data presented in this report are based on data submitted by school districts to the data repository for the 2008-09 school year. Students are reported based on their date of entry in grade 9 and their last enrollment status as reported in the warehouse on July 31, 2009. The federal Family Education Rights and Privacy Act prohibits the release of personally identifiable student information. This Act precludes the publication of summary information based on fewer than five students or in which subtraction or other simple mathematical operations could be used to obtain personal information. Cells that contain the ("#") symbol have been suppressed to protect student privacy.
District-ell status Thursday, March 4, 2010 Page 42 of 301
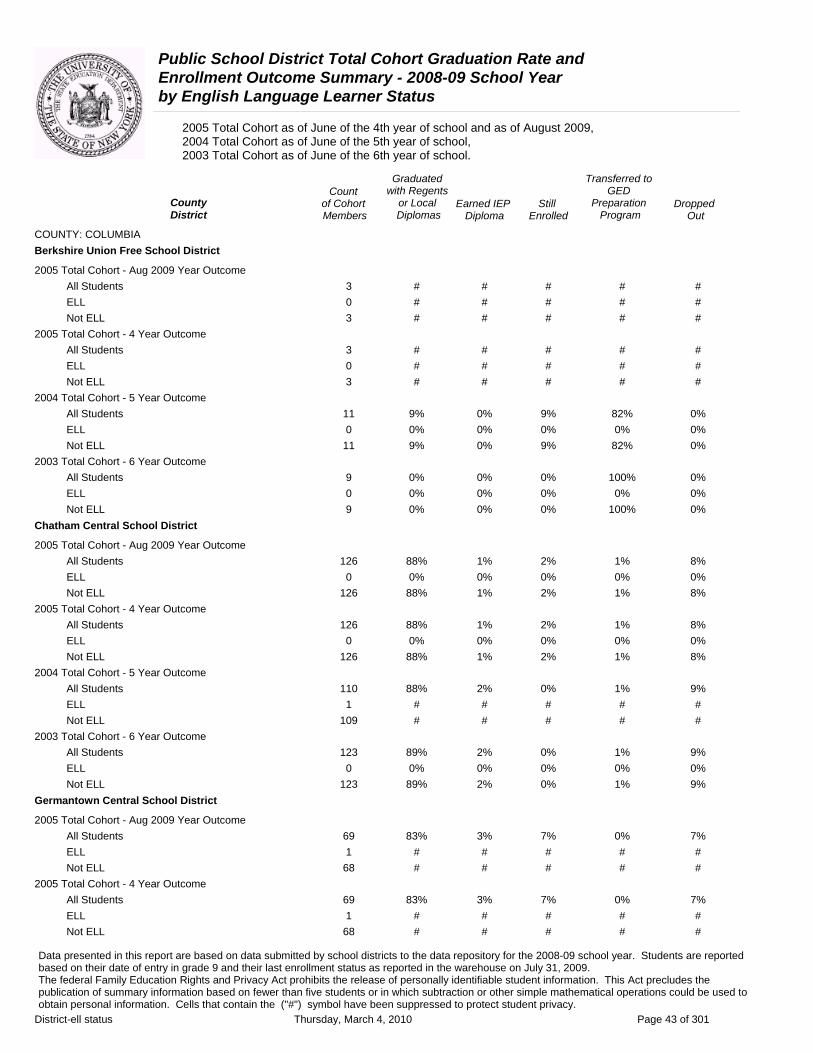
Public School District Total Cohort Graduation Rate and Enrollment Outcome Summary - 2008-09 School Year by English Language Learner Status
2005 Total Cohort as of June of the 4th year of school and as of August 2009, 2004 Total Cohort as of June of the 5th year of school, 2003 Total Cohort as of June of the 6th year of school.
Graduated Transferred to Count with Regents GED
County of Cohort or Local Earned IEP Still Preparation DroppedDistrict Members Diplomas Diploma Enrolled Program Out
COUNTY: COLUMBIA Berkshire Union Free School District
2005 Total Cohort - Aug 2009 Year Outcome All Students 3 # # # # # ELL 0 # # # # # Not ELL 3 # # # # #
2005 Total Cohort - 4 Year Outcome All Students 3 # # # # # ELL 0 # # # # # Not ELL 3 # # # # #
2004 Total Cohort - 5 Year Outcome All Students 11 9% 0% 9% 82% 0% ELL 0 0% 0% 0% 0% 0% Not ELL 11 9% 0% 9% 82% 0%
2003 Total Cohort - 6 Year Outcome All Students 9 0% 0% 0% 100% 0% ELL 0 0% 0% 0% 0% 0% Not ELL 9 0% 0% 0% 100% 0%
Chatham Central School District
2005 Total Cohort - Aug 2009 Year Outcome All Students 126 88% 1% 2% 1% 8% ELL 0 0% 0% 0% 0% 0% Not ELL 126 88% 1% 2% 1% 8%
2005 Total Cohort - 4 Year Outcome All Students 126 88% 1% 2% 1% 8% ELL 0 0% 0% 0% 0% 0% Not ELL 126 88% 1% 2% 1% 8%
2004 Total Cohort - 5 Year Outcome All Students 110 88% 2% 0% 1% 9% ELL 1 # # # # # Not ELL 109 # # # # #
2003 Total Cohort - 6 Year Outcome All Students 123 89% 2% 0% 1% 9% ELL 0 0% 0% 0% 0% 0% Not ELL 123 89% 2% 0% 1% 9%
Germantown Central School District
2005 Total Cohort - Aug 2009 Year Outcome All Students 69 83% 3% 7% 0% 7% ELL 1 # # # # # Not ELL 68 # # # # #
2005 Total Cohort - 4 Year Outcome All Students 69 83% 3% 7% 0% 7% ELL 1 # # # # # Not ELL 68 # # # # #
Data presented in this report are based on data submitted by school districts to the data repository for the 2008-09 school year. Students are reported based on their date of entry in grade 9 and their last enrollment status as reported in the warehouse on July 31, 2009. The federal Family Education Rights and Privacy Act prohibits the release of personally identifiable student information. This Act precludes the publication of summary information based on fewer than five students or in which subtraction or other simple mathematical operations could be used to obtain personal information. Cells that contain the ("#") symbol have been suppressed to protect student privacy.
District-ell status Thursday, March 4, 2010 Page 43 of 301

Public School District Total Cohort Graduation Rate and Enrollment Outcome Summary - 2008-09 School Year by English Language Learner Status
2005 Total Cohort as of June of the 4th year of school and as of August 2009, 2004 Total Cohort as of June of the 5th year of school, 2003 Total Cohort as of June of the 6th year of school.
Graduated Transferred to Count with Regents GED
County District
of Cohort Members
or Local Diplomas
Earned IEP Diploma
Still Enrolled
Preparation Program
Dropped Out
COUNTY: COLUMBIA Germantown Central School District
2004 Total Cohort - 5 Year Outcome All Students 64 91% 2% 0% 0% 8% ELL 0 0% 0% 0% 0% 0% Not ELL 64 91% 2% 0% 0% 8%
2003 Total Cohort - 6 Year Outcome All Students 63 86% 2% 0% 0% 13% ELL 0 0% 0% 0% 0% 0% Not ELL 63 86% 2% 0% 0% 13%
Hudson City School District
2005 Total Cohort - Aug 2009 Year Outcome All Students 169 59% 10% 12% 4% 14% ELL 2 # # # # # Not ELL 167 # # # # #
2005 Total Cohort - 4 Year Outcome All Students 169 57% 10% 14% 4% 14% ELL 2 # # # # # Not ELL 167 # # # # #
2004 Total Cohort - 5 Year Outcome All Students 192 66% 10% 3% 1% 20% ELL 4 # # # # # Not ELL 188 # # # # #
2003 Total Cohort - 6 Year Outcome All Students 158 67% 8% 1% 3% 21% ELL 2 # # # # # Not ELL 156 # # # # #
Kinderhook Central School District
2005 Total Cohort - Aug 2009 Year Outcome All Students 181 80% 2% 7% 1% 10% ELL 1 # # # # # Not ELL 180 # # # # #
2005 Total Cohort - 4 Year Outcome All Students 181 80% 2% 7% 1% 10% ELL 1 # # # # # Not ELL 180 # # # # #
2004 Total Cohort - 5 Year Outcome All Students 177 86% 2% 4% 0% 8% ELL 3 # # # # # Not ELL 174 # # # # #
2003 Total Cohort - 6 Year Outcome All Students 178 87% 1% 1% 0% 11% ELL 1 # # # # # Not ELL 177 # # # # #
Data presented in this report are based on data submitted by school districts to the data repository for the 2008-09 school year. Students are reported based on their date of entry in grade 9 and their last enrollment status as reported in the warehouse on July 31, 2009. The federal Family Education Rights and Privacy Act prohibits the release of personally identifiable student information. This Act precludes the publication of summary information based on fewer than five students or in which subtraction or other simple mathematical operations could be used to obtain personal information. Cells that contain the ("#") symbol have been suppressed to protect student privacy.
District-ell status Thursday, March 4, 2010 Page 44 of 301

Public School District Total Cohort Graduation Rate and Enrollment Outcome Summary - 2008-09 School Year by English Language Learner Status
2005 Total Cohort as of June of the 4th year of school and as of August 2009, 2004 Total Cohort as of June of the 5th year of school, 2003 Total Cohort as of June of the 6th year of school.
Graduated Transferred to Count with Regents GED
County of Cohort or Local Earned IEP Still Preparation DroppedDistrict Members Diplomas Diploma Enrolled Program Out
COUNTY: COLUMBIA New Lebanon Central School District
2005 Total Cohort - Aug 2009 Year Outcome All Students 52 87% 4% 2% 0% 8% ELL 0 0% 0% 0% 0% 0% Not ELL 52 87% 4% 2% 0% 8%
2005 Total Cohort - 4 Year Outcome All Students 52 87% 4% 2% 0% 8% ELL 0 0% 0% 0% 0% 0% Not ELL 52 87% 4% 2% 0% 8%
2004 Total Cohort - 5 Year Outcome All Students 56 88% 0% 2% 0% 11% ELL 0 0% 0% 0% 0% 0% Not ELL 56 88% 0% 2% 0% 11%
2003 Total Cohort - 6 Year Outcome All Students 53 85% 2% 0% 0% 13% ELL 0 0% 0% 0% 0% 0% Not ELL 53 85% 2% 0% 0% 13%
Taconic Hills Central School District
2005 Total Cohort - Aug 2009 Year Outcome All Students 166 77% 7% 5% 1% 11% ELL 0 0% 0% 0% 0% 0% Not ELL 166 77% 7% 5% 1% 11%
2005 Total Cohort - 4 Year Outcome All Students 166 77% 7% 5% 1% 11% ELL 0 0% 0% 0% 0% 0% Not ELL 166 77% 7% 5% 1% 11%
2004 Total Cohort - 5 Year Outcome All Students 162 83% 4% 2% 1% 10% ELL 0 0% 0% 0% 0% 0% Not ELL 162 83% 4% 2% 1% 10%
2003 Total Cohort - 6 Year Outcome All Students 158 78% 2% 1% 3% 16% ELL 0 0% 0% 0% 0% 0% Not ELL 158 78% 2% 1% 3% 16%
Data presented in this report are based on data submitted by school districts to the data repository for the 2008-09 school year. Students are reported based on their date of entry in grade 9 and their last enrollment status as reported in the warehouse on July 31, 2009. The federal Family Education Rights and Privacy Act prohibits the release of personally identifiable student information. This Act precludes the publication of summary information based on fewer than five students or in which subtraction or other simple mathematical operations could be used to obtain personal information. Cells that contain the ("#") symbol have been suppressed to protect student privacy.
District-ell status Thursday, March 4, 2010 Page 45 of 301

Public School District Total Cohort Graduation Rate and Enrollment Outcome Summary - 2008-09 School Year by English Language Learner Status
2005 Total Cohort as of June of the 4th year of school and as of August 2009, 2004 Total Cohort as of June of the 5th year of school, 2003 Total Cohort as of June of the 6th year of school.
Graduated Transferred to Count with Regents GED
County District
of Cohort Members
or Local Diplomas
Earned IEP Diploma
Still Enrolled
Preparation Program
Dropped Out
COUNTY: CORTLAND Cincinnatus Central School District
2005 Total Cohort - Aug 2009 Year Outcome All Students 49 78% 2% 6% 10% 4% ELL 0 0% 0% 0% 0% 0% Not ELL 49 78% 2% 6% 10% 4%
2005 Total Cohort - 4 Year Outcome All Students 49 78% 2% 6% 10% 4% ELL 0 0% 0% 0% 0% 0% Not ELL 49 78% 2% 6% 10% 4%
2004 Total Cohort - 5 Year Outcome All Students 45 62% 7% 2% 16% 13% ELL 0 0% 0% 0% 0% 0% Not ELL 45 62% 7% 2% 16% 13%
2003 Total Cohort - 6 Year Outcome All Students 44 66% 11% 0% 11% 11% ELL 0 0% 0% 0% 0% 0% Not ELL 44 66% 11% 0% 11% 11%
Cortland City School District
2005 Total Cohort - Aug 2009 Year Outcome All Students 244 77% 4% 7% 2% 11% ELL 2 # # # # # Not ELL 242 # # # # #
2005 Total Cohort - 4 Year Outcome All Students 244 74% 4% 9% 2% 11% ELL 2 # # # # # Not ELL 242 # # # # #
2004 Total Cohort - 5 Year Outcome All Students 233 79% 3% 3% 3% 12% ELL 0 0% 0% 0% 0% 0% Not ELL 233 79% 3% 3% 3% 12%
2003 Total Cohort - 6 Year Outcome All Students 219 80% 6% 0% 2% 11% ELL 0 0% 0% 0% 0% 0% Not ELL 219 80% 6% 0% 2% 11%
Homer Central School District
2005 Total Cohort - Aug 2009 Year Outcome All Students 180 82% 2% 6% 3% 8% ELL 0 0% 0% 0% 0% 0% Not ELL 180 82% 2% 6% 3% 8%
2005 Total Cohort - 4 Year Outcome All Students 180 80% 2% 8% 3% 8% ELL 0 0% 0% 0% 0% 0% Not ELL 180 80% 2% 8% 3% 8%
Data presented in this report are based on data submitted by school districts to the data repository for the 2008-09 school year. Students are reported based on their date of entry in grade 9 and their last enrollment status as reported in the warehouse on July 31, 2009. The federal Family Education Rights and Privacy Act prohibits the release of personally identifiable student information. This Act precludes the publication of summary information based on fewer than five students or in which subtraction or other simple mathematical operations could be used to obtain personal information. Cells that contain the ("#") symbol have been suppressed to protect student privacy.
District-ell status Thursday, March 4, 2010 Page 46 of 301

Public School District Total Cohort Graduation Rate and Enrollment Outcome Summary - 2008-09 School Year by English Language Learner Status
2005 Total Cohort as of June of the 4th year of school and as of August 2009, 2004 Total Cohort as of June of the 5th year of school, 2003 Total Cohort as of June of the 6th year of school.
Graduated Transferred to Count with Regents GED
County of Cohort or Local Earned IEP Still Preparation DroppedDistrict Members Diplomas Diploma Enrolled Program Out
COUNTY: CORTLAND Homer Central School District
2004 Total Cohort - 5 Year Outcome All Students 196 87% 5% 1% 1% 7% ELL 0 0% 0% 0% 0% 0% Not ELL 196 87% 5% 1% 1% 7%
2003 Total Cohort - 6 Year Outcome All Students 191 81% 8% 0% 3% 8% ELL 0 0% 0% 0% 0% 0% Not ELL 191 81% 8% 0% 3% 8%
Marathon Central School District
2005 Total Cohort - Aug 2009 Year Outcome All Students 72 81% 7% 3% 4% 6% ELL 0 0% 0% 0% 0% 0% Not ELL 72 81% 7% 3% 4% 6%
2005 Total Cohort - 4 Year Outcome All Students 72 81% 7% 3% 4% 6% ELL 0 0% 0% 0% 0% 0% Not ELL 72 81% 7% 3% 4% 6%
2004 Total Cohort - 5 Year Outcome All Students 80 88% 4% 1% 0% 8% ELL 0 0% 0% 0% 0% 0% Not ELL 80 88% 4% 1% 0% 8%
2003 Total Cohort - 6 Year Outcome All Students 91 82% 5% 1% 2% 9% ELL 0 0% 0% 0% 0% 0% Not ELL 91 82% 5% 1% 2% 9%
Mcgraw Central School District
2005 Total Cohort - Aug 2009 Year Outcome All Students 46 67% 13% 11% 0% 9% ELL 0 0% 0% 0% 0% 0% Not ELL 46 67% 13% 11% 0% 9%
2005 Total Cohort - 4 Year Outcome All Students 46 67% 13% 11% 0% 9% ELL 0 0% 0% 0% 0% 0% Not ELL 46 67% 13% 11% 0% 9%
2004 Total Cohort - 5 Year Outcome All Students 46 72% 13% 0% 2% 13% ELL 0 0% 0% 0% 0% 0% Not ELL 46 72% 13% 0% 2% 13%
2003 Total Cohort - 6 Year Outcome All Students 50 84% 6% 2% 4% 4% ELL 0 0% 0% 0% 0% 0% Not ELL 50 84% 6% 2% 4% 4%
Data presented in this report are based on data submitted by school districts to the data repository for the 2008-09 school year. Students are reported based on their date of entry in grade 9 and their last enrollment status as reported in the warehouse on July 31, 2009. The federal Family Education Rights and Privacy Act prohibits the release of personally identifiable student information. This Act precludes the publication of summary information based on fewer than five students or in which subtraction or other simple mathematical operations could be used to obtain personal information. Cells that contain the ("#") symbol have been suppressed to protect student privacy.
District-ell status Thursday, March 4, 2010 Page 47 of 301
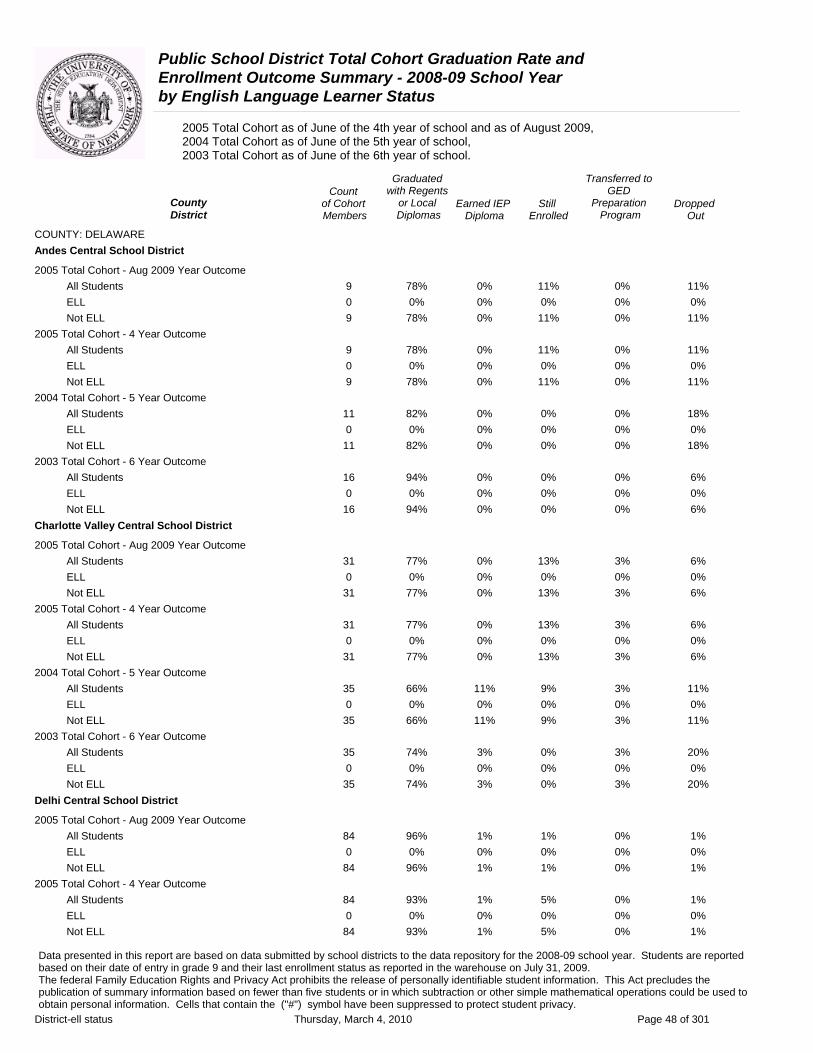
Public School District Total Cohort Graduation Rate and Enrollment Outcome Summary - 2008-09 School Year by English Language Learner Status
2005 Total Cohort as of June of the 4th year of school and as of August 2009, 2004 Total Cohort as of June of the 5th year of school, 2003 Total Cohort as of June of the 6th year of school.
County District
COUNTY: DELAWARE Andes Central School District
2005 Total Cohort - Aug 2009 Year Outcome All Students ELL Not ELL
2005 Total Cohort - 4 Year Outcome All Students ELL Not ELL
2004 Total Cohort - 5 Year Outcome All Students ELL Not ELL
2003 Total Cohort - 6 Year Outcome All Students ELL Not ELL
Charlotte Valley Central School District
2005 Total Cohort - Aug 2009 Year Outcome All Students ELL Not ELL
2005 Total Cohort - 4 Year Outcome All Students ELL Not ELL
2004 Total Cohort - 5 Year Outcome All Students ELL Not ELL
2003 Total Cohort - 6 Year Outcome All Students ELL Not ELL
Delhi Central School District
2005 Total Cohort - Aug 2009 Year Outcome All Students ELL Not ELL
2005 Total Cohort - 4 Year Outcome All Students ELL Not ELL
Count of Cohort Members
9 0 9
9 0 9
11 0 11
16 0 16
31 0 31
31 0 31
35 0 35
35 0 35
84 0 84
84 0 84
Graduated with Regents
or Local Diplomas
78% 0%
78%
78% 0%
78%
82% 0%
82%
94% 0%
94%
77% 0%
77%
77% 0%
77%
66% 0%
66%
74% 0%
74%
96% 0%
96%
93% 0%
93%
Earned IEP Diploma
0% 0% 0%
0% 0% 0%
0% 0% 0%
0% 0% 0%
0% 0% 0%
0% 0% 0%
11% 0%
11%
3% 0% 3%
1% 0% 1%
1% 0% 1%
Still Enrolled
11% 0%
11%
11% 0%
11%
0% 0% 0%
0% 0% 0%
13% 0%
13%
13% 0%
13%
9% 0% 9%
0% 0% 0%
1% 0% 1%
5% 0% 5%
Transferred to GED
Preparation Program
Dropped Out
0% 11% 0% 0% 0% 11%
0% 11% 0% 0% 0% 11%
0% 18% 0% 0% 0% 18%
0% 6% 0% 0% 0% 6%
3% 6% 0% 0% 3% 6%
3% 6% 0% 0% 3% 6%
3% 11% 0% 0% 3% 11%
3% 20% 0% 0% 3% 20%
0% 1% 0% 0% 0% 1%
0% 1% 0% 0% 0% 1%
Data presented in this report are based on data submitted by school districts to the data repository for the 2008-09 school year. Students are reported based on their date of entry in grade 9 and their last enrollment status as reported in the warehouse on July 31, 2009. The federal Family Education Rights and Privacy Act prohibits the release of personally identifiable student information. This Act precludes the publication of summary information based on fewer than five students or in which subtraction or other simple mathematical operations could be used to obtain personal information. Cells that contain the ("#") symbol have been suppressed to protect student privacy.
District-ell status Thursday, March 4, 2010 Page 48 of 301

Public School District Total Cohort Graduation Rate and Enrollment Outcome Summary - 2008-09 School Year by English Language Learner Status
2005 Total Cohort as of June of the 4th year of school and as of August 2009, 2004 Total Cohort as of June of the 5th year of school, 2003 Total Cohort as of June of the 6th year of school.
Graduated Transferred to Count with Regents GED
County District
of Cohort Members
or Local Diplomas
Earned IEP Diploma
Still Enrolled
Preparation Program
Dropped Out
COUNTY: DELAWARE Delhi Central School District
2004 Total Cohort - 5 Year Outcome All Students 88 91% 1% 1% 1% 6% ELL 0 0% 0% 0% 0% 0% Not ELL 88 91% 1% 1% 1% 6%
2003 Total Cohort - 6 Year Outcome All Students 88 88% 1% 1% 1% 9% ELL 0 0% 0% 0% 0% 0% Not ELL 88 88% 1% 1% 1% 9%
Downsville Central School District
2005 Total Cohort - Aug 2009 Year Outcome All Students 30 100% 0% 0% 0% 0% ELL 0 0% 0% 0% 0% 0% Not ELL 30 100% 0% 0% 0% 0%
2005 Total Cohort - 4 Year Outcome All Students 30 100% 0% 0% 0% 0% ELL 0 0% 0% 0% 0% 0% Not ELL 30 100% 0% 0% 0% 0%
2004 Total Cohort - 5 Year Outcome All Students 36 92% 3% 0% 0% 6% ELL 0 0% 0% 0% 0% 0% Not ELL 36 92% 3% 0% 0% 6%
2003 Total Cohort - 6 Year Outcome All Students 36 100% 0% 0% 0% 0% ELL 0 0% 0% 0% 0% 0% Not ELL 36 100% 0% 0% 0% 0%
Franklin Central School District
2005 Total Cohort - Aug 2009 Year Outcome All Students 25 100% 0% 0% 0% 0% ELL 0 0% 0% 0% 0% 0% Not ELL 25 100% 0% 0% 0% 0%
2005 Total Cohort - 4 Year Outcome All Students 25 100% 0% 0% 0% 0% ELL 0 0% 0% 0% 0% 0% Not ELL 25 100% 0% 0% 0% 0%
2004 Total Cohort - 5 Year Outcome All Students 19 89% 5% 5% 0% 0% ELL 0 0% 0% 0% 0% 0% Not ELL 19 89% 5% 5% 0% 0%
2003 Total Cohort - 6 Year Outcome All Students 35 89% 0% 0% 3% 9% ELL 0 0% 0% 0% 0% 0% Not ELL 35 89% 0% 0% 3% 9%
Data presented in this report are based on data submitted by school districts to the data repository for the 2008-09 school year. Students are reported based on their date of entry in grade 9 and their last enrollment status as reported in the warehouse on July 31, 2009. The federal Family Education Rights and Privacy Act prohibits the release of personally identifiable student information. This Act precludes the publication of summary information based on fewer than five students or in which subtraction or other simple mathematical operations could be used to obtain personal information. Cells that contain the ("#") symbol have been suppressed to protect student privacy.
District-ell status Thursday, March 4, 2010 Page 49 of 301
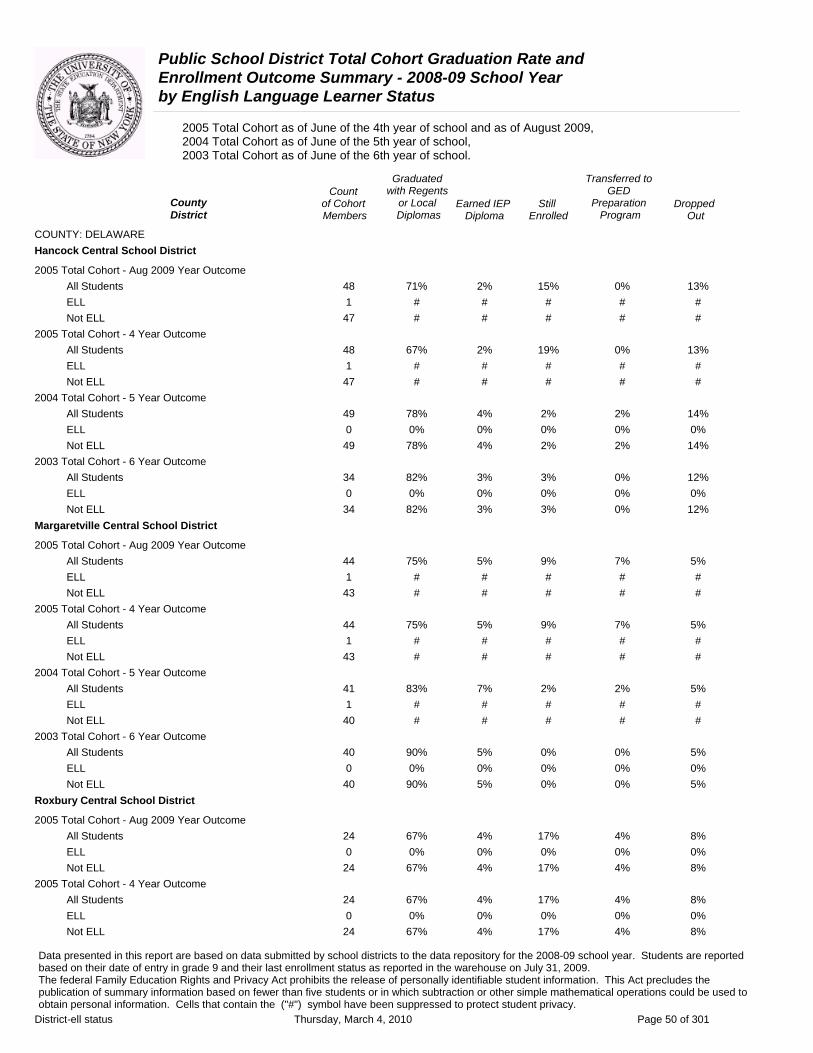
Public School District Total Cohort Graduation Rate and Enrollment Outcome Summary - 2008-09 School Year by English Language Learner Status
2005 Total Cohort as of June of the 4th year of school and as of August 2009, 2004 Total Cohort as of June of the 5th year of school, 2003 Total Cohort as of June of the 6th year of school.
Graduated Transferred to Count with Regents GED
County of Cohort or Local Earned IEP Still Preparation DroppedDistrict Members Diplomas Diploma Enrolled Program Out
COUNTY: DELAWARE Hancock Central School District
2005 Total Cohort - Aug 2009 Year Outcome All Students 48 71% 2% 15% 0% 13% ELL 1 # # # # # Not ELL 47 # # # # #
2005 Total Cohort - 4 Year Outcome All Students 48 67% 2% 19% 0% 13% ELL 1 # # # # # Not ELL 47 # # # # #
2004 Total Cohort - 5 Year Outcome All Students 49 78% 4% 2% 2% 14% ELL 0 0% 0% 0% 0% 0% Not ELL 49 78% 4% 2% 2% 14%
2003 Total Cohort - 6 Year Outcome All Students 34 82% 3% 3% 0% 12% ELL 0 0% 0% 0% 0% 0% Not ELL 34 82% 3% 3% 0% 12%
Margaretville Central School District
2005 Total Cohort - Aug 2009 Year Outcome All Students 44 75% 5% 9% 7% 5% ELL 1 # # # # # Not ELL 43 # # # # #
2005 Total Cohort - 4 Year Outcome All Students 44 75% 5% 9% 7% 5% ELL 1 # # # # # Not ELL 43 # # # # #
2004 Total Cohort - 5 Year Outcome All Students 41 83% 7% 2% 2% 5% ELL 1 # # # # # Not ELL 40 # # # # #
2003 Total Cohort - 6 Year Outcome All Students 40 90% 5% 0% 0% 5% ELL 0 0% 0% 0% 0% 0% Not ELL 40 90% 5% 0% 0% 5%
Roxbury Central School District
2005 Total Cohort - Aug 2009 Year Outcome All Students 24 67% 4% 17% 4% 8% ELL 0 0% 0% 0% 0% 0% Not ELL 24 67% 4% 17% 4% 8%
2005 Total Cohort - 4 Year Outcome All Students 24 67% 4% 17% 4% 8% ELL 0 0% 0% 0% 0% 0% Not ELL 24 67% 4% 17% 4% 8%
Data presented in this report are based on data submitted by school districts to the data repository for the 2008-09 school year. Students are reported based on their date of entry in grade 9 and their last enrollment status as reported in the warehouse on July 31, 2009. The federal Family Education Rights and Privacy Act prohibits the release of personally identifiable student information. This Act precludes the publication of summary information based on fewer than five students or in which subtraction or other simple mathematical operations could be used to obtain personal information. Cells that contain the ("#") symbol have been suppressed to protect student privacy.
District-ell status Thursday, March 4, 2010 Page 50 of 301

Public School District Total Cohort Graduation Rate and Enrollment Outcome Summary - 2008-09 School Year by English Language Learner Status
2005 Total Cohort as of June of the 4th year of school and as of August 2009, 2004 Total Cohort as of June of the 5th year of school, 2003 Total Cohort as of June of the 6th year of school.
Graduated Transferred to Count with Regents GED
County of Cohort or Local Earned IEP Still Preparation DroppedDistrict Members Diplomas Diploma Enrolled Program Out
COUNTY: DELAWARE Roxbury Central School District
2004 Total Cohort - 5 Year Outcome All Students 25 68% 8% 8% 4% 12% ELL 0 0% 0% 0% 0% 0% Not ELL 25 68% 8% 8% 4% 12%
2003 Total Cohort - 6 Year Outcome All Students 32 81% 3% 9% 0% 6% ELL 0 0% 0% 0% 0% 0% Not ELL 32 81% 3% 9% 0% 6%
Sidney Central School District
2005 Total Cohort - Aug 2009 Year Outcome All Students 98 77% 1% 12% 0% 10% ELL 0 0% 0% 0% 0% 0% Not ELL 98 77% 1% 12% 0% 10%
2005 Total Cohort - 4 Year Outcome All Students 98 72% 1% 16% 0% 10% ELL 0 0% 0% 0% 0% 0% Not ELL 98 72% 1% 16% 0% 10%
2004 Total Cohort - 5 Year Outcome All Students 96 82% 3% 4% 0% 10% ELL 0 0% 0% 0% 0% 0% Not ELL 96 82% 3% 4% 0% 10%
2003 Total Cohort - 6 Year Outcome All Students 105 90% 4% 1% 0% 6% ELL 0 0% 0% 0% 0% 0% Not ELL 105 90% 4% 1% 0% 6%
South Kortright Central School District
2005 Total Cohort - Aug 2009 Year Outcome All Students 36 89% 3% 6% 0% 3% ELL 0 0% 0% 0% 0% 0% Not ELL 36 89% 3% 6% 0% 3%
2005 Total Cohort - 4 Year Outcome All Students 36 89% 3% 6% 0% 3% ELL 0 0% 0% 0% 0% 0% Not ELL 36 89% 3% 6% 0% 3%
2004 Total Cohort - 5 Year Outcome All Students 28 86% 4% 7% 0% 4% ELL 0 0% 0% 0% 0% 0% Not ELL 28 86% 4% 7% 0% 4%
2003 Total Cohort - 6 Year Outcome All Students 34 88% 6% 6% 0% 0% ELL 0 0% 0% 0% 0% 0% Not ELL 34 88% 6% 6% 0% 0%
Data presented in this report are based on data submitted by school districts to the data repository for the 2008-09 school year. Students are reported based on their date of entry in grade 9 and their last enrollment status as reported in the warehouse on July 31, 2009. The federal Family Education Rights and Privacy Act prohibits the release of personally identifiable student information. This Act precludes the publication of summary information based on fewer than five students or in which subtraction or other simple mathematical operations could be used to obtain personal information. Cells that contain the ("#") symbol have been suppressed to protect student privacy.
District-ell status Thursday, March 4, 2010 Page 51 of 301
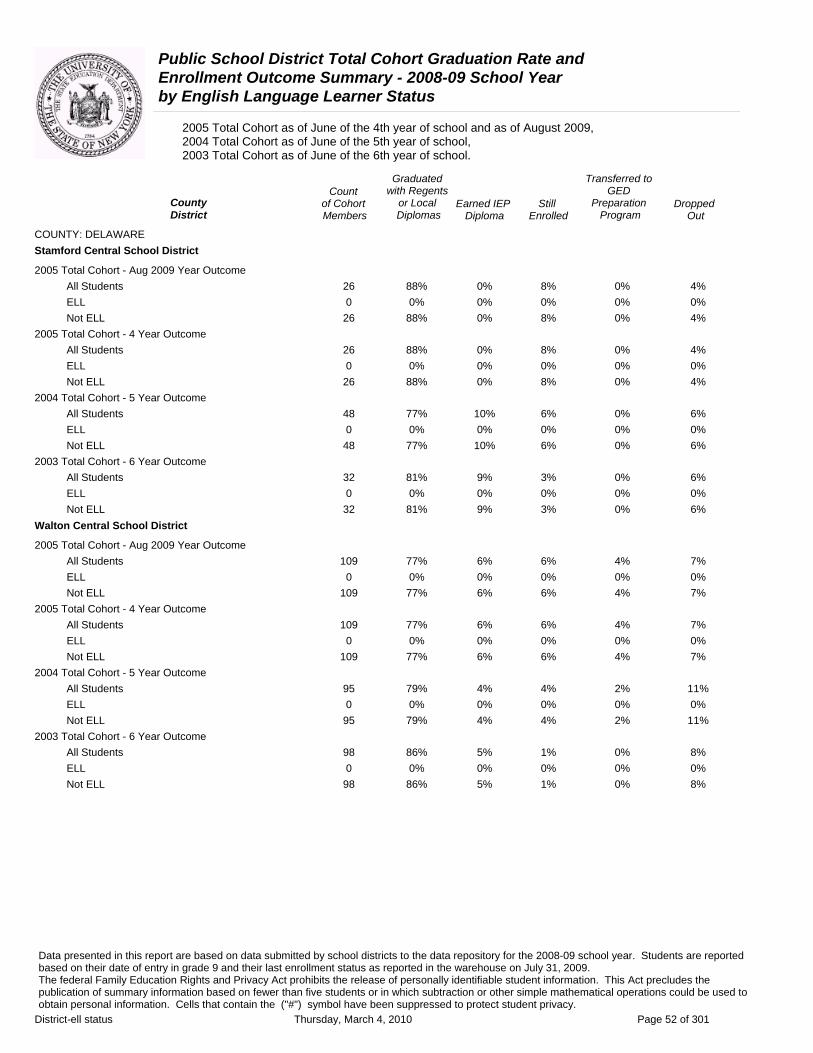
Public School District Total Cohort Graduation Rate and Enrollment Outcome Summary - 2008-09 School Year by English Language Learner Status
2005 Total Cohort as of June of the 4th year of school and as of August 2009, 2004 Total Cohort as of June of the 5th year of school, 2003 Total Cohort as of June of the 6th year of school.
Graduated Transferred to Count with Regents GED
County of Cohort or Local Earned IEP Still Preparation DroppedDistrict Members Diplomas Diploma Enrolled Program Out
COUNTY: DELAWARE Stamford Central School District
2005 Total Cohort - Aug 2009 Year Outcome All Students 26 88% 0% 8% 0% 4% ELL 0 0% 0% 0% 0% 0% Not ELL 26 88% 0% 8% 0% 4%
2005 Total Cohort - 4 Year Outcome All Students 26 88% 0% 8% 0% 4% ELL 0 0% 0% 0% 0% 0% Not ELL 26 88% 0% 8% 0% 4%
2004 Total Cohort - 5 Year Outcome All Students 48 77% 10% 6% 0% 6% ELL 0 0% 0% 0% 0% 0% Not ELL 48 77% 10% 6% 0% 6%
2003 Total Cohort - 6 Year Outcome All Students 32 81% 9% 3% 0% 6% ELL 0 0% 0% 0% 0% 0% Not ELL 32 81% 9% 3% 0% 6%
Walton Central School District
2005 Total Cohort - Aug 2009 Year Outcome All Students 109 77% 6% 6% 4% 7% ELL 0 0% 0% 0% 0% 0% Not ELL 109 77% 6% 6% 4% 7%
2005 Total Cohort - 4 Year Outcome All Students 109 77% 6% 6% 4% 7% ELL 0 0% 0% 0% 0% 0% Not ELL 109 77% 6% 6% 4% 7%
2004 Total Cohort - 5 Year Outcome All Students 95 79% 4% 4% 2% 11% ELL 0 0% 0% 0% 0% 0% Not ELL 95 79% 4% 4% 2% 11%
2003 Total Cohort - 6 Year Outcome All Students 98 86% 5% 1% 0% 8% ELL 0 0% 0% 0% 0% 0% Not ELL 98 86% 5% 1% 0% 8%
Data presented in this report are based on data submitted by school districts to the data repository for the 2008-09 school year. Students are reported based on their date of entry in grade 9 and their last enrollment status as reported in the warehouse on July 31, 2009. The federal Family Education Rights and Privacy Act prohibits the release of personally identifiable student information. This Act precludes the publication of summary information based on fewer than five students or in which subtraction or other simple mathematical operations could be used to obtain personal information. Cells that contain the ("#") symbol have been suppressed to protect student privacy.
District-ell status Thursday, March 4, 2010 Page 52 of 301
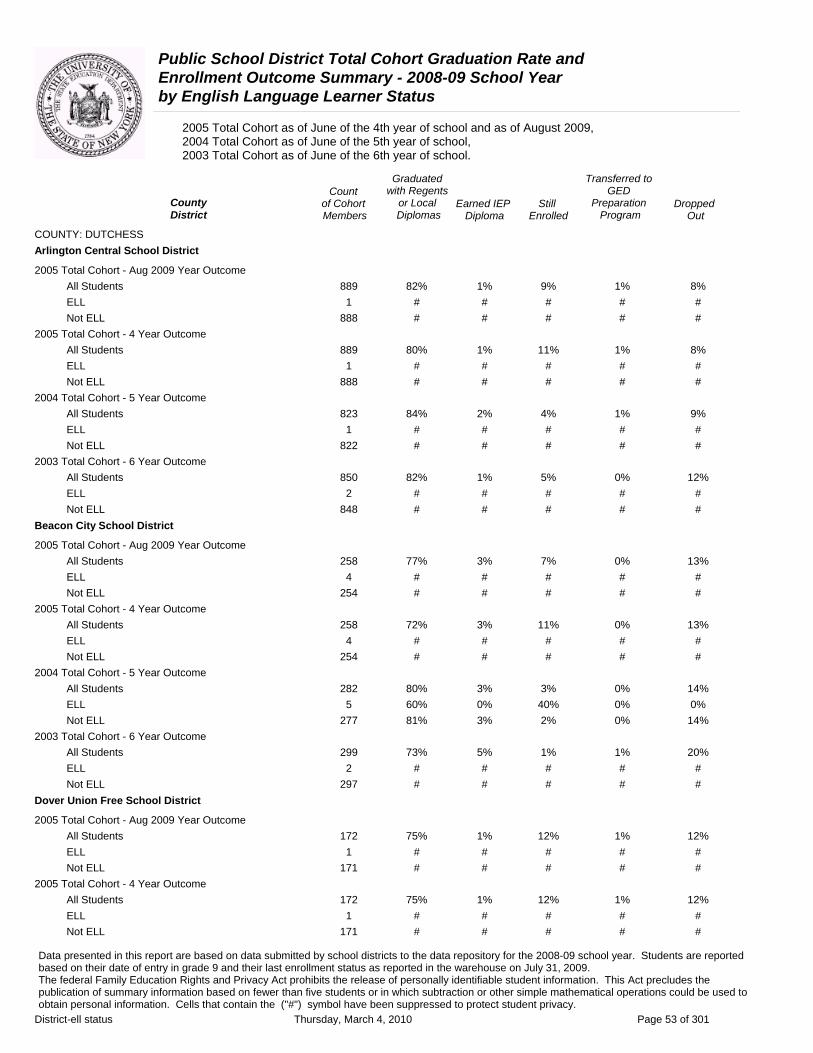
Public School District Total Cohort Graduation Rate and Enrollment Outcome Summary - 2008-09 School Year by English Language Learner Status
2005 Total Cohort as of June of the 4th year of school and as of August 2009, 2004 Total Cohort as of June of the 5th year of school, 2003 Total Cohort as of June of the 6th year of school.
Graduated Transferred to Count with Regents GED
County District
of Cohort Members
or Local Diplomas
Earned IEP Diploma
Still Enrolled
Preparation Program
Dropped Out
COUNTY: DUTCHESS Arlington Central School District
2005 Total Cohort - Aug 2009 Year Outcome All Students 889 82% 1% 9% 1% 8% ELL 1 # # # # # Not ELL 888 # # # # #
2005 Total Cohort - 4 Year Outcome All Students 889 80% 1% 11% 1% 8% ELL 1 # # # # # Not ELL 888 # # # # #
2004 Total Cohort - 5 Year Outcome All Students 823 84% 2% 4% 1% 9% ELL 1 # # # # # Not ELL 822 # # # # #
2003 Total Cohort - 6 Year Outcome All Students 850 82% 1% 5% 0% 12% ELL 2 # # # # # Not ELL 848 # # # # #
Beacon City School District
2005 Total Cohort - Aug 2009 Year Outcome All Students 258 77% 3% 7% 0% 13% ELL 4 # # # # # Not ELL 254 # # # # #
2005 Total Cohort - 4 Year Outcome All Students 258 72% 3% 11% 0% 13% ELL 4 # # # # # Not ELL 254 # # # # #
2004 Total Cohort - 5 Year Outcome All Students 282 80% 3% 3% 0% 14% ELL 5 60% 0% 40% 0% 0% Not ELL 277 81% 3% 2% 0% 14%
2003 Total Cohort - 6 Year Outcome All Students 299 73% 5% 1% 1% 20% ELL 2 # # # # # Not ELL 297 # # # # #
Dover Union Free School District
2005 Total Cohort - Aug 2009 Year Outcome All Students 172 75% 1% 12% 1% 12% ELL 1 # # # # # Not ELL 171 # # # # #
2005 Total Cohort - 4 Year Outcome All Students 172 75% 1% 12% 1% 12% ELL 1 # # # # # Not ELL 171 # # # # #
Data presented in this report are based on data submitted by school districts to the data repository for the 2008-09 school year. Students are reported based on their date of entry in grade 9 and their last enrollment status as reported in the warehouse on July 31, 2009. The federal Family Education Rights and Privacy Act prohibits the release of personally identifiable student information. This Act precludes the publication of summary information based on fewer than five students or in which subtraction or other simple mathematical operations could be used to obtain personal information. Cells that contain the ("#") symbol have been suppressed to protect student privacy.
District-ell status Thursday, March 4, 2010 Page 53 of 301
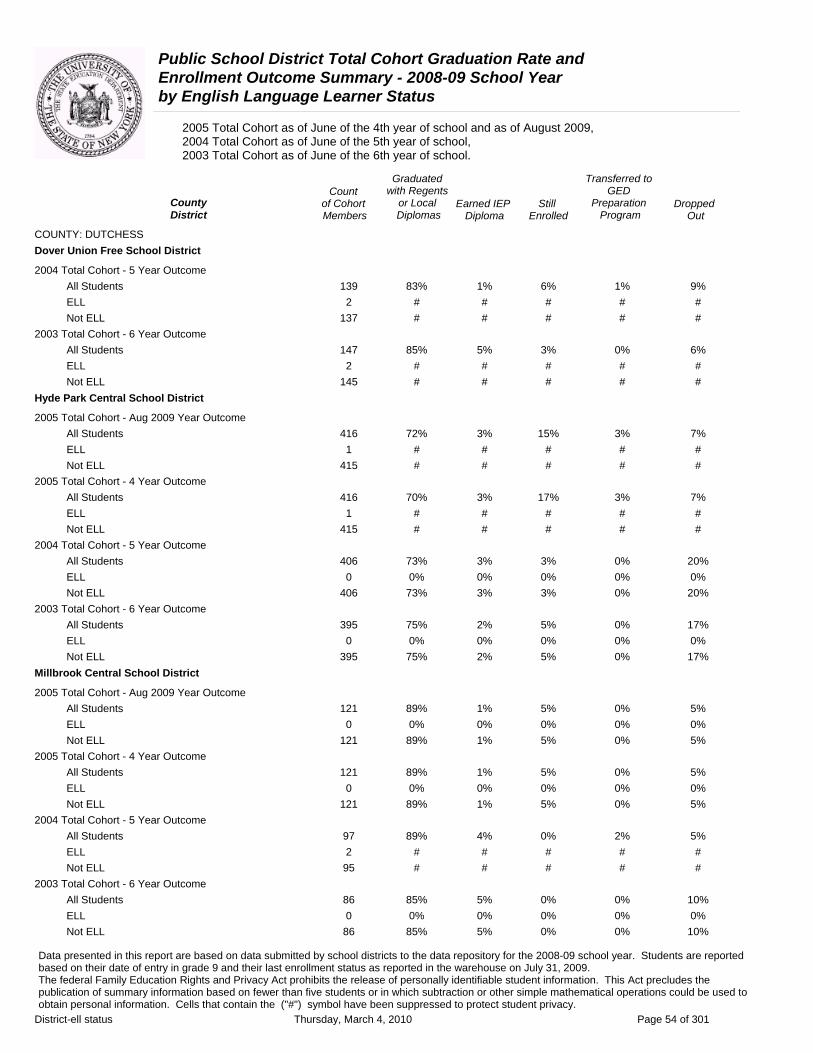
Public School District Total Cohort Graduation Rate and Enrollment Outcome Summary - 2008-09 School Year by English Language Learner Status
2005 Total Cohort as of June of the 4th year of school and as of August 2009, 2004 Total Cohort as of June of the 5th year of school, 2003 Total Cohort as of June of the 6th year of school.
Graduated Transferred to Count with Regents GED
County of Cohort or Local Earned IEP Still Preparation DroppedDistrict Members Diplomas Diploma Enrolled Program Out
COUNTY: DUTCHESS Dover Union Free School District
2004 Total Cohort - 5 Year Outcome All Students 139 83% 1% 6% 1% 9% ELL 2 # # # # # Not ELL 137 # # # # #
2003 Total Cohort - 6 Year Outcome All Students 147 85% 5% 3% 0% 6% ELL 2 # # # # # Not ELL 145 # # # # #
Hyde Park Central School District
2005 Total Cohort - Aug 2009 Year Outcome All Students 416 72% 3% 15% 3% 7% ELL 1 # # # # # Not ELL 415 # # # # #
2005 Total Cohort - 4 Year Outcome All Students 416 70% 3% 17% 3% 7% ELL 1 # # # # # Not ELL 415 # # # # #
2004 Total Cohort - 5 Year Outcome All Students 406 73% 3% 3% 0% 20% ELL 0 0% 0% 0% 0% 0% Not ELL 406 73% 3% 3% 0% 20%
2003 Total Cohort - 6 Year Outcome All Students 395 75% 2% 5% 0% 17% ELL 0 0% 0% 0% 0% 0% Not ELL 395 75% 2% 5% 0% 17%
Millbrook Central School District
2005 Total Cohort - Aug 2009 Year Outcome All Students 121 89% 1% 5% 0% 5% ELL 0 0% 0% 0% 0% 0% Not ELL 121 89% 1% 5% 0% 5%
2005 Total Cohort - 4 Year Outcome All Students 121 89% 1% 5% 0% 5% ELL 0 0% 0% 0% 0% 0% Not ELL 121 89% 1% 5% 0% 5%
2004 Total Cohort - 5 Year Outcome All Students 97 89% 4% 0% 2% 5% ELL 2 # # # # # Not ELL 95 # # # # #
2003 Total Cohort - 6 Year Outcome All Students 86 85% 5% 0% 0% 10% ELL 0 0% 0% 0% 0% 0% Not ELL 86 85% 5% 0% 0% 10%
Data presented in this report are based on data submitted by school districts to the data repository for the 2008-09 school year. Students are reported based on their date of entry in grade 9 and their last enrollment status as reported in the warehouse on July 31, 2009. The federal Family Education Rights and Privacy Act prohibits the release of personally identifiable student information. This Act precludes the publication of summary information based on fewer than five students or in which subtraction or other simple mathematical operations could be used to obtain personal information. Cells that contain the ("#") symbol have been suppressed to protect student privacy.
District-ell status Thursday, March 4, 2010 Page 54 of 301

Public School District Total Cohort Graduation Rate and Enrollment Outcome Summary - 2008-09 School Year by English Language Learner Status
2005 Total Cohort as of June of the 4th year of school and as of August 2009, 2004 Total Cohort as of June of the 5th year of school, 2003 Total Cohort as of June of the 6th year of school.
Graduated Transferred to Count with Regents GED
County of Cohort or Local Earned IEP Still Preparation DroppedDistrict Members Diplomas Diploma Enrolled Program Out
COUNTY: DUTCHESS Northeast Central School District
2005 Total Cohort - Aug 2009 Year Outcome All Students 82 79% 2% 7% 1% 10% ELL 2 # # # # # Not ELL 80 # # # # #
2005 Total Cohort - 4 Year Outcome All Students 82 79% 2% 7% 1% 10% ELL 2 # # # # # Not ELL 80 # # # # #
2004 Total Cohort - 5 Year Outcome All Students 79 85% 3% 5% 1% 6% ELL 0 0% 0% 0% 0% 0% Not ELL 79 85% 3% 5% 1% 6%
2003 Total Cohort - 6 Year Outcome All Students 94 80% 3% 1% 1% 15% ELL 1 # # # # # Not ELL 93 # # # # #
Pawling Central School District
2005 Total Cohort - Aug 2009 Year Outcome All Students 117 85% 0% 12% 0% 3% ELL 1 # # # # # Not ELL 116 # # # # #
2005 Total Cohort - 4 Year Outcome All Students 117 85% 0% 12% 0% 3% ELL 1 # # # # # Not ELL 116 # # # # #
2004 Total Cohort - 5 Year Outcome All Students 117 92% 0% 3% 2% 3% ELL 0 0% 0% 0% 0% 0% Not ELL 117 92% 0% 3% 2% 3%
2003 Total Cohort - 6 Year Outcome All Students 107 87% 0% 7% 1% 6% ELL 1 # # # # # Not ELL 106 # # # # #
Pine Plains Central School District
2005 Total Cohort - Aug 2009 Year Outcome All Students 121 68% 4% 12% 3% 13% ELL 2 # # # # # Not ELL 119 # # # # #
2005 Total Cohort - 4 Year Outcome All Students 121 67% 4% 12% 3% 13% ELL 2 # # # # # Not ELL 119 # # # # #
Data presented in this report are based on data submitted by school districts to the data repository for the 2008-09 school year. Students are reported based on their date of entry in grade 9 and their last enrollment status as reported in the warehouse on July 31, 2009. The federal Family Education Rights and Privacy Act prohibits the release of personally identifiable student information. This Act precludes the publication of summary information based on fewer than five students or in which subtraction or other simple mathematical operations could be used to obtain personal information. Cells that contain the ("#") symbol have been suppressed to protect student privacy.
District-ell status Thursday, March 4, 2010 Page 55 of 301

Public School District Total Cohort Graduation Rate and Enrollment Outcome Summary - 2008-09 School Year by English Language Learner Status
2005 Total Cohort as of June of the 4th year of school and as of August 2009, 2004 Total Cohort as of June of the 5th year of school, 2003 Total Cohort as of June of the 6th year of school.
Graduated Transferred to Count with Regents GED
County of Cohort or Local Earned IEP Still Preparation DroppedDistrict Members Diplomas Diploma Enrolled Program Out
COUNTY: DUTCHESS Pine Plains Central School District
2004 Total Cohort - 5 Year Outcome All Students 131 66% 11% 1% 5% 17% ELL 1 # # # # # Not ELL 130 # # # # #
2003 Total Cohort - 6 Year Outcome All Students 111 74% 9% 2% 2% 14% ELL 1 # # # # # Not ELL 110 # # # # #
Poughkeepsie City School District
2005 Total Cohort - Aug 2009 Year Outcome All Students 335 55% 3% 13% 3% 26% ELL 11 27% 0% 36% 0% 36% Not ELL 324 56% 3% 12% 3% 25%
2005 Total Cohort - 4 Year Outcome All Students 335 50% 3% 17% 3% 26% ELL 11 18% 0% 45% 0% 36% Not ELL 324 52% 3% 16% 3% 25%
2004 Total Cohort - 5 Year Outcome All Students 336 53% 6% 5% 5% 31% ELL 4 # # # # # Not ELL 332 # # # # #
2003 Total Cohort - 6 Year Outcome All Students 344 57% 4% 1% 4% 34% ELL 2 # # # # # Not ELL 342 # # # # #
Red Hook Central School District
2005 Total Cohort - Aug 2009 Year Outcome All Students 174 82% 1% 8% 6% 3% ELL 1 # # # # # Not ELL 173 # # # # #
2005 Total Cohort - 4 Year Outcome All Students 174 82% 1% 9% 6% 3% ELL 1 # # # # # Not ELL 173 # # # # #
2004 Total Cohort - 5 Year Outcome All Students 177 86% 2% 2% 1% 10% ELL 0 0% 0% 0% 0% 0% Not ELL 177 86% 2% 2% 1% 10%
2003 Total Cohort - 6 Year Outcome All Students 216 84% 2% 2% 1% 11% ELL 0 0% 0% 0% 0% 0% Not ELL 216 84% 2% 2% 1% 11%
Data presented in this report are based on data submitted by school districts to the data repository for the 2008-09 school year. Students are reported based on their date of entry in grade 9 and their last enrollment status as reported in the warehouse on July 31, 2009. The federal Family Education Rights and Privacy Act prohibits the release of personally identifiable student information. This Act precludes the publication of summary information based on fewer than five students or in which subtraction or other simple mathematical operations could be used to obtain personal information. Cells that contain the ("#") symbol have been suppressed to protect student privacy.
District-ell status Thursday, March 4, 2010 Page 56 of 301
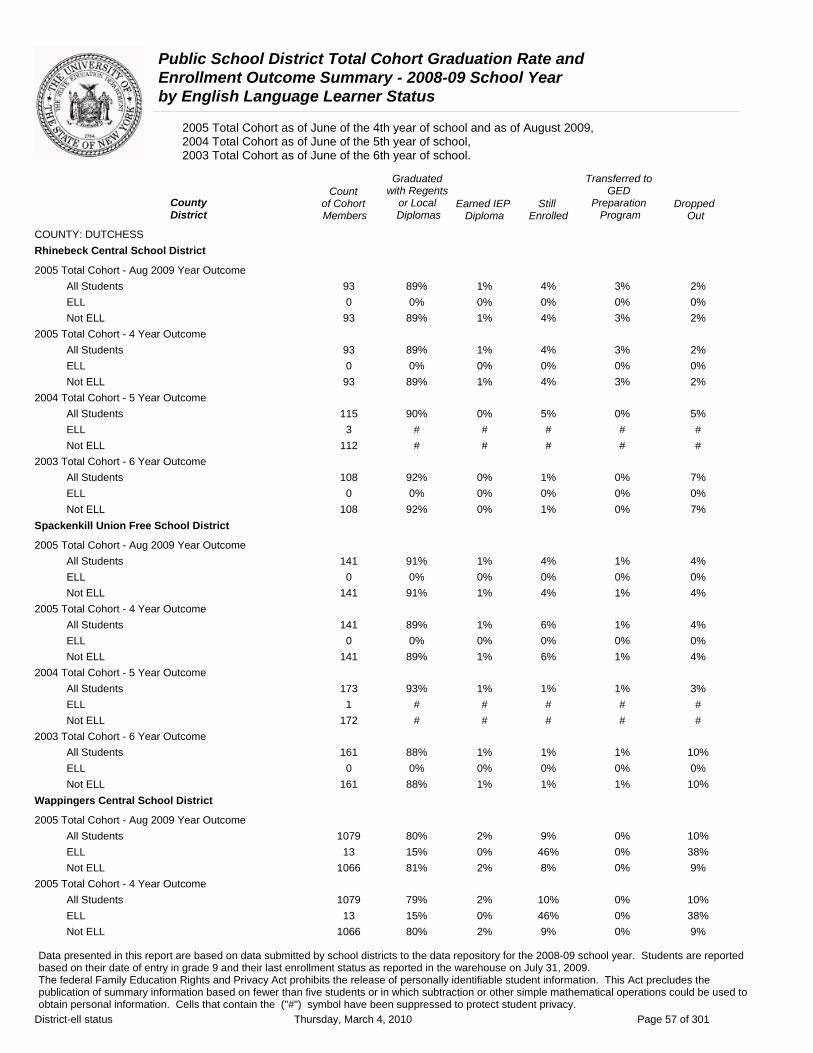
Public School District Total Cohort Graduation Rate and Enrollment Outcome Summary - 2008-09 School Year by English Language Learner Status
2005 Total Cohort as of June of the 4th year of school and as of August 2009, 2004 Total Cohort as of June of the 5th year of school, 2003 Total Cohort as of June of the 6th year of school.
Graduated Transferred to Count with Regents GED
County of Cohort or Local Earned IEP Still Preparation DroppedDistrict Members Diplomas Diploma Enrolled Program Out
COUNTY: DUTCHESS Rhinebeck Central School District
2005 Total Cohort - Aug 2009 Year Outcome All Students 93 89% 1% 4% 3% 2% ELL 0 0% 0% 0% 0% 0% Not ELL 93 89% 1% 4% 3% 2%
2005 Total Cohort - 4 Year Outcome All Students 93 89% 1% 4% 3% 2% ELL 0 0% 0% 0% 0% 0% Not ELL 93 89% 1% 4% 3% 2%
2004 Total Cohort - 5 Year Outcome All Students 115 90% 0% 5% 0% 5% ELL 3 # # # # # Not ELL 112 # # # # #
2003 Total Cohort - 6 Year Outcome All Students 108 92% 0% 1% 0% 7% ELL 0 0% 0% 0% 0% 0% Not ELL 108 92% 0% 1% 0% 7%
Spackenkill Union Free School District
2005 Total Cohort - Aug 2009 Year Outcome All Students 141 91% 1% 4% 1% 4% ELL 0 0% 0% 0% 0% 0% Not ELL 141 91% 1% 4% 1% 4%
2005 Total Cohort - 4 Year Outcome All Students 141 89% 1% 6% 1% 4% ELL 0 0% 0% 0% 0% 0% Not ELL 141 89% 1% 6% 1% 4%
2004 Total Cohort - 5 Year Outcome All Students 173 93% 1% 1% 1% 3% ELL 1 # # # # # Not ELL 172 # # # # #
2003 Total Cohort - 6 Year Outcome All Students 161 88% 1% 1% 1% 10% ELL 0 0% 0% 0% 0% 0% Not ELL 161 88% 1% 1% 1% 10%
Wappingers Central School District
2005 Total Cohort - Aug 2009 Year Outcome All Students 1079 80% 2% 9% 0% 10% ELL 13 15% 0% 46% 0% 38% Not ELL 1066 81% 2% 8% 0% 9%
2005 Total Cohort - 4 Year Outcome All Students 1079 79% 2% 10% 0% 10% ELL 13 15% 0% 46% 0% 38% Not ELL 1066 80% 2% 9% 0% 9%
Data presented in this report are based on data submitted by school districts to the data repository for the 2008-09 school year. Students are reported based on their date of entry in grade 9 and their last enrollment status as reported in the warehouse on July 31, 2009. The federal Family Education Rights and Privacy Act prohibits the release of personally identifiable student information. This Act precludes the publication of summary information based on fewer than five students or in which subtraction or other simple mathematical operations could be used to obtain personal information. Cells that contain the ("#") symbol have been suppressed to protect student privacy.
District-ell status Thursday, March 4, 2010 Page 57 of 301
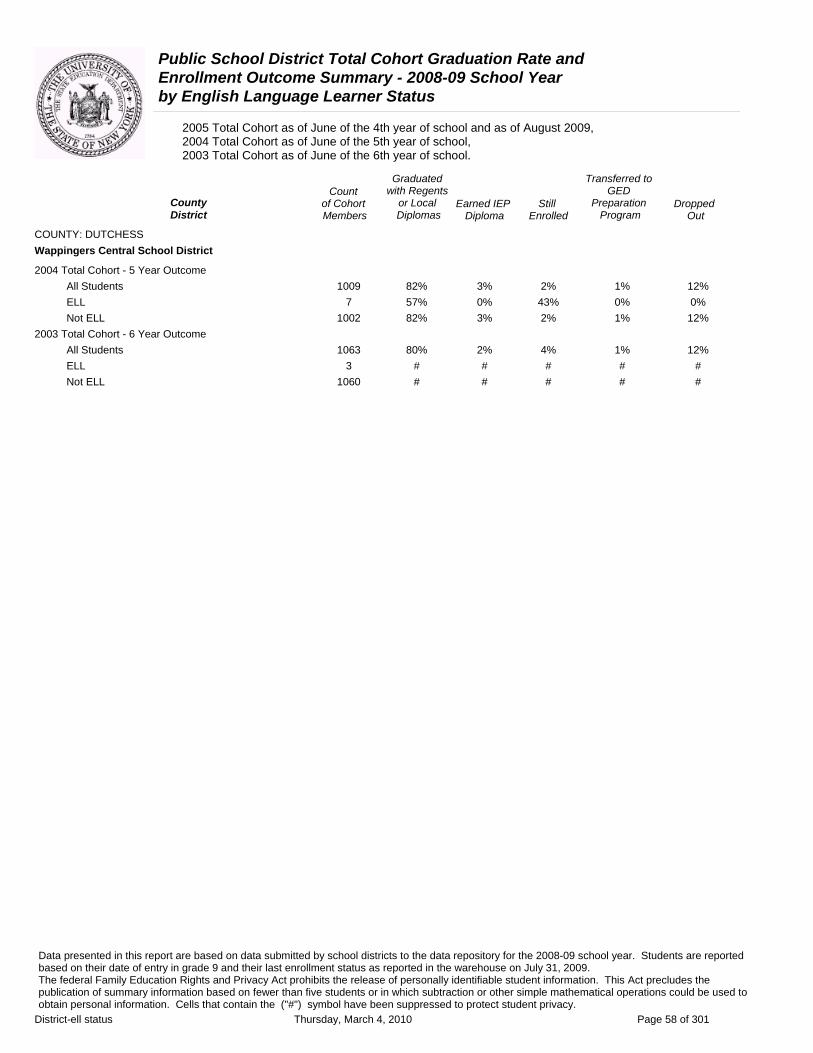
Public School District Total Cohort Graduation Rate and Enrollment Outcome Summary - 2008-09 School Year by English Language Learner Status
2005 Total Cohort as of June of the 4th year of school and as of August 2009, 2004 Total Cohort as of June of the 5th year of school, 2003 Total Cohort as of June of the 6th year of school.
Graduated Transferred to Count with Regents GED
County of Cohort or Local Earned IEP Still Preparation DroppedDistrict Members Diplomas Diploma Enrolled Program Out
COUNTY: DUTCHESS Wappingers Central School District
2004 Total Cohort - 5 Year Outcome All Students 1009 82% 3% 2% 1% 12% ELL 7 57% 0% 43% 0% 0% Not ELL 1002 82% 3% 2% 1% 12%
2003 Total Cohort - 6 Year Outcome All Students 1063 80% 2% 4% 1% 12% ELL 3 # # # # # Not ELL 1060 # # # # #
Data presented in this report are based on data submitted by school districts to the data repository for the 2008-09 school year. Students are reported based on their date of entry in grade 9 and their last enrollment status as reported in the warehouse on July 31, 2009. The federal Family Education Rights and Privacy Act prohibits the release of personally identifiable student information. This Act precludes the publication of summary information based on fewer than five students or in which subtraction or other simple mathematical operations could be used to obtain personal information. Cells that contain the ("#") symbol have been suppressed to protect student privacy.
District-ell status Thursday, March 4, 2010 Page 58 of 301
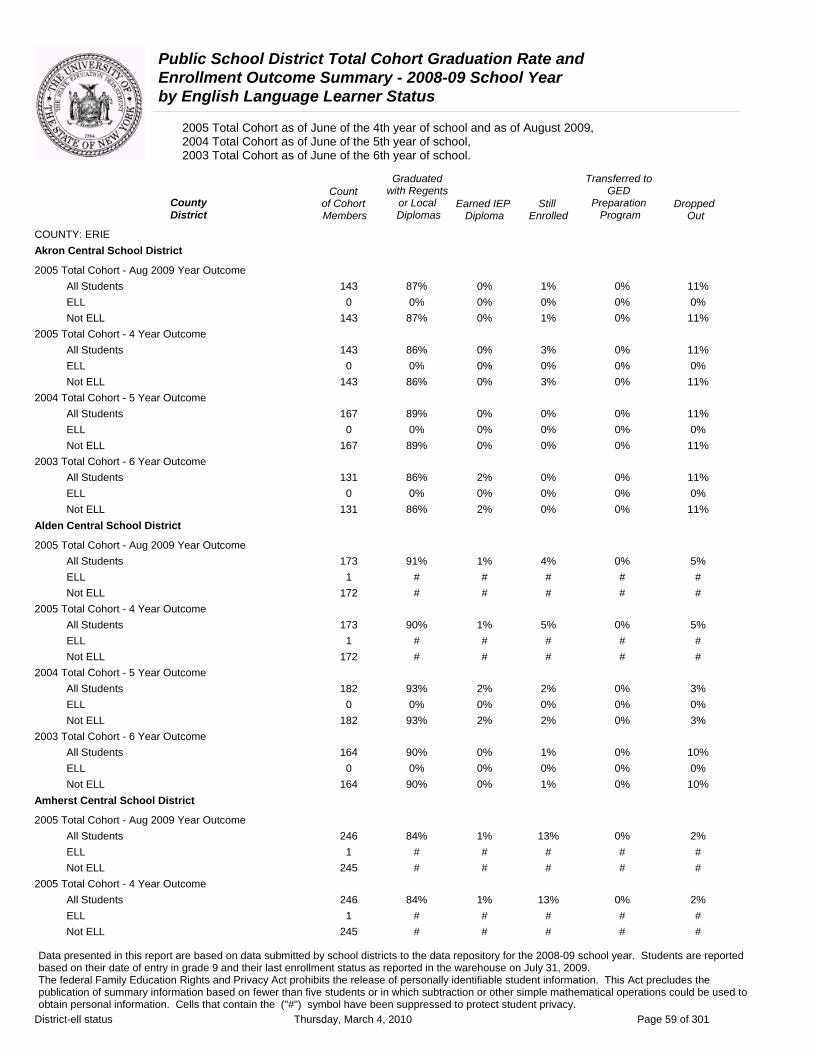
Public School District Total Cohort Graduation Rate and Enrollment Outcome Summary - 2008-09 School Year by English Language Learner Status
2005 Total Cohort as of June of the 4th year of school and as of August 2009, 2004 Total Cohort as of June of the 5th year of school, 2003 Total Cohort as of June of the 6th year of school.
Graduated Transferred to Count with Regents GED
County of Cohort or Local Earned IEP Still Preparation DroppedDistrict Members Diplomas Diploma Enrolled Program Out
COUNTY: ERIE Akron Central School District
2005 Total Cohort - Aug 2009 Year Outcome All Students 143 87% 0% 1% 0% 11% ELL 0 0% 0% 0% 0% 0% Not ELL 143 87% 0% 1% 0% 11%
2005 Total Cohort - 4 Year Outcome All Students 143 86% 0% 3% 0% 11% ELL 0 0% 0% 0% 0% 0% Not ELL 143 86% 0% 3% 0% 11%
2004 Total Cohort - 5 Year Outcome All Students 167 89% 0% 0% 0% 11% ELL 0 0% 0% 0% 0% 0% Not ELL 167 89% 0% 0% 0% 11%
2003 Total Cohort - 6 Year Outcome All Students 131 86% 2% 0% 0% 11% ELL 0 0% 0% 0% 0% 0% Not ELL 131 86% 2% 0% 0% 11%
Alden Central School District
2005 Total Cohort - Aug 2009 Year Outcome All Students 173 91% 1% 4% 0% 5% ELL 1 # # # # # Not ELL 172 # # # # #
2005 Total Cohort - 4 Year Outcome All Students 173 90% 1% 5% 0% 5% ELL 1 # # # # # Not ELL 172 # # # # #
2004 Total Cohort - 5 Year Outcome All Students 182 93% 2% 2% 0% 3% ELL 0 0% 0% 0% 0% 0% Not ELL 182 93% 2% 2% 0% 3%
2003 Total Cohort - 6 Year Outcome All Students 164 90% 0% 1% 0% 10% ELL 0 0% 0% 0% 0% 0% Not ELL 164 90% 0% 1% 0% 10%
Amherst Central School District
2005 Total Cohort - Aug 2009 Year Outcome All Students 246 84% 1% 13% 0% 2% ELL 1 # # # # # Not ELL 245 # # # # #
2005 Total Cohort - 4 Year Outcome All Students 246 84% 1% 13% 0% 2% ELL 1 # # # # # Not ELL 245 # # # # #
Data presented in this report are based on data submitted by school districts to the data repository for the 2008-09 school year. Students are reported based on their date of entry in grade 9 and their last enrollment status as reported in the warehouse on July 31, 2009. The federal Family Education Rights and Privacy Act prohibits the release of personally identifiable student information. This Act precludes the publication of summary information based on fewer than five students or in which subtraction or other simple mathematical operations could be used to obtain personal information. Cells that contain the ("#") symbol have been suppressed to protect student privacy.
District-ell status Thursday, March 4, 2010 Page 59 of 301
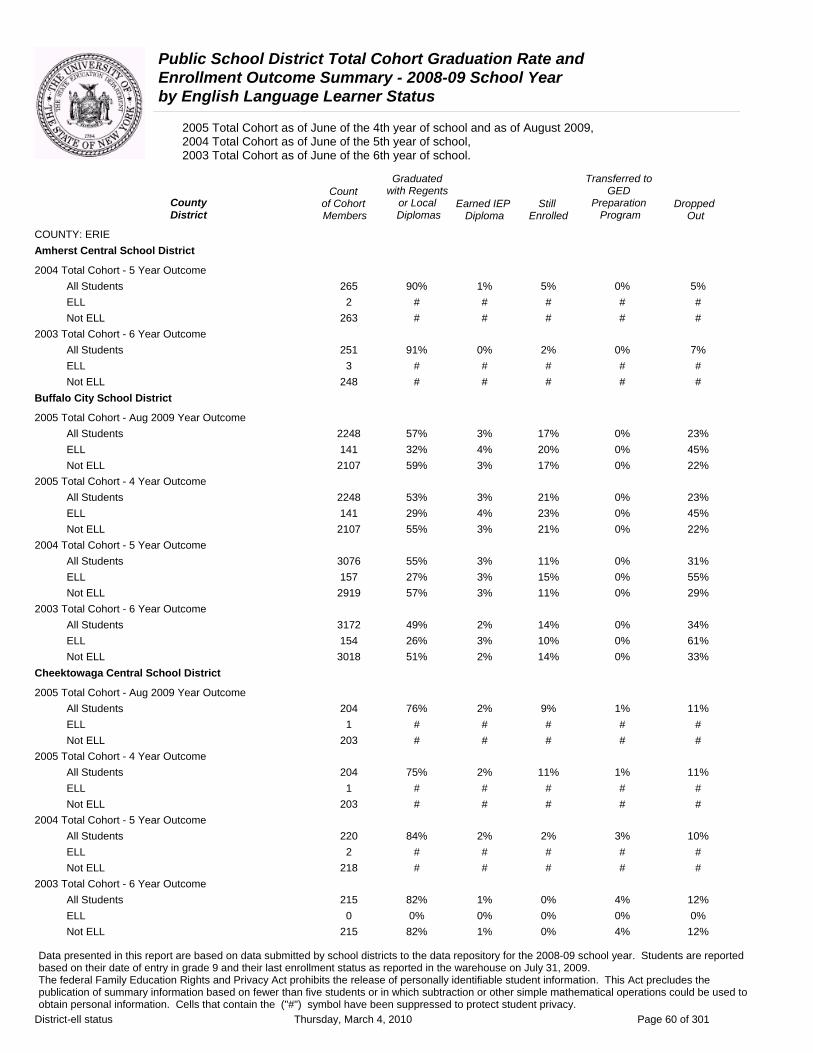
Public School District Total Cohort Graduation Rate and Enrollment Outcome Summary - 2008-09 School Year by English Language Learner Status
2005 Total Cohort as of June of the 4th year of school and as of August 2009, 2004 Total Cohort as of June of the 5th year of school, 2003 Total Cohort as of June of the 6th year of school.
Graduated Transferred to Count with Regents GED
County District
of Cohort Members
or Local Diplomas
Earned IEP Diploma
Still Enrolled
Preparation Program
Dropped Out
COUNTY: ERIE Amherst Central School District
2004 Total Cohort - 5 Year Outcome All Students 265 90% 1% 5% 0% 5% ELL 2 # # # # # Not ELL 263 # # # # #
2003 Total Cohort - 6 Year Outcome All Students 251 91% 0% 2% 0% 7% ELL 3 # # # # # Not ELL 248 # # # # #
Buffalo City School District
2005 Total Cohort - Aug 2009 Year Outcome All Students 2248 57% 3% 17% 0% 23% ELL 141 32% 4% 20% 0% 45% Not ELL 2107 59% 3% 17% 0% 22%
2005 Total Cohort - 4 Year Outcome All Students 2248 53% 3% 21% 0% 23% ELL 141 29% 4% 23% 0% 45% Not ELL 2107 55% 3% 21% 0% 22%
2004 Total Cohort - 5 Year Outcome All Students 3076 55% 3% 11% 0% 31% ELL 157 27% 3% 15% 0% 55% Not ELL 2919 57% 3% 11% 0% 29%
2003 Total Cohort - 6 Year Outcome All Students 3172 49% 2% 14% 0% 34% ELL 154 26% 3% 10% 0% 61% Not ELL 3018 51% 2% 14% 0% 33%
Cheektowaga Central School District
2005 Total Cohort - Aug 2009 Year Outcome All Students 204 76% 2% 9% 1% 11% ELL 1 # # # # # Not ELL 203 # # # # #
2005 Total Cohort - 4 Year Outcome All Students 204 75% 2% 11% 1% 11% ELL 1 # # # # # Not ELL 203 # # # # #
2004 Total Cohort - 5 Year Outcome All Students 220 84% 2% 2% 3% 10% ELL 2 # # # # # Not ELL 218 # # # # #
2003 Total Cohort - 6 Year Outcome All Students 215 82% 1% 0% 4% 12% ELL 0 0% 0% 0% 0% 0% Not ELL 215 82% 1% 0% 4% 12%
Data presented in this report are based on data submitted by school districts to the data repository for the 2008-09 school year. Students are reported based on their date of entry in grade 9 and their last enrollment status as reported in the warehouse on July 31, 2009. The federal Family Education Rights and Privacy Act prohibits the release of personally identifiable student information. This Act precludes the publication of summary information based on fewer than five students or in which subtraction or other simple mathematical operations could be used to obtain personal information. Cells that contain the ("#") symbol have been suppressed to protect student privacy.
District-ell status Thursday, March 4, 2010 Page 60 of 301
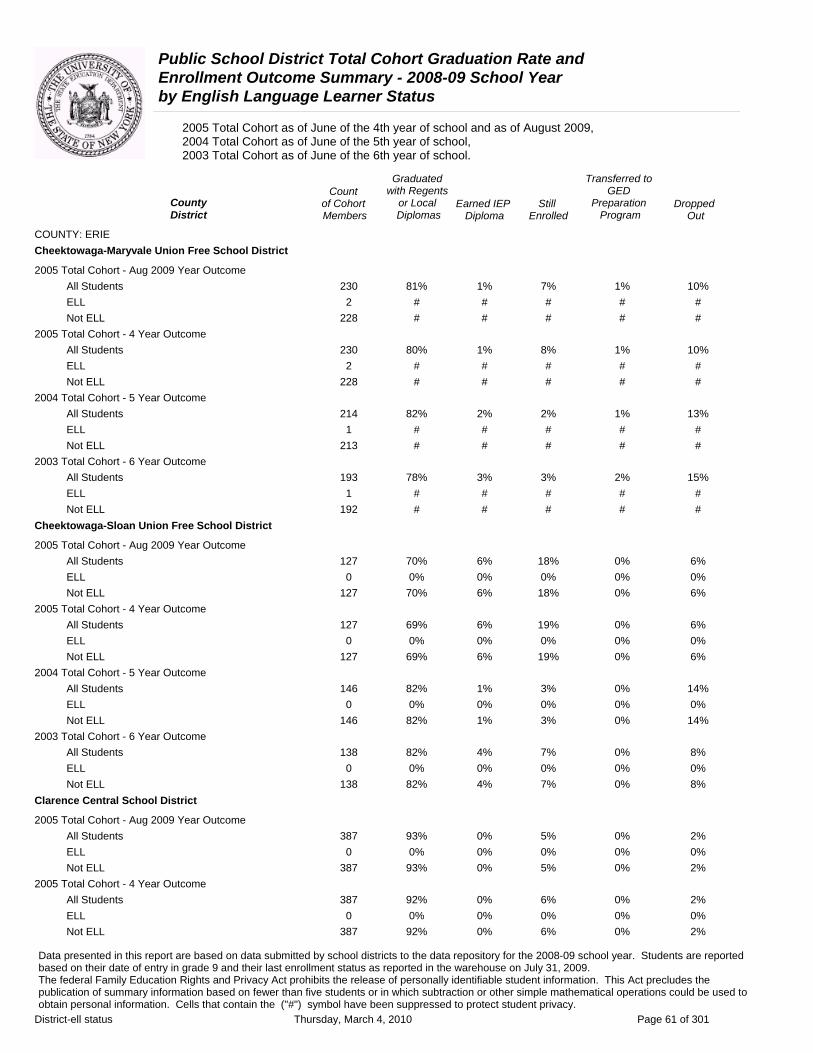
Public School District Total Cohort Graduation Rate and Enrollment Outcome Summary - 2008-09 School Year by English Language Learner Status
2005 Total Cohort as of June of the 4th year of school and as of August 2009, 2004 Total Cohort as of June of the 5th year of school, 2003 Total Cohort as of June of the 6th year of school.
Graduated Transferred to Count with Regents GED
County of Cohort or Local Earned IEP Still Preparation DroppedDistrict Members Diplomas Diploma Enrolled Program Out
COUNTY: ERIE Cheektowaga-Maryvale Union Free School District
2005 Total Cohort - Aug 2009 Year Outcome All Students 230 81% 1% 7% 1% 10% ELL 2 # # # # # Not ELL 228 # # # # #
2005 Total Cohort - 4 Year Outcome All Students 230 80% 1% 8% 1% 10% ELL 2 # # # # # Not ELL 228 # # # # #
2004 Total Cohort - 5 Year Outcome All Students 214 82% 2% 2% 1% 13% ELL 1 # # # # # Not ELL 213 # # # # #
2003 Total Cohort - 6 Year Outcome All Students 193 78% 3% 3% 2% 15% ELL 1 # # # # # Not ELL 192 # # # # #
Cheektowaga-Sloan Union Free School District
2005 Total Cohort - Aug 2009 Year Outcome All Students 127 70% 6% 18% 0% 6% ELL 0 0% 0% 0% 0% 0% Not ELL 127 70% 6% 18% 0% 6%
2005 Total Cohort - 4 Year Outcome All Students 127 69% 6% 19% 0% 6% ELL 0 0% 0% 0% 0% 0% Not ELL 127 69% 6% 19% 0% 6%
2004 Total Cohort - 5 Year Outcome All Students 146 82% 1% 3% 0% 14% ELL 0 0% 0% 0% 0% 0% Not ELL 146 82% 1% 3% 0% 14%
2003 Total Cohort - 6 Year Outcome All Students 138 82% 4% 7% 0% 8% ELL 0 0% 0% 0% 0% 0% Not ELL 138 82% 4% 7% 0% 8%
Clarence Central School District
2005 Total Cohort - Aug 2009 Year Outcome All Students 387 93% 0% 5% 0% 2% ELL 0 0% 0% 0% 0% 0% Not ELL 387 93% 0% 5% 0% 2%
2005 Total Cohort - 4 Year Outcome All Students 387 92% 0% 6% 0% 2% ELL 0 0% 0% 0% 0% 0% Not ELL 387 92% 0% 6% 0% 2%
Data presented in this report are based on data submitted by school districts to the data repository for the 2008-09 school year. Students are reported based on their date of entry in grade 9 and their last enrollment status as reported in the warehouse on July 31, 2009. The federal Family Education Rights and Privacy Act prohibits the release of personally identifiable student information. This Act precludes the publication of summary information based on fewer than five students or in which subtraction or other simple mathematical operations could be used to obtain personal information. Cells that contain the ("#") symbol have been suppressed to protect student privacy.
District-ell status Thursday, March 4, 2010 Page 61 of 301
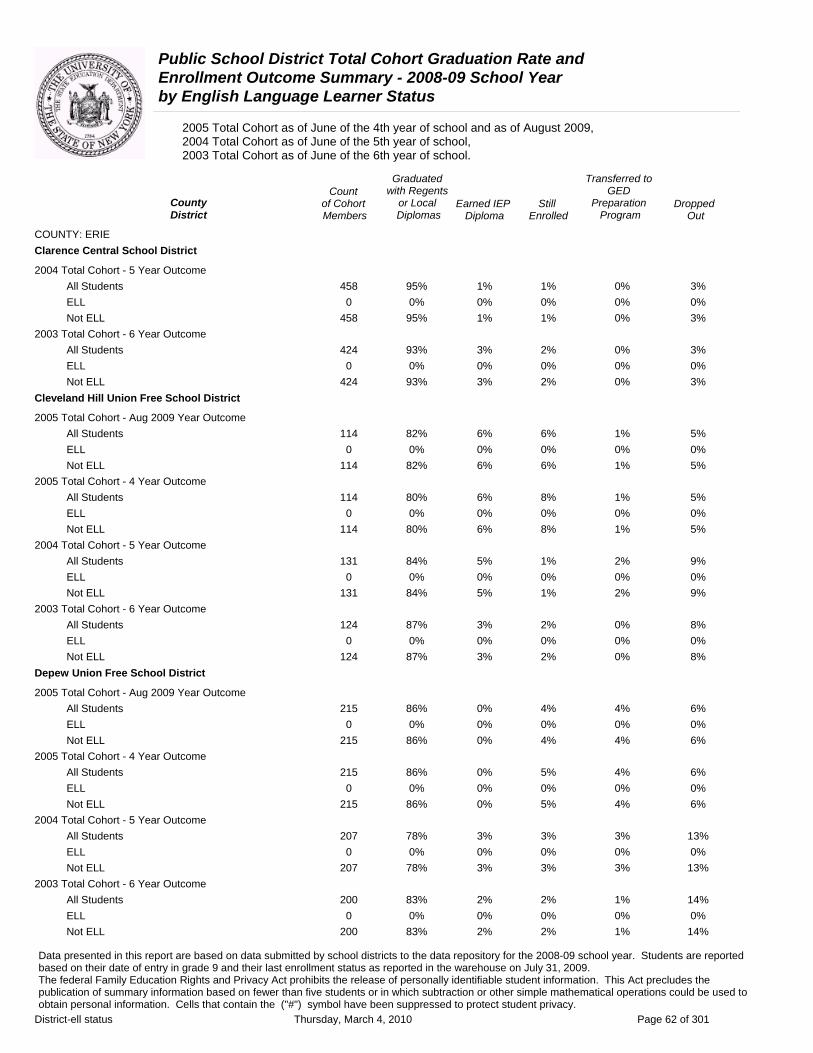
Public School District Total Cohort Graduation Rate and Enrollment Outcome Summary - 2008-09 School Year by English Language Learner Status
2005 Total Cohort as of June of the 4th year of school and as of August 2009, 2004 Total Cohort as of June of the 5th year of school, 2003 Total Cohort as of June of the 6th year of school.
Graduated Transferred to Count with Regents GED
County of Cohort or Local Earned IEP Still Preparation DroppedDistrict Members Diplomas Diploma Enrolled Program Out
COUNTY: ERIE Clarence Central School District
2004 Total Cohort - 5 Year Outcome All Students 458 95% 1% 1% 0% 3% ELL 0 0% 0% 0% 0% 0% Not ELL 458 95% 1% 1% 0% 3%
2003 Total Cohort - 6 Year Outcome All Students 424 93% 3% 2% 0% 3% ELL 0 0% 0% 0% 0% 0% Not ELL 424 93% 3% 2% 0% 3%
Cleveland Hill Union Free School District
2005 Total Cohort - Aug 2009 Year Outcome All Students 114 82% 6% 6% 1% 5% ELL 0 0% 0% 0% 0% 0% Not ELL 114 82% 6% 6% 1% 5%
2005 Total Cohort - 4 Year Outcome All Students 114 80% 6% 8% 1% 5% ELL 0 0% 0% 0% 0% 0% Not ELL 114 80% 6% 8% 1% 5%
2004 Total Cohort - 5 Year Outcome All Students 131 84% 5% 1% 2% 9% ELL 0 0% 0% 0% 0% 0% Not ELL 131 84% 5% 1% 2% 9%
2003 Total Cohort - 6 Year Outcome All Students 124 87% 3% 2% 0% 8% ELL 0 0% 0% 0% 0% 0% Not ELL 124 87% 3% 2% 0% 8%
Depew Union Free School District
2005 Total Cohort - Aug 2009 Year Outcome All Students 215 86% 0% 4% 4% 6% ELL 0 0% 0% 0% 0% 0% Not ELL 215 86% 0% 4% 4% 6%
2005 Total Cohort - 4 Year Outcome All Students 215 86% 0% 5% 4% 6% ELL 0 0% 0% 0% 0% 0% Not ELL 215 86% 0% 5% 4% 6%
2004 Total Cohort - 5 Year Outcome All Students 207 78% 3% 3% 3% 13% ELL 0 0% 0% 0% 0% 0% Not ELL 207 78% 3% 3% 3% 13%
2003 Total Cohort - 6 Year Outcome All Students 200 83% 2% 2% 1% 14% ELL 0 0% 0% 0% 0% 0% Not ELL 200 83% 2% 2% 1% 14%
Data presented in this report are based on data submitted by school districts to the data repository for the 2008-09 school year. Students are reported based on their date of entry in grade 9 and their last enrollment status as reported in the warehouse on July 31, 2009. The federal Family Education Rights and Privacy Act prohibits the release of personally identifiable student information. This Act precludes the publication of summary information based on fewer than five students or in which subtraction or other simple mathematical operations could be used to obtain personal information. Cells that contain the ("#") symbol have been suppressed to protect student privacy.
District-ell status Thursday, March 4, 2010 Page 62 of 301
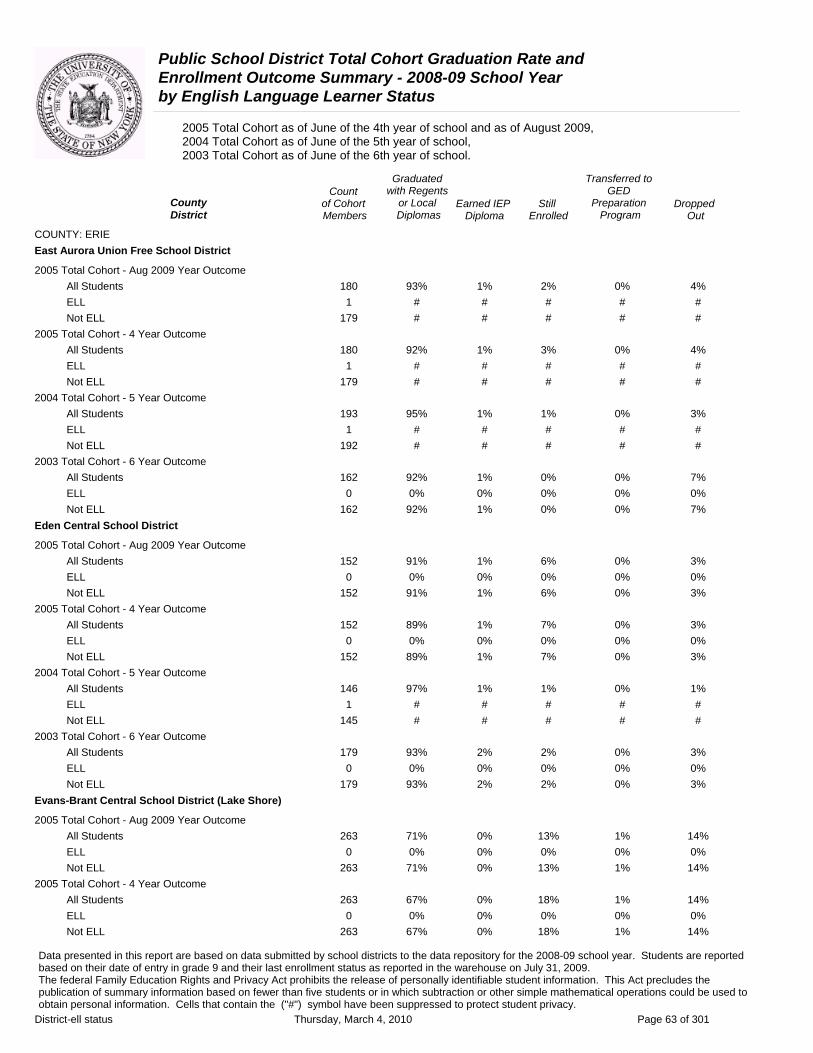
Public School District Total Cohort Graduation Rate and Enrollment Outcome Summary - 2008-09 School Year by English Language Learner Status
2005 Total Cohort as of June of the 4th year of school and as of August 2009, 2004 Total Cohort as of June of the 5th year of school, 2003 Total Cohort as of June of the 6th year of school.
Graduated Transferred to Count with Regents GED
County District
of Cohort Members
or Local Diplomas
Earned IEP Diploma
Still Enrolled
Preparation Program
Dropped Out
COUNTY: ERIE East Aurora Union Free School District
2005 Total Cohort - Aug 2009 Year Outcome All Students 180 93% 1% 2% 0% 4% ELL 1 # # # # # Not ELL 179 # # # # #
2005 Total Cohort - 4 Year Outcome All Students 180 92% 1% 3% 0% 4% ELL 1 # # # # # Not ELL 179 # # # # #
2004 Total Cohort - 5 Year Outcome All Students 193 95% 1% 1% 0% 3% ELL 1 # # # # # Not ELL 192 # # # # #
2003 Total Cohort - 6 Year Outcome All Students 162 92% 1% 0% 0% 7% ELL 0 0% 0% 0% 0% 0% Not ELL 162 92% 1% 0% 0% 7%
Eden Central School District
2005 Total Cohort - Aug 2009 Year Outcome All Students 152 91% 1% 6% 0% 3% ELL 0 0% 0% 0% 0% 0% Not ELL 152 91% 1% 6% 0% 3%
2005 Total Cohort - 4 Year Outcome All Students 152 89% 1% 7% 0% 3% ELL 0 0% 0% 0% 0% 0% Not ELL 152 89% 1% 7% 0% 3%
2004 Total Cohort - 5 Year Outcome All Students 146 97% 1% 1% 0% 1% ELL 1 # # # # # Not ELL 145 # # # # #
2003 Total Cohort - 6 Year Outcome All Students 179 93% 2% 2% 0% 3% ELL 0 0% 0% 0% 0% 0% Not ELL 179 93% 2% 2% 0% 3%
Evans-Brant Central School District (Lake Shore)
2005 Total Cohort - Aug 2009 Year Outcome All Students 263 71% 0% 13% 1% 14% ELL 0 0% 0% 0% 0% 0% Not ELL 263 71% 0% 13% 1% 14%
2005 Total Cohort - 4 Year Outcome All Students 263 67% 0% 18% 1% 14% ELL 0 0% 0% 0% 0% 0% Not ELL 263 67% 0% 18% 1% 14%
Data presented in this report are based on data submitted by school districts to the data repository for the 2008-09 school year. Students are reported based on their date of entry in grade 9 and their last enrollment status as reported in the warehouse on July 31, 2009. The federal Family Education Rights and Privacy Act prohibits the release of personally identifiable student information. This Act precludes the publication of summary information based on fewer than five students or in which subtraction or other simple mathematical operations could be used to obtain personal information. Cells that contain the ("#") symbol have been suppressed to protect student privacy.
District-ell status Thursday, March 4, 2010 Page 63 of 301
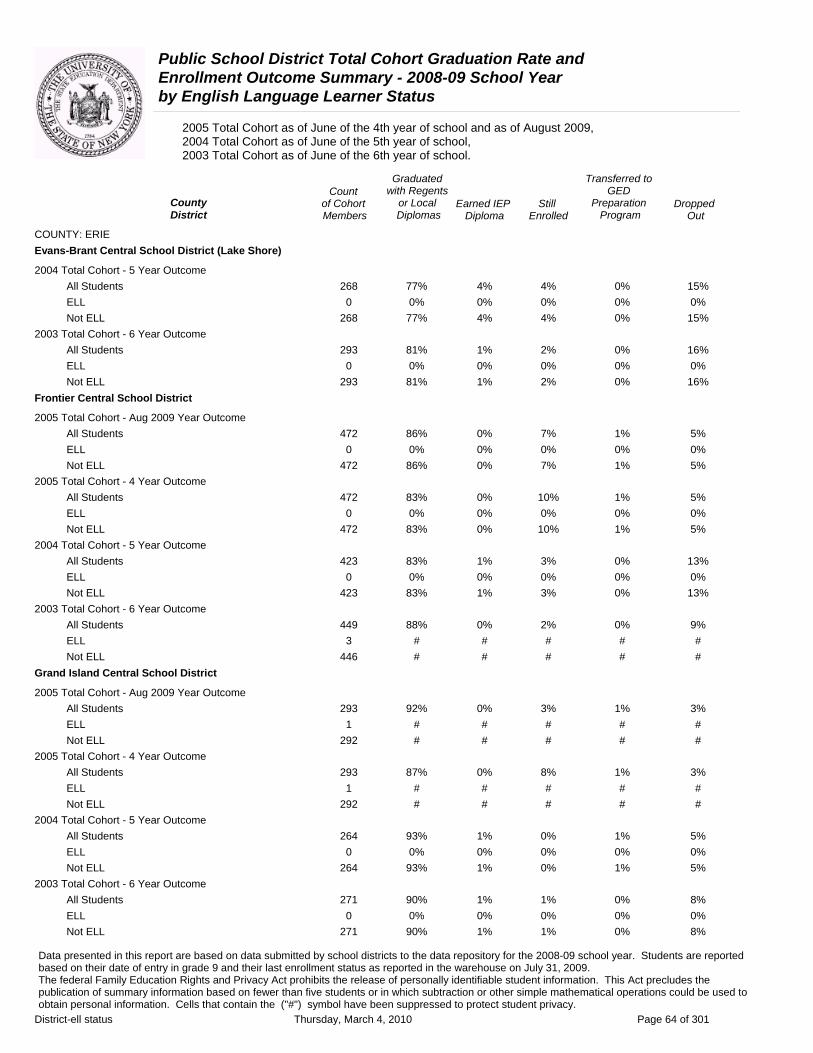
Public School District Total Cohort Graduation Rate and Enrollment Outcome Summary - 2008-09 School Year by English Language Learner Status
2005 Total Cohort as of June of the 4th year of school and as of August 2009, 2004 Total Cohort as of June of the 5th year of school, 2003 Total Cohort as of June of the 6th year of school.
Graduated Transferred to Count with Regents GED
County of Cohort or Local Earned IEP Still Preparation DroppedDistrict Members Diplomas Diploma Enrolled Program Out
COUNTY: ERIE Evans-Brant Central School District (Lake Shore)
2004 Total Cohort - 5 Year Outcome All Students 268 77% 4% 4% 0% 15% ELL 0 0% 0% 0% 0% 0% Not ELL 268 77% 4% 4% 0% 15%
2003 Total Cohort - 6 Year Outcome All Students 293 81% 1% 2% 0% 16% ELL 0 0% 0% 0% 0% 0% Not ELL 293 81% 1% 2% 0% 16%
Frontier Central School District
2005 Total Cohort - Aug 2009 Year Outcome All Students 472 86% 0% 7% 1% 5% ELL 0 0% 0% 0% 0% 0% Not ELL 472 86% 0% 7% 1% 5%
2005 Total Cohort - 4 Year Outcome All Students 472 83% 0% 10% 1% 5% ELL 0 0% 0% 0% 0% 0% Not ELL 472 83% 0% 10% 1% 5%
2004 Total Cohort - 5 Year Outcome All Students 423 83% 1% 3% 0% 13% ELL 0 0% 0% 0% 0% 0% Not ELL 423 83% 1% 3% 0% 13%
2003 Total Cohort - 6 Year Outcome All Students 449 88% 0% 2% 0% 9% ELL 3 # # # # # Not ELL 446 # # # # #
Grand Island Central School District
2005 Total Cohort - Aug 2009 Year Outcome All Students 293 92% 0% 3% 1% 3% ELL 1 # # # # # Not ELL 292 # # # # #
2005 Total Cohort - 4 Year Outcome All Students 293 87% 0% 8% 1% 3% ELL 1 # # # # # Not ELL 292 # # # # #
2004 Total Cohort - 5 Year Outcome All Students 264 93% 1% 0% 1% 5% ELL 0 0% 0% 0% 0% 0% Not ELL 264 93% 1% 0% 1% 5%
2003 Total Cohort - 6 Year Outcome All Students 271 90% 1% 1% 0% 8% ELL 0 0% 0% 0% 0% 0% Not ELL 271 90% 1% 1% 0% 8%
Data presented in this report are based on data submitted by school districts to the data repository for the 2008-09 school year. Students are reported based on their date of entry in grade 9 and their last enrollment status as reported in the warehouse on July 31, 2009. The federal Family Education Rights and Privacy Act prohibits the release of personally identifiable student information. This Act precludes the publication of summary information based on fewer than five students or in which subtraction or other simple mathematical operations could be used to obtain personal information. Cells that contain the ("#") symbol have been suppressed to protect student privacy.
District-ell status Thursday, March 4, 2010 Page 64 of 301
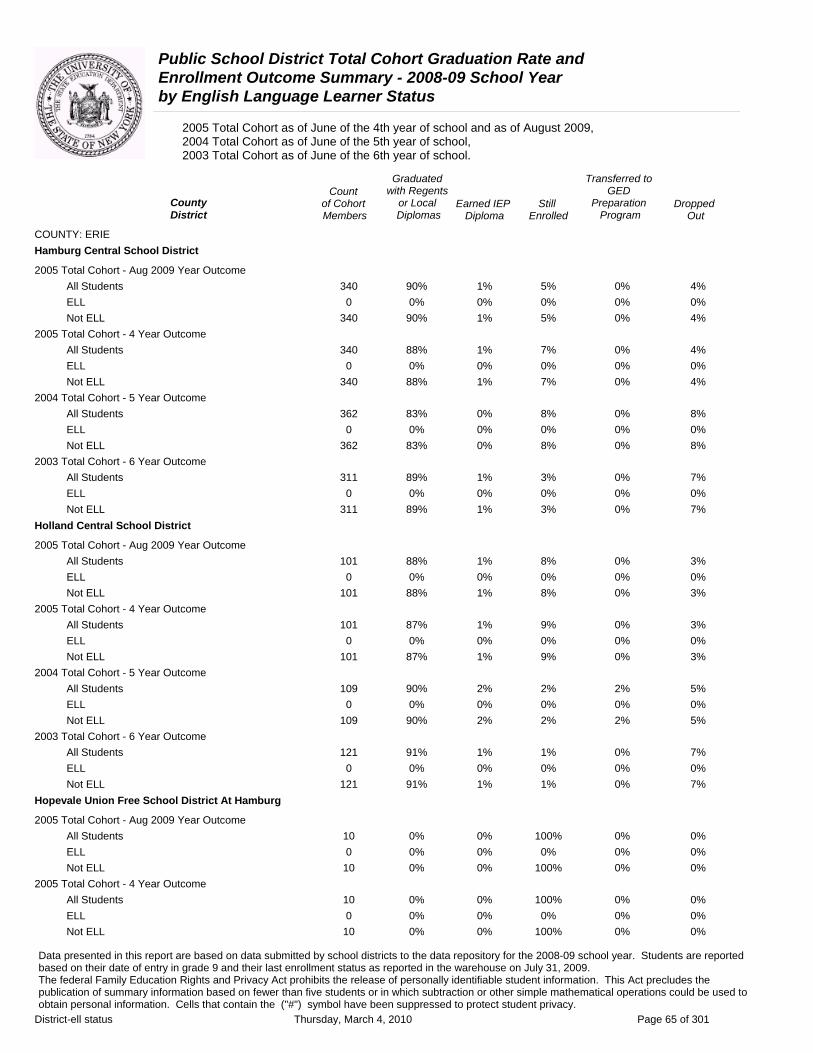
Public School District Total Cohort Graduation Rate and Enrollment Outcome Summary - 2008-09 School Year by English Language Learner Status
2005 Total Cohort as of June of the 4th year of school and as of August 2009, 2004 Total Cohort as of June of the 5th year of school, 2003 Total Cohort as of June of the 6th year of school.
Graduated Transferred to Count with Regents GED
County of Cohort or Local Earned IEP Still Preparation DroppedDistrict Members Diplomas Diploma Enrolled Program Out
COUNTY: ERIE Hamburg Central School District
2005 Total Cohort - Aug 2009 Year Outcome All Students 340 90% 1% 5% 0% 4% ELL 0 0% 0% 0% 0% 0% Not ELL 340 90% 1% 5% 0% 4%
2005 Total Cohort - 4 Year Outcome All Students 340 88% 1% 7% 0% 4% ELL 0 0% 0% 0% 0% 0% Not ELL 340 88% 1% 7% 0% 4%
2004 Total Cohort - 5 Year Outcome All Students 362 83% 0% 8% 0% 8% ELL 0 0% 0% 0% 0% 0% Not ELL 362 83% 0% 8% 0% 8%
2003 Total Cohort - 6 Year Outcome All Students 311 89% 1% 3% 0% 7% ELL 0 0% 0% 0% 0% 0% Not ELL 311 89% 1% 3% 0% 7%
Holland Central School District
2005 Total Cohort - Aug 2009 Year Outcome All Students 101 88% 1% 8% 0% 3% ELL 0 0% 0% 0% 0% 0% Not ELL 101 88% 1% 8% 0% 3%
2005 Total Cohort - 4 Year Outcome All Students 101 87% 1% 9% 0% 3% ELL 0 0% 0% 0% 0% 0% Not ELL 101 87% 1% 9% 0% 3%
2004 Total Cohort - 5 Year Outcome All Students 109 90% 2% 2% 2% 5% ELL 0 0% 0% 0% 0% 0% Not ELL 109 90% 2% 2% 2% 5%
2003 Total Cohort - 6 Year Outcome All Students 121 91% 1% 1% 0% 7% ELL 0 0% 0% 0% 0% 0% Not ELL 121 91% 1% 1% 0% 7%
Hopevale Union Free School District At Hamburg
2005 Total Cohort - Aug 2009 Year Outcome All Students 10 0% 0% 100% 0% 0% ELL 0 0% 0% 0% 0% 0% Not ELL 10 0% 0% 100% 0% 0%
2005 Total Cohort - 4 Year Outcome All Students 10 0% 0% 100% 0% 0% ELL 0 0% 0% 0% 0% 0% Not ELL 10 0% 0% 100% 0% 0%
Data presented in this report are based on data submitted by school districts to the data repository for the 2008-09 school year. Students are reported based on their date of entry in grade 9 and their last enrollment status as reported in the warehouse on July 31, 2009. The federal Family Education Rights and Privacy Act prohibits the release of personally identifiable student information. This Act precludes the publication of summary information based on fewer than five students or in which subtraction or other simple mathematical operations could be used to obtain personal information. Cells that contain the ("#") symbol have been suppressed to protect student privacy.
District-ell status Thursday, March 4, 2010 Page 65 of 301

Public School District Total Cohort Graduation Rate and Enrollment Outcome Summary - 2008-09 School Year by English Language Learner Status
2005 Total Cohort as of June of the 4th year of school and as of August 2009, 2004 Total Cohort as of June of the 5th year of school, 2003 Total Cohort as of June of the 6th year of school.
Graduated Transferred to Count with Regents GED
County of Cohort or Local Earned IEP Still Preparation DroppedDistrict Members Diplomas Diploma Enrolled Program Out
COUNTY: ERIE Hopevale Union Free School District At Hamburg
2004 Total Cohort - 5 Year Outcome All Students 2 # # # # # ELL 0 # # # # # Not ELL 2 # # # # #
2003 Total Cohort - 6 Year Outcome All Students 4 # # # # # ELL 0 # # # # # Not ELL 4 # # # # #
Iroquois Central School District
2005 Total Cohort - Aug 2009 Year Outcome All Students 252 92% 2% 3% 0% 3% ELL 0 0% 0% 0% 0% 0% Not ELL 252 92% 2% 3% 0% 3%
2005 Total Cohort - 4 Year Outcome All Students 252 92% 2% 3% 0% 3% ELL 0 0% 0% 0% 0% 0% Not ELL 252 92% 2% 3% 0% 3%
2004 Total Cohort - 5 Year Outcome All Students 286 97% 1% 0% 0% 2% ELL 0 0% 0% 0% 0% 0% Not ELL 286 97% 1% 0% 0% 2%
2003 Total Cohort - 6 Year Outcome All Students 262 94% 2% 0% 0% 3% ELL 0 0% 0% 0% 0% 0% Not ELL 262 94% 2% 0% 0% 3%
Kenmore-Tonawanda Union Free School District
2005 Total Cohort - Aug 2009 Year Outcome All Students 798 81% 1% 9% 5% 4% ELL 2 # # # # # Not ELL 796 # # # # #
2005 Total Cohort - 4 Year Outcome All Students 798 79% 1% 11% 5% 4% ELL 2 # # # # # Not ELL 796 # # # # #
2004 Total Cohort - 5 Year Outcome All Students 770 79% 2% 3% 9% 8% ELL 8 50% 0% 38% 13% 0% Not ELL 762 79% 2% 2% 9% 8%
2003 Total Cohort - 6 Year Outcome All Students 745 81% 2% 3% 5% 8% ELL 2 # # # # # Not ELL 743 # # # # #
Data presented in this report are based on data submitted by school districts to the data repository for the 2008-09 school year. Students are reported based on their date of entry in grade 9 and their last enrollment status as reported in the warehouse on July 31, 2009. The federal Family Education Rights and Privacy Act prohibits the release of personally identifiable student information. This Act precludes the publication of summary information based on fewer than five students or in which subtraction or other simple mathematical operations could be used to obtain personal information. Cells that contain the ("#") symbol have been suppressed to protect student privacy.
District-ell status Thursday, March 4, 2010 Page 66 of 301
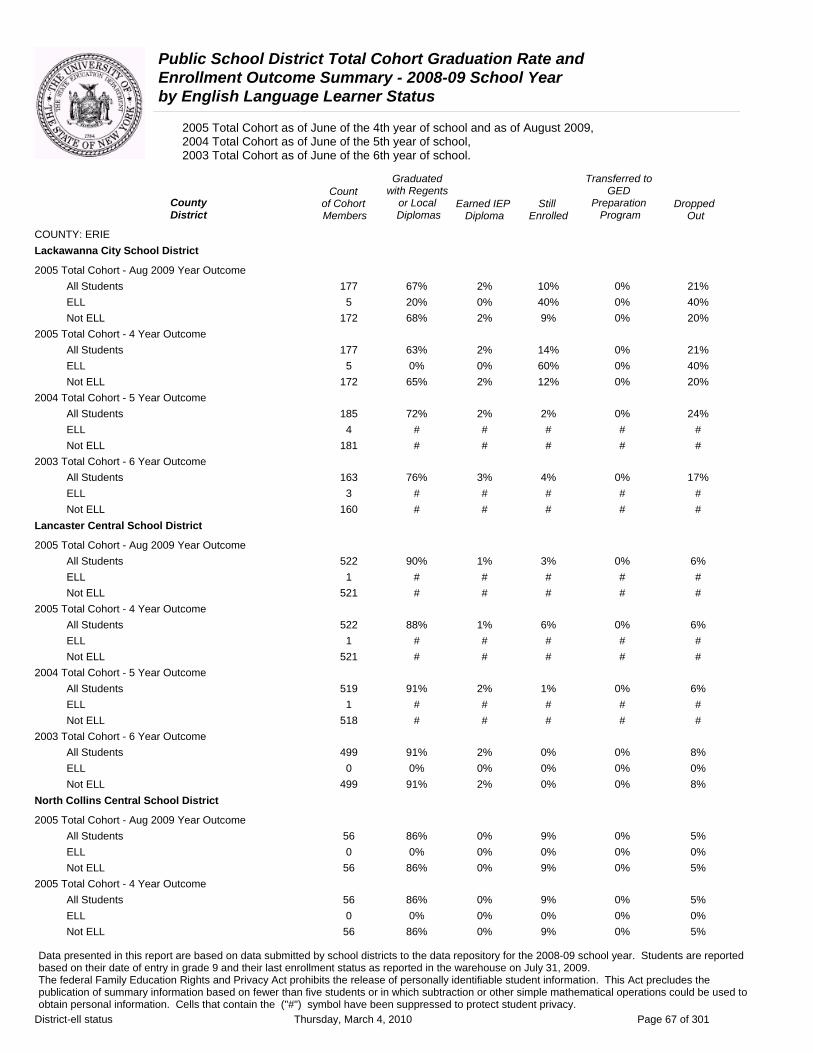
Public School District Total Cohort Graduation Rate and Enrollment Outcome Summary - 2008-09 School Year by English Language Learner Status
2005 Total Cohort as of June of the 4th year of school and as of August 2009, 2004 Total Cohort as of June of the 5th year of school, 2003 Total Cohort as of June of the 6th year of school.
Graduated Transferred to Count with Regents GED
County of Cohort or Local Earned IEP Still Preparation DroppedDistrict Members Diplomas Diploma Enrolled Program Out
COUNTY: ERIE Lackawanna City School District
2005 Total Cohort - Aug 2009 Year Outcome All Students 177 67% 2% 10% 0% 21% ELL 5 20% 0% 40% 0% 40% Not ELL 172 68% 2% 9% 0% 20%
2005 Total Cohort - 4 Year Outcome All Students 177 63% 2% 14% 0% 21% ELL 5 0% 0% 60% 0% 40% Not ELL 172 65% 2% 12% 0% 20%
2004 Total Cohort - 5 Year Outcome All Students 185 72% 2% 2% 0% 24% ELL 4 # # # # # Not ELL 181 # # # # #
2003 Total Cohort - 6 Year Outcome All Students 163 76% 3% 4% 0% 17% ELL 3 # # # # # Not ELL 160 # # # # #
Lancaster Central School District
2005 Total Cohort - Aug 2009 Year Outcome All Students 522 90% 1% 3% 0% 6% ELL 1 # # # # # Not ELL 521 # # # # #
2005 Total Cohort - 4 Year Outcome All Students 522 88% 1% 6% 0% 6% ELL 1 # # # # # Not ELL 521 # # # # #
2004 Total Cohort - 5 Year Outcome All Students 519 91% 2% 1% 0% 6% ELL 1 # # # # # Not ELL 518 # # # # #
2003 Total Cohort - 6 Year Outcome All Students 499 91% 2% 0% 0% 8% ELL 0 0% 0% 0% 0% 0% Not ELL 499 91% 2% 0% 0% 8%
North Collins Central School District
2005 Total Cohort - Aug 2009 Year Outcome All Students 56 86% 0% 9% 0% 5% ELL 0 0% 0% 0% 0% 0% Not ELL 56 86% 0% 9% 0% 5%
2005 Total Cohort - 4 Year Outcome All Students 56 86% 0% 9% 0% 5% ELL 0 0% 0% 0% 0% 0% Not ELL 56 86% 0% 9% 0% 5%
Data presented in this report are based on data submitted by school districts to the data repository for the 2008-09 school year. Students are reported based on their date of entry in grade 9 and their last enrollment status as reported in the warehouse on July 31, 2009. The federal Family Education Rights and Privacy Act prohibits the release of personally identifiable student information. This Act precludes the publication of summary information based on fewer than five students or in which subtraction or other simple mathematical operations could be used to obtain personal information. Cells that contain the ("#") symbol have been suppressed to protect student privacy.
District-ell status Thursday, March 4, 2010 Page 67 of 301
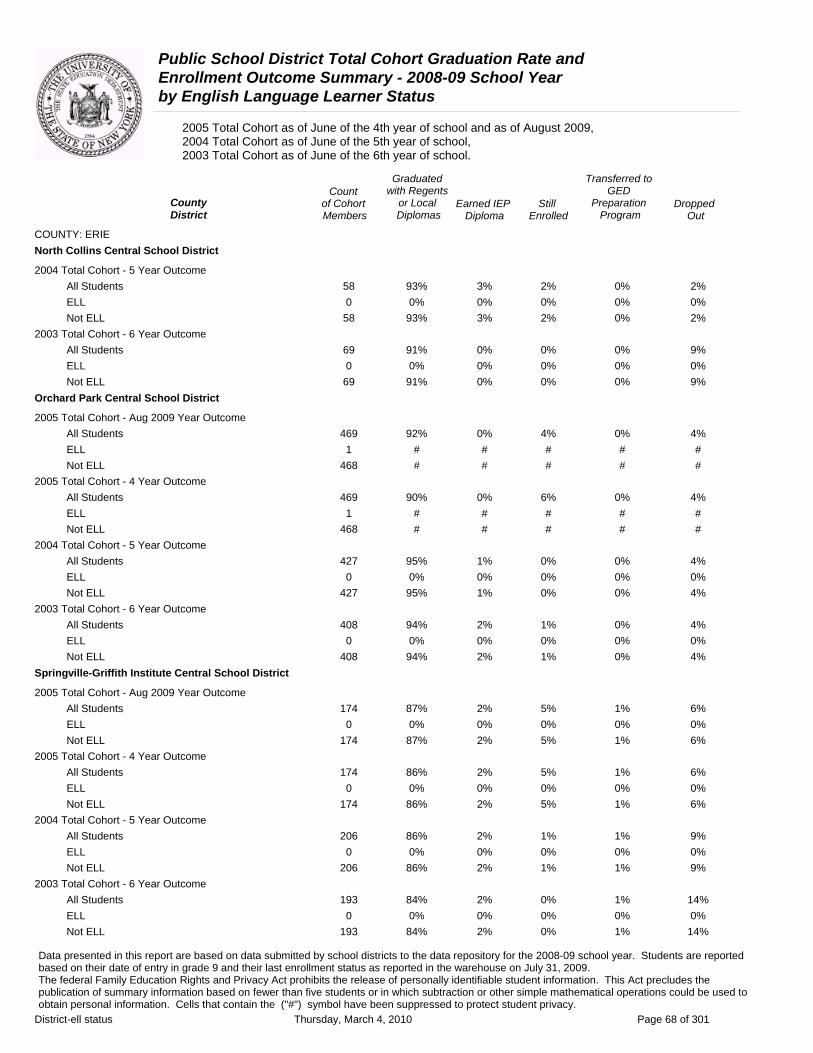
Public School District Total Cohort Graduation Rate and Enrollment Outcome Summary - 2008-09 School Year by English Language Learner Status
2005 Total Cohort as of June of the 4th year of school and as of August 2009, 2004 Total Cohort as of June of the 5th year of school, 2003 Total Cohort as of June of the 6th year of school.
Graduated Transferred to Count with Regents GED
County of Cohort or Local Earned IEP Still Preparation DroppedDistrict Members Diplomas Diploma Enrolled Program Out
COUNTY: ERIE North Collins Central School District
2004 Total Cohort - 5 Year Outcome All Students 58 93% 3% 2% 0% 2% ELL 0 0% 0% 0% 0% 0% Not ELL 58 93% 3% 2% 0% 2%
2003 Total Cohort - 6 Year Outcome All Students 69 91% 0% 0% 0% 9% ELL 0 0% 0% 0% 0% 0% Not ELL 69 91% 0% 0% 0% 9%
Orchard Park Central School District
2005 Total Cohort - Aug 2009 Year Outcome All Students 469 92% 0% 4% 0% 4% ELL 1 # # # # # Not ELL 468 # # # # #
2005 Total Cohort - 4 Year Outcome All Students 469 90% 0% 6% 0% 4% ELL 1 # # # # # Not ELL 468 # # # # #
2004 Total Cohort - 5 Year Outcome All Students 427 95% 1% 0% 0% 4% ELL 0 0% 0% 0% 0% 0% Not ELL 427 95% 1% 0% 0% 4%
2003 Total Cohort - 6 Year Outcome All Students 408 94% 2% 1% 0% 4% ELL 0 0% 0% 0% 0% 0% Not ELL 408 94% 2% 1% 0% 4%
Springville-Griffith Institute Central School District
2005 Total Cohort - Aug 2009 Year Outcome All Students 174 87% 2% 5% 1% 6% ELL 0 0% 0% 0% 0% 0% Not ELL 174 87% 2% 5% 1% 6%
2005 Total Cohort - 4 Year Outcome All Students 174 86% 2% 5% 1% 6% ELL 0 0% 0% 0% 0% 0% Not ELL 174 86% 2% 5% 1% 6%
2004 Total Cohort - 5 Year Outcome All Students 206 86% 2% 1% 1% 9% ELL 0 0% 0% 0% 0% 0% Not ELL 206 86% 2% 1% 1% 9%
2003 Total Cohort - 6 Year Outcome All Students 193 84% 2% 0% 1% 14% ELL 0 0% 0% 0% 0% 0% Not ELL 193 84% 2% 0% 1% 14%
Data presented in this report are based on data submitted by school districts to the data repository for the 2008-09 school year. Students are reported based on their date of entry in grade 9 and their last enrollment status as reported in the warehouse on July 31, 2009. The federal Family Education Rights and Privacy Act prohibits the release of personally identifiable student information. This Act precludes the publication of summary information based on fewer than five students or in which subtraction or other simple mathematical operations could be used to obtain personal information. Cells that contain the ("#") symbol have been suppressed to protect student privacy.
District-ell status Thursday, March 4, 2010 Page 68 of 301

Public School District Total Cohort Graduation Rate and Enrollment Outcome Summary - 2008-09 School Year by English Language Learner Status
2005 Total Cohort as of June of the 4th year of school and as of August 2009, 2004 Total Cohort as of June of the 5th year of school, 2003 Total Cohort as of June of the 6th year of school.
Graduated Transferred to Count with Regents GED
County of Cohort or Local Earned IEP Still Preparation DroppedDistrict Members Diplomas Diploma Enrolled Program Out
COUNTY: ERIE Sweet Home Central School District
2005 Total Cohort - Aug 2009 Year Outcome All Students 337 84% 1% 12% 0% 4% ELL 3 # # # # # Not ELL 334 # # # # #
2005 Total Cohort - 4 Year Outcome All Students 337 84% 1% 12% 0% 4% ELL 3 # # # # # Not ELL 334 # # # # #
2004 Total Cohort - 5 Year Outcome All Students 335 90% 1% 1% 0% 7% ELL 2 # # # # # Not ELL 333 # # # # #
2003 Total Cohort - 6 Year Outcome All Students 281 88% 1% 1% 0% 10% ELL 1 # # # # # Not ELL 280 # # # # #
Tonawanda City School District
2005 Total Cohort - Aug 2009 Year Outcome All Students 173 79% 1% 8% 7% 5% ELL 0 0% 0% 0% 0% 0% Not ELL 173 79% 1% 8% 7% 5%
2005 Total Cohort - 4 Year Outcome All Students 173 79% 1% 8% 7% 5% ELL 0 0% 0% 0% 0% 0% Not ELL 173 79% 1% 8% 7% 5%
2004 Total Cohort - 5 Year Outcome All Students 226 81% 1% 2% 8% 8% ELL 0 0% 0% 0% 0% 0% Not ELL 226 81% 1% 2% 8% 8%
2003 Total Cohort - 6 Year Outcome All Students 210 82% 2% 3% 9% 5% ELL 1 # # # # # Not ELL 209 # # # # #
West Seneca Central School District
2005 Total Cohort - Aug 2009 Year Outcome All Students 641 86% 1% 4% 5% 4% ELL 0 0% 0% 0% 0% 0% Not ELL 641 86% 1% 4% 5% 4%
2005 Total Cohort - 4 Year Outcome All Students 641 84% 1% 6% 5% 4% ELL 0 0% 0% 0% 0% 0% Not ELL 641 84% 1% 6% 5% 4%
Data presented in this report are based on data submitted by school districts to the data repository for the 2008-09 school year. Students are reported based on their date of entry in grade 9 and their last enrollment status as reported in the warehouse on July 31, 2009. The federal Family Education Rights and Privacy Act prohibits the release of personally identifiable student information. This Act precludes the publication of summary information based on fewer than five students or in which subtraction or other simple mathematical operations could be used to obtain personal information. Cells that contain the ("#") symbol have been suppressed to protect student privacy.
District-ell status Thursday, March 4, 2010 Page 69 of 301
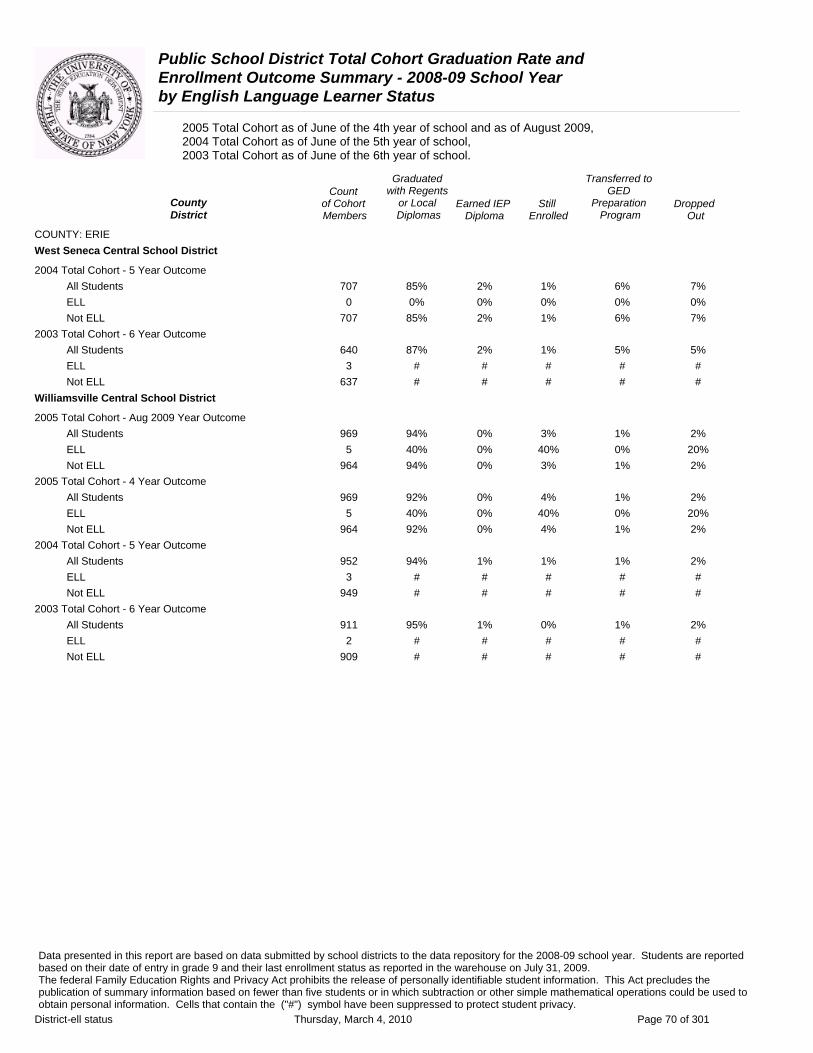
Public School District Total Cohort Graduation Rate and Enrollment Outcome Summary - 2008-09 School Year by English Language Learner Status
2005 Total Cohort as of June of the 4th year of school and as of August 2009, 2004 Total Cohort as of June of the 5th year of school, 2003 Total Cohort as of June of the 6th year of school.
Graduated Transferred to Count with Regents GED
County of Cohort or Local Earned IEP Still Preparation DroppedDistrict Members Diplomas Diploma Enrolled Program Out
COUNTY: ERIE West Seneca Central School District
2004 Total Cohort - 5 Year Outcome All Students 707 85% 2% 1% 6% 7% ELL 0 0% 0% 0% 0% 0% Not ELL 707 85% 2% 1% 6% 7%
2003 Total Cohort - 6 Year Outcome All Students 640 87% 2% 1% 5% 5% ELL 3 # # # # # Not ELL 637 # # # # #
Williamsville Central School District
2005 Total Cohort - Aug 2009 Year Outcome All Students 969 94% 0% 3% 1% 2% ELL 5 40% 0% 40% 0% 20% Not ELL 964 94% 0% 3% 1% 2%
2005 Total Cohort - 4 Year Outcome All Students 969 92% 0% 4% 1% 2% ELL 5 40% 0% 40% 0% 20% Not ELL 964 92% 0% 4% 1% 2%
2004 Total Cohort - 5 Year Outcome All Students 952 94% 1% 1% 1% 2% ELL 3 # # # # # Not ELL 949 # # # # #
2003 Total Cohort - 6 Year Outcome All Students 911 95% 1% 0% 1% 2% ELL 2 # # # # # Not ELL 909 # # # # #
Data presented in this report are based on data submitted by school districts to the data repository for the 2008-09 school year. Students are reported based on their date of entry in grade 9 and their last enrollment status as reported in the warehouse on July 31, 2009. The federal Family Education Rights and Privacy Act prohibits the release of personally identifiable student information. This Act precludes the publication of summary information based on fewer than five students or in which subtraction or other simple mathematical operations could be used to obtain personal information. Cells that contain the ("#") symbol have been suppressed to protect student privacy.
District-ell status Thursday, March 4, 2010 Page 70 of 301

Public School District Total Cohort Graduation Rate and Enrollment Outcome Summary - 2008-09 School Year by English Language Learner Status
2005 Total Cohort as of June of the 4th year of school and as of August 2009, 2004 Total Cohort as of June of the 5th year of school, 2003 Total Cohort as of June of the 6th year of school.
Graduated Transferred to Count with Regents GED
County of Cohort or Local Earned IEP Still Preparation DroppedDistrict Members Diplomas Diploma Enrolled Program Out
COUNTY: ESSEX Crown Point Central School District
2005 Total Cohort - Aug 2009 Year Outcome All Students 24 75% 0% 13% 0% 13% ELL 0 0% 0% 0% 0% 0% Not ELL 24 75% 0% 13% 0% 13%
2005 Total Cohort - 4 Year Outcome All Students 24 75% 0% 13% 0% 13% ELL 0 0% 0% 0% 0% 0% Not ELL 24 75% 0% 13% 0% 13%
2004 Total Cohort - 5 Year Outcome All Students 33 79% 9% 3% 3% 6% ELL 0 0% 0% 0% 0% 0% Not ELL 33 79% 9% 3% 3% 6%
2003 Total Cohort - 6 Year Outcome All Students 31 81% 6% 0% 3% 10% ELL 0 0% 0% 0% 0% 0% Not ELL 31 81% 6% 0% 3% 10%
Elizabethtown-Lewis Central School District
2005 Total Cohort - Aug 2009 Year Outcome All Students 28 82% 0% 7% 0% 11% ELL 0 0% 0% 0% 0% 0% Not ELL 28 82% 0% 7% 0% 11%
2005 Total Cohort - 4 Year Outcome All Students 28 82% 0% 7% 0% 11% ELL 0 0% 0% 0% 0% 0% Not ELL 28 82% 0% 7% 0% 11%
2004 Total Cohort - 5 Year Outcome All Students 33 73% 6% 3% 3% 15% ELL 0 0% 0% 0% 0% 0% Not ELL 33 73% 6% 3% 3% 15%
2003 Total Cohort - 6 Year Outcome All Students 34 82% 0% 0% 6% 12% ELL 0 0% 0% 0% 0% 0% Not ELL 34 82% 0% 0% 6% 12%
Keene Central School District
2005 Total Cohort - Aug 2009 Year Outcome All Students 13 100% 0% 0% 0% 0% ELL 0 0% 0% 0% 0% 0% Not ELL 13 100% 0% 0% 0% 0%
2005 Total Cohort - 4 Year Outcome All Students 13 100% 0% 0% 0% 0% ELL 0 0% 0% 0% 0% 0% Not ELL 13 100% 0% 0% 0% 0%
Data presented in this report are based on data submitted by school districts to the data repository for the 2008-09 school year. Students are reported based on their date of entry in grade 9 and their last enrollment status as reported in the warehouse on July 31, 2009. The federal Family Education Rights and Privacy Act prohibits the release of personally identifiable student information. This Act precludes the publication of summary information based on fewer than five students or in which subtraction or other simple mathematical operations could be used to obtain personal information. Cells that contain the ("#") symbol have been suppressed to protect student privacy.
District-ell status Thursday, March 4, 2010 Page 71 of 301

Public School District Total Cohort Graduation Rate and Enrollment Outcome Summary - 2008-09 School Year by English Language Learner Status
2005 Total Cohort as of June of the 4th year of school and as of August 2009, 2004 Total Cohort as of June of the 5th year of school, 2003 Total Cohort as of June of the 6th year of school.
Graduated Transferred to Count with Regents GED
County of Cohort or Local Earned IEP Still Preparation DroppedDistrict Members Diplomas Diploma Enrolled Program Out
COUNTY: ESSEX Keene Central School District
2004 Total Cohort - 5 Year Outcome All Students 14 93% 0% 0% 7% 0% ELL 0 0% 0% 0% 0% 0% Not ELL 14 93% 0% 0% 7% 0%
2003 Total Cohort - 6 Year Outcome All Students 18 100% 0% 0% 0% 0% ELL 0 0% 0% 0% 0% 0% Not ELL 18 100% 0% 0% 0% 0%
Lake Placid Central School District
2005 Total Cohort - Aug 2009 Year Outcome All Students 58 91% 0% 2% 3% 3% ELL 0 0% 0% 0% 0% 0% Not ELL 58 91% 0% 2% 3% 3%
2005 Total Cohort - 4 Year Outcome All Students 58 91% 0% 2% 3% 3% ELL 0 0% 0% 0% 0% 0% Not ELL 58 91% 0% 2% 3% 3%
2004 Total Cohort - 5 Year Outcome All Students 66 83% 3% 2% 3% 9% ELL 0 0% 0% 0% 0% 0% Not ELL 66 83% 3% 2% 3% 9%
2003 Total Cohort - 6 Year Outcome All Students 75 88% 0% 0% 1% 11% ELL 0 0% 0% 0% 0% 0% Not ELL 75 88% 0% 0% 1% 11%
Minerva Central School District
2005 Total Cohort - Aug 2009 Year Outcome All Students 14 100% 0% 0% 0% 0% ELL 0 0% 0% 0% 0% 0% Not ELL 14 100% 0% 0% 0% 0%
2005 Total Cohort - 4 Year Outcome All Students 14 93% 0% 7% 0% 0% ELL 0 0% 0% 0% 0% 0% Not ELL 14 93% 0% 7% 0% 0%
2004 Total Cohort - 5 Year Outcome All Students 12 83% 0% 0% 0% 17% ELL 0 0% 0% 0% 0% 0% Not ELL 12 83% 0% 0% 0% 17%
2003 Total Cohort - 6 Year Outcome All Students 10 90% 0% 0% 10% 0% ELL 0 0% 0% 0% 0% 0% Not ELL 10 90% 0% 0% 10% 0%
Data presented in this report are based on data submitted by school districts to the data repository for the 2008-09 school year. Students are reported based on their date of entry in grade 9 and their last enrollment status as reported in the warehouse on July 31, 2009. The federal Family Education Rights and Privacy Act prohibits the release of personally identifiable student information. This Act precludes the publication of summary information based on fewer than five students or in which subtraction or other simple mathematical operations could be used to obtain personal information. Cells that contain the ("#") symbol have been suppressed to protect student privacy.
District-ell status Thursday, March 4, 2010 Page 72 of 301
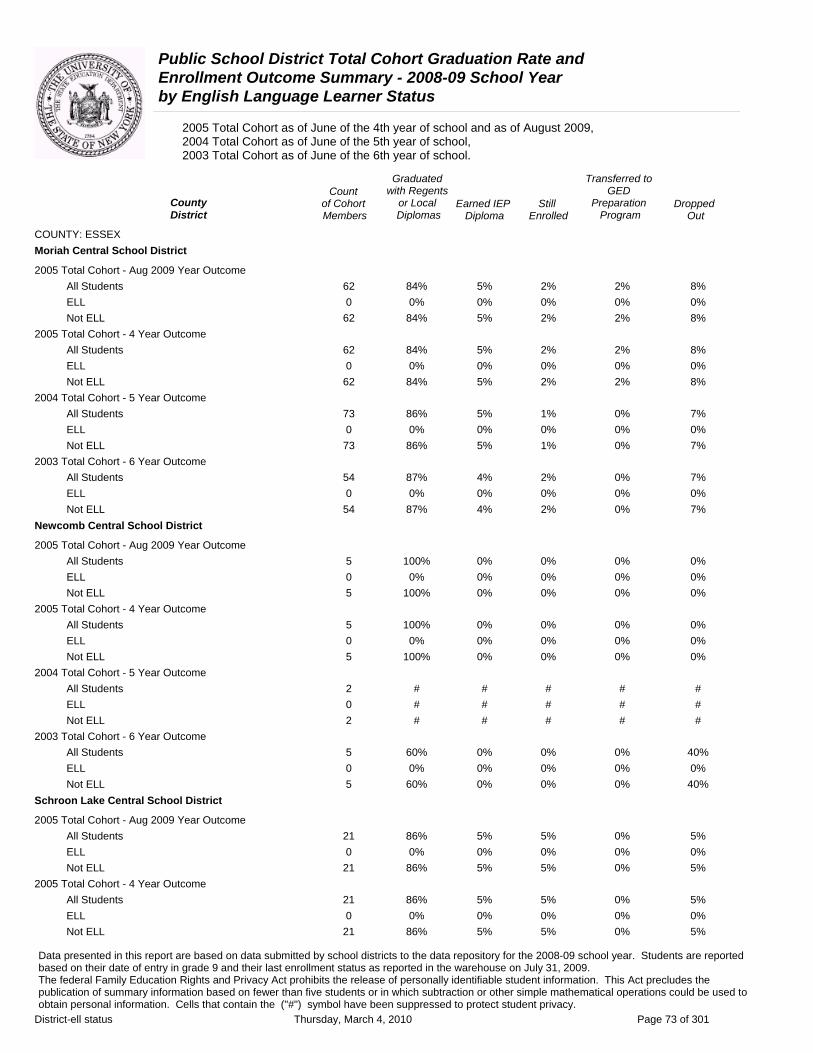
Public School District Total Cohort Graduation Rate and Enrollment Outcome Summary - 2008-09 School Year by English Language Learner Status
2005 Total Cohort as of June of the 4th year of school and as of August 2009, 2004 Total Cohort as of June of the 5th year of school, 2003 Total Cohort as of June of the 6th year of school.
Graduated Transferred to Count with Regents GED
County of Cohort or Local Earned IEP Still Preparation DroppedDistrict Members Diplomas Diploma Enrolled Program Out
COUNTY: ESSEX Moriah Central School District
2005 Total Cohort - Aug 2009 Year Outcome All Students 62 84% 5% 2% 2% 8% ELL 0 0% 0% 0% 0% 0% Not ELL 62 84% 5% 2% 2% 8%
2005 Total Cohort - 4 Year Outcome All Students 62 84% 5% 2% 2% 8% ELL 0 0% 0% 0% 0% 0% Not ELL 62 84% 5% 2% 2% 8%
2004 Total Cohort - 5 Year Outcome All Students 73 86% 5% 1% 0% 7% ELL 0 0% 0% 0% 0% 0% Not ELL 73 86% 5% 1% 0% 7%
2003 Total Cohort - 6 Year Outcome All Students 54 87% 4% 2% 0% 7% ELL 0 0% 0% 0% 0% 0% Not ELL 54 87% 4% 2% 0% 7%
Newcomb Central School District
2005 Total Cohort - Aug 2009 Year Outcome All Students 5 100% 0% 0% 0% 0% ELL 0 0% 0% 0% 0% 0% Not ELL 5 100% 0% 0% 0% 0%
2005 Total Cohort - 4 Year Outcome All Students 5 100% 0% 0% 0% 0% ELL 0 0% 0% 0% 0% 0% Not ELL 5 100% 0% 0% 0% 0%
2004 Total Cohort - 5 Year Outcome All Students 2 # # # # # ELL 0 # # # # # Not ELL 2 # # # # #
2003 Total Cohort - 6 Year Outcome All Students 5 60% 0% 0% 0% 40% ELL 0 0% 0% 0% 0% 0% Not ELL 5 60% 0% 0% 0% 40%
Schroon Lake Central School District
2005 Total Cohort - Aug 2009 Year Outcome All Students 21 86% 5% 5% 0% 5% ELL 0 0% 0% 0% 0% 0% Not ELL 21 86% 5% 5% 0% 5%
2005 Total Cohort - 4 Year Outcome All Students 21 86% 5% 5% 0% 5% ELL 0 0% 0% 0% 0% 0% Not ELL 21 86% 5% 5% 0% 5%
Data presented in this report are based on data submitted by school districts to the data repository for the 2008-09 school year. Students are reported based on their date of entry in grade 9 and their last enrollment status as reported in the warehouse on July 31, 2009. The federal Family Education Rights and Privacy Act prohibits the release of personally identifiable student information. This Act precludes the publication of summary information based on fewer than five students or in which subtraction or other simple mathematical operations could be used to obtain personal information. Cells that contain the ("#") symbol have been suppressed to protect student privacy.
District-ell status Thursday, March 4, 2010 Page 73 of 301

Public School District Total Cohort Graduation Rate and Enrollment Outcome Summary - 2008-09 School Year by English Language Learner Status
2005 Total Cohort as of June of the 4th year of school and as of August 2009, 2004 Total Cohort as of June of the 5th year of school, 2003 Total Cohort as of June of the 6th year of school.
Graduated Transferred to Count with Regents GED
County of Cohort or Local Earned IEP Still Preparation DroppedDistrict Members Diplomas Diploma Enrolled Program Out
COUNTY: ESSEX Schroon Lake Central School District
2004 Total Cohort - 5 Year Outcome All Students 27 93% 0% 0% 7% 0% ELL 0 0% 0% 0% 0% 0% Not ELL 27 93% 0% 0% 7% 0%
2003 Total Cohort - 6 Year Outcome All Students 23 78% 4% 4% 4% 9% ELL 0 0% 0% 0% 0% 0% Not ELL 23 78% 4% 4% 4% 9%
Ticonderoga Central School District
2005 Total Cohort - Aug 2009 Year Outcome All Students 115 79% 2% 10% 0% 10% ELL 0 0% 0% 0% 0% 0% Not ELL 115 79% 2% 10% 0% 10%
2005 Total Cohort - 4 Year Outcome All Students 115 76% 2% 13% 0% 10% ELL 0 0% 0% 0% 0% 0% Not ELL 115 76% 2% 13% 0% 10%
2004 Total Cohort - 5 Year Outcome All Students 86 77% 3% 6% 0% 14% ELL 0 0% 0% 0% 0% 0% Not ELL 86 77% 3% 6% 0% 14%
2003 Total Cohort - 6 Year Outcome All Students 87 87% 1% 3% 0% 8% ELL 0 0% 0% 0% 0% 0% Not ELL 87 87% 1% 3% 0% 8%
Westport Central School District
2005 Total Cohort - Aug 2009 Year Outcome All Students 19 95% 0% 0% 0% 5% ELL 0 0% 0% 0% 0% 0% Not ELL 19 95% 0% 0% 0% 5%
2005 Total Cohort - 4 Year Outcome All Students 19 95% 0% 0% 0% 5% ELL 0 0% 0% 0% 0% 0% Not ELL 19 95% 0% 0% 0% 5%
2004 Total Cohort - 5 Year Outcome All Students 32 94% 3% 3% 0% 0% ELL 0 0% 0% 0% 0% 0% Not ELL 32 94% 3% 3% 0% 0%
2003 Total Cohort - 6 Year Outcome All Students 29 93% 3% 3% 0% 0% ELL 0 0% 0% 0% 0% 0% Not ELL 29 93% 3% 3% 0% 0%
Data presented in this report are based on data submitted by school districts to the data repository for the 2008-09 school year. Students are reported based on their date of entry in grade 9 and their last enrollment status as reported in the warehouse on July 31, 2009. The federal Family Education Rights and Privacy Act prohibits the release of personally identifiable student information. This Act precludes the publication of summary information based on fewer than five students or in which subtraction or other simple mathematical operations could be used to obtain personal information. Cells that contain the ("#") symbol have been suppressed to protect student privacy.
District-ell status Thursday, March 4, 2010 Page 74 of 301

Public School District Total Cohort Graduation Rate and Enrollment Outcome Summary - 2008-09 School Year by English Language Learner Status
2005 Total Cohort as of June of the 4th year of school and as of August 2009, 2004 Total Cohort as of June of the 5th year of school, 2003 Total Cohort as of June of the 6th year of school.
Graduated Transferred to Count with Regents GED
County of Cohort or Local Earned IEP Still Preparation DroppedDistrict Members Diplomas Diploma Enrolled Program Out
COUNTY: ESSEX Willsboro Central School District
2005 Total Cohort - Aug 2009 Year Outcome All Students 30 77% 0% 13% 0% 10% ELL 0 0% 0% 0% 0% 0% Not ELL 30 77% 0% 13% 0% 10%
2005 Total Cohort - 4 Year Outcome All Students 30 73% 0% 17% 0% 10% ELL 0 0% 0% 0% 0% 0% Not ELL 30 73% 0% 17% 0% 10%
2004 Total Cohort - 5 Year Outcome All Students 34 85% 6% 0% 0% 9% ELL 0 0% 0% 0% 0% 0% Not ELL 34 85% 6% 0% 0% 9%
2003 Total Cohort - 6 Year Outcome All Students 24 92% 4% 0% 0% 4% ELL 0 0% 0% 0% 0% 0% Not ELL 24 92% 4% 0% 0% 4%
Data presented in this report are based on data submitted by school districts to the data repository for the 2008-09 school year. Students are reported based on their date of entry in grade 9 and their last enrollment status as reported in the warehouse on July 31, 2009. The federal Family Education Rights and Privacy Act prohibits the release of personally identifiable student information. This Act precludes the publication of summary information based on fewer than five students or in which subtraction or other simple mathematical operations could be used to obtain personal information. Cells that contain the ("#") symbol have been suppressed to protect student privacy.
District-ell status Thursday, March 4, 2010 Page 75 of 301

Public School District Total Cohort Graduation Rate and Enrollment Outcome Summary - 2008-09 School Year by English Language Learner Status
2005 Total Cohort as of June of the 4th year of school and as of August 2009, 2004 Total Cohort as of June of the 5th year of school, 2003 Total Cohort as of June of the 6th year of school.
Graduated Transferred to Count with Regents GED
County of Cohort or Local Earned IEP Still Preparation DroppedDistrict Members Diplomas Diploma Enrolled Program Out
COUNTY: FRANKLIN Brushton-Moira Central School District
2005 Total Cohort - Aug 2009 Year Outcome All Students 69 78% 3% 12% 0% 7% ELL 0 0% 0% 0% 0% 0% Not ELL 69 78% 3% 12% 0% 7%
2005 Total Cohort - 4 Year Outcome All Students 69 70% 3% 20% 0% 7% ELL 0 0% 0% 0% 0% 0% Not ELL 69 70% 3% 20% 0% 7%
2004 Total Cohort - 5 Year Outcome All Students 66 82% 5% 2% 0% 12% ELL 0 0% 0% 0% 0% 0% Not ELL 66 82% 5% 2% 0% 12%
2003 Total Cohort - 6 Year Outcome All Students 56 88% 2% 0% 0% 11% ELL 0 0% 0% 0% 0% 0% Not ELL 56 88% 2% 0% 0% 11%
Chateaugay Central School District
2005 Total Cohort - Aug 2009 Year Outcome All Students 53 85% 6% 0% 0% 9% ELL 0 0% 0% 0% 0% 0% Not ELL 53 85% 6% 0% 0% 9%
2005 Total Cohort - 4 Year Outcome All Students 53 85% 6% 0% 0% 9% ELL 0 0% 0% 0% 0% 0% Not ELL 53 85% 6% 0% 0% 9%
2004 Total Cohort - 5 Year Outcome All Students 59 85% 3% 0% 3% 8% ELL 0 0% 0% 0% 0% 0% Not ELL 59 85% 3% 0% 3% 8%
2003 Total Cohort - 6 Year Outcome All Students 53 83% 6% 2% 0% 9% ELL 0 0% 0% 0% 0% 0% Not ELL 53 83% 6% 2% 0% 9%
Malone Central School District
2005 Total Cohort - Aug 2009 Year Outcome All Students 194 75% 4% 15% 1% 5% ELL 0 0% 0% 0% 0% 0% Not ELL 194 75% 4% 15% 1% 5%
2005 Total Cohort - 4 Year Outcome All Students 194 75% 4% 15% 1% 5% ELL 0 0% 0% 0% 0% 0% Not ELL 194 75% 4% 15% 1% 5%
Data presented in this report are based on data submitted by school districts to the data repository for the 2008-09 school year. Students are reported based on their date of entry in grade 9 and their last enrollment status as reported in the warehouse on July 31, 2009. The federal Family Education Rights and Privacy Act prohibits the release of personally identifiable student information. This Act precludes the publication of summary information based on fewer than five students or in which subtraction or other simple mathematical operations could be used to obtain personal information. Cells that contain the ("#") symbol have been suppressed to protect student privacy.
District-ell status Thursday, March 4, 2010 Page 76 of 301
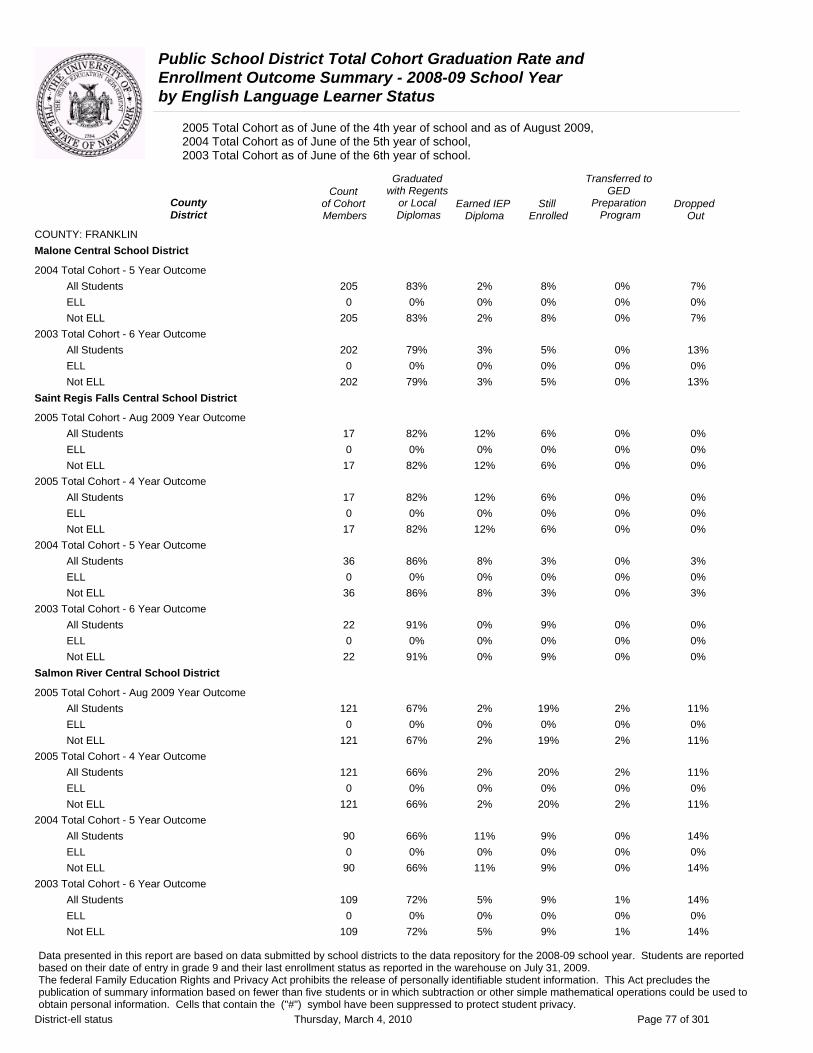
Public School District Total Cohort Graduation Rate and Enrollment Outcome Summary - 2008-09 School Year by English Language Learner Status
2005 Total Cohort as of June of the 4th year of school and as of August 2009, 2004 Total Cohort as of June of the 5th year of school, 2003 Total Cohort as of June of the 6th year of school.
Graduated Transferred to Count with Regents GED
County of Cohort or Local Earned IEP Still Preparation DroppedDistrict Members Diplomas Diploma Enrolled Program Out
COUNTY: FRANKLIN Malone Central School District
2004 Total Cohort - 5 Year Outcome All Students 205 83% 2% 8% 0% 7% ELL 0 0% 0% 0% 0% 0% Not ELL 205 83% 2% 8% 0% 7%
2003 Total Cohort - 6 Year Outcome All Students 202 79% 3% 5% 0% 13% ELL 0 0% 0% 0% 0% 0% Not ELL 202 79% 3% 5% 0% 13%
Saint Regis Falls Central School District
2005 Total Cohort - Aug 2009 Year Outcome All Students 17 82% 12% 6% 0% 0% ELL 0 0% 0% 0% 0% 0% Not ELL 17 82% 12% 6% 0% 0%
2005 Total Cohort - 4 Year Outcome All Students 17 82% 12% 6% 0% 0% ELL 0 0% 0% 0% 0% 0% Not ELL 17 82% 12% 6% 0% 0%
2004 Total Cohort - 5 Year Outcome All Students 36 86% 8% 3% 0% 3% ELL 0 0% 0% 0% 0% 0% Not ELL 36 86% 8% 3% 0% 3%
2003 Total Cohort - 6 Year Outcome All Students 22 91% 0% 9% 0% 0% ELL 0 0% 0% 0% 0% 0% Not ELL 22 91% 0% 9% 0% 0%
Salmon River Central School District
2005 Total Cohort - Aug 2009 Year Outcome All Students 121 67% 2% 19% 2% 11% ELL 0 0% 0% 0% 0% 0% Not ELL 121 67% 2% 19% 2% 11%
2005 Total Cohort - 4 Year Outcome All Students 121 66% 2% 20% 2% 11% ELL 0 0% 0% 0% 0% 0% Not ELL 121 66% 2% 20% 2% 11%
2004 Total Cohort - 5 Year Outcome All Students 90 66% 11% 9% 0% 14% ELL 0 0% 0% 0% 0% 0% Not ELL 90 66% 11% 9% 0% 14%
2003 Total Cohort - 6 Year Outcome All Students 109 72% 5% 9% 1% 14% ELL 0 0% 0% 0% 0% 0% Not ELL 109 72% 5% 9% 1% 14%
Data presented in this report are based on data submitted by school districts to the data repository for the 2008-09 school year. Students are reported based on their date of entry in grade 9 and their last enrollment status as reported in the warehouse on July 31, 2009. The federal Family Education Rights and Privacy Act prohibits the release of personally identifiable student information. This Act precludes the publication of summary information based on fewer than five students or in which subtraction or other simple mathematical operations could be used to obtain personal information. Cells that contain the ("#") symbol have been suppressed to protect student privacy.
District-ell status Thursday, March 4, 2010 Page 77 of 301

Public School District Total Cohort Graduation Rate and Enrollment Outcome Summary - 2008-09 School Year by English Language Learner Status
2005 Total Cohort as of June of the 4th year of school and as of August 2009, 2004 Total Cohort as of June of the 5th year of school, 2003 Total Cohort as of June of the 6th year of school.
Graduated Transferred to Count with Regents GED
County of Cohort or Local Earned IEP Still Preparation DroppedDistrict Members Diplomas Diploma Enrolled Program Out
COUNTY: FRANKLIN Saranac Lake Central School District
2005 Total Cohort - Aug 2009 Year Outcome All Students 114 80% 2% 7% 3% 9% ELL 1 # # # # # Not ELL 113 # # # # #
2005 Total Cohort - 4 Year Outcome All Students 114 77% 2% 10% 3% 9% ELL 1 # # # # # Not ELL 113 # # # # #
2004 Total Cohort - 5 Year Outcome All Students 147 80% 3% 1% 2% 13% ELL 0 0% 0% 0% 0% 0% Not ELL 147 80% 3% 1% 2% 13%
2003 Total Cohort - 6 Year Outcome All Students 159 83% 3% 3% 0% 11% ELL 0 0% 0% 0% 0% 0% Not ELL 159 83% 3% 3% 0% 11%
Tupper Lake Central School District
2005 Total Cohort - Aug 2009 Year Outcome All Students 87 86% 3% 2% 2% 6% ELL 0 0% 0% 0% 0% 0% Not ELL 87 86% 3% 2% 2% 6%
2005 Total Cohort - 4 Year Outcome All Students 87 84% 3% 5% 2% 6% ELL 0 0% 0% 0% 0% 0% Not ELL 87 84% 3% 5% 2% 6%
2004 Total Cohort - 5 Year Outcome All Students 100 75% 5% 5% 1% 14% ELL 0 0% 0% 0% 0% 0% Not ELL 100 75% 5% 5% 1% 14%
2003 Total Cohort - 6 Year Outcome All Students 72 79% 1% 8% 1% 10% ELL 0 0% 0% 0% 0% 0% Not ELL 72 79% 1% 8% 1% 10%
Data presented in this report are based on data submitted by school districts to the data repository for the 2008-09 school year. Students are reported based on their date of entry in grade 9 and their last enrollment status as reported in the warehouse on July 31, 2009. The federal Family Education Rights and Privacy Act prohibits the release of personally identifiable student information. This Act precludes the publication of summary information based on fewer than five students or in which subtraction or other simple mathematical operations could be used to obtain personal information. Cells that contain the ("#") symbol have been suppressed to protect student privacy.
District-ell status Thursday, March 4, 2010 Page 78 of 301

Public School District Total Cohort Graduation Rate and Enrollment Outcome Summary - 2008-09 School Year by English Language Learner Status
2005 Total Cohort as of June of the 4th year of school and as of August 2009, 2004 Total Cohort as of June of the 5th year of school, 2003 Total Cohort as of June of the 6th year of school.
Graduated Transferred to Count with Regents GED
County of Cohort or Local Earned IEP Still Preparation DroppedDistrict Members Diplomas Diploma Enrolled Program Out
COUNTY: FULTON Broadalbin-Perth Central School District
2005 Total Cohort - Aug 2009 Year Outcome All Students 187 87% 3% 2% 0% 8% ELL 0 0% 0% 0% 0% 0% Not ELL 187 87% 3% 2% 0% 8%
2005 Total Cohort - 4 Year Outcome All Students 187 87% 3% 2% 0% 8% ELL 0 0% 0% 0% 0% 0% Not ELL 187 87% 3% 2% 0% 8%
2004 Total Cohort - 5 Year Outcome All Students 161 88% 1% 2% 0% 8% ELL 0 0% 0% 0% 0% 0% Not ELL 161 88% 1% 2% 0% 8%
2003 Total Cohort - 6 Year Outcome All Students 157 89% 2% 0% 0% 9% ELL 0 0% 0% 0% 0% 0% Not ELL 157 89% 2% 0% 0% 9%
Gloversville City School District
2005 Total Cohort - Aug 2009 Year Outcome All Students 221 69% 7% 11% 0% 13% ELL 0 0% 0% 0% 0% 0% Not ELL 221 69% 7% 11% 0% 13%
2005 Total Cohort - 4 Year Outcome All Students 221 66% 7% 14% 0% 13% ELL 0 0% 0% 0% 0% 0% Not ELL 221 66% 7% 14% 0% 13%
2004 Total Cohort - 5 Year Outcome All Students 253 74% 3% 6% 0% 17% ELL 0 0% 0% 0% 0% 0% Not ELL 253 74% 3% 6% 0% 17%
2003 Total Cohort - 6 Year Outcome All Students 258 67% 9% 5% 0% 18% ELL 0 0% 0% 0% 0% 0% Not ELL 258 67% 9% 5% 0% 18%
Johnstown City School District
2005 Total Cohort - Aug 2009 Year Outcome All Students 160 76% 5% 11% 0% 9% ELL 0 0% 0% 0% 0% 0% Not ELL 160 76% 5% 11% 0% 9%
2005 Total Cohort - 4 Year Outcome All Students 160 71% 5% 16% 0% 9% ELL 0 0% 0% 0% 0% 0% Not ELL 160 71% 5% 16% 0% 9%
Data presented in this report are based on data submitted by school districts to the data repository for the 2008-09 school year. Students are reported based on their date of entry in grade 9 and their last enrollment status as reported in the warehouse on July 31, 2009. The federal Family Education Rights and Privacy Act prohibits the release of personally identifiable student information. This Act precludes the publication of summary information based on fewer than five students or in which subtraction or other simple mathematical operations could be used to obtain personal information. Cells that contain the ("#") symbol have been suppressed to protect student privacy.
District-ell status Thursday, March 4, 2010 Page 79 of 301

Public School District Total Cohort Graduation Rate and Enrollment Outcome Summary - 2008-09 School Year by English Language Learner Status
2005 Total Cohort as of June of the 4th year of school and as of August 2009, 2004 Total Cohort as of June of the 5th year of school, 2003 Total Cohort as of June of the 6th year of school.
Graduated Transferred to Count with Regents GED
County of Cohort or Local Earned IEP Still Preparation DroppedDistrict Members Diplomas Diploma Enrolled Program Out
COUNTY: FULTON Johnstown City School District
2004 Total Cohort - 5 Year Outcome All Students 176 75% 5% 5% 0% 15% ELL 0 0% 0% 0% 0% 0% Not ELL 176 75% 5% 5% 0% 15%
2003 Total Cohort - 6 Year Outcome All Students 171 75% 6% 5% 0% 13% ELL 0 0% 0% 0% 0% 0% Not ELL 171 75% 6% 5% 0% 13%
Mayfield Central School District
2005 Total Cohort - Aug 2009 Year Outcome All Students 104 84% 1% 13% 0% 3% ELL 0 0% 0% 0% 0% 0% Not ELL 104 84% 1% 13% 0% 3%
2005 Total Cohort - 4 Year Outcome All Students 104 84% 1% 13% 0% 3% ELL 0 0% 0% 0% 0% 0% Not ELL 104 84% 1% 13% 0% 3%
2004 Total Cohort - 5 Year Outcome All Students 112 86% 2% 0% 5% 7% ELL 0 0% 0% 0% 0% 0% Not ELL 112 86% 2% 0% 5% 7%
2003 Total Cohort - 6 Year Outcome All Students 93 90% 1% 3% 1% 4% ELL 0 0% 0% 0% 0% 0% Not ELL 93 90% 1% 3% 1% 4%
Northville Central School District
2005 Total Cohort - Aug 2009 Year Outcome All Students 46 83% 2% 7% 0% 9% ELL 0 0% 0% 0% 0% 0% Not ELL 46 83% 2% 7% 0% 9%
2005 Total Cohort - 4 Year Outcome All Students 46 83% 2% 7% 0% 9% ELL 0 0% 0% 0% 0% 0% Not ELL 46 83% 2% 7% 0% 9%
2004 Total Cohort - 5 Year Outcome All Students 65 88% 6% 0% 0% 6% ELL 0 0% 0% 0% 0% 0% Not ELL 65 88% 6% 0% 0% 6%
2003 Total Cohort - 6 Year Outcome All Students 40 75% 8% 0% 8% 10% ELL 0 0% 0% 0% 0% 0% Not ELL 40 75% 8% 0% 8% 10%
Data presented in this report are based on data submitted by school districts to the data repository for the 2008-09 school year. Students are reported based on their date of entry in grade 9 and their last enrollment status as reported in the warehouse on July 31, 2009. The federal Family Education Rights and Privacy Act prohibits the release of personally identifiable student information. This Act precludes the publication of summary information based on fewer than five students or in which subtraction or other simple mathematical operations could be used to obtain personal information. Cells that contain the ("#") symbol have been suppressed to protect student privacy.
District-ell status Thursday, March 4, 2010 Page 80 of 301

Public School District Total Cohort Graduation Rate and Enrollment Outcome Summary - 2008-09 School Year by English Language Learner Status
2005 Total Cohort as of June of the 4th year of school and as of August 2009, 2004 Total Cohort as of June of the 5th year of school, 2003 Total Cohort as of June of the 6th year of school.
Graduated Transferred to Count with Regents GED
County of Cohort or Local Earned IEP Still Preparation DroppedDistrict Members Diplomas Diploma Enrolled Program Out
COUNTY: FULTON Oppenheim-Ephratah Central School District
2005 Total Cohort - Aug 2009 Year Outcome All Students 38 68% 11% 11% 0% 11% ELL 0 0% 0% 0% 0% 0% Not ELL 38 68% 11% 11% 0% 11%
2005 Total Cohort - 4 Year Outcome All Students 38 66% 11% 13% 0% 11% ELL 0 0% 0% 0% 0% 0% Not ELL 38 66% 11% 13% 0% 11%
2004 Total Cohort - 5 Year Outcome All Students 26 69% 0% 0% 0% 31% ELL 0 0% 0% 0% 0% 0% Not ELL 26 69% 0% 0% 0% 31%
2003 Total Cohort - 6 Year Outcome All Students 33 61% 15% 6% 3% 15% ELL 0 0% 0% 0% 0% 0% Not ELL 33 61% 15% 6% 3% 15%
Data presented in this report are based on data submitted by school districts to the data repository for the 2008-09 school year. Students are reported based on their date of entry in grade 9 and their last enrollment status as reported in the warehouse on July 31, 2009. The federal Family Education Rights and Privacy Act prohibits the release of personally identifiable student information. This Act precludes the publication of summary information based on fewer than five students or in which subtraction or other simple mathematical operations could be used to obtain personal information. Cells that contain the ("#") symbol have been suppressed to protect student privacy.
District-ell status Thursday, March 4, 2010 Page 81 of 301
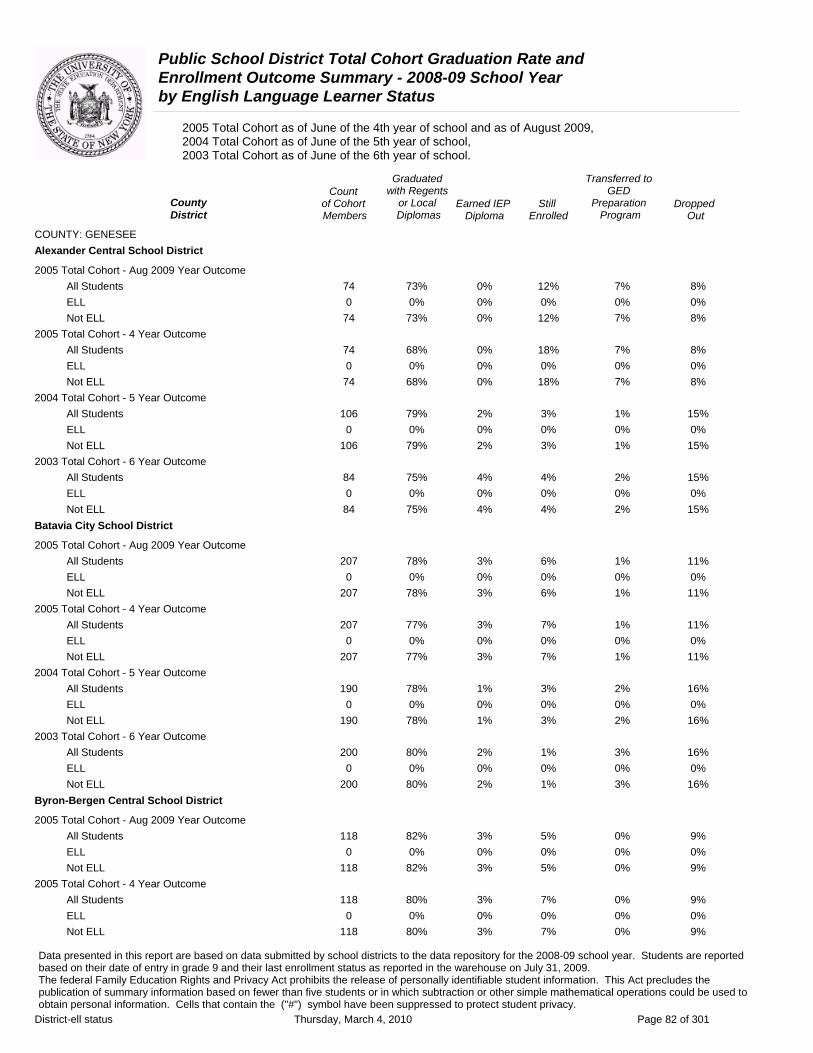
Public School District Total Cohort Graduation Rate and Enrollment Outcome Summary - 2008-09 School Year by English Language Learner Status
2005 Total Cohort as of June of the 4th year of school and as of August 2009, 2004 Total Cohort as of June of the 5th year of school, 2003 Total Cohort as of June of the 6th year of school.
Graduated Transferred to Count with Regents GED
County District
of Cohort Members
or Local Diplomas
Earned IEP Diploma
Still Enrolled
Preparation Program
Dropped Out
COUNTY: GENESEE Alexander Central School District
2005 Total Cohort - Aug 2009 Year Outcome All Students 74 73% 0% 12% 7% 8% ELL 0 0% 0% 0% 0% 0% Not ELL 74 73% 0% 12% 7% 8%
2005 Total Cohort - 4 Year Outcome All Students 74 68% 0% 18% 7% 8% ELL 0 0% 0% 0% 0% 0% Not ELL 74 68% 0% 18% 7% 8%
2004 Total Cohort - 5 Year Outcome All Students 106 79% 2% 3% 1% 15% ELL 0 0% 0% 0% 0% 0% Not ELL 106 79% 2% 3% 1% 15%
2003 Total Cohort - 6 Year Outcome All Students 84 75% 4% 4% 2% 15% ELL 0 0% 0% 0% 0% 0% Not ELL 84 75% 4% 4% 2% 15%
Batavia City School District
2005 Total Cohort - Aug 2009 Year Outcome All Students 207 78% 3% 6% 1% 11% ELL 0 0% 0% 0% 0% 0% Not ELL 207 78% 3% 6% 1% 11%
2005 Total Cohort - 4 Year Outcome All Students 207 77% 3% 7% 1% 11% ELL 0 0% 0% 0% 0% 0% Not ELL 207 77% 3% 7% 1% 11%
2004 Total Cohort - 5 Year Outcome All Students 190 78% 1% 3% 2% 16% ELL 0 0% 0% 0% 0% 0% Not ELL 190 78% 1% 3% 2% 16%
2003 Total Cohort - 6 Year Outcome All Students 200 80% 2% 1% 3% 16% ELL 0 0% 0% 0% 0% 0% Not ELL 200 80% 2% 1% 3% 16%
Byron-Bergen Central School District
2005 Total Cohort - Aug 2009 Year Outcome All Students 118 82% 3% 5% 0% 9% ELL 0 0% 0% 0% 0% 0% Not ELL 118 82% 3% 5% 0% 9%
2005 Total Cohort - 4 Year Outcome All Students 118 80% 3% 7% 0% 9% ELL 0 0% 0% 0% 0% 0% Not ELL 118 80% 3% 7% 0% 9%
Data presented in this report are based on data submitted by school districts to the data repository for the 2008-09 school year. Students are reported based on their date of entry in grade 9 and their last enrollment status as reported in the warehouse on July 31, 2009. The federal Family Education Rights and Privacy Act prohibits the release of personally identifiable student information. This Act precludes the publication of summary information based on fewer than five students or in which subtraction or other simple mathematical operations could be used to obtain personal information. Cells that contain the ("#") symbol have been suppressed to protect student privacy.
District-ell status Thursday, March 4, 2010 Page 82 of 301

Public School District Total Cohort Graduation Rate and Enrollment Outcome Summary - 2008-09 School Year by English Language Learner Status
2005 Total Cohort as of June of the 4th year of school and as of August 2009, 2004 Total Cohort as of June of the 5th year of school, 2003 Total Cohort as of June of the 6th year of school.
Graduated Transferred to Count with Regents GED
County District
of Cohort Members
or Local Diplomas
Earned IEP Diploma
Still Enrolled
Preparation Program
Dropped Out
COUNTY: GENESEE Byron-Bergen Central School District
2004 Total Cohort - 5 Year Outcome All Students 114 90% 0% 4% 3% 3% ELL 1 # # # # # Not ELL 113 # # # # #
2003 Total Cohort - 6 Year Outcome All Students 126 90% 1% 4% 0% 6% ELL 1 # # # # # Not ELL 125 # # # # #
Elba Central School District
2005 Total Cohort - Aug 2009 Year Outcome All Students 33 97% 0% 0% 0% 3% ELL 0 0% 0% 0% 0% 0% Not ELL 33 97% 0% 0% 0% 3%
2005 Total Cohort - 4 Year Outcome All Students 33 97% 0% 0% 0% 3% ELL 0 0% 0% 0% 0% 0% Not ELL 33 97% 0% 0% 0% 3%
2004 Total Cohort - 5 Year Outcome All Students 60 93% 0% 2% 2% 3% ELL 1 # # # # # Not ELL 59 # # # # #
2003 Total Cohort - 6 Year Outcome All Students 47 87% 2% 0% 2% 9% ELL 1 # # # # # Not ELL 46 # # # # #
Le Roy Central School District
2005 Total Cohort - Aug 2009 Year Outcome All Students 124 81% 5% 5% 1% 9% ELL 0 0% 0% 0% 0% 0% Not ELL 124 81% 5% 5% 1% 9%
2005 Total Cohort - 4 Year Outcome All Students 124 81% 5% 5% 1% 9% ELL 0 0% 0% 0% 0% 0% Not ELL 124 81% 5% 5% 1% 9%
2004 Total Cohort - 5 Year Outcome All Students 130 88% 2% 4% 2% 5% ELL 0 0% 0% 0% 0% 0% Not ELL 130 88% 2% 4% 2% 5%
2003 Total Cohort - 6 Year Outcome All Students 120 88% 2% 4% 1% 6% ELL 0 0% 0% 0% 0% 0% Not ELL 120 88% 2% 4% 1% 6%
Data presented in this report are based on data submitted by school districts to the data repository for the 2008-09 school year. Students are reported based on their date of entry in grade 9 and their last enrollment status as reported in the warehouse on July 31, 2009. The federal Family Education Rights and Privacy Act prohibits the release of personally identifiable student information. This Act precludes the publication of summary information based on fewer than five students or in which subtraction or other simple mathematical operations could be used to obtain personal information. Cells that contain the ("#") symbol have been suppressed to protect student privacy.
District-ell status Thursday, March 4, 2010 Page 83 of 301
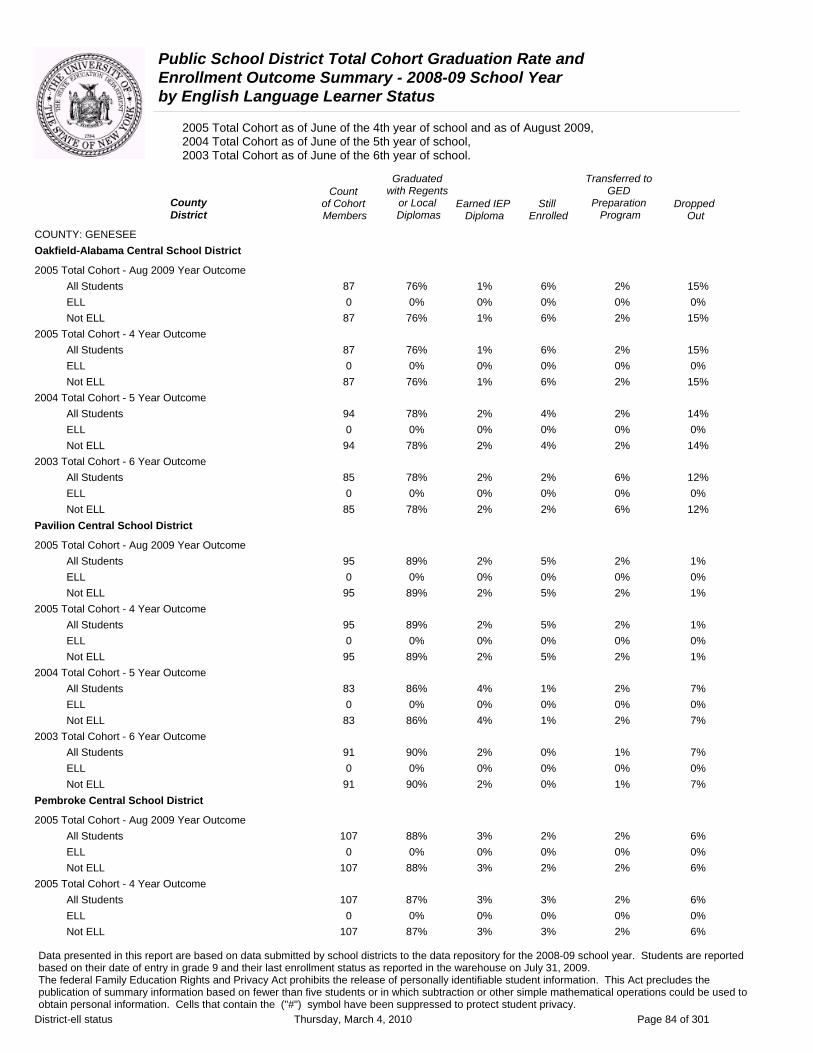
Public School District Total Cohort Graduation Rate and Enrollment Outcome Summary - 2008-09 School Year by English Language Learner Status
2005 Total Cohort as of June of the 4th year of school and as of August 2009, 2004 Total Cohort as of June of the 5th year of school, 2003 Total Cohort as of June of the 6th year of school.
Graduated Transferred to Count with Regents GED
County of Cohort or Local Earned IEP Still Preparation DroppedDistrict Members Diplomas Diploma Enrolled Program Out
COUNTY: GENESEE Oakfield-Alabama Central School District
2005 Total Cohort - Aug 2009 Year Outcome All Students 87 76% 1% 6% 2% 15% ELL 0 0% 0% 0% 0% 0% Not ELL 87 76% 1% 6% 2% 15%
2005 Total Cohort - 4 Year Outcome All Students 87 76% 1% 6% 2% 15% ELL 0 0% 0% 0% 0% 0% Not ELL 87 76% 1% 6% 2% 15%
2004 Total Cohort - 5 Year Outcome All Students 94 78% 2% 4% 2% 14% ELL 0 0% 0% 0% 0% 0% Not ELL 94 78% 2% 4% 2% 14%
2003 Total Cohort - 6 Year Outcome All Students 85 78% 2% 2% 6% 12% ELL 0 0% 0% 0% 0% 0% Not ELL 85 78% 2% 2% 6% 12%
Pavilion Central School District
2005 Total Cohort - Aug 2009 Year Outcome All Students 95 89% 2% 5% 2% 1% ELL 0 0% 0% 0% 0% 0% Not ELL 95 89% 2% 5% 2% 1%
2005 Total Cohort - 4 Year Outcome All Students 95 89% 2% 5% 2% 1% ELL 0 0% 0% 0% 0% 0% Not ELL 95 89% 2% 5% 2% 1%
2004 Total Cohort - 5 Year Outcome All Students 83 86% 4% 1% 2% 7% ELL 0 0% 0% 0% 0% 0% Not ELL 83 86% 4% 1% 2% 7%
2003 Total Cohort - 6 Year Outcome All Students 91 90% 2% 0% 1% 7% ELL 0 0% 0% 0% 0% 0% Not ELL 91 90% 2% 0% 1% 7%
Pembroke Central School District
2005 Total Cohort - Aug 2009 Year Outcome All Students 107 88% 3% 2% 2% 6% ELL 0 0% 0% 0% 0% 0% Not ELL 107 88% 3% 2% 2% 6%
2005 Total Cohort - 4 Year Outcome All Students 107 87% 3% 3% 2% 6% ELL 0 0% 0% 0% 0% 0% Not ELL 107 87% 3% 3% 2% 6%
Data presented in this report are based on data submitted by school districts to the data repository for the 2008-09 school year. Students are reported based on their date of entry in grade 9 and their last enrollment status as reported in the warehouse on July 31, 2009. The federal Family Education Rights and Privacy Act prohibits the release of personally identifiable student information. This Act precludes the publication of summary information based on fewer than five students or in which subtraction or other simple mathematical operations could be used to obtain personal information. Cells that contain the ("#") symbol have been suppressed to protect student privacy.
District-ell status Thursday, March 4, 2010 Page 84 of 301

Public School District Total Cohort Graduation Rate and Enrollment Outcome Summary - 2008-09 School Year by English Language Learner Status
2005 Total Cohort as of June of the 4th year of school and as of August 2009, 2004 Total Cohort as of June of the 5th year of school, 2003 Total Cohort as of June of the 6th year of school.
Graduated Transferred to Count with Regents GED
County of Cohort or Local Earned IEP Still Preparation DroppedDistrict Members Diplomas Diploma Enrolled Program Out
COUNTY: GENESEE Pembroke Central School District
2004 Total Cohort - 5 Year Outcome All Students 112 94% 0% 2% 1% 4% ELL 1 # # # # # Not ELL 111 # # # # #
2003 Total Cohort - 6 Year Outcome All Students 98 89% 1% 2% 2% 6% ELL 0 0% 0% 0% 0% 0% Not ELL 98 89% 1% 2% 2% 6%
Data presented in this report are based on data submitted by school districts to the data repository for the 2008-09 school year. Students are reported based on their date of entry in grade 9 and their last enrollment status as reported in the warehouse on July 31, 2009. The federal Family Education Rights and Privacy Act prohibits the release of personally identifiable student information. This Act precludes the publication of summary information based on fewer than five students or in which subtraction or other simple mathematical operations could be used to obtain personal information. Cells that contain the ("#") symbol have been suppressed to protect student privacy.
District-ell status Thursday, March 4, 2010 Page 85 of 301

Public School District Total Cohort Graduation Rate and Enrollment Outcome Summary - 2008-09 School Year by English Language Learner Status
2005 Total Cohort as of June of the 4th year of school and as of August 2009, 2004 Total Cohort as of June of the 5th year of school, 2003 Total Cohort as of June of the 6th year of school.
Graduated Transferred to Count with Regents GED
County of Cohort or Local Earned IEP Still Preparation DroppedDistrict Members Diplomas Diploma Enrolled Program Out
COUNTY: GREENE Cairo-Durham Central School District
2005 Total Cohort - Aug 2009 Year Outcome All Students 156 77% 3% 7% 1% 12% ELL 0 0% 0% 0% 0% 0% Not ELL 156 77% 3% 7% 1% 12%
2005 Total Cohort - 4 Year Outcome All Students 156 76% 3% 8% 1% 12% ELL 0 0% 0% 0% 0% 0% Not ELL 156 76% 3% 8% 1% 12%
2004 Total Cohort - 5 Year Outcome All Students 153 72% 3% 3% 9% 13% ELL 0 0% 0% 0% 0% 0% Not ELL 153 72% 3% 3% 9% 13%
2003 Total Cohort - 6 Year Outcome All Students 139 73% 2% 1% 2% 22% ELL 0 0% 0% 0% 0% 0% Not ELL 139 73% 2% 1% 2% 22%
Catskill Central School District
2005 Total Cohort - Aug 2009 Year Outcome All Students 114 73% 2% 9% 5% 11% ELL 1 # # # # # Not ELL 113 # # # # #
2005 Total Cohort - 4 Year Outcome All Students 114 72% 2% 10% 5% 11% ELL 1 # # # # # Not ELL 113 # # # # #
2004 Total Cohort - 5 Year Outcome All Students 149 69% 5% 5% 7% 14% ELL 2 # # # # # Not ELL 147 # # # # #
2003 Total Cohort - 6 Year Outcome All Students 145 68% 3% 3% 11% 14% ELL 2 # # # # # Not ELL 143 # # # # #
Coxsackie-Athens Central School District
2005 Total Cohort - Aug 2009 Year Outcome All Students 139 83% 1% 8% 0% 9% ELL 1 # # # # # Not ELL 138 # # # # #
2005 Total Cohort - 4 Year Outcome All Students 139 83% 1% 8% 0% 9% ELL 1 # # # # # Not ELL 138 # # # # #
Data presented in this report are based on data submitted by school districts to the data repository for the 2008-09 school year. Students are reported based on their date of entry in grade 9 and their last enrollment status as reported in the warehouse on July 31, 2009. The federal Family Education Rights and Privacy Act prohibits the release of personally identifiable student information. This Act precludes the publication of summary information based on fewer than five students or in which subtraction or other simple mathematical operations could be used to obtain personal information. Cells that contain the ("#") symbol have been suppressed to protect student privacy.
District-ell status Thursday, March 4, 2010 Page 86 of 301

Public School District Total Cohort Graduation Rate and Enrollment Outcome Summary - 2008-09 School Year by English Language Learner Status
2005 Total Cohort as of June of the 4th year of school and as of August 2009, 2004 Total Cohort as of June of the 5th year of school, 2003 Total Cohort as of June of the 6th year of school.
Graduated Transferred to Count with Regents GED
County of Cohort or Local Earned IEP Still Preparation DroppedDistrict Members Diplomas Diploma Enrolled Program Out
COUNTY: GREENE Coxsackie-Athens Central School District
2004 Total Cohort - 5 Year Outcome All Students 137 78% 4% 1% 3% 13% ELL 0 0% 0% 0% 0% 0% Not ELL 137 78% 4% 1% 3% 13%
2003 Total Cohort - 6 Year Outcome All Students 111 83% 4% 4% 0% 10% ELL 0 0% 0% 0% 0% 0% Not ELL 111 83% 4% 4% 0% 10%
Greenville Central School District
2005 Total Cohort - Aug 2009 Year Outcome All Students 130 83% 1% 8% 4% 5% ELL 0 0% 0% 0% 0% 0% Not ELL 130 83% 1% 8% 4% 5%
2005 Total Cohort - 4 Year Outcome All Students 130 83% 1% 8% 4% 5% ELL 0 0% 0% 0% 0% 0% Not ELL 130 83% 1% 8% 4% 5%
2004 Total Cohort - 5 Year Outcome All Students 129 87% 1% 2% 5% 5% ELL 0 0% 0% 0% 0% 0% Not ELL 129 87% 1% 2% 5% 5%
2003 Total Cohort - 6 Year Outcome All Students 117 93% 1% 0% 2% 3% ELL 0 0% 0% 0% 0% 0% Not ELL 117 93% 1% 0% 2% 3%
Hunter-Tannersville Central School District
2005 Total Cohort - Aug 2009 Year Outcome All Students 62 84% 2% 6% 5% 3% ELL 1 # # # # # Not ELL 61 # # # # #
2005 Total Cohort - 4 Year Outcome All Students 62 84% 2% 6% 5% 3% ELL 1 # # # # # Not ELL 61 # # # # #
2004 Total Cohort - 5 Year Outcome All Students 45 73% 2% 13% 2% 9% ELL 0 0% 0% 0% 0% 0% Not ELL 45 73% 2% 13% 2% 9%
2003 Total Cohort - 6 Year Outcome All Students 53 91% 0% 0% 0% 9% ELL 0 0% 0% 0% 0% 0% Not ELL 53 91% 0% 0% 0% 9%
Data presented in this report are based on data submitted by school districts to the data repository for the 2008-09 school year. Students are reported based on their date of entry in grade 9 and their last enrollment status as reported in the warehouse on July 31, 2009. The federal Family Education Rights and Privacy Act prohibits the release of personally identifiable student information. This Act precludes the publication of summary information based on fewer than five students or in which subtraction or other simple mathematical operations could be used to obtain personal information. Cells that contain the ("#") symbol have been suppressed to protect student privacy.
District-ell status Thursday, March 4, 2010 Page 87 of 301

Public School District Total Cohort Graduation Rate and Enrollment Outcome Summary - 2008-09 School Year by English Language Learner Status
2005 Total Cohort as of June of the 4th year of school and as of August 2009, 2004 Total Cohort as of June of the 5th year of school, 2003 Total Cohort as of June of the 6th year of school.
Graduated Transferred to Count with Regents GED
County of Cohort or Local Earned IEP Still Preparation DroppedDistrict Members Diplomas Diploma Enrolled Program Out
COUNTY: GREENE Windham-Ashland-Jewett Central School District
2005 Total Cohort - Aug 2009 Year Outcome All Students 43 91% 2% 5% 0% 2% ELL 0 0% 0% 0% 0% 0% Not ELL 43 91% 2% 5% 0% 2%
2005 Total Cohort - 4 Year Outcome All Students 43 88% 2% 7% 0% 2% ELL 0 0% 0% 0% 0% 0% Not ELL 43 88% 2% 7% 0% 2%
2004 Total Cohort - 5 Year Outcome All Students 34 97% 0% 3% 0% 0% ELL 0 0% 0% 0% 0% 0% Not ELL 34 97% 0% 3% 0% 0%
2003 Total Cohort - 6 Year Outcome All Students 48 92% 2% 0% 0% 6% ELL 0 0% 0% 0% 0% 0% Not ELL 48 92% 2% 0% 0% 6%
Data presented in this report are based on data submitted by school districts to the data repository for the 2008-09 school year. Students are reported based on their date of entry in grade 9 and their last enrollment status as reported in the warehouse on July 31, 2009. The federal Family Education Rights and Privacy Act prohibits the release of personally identifiable student information. This Act precludes the publication of summary information based on fewer than five students or in which subtraction or other simple mathematical operations could be used to obtain personal information. Cells that contain the ("#") symbol have been suppressed to protect student privacy.
District-ell status Thursday, March 4, 2010 Page 88 of 301
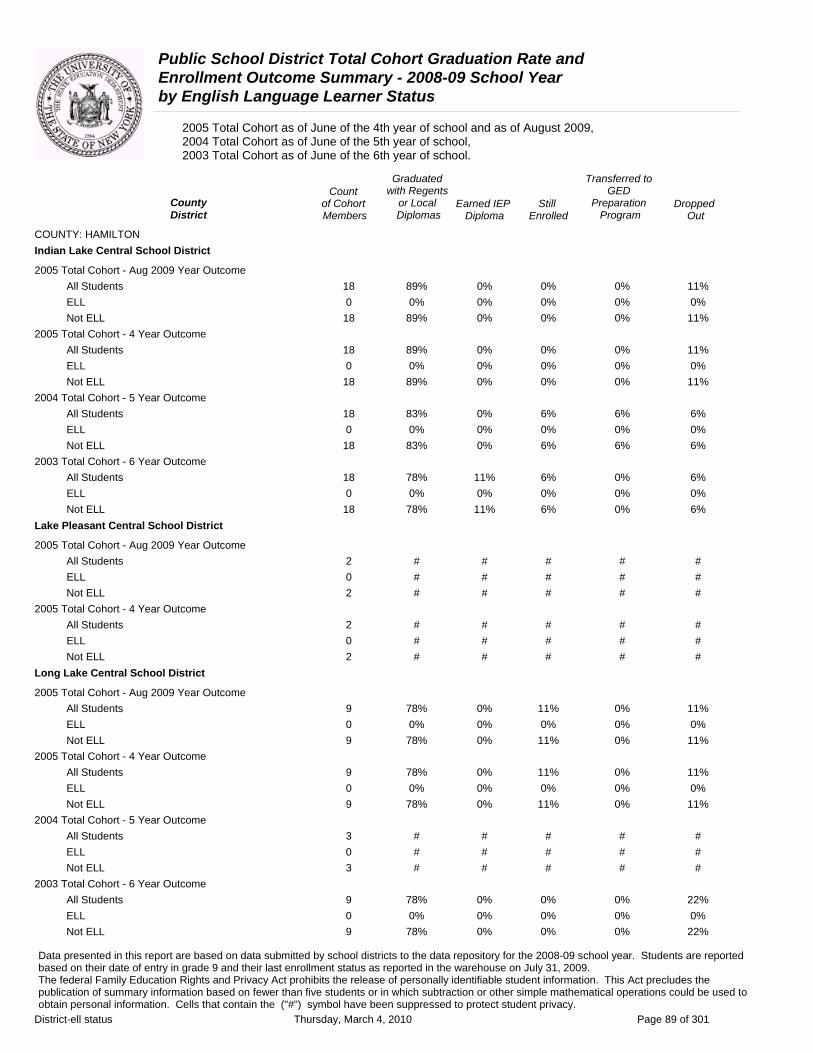
Public School District Total Cohort Graduation Rate and Enrollment Outcome Summary - 2008-09 School Year by English Language Learner Status
2005 Total Cohort as of June of the 4th year of school and as of August 2009, 2004 Total Cohort as of June of the 5th year of school, 2003 Total Cohort as of June of the 6th year of school.
Graduated Transferred to Count with Regents GED
County of Cohort or Local Earned IEP Still Preparation DroppedDistrict Members Diplomas Diploma Enrolled Program Out
COUNTY: HAMILTON Indian Lake Central School District
2005 Total Cohort - Aug 2009 Year Outcome All Students 18 89% 0% 0% 0% 11% ELL 0 0% 0% 0% 0% 0% Not ELL 18 89% 0% 0% 0% 11%
2005 Total Cohort - 4 Year Outcome All Students 18 89% 0% 0% 0% 11% ELL 0 0% 0% 0% 0% 0% Not ELL 18 89% 0% 0% 0% 11%
2004 Total Cohort - 5 Year Outcome All Students 18 83% 0% 6% 6% 6% ELL 0 0% 0% 0% 0% 0% Not ELL 18 83% 0% 6% 6% 6%
2003 Total Cohort - 6 Year Outcome All Students 18 78% 11% 6% 0% 6% ELL 0 0% 0% 0% 0% 0% Not ELL 18 78% 11% 6% 0% 6%
Lake Pleasant Central School District
2005 Total Cohort - Aug 2009 Year Outcome All Students 2 # # # # # ELL 0 # # # # # Not ELL 2 # # # # #
2005 Total Cohort - 4 Year Outcome All Students 2 # # # # # ELL 0 # # # # # Not ELL 2 # # # # #
Long Lake Central School District
2005 Total Cohort - Aug 2009 Year Outcome All Students 9 78% 0% 11% 0% 11% ELL 0 0% 0% 0% 0% 0% Not ELL 9 78% 0% 11% 0% 11%
2005 Total Cohort - 4 Year Outcome All Students 9 78% 0% 11% 0% 11% ELL 0 0% 0% 0% 0% 0% Not ELL 9 78% 0% 11% 0% 11%
2004 Total Cohort - 5 Year Outcome All Students 3 # # # # # ELL 0 # # # # # Not ELL 3 # # # # #
2003 Total Cohort - 6 Year Outcome All Students 9 78% 0% 0% 0% 22% ELL 0 0% 0% 0% 0% 0% Not ELL 9 78% 0% 0% 0% 22%
Data presented in this report are based on data submitted by school districts to the data repository for the 2008-09 school year. Students are reported based on their date of entry in grade 9 and their last enrollment status as reported in the warehouse on July 31, 2009. The federal Family Education Rights and Privacy Act prohibits the release of personally identifiable student information. This Act precludes the publication of summary information based on fewer than five students or in which subtraction or other simple mathematical operations could be used to obtain personal information. Cells that contain the ("#") symbol have been suppressed to protect student privacy.
District-ell status Thursday, March 4, 2010 Page 89 of 301

Public School District Total Cohort Graduation Rate and Enrollment Outcome Summary - 2008-09 School Year by English Language Learner Status
2005 Total Cohort as of June of the 4th year of school and as of August 2009, 2004 Total Cohort as of June of the 5th year of school, 2003 Total Cohort as of June of the 6th year of school.
Graduated Transferred to Count with Regents GED
County of Cohort or Local Earned IEP Still Preparation DroppedDistrict Members Diplomas Diploma Enrolled Program Out
COUNTY: HAMILTON Wells Central School District
2005 Total Cohort - Aug 2009 Year Outcome All Students 21 81% 5% 10% 0% 5% ELL 0 0% 0% 0% 0% 0% Not ELL 21 81% 5% 10% 0% 5%
2005 Total Cohort - 4 Year Outcome All Students 21 76% 5% 14% 0% 5% ELL 0 0% 0% 0% 0% 0% Not ELL 21 76% 5% 14% 0% 5%
2004 Total Cohort - 5 Year Outcome All Students 19 89% 0% 0% 0% 11% ELL 0 0% 0% 0% 0% 0% Not ELL 19 89% 0% 0% 0% 11%
2003 Total Cohort - 6 Year Outcome All Students 18 94% 0% 6% 0% 0% ELL 0 0% 0% 0% 0% 0% Not ELL 18 94% 0% 6% 0% 0%
Data presented in this report are based on data submitted by school districts to the data repository for the 2008-09 school year. Students are reported based on their date of entry in grade 9 and their last enrollment status as reported in the warehouse on July 31, 2009. The federal Family Education Rights and Privacy Act prohibits the release of personally identifiable student information. This Act precludes the publication of summary information based on fewer than five students or in which subtraction or other simple mathematical operations could be used to obtain personal information. Cells that contain the ("#") symbol have been suppressed to protect student privacy.
District-ell status Thursday, March 4, 2010 Page 90 of 301

Public School District Total Cohort Graduation Rate and Enrollment Outcome Summary - 2008-09 School Year by English Language Learner Status
2005 Total Cohort as of June of the 4th year of school and as of August 2009, 2004 Total Cohort as of June of the 5th year of school, 2003 Total Cohort as of June of the 6th year of school.
Graduated Transferred to Count with Regents GED
County of Cohort or Local Earned IEP Still Preparation DroppedDistrict Members Diplomas Diploma Enrolled Program Out
COUNTY: HERKIMER Dolgeville Central School District
2005 Total Cohort - Aug 2009 Year Outcome All Students 78 81% 10% 4% 0% 5% ELL 0 0% 0% 0% 0% 0% Not ELL 78 81% 10% 4% 0% 5%
2005 Total Cohort - 4 Year Outcome All Students 78 81% 10% 4% 0% 5% ELL 0 0% 0% 0% 0% 0% Not ELL 78 81% 10% 4% 0% 5%
2004 Total Cohort - 5 Year Outcome All Students 73 81% 8% 3% 1% 7% ELL 0 0% 0% 0% 0% 0% Not ELL 73 81% 8% 3% 1% 7%
2003 Total Cohort - 6 Year Outcome All Students 90 84% 3% 2% 1% 9% ELL 0 0% 0% 0% 0% 0% Not ELL 90 84% 3% 2% 1% 9%
Frankfort-Schuyler Central School District
2005 Total Cohort - Aug 2009 Year Outcome All Students 96 79% 3% 6% 1% 10% ELL 0 0% 0% 0% 0% 0% Not ELL 96 79% 3% 6% 1% 10%
2005 Total Cohort - 4 Year Outcome All Students 96 78% 3% 7% 1% 10% ELL 0 0% 0% 0% 0% 0% Not ELL 96 78% 3% 7% 1% 10%
2004 Total Cohort - 5 Year Outcome All Students 79 76% 11% 0% 3% 10% ELL 0 0% 0% 0% 0% 0% Not ELL 79 76% 11% 0% 3% 10%
2003 Total Cohort - 6 Year Outcome All Students 72 86% 1% 3% 3% 7% ELL 0 0% 0% 0% 0% 0% Not ELL 72 86% 1% 3% 3% 7%
Herkimer Central School District
2005 Total Cohort - Aug 2009 Year Outcome All Students 145 74% 0% 8% 2% 17% ELL 0 0% 0% 0% 0% 0% Not ELL 145 74% 0% 8% 2% 17%
2005 Total Cohort - 4 Year Outcome All Students 145 71% 0% 10% 2% 17% ELL 0 0% 0% 0% 0% 0% Not ELL 145 71% 0% 10% 2% 17%
Data presented in this report are based on data submitted by school districts to the data repository for the 2008-09 school year. Students are reported based on their date of entry in grade 9 and their last enrollment status as reported in the warehouse on July 31, 2009. The federal Family Education Rights and Privacy Act prohibits the release of personally identifiable student information. This Act precludes the publication of summary information based on fewer than five students or in which subtraction or other simple mathematical operations could be used to obtain personal information. Cells that contain the ("#") symbol have been suppressed to protect student privacy.
District-ell status Thursday, March 4, 2010 Page 91 of 301

Public School District Total Cohort Graduation Rate and Enrollment Outcome Summary - 2008-09 School Year by English Language Learner Status
2005 Total Cohort as of June of the 4th year of school and as of August 2009, 2004 Total Cohort as of June of the 5th year of school, 2003 Total Cohort as of June of the 6th year of school.
County District
COUNTY: HERKIMER Herkimer Central School District
2004 Total Cohort - 5 Year Outcome All Students ELL Not ELL
2003 Total Cohort - 6 Year Outcome All Students ELL Not ELL
Ilion Central School District
2005 Total Cohort - Aug 2009 Year Outcome All Students ELL Not ELL
2005 Total Cohort - 4 Year Outcome All Students ELL Not ELL
2004 Total Cohort - 5 Year Outcome All Students ELL Not ELL
2003 Total Cohort - 6 Year Outcome All Students ELL Not ELL
Little Falls City School District
2005 Total Cohort - Aug 2009 Year Outcome All Students ELL Not ELL
2005 Total Cohort - 4 Year Outcome All Students ELL Not ELL
2004 Total Cohort - 5 Year Outcome All Students ELL Not ELL
2003 Total Cohort - 6 Year Outcome All Students ELL Not ELL
Count of Cohort Members
106 0
106
107 0
107
118 0
118
118 0
118
131 0
131
141 0
141
108 0
108
108 0
108
111 0
111
79 0 79
Graduated with Regents
or Local Diplomas
81% 0%
81%
78% 0%
78%
76% 0%
76%
75% 0%
75%
79% 0%
79%
78% 0%
78%
71% 0%
71%
71% 0%
71%
74% 0%
74%
76% 0%
76%
Earned IEP Diploma
3% 0% 3%
1% 0% 1%
5% 0% 5%
5% 0% 5%
5% 0% 5%
1% 0% 1%
6% 0% 6%
6% 0% 6%
8% 0% 8%
5% 0% 5%
Still Enrolled
4% 0% 4%
7% 0% 7%
9% 0% 9%
11% 0%
11%
7% 0% 7%
1% 0% 1%
8% 0% 8%
8% 0% 8%
5% 0% 5%
4% 0% 4%
Transferred to GED
Preparation Program
Dropped Out
1% 11% 0% 0% 1% 11%
1% 14% 0% 0% 1% 14%
1% 8% 0% 0% 1% 8%
1% 8% 0% 0% 1% 8%
2% 8% 0% 0% 2% 8%
4% 12% 0% 0% 4% 12%
0% 14% 0% 0% 0% 14%
0% 14% 0% 0% 0% 14%
1% 12% 0% 0% 1% 12%
1% 14% 0% 0% 1% 14%
Data presented in this report are based on data submitted by school districts to the data repository for the 2008-09 school year. Students are reported based on their date of entry in grade 9 and their last enrollment status as reported in the warehouse on July 31, 2009. The federal Family Education Rights and Privacy Act prohibits the release of personally identifiable student information. This Act precludes the publication of summary information based on fewer than five students or in which subtraction or other simple mathematical operations could be used to obtain personal information. Cells that contain the ("#") symbol have been suppressed to protect student privacy.
District-ell status Thursday, March 4, 2010 Page 92 of 301

Public School District Total Cohort Graduation Rate and Enrollment Outcome Summary - 2008-09 School Year by English Language Learner Status
2005 Total Cohort as of June of the 4th year of school and as of August 2009, 2004 Total Cohort as of June of the 5th year of school, 2003 Total Cohort as of June of the 6th year of school.
Graduated Transferred to Count with Regents GED
County of Cohort or Local Earned IEP Still Preparation DroppedDistrict Members Diplomas Diploma Enrolled Program Out
COUNTY: HERKIMER Mohawk Central School District
2005 Total Cohort - Aug 2009 Year Outcome All Students 96 67% 9% 14% 0% 10% ELL 0 0% 0% 0% 0% 0% Not ELL 96 67% 9% 14% 0% 10%
2005 Total Cohort - 4 Year Outcome All Students 96 67% 9% 14% 0% 10% ELL 0 0% 0% 0% 0% 0% Not ELL 96 67% 9% 14% 0% 10%
2004 Total Cohort - 5 Year Outcome All Students 101 79% 12% 2% 0% 7% ELL 0 0% 0% 0% 0% 0% Not ELL 101 79% 12% 2% 0% 7%
2003 Total Cohort - 6 Year Outcome All Students 48 75% 15% 4% 0% 6% ELL 0 0% 0% 0% 0% 0% Not ELL 48 75% 15% 4% 0% 6%
Mount Markham Central School District
2005 Total Cohort - Aug 2009 Year Outcome All Students 108 89% 1% 4% 0% 6% ELL 0 0% 0% 0% 0% 0% Not ELL 108 89% 1% 4% 0% 6%
2005 Total Cohort - 4 Year Outcome All Students 108 86% 1% 6% 0% 6% ELL 0 0% 0% 0% 0% 0% Not ELL 108 86% 1% 6% 0% 6%
2004 Total Cohort - 5 Year Outcome All Students 132 85% 1% 2% 5% 7% ELL 0 0% 0% 0% 0% 0% Not ELL 132 85% 1% 2% 5% 7%
2003 Total Cohort - 6 Year Outcome All Students 109 83% 6% 5% 0% 6% ELL 0 0% 0% 0% 0% 0% Not ELL 109 83% 6% 5% 0% 6%
Poland Central School District
2005 Total Cohort - Aug 2009 Year Outcome All Students 62 92% 2% 0% 5% 2% ELL 0 0% 0% 0% 0% 0% Not ELL 62 92% 2% 0% 5% 2%
2005 Total Cohort - 4 Year Outcome All Students 62 92% 2% 0% 5% 2% ELL 0 0% 0% 0% 0% 0% Not ELL 62 92% 2% 0% 5% 2%
Data presented in this report are based on data submitted by school districts to the data repository for the 2008-09 school year. Students are reported based on their date of entry in grade 9 and their last enrollment status as reported in the warehouse on July 31, 2009. The federal Family Education Rights and Privacy Act prohibits the release of personally identifiable student information. This Act precludes the publication of summary information based on fewer than five students or in which subtraction or other simple mathematical operations could be used to obtain personal information. Cells that contain the ("#") symbol have been suppressed to protect student privacy.
District-ell status Thursday, March 4, 2010 Page 93 of 301

Public School District Total Cohort Graduation Rate and Enrollment Outcome Summary - 2008-09 School Year by English Language Learner Status
2005 Total Cohort as of June of the 4th year of school and as of August 2009, 2004 Total Cohort as of June of the 5th year of school, 2003 Total Cohort as of June of the 6th year of school.
Graduated Transferred to Count with Regents GED
County of Cohort or Local Earned IEP Still Preparation DroppedDistrict Members Diplomas Diploma Enrolled Program Out
COUNTY: HERKIMER Poland Central School District
2004 Total Cohort - 5 Year Outcome All Students 63 89% 2% 0% 6% 3% ELL 0 0% 0% 0% 0% 0% Not ELL 63 89% 2% 0% 6% 3%
2003 Total Cohort - 6 Year Outcome All Students 67 88% 1% 1% 6% 3% ELL 0 0% 0% 0% 0% 0% Not ELL 67 88% 1% 1% 6% 3%
Town Of Webb Union Free School District
2005 Total Cohort - Aug 2009 Year Outcome All Students 30 93% 3% 3% 0% 0% ELL 0 0% 0% 0% 0% 0% Not ELL 30 93% 3% 3% 0% 0%
2005 Total Cohort - 4 Year Outcome All Students 30 93% 3% 3% 0% 0% ELL 0 0% 0% 0% 0% 0% Not ELL 30 93% 3% 3% 0% 0%
2004 Total Cohort - 5 Year Outcome All Students 39 82% 0% 5% 8% 5% ELL 0 0% 0% 0% 0% 0% Not ELL 39 82% 0% 5% 8% 5%
2003 Total Cohort - 6 Year Outcome All Students 37 86% 8% 3% 0% 3% ELL 0 0% 0% 0% 0% 0% Not ELL 37 86% 8% 3% 0% 3%
Van Hornesville-Owen D Young Central School District
2005 Total Cohort - Aug 2009 Year Outcome All Students 25 84% 0% 4% 4% 8% ELL 0 0% 0% 0% 0% 0% Not ELL 25 84% 0% 4% 4% 8%
2005 Total Cohort - 4 Year Outcome All Students 25 84% 0% 4% 4% 8% ELL 0 0% 0% 0% 0% 0% Not ELL 25 84% 0% 4% 4% 8%
2004 Total Cohort - 5 Year Outcome All Students 9 89% 0% 0% 0% 11% ELL 0 0% 0% 0% 0% 0% Not ELL 9 89% 0% 0% 0% 11%
2003 Total Cohort - 6 Year Outcome All Students 24 100% 0% 0% 0% 0% ELL 0 0% 0% 0% 0% 0% Not ELL 24 100% 0% 0% 0% 0%
Data presented in this report are based on data submitted by school districts to the data repository for the 2008-09 school year. Students are reported based on their date of entry in grade 9 and their last enrollment status as reported in the warehouse on July 31, 2009. The federal Family Education Rights and Privacy Act prohibits the release of personally identifiable student information. This Act precludes the publication of summary information based on fewer than five students or in which subtraction or other simple mathematical operations could be used to obtain personal information. Cells that contain the ("#") symbol have been suppressed to protect student privacy.
District-ell status Thursday, March 4, 2010 Page 94 of 301
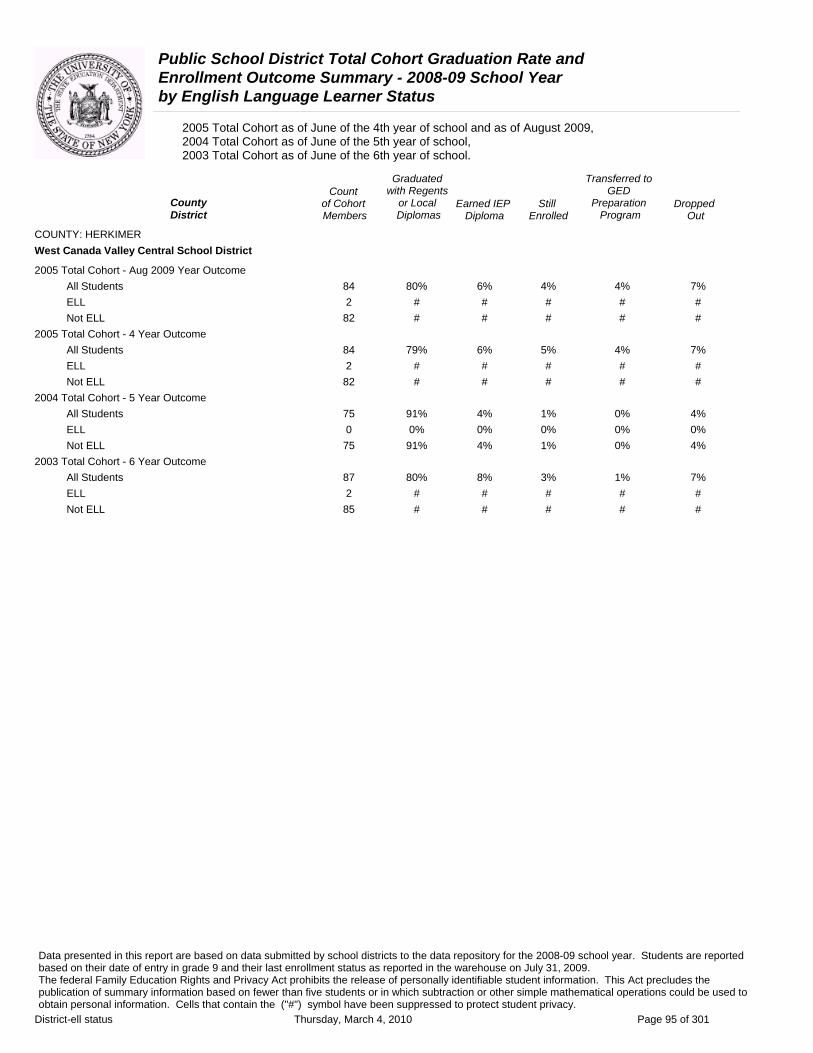
Public School District Total Cohort Graduation Rate and Enrollment Outcome Summary - 2008-09 School Year by English Language Learner Status
2005 Total Cohort as of June of the 4th year of school and as of August 2009, 2004 Total Cohort as of June of the 5th year of school, 2003 Total Cohort as of June of the 6th year of school.
Graduated Transferred to Count with Regents GED
County of Cohort or Local Earned IEP Still Preparation DroppedDistrict Members Diplomas Diploma Enrolled Program Out
COUNTY: HERKIMER West Canada Valley Central School District
2005 Total Cohort - Aug 2009 Year Outcome All Students 84 80% 6% 4% 4% 7% ELL 2 # # # # # Not ELL 82 # # # # #
2005 Total Cohort - 4 Year Outcome All Students 84 79% 6% 5% 4% 7% ELL 2 # # # # # Not ELL 82 # # # # #
2004 Total Cohort - 5 Year Outcome All Students 75 91% 4% 1% 0% 4% ELL 0 0% 0% 0% 0% 0% Not ELL 75 91% 4% 1% 0% 4%
2003 Total Cohort - 6 Year Outcome All Students 87 80% 8% 3% 1% 7% ELL 2 # # # # # Not ELL 85 # # # # #
Data presented in this report are based on data submitted by school districts to the data repository for the 2008-09 school year. Students are reported based on their date of entry in grade 9 and their last enrollment status as reported in the warehouse on July 31, 2009. The federal Family Education Rights and Privacy Act prohibits the release of personally identifiable student information. This Act precludes the publication of summary information based on fewer than five students or in which subtraction or other simple mathematical operations could be used to obtain personal information. Cells that contain the ("#") symbol have been suppressed to protect student privacy.
District-ell status Thursday, March 4, 2010 Page 95 of 301

Public School District Total Cohort Graduation Rate and Enrollment Outcome Summary - 2008-09 School Year by English Language Learner Status
2005 Total Cohort as of June of the 4th year of school and as of August 2009, 2004 Total Cohort as of June of the 5th year of school, 2003 Total Cohort as of June of the 6th year of school.
Graduated Transferred to Count with Regents GED
County of Cohort or Local Earned IEP Still Preparation DroppedDistrict Members Diplomas Diploma Enrolled Program Out
COUNTY: JEFFERSON Alexandria Central School District
2005 Total Cohort - Aug 2009 Year Outcome All Students 59 73% 8% 8% 0% 10% ELL 0 0% 0% 0% 0% 0% Not ELL 59 73% 8% 8% 0% 10%
2005 Total Cohort - 4 Year Outcome All Students 59 68% 8% 14% 0% 10% ELL 0 0% 0% 0% 0% 0% Not ELL 59 68% 8% 14% 0% 10%
2004 Total Cohort - 5 Year Outcome All Students 60 85% 5% 3% 0% 7% ELL 0 0% 0% 0% 0% 0% Not ELL 60 85% 5% 3% 0% 7%
2003 Total Cohort - 6 Year Outcome All Students 61 82% 8% 3% 0% 7% ELL 0 0% 0% 0% 0% 0% Not ELL 61 82% 8% 3% 0% 7%
Belleville Henderson Central School District
2005 Total Cohort - Aug 2009 Year Outcome All Students 54 85% 2% 9% 0% 4% ELL 0 0% 0% 0% 0% 0% Not ELL 54 85% 2% 9% 0% 4%
2005 Total Cohort - 4 Year Outcome All Students 54 85% 2% 9% 0% 4% ELL 0 0% 0% 0% 0% 0% Not ELL 54 85% 2% 9% 0% 4%
2004 Total Cohort - 5 Year Outcome All Students 44 86% 5% 0% 0% 9% ELL 0 0% 0% 0% 0% 0% Not ELL 44 86% 5% 0% 0% 9%
2003 Total Cohort - 6 Year Outcome All Students 45 87% 4% 0% 0% 9% ELL 0 0% 0% 0% 0% 0% Not ELL 45 87% 4% 0% 0% 9%
Carthage Central School District
2005 Total Cohort - Aug 2009 Year Outcome All Students 243 84% 2% 6% 2% 7% ELL 0 0% 0% 0% 0% 0% Not ELL 243 84% 2% 6% 2% 7%
2005 Total Cohort - 4 Year Outcome All Students 243 80% 2% 9% 2% 7% ELL 0 0% 0% 0% 0% 0% Not ELL 243 80% 2% 9% 2% 7%
Data presented in this report are based on data submitted by school districts to the data repository for the 2008-09 school year. Students are reported based on their date of entry in grade 9 and their last enrollment status as reported in the warehouse on July 31, 2009. The federal Family Education Rights and Privacy Act prohibits the release of personally identifiable student information. This Act precludes the publication of summary information based on fewer than five students or in which subtraction or other simple mathematical operations could be used to obtain personal information. Cells that contain the ("#") symbol have been suppressed to protect student privacy.
District-ell status Thursday, March 4, 2010 Page 96 of 301

Public School District Total Cohort Graduation Rate and Enrollment Outcome Summary - 2008-09 School Year by English Language Learner Status
2005 Total Cohort as of June of the 4th year of school and as of August 2009, 2004 Total Cohort as of June of the 5th year of school, 2003 Total Cohort as of June of the 6th year of school.
Graduated Transferred to Count with Regents GED
County of Cohort or Local Earned IEP Still Preparation DroppedDistrict Members Diplomas Diploma Enrolled Program Out
COUNTY: JEFFERSON Carthage Central School District
2004 Total Cohort - 5 Year Outcome All Students 224 78% 4% 5% 2% 11% ELL 1 # # # # # Not ELL 223 # # # # #
2003 Total Cohort - 6 Year Outcome All Students 229 83% 5% 1% 3% 7% ELL 0 0% 0% 0% 0% 0% Not ELL 229 83% 5% 1% 3% 7%
General Brown Central School District
2005 Total Cohort - Aug 2009 Year Outcome All Students 136 88% 1% 3% 2% 6% ELL 0 0% 0% 0% 0% 0% Not ELL 136 88% 1% 3% 2% 6%
2005 Total Cohort - 4 Year Outcome All Students 136 88% 1% 3% 2% 6% ELL 0 0% 0% 0% 0% 0% Not ELL 136 88% 1% 3% 2% 6%
2004 Total Cohort - 5 Year Outcome All Students 102 87% 2% 0% 2% 9% ELL 0 0% 0% 0% 0% 0% Not ELL 102 87% 2% 0% 2% 9%
2003 Total Cohort - 6 Year Outcome All Students 124 88% 3% 0% 2% 7% ELL 0 0% 0% 0% 0% 0% Not ELL 124 88% 3% 0% 2% 7%
Indian River Central School District
2005 Total Cohort - Aug 2009 Year Outcome All Students 219 86% 2% 4% 3% 5% ELL 0 0% 0% 0% 0% 0% Not ELL 219 86% 2% 4% 3% 5%
2005 Total Cohort - 4 Year Outcome All Students 219 83% 2% 7% 3% 5% ELL 0 0% 0% 0% 0% 0% Not ELL 219 83% 2% 7% 3% 5%
2004 Total Cohort - 5 Year Outcome All Students 182 87% 5% 1% 2% 5% ELL 0 0% 0% 0% 0% 0% Not ELL 182 87% 5% 1% 2% 5%
2003 Total Cohort - 6 Year Outcome All Students 207 88% 5% 0% 0% 6% ELL 2 # # # # # Not ELL 205 # # # # #
Data presented in this report are based on data submitted by school districts to the data repository for the 2008-09 school year. Students are reported based on their date of entry in grade 9 and their last enrollment status as reported in the warehouse on July 31, 2009. The federal Family Education Rights and Privacy Act prohibits the release of personally identifiable student information. This Act precludes the publication of summary information based on fewer than five students or in which subtraction or other simple mathematical operations could be used to obtain personal information. Cells that contain the ("#") symbol have been suppressed to protect student privacy.
District-ell status Thursday, March 4, 2010 Page 97 of 301
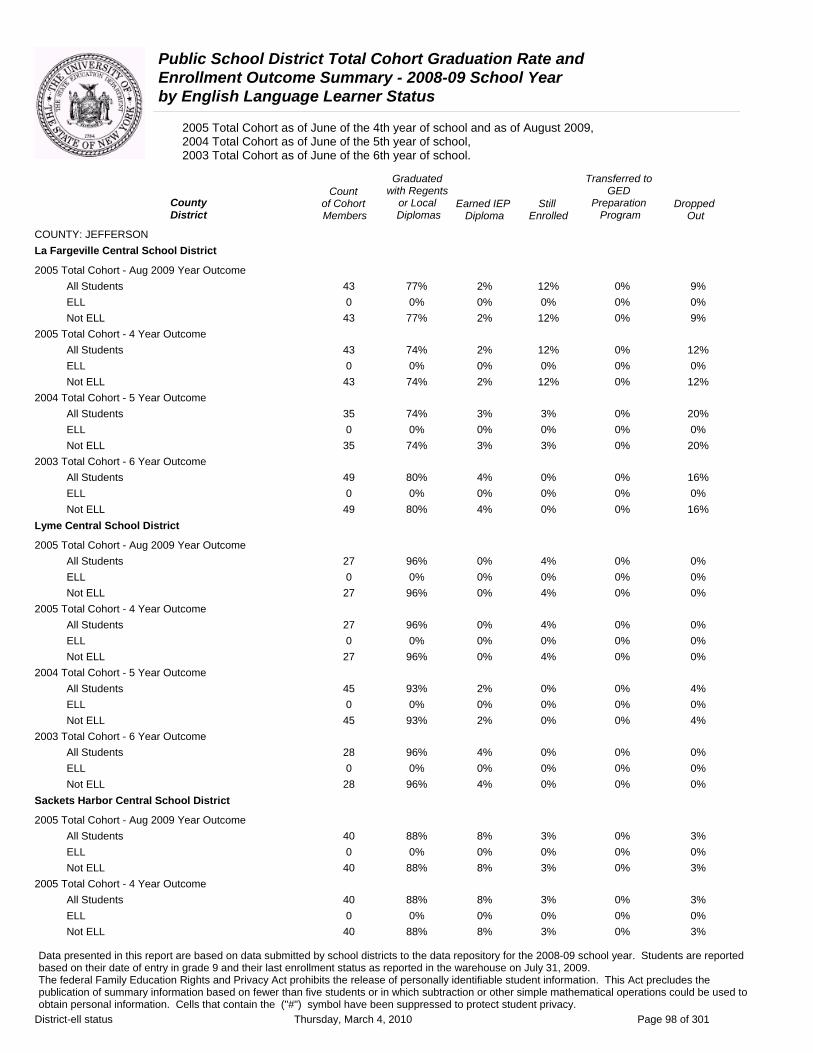
Public School District Total Cohort Graduation Rate and Enrollment Outcome Summary - 2008-09 School Year by English Language Learner Status
2005 Total Cohort as of June of the 4th year of school and as of August 2009, 2004 Total Cohort as of June of the 5th year of school, 2003 Total Cohort as of June of the 6th year of school.
Graduated Transferred to Count with Regents GED
County District
of Cohort Members
or Local Diplomas
Earned IEP Diploma
Still Enrolled
Preparation Program
Dropped Out
COUNTY: JEFFERSON La Fargeville Central School District
2005 Total Cohort - Aug 2009 Year Outcome All Students 43 77% 2% 12% 0% 9% ELL 0 0% 0% 0% 0% 0% Not ELL 43 77% 2% 12% 0% 9%
2005 Total Cohort - 4 Year Outcome All Students 43 74% 2% 12% 0% 12% ELL 0 0% 0% 0% 0% 0% Not ELL 43 74% 2% 12% 0% 12%
2004 Total Cohort - 5 Year Outcome All Students 35 74% 3% 3% 0% 20% ELL 0 0% 0% 0% 0% 0% Not ELL 35 74% 3% 3% 0% 20%
2003 Total Cohort - 6 Year Outcome All Students 49 80% 4% 0% 0% 16% ELL 0 0% 0% 0% 0% 0% Not ELL 49 80% 4% 0% 0% 16%
Lyme Central School District
2005 Total Cohort - Aug 2009 Year Outcome All Students 27 96% 0% 4% 0% 0% ELL 0 0% 0% 0% 0% 0% Not ELL 27 96% 0% 4% 0% 0%
2005 Total Cohort - 4 Year Outcome All Students 27 96% 0% 4% 0% 0% ELL 0 0% 0% 0% 0% 0% Not ELL 27 96% 0% 4% 0% 0%
2004 Total Cohort - 5 Year Outcome All Students 45 93% 2% 0% 0% 4% ELL 0 0% 0% 0% 0% 0% Not ELL 45 93% 2% 0% 0% 4%
2003 Total Cohort - 6 Year Outcome All Students 28 96% 4% 0% 0% 0% ELL 0 0% 0% 0% 0% 0% Not ELL 28 96% 4% 0% 0% 0%
Sackets Harbor Central School District
2005 Total Cohort - Aug 2009 Year Outcome All Students 40 88% 8% 3% 0% 3% ELL 0 0% 0% 0% 0% 0% Not ELL 40 88% 8% 3% 0% 3%
2005 Total Cohort - 4 Year Outcome All Students 40 88% 8% 3% 0% 3% ELL 0 0% 0% 0% 0% 0% Not ELL 40 88% 8% 3% 0% 3%
Data presented in this report are based on data submitted by school districts to the data repository for the 2008-09 school year. Students are reported based on their date of entry in grade 9 and their last enrollment status as reported in the warehouse on July 31, 2009. The federal Family Education Rights and Privacy Act prohibits the release of personally identifiable student information. This Act precludes the publication of summary information based on fewer than five students or in which subtraction or other simple mathematical operations could be used to obtain personal information. Cells that contain the ("#") symbol have been suppressed to protect student privacy.
District-ell status Thursday, March 4, 2010 Page 98 of 301

Public School District Total Cohort Graduation Rate and Enrollment Outcome Summary - 2008-09 School Year by English Language Learner Status
2005 Total Cohort as of June of the 4th year of school and as of August 2009, 2004 Total Cohort as of June of the 5th year of school, 2003 Total Cohort as of June of the 6th year of school.
Graduated Transferred to Count with Regents GED
County of Cohort or Local Earned IEP Still Preparation DroppedDistrict Members Diplomas Diploma Enrolled Program Out
COUNTY: JEFFERSON Sackets Harbor Central School District
2004 Total Cohort - 5 Year Outcome All Students 33 85% 3% 0% 3% 9% ELL 0 0% 0% 0% 0% 0% Not ELL 33 85% 3% 0% 3% 9%
2003 Total Cohort - 6 Year Outcome All Students 35 86% 6% 3% 0% 6% ELL 0 0% 0% 0% 0% 0% Not ELL 35 86% 6% 3% 0% 6%
South Jefferson Central School District
2005 Total Cohort - Aug 2009 Year Outcome All Students 161 83% 4% 2% 2% 9% ELL 0 0% 0% 0% 0% 0% Not ELL 161 83% 4% 2% 2% 9%
2005 Total Cohort - 4 Year Outcome All Students 161 82% 4% 3% 2% 9% ELL 0 0% 0% 0% 0% 0% Not ELL 161 82% 4% 3% 2% 9%
2004 Total Cohort - 5 Year Outcome All Students 153 76% 9% 3% 7% 6% ELL 0 0% 0% 0% 0% 0% Not ELL 153 76% 9% 3% 7% 6%
2003 Total Cohort - 6 Year Outcome All Students 169 76% 8% 0% 9% 7% ELL 0 0% 0% 0% 0% 0% Not ELL 169 76% 8% 0% 9% 7%
Thousand Islands Central School District
2005 Total Cohort - Aug 2009 Year Outcome All Students 100 89% 0% 4% 1% 6% ELL 0 0% 0% 0% 0% 0% Not ELL 100 89% 0% 4% 1% 6%
2005 Total Cohort - 4 Year Outcome All Students 100 89% 0% 4% 1% 6% ELL 0 0% 0% 0% 0% 0% Not ELL 100 89% 0% 4% 1% 6%
2004 Total Cohort - 5 Year Outcome All Students 102 86% 4% 0% 1% 9% ELL 0 0% 0% 0% 0% 0% Not ELL 102 86% 4% 0% 1% 9%
2003 Total Cohort - 6 Year Outcome All Students 94 90% 4% 0% 0% 5% ELL 0 0% 0% 0% 0% 0% Not ELL 94 90% 4% 0% 0% 5%
Data presented in this report are based on data submitted by school districts to the data repository for the 2008-09 school year. Students are reported based on their date of entry in grade 9 and their last enrollment status as reported in the warehouse on July 31, 2009. The federal Family Education Rights and Privacy Act prohibits the release of personally identifiable student information. This Act precludes the publication of summary information based on fewer than five students or in which subtraction or other simple mathematical operations could be used to obtain personal information. Cells that contain the ("#") symbol have been suppressed to protect student privacy.
District-ell status Thursday, March 4, 2010 Page 99 of 301
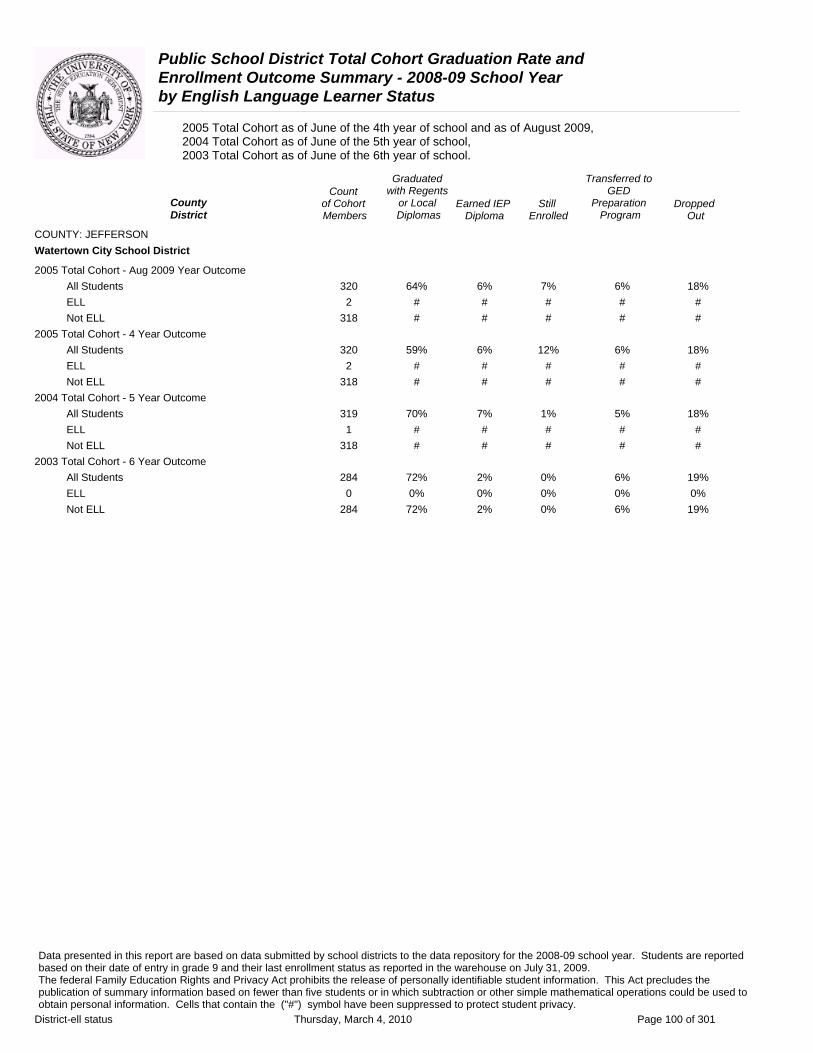
Public School District Total Cohort Graduation Rate and Enrollment Outcome Summary - 2008-09 School Year by English Language Learner Status
2005 Total Cohort as of June of the 4th year of school and as of August 2009, 2004 Total Cohort as of June of the 5th year of school, 2003 Total Cohort as of June of the 6th year of school.
Graduated Transferred to Count with Regents GED
County of Cohort or Local Earned IEP Still Preparation DroppedDistrict Members Diplomas Diploma Enrolled Program Out
COUNTY: JEFFERSON Watertown City School District
2005 Total Cohort - Aug 2009 Year Outcome All Students 320 64% 6% 7% 6% 18% ELL 2 # # # # # Not ELL 318 # # # # #
2005 Total Cohort - 4 Year Outcome All Students 320 59% 6% 12% 6% 18% ELL 2 # # # # # Not ELL 318 # # # # #
2004 Total Cohort - 5 Year Outcome All Students 319 70% 7% 1% 5% 18% ELL 1 # # # # # Not ELL 318 # # # # #
2003 Total Cohort - 6 Year Outcome All Students 284 72% 2% 0% 6% 19% ELL 0 0% 0% 0% 0% 0% Not ELL 284 72% 2% 0% 6% 19%
Data presented in this report are based on data submitted by school districts to the data repository for the 2008-09 school year. Students are reported based on their date of entry in grade 9 and their last enrollment status as reported in the warehouse on July 31, 2009. The federal Family Education Rights and Privacy Act prohibits the release of personally identifiable student information. This Act precludes the publication of summary information based on fewer than five students or in which subtraction or other simple mathematical operations could be used to obtain personal information. Cells that contain the ("#") symbol have been suppressed to protect student privacy.
District-ell status Thursday, March 4, 2010 Page 100 of 301

Public School District Total Cohort Graduation Rate and Enrollment Outcome Summary - 2008-09 School Year by English Language Learner Status
2005 Total Cohort as of June of the 4th year of school and as of August 2009, 2004 Total Cohort as of June of the 5th year of school, 2003 Total Cohort as of June of the 6th year of school.
Graduated Transferred to Count with Regents GED
County of Cohort or Local Earned IEP Still Preparation DroppedDistrict Members Diplomas Diploma Enrolled Program Out
COUNTY: LEWIS Beaver River Central School District
2005 Total Cohort - Aug 2009 Year Outcome All Students 73 90% 0% 0% 1% 8% ELL 0 0% 0% 0% 0% 0% Not ELL 73 90% 0% 0% 1% 8%
2005 Total Cohort - 4 Year Outcome All Students 73 89% 0% 1% 1% 8% ELL 0 0% 0% 0% 0% 0% Not ELL 73 89% 0% 1% 1% 8%
2004 Total Cohort - 5 Year Outcome All Students 83 89% 5% 0% 2% 4% ELL 0 0% 0% 0% 0% 0% Not ELL 83 89% 5% 0% 2% 4%
2003 Total Cohort - 6 Year Outcome All Students 82 88% 1% 0% 2% 9% ELL 0 0% 0% 0% 0% 0% Not ELL 82 88% 1% 0% 2% 9%
Copenhagen Central School District
2005 Total Cohort - Aug 2009 Year Outcome All Students 58 90% 3% 3% 0% 3% ELL 1 # # # # # Not ELL 57 # # # # #
2005 Total Cohort - 4 Year Outcome All Students 58 88% 3% 5% 0% 3% ELL 1 # # # # # Not ELL 57 # # # # #
2004 Total Cohort - 5 Year Outcome All Students 54 87% 6% 4% 2% 2% ELL 0 0% 0% 0% 0% 0% Not ELL 54 87% 6% 4% 2% 2%
2003 Total Cohort - 6 Year Outcome All Students 47 91% 2% 0% 2% 4% ELL 0 0% 0% 0% 0% 0% Not ELL 47 91% 2% 0% 2% 4%
Harrisville Central School District
2005 Total Cohort - Aug 2009 Year Outcome All Students 30 77% 3% 13% 0% 7% ELL 0 0% 0% 0% 0% 0% Not ELL 30 77% 3% 13% 0% 7%
2005 Total Cohort - 4 Year Outcome All Students 30 77% 3% 13% 0% 7% ELL 0 0% 0% 0% 0% 0% Not ELL 30 77% 3% 13% 0% 7%
Data presented in this report are based on data submitted by school districts to the data repository for the 2008-09 school year. Students are reported based on their date of entry in grade 9 and their last enrollment status as reported in the warehouse on July 31, 2009. The federal Family Education Rights and Privacy Act prohibits the release of personally identifiable student information. This Act precludes the publication of summary information based on fewer than five students or in which subtraction or other simple mathematical operations could be used to obtain personal information. Cells that contain the ("#") symbol have been suppressed to protect student privacy.
District-ell status Thursday, March 4, 2010 Page 101 of 301
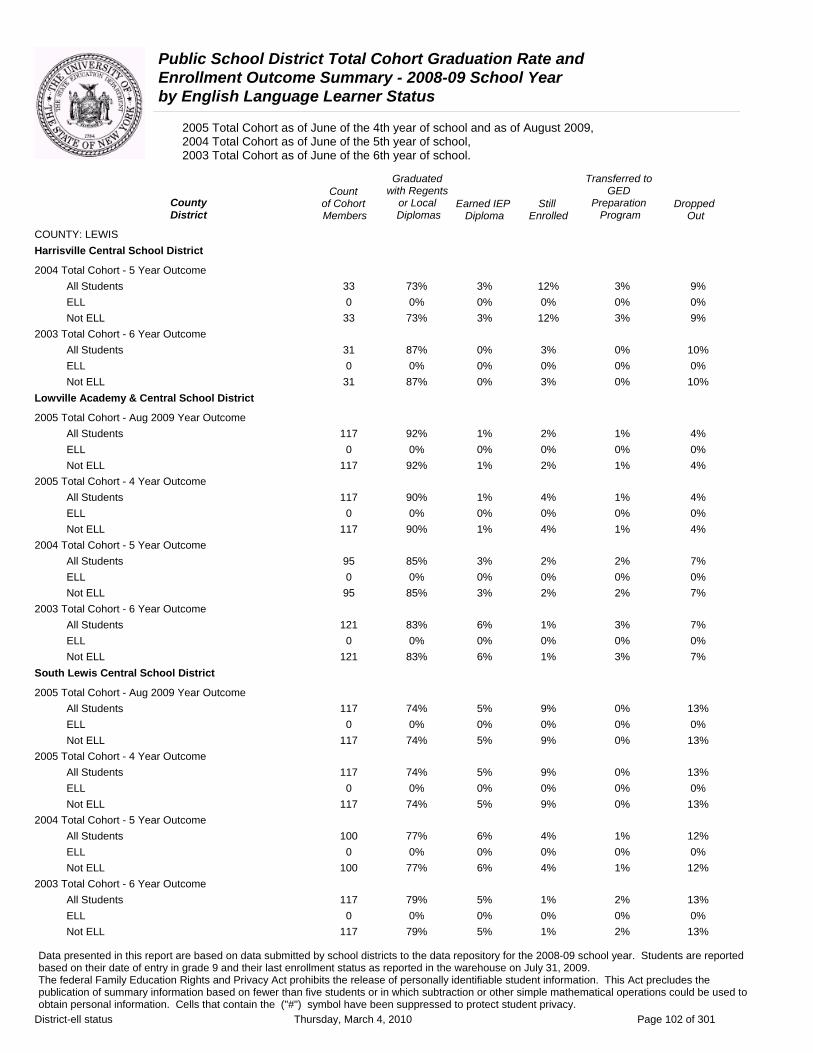
Public School District Total Cohort Graduation Rate and Enrollment Outcome Summary - 2008-09 School Year by English Language Learner Status
2005 Total Cohort as of June of the 4th year of school and as of August 2009, 2004 Total Cohort as of June of the 5th year of school, 2003 Total Cohort as of June of the 6th year of school.
Graduated Transferred to Count with Regents GED
County of Cohort or Local Earned IEP Still Preparation DroppedDistrict Members Diplomas Diploma Enrolled Program Out
COUNTY: LEWIS Harrisville Central School District
2004 Total Cohort - 5 Year Outcome All Students 33 73% 3% 12% 3% 9% ELL 0 0% 0% 0% 0% 0% Not ELL 33 73% 3% 12% 3% 9%
2003 Total Cohort - 6 Year Outcome All Students 31 87% 0% 3% 0% 10% ELL 0 0% 0% 0% 0% 0% Not ELL 31 87% 0% 3% 0% 10%
Lowville Academy & Central School District
2005 Total Cohort - Aug 2009 Year Outcome All Students 117 92% 1% 2% 1% 4% ELL 0 0% 0% 0% 0% 0% Not ELL 117 92% 1% 2% 1% 4%
2005 Total Cohort - 4 Year Outcome All Students 117 90% 1% 4% 1% 4% ELL 0 0% 0% 0% 0% 0% Not ELL 117 90% 1% 4% 1% 4%
2004 Total Cohort - 5 Year Outcome All Students 95 85% 3% 2% 2% 7% ELL 0 0% 0% 0% 0% 0% Not ELL 95 85% 3% 2% 2% 7%
2003 Total Cohort - 6 Year Outcome All Students 121 83% 6% 1% 3% 7% ELL 0 0% 0% 0% 0% 0% Not ELL 121 83% 6% 1% 3% 7%
South Lewis Central School District
2005 Total Cohort - Aug 2009 Year Outcome All Students 117 74% 5% 9% 0% 13% ELL 0 0% 0% 0% 0% 0% Not ELL 117 74% 5% 9% 0% 13%
2005 Total Cohort - 4 Year Outcome All Students 117 74% 5% 9% 0% 13% ELL 0 0% 0% 0% 0% 0% Not ELL 117 74% 5% 9% 0% 13%
2004 Total Cohort - 5 Year Outcome All Students 100 77% 6% 4% 1% 12% ELL 0 0% 0% 0% 0% 0% Not ELL 100 77% 6% 4% 1% 12%
2003 Total Cohort - 6 Year Outcome All Students 117 79% 5% 1% 2% 13% ELL 0 0% 0% 0% 0% 0% Not ELL 117 79% 5% 1% 2% 13%
Data presented in this report are based on data submitted by school districts to the data repository for the 2008-09 school year. Students are reported based on their date of entry in grade 9 and their last enrollment status as reported in the warehouse on July 31, 2009. The federal Family Education Rights and Privacy Act prohibits the release of personally identifiable student information. This Act precludes the publication of summary information based on fewer than five students or in which subtraction or other simple mathematical operations could be used to obtain personal information. Cells that contain the ("#") symbol have been suppressed to protect student privacy.
District-ell status Thursday, March 4, 2010 Page 102 of 301

Public School District Total Cohort Graduation Rate and Enrollment Outcome Summary - 2008-09 School Year by English Language Learner Status
2005 Total Cohort as of June of the 4th year of school and as of August 2009, 2004 Total Cohort as of June of the 5th year of school, 2003 Total Cohort as of June of the 6th year of school.
Graduated Transferred to Count with Regents GED
County District
of Cohort Members
or Local Diplomas
Earned IEP Diploma
Still Enrolled
Preparation Program
Dropped Out
COUNTY: LIVINGSTON Avon Central School District
2005 Total Cohort - Aug 2009 Year Outcome All Students 101 86% 1% 7% 1% 5% ELL 0 0% 0% 0% 0% 0% Not ELL 101 86% 1% 7% 1% 5%
2005 Total Cohort - 4 Year Outcome All Students 101 85% 1% 8% 1% 5% ELL 0 0% 0% 0% 0% 0% Not ELL 101 85% 1% 8% 1% 5%
2004 Total Cohort - 5 Year Outcome All Students 94 87% 1% 3% 0% 9% ELL 1 # # # # # Not ELL 93 # # # # #
2003 Total Cohort - 6 Year Outcome All Students 89 90% 1% 3% 3% 2% ELL 0 0% 0% 0% 0% 0% Not ELL 89 90% 1% 3% 3% 2%
Caledonia-Mumford Central School District
2005 Total Cohort - Aug 2009 Year Outcome All Students 95 86% 4% 3% 3% 3% ELL 0 0% 0% 0% 0% 0% Not ELL 95 86% 4% 3% 3% 3%
2005 Total Cohort - 4 Year Outcome All Students 95 86% 4% 3% 3% 3% ELL 0 0% 0% 0% 0% 0% Not ELL 95 86% 4% 3% 3% 3%
2004 Total Cohort - 5 Year Outcome All Students 108 90% 0% 4% 3% 4% ELL 0 0% 0% 0% 0% 0% Not ELL 108 90% 0% 4% 3% 4%
2003 Total Cohort - 6 Year Outcome All Students 87 97% 0% 0% 0% 3% ELL 0 0% 0% 0% 0% 0% Not ELL 87 97% 0% 0% 0% 3%
Dalton-Nunda Central School District (Keshequa)
2005 Total Cohort - Aug 2009 Year Outcome All Students 58 84% 5% 5% 0% 5% ELL 0 0% 0% 0% 0% 0% Not ELL 58 84% 5% 5% 0% 5%
2005 Total Cohort - 4 Year Outcome All Students 58 84% 5% 5% 0% 5% ELL 0 0% 0% 0% 0% 0% Not ELL 58 84% 5% 5% 0% 5%
Data presented in this report are based on data submitted by school districts to the data repository for the 2008-09 school year. Students are reported based on their date of entry in grade 9 and their last enrollment status as reported in the warehouse on July 31, 2009. The federal Family Education Rights and Privacy Act prohibits the release of personally identifiable student information. This Act precludes the publication of summary information based on fewer than five students or in which subtraction or other simple mathematical operations could be used to obtain personal information. Cells that contain the ("#") symbol have been suppressed to protect student privacy.
District-ell status Thursday, March 4, 2010 Page 103 of 301

Public School District Total Cohort Graduation Rate and Enrollment Outcome Summary - 2008-09 School Year by English Language Learner Status
2005 Total Cohort as of June of the 4th year of school and as of August 2009, 2004 Total Cohort as of June of the 5th year of school, 2003 Total Cohort as of June of the 6th year of school.
Graduated Transferred to Count with Regents GED
County of Cohort or Local Earned IEP Still Preparation DroppedDistrict Members Diplomas Diploma Enrolled Program Out
COUNTY: LIVINGSTON Dalton-Nunda Central School District (Keshequa)
2004 Total Cohort - 5 Year Outcome All Students 72 83% 6% 0% 3% 8% ELL 0 0% 0% 0% 0% 0% Not ELL 72 83% 6% 0% 3% 8%
2003 Total Cohort - 6 Year Outcome All Students 77 71% 10% 3% 0% 16% ELL 0 0% 0% 0% 0% 0% Not ELL 77 71% 10% 3% 0% 16%
Dansville Central School District
2005 Total Cohort - Aug 2009 Year Outcome All Students 125 76% 2% 14% 1% 8% ELL 0 0% 0% 0% 0% 0% Not ELL 125 76% 2% 14% 1% 8%
2005 Total Cohort - 4 Year Outcome All Students 125 74% 2% 15% 1% 8% ELL 0 0% 0% 0% 0% 0% Not ELL 125 74% 2% 15% 1% 8%
2004 Total Cohort - 5 Year Outcome All Students 156 83% 1% 10% 1% 4% ELL 0 0% 0% 0% 0% 0% Not ELL 156 83% 1% 10% 1% 4%
2003 Total Cohort - 6 Year Outcome All Students 121 83% 0% 7% 2% 8% ELL 0 0% 0% 0% 0% 0% Not ELL 121 83% 0% 7% 2% 8%
Geneseo Central School District
2005 Total Cohort - Aug 2009 Year Outcome All Students 74 88% 3% 8% 0% 1% ELL 3 # # # # # Not ELL 71 # # # # #
2005 Total Cohort - 4 Year Outcome All Students 74 86% 3% 9% 0% 1% ELL 3 # # # # # Not ELL 71 # # # # #
2004 Total Cohort - 5 Year Outcome All Students 89 94% 2% 0% 0% 3% ELL 1 # # # # # Not ELL 88 # # # # #
2003 Total Cohort - 6 Year Outcome All Students 82 88% 5% 0% 1% 6% ELL 0 0% 0% 0% 0% 0% Not ELL 82 88% 5% 0% 1% 6%
Data presented in this report are based on data submitted by school districts to the data repository for the 2008-09 school year. Students are reported based on their date of entry in grade 9 and their last enrollment status as reported in the warehouse on July 31, 2009. The federal Family Education Rights and Privacy Act prohibits the release of personally identifiable student information. This Act precludes the publication of summary information based on fewer than five students or in which subtraction or other simple mathematical operations could be used to obtain personal information. Cells that contain the ("#") symbol have been suppressed to protect student privacy.
District-ell status Thursday, March 4, 2010 Page 104 of 301

Public School District Total Cohort Graduation Rate and Enrollment Outcome Summary - 2008-09 School Year by English Language Learner Status
2005 Total Cohort as of June of the 4th year of school and as of August 2009, 2004 Total Cohort as of June of the 5th year of school, 2003 Total Cohort as of June of the 6th year of school.
County District
COUNTY: LIVINGSTON Livonia Central School District
2005 Total Cohort - Aug 2009 Year Outcome All Students ELL Not ELL
2005 Total Cohort - 4 Year Outcome All Students ELL Not ELL
2004 Total Cohort - 5 Year Outcome All Students ELL Not ELL
2003 Total Cohort - 6 Year Outcome All Students ELL Not ELL
Mount Morris Central School District
2005 Total Cohort - Aug 2009 Year Outcome All Students ELL Not ELL
2005 Total Cohort - 4 Year Outcome All Students ELL Not ELL
2004 Total Cohort - 5 Year Outcome All Students ELL Not ELL
2003 Total Cohort - 6 Year Outcome All Students ELL Not ELL
York Central School District
2005 Total Cohort - Aug 2009 Year Outcome All Students ELL Not ELL
2005 Total Cohort - 4 Year Outcome All Students ELL Not ELL
Count of Cohort Members
178 0
178
178 0
178
172 0
172
198 0
198
53 1 52
53 1 52
46 0 46
51 0 51
87 0 87
87 0 87
Graduated with Regents
or Local Diplomas
88%
0%
88%
87%
0%
87%
88%
0%
88%
89%
0%
89%
79%
#
#
75%
#
#
59%
0%
59%
71%
0%
71%
86%
0%
86%
86%
0%
86%
Earned IEP Diploma
1% 0% 1%
1% 0% 1%
0% 0% 0%
2% 0% 2%
0% # #
0% # #
13% 0%
13%
4% 0% 4%
1% 0% 1%
1% 0% 1%
Still Enrolled
5% 0% 5%
6% 0% 6%
2% 0% 2%
1% 0% 1%
8% # #
11% # #
4% 0% 4%
2% 0% 2%
10% 0%
10%
10% 0%
10%
Transferred to GED
Preparation Program
Dropped Out
0% 6% 0% 0% 0% 6%
0% 6% 0% 0% 0% 6%
2% 8% 0% 0% 2% 8%
1% 8% 0% 0% 1% 8%
0% 13% # # # #
0% 13% # # # #
2% 22% 0% 0% 2% 22%
0% 24% 0% 0% 0% 24%
0% 2% 0% 0% 0% 2%
0% 2% 0% 0% 0% 2%
Data presented in this report are based on data submitted by school districts to the data repository for the 2008-09 school year. Students are reported based on their date of entry in grade 9 and their last enrollment status as reported in the warehouse on July 31, 2009. The federal Family Education Rights and Privacy Act prohibits the release of personally identifiable student information. This Act precludes the publication of summary information based on fewer than five students or in which subtraction or other simple mathematical operations could be used to obtain personal information. Cells that contain the ("#") symbol have been suppressed to protect student privacy.
District-ell status Thursday, March 4, 2010 Page 105 of 301

Public School District Total Cohort Graduation Rate and Enrollment Outcome Summary - 2008-09 School Year by English Language Learner Status
2005 Total Cohort as of June of the 4th year of school and as of August 2009, 2004 Total Cohort as of June of the 5th year of school, 2003 Total Cohort as of June of the 6th year of school.
Graduated Transferred to Count with Regents GED
County of Cohort or Local Earned IEP Still Preparation DroppedDistrict Members Diplomas Diploma Enrolled Program Out
COUNTY: LIVINGSTON York Central School District
2004 Total Cohort - 5 Year Outcome All Students 83 87% 1% 6% 0% 6% ELL 0 0% 0% 0% 0% 0% Not ELL 83 87% 1% 6% 0% 6%
2003 Total Cohort - 6 Year Outcome All Students 80 90% 3% 1% 1% 5% ELL 0 0% 0% 0% 0% 0% Not ELL 80 90% 3% 1% 1% 5%
Data presented in this report are based on data submitted by school districts to the data repository for the 2008-09 school year. Students are reported based on their date of entry in grade 9 and their last enrollment status as reported in the warehouse on July 31, 2009. The federal Family Education Rights and Privacy Act prohibits the release of personally identifiable student information. This Act precludes the publication of summary information based on fewer than five students or in which subtraction or other simple mathematical operations could be used to obtain personal information. Cells that contain the ("#") symbol have been suppressed to protect student privacy.
District-ell status Thursday, March 4, 2010 Page 106 of 301

Public School District Total Cohort Graduation Rate and Enrollment Outcome Summary - 2008-09 School Year by English Language Learner Status
2005 Total Cohort as of June of the 4th year of school and as of August 2009, 2004 Total Cohort as of June of the 5th year of school, 2003 Total Cohort as of June of the 6th year of school.
Graduated Transferred to Count with Regents GED
County of Cohort or Local Earned IEP Still Preparation DroppedDistrict Members Diplomas Diploma Enrolled Program Out
COUNTY: MADISON Brookfield Central School District
2005 Total Cohort - Aug 2009 Year Outcome All Students 19 79% 5% 5% 0% 11% ELL 0 0% 0% 0% 0% 0% Not ELL 19 79% 5% 5% 0% 11%
2005 Total Cohort - 4 Year Outcome All Students 19 79% 5% 5% 0% 11% ELL 0 0% 0% 0% 0% 0% Not ELL 19 79% 5% 5% 0% 11%
2004 Total Cohort - 5 Year Outcome All Students 19 89% 5% 0% 0% 5% ELL 0 0% 0% 0% 0% 0% Not ELL 19 89% 5% 0% 0% 5%
2003 Total Cohort - 6 Year Outcome All Students 23 91% 4% 0% 0% 4% ELL 0 0% 0% 0% 0% 0% Not ELL 23 91% 4% 0% 0% 4%
Canastota Central School District
2005 Total Cohort - Aug 2009 Year Outcome All Students 137 81% 1% 4% 6% 8% ELL 0 0% 0% 0% 0% 0% Not ELL 137 81% 1% 4% 6% 8%
2005 Total Cohort - 4 Year Outcome All Students 137 79% 1% 6% 6% 8% ELL 0 0% 0% 0% 0% 0% Not ELL 137 79% 1% 6% 6% 8%
2004 Total Cohort - 5 Year Outcome All Students 133 77% 10% 1% 2% 10% ELL 0 0% 0% 0% 0% 0% Not ELL 133 77% 10% 1% 2% 10%
2003 Total Cohort - 6 Year Outcome All Students 132 76% 5% 1% 4% 14% ELL 0 0% 0% 0% 0% 0% Not ELL 132 76% 5% 1% 4% 14%
Cazenovia Central School District
2005 Total Cohort - Aug 2009 Year Outcome All Students 136 92% 2% 3% 0% 3% ELL 0 0% 0% 0% 0% 0% Not ELL 136 92% 2% 3% 0% 3%
2005 Total Cohort - 4 Year Outcome All Students 136 92% 2% 3% 0% 3% ELL 0 0% 0% 0% 0% 0% Not ELL 136 92% 2% 3% 0% 3%
Data presented in this report are based on data submitted by school districts to the data repository for the 2008-09 school year. Students are reported based on their date of entry in grade 9 and their last enrollment status as reported in the warehouse on July 31, 2009. The federal Family Education Rights and Privacy Act prohibits the release of personally identifiable student information. This Act precludes the publication of summary information based on fewer than five students or in which subtraction or other simple mathematical operations could be used to obtain personal information. Cells that contain the ("#") symbol have been suppressed to protect student privacy.
District-ell status Thursday, March 4, 2010 Page 107 of 301
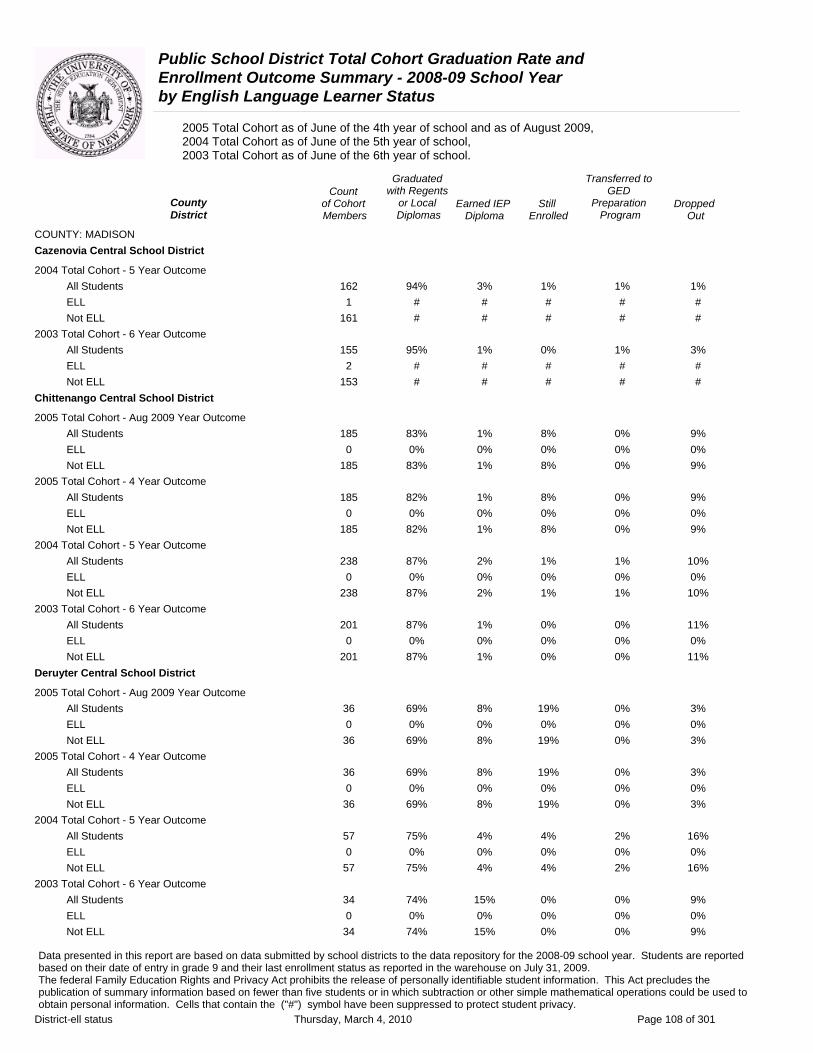
Public School District Total Cohort Graduation Rate and Enrollment Outcome Summary - 2008-09 School Year by English Language Learner Status
2005 Total Cohort as of June of the 4th year of school and as of August 2009, 2004 Total Cohort as of June of the 5th year of school, 2003 Total Cohort as of June of the 6th year of school.
Graduated Transferred to Count with Regents GED
County of Cohort or Local Earned IEP Still Preparation DroppedDistrict Members Diplomas Diploma Enrolled Program Out
COUNTY: MADISON Cazenovia Central School District
2004 Total Cohort - 5 Year Outcome All Students 162 94% 3% 1% 1% 1% ELL 1 # # # # # Not ELL 161 # # # # #
2003 Total Cohort - 6 Year Outcome All Students 155 95% 1% 0% 1% 3% ELL 2 # # # # # Not ELL 153 # # # # #
Chittenango Central School District
2005 Total Cohort - Aug 2009 Year Outcome All Students 185 83% 1% 8% 0% 9% ELL 0 0% 0% 0% 0% 0% Not ELL 185 83% 1% 8% 0% 9%
2005 Total Cohort - 4 Year Outcome All Students 185 82% 1% 8% 0% 9% ELL 0 0% 0% 0% 0% 0% Not ELL 185 82% 1% 8% 0% 9%
2004 Total Cohort - 5 Year Outcome All Students 238 87% 2% 1% 1% 10% ELL 0 0% 0% 0% 0% 0% Not ELL 238 87% 2% 1% 1% 10%
2003 Total Cohort - 6 Year Outcome All Students 201 87% 1% 0% 0% 11% ELL 0 0% 0% 0% 0% 0% Not ELL 201 87% 1% 0% 0% 11%
Deruyter Central School District
2005 Total Cohort - Aug 2009 Year Outcome All Students 36 69% 8% 19% 0% 3% ELL 0 0% 0% 0% 0% 0% Not ELL 36 69% 8% 19% 0% 3%
2005 Total Cohort - 4 Year Outcome All Students 36 69% 8% 19% 0% 3% ELL 0 0% 0% 0% 0% 0% Not ELL 36 69% 8% 19% 0% 3%
2004 Total Cohort - 5 Year Outcome All Students 57 75% 4% 4% 2% 16% ELL 0 0% 0% 0% 0% 0% Not ELL 57 75% 4% 4% 2% 16%
2003 Total Cohort - 6 Year Outcome All Students 34 74% 15% 0% 0% 9% ELL 0 0% 0% 0% 0% 0% Not ELL 34 74% 15% 0% 0% 9%
Data presented in this report are based on data submitted by school districts to the data repository for the 2008-09 school year. Students are reported based on their date of entry in grade 9 and their last enrollment status as reported in the warehouse on July 31, 2009. The federal Family Education Rights and Privacy Act prohibits the release of personally identifiable student information. This Act precludes the publication of summary information based on fewer than five students or in which subtraction or other simple mathematical operations could be used to obtain personal information. Cells that contain the ("#") symbol have been suppressed to protect student privacy.
District-ell status Thursday, March 4, 2010 Page 108 of 301
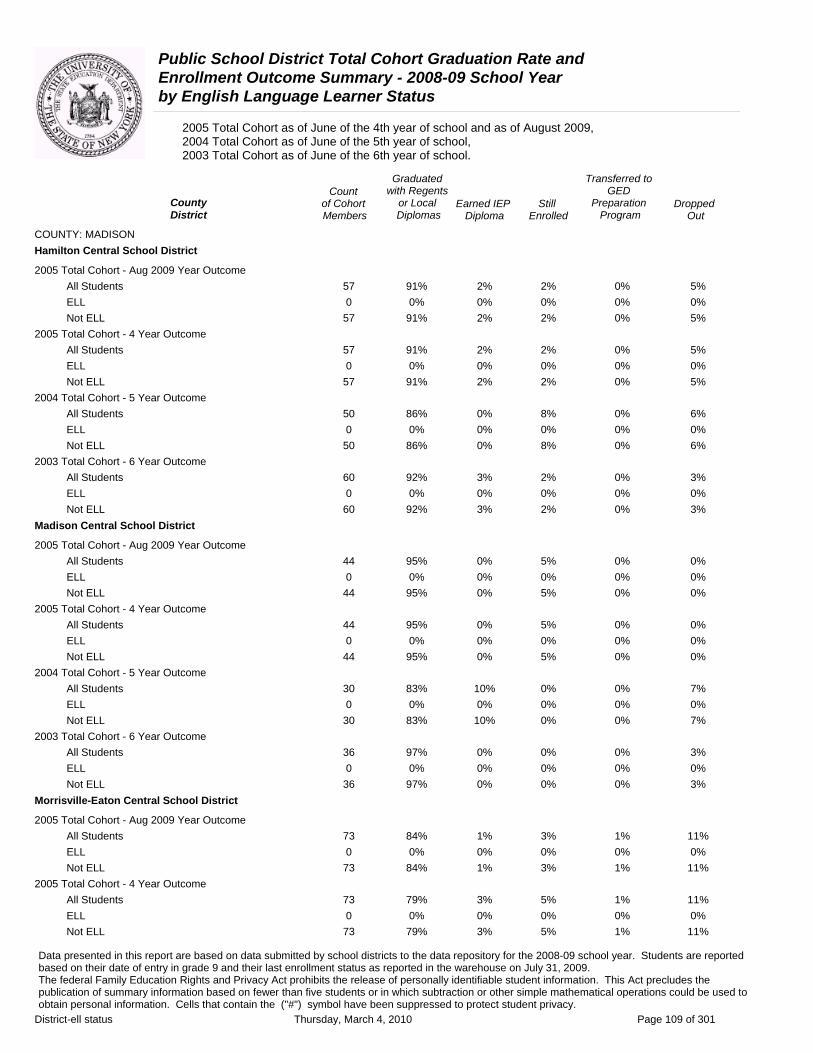
Public School District Total Cohort Graduation Rate and Enrollment Outcome Summary - 2008-09 School Year by English Language Learner Status
2005 Total Cohort as of June of the 4th year of school and as of August 2009, 2004 Total Cohort as of June of the 5th year of school, 2003 Total Cohort as of June of the 6th year of school.
Graduated Transferred to Count with Regents GED
County of Cohort or Local Earned IEP Still Preparation DroppedDistrict Members Diplomas Diploma Enrolled Program Out
COUNTY: MADISON Hamilton Central School District
2005 Total Cohort - Aug 2009 Year Outcome All Students 57 91% 2% 2% 0% 5% ELL 0 0% 0% 0% 0% 0% Not ELL 57 91% 2% 2% 0% 5%
2005 Total Cohort - 4 Year Outcome All Students 57 91% 2% 2% 0% 5% ELL 0 0% 0% 0% 0% 0% Not ELL 57 91% 2% 2% 0% 5%
2004 Total Cohort - 5 Year Outcome All Students 50 86% 0% 8% 0% 6% ELL 0 0% 0% 0% 0% 0% Not ELL 50 86% 0% 8% 0% 6%
2003 Total Cohort - 6 Year Outcome All Students 60 92% 3% 2% 0% 3% ELL 0 0% 0% 0% 0% 0% Not ELL 60 92% 3% 2% 0% 3%
Madison Central School District
2005 Total Cohort - Aug 2009 Year Outcome All Students 44 95% 0% 5% 0% 0% ELL 0 0% 0% 0% 0% 0% Not ELL 44 95% 0% 5% 0% 0%
2005 Total Cohort - 4 Year Outcome All Students 44 95% 0% 5% 0% 0% ELL 0 0% 0% 0% 0% 0% Not ELL 44 95% 0% 5% 0% 0%
2004 Total Cohort - 5 Year Outcome All Students 30 83% 10% 0% 0% 7% ELL 0 0% 0% 0% 0% 0% Not ELL 30 83% 10% 0% 0% 7%
2003 Total Cohort - 6 Year Outcome All Students 36 97% 0% 0% 0% 3% ELL 0 0% 0% 0% 0% 0% Not ELL 36 97% 0% 0% 0% 3%
Morrisville-Eaton Central School District
2005 Total Cohort - Aug 2009 Year Outcome All Students 73 84% 1% 3% 1% 11% ELL 0 0% 0% 0% 0% 0% Not ELL 73 84% 1% 3% 1% 11%
2005 Total Cohort - 4 Year Outcome All Students 73 79% 3% 5% 1% 11% ELL 0 0% 0% 0% 0% 0% Not ELL 73 79% 3% 5% 1% 11%
Data presented in this report are based on data submitted by school districts to the data repository for the 2008-09 school year. Students are reported based on their date of entry in grade 9 and their last enrollment status as reported in the warehouse on July 31, 2009. The federal Family Education Rights and Privacy Act prohibits the release of personally identifiable student information. This Act precludes the publication of summary information based on fewer than five students or in which subtraction or other simple mathematical operations could be used to obtain personal information. Cells that contain the ("#") symbol have been suppressed to protect student privacy.
District-ell status Thursday, March 4, 2010 Page 109 of 301
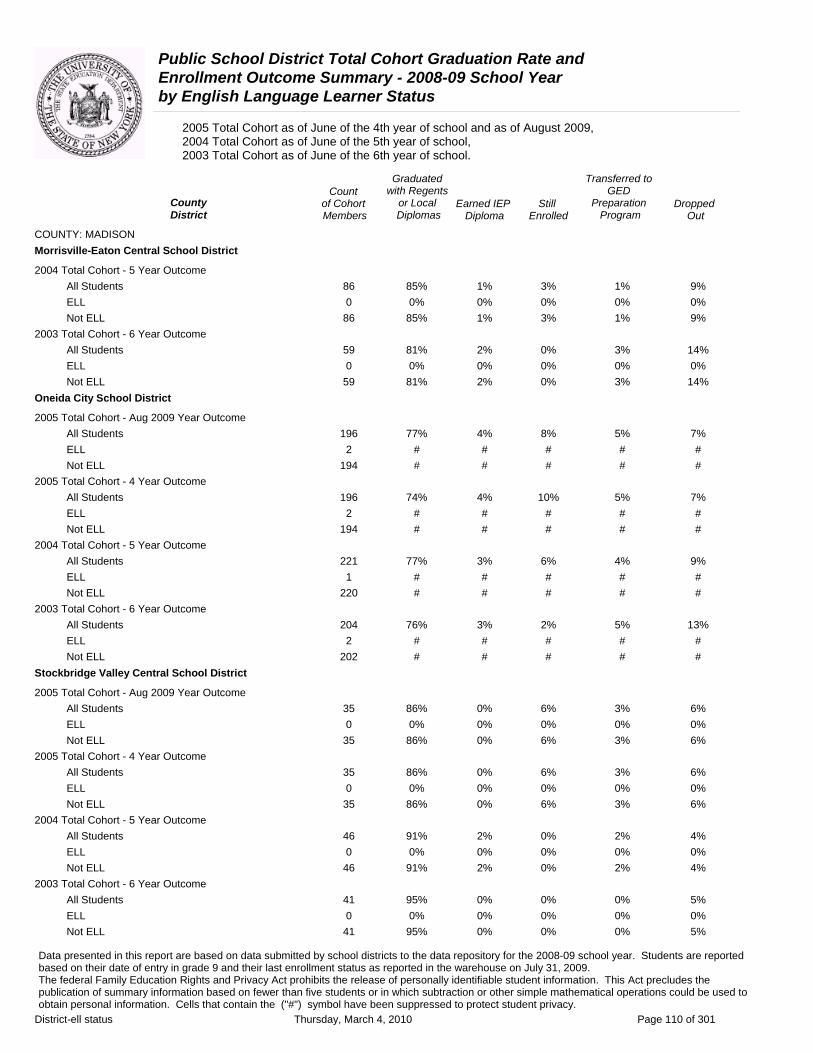
Public School District Total Cohort Graduation Rate and Enrollment Outcome Summary - 2008-09 School Year by English Language Learner Status
2005 Total Cohort as of June of the 4th year of school and as of August 2009, 2004 Total Cohort as of June of the 5th year of school, 2003 Total Cohort as of June of the 6th year of school.
Graduated Transferred to Count with Regents GED
County District
of Cohort Members
or Local Diplomas
Earned IEP Diploma
Still Enrolled
Preparation Program
Dropped Out
COUNTY: MADISON Morrisville-Eaton Central School District
2004 Total Cohort - 5 Year Outcome All Students 86 85% 1% 3% 1% 9% ELL 0 0% 0% 0% 0% 0% Not ELL 86 85% 1% 3% 1% 9%
2003 Total Cohort - 6 Year Outcome All Students 59 81% 2% 0% 3% 14% ELL 0 0% 0% 0% 0% 0% Not ELL 59 81% 2% 0% 3% 14%
Oneida City School District
2005 Total Cohort - Aug 2009 Year Outcome All Students 196 77% 4% 8% 5% 7% ELL 2 # # # # # Not ELL 194 # # # # #
2005 Total Cohort - 4 Year Outcome All Students 196 74% 4% 10% 5% 7% ELL 2 # # # # # Not ELL 194 # # # # #
2004 Total Cohort - 5 Year Outcome All Students 221 77% 3% 6% 4% 9% ELL 1 # # # # # Not ELL 220 # # # # #
2003 Total Cohort - 6 Year Outcome All Students 204 76% 3% 2% 5% 13% ELL 2 # # # # # Not ELL 202 # # # # #
Stockbridge Valley Central School District
2005 Total Cohort - Aug 2009 Year Outcome All Students 35 86% 0% 6% 3% 6% ELL 0 0% 0% 0% 0% 0% Not ELL 35 86% 0% 6% 3% 6%
2005 Total Cohort - 4 Year Outcome All Students 35 86% 0% 6% 3% 6% ELL 0 0% 0% 0% 0% 0% Not ELL 35 86% 0% 6% 3% 6%
2004 Total Cohort - 5 Year Outcome All Students 46 91% 2% 0% 2% 4% ELL 0 0% 0% 0% 0% 0% Not ELL 46 91% 2% 0% 2% 4%
2003 Total Cohort - 6 Year Outcome All Students 41 95% 0% 0% 0% 5% ELL 0 0% 0% 0% 0% 0% Not ELL 41 95% 0% 0% 0% 5%
Data presented in this report are based on data submitted by school districts to the data repository for the 2008-09 school year. Students are reported based on their date of entry in grade 9 and their last enrollment status as reported in the warehouse on July 31, 2009. The federal Family Education Rights and Privacy Act prohibits the release of personally identifiable student information. This Act precludes the publication of summary information based on fewer than five students or in which subtraction or other simple mathematical operations could be used to obtain personal information. Cells that contain the ("#") symbol have been suppressed to protect student privacy.
District-ell status Thursday, March 4, 2010 Page 110 of 301

Public School District Total Cohort Graduation Rate and Enrollment Outcome Summary - 2008-09 School Year by English Language Learner Status
2005 Total Cohort as of June of the 4th year of school and as of August 2009, 2004 Total Cohort as of June of the 5th year of school, 2003 Total Cohort as of June of the 6th year of school.
Graduated Transferred to Count with Regents GED
County of Cohort or Local Earned IEP Still Preparation DroppedDistrict Members Diplomas Diploma Enrolled Program Out
COUNTY: MONROE Brighton Central School District
2005 Total Cohort - Aug 2009 Year Outcome All Students 359 91% 0% 6% 1% 1% ELL 4 # # # # # Not ELL 355 # # # # #
2005 Total Cohort - 4 Year Outcome All Students 359 85% 0% 13% 1% 1% ELL 4 # # # # # Not ELL 355 # # # # #
2004 Total Cohort - 5 Year Outcome All Students 288 94% 0% 1% 2% 2% ELL 5 80% 0% 0% 0% 20% Not ELL 283 95% 0% 1% 2% 1%
2003 Total Cohort - 6 Year Outcome All Students 353 95% 1% 1% 1% 2% ELL 5 80% 0% 20% 0% 0% Not ELL 348 95% 1% 1% 1% 2%
Brockport Central School District
2005 Total Cohort - Aug 2009 Year Outcome All Students 390 86% 1% 7% 2% 3% ELL 0 0% 0% 0% 0% 0% Not ELL 390 86% 1% 7% 2% 3%
2005 Total Cohort - 4 Year Outcome All Students 390 82% 1% 11% 2% 3% ELL 0 0% 0% 0% 0% 0% Not ELL 390 82% 1% 11% 2% 3%
2004 Total Cohort - 5 Year Outcome All Students 407 87% 2% 2% 4% 5% ELL 1 # # # # # Not ELL 406 # # # # #
2003 Total Cohort - 6 Year Outcome All Students 390 85% 3% 2% 6% 4% ELL 1 # # # # # Not ELL 389 # # # # #
Churchville-Chili Central School District
2005 Total Cohort - Aug 2009 Year Outcome All Students 377 90% 1% 5% 2% 2% ELL 1 # # # # # Not ELL 376 # # # # #
2005 Total Cohort - 4 Year Outcome All Students 377 88% 1% 6% 2% 2% ELL 1 # # # # # Not ELL 376 # # # # #
Data presented in this report are based on data submitted by school districts to the data repository for the 2008-09 school year. Students are reported based on their date of entry in grade 9 and their last enrollment status as reported in the warehouse on July 31, 2009. The federal Family Education Rights and Privacy Act prohibits the release of personally identifiable student information. This Act precludes the publication of summary information based on fewer than five students or in which subtraction or other simple mathematical operations could be used to obtain personal information. Cells that contain the ("#") symbol have been suppressed to protect student privacy.
District-ell status Thursday, March 4, 2010 Page 111 of 301

Public School District Total Cohort Graduation Rate and Enrollment Outcome Summary - 2008-09 School Year by English Language Learner Status
2005 Total Cohort as of June of the 4th year of school and as of August 2009, 2004 Total Cohort as of June of the 5th year of school, 2003 Total Cohort as of June of the 6th year of school.
Graduated Transferred to Count with Regents GED
County of Cohort or Local Earned IEP Still Preparation DroppedDistrict Members Diplomas Diploma Enrolled Program Out
COUNTY: MONROE Churchville-Chili Central School District
2004 Total Cohort - 5 Year Outcome All Students 382 94% 0% 2% 1% 3% ELL 0 0% 0% 0% 0% 0% Not ELL 382 94% 0% 2% 1% 3%
2003 Total Cohort - 6 Year Outcome All Students 404 91% 2% 0% 0% 6% ELL 0 0% 0% 0% 0% 0% Not ELL 404 91% 2% 0% 0% 6%
East Irondequoit Central School District
2005 Total Cohort - Aug 2009 Year Outcome All Students 298 85% 2% 6% 2% 5% ELL 3 # # # # # Not ELL 295 # # # # #
2005 Total Cohort - 4 Year Outcome All Students 298 82% 3% 8% 2% 5% ELL 3 # # # # # Not ELL 295 # # # # #
2004 Total Cohort - 5 Year Outcome All Students 290 88% 1% 4% 1% 5% ELL 2 # # # # # Not ELL 288 # # # # #
2003 Total Cohort - 6 Year Outcome All Students 244 84% 4% 2% 2% 8% ELL 1 # # # # # Not ELL 243 # # # # #
East Rochester Union Free School District
2005 Total Cohort - Aug 2009 Year Outcome All Students 116 71% 3% 9% 5% 11% ELL 1 # # # # # Not ELL 115 # # # # #
2005 Total Cohort - 4 Year Outcome All Students 116 71% 3% 9% 5% 11% ELL 1 # # # # # Not ELL 115 # # # # #
2004 Total Cohort - 5 Year Outcome All Students 115 81% 2% 1% 4% 12% ELL 0 0% 0% 0% 0% 0% Not ELL 115 81% 2% 1% 4% 12%
2003 Total Cohort - 6 Year Outcome All Students 88 80% 2% 1% 1% 16% ELL 0 0% 0% 0% 0% 0% Not ELL 88 80% 2% 1% 1% 16%
Data presented in this report are based on data submitted by school districts to the data repository for the 2008-09 school year. Students are reported based on their date of entry in grade 9 and their last enrollment status as reported in the warehouse on July 31, 2009. The federal Family Education Rights and Privacy Act prohibits the release of personally identifiable student information. This Act precludes the publication of summary information based on fewer than five students or in which subtraction or other simple mathematical operations could be used to obtain personal information. Cells that contain the ("#") symbol have been suppressed to protect student privacy.
District-ell status Thursday, March 4, 2010 Page 112 of 301

Public School District Total Cohort Graduation Rate and Enrollment Outcome Summary - 2008-09 School Year by English Language Learner Status
2005 Total Cohort as of June of the 4th year of school and as of August 2009, 2004 Total Cohort as of June of the 5th year of school, 2003 Total Cohort as of June of the 6th year of school.
Graduated Transferred to Count with Regents GED
County of Cohort or Local Earned IEP Still Preparation DroppedDistrict Members Diplomas Diploma Enrolled Program Out
COUNTY: MONROE Fairport Central School District
2005 Total Cohort - Aug 2009 Year Outcome All Students 636 94% 1% 3% 0% 1% ELL 7 57% 0% 43% 0% 0% Not ELL 629 95% 1% 2% 0% 1%
2005 Total Cohort - 4 Year Outcome All Students 636 93% 1% 4% 0% 1% ELL 7 57% 0% 43% 0% 0% Not ELL 629 93% 1% 4% 0% 1%
2004 Total Cohort - 5 Year Outcome All Students 619 95% 1% 2% 1% 1% ELL 5 80% 0% 20% 0% 0% Not ELL 614 95% 1% 2% 1% 1%
2003 Total Cohort - 6 Year Outcome All Students 572 95% 2% 1% 0% 2% ELL 2 # # # # # Not ELL 570 # # # # #
Gates-Chili Central School District
2005 Total Cohort - Aug 2009 Year Outcome All Students 480 83% 2% 6% 3% 6% ELL 4 # # # # # Not ELL 476 # # # # #
2005 Total Cohort - 4 Year Outcome All Students 480 82% 2% 7% 3% 6% ELL 4 # # # # # Not ELL 476 # # # # #
2004 Total Cohort - 5 Year Outcome All Students 455 90% 1% 1% 1% 7% ELL 1 # # # # # Not ELL 454 # # # # #
2003 Total Cohort - 6 Year Outcome All Students 451 85% 2% 2% 3% 8% ELL 2 # # # # # Not ELL 449 # # # # #
Greece Central School District
2005 Total Cohort - Aug 2009 Year Outcome All Students 1095 79% 1% 10% 2% 8% ELL 16 44% 6% 38% 0% 13% Not ELL 1079 79% 1% 10% 2% 8%
2005 Total Cohort - 4 Year Outcome All Students 1095 76% 1% 13% 2% 8% ELL 16 38% 6% 44% 0% 13% Not ELL 1079 77% 1% 12% 2% 8%
Data presented in this report are based on data submitted by school districts to the data repository for the 2008-09 school year. Students are reported based on their date of entry in grade 9 and their last enrollment status as reported in the warehouse on July 31, 2009. The federal Family Education Rights and Privacy Act prohibits the release of personally identifiable student information. This Act precludes the publication of summary information based on fewer than five students or in which subtraction or other simple mathematical operations could be used to obtain personal information. Cells that contain the ("#") symbol have been suppressed to protect student privacy.
District-ell status Thursday, March 4, 2010 Page 113 of 301

Public School District Total Cohort Graduation Rate and Enrollment Outcome Summary - 2008-09 School Year by English Language Learner Status
2005 Total Cohort as of June of the 4th year of school and as of August 2009, 2004 Total Cohort as of June of the 5th year of school, 2003 Total Cohort as of June of the 6th year of school.
Graduated Transferred to Count with Regents GED
County District
of Cohort Members
or Local Diplomas
Earned IEP Diploma
Still Enrolled
Preparation Program
Dropped Out
COUNTY: MONROE Greece Central School District
2004 Total Cohort - 5 Year Outcome All Students 1334 83% 1% 5% 2% 8% ELL 15 67% 7% 20% 0% 7% Not ELL 1319 84% 1% 5% 2% 8%
2003 Total Cohort - 6 Year Outcome All Students 1171 84% 0% 4% 3% 9% ELL 17 47% 6% 24% 0% 24% Not ELL 1154 84% 0% 4% 3% 9%
Hilton Central School District
2005 Total Cohort - Aug 2009 Year Outcome All Students 397 89% 0% 6% 2% 4% ELL 2 # # # # # Not ELL 395 # # # # #
2005 Total Cohort - 4 Year Outcome All Students 397 87% 0% 8% 2% 4% ELL 2 # # # # # Not ELL 395 # # # # #
2004 Total Cohort - 5 Year Outcome All Students 346 93% 1% 0% 3% 3% ELL 0 0% 0% 0% 0% 0% Not ELL 346 93% 1% 0% 3% 3%
2003 Total Cohort - 6 Year Outcome All Students 383 90% 2% 0% 4% 4% ELL 1 # # # # # Not ELL 382 # # # # #
Honeoye Falls-Lima Central School District
2005 Total Cohort - Aug 2009 Year Outcome All Students 213 91% 1% 6% 1% 1% ELL 0 0% 0% 0% 0% 0% Not ELL 213 91% 1% 6% 1% 1%
2005 Total Cohort - 4 Year Outcome All Students 213 91% 1% 6% 1% 1% ELL 0 0% 0% 0% 0% 0% Not ELL 213 91% 1% 6% 1% 1%
2004 Total Cohort - 5 Year Outcome All Students 224 96% 0% 3% 1% 0% ELL 0 0% 0% 0% 0% 0% Not ELL 224 96% 0% 3% 1% 0%
2003 Total Cohort - 6 Year Outcome All Students 232 94% 0% 4% 0% 1% ELL 0 0% 0% 0% 0% 0% Not ELL 232 94% 0% 4% 0% 1%
Data presented in this report are based on data submitted by school districts to the data repository for the 2008-09 school year. Students are reported based on their date of entry in grade 9 and their last enrollment status as reported in the warehouse on July 31, 2009. The federal Family Education Rights and Privacy Act prohibits the release of personally identifiable student information. This Act precludes the publication of summary information based on fewer than five students or in which subtraction or other simple mathematical operations could be used to obtain personal information. Cells that contain the ("#") symbol have been suppressed to protect student privacy.
District-ell status Thursday, March 4, 2010 Page 114 of 301
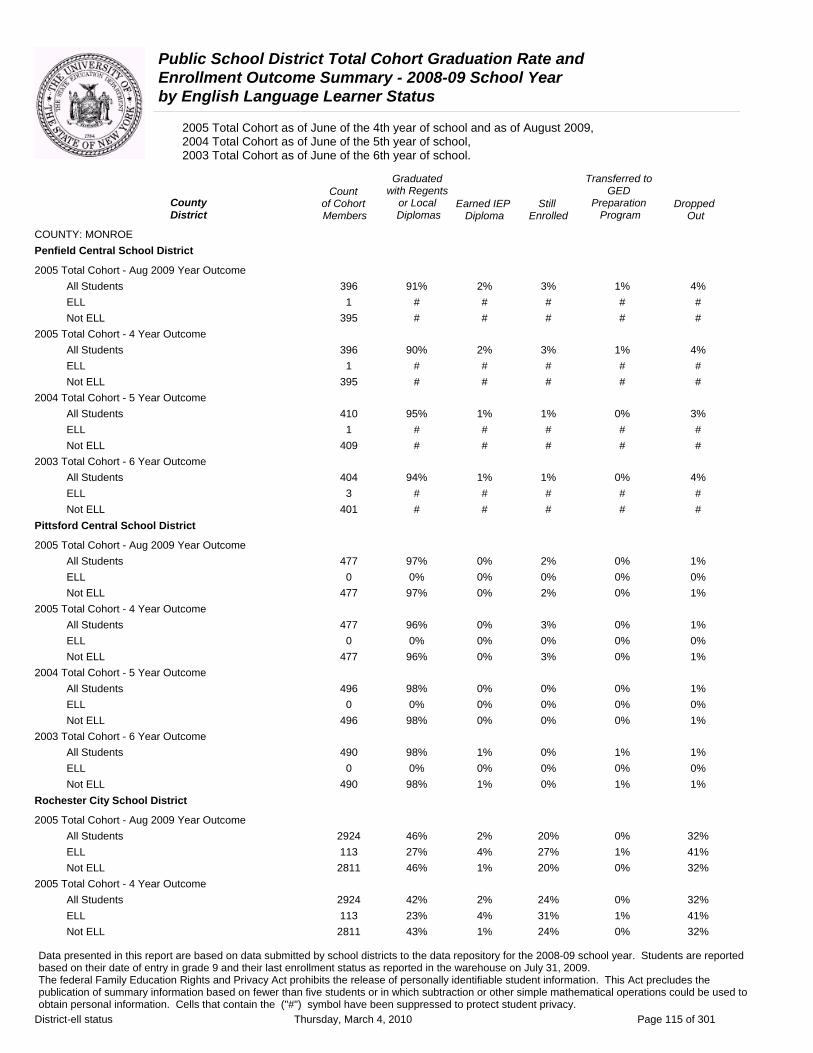
Public School District Total Cohort Graduation Rate and Enrollment Outcome Summary - 2008-09 School Year by English Language Learner Status
2005 Total Cohort as of June of the 4th year of school and as of August 2009, 2004 Total Cohort as of June of the 5th year of school, 2003 Total Cohort as of June of the 6th year of school.
Graduated Transferred to Count with Regents GED
County of Cohort or Local Earned IEP Still Preparation DroppedDistrict Members Diplomas Diploma Enrolled Program Out
COUNTY: MONROE Penfield Central School District
2005 Total Cohort - Aug 2009 Year Outcome All Students 396 91% 2% 3% 1% 4% ELL 1 # # # # # Not ELL 395 # # # # #
2005 Total Cohort - 4 Year Outcome All Students 396 90% 2% 3% 1% 4% ELL 1 # # # # # Not ELL 395 # # # # #
2004 Total Cohort - 5 Year Outcome All Students 410 95% 1% 1% 0% 3% ELL 1 # # # # # Not ELL 409 # # # # #
2003 Total Cohort - 6 Year Outcome All Students 404 94% 1% 1% 0% 4% ELL 3 # # # # # Not ELL 401 # # # # #
Pittsford Central School District
2005 Total Cohort - Aug 2009 Year Outcome All Students 477 97% 0% 2% 0% 1% ELL 0 0% 0% 0% 0% 0% Not ELL 477 97% 0% 2% 0% 1%
2005 Total Cohort - 4 Year Outcome All Students 477 96% 0% 3% 0% 1% ELL 0 0% 0% 0% 0% 0% Not ELL 477 96% 0% 3% 0% 1%
2004 Total Cohort - 5 Year Outcome All Students 496 98% 0% 0% 0% 1% ELL 0 0% 0% 0% 0% 0% Not ELL 496 98% 0% 0% 0% 1%
2003 Total Cohort - 6 Year Outcome All Students 490 98% 1% 0% 1% 1% ELL 0 0% 0% 0% 0% 0% Not ELL 490 98% 1% 0% 1% 1%
Rochester City School District
2005 Total Cohort - Aug 2009 Year Outcome All Students 2924 46% 2% 20% 0% 32% ELL 113 27% 4% 27% 1% 41% Not ELL 2811 46% 1% 20% 0% 32%
2005 Total Cohort - 4 Year Outcome All Students 2924 42% 2% 24% 0% 32% ELL 113 23% 4% 31% 1% 41% Not ELL 2811 43% 1% 24% 0% 32%
Data presented in this report are based on data submitted by school districts to the data repository for the 2008-09 school year. Students are reported based on their date of entry in grade 9 and their last enrollment status as reported in the warehouse on July 31, 2009. The federal Family Education Rights and Privacy Act prohibits the release of personally identifiable student information. This Act precludes the publication of summary information based on fewer than five students or in which subtraction or other simple mathematical operations could be used to obtain personal information. Cells that contain the ("#") symbol have been suppressed to protect student privacy.
District-ell status Thursday, March 4, 2010 Page 115 of 301
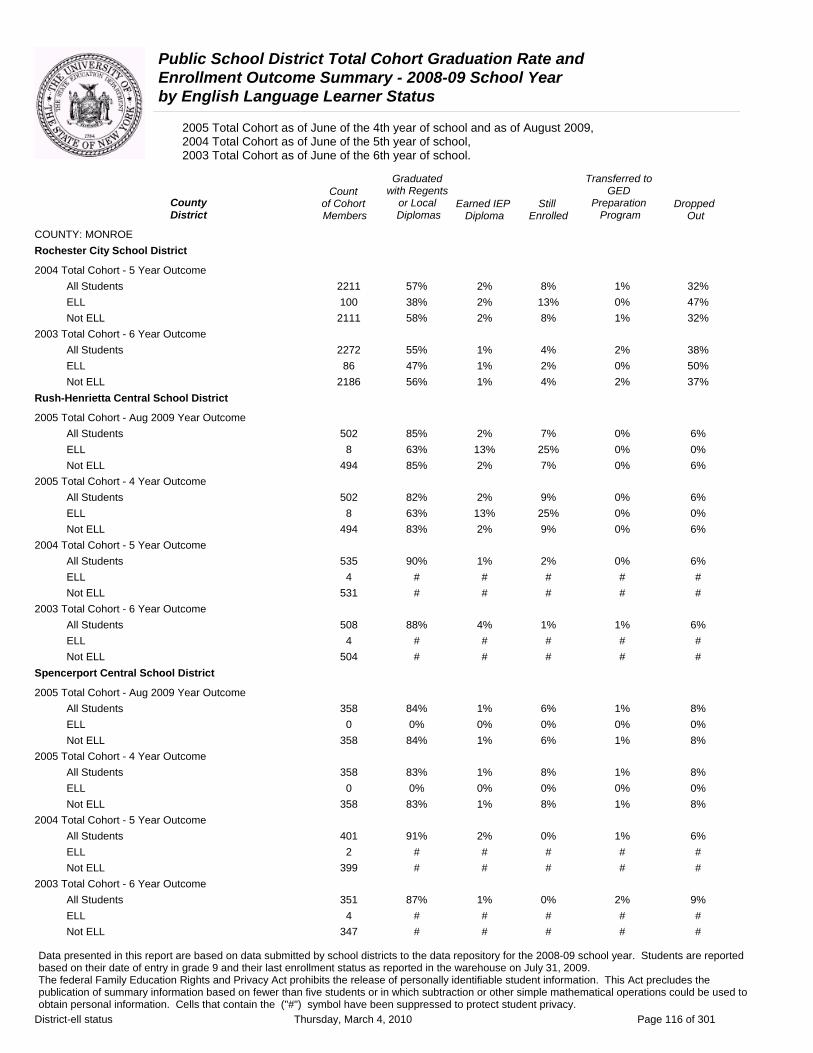
Public School District Total Cohort Graduation Rate and Enrollment Outcome Summary - 2008-09 School Year by English Language Learner Status
2005 Total Cohort as of June of the 4th year of school and as of August 2009, 2004 Total Cohort as of June of the 5th year of school, 2003 Total Cohort as of June of the 6th year of school.
Graduated Transferred to Count with Regents GED
County of Cohort or Local Earned IEP Still Preparation DroppedDistrict Members Diplomas Diploma Enrolled Program Out
COUNTY: MONROE Rochester City School District
2004 Total Cohort - 5 Year Outcome All Students 2211 57% 2% 8% 1% 32% ELL 100 38% 2% 13% 0% 47% Not ELL 2111 58% 2% 8% 1% 32%
2003 Total Cohort - 6 Year Outcome All Students 2272 55% 1% 4% 2% 38% ELL 86 47% 1% 2% 0% 50% Not ELL 2186 56% 1% 4% 2% 37%
Rush-Henrietta Central School District
2005 Total Cohort - Aug 2009 Year Outcome All Students 502 85% 2% 7% 0% 6% ELL 8 63% 13% 25% 0% 0% Not ELL 494 85% 2% 7% 0% 6%
2005 Total Cohort - 4 Year Outcome All Students 502 82% 2% 9% 0% 6% ELL 8 63% 13% 25% 0% 0% Not ELL 494 83% 2% 9% 0% 6%
2004 Total Cohort - 5 Year Outcome All Students 535 90% 1% 2% 0% 6% ELL 4 # # # # # Not ELL 531 # # # # #
2003 Total Cohort - 6 Year Outcome All Students 508 88% 4% 1% 1% 6% ELL 4 # # # # # Not ELL 504 # # # # #
Spencerport Central School District
2005 Total Cohort - Aug 2009 Year Outcome All Students 358 84% 1% 6% 1% 8% ELL 0 0% 0% 0% 0% 0% Not ELL 358 84% 1% 6% 1% 8%
2005 Total Cohort - 4 Year Outcome All Students 358 83% 1% 8% 1% 8% ELL 0 0% 0% 0% 0% 0% Not ELL 358 83% 1% 8% 1% 8%
2004 Total Cohort - 5 Year Outcome All Students 401 91% 2% 0% 1% 6% ELL 2 # # # # # Not ELL 399 # # # # #
2003 Total Cohort - 6 Year Outcome All Students 351 87% 1% 0% 2% 9% ELL 4 # # # # # Not ELL 347 # # # # #
Data presented in this report are based on data submitted by school districts to the data repository for the 2008-09 school year. Students are reported based on their date of entry in grade 9 and their last enrollment status as reported in the warehouse on July 31, 2009. The federal Family Education Rights and Privacy Act prohibits the release of personally identifiable student information. This Act precludes the publication of summary information based on fewer than five students or in which subtraction or other simple mathematical operations could be used to obtain personal information. Cells that contain the ("#") symbol have been suppressed to protect student privacy.
District-ell status Thursday, March 4, 2010 Page 116 of 301
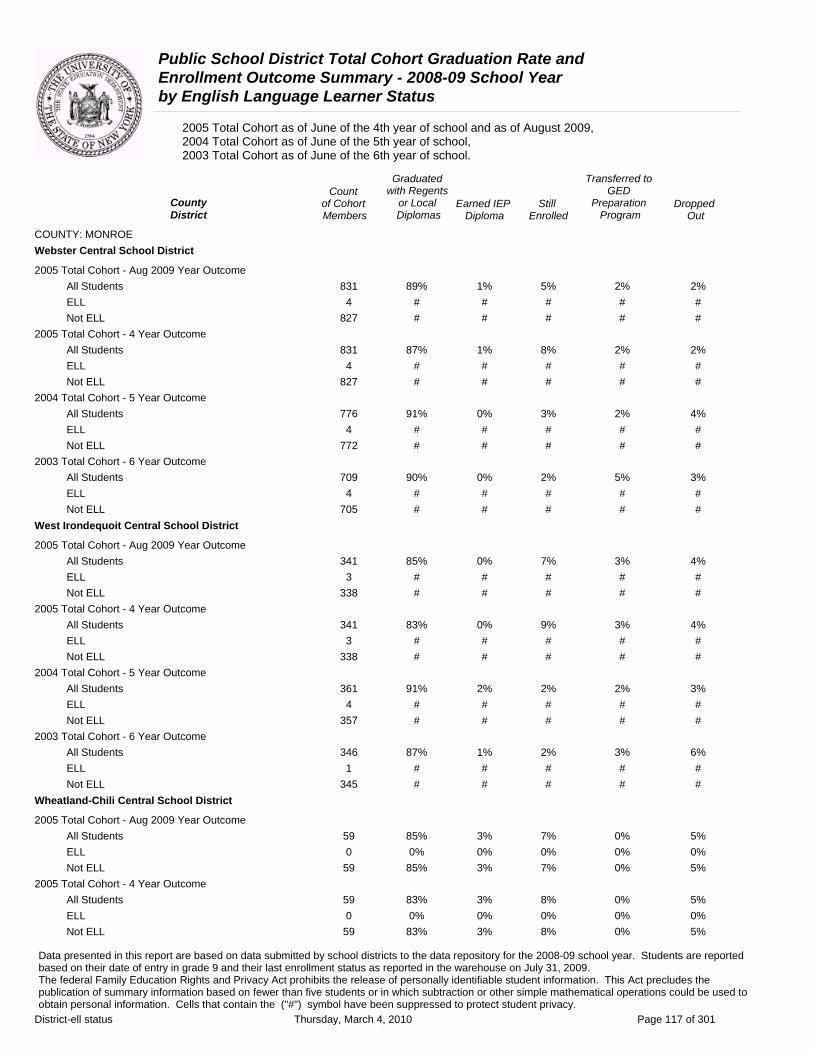
Public School District Total Cohort Graduation Rate and Enrollment Outcome Summary - 2008-09 School Year by English Language Learner Status
2005 Total Cohort as of June of the 4th year of school and as of August 2009, 2004 Total Cohort as of June of the 5th year of school, 2003 Total Cohort as of June of the 6th year of school.
Graduated Transferred to Count with Regents GED
County of Cohort or Local Earned IEP Still Preparation DroppedDistrict Members Diplomas Diploma Enrolled Program Out
COUNTY: MONROE Webster Central School District
2005 Total Cohort - Aug 2009 Year Outcome All Students 831 89% 1% 5% 2% 2% ELL 4 # # # # # Not ELL 827 # # # # #
2005 Total Cohort - 4 Year Outcome All Students 831 87% 1% 8% 2% 2% ELL 4 # # # # # Not ELL 827 # # # # #
2004 Total Cohort - 5 Year Outcome All Students 776 91% 0% 3% 2% 4% ELL 4 # # # # # Not ELL 772 # # # # #
2003 Total Cohort - 6 Year Outcome All Students 709 90% 0% 2% 5% 3% ELL 4 # # # # # Not ELL 705 # # # # #
West Irondequoit Central School District
2005 Total Cohort - Aug 2009 Year Outcome All Students 341 85% 0% 7% 3% 4% ELL 3 # # # # # Not ELL 338 # # # # #
2005 Total Cohort - 4 Year Outcome All Students 341 83% 0% 9% 3% 4% ELL 3 # # # # # Not ELL 338 # # # # #
2004 Total Cohort - 5 Year Outcome All Students 361 91% 2% 2% 2% 3% ELL 4 # # # # # Not ELL 357 # # # # #
2003 Total Cohort - 6 Year Outcome All Students 346 87% 1% 2% 3% 6% ELL 1 # # # # # Not ELL 345 # # # # #
Wheatland-Chili Central School District
2005 Total Cohort - Aug 2009 Year Outcome All Students 59 85% 3% 7% 0% 5% ELL 0 0% 0% 0% 0% 0% Not ELL 59 85% 3% 7% 0% 5%
2005 Total Cohort - 4 Year Outcome All Students 59 83% 3% 8% 0% 5% ELL 0 0% 0% 0% 0% 0% Not ELL 59 83% 3% 8% 0% 5%
Data presented in this report are based on data submitted by school districts to the data repository for the 2008-09 school year. Students are reported based on their date of entry in grade 9 and their last enrollment status as reported in the warehouse on July 31, 2009. The federal Family Education Rights and Privacy Act prohibits the release of personally identifiable student information. This Act precludes the publication of summary information based on fewer than five students or in which subtraction or other simple mathematical operations could be used to obtain personal information. Cells that contain the ("#") symbol have been suppressed to protect student privacy.
District-ell status Thursday, March 4, 2010 Page 117 of 301

Public School District Total Cohort Graduation Rate and Enrollment Outcome Summary - 2008-09 School Year by English Language Learner Status
2005 Total Cohort as of June of the 4th year of school and as of August 2009, 2004 Total Cohort as of June of the 5th year of school, 2003 Total Cohort as of June of the 6th year of school.
Graduated Transferred to Count with Regents GED
County of Cohort or Local Earned IEP Still Preparation DroppedDistrict Members Diplomas Diploma Enrolled Program Out
COUNTY: MONROE Wheatland-Chili Central School District
2004 Total Cohort - 5 Year Outcome All Students 71 89% 6% 1% 0% 4% ELL 0 0% 0% 0% 0% 0% Not ELL 71 89% 6% 1% 0% 4%
2003 Total Cohort - 6 Year Outcome All Students 79 90% 3% 0% 1% 4% ELL 7 71% 0% 0% 0% 0% Not ELL 72 92% 3% 0% 1% 4%
Data presented in this report are based on data submitted by school districts to the data repository for the 2008-09 school year. Students are reported based on their date of entry in grade 9 and their last enrollment status as reported in the warehouse on July 31, 2009. The federal Family Education Rights and Privacy Act prohibits the release of personally identifiable student information. This Act precludes the publication of summary information based on fewer than five students or in which subtraction or other simple mathematical operations could be used to obtain personal information. Cells that contain the ("#") symbol have been suppressed to protect student privacy.
District-ell status Thursday, March 4, 2010 Page 118 of 301
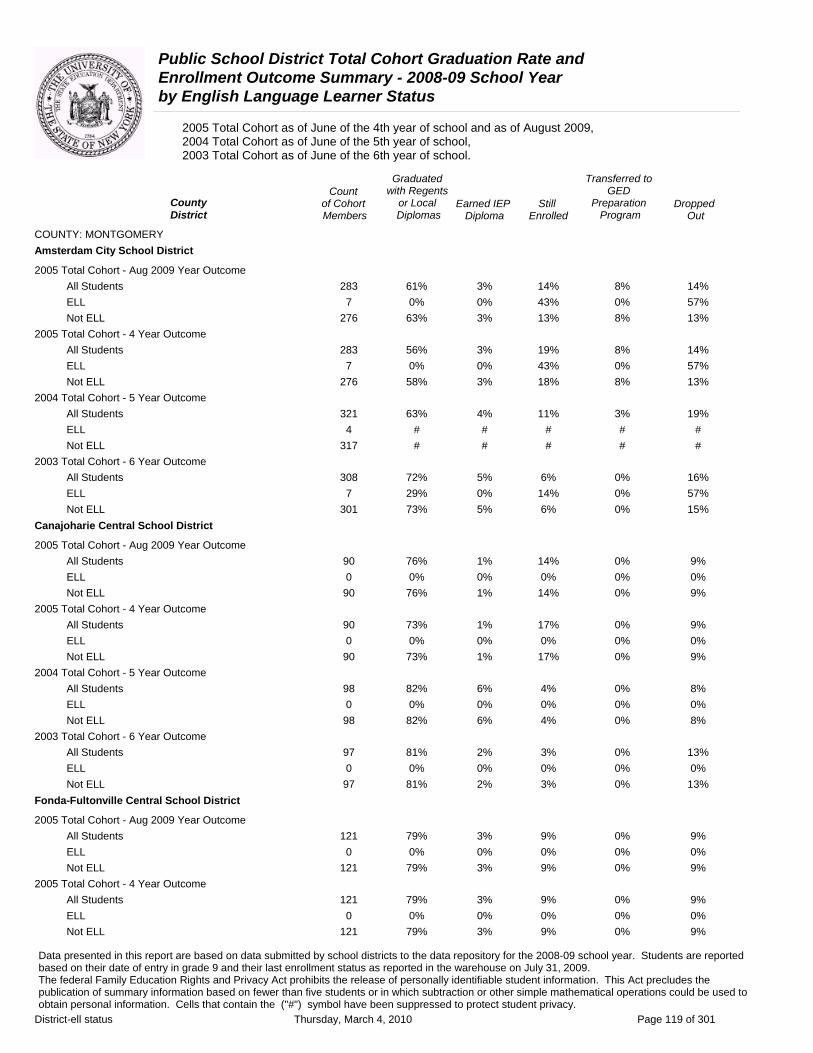
Public School District Total Cohort Graduation Rate and Enrollment Outcome Summary - 2008-09 School Year by English Language Learner Status
2005 Total Cohort as of June of the 4th year of school and as of August 2009, 2004 Total Cohort as of June of the 5th year of school, 2003 Total Cohort as of June of the 6th year of school.
Graduated Transferred to Count with Regents GED
County of Cohort or Local Earned IEP Still Preparation DroppedDistrict Members Diplomas Diploma Enrolled Program Out
COUNTY: MONTGOMERY Amsterdam City School District
2005 Total Cohort - Aug 2009 Year Outcome All Students 283 61% 3% 14% 8% 14% ELL 7 0% 0% 43% 0% 57% Not ELL 276 63% 3% 13% 8% 13%
2005 Total Cohort - 4 Year Outcome All Students 283 56% 3% 19% 8% 14% ELL 7 0% 0% 43% 0% 57% Not ELL 276 58% 3% 18% 8% 13%
2004 Total Cohort - 5 Year Outcome All Students 321 63% 4% 11% 3% 19% ELL 4 # # # # # Not ELL 317 # # # # #
2003 Total Cohort - 6 Year Outcome All Students 308 72% 5% 6% 0% 16% ELL 7 29% 0% 14% 0% 57% Not ELL 301 73% 5% 6% 0% 15%
Canajoharie Central School District
2005 Total Cohort - Aug 2009 Year Outcome All Students 90 76% 1% 14% 0% 9% ELL 0 0% 0% 0% 0% 0% Not ELL 90 76% 1% 14% 0% 9%
2005 Total Cohort - 4 Year Outcome All Students 90 73% 1% 17% 0% 9% ELL 0 0% 0% 0% 0% 0% Not ELL 90 73% 1% 17% 0% 9%
2004 Total Cohort - 5 Year Outcome All Students 98 82% 6% 4% 0% 8% ELL 0 0% 0% 0% 0% 0% Not ELL 98 82% 6% 4% 0% 8%
2003 Total Cohort - 6 Year Outcome All Students 97 81% 2% 3% 0% 13% ELL 0 0% 0% 0% 0% 0% Not ELL 97 81% 2% 3% 0% 13%
Fonda-Fultonville Central School District
2005 Total Cohort - Aug 2009 Year Outcome All Students 121 79% 3% 9% 0% 9% ELL 0 0% 0% 0% 0% 0% Not ELL 121 79% 3% 9% 0% 9%
2005 Total Cohort - 4 Year Outcome All Students 121 79% 3% 9% 0% 9% ELL 0 0% 0% 0% 0% 0% Not ELL 121 79% 3% 9% 0% 9%
Data presented in this report are based on data submitted by school districts to the data repository for the 2008-09 school year. Students are reported based on their date of entry in grade 9 and their last enrollment status as reported in the warehouse on July 31, 2009. The federal Family Education Rights and Privacy Act prohibits the release of personally identifiable student information. This Act precludes the publication of summary information based on fewer than five students or in which subtraction or other simple mathematical operations could be used to obtain personal information. Cells that contain the ("#") symbol have been suppressed to protect student privacy.
District-ell status Thursday, March 4, 2010 Page 119 of 301
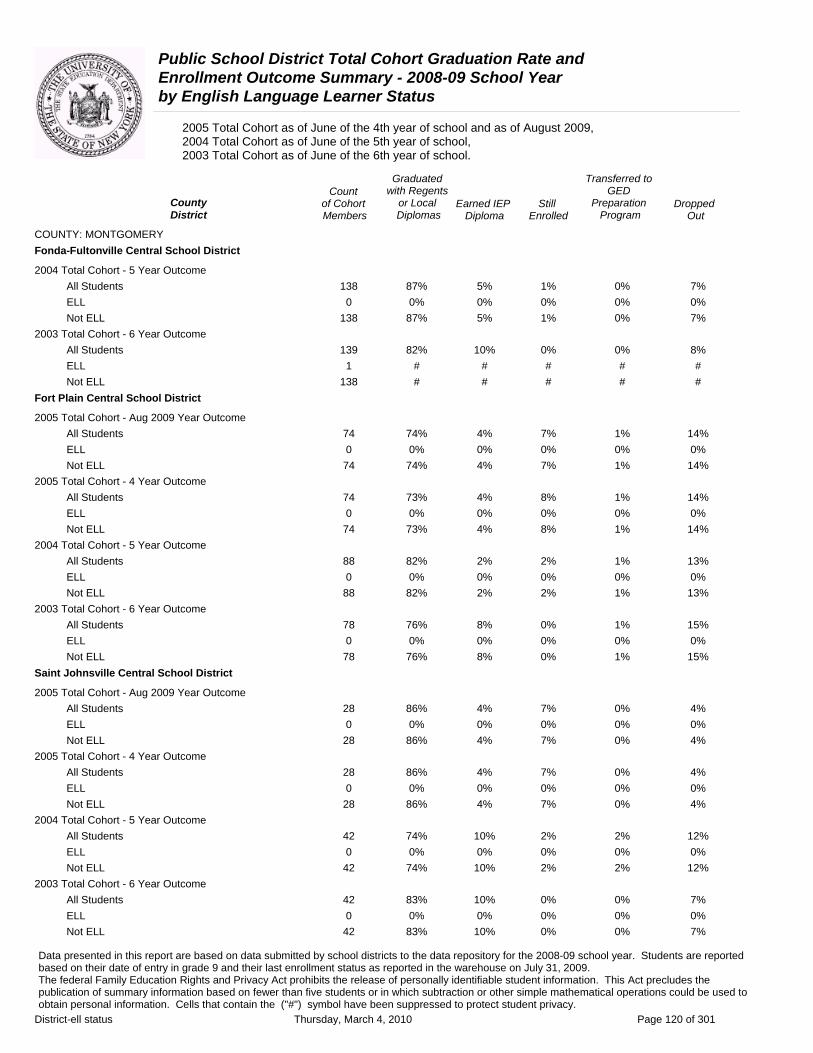
Public School District Total Cohort Graduation Rate and Enrollment Outcome Summary - 2008-09 School Year by English Language Learner Status
2005 Total Cohort as of June of the 4th year of school and as of August 2009, 2004 Total Cohort as of June of the 5th year of school, 2003 Total Cohort as of June of the 6th year of school.
Graduated Transferred to Count with Regents GED
County of Cohort or Local Earned IEP Still Preparation DroppedDistrict Members Diplomas Diploma Enrolled Program Out
COUNTY: MONTGOMERY Fonda-Fultonville Central School District
2004 Total Cohort - 5 Year Outcome All Students 138 87% 5% 1% 0% 7% ELL 0 0% 0% 0% 0% 0% Not ELL 138 87% 5% 1% 0% 7%
2003 Total Cohort - 6 Year Outcome All Students 139 82% 10% 0% 0% 8% ELL 1 # # # # # Not ELL 138 # # # # #
Fort Plain Central School District
2005 Total Cohort - Aug 2009 Year Outcome All Students 74 74% 4% 7% 1% 14% ELL 0 0% 0% 0% 0% 0% Not ELL 74 74% 4% 7% 1% 14%
2005 Total Cohort - 4 Year Outcome All Students 74 73% 4% 8% 1% 14% ELL 0 0% 0% 0% 0% 0% Not ELL 74 73% 4% 8% 1% 14%
2004 Total Cohort - 5 Year Outcome All Students 88 82% 2% 2% 1% 13% ELL 0 0% 0% 0% 0% 0% Not ELL 88 82% 2% 2% 1% 13%
2003 Total Cohort - 6 Year Outcome All Students 78 76% 8% 0% 1% 15% ELL 0 0% 0% 0% 0% 0% Not ELL 78 76% 8% 0% 1% 15%
Saint Johnsville Central School District
2005 Total Cohort - Aug 2009 Year Outcome All Students 28 86% 4% 7% 0% 4% ELL 0 0% 0% 0% 0% 0% Not ELL 28 86% 4% 7% 0% 4%
2005 Total Cohort - 4 Year Outcome All Students 28 86% 4% 7% 0% 4% ELL 0 0% 0% 0% 0% 0% Not ELL 28 86% 4% 7% 0% 4%
2004 Total Cohort - 5 Year Outcome All Students 42 74% 10% 2% 2% 12% ELL 0 0% 0% 0% 0% 0% Not ELL 42 74% 10% 2% 2% 12%
2003 Total Cohort - 6 Year Outcome All Students 42 83% 10% 0% 0% 7% ELL 0 0% 0% 0% 0% 0% Not ELL 42 83% 10% 0% 0% 7%
Data presented in this report are based on data submitted by school districts to the data repository for the 2008-09 school year. Students are reported based on their date of entry in grade 9 and their last enrollment status as reported in the warehouse on July 31, 2009. The federal Family Education Rights and Privacy Act prohibits the release of personally identifiable student information. This Act precludes the publication of summary information based on fewer than five students or in which subtraction or other simple mathematical operations could be used to obtain personal information. Cells that contain the ("#") symbol have been suppressed to protect student privacy.
District-ell status Thursday, March 4, 2010 Page 120 of 301
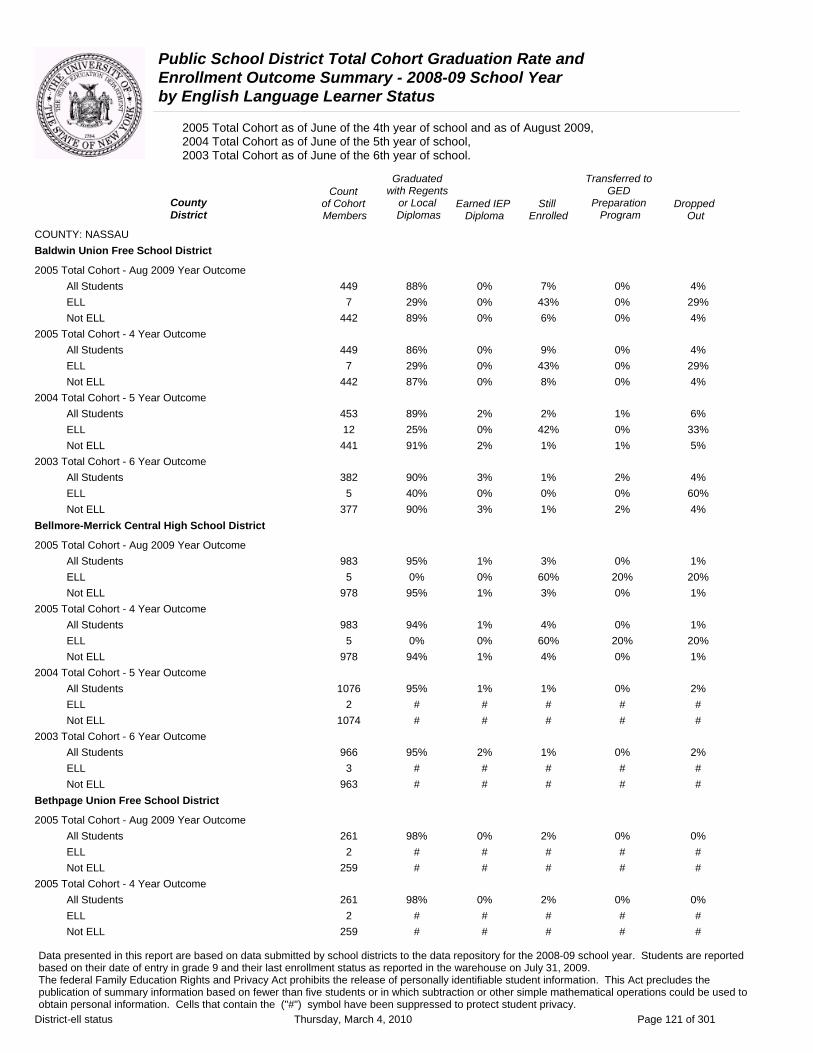
Public School District Total Cohort Graduation Rate and Enrollment Outcome Summary - 2008-09 School Year by English Language Learner Status
2005 Total Cohort as of June of the 4th year of school and as of August 2009, 2004 Total Cohort as of June of the 5th year of school, 2003 Total Cohort as of June of the 6th year of school.
Graduated Transferred to Count with Regents GED
County of Cohort or Local Earned IEP Still Preparation DroppedDistrict Members Diplomas Diploma Enrolled Program Out
COUNTY: NASSAU Baldwin Union Free School District
2005 Total Cohort - Aug 2009 Year Outcome All Students 449 88% 0% 7% 0% 4% ELL 7 29% 0% 43% 0% 29% Not ELL 442 89% 0% 6% 0% 4%
2005 Total Cohort - 4 Year Outcome All Students 449 86% 0% 9% 0% 4% ELL 7 29% 0% 43% 0% 29% Not ELL 442 87% 0% 8% 0% 4%
2004 Total Cohort - 5 Year Outcome All Students 453 89% 2% 2% 1% 6% ELL 12 25% 0% 42% 0% 33% Not ELL 441 91% 2% 1% 1% 5%
2003 Total Cohort - 6 Year Outcome All Students 382 90% 3% 1% 2% 4% ELL 5 40% 0% 0% 0% 60% Not ELL 377 90% 3% 1% 2% 4%
Bellmore-Merrick Central High School District
2005 Total Cohort - Aug 2009 Year Outcome All Students 983 95% 1% 3% 0% 1% ELL 5 0% 0% 60% 20% 20% Not ELL 978 95% 1% 3% 0% 1%
2005 Total Cohort - 4 Year Outcome All Students 983 94% 1% 4% 0% 1% ELL 5 0% 0% 60% 20% 20% Not ELL 978 94% 1% 4% 0% 1%
2004 Total Cohort - 5 Year Outcome All Students 1076 95% 1% 1% 0% 2% ELL 2 # # # # # Not ELL 1074 # # # # #
2003 Total Cohort - 6 Year Outcome All Students 966 95% 2% 1% 0% 2% ELL 3 # # # # # Not ELL 963 # # # # #
Bethpage Union Free School District
2005 Total Cohort - Aug 2009 Year Outcome All Students 261 98% 0% 2% 0% 0% ELL 2 # # # # # Not ELL 259 # # # # #
2005 Total Cohort - 4 Year Outcome All Students 261 98% 0% 2% 0% 0% ELL 2 # # # # # Not ELL 259 # # # # #
Data presented in this report are based on data submitted by school districts to the data repository for the 2008-09 school year. Students are reported based on their date of entry in grade 9 and their last enrollment status as reported in the warehouse on July 31, 2009. The federal Family Education Rights and Privacy Act prohibits the release of personally identifiable student information. This Act precludes the publication of summary information based on fewer than five students or in which subtraction or other simple mathematical operations could be used to obtain personal information. Cells that contain the ("#") symbol have been suppressed to protect student privacy.
District-ell status Thursday, March 4, 2010 Page 121 of 301

Public School District Total Cohort Graduation Rate and Enrollment Outcome Summary - 2008-09 School Year by English Language Learner Status
2005 Total Cohort as of June of the 4th year of school and as of August 2009, 2004 Total Cohort as of June of the 5th year of school, 2003 Total Cohort as of June of the 6th year of school.
Graduated Transferred to Count with Regents GED
County of Cohort or Local Earned IEP Still Preparation DroppedDistrict Members Diplomas Diploma Enrolled Program Out
COUNTY: NASSAU Bethpage Union Free School District
2004 Total Cohort - 5 Year Outcome All Students 245 98% 1% 0% 0% 1% ELL 1 # # # # # Not ELL 244 # # # # #
2003 Total Cohort - 6 Year Outcome All Students 251 98% 1% 0% 0% 1% ELL 1 # # # # # Not ELL 250 # # # # #
Carle Place Union Free School District
2005 Total Cohort - Aug 2009 Year Outcome All Students 123 91% 0% 7% 0% 2% ELL 2 # # # # # Not ELL 121 # # # # #
2005 Total Cohort - 4 Year Outcome All Students 123 89% 0% 9% 0% 2% ELL 2 # # # # # Not ELL 121 # # # # #
2004 Total Cohort - 5 Year Outcome All Students 122 97% 1% 0% 0% 2% ELL 3 # # # # # Not ELL 119 # # # # #
2003 Total Cohort - 6 Year Outcome All Students 104 97% 0% 0% 0% 3% ELL 1 # # # # # Not ELL 103 # # # # #
East Meadow Union Free School District
2005 Total Cohort - Aug 2009 Year Outcome All Students 676 90% 0% 7% 0% 3% ELL 14 57% 0% 36% 0% 7% Not ELL 662 90% 0% 6% 0% 3%
2005 Total Cohort - 4 Year Outcome All Students 676 87% 0% 10% 0% 3% ELL 14 57% 0% 36% 0% 7% Not ELL 662 88% 0% 9% 0% 3%
2004 Total Cohort - 5 Year Outcome All Students 696 94% 1% 1% 0% 4% ELL 16 81% 0% 0% 0% 19% Not ELL 680 95% 1% 1% 0% 3%
2003 Total Cohort - 6 Year Outcome All Students 641 94% 1% 1% 0% 4% ELL 23 74% 0% 4% 0% 22% Not ELL 618 95% 1% 1% 0% 3%
Data presented in this report are based on data submitted by school districts to the data repository for the 2008-09 school year. Students are reported based on their date of entry in grade 9 and their last enrollment status as reported in the warehouse on July 31, 2009. The federal Family Education Rights and Privacy Act prohibits the release of personally identifiable student information. This Act precludes the publication of summary information based on fewer than five students or in which subtraction or other simple mathematical operations could be used to obtain personal information. Cells that contain the ("#") symbol have been suppressed to protect student privacy.
District-ell status Thursday, March 4, 2010 Page 122 of 301
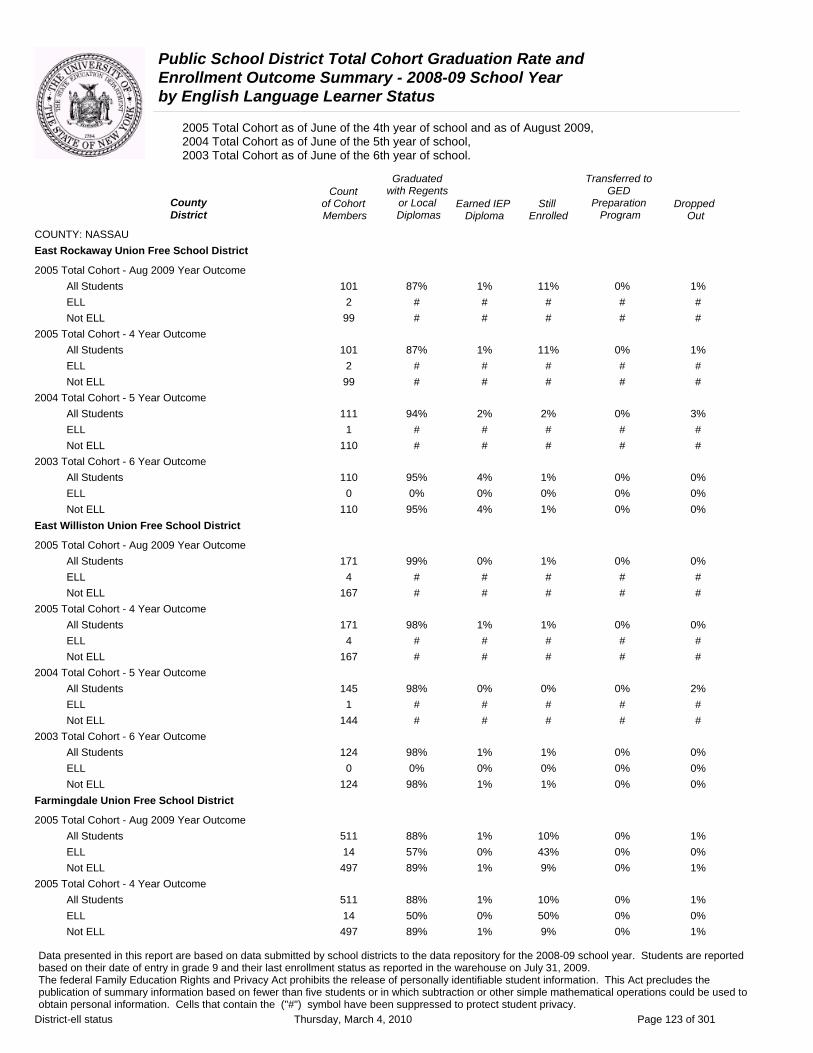
Public School District Total Cohort Graduation Rate and Enrollment Outcome Summary - 2008-09 School Year by English Language Learner Status
2005 Total Cohort as of June of the 4th year of school and as of August 2009, 2004 Total Cohort as of June of the 5th year of school, 2003 Total Cohort as of June of the 6th year of school.
Graduated Transferred to Count with Regents GED
County of Cohort or Local Earned IEP Still Preparation DroppedDistrict Members Diplomas Diploma Enrolled Program Out
COUNTY: NASSAU East Rockaway Union Free School District
2005 Total Cohort - Aug 2009 Year Outcome All Students 101 87% 1% 11% 0% 1% ELL 2 # # # # # Not ELL 99 # # # # #
2005 Total Cohort - 4 Year Outcome All Students 101 87% 1% 11% 0% 1% ELL 2 # # # # # Not ELL 99 # # # # #
2004 Total Cohort - 5 Year Outcome All Students 111 94% 2% 2% 0% 3% ELL 1 # # # # # Not ELL 110 # # # # #
2003 Total Cohort - 6 Year Outcome All Students 110 95% 4% 1% 0% 0% ELL 0 0% 0% 0% 0% 0% Not ELL 110 95% 4% 1% 0% 0%
East Williston Union Free School District
2005 Total Cohort - Aug 2009 Year Outcome All Students 171 99% 0% 1% 0% 0% ELL 4 # # # # # Not ELL 167 # # # # #
2005 Total Cohort - 4 Year Outcome All Students 171 98% 1% 1% 0% 0% ELL 4 # # # # # Not ELL 167 # # # # #
2004 Total Cohort - 5 Year Outcome All Students 145 98% 0% 0% 0% 2% ELL 1 # # # # # Not ELL 144 # # # # #
2003 Total Cohort - 6 Year Outcome All Students 124 98% 1% 1% 0% 0% ELL 0 0% 0% 0% 0% 0% Not ELL 124 98% 1% 1% 0% 0%
Farmingdale Union Free School District
2005 Total Cohort - Aug 2009 Year Outcome All Students 511 88% 1% 10% 0% 1% ELL 14 57% 0% 43% 0% 0% Not ELL 497 89% 1% 9% 0% 1%
2005 Total Cohort - 4 Year Outcome All Students 511 88% 1% 10% 0% 1% ELL 14 50% 0% 50% 0% 0% Not ELL 497 89% 1% 9% 0% 1%
Data presented in this report are based on data submitted by school districts to the data repository for the 2008-09 school year. Students are reported based on their date of entry in grade 9 and their last enrollment status as reported in the warehouse on July 31, 2009. The federal Family Education Rights and Privacy Act prohibits the release of personally identifiable student information. This Act precludes the publication of summary information based on fewer than five students or in which subtraction or other simple mathematical operations could be used to obtain personal information. Cells that contain the ("#") symbol have been suppressed to protect student privacy.
District-ell status Thursday, March 4, 2010 Page 123 of 301

Public School District Total Cohort Graduation Rate and Enrollment Outcome Summary - 2008-09 School Year by English Language Learner Status
2005 Total Cohort as of June of the 4th year of school and as of August 2009, 2004 Total Cohort as of June of the 5th year of school, 2003 Total Cohort as of June of the 6th year of school.
Graduated Transferred to Count with Regents GED
County of Cohort or Local Earned IEP Still Preparation DroppedDistrict Members Diplomas Diploma Enrolled Program Out
COUNTY: NASSAU Farmingdale Union Free School District
2004 Total Cohort - 5 Year Outcome All Students 485 93% 1% 2% 0% 4% ELL 13 54% 0% 15% 0% 31% Not ELL 472 94% 1% 1% 0% 3%
2003 Total Cohort - 6 Year Outcome All Students 508 92% 1% 1% 0% 5% ELL 12 50% 0% 8% 0% 42% Not ELL 496 93% 1% 1% 0% 4%
Freeport Union Free School District
2005 Total Cohort - Aug 2009 Year Outcome All Students 527 68% 1% 24% 0% 6% ELL 59 31% 0% 42% 0% 27% Not ELL 468 72% 1% 22% 0% 4%
2005 Total Cohort - 4 Year Outcome All Students 527 61% 1% 31% 0% 6% ELL 59 27% 0% 46% 0% 27% Not ELL 468 65% 1% 30% 0% 4%
2004 Total Cohort - 5 Year Outcome All Students 552 73% 1% 17% 0% 10% ELL 46 48% 0% 24% 0% 28% Not ELL 506 75% 1% 16% 0% 8%
2003 Total Cohort - 6 Year Outcome All Students 555 69% 1% 16% 0% 15% ELL 42 40% 2% 19% 0% 38% Not ELL 513 71% 1% 15% 0% 13%
Garden City Union Free School District
2005 Total Cohort - Aug 2009 Year Outcome All Students 284 98% 0% 2% 0% 0% ELL 0 0% 0% 0% 0% 0% Not ELL 284 98% 0% 2% 0% 0%
2005 Total Cohort - 4 Year Outcome All Students 284 96% 0% 4% 0% 0% ELL 0 0% 0% 0% 0% 0% Not ELL 284 96% 0% 4% 0% 0%
2004 Total Cohort - 5 Year Outcome All Students 304 98% 1% 0% 0% 0% ELL 0 0% 0% 0% 0% 0% Not ELL 304 98% 1% 0% 0% 0%
2003 Total Cohort - 6 Year Outcome All Students 298 99% 0% 0% 0% 1% ELL 1 # # # # # Not ELL 297 # # # # #
Data presented in this report are based on data submitted by school districts to the data repository for the 2008-09 school year. Students are reported based on their date of entry in grade 9 and their last enrollment status as reported in the warehouse on July 31, 2009. The federal Family Education Rights and Privacy Act prohibits the release of personally identifiable student information. This Act precludes the publication of summary information based on fewer than five students or in which subtraction or other simple mathematical operations could be used to obtain personal information. Cells that contain the ("#") symbol have been suppressed to protect student privacy.
District-ell status Thursday, March 4, 2010 Page 124 of 301

Public School District Total Cohort Graduation Rate and Enrollment Outcome Summary - 2008-09 School Year by English Language Learner Status
2005 Total Cohort as of June of the 4th year of school and as of August 2009, 2004 Total Cohort as of June of the 5th year of school, 2003 Total Cohort as of June of the 6th year of school.
Graduated Transferred to Count with Regents GED
County of Cohort or Local Earned IEP Still Preparation DroppedDistrict Members Diplomas Diploma Enrolled Program Out
COUNTY: NASSAU Glen Cove City School District
2005 Total Cohort - Aug 2009 Year Outcome All Students 225 70% 1% 16% 6% 8% ELL 26 42% 0% 27% 8% 23% Not ELL 199 73% 2% 14% 6% 6%
2005 Total Cohort - 4 Year Outcome All Students 225 68% 1% 18% 6% 8% ELL 26 38% 0% 31% 8% 23% Not ELL 199 71% 2% 16% 6% 6%
2004 Total Cohort - 5 Year Outcome All Students 219 89% 1% 1% 5% 4% ELL 16 81% 0% 6% 6% 6% Not ELL 203 89% 1% 1% 5% 4%
2003 Total Cohort - 6 Year Outcome All Students 220 80% 2% 2% 5% 11% ELL 12 58% 0% 25% 0% 17% Not ELL 208 81% 2% 0% 6% 11%
Great Neck Union Free School District
2005 Total Cohort - Aug 2009 Year Outcome All Students 553 93% 0% 6% 0% 2% ELL 17 71% 0% 29% 0% 0% Not ELL 536 93% 0% 5% 0% 2%
2005 Total Cohort - 4 Year Outcome All Students 553 92% 0% 6% 0% 2% ELL 17 71% 0% 29% 0% 0% Not ELL 536 93% 0% 5% 0% 2%
2004 Total Cohort - 5 Year Outcome All Students 562 96% 1% 3% 0% 1% ELL 14 71% 0% 14% 0% 14% Not ELL 548 97% 1% 2% 0% 1%
2003 Total Cohort - 6 Year Outcome All Students 576 95% 0% 3% 0% 2% ELL 15 87% 0% 0% 0% 13% Not ELL 561 96% 0% 3% 0% 1%
Hempstead Union Free School District
2005 Total Cohort - Aug 2009 Year Outcome All Students 390 54% 1% 26% 0% 18% ELL 63 16% 0% 46% 0% 38% Not ELL 327 62% 1% 23% 0% 14%
2005 Total Cohort - 4 Year Outcome All Students 390 50% 1% 31% 0% 18% ELL 63 16% 0% 46% 0% 38% Not ELL 327 57% 1% 28% 0% 14%
Data presented in this report are based on data submitted by school districts to the data repository for the 2008-09 school year. Students are reported based on their date of entry in grade 9 and their last enrollment status as reported in the warehouse on July 31, 2009. The federal Family Education Rights and Privacy Act prohibits the release of personally identifiable student information. This Act precludes the publication of summary information based on fewer than five students or in which subtraction or other simple mathematical operations could be used to obtain personal information. Cells that contain the ("#") symbol have been suppressed to protect student privacy.
District-ell status Thursday, March 4, 2010 Page 125 of 301
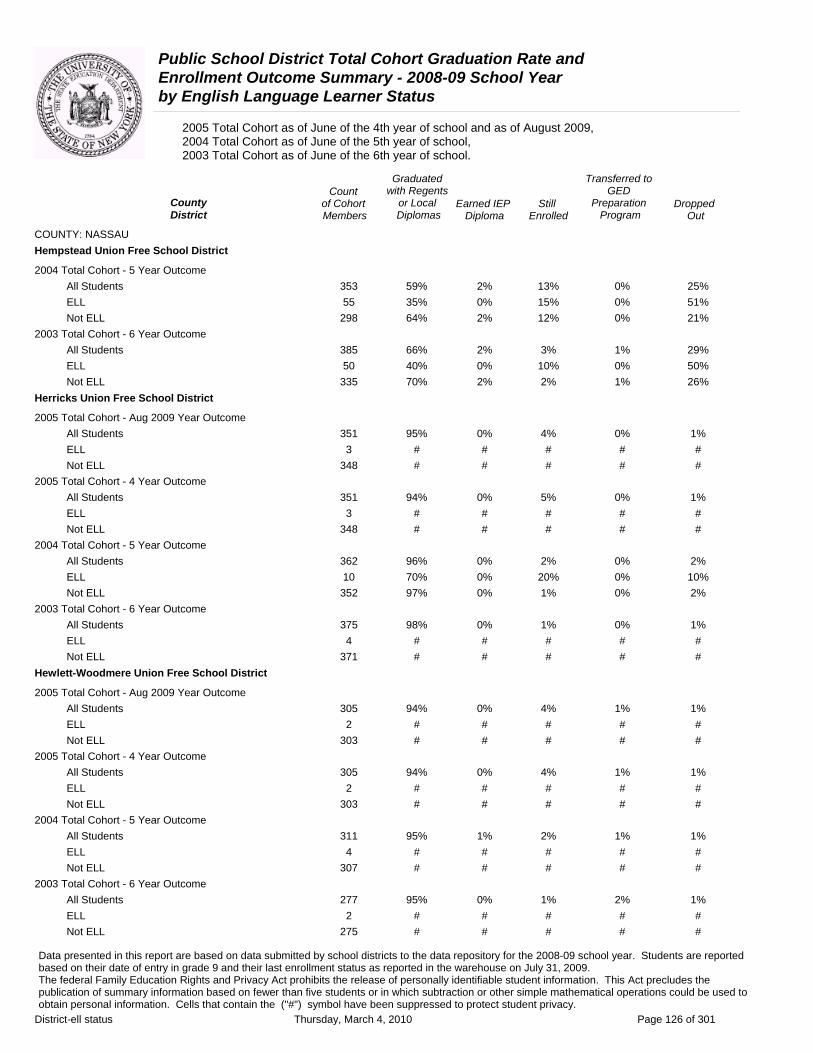
Public School District Total Cohort Graduation Rate and Enrollment Outcome Summary - 2008-09 School Year by English Language Learner Status
2005 Total Cohort as of June of the 4th year of school and as of August 2009, 2004 Total Cohort as of June of the 5th year of school, 2003 Total Cohort as of June of the 6th year of school.
Graduated Transferred to Count with Regents GED
County of Cohort or Local Earned IEP Still Preparation DroppedDistrict Members Diplomas Diploma Enrolled Program Out
COUNTY: NASSAU Hempstead Union Free School District
2004 Total Cohort - 5 Year Outcome All Students 353 59% 2% 13% 0% 25% ELL 55 35% 0% 15% 0% 51% Not ELL 298 64% 2% 12% 0% 21%
2003 Total Cohort - 6 Year Outcome All Students 385 66% 2% 3% 1% 29% ELL 50 40% 0% 10% 0% 50% Not ELL 335 70% 2% 2% 1% 26%
Herricks Union Free School District
2005 Total Cohort - Aug 2009 Year Outcome All Students 351 95% 0% 4% 0% 1% ELL 3 # # # # # Not ELL 348 # # # # #
2005 Total Cohort - 4 Year Outcome All Students 351 94% 0% 5% 0% 1% ELL 3 # # # # # Not ELL 348 # # # # #
2004 Total Cohort - 5 Year Outcome All Students 362 96% 0% 2% 0% 2% ELL 10 70% 0% 20% 0% 10% Not ELL 352 97% 0% 1% 0% 2%
2003 Total Cohort - 6 Year Outcome All Students 375 98% 0% 1% 0% 1% ELL 4 # # # # # Not ELL 371 # # # # #
Hewlett-Woodmere Union Free School District
2005 Total Cohort - Aug 2009 Year Outcome All Students 305 94% 0% 4% 1% 1% ELL 2 # # # # # Not ELL 303 # # # # #
2005 Total Cohort - 4 Year Outcome All Students 305 94% 0% 4% 1% 1% ELL 2 # # # # # Not ELL 303 # # # # #
2004 Total Cohort - 5 Year Outcome All Students 311 95% 1% 2% 1% 1% ELL 4 # # # # # Not ELL 307 # # # # #
2003 Total Cohort - 6 Year Outcome All Students 277 95% 0% 1% 2% 1% ELL 2 # # # # # Not ELL 275 # # # # #
Data presented in this report are based on data submitted by school districts to the data repository for the 2008-09 school year. Students are reported based on their date of entry in grade 9 and their last enrollment status as reported in the warehouse on July 31, 2009. The federal Family Education Rights and Privacy Act prohibits the release of personally identifiable student information. This Act precludes the publication of summary information based on fewer than five students or in which subtraction or other simple mathematical operations could be used to obtain personal information. Cells that contain the ("#") symbol have been suppressed to protect student privacy.
District-ell status Thursday, March 4, 2010 Page 126 of 301

Public School District Total Cohort Graduation Rate and Enrollment Outcome Summary - 2008-09 School Year by English Language Learner Status
2005 Total Cohort as of June of the 4th year of school and as of August 2009, 2004 Total Cohort as of June of the 5th year of school, 2003 Total Cohort as of June of the 6th year of school.
Graduated Transferred to Count with Regents GED
County of Cohort or Local Earned IEP Still Preparation DroppedDistrict Members Diplomas Diploma Enrolled Program Out
COUNTY: NASSAU Hicksville Union Free School District
2005 Total Cohort - Aug 2009 Year Outcome All Students 427 87% 0% 6% 0% 7% ELL 25 48% 0% 32% 0% 20% Not ELL 402 90% 0% 4% 0% 6%
2005 Total Cohort - 4 Year Outcome All Students 427 85% 0% 8% 0% 7% ELL 25 48% 0% 32% 0% 20% Not ELL 402 87% 0% 6% 0% 6%
2004 Total Cohort - 5 Year Outcome All Students 478 87% 1% 4% 0% 8% ELL 10 70% 0% 10% 0% 20% Not ELL 468 87% 1% 4% 0% 8%
2003 Total Cohort - 6 Year Outcome All Students 421 86% 2% 2% 0% 10% ELL 15 53% 0% 7% 0% 40% Not ELL 406 87% 2% 1% 0% 9%
Island Trees Union Free School District
2005 Total Cohort - Aug 2009 Year Outcome All Students 222 91% 0% 6% 0% 2% ELL 1 # # # # # Not ELL 221 # # # # #
2005 Total Cohort - 4 Year Outcome All Students 222 91% 0% 7% 0% 2% ELL 1 # # # # # Not ELL 221 # # # # #
2004 Total Cohort - 5 Year Outcome All Students 242 95% 2% 0% 0% 2% ELL 3 # # # # # Not ELL 239 # # # # #
2003 Total Cohort - 6 Year Outcome All Students 246 95% 0% 2% 0% 2% ELL 2 # # # # # Not ELL 244 # # # # #
Jericho Union Free School District
2005 Total Cohort - Aug 2009 Year Outcome All Students 296 97% 0% 3% 0% 0% ELL 1 # # # # # Not ELL 295 # # # # #
2005 Total Cohort - 4 Year Outcome All Students 296 97% 0% 3% 0% 0% ELL 1 # # # # # Not ELL 295 # # # # #
Data presented in this report are based on data submitted by school districts to the data repository for the 2008-09 school year. Students are reported based on their date of entry in grade 9 and their last enrollment status as reported in the warehouse on July 31, 2009. The federal Family Education Rights and Privacy Act prohibits the release of personally identifiable student information. This Act precludes the publication of summary information based on fewer than five students or in which subtraction or other simple mathematical operations could be used to obtain personal information. Cells that contain the ("#") symbol have been suppressed to protect student privacy.
District-ell status Thursday, March 4, 2010 Page 127 of 301

Public School District Total Cohort Graduation Rate and Enrollment Outcome Summary - 2008-09 School Year by English Language Learner Status
2005 Total Cohort as of June of the 4th year of school and as of August 2009, 2004 Total Cohort as of June of the 5th year of school, 2003 Total Cohort as of June of the 6th year of school.
Graduated Transferred to Count with Regents GED
County of Cohort or Local Earned IEP Still Preparation DroppedDistrict Members Diplomas Diploma Enrolled Program Out
COUNTY: NASSAU Jericho Union Free School District
2004 Total Cohort - 5 Year Outcome All Students 328 98% 2% 0% 0% 0% ELL 3 # # # # # Not ELL 325 # # # # #
2003 Total Cohort - 6 Year Outcome All Students 269 99% 0% 0% 0% 0% ELL 9 89% 0% 0% 0% 11% Not ELL 260 100% 0% 0% 0% 0%
Lawrence Union Free School District
2005 Total Cohort - Aug 2009 Year Outcome All Students 331 77% 1% 14% 4% 4% ELL 18 28% 0% 61% 6% 6% Not ELL 313 80% 1% 11% 4% 4%
2005 Total Cohort - 4 Year Outcome All Students 331 69% 1% 21% 4% 4% ELL 18 22% 0% 67% 6% 6% Not ELL 313 72% 1% 19% 4% 4%
2004 Total Cohort - 5 Year Outcome All Students 285 90% 1% 4% 1% 4% ELL 5 80% 0% 0% 20% 0% Not ELL 280 90% 1% 4% 1% 4%
2003 Total Cohort - 6 Year Outcome All Students 284 89% 0% 4% 1% 5% ELL 5 60% 20% 0% 0% 20% Not ELL 279 90% 0% 4% 1% 5%
Levittown Union Free School District
2005 Total Cohort - Aug 2009 Year Outcome All Students 658 94% 0% 5% 1% 0% ELL 4 # # # # # Not ELL 654 # # # # #
2005 Total Cohort - 4 Year Outcome All Students 658 93% 0% 5% 1% 0% ELL 4 # # # # # Not ELL 654 # # # # #
2004 Total Cohort - 5 Year Outcome All Students 687 95% 1% 1% 0% 2% ELL 8 75% 0% 0% 0% 25% Not ELL 679 96% 1% 1% 0% 1%
2003 Total Cohort - 6 Year Outcome All Students 631 95% 1% 1% 1% 2% ELL 3 # # # # # Not ELL 628 # # # # #
Data presented in this report are based on data submitted by school districts to the data repository for the 2008-09 school year. Students are reported based on their date of entry in grade 9 and their last enrollment status as reported in the warehouse on July 31, 2009. The federal Family Education Rights and Privacy Act prohibits the release of personally identifiable student information. This Act precludes the publication of summary information based on fewer than five students or in which subtraction or other simple mathematical operations could be used to obtain personal information. Cells that contain the ("#") symbol have been suppressed to protect student privacy.
District-ell status Thursday, March 4, 2010 Page 128 of 301
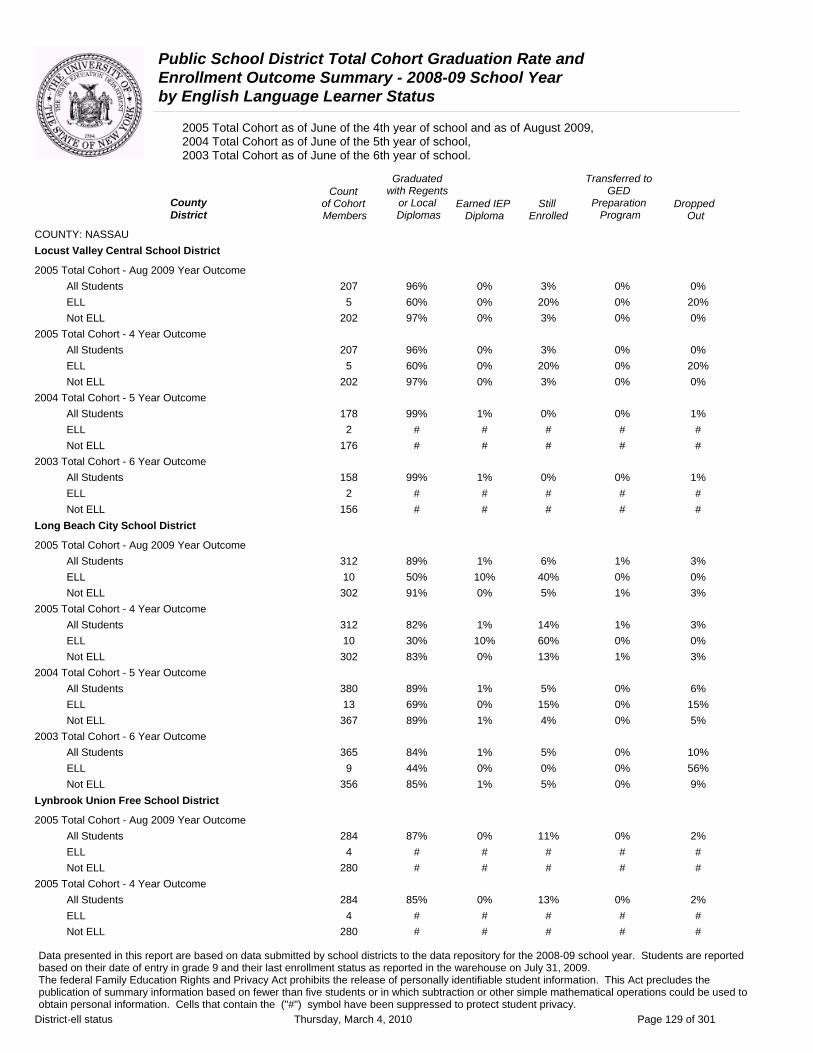
Public School District Total Cohort Graduation Rate and Enrollment Outcome Summary - 2008-09 School Year by English Language Learner Status
2005 Total Cohort as of June of the 4th year of school and as of August 2009, 2004 Total Cohort as of June of the 5th year of school, 2003 Total Cohort as of June of the 6th year of school.
Graduated Transferred to Count with Regents GED
County of Cohort or Local Earned IEP Still Preparation DroppedDistrict Members Diplomas Diploma Enrolled Program Out
COUNTY: NASSAU Locust Valley Central School District
2005 Total Cohort - Aug 2009 Year Outcome All Students 207 96% 0% 3% 0% 0% ELL 5 60% 0% 20% 0% 20% Not ELL 202 97% 0% 3% 0% 0%
2005 Total Cohort - 4 Year Outcome All Students 207 96% 0% 3% 0% 0% ELL 5 60% 0% 20% 0% 20% Not ELL 202 97% 0% 3% 0% 0%
2004 Total Cohort - 5 Year Outcome All Students 178 99% 1% 0% 0% 1% ELL 2 # # # # # Not ELL 176 # # # # #
2003 Total Cohort - 6 Year Outcome All Students 158 99% 1% 0% 0% 1% ELL 2 # # # # # Not ELL 156 # # # # #
Long Beach City School District
2005 Total Cohort - Aug 2009 Year Outcome All Students 312 89% 1% 6% 1% 3% ELL 10 50% 10% 40% 0% 0% Not ELL 302 91% 0% 5% 1% 3%
2005 Total Cohort - 4 Year Outcome All Students 312 82% 1% 14% 1% 3% ELL 10 30% 10% 60% 0% 0% Not ELL 302 83% 0% 13% 1% 3%
2004 Total Cohort - 5 Year Outcome All Students 380 89% 1% 5% 0% 6% ELL 13 69% 0% 15% 0% 15% Not ELL 367 89% 1% 4% 0% 5%
2003 Total Cohort - 6 Year Outcome All Students 365 84% 1% 5% 0% 10% ELL 9 44% 0% 0% 0% 56% Not ELL 356 85% 1% 5% 0% 9%
Lynbrook Union Free School District
2005 Total Cohort - Aug 2009 Year Outcome All Students 284 87% 0% 11% 0% 2% ELL 4 # # # # # Not ELL 280 # # # # #
2005 Total Cohort - 4 Year Outcome All Students 284 85% 0% 13% 0% 2% ELL 4 # # # # # Not ELL 280 # # # # #
Data presented in this report are based on data submitted by school districts to the data repository for the 2008-09 school year. Students are reported based on their date of entry in grade 9 and their last enrollment status as reported in the warehouse on July 31, 2009. The federal Family Education Rights and Privacy Act prohibits the release of personally identifiable student information. This Act precludes the publication of summary information based on fewer than five students or in which subtraction or other simple mathematical operations could be used to obtain personal information. Cells that contain the ("#") symbol have been suppressed to protect student privacy.
District-ell status Thursday, March 4, 2010 Page 129 of 301

Public School District Total Cohort Graduation Rate and Enrollment Outcome Summary - 2008-09 School Year by English Language Learner Status
2005 Total Cohort as of June of the 4th year of school and as of August 2009, 2004 Total Cohort as of June of the 5th year of school, 2003 Total Cohort as of June of the 6th year of school.
Graduated Transferred to Count with Regents GED
County of Cohort or Local Earned IEP Still Preparation DroppedDistrict Members Diplomas Diploma Enrolled Program Out
COUNTY: NASSAU Lynbrook Union Free School District
2004 Total Cohort - 5 Year Outcome All Students 304 95% 0% 3% 0% 1% ELL 2 # # # # # Not ELL 302 # # # # #
2003 Total Cohort - 6 Year Outcome All Students 251 90% 0% 4% 0% 5% ELL 6 67% 0% 17% 0% 17% Not ELL 245 91% 0% 4% 0% 5%
Malverne Union Free School District
2005 Total Cohort - Aug 2009 Year Outcome All Students 127 87% 0% 11% 2% 0% ELL 0 0% 0% 0% 0% 0% Not ELL 127 87% 0% 11% 2% 0%
2005 Total Cohort - 4 Year Outcome All Students 127 82% 0% 16% 2% 0% ELL 0 0% 0% 0% 0% 0% Not ELL 127 82% 0% 16% 2% 0%
2004 Total Cohort - 5 Year Outcome All Students 139 88% 2% 2% 1% 6% ELL 0 0% 0% 0% 0% 0% Not ELL 139 88% 2% 2% 1% 6%
2003 Total Cohort - 6 Year Outcome All Students 141 82% 1% 9% 0% 9% ELL 4 # # # # # Not ELL 137 # # # # #
Manhasset Union Free School District
2005 Total Cohort - Aug 2009 Year Outcome All Students 192 96% 0% 4% 0% 1% ELL 2 # # # # # Not ELL 190 # # # # #
2005 Total Cohort - 4 Year Outcome All Students 192 95% 0% 4% 0% 1% ELL 2 # # # # # Not ELL 190 # # # # #
2004 Total Cohort - 5 Year Outcome All Students 212 97% 2% 0% 0% 1% ELL 2 # # # # # Not ELL 210 # # # # #
2003 Total Cohort - 6 Year Outcome All Students 194 97% 1% 1% 0% 1% ELL 2 # # # # # Not ELL 192 # # # # #
Data presented in this report are based on data submitted by school districts to the data repository for the 2008-09 school year. Students are reported based on their date of entry in grade 9 and their last enrollment status as reported in the warehouse on July 31, 2009. The federal Family Education Rights and Privacy Act prohibits the release of personally identifiable student information. This Act precludes the publication of summary information based on fewer than five students or in which subtraction or other simple mathematical operations could be used to obtain personal information. Cells that contain the ("#") symbol have been suppressed to protect student privacy.
District-ell status Thursday, March 4, 2010 Page 130 of 301

Public School District Total Cohort Graduation Rate and Enrollment Outcome Summary - 2008-09 School Year by English Language Learner Status
2005 Total Cohort as of June of the 4th year of school and as of August 2009, 2004 Total Cohort as of June of the 5th year of school, 2003 Total Cohort as of June of the 6th year of school.
Graduated Transferred to Count with Regents GED
County of Cohort or Local Earned IEP Still Preparation DroppedDistrict Members Diplomas Diploma Enrolled Program Out
COUNTY: NASSAU Massapequa Union Free School District
2005 Total Cohort - Aug 2009 Year Outcome All Students 624 96% 0% 3% 0% 1% ELL 4 # # # # # Not ELL 620 # # # # #
2005 Total Cohort - 4 Year Outcome All Students 624 96% 0% 3% 0% 1% ELL 4 # # # # # Not ELL 620 # # # # #
2004 Total Cohort - 5 Year Outcome All Students 661 95% 1% 1% 0% 3% ELL 0 0% 0% 0% 0% 0% Not ELL 661 95% 1% 1% 0% 3%
2003 Total Cohort - 6 Year Outcome All Students 599 96% 1% 0% 0% 3% ELL 1 # # # # # Not ELL 598 # # # # #
Mineola Union Free School District
2005 Total Cohort - Aug 2009 Year Outcome All Students 191 92% 1% 5% 1% 3% ELL 5 40% 0% 20% 0% 40% Not ELL 186 93% 1% 4% 1% 2%
2005 Total Cohort - 4 Year Outcome All Students 191 91% 1% 5% 1% 3% ELL 5 40% 0% 20% 0% 40% Not ELL 186 92% 1% 5% 1% 2%
2004 Total Cohort - 5 Year Outcome All Students 195 93% 3% 2% 0% 3% ELL 5 20% 0% 40% 0% 40% Not ELL 190 95% 3% 1% 0% 2%
2003 Total Cohort - 6 Year Outcome All Students 187 91% 1% 2% 0% 6% ELL 4 # # # # # Not ELL 183 # # # # #
North Shore Central School District
2005 Total Cohort - Aug 2009 Year Outcome All Students 195 91% 0% 7% 0% 3% ELL 1 # # # # # Not ELL 194 # # # # #
2005 Total Cohort - 4 Year Outcome All Students 195 91% 0% 7% 0% 3% ELL 1 # # # # # Not ELL 194 # # # # #
Data presented in this report are based on data submitted by school districts to the data repository for the 2008-09 school year. Students are reported based on their date of entry in grade 9 and their last enrollment status as reported in the warehouse on July 31, 2009. The federal Family Education Rights and Privacy Act prohibits the release of personally identifiable student information. This Act precludes the publication of summary information based on fewer than five students or in which subtraction or other simple mathematical operations could be used to obtain personal information. Cells that contain the ("#") symbol have been suppressed to protect student privacy.
District-ell status Thursday, March 4, 2010 Page 131 of 301

Public School District Total Cohort Graduation Rate and Enrollment Outcome Summary - 2008-09 School Year by English Language Learner Status
2005 Total Cohort as of June of the 4th year of school and as of August 2009, 2004 Total Cohort as of June of the 5th year of school, 2003 Total Cohort as of June of the 6th year of school.
Graduated Transferred to Count with Regents GED
County of Cohort or Local Earned IEP Still Preparation DroppedDistrict Members Diplomas Diploma Enrolled Program Out
COUNTY: NASSAU North Shore Central School District
2004 Total Cohort - 5 Year Outcome All Students 224 96% 0% 1% 0% 2% ELL 1 # # # # # Not ELL 223 # # # # #
2003 Total Cohort - 6 Year Outcome All Students 199 94% 1% 2% 0% 3% ELL 2 # # # # # Not ELL 197 # # # # #
Oceanside Union Free School District
2005 Total Cohort - Aug 2009 Year Outcome All Students 539 89% 1% 7% 2% 2% ELL 5 40% 0% 20% 40% 0% Not ELL 534 90% 1% 7% 1% 2%
2005 Total Cohort - 4 Year Outcome All Students 539 88% 1% 8% 2% 2% ELL 5 40% 0% 20% 40% 0% Not ELL 534 88% 1% 8% 1% 2%
2004 Total Cohort - 5 Year Outcome All Students 519 94% 2% 2% 2% 1% ELL 3 # # # # # Not ELL 516 # # # # #
2003 Total Cohort - 6 Year Outcome All Students 493 95% 1% 2% 1% 1% ELL 1 # # # # # Not ELL 492 # # # # #
Oyster Bay-East Norwich Central School District
2005 Total Cohort - Aug 2009 Year Outcome All Students 106 85% 1% 9% 0% 5% ELL 3 # # # # # Not ELL 103 # # # # #
2005 Total Cohort - 4 Year Outcome All Students 106 85% 1% 9% 0% 5% ELL 3 # # # # # Not ELL 103 # # # # #
2004 Total Cohort - 5 Year Outcome All Students 120 91% 0% 2% 0% 8% ELL 7 14% 0% 14% 0% 71% Not ELL 113 96% 0% 1% 0% 4%
2003 Total Cohort - 6 Year Outcome All Students 119 96% 0% 2% 0% 3% ELL 1 # # # # # Not ELL 118 # # # # #
Data presented in this report are based on data submitted by school districts to the data repository for the 2008-09 school year. Students are reported based on their date of entry in grade 9 and their last enrollment status as reported in the warehouse on July 31, 2009. The federal Family Education Rights and Privacy Act prohibits the release of personally identifiable student information. This Act precludes the publication of summary information based on fewer than five students or in which subtraction or other simple mathematical operations could be used to obtain personal information. Cells that contain the ("#") symbol have been suppressed to protect student privacy.
District-ell status Thursday, March 4, 2010 Page 132 of 301
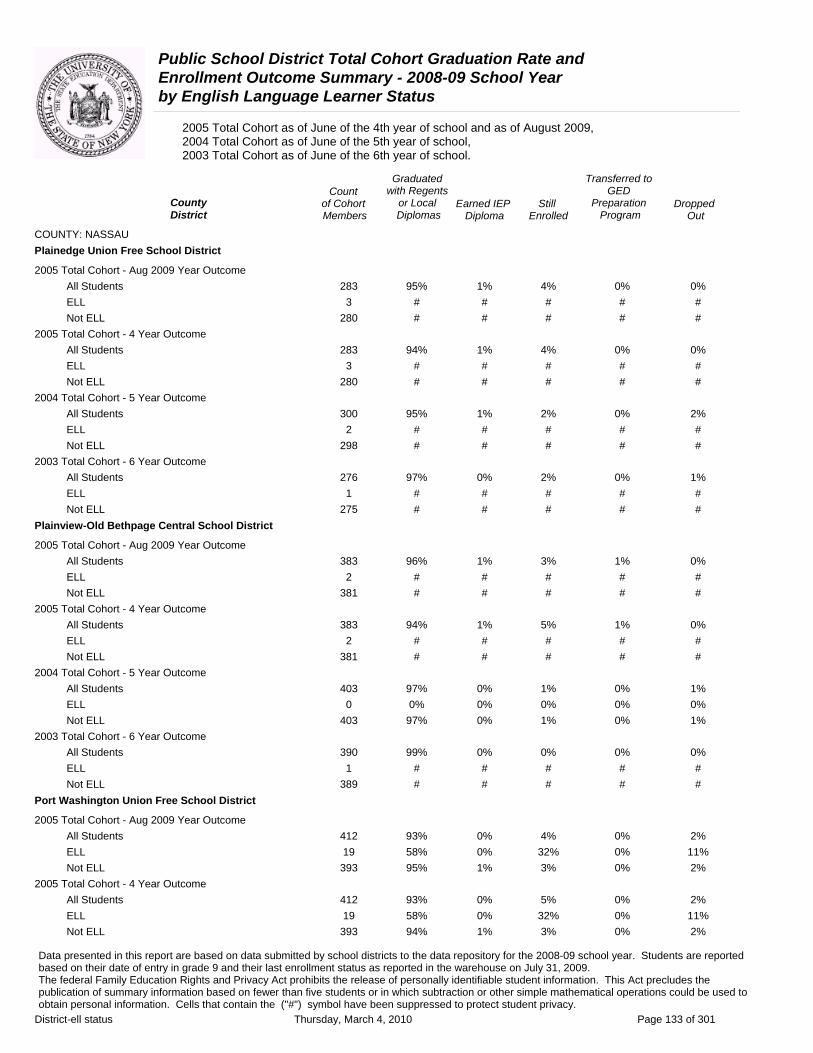
Public School District Total Cohort Graduation Rate and Enrollment Outcome Summary - 2008-09 School Year by English Language Learner Status
2005 Total Cohort as of June of the 4th year of school and as of August 2009, 2004 Total Cohort as of June of the 5th year of school, 2003 Total Cohort as of June of the 6th year of school.
Graduated Transferred to Count with Regents GED
County of Cohort or Local Earned IEP Still Preparation DroppedDistrict Members Diplomas Diploma Enrolled Program Out
COUNTY: NASSAU Plainedge Union Free School District
2005 Total Cohort - Aug 2009 Year Outcome All Students 283 95% 1% 4% 0% 0% ELL 3 # # # # # Not ELL 280 # # # # #
2005 Total Cohort - 4 Year Outcome All Students 283 94% 1% 4% 0% 0% ELL 3 # # # # # Not ELL 280 # # # # #
2004 Total Cohort - 5 Year Outcome All Students 300 95% 1% 2% 0% 2% ELL 2 # # # # # Not ELL 298 # # # # #
2003 Total Cohort - 6 Year Outcome All Students 276 97% 0% 2% 0% 1% ELL 1 # # # # # Not ELL 275 # # # # #
Plainview-Old Bethpage Central School District
2005 Total Cohort - Aug 2009 Year Outcome All Students 383 96% 1% 3% 1% 0% ELL 2 # # # # # Not ELL 381 # # # # #
2005 Total Cohort - 4 Year Outcome All Students 383 94% 1% 5% 1% 0% ELL 2 # # # # # Not ELL 381 # # # # #
2004 Total Cohort - 5 Year Outcome All Students 403 97% 0% 1% 0% 1% ELL 0 0% 0% 0% 0% 0% Not ELL 403 97% 0% 1% 0% 1%
2003 Total Cohort - 6 Year Outcome All Students 390 99% 0% 0% 0% 0% ELL 1 # # # # # Not ELL 389 # # # # #
Port Washington Union Free School District
2005 Total Cohort - Aug 2009 Year Outcome All Students 412 93% 0% 4% 0% 2% ELL 19 58% 0% 32% 0% 11% Not ELL 393 95% 1% 3% 0% 2%
2005 Total Cohort - 4 Year Outcome All Students 412 93% 0% 5% 0% 2% ELL 19 58% 0% 32% 0% 11% Not ELL 393 94% 1% 3% 0% 2%
Data presented in this report are based on data submitted by school districts to the data repository for the 2008-09 school year. Students are reported based on their date of entry in grade 9 and their last enrollment status as reported in the warehouse on July 31, 2009. The federal Family Education Rights and Privacy Act prohibits the release of personally identifiable student information. This Act precludes the publication of summary information based on fewer than five students or in which subtraction or other simple mathematical operations could be used to obtain personal information. Cells that contain the ("#") symbol have been suppressed to protect student privacy.
District-ell status Thursday, March 4, 2010 Page 133 of 301

Public School District Total Cohort Graduation Rate and Enrollment Outcome Summary - 2008-09 School Year by English Language Learner Status
2005 Total Cohort as of June of the 4th year of school and as of August 2009, 2004 Total Cohort as of June of the 5th year of school, 2003 Total Cohort as of June of the 6th year of school.
Graduated Transferred to Count with Regents GED
County of Cohort or Local Earned IEP Still Preparation DroppedDistrict Members Diplomas Diploma Enrolled Program Out
COUNTY: NASSAU Port Washington Union Free School District
2004 Total Cohort - 5 Year Outcome All Students 382 97% 1% 1% 0% 1% ELL 16 81% 0% 6% 0% 13% Not ELL 366 98% 1% 1% 0% 1%
2003 Total Cohort - 6 Year Outcome All Students 353 98% 1% 0% 0% 1% ELL 11 82% 9% 0% 0% 9% Not ELL 342 99% 0% 0% 0% 1%
Rockville Centre Union Free School District
2005 Total Cohort - Aug 2009 Year Outcome All Students 266 96% 0% 4% 0% 0% ELL 2 # # # # # Not ELL 264 # # # # #
2005 Total Cohort - 4 Year Outcome All Students 266 96% 0% 4% 0% 0% ELL 2 # # # # # Not ELL 264 # # # # #
2004 Total Cohort - 5 Year Outcome All Students 294 99% 0% 0% 0% 0% ELL 2 # # # # # Not ELL 292 # # # # #
2003 Total Cohort - 6 Year Outcome All Students 312 98% 1% 0% 0% 0% ELL 0 0% 0% 0% 0% 0% Not ELL 312 98% 1% 0% 0% 0%
Roosevelt Union Free School District
2005 Total Cohort - Aug 2009 Year Outcome All Students 193 59% 4% 21% 0% 16% ELL 19 21% 0% 21% 0% 58% Not ELL 174 63% 5% 21% 0% 11%
2005 Total Cohort - 4 Year Outcome All Students 193 59% 4% 21% 0% 16% ELL 19 21% 0% 21% 0% 58% Not ELL 174 63% 5% 21% 0% 11%
2004 Total Cohort - 5 Year Outcome All Students 205 66% 2% 9% 0% 22% ELL 13 23% 0% 8% 0% 69% Not ELL 192 69% 3% 9% 0% 19%
2003 Total Cohort - 6 Year Outcome All Students 218 67% 8% 9% 0% 17% ELL 12 58% 0% 17% 0% 25% Not ELL 206 67% 8% 8% 0% 17%
Data presented in this report are based on data submitted by school districts to the data repository for the 2008-09 school year. Students are reported based on their date of entry in grade 9 and their last enrollment status as reported in the warehouse on July 31, 2009. The federal Family Education Rights and Privacy Act prohibits the release of personally identifiable student information. This Act precludes the publication of summary information based on fewer than five students or in which subtraction or other simple mathematical operations could be used to obtain personal information. Cells that contain the ("#") symbol have been suppressed to protect student privacy.
District-ell status Thursday, March 4, 2010 Page 134 of 301

Public School District Total Cohort Graduation Rate and Enrollment Outcome Summary - 2008-09 School Year by English Language Learner Status
2005 Total Cohort as of June of the 4th year of school and as of August 2009, 2004 Total Cohort as of June of the 5th year of school, 2003 Total Cohort as of June of the 6th year of school.
Graduated Transferred to Count with Regents GED
County of Cohort or Local Earned IEP Still Preparation DroppedDistrict Members Diplomas Diploma Enrolled Program Out
COUNTY: NASSAU Roslyn Union Free School District
2005 Total Cohort - Aug 2009 Year Outcome All Students 281 94% 0% 5% 0% 1% ELL 2 # # # # # Not ELL 279 # # # # #
2005 Total Cohort - 4 Year Outcome All Students 281 94% 0% 5% 0% 1% ELL 2 # # # # # Not ELL 279 # # # # #
2004 Total Cohort - 5 Year Outcome All Students 280 96% 0% 2% 0% 2% ELL 2 # # # # # Not ELL 278 # # # # #
2003 Total Cohort - 6 Year Outcome All Students 278 95% 1% 1% 0% 3% ELL 2 # # # # # Not ELL 276 # # # # #
Seaford Union Free School District
2005 Total Cohort - Aug 2009 Year Outcome All Students 226 92% 0% 4% 0% 4% ELL 0 0% 0% 0% 0% 0% Not ELL 226 92% 0% 4% 0% 4%
2005 Total Cohort - 4 Year Outcome All Students 226 91% 0% 5% 0% 4% ELL 0 0% 0% 0% 0% 0% Not ELL 226 91% 0% 5% 0% 4%
2004 Total Cohort - 5 Year Outcome All Students 227 96% 0% 0% 0% 4% ELL 0 0% 0% 0% 0% 0% Not ELL 227 96% 0% 0% 0% 4%
2003 Total Cohort - 6 Year Outcome All Students 204 95% 1% 0% 0% 4% ELL 0 0% 0% 0% 0% 0% Not ELL 204 95% 1% 0% 0% 4%
Sewanhaka Central High School District
2005 Total Cohort - Aug 2009 Year Outcome All Students 1513 92% 1% 3% 1% 2% ELL 28 82% 0% 7% 0% 11% Not ELL 1485 93% 1% 3% 1% 2%
2005 Total Cohort - 4 Year Outcome All Students 1513 92% 1% 4% 1% 2% ELL 28 71% 0% 18% 0% 11% Not ELL 1485 92% 1% 3% 1% 2%
Data presented in this report are based on data submitted by school districts to the data repository for the 2008-09 school year. Students are reported based on their date of entry in grade 9 and their last enrollment status as reported in the warehouse on July 31, 2009. The federal Family Education Rights and Privacy Act prohibits the release of personally identifiable student information. This Act precludes the publication of summary information based on fewer than five students or in which subtraction or other simple mathematical operations could be used to obtain personal information. Cells that contain the ("#") symbol have been suppressed to protect student privacy.
District-ell status Thursday, March 4, 2010 Page 135 of 301
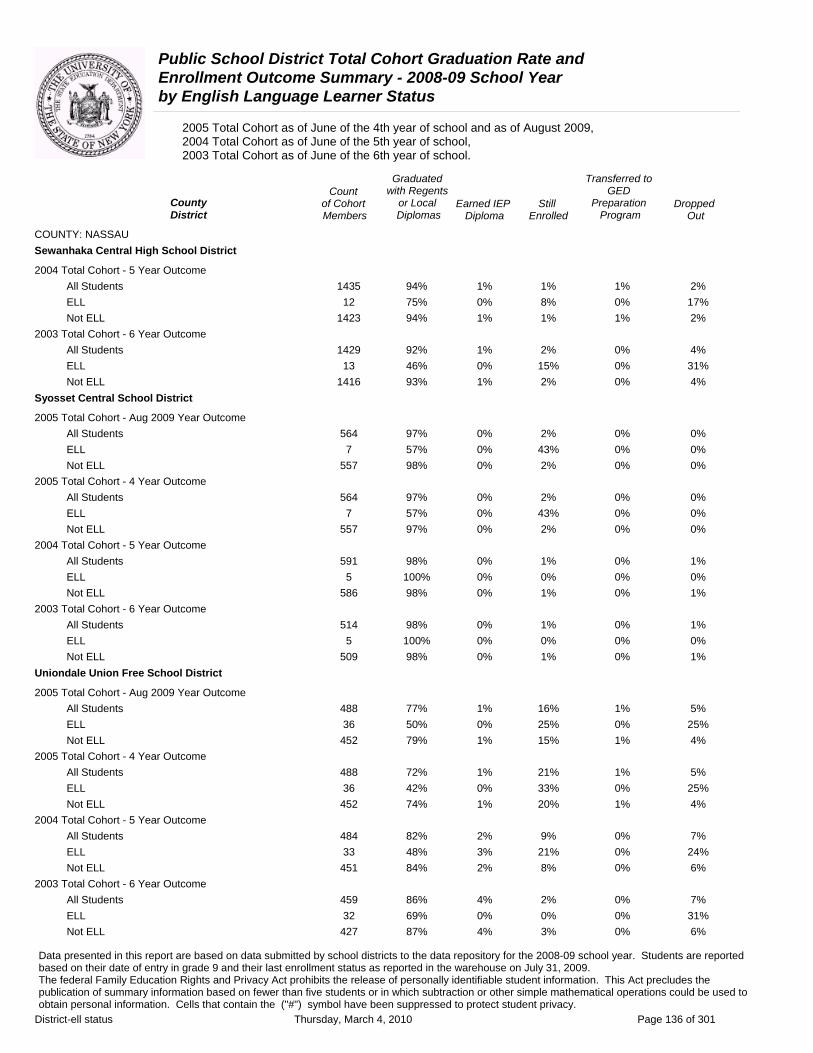
Public School District Total Cohort Graduation Rate and Enrollment Outcome Summary - 2008-09 School Year by English Language Learner Status
2005 Total Cohort as of June of the 4th year of school and as of August 2009, 2004 Total Cohort as of June of the 5th year of school, 2003 Total Cohort as of June of the 6th year of school.
Graduated Transferred to Count with Regents GED
County of Cohort or Local Earned IEP Still Preparation DroppedDistrict Members Diplomas Diploma Enrolled Program Out
COUNTY: NASSAU Sewanhaka Central High School District
2004 Total Cohort - 5 Year Outcome All Students 1435 94% 1% 1% 1% 2% ELL 12 75% 0% 8% 0% 17% Not ELL 1423 94% 1% 1% 1% 2%
2003 Total Cohort - 6 Year Outcome All Students 1429 92% 1% 2% 0% 4% ELL 13 46% 0% 15% 0% 31% Not ELL 1416 93% 1% 2% 0% 4%
Syosset Central School District
2005 Total Cohort - Aug 2009 Year Outcome All Students 564 97% 0% 2% 0% 0% ELL 7 57% 0% 43% 0% 0% Not ELL 557 98% 0% 2% 0% 0%
2005 Total Cohort - 4 Year Outcome All Students 564 97% 0% 2% 0% 0% ELL 7 57% 0% 43% 0% 0% Not ELL 557 97% 0% 2% 0% 0%
2004 Total Cohort - 5 Year Outcome All Students 591 98% 0% 1% 0% 1% ELL 5 100% 0% 0% 0% 0% Not ELL 586 98% 0% 1% 0% 1%
2003 Total Cohort - 6 Year Outcome All Students 514 98% 0% 1% 0% 1% ELL 5 100% 0% 0% 0% 0% Not ELL 509 98% 0% 1% 0% 1%
Uniondale Union Free School District
2005 Total Cohort - Aug 2009 Year Outcome All Students 488 77% 1% 16% 1% 5% ELL 36 50% 0% 25% 0% 25% Not ELL 452 79% 1% 15% 1% 4%
2005 Total Cohort - 4 Year Outcome All Students 488 72% 1% 21% 1% 5% ELL 36 42% 0% 33% 0% 25% Not ELL 452 74% 1% 20% 1% 4%
2004 Total Cohort - 5 Year Outcome All Students 484 82% 2% 9% 0% 7% ELL 33 48% 3% 21% 0% 24% Not ELL 451 84% 2% 8% 0% 6%
2003 Total Cohort - 6 Year Outcome All Students 459 86% 4% 2% 0% 7% ELL 32 69% 0% 0% 0% 31% Not ELL 427 87% 4% 3% 0% 6%
Data presented in this report are based on data submitted by school districts to the data repository for the 2008-09 school year. Students are reported based on their date of entry in grade 9 and their last enrollment status as reported in the warehouse on July 31, 2009. The federal Family Education Rights and Privacy Act prohibits the release of personally identifiable student information. This Act precludes the publication of summary information based on fewer than five students or in which subtraction or other simple mathematical operations could be used to obtain personal information. Cells that contain the ("#") symbol have been suppressed to protect student privacy.
District-ell status Thursday, March 4, 2010 Page 136 of 301
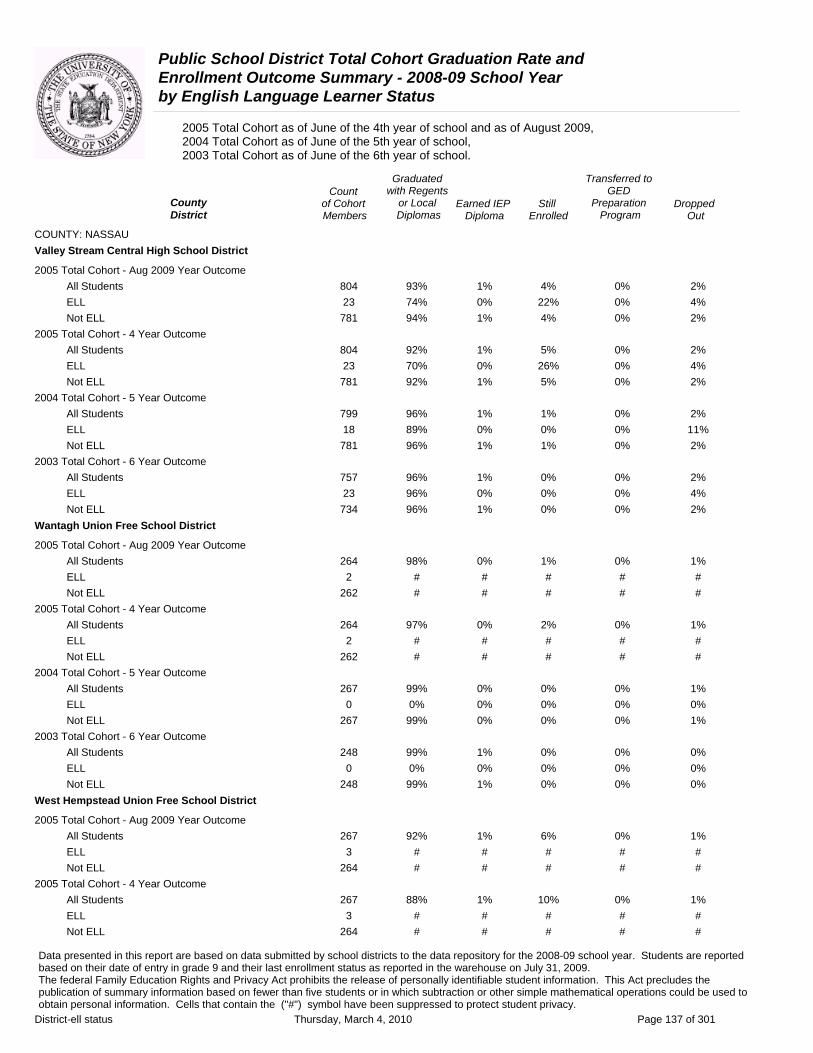
Public School District Total Cohort Graduation Rate and Enrollment Outcome Summary - 2008-09 School Year by English Language Learner Status
2005 Total Cohort as of June of the 4th year of school and as of August 2009, 2004 Total Cohort as of June of the 5th year of school, 2003 Total Cohort as of June of the 6th year of school.
Graduated Transferred to Count with Regents GED
County of Cohort or Local Earned IEP Still Preparation DroppedDistrict Members Diplomas Diploma Enrolled Program Out
COUNTY: NASSAU Valley Stream Central High School District
2005 Total Cohort - Aug 2009 Year Outcome All Students 804 93% 1% 4% 0% 2% ELL 23 74% 0% 22% 0% 4% Not ELL 781 94% 1% 4% 0% 2%
2005 Total Cohort - 4 Year Outcome All Students 804 92% 1% 5% 0% 2% ELL 23 70% 0% 26% 0% 4% Not ELL 781 92% 1% 5% 0% 2%
2004 Total Cohort - 5 Year Outcome All Students 799 96% 1% 1% 0% 2% ELL 18 89% 0% 0% 0% 11% Not ELL 781 96% 1% 1% 0% 2%
2003 Total Cohort - 6 Year Outcome All Students 757 96% 1% 0% 0% 2% ELL 23 96% 0% 0% 0% 4% Not ELL 734 96% 1% 0% 0% 2%
Wantagh Union Free School District
2005 Total Cohort - Aug 2009 Year Outcome All Students 264 98% 0% 1% 0% 1% ELL 2 # # # # # Not ELL 262 # # # # #
2005 Total Cohort - 4 Year Outcome All Students 264 97% 0% 2% 0% 1% ELL 2 # # # # # Not ELL 262 # # # # #
2004 Total Cohort - 5 Year Outcome All Students 267 99% 0% 0% 0% 1% ELL 0 0% 0% 0% 0% 0% Not ELL 267 99% 0% 0% 0% 1%
2003 Total Cohort - 6 Year Outcome All Students 248 99% 1% 0% 0% 0% ELL 0 0% 0% 0% 0% 0% Not ELL 248 99% 1% 0% 0% 0%
West Hempstead Union Free School District
2005 Total Cohort - Aug 2009 Year Outcome All Students 267 92% 1% 6% 0% 1% ELL 3 # # # # # Not ELL 264 # # # # #
2005 Total Cohort - 4 Year Outcome All Students 267 88% 1% 10% 0% 1% ELL 3 # # # # # Not ELL 264 # # # # #
Data presented in this report are based on data submitted by school districts to the data repository for the 2008-09 school year. Students are reported based on their date of entry in grade 9 and their last enrollment status as reported in the warehouse on July 31, 2009. The federal Family Education Rights and Privacy Act prohibits the release of personally identifiable student information. This Act precludes the publication of summary information based on fewer than five students or in which subtraction or other simple mathematical operations could be used to obtain personal information. Cells that contain the ("#") symbol have been suppressed to protect student privacy.
District-ell status Thursday, March 4, 2010 Page 137 of 301
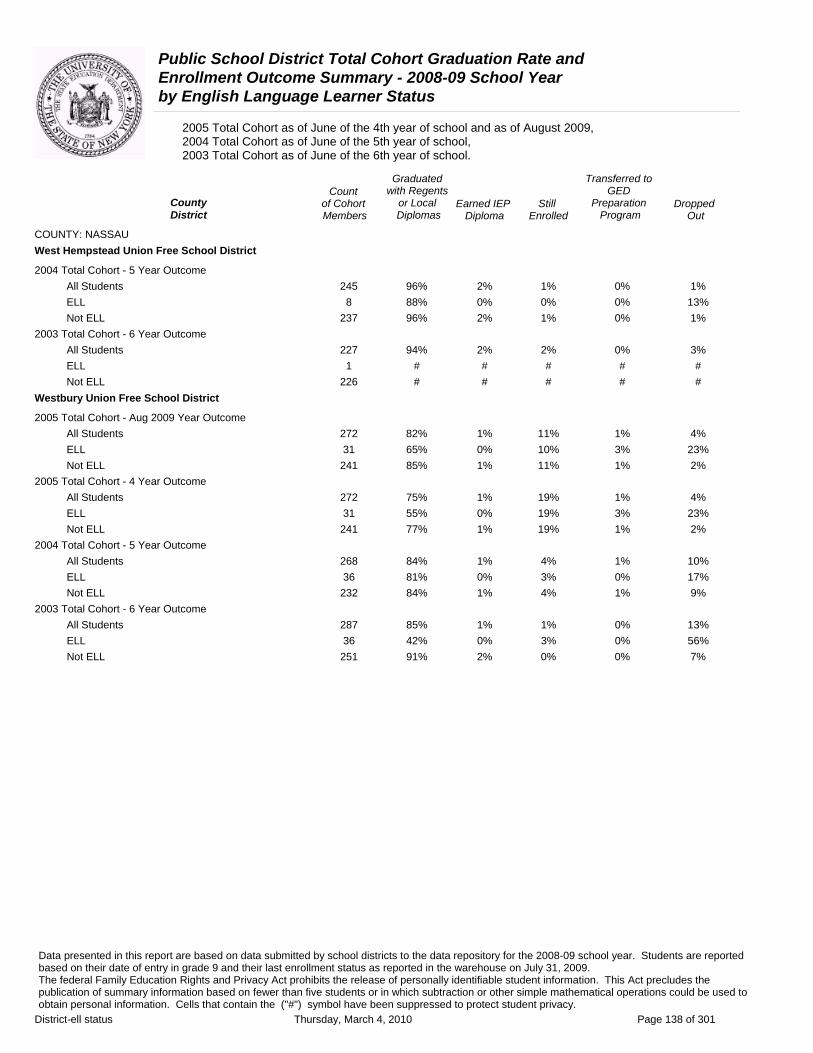
Public School District Total Cohort Graduation Rate and Enrollment Outcome Summary - 2008-09 School Year by English Language Learner Status
2005 Total Cohort as of June of the 4th year of school and as of August 2009, 2004 Total Cohort as of June of the 5th year of school, 2003 Total Cohort as of June of the 6th year of school.
Graduated Transferred to Count with Regents GED
County of Cohort or Local Earned IEP Still Preparation DroppedDistrict Members Diplomas Diploma Enrolled Program Out
COUNTY: NASSAU West Hempstead Union Free School District
2004 Total Cohort - 5 Year Outcome All Students 245 96% 2% 1% 0% 1% ELL 8 88% 0% 0% 0% 13% Not ELL 237 96% 2% 1% 0% 1%
2003 Total Cohort - 6 Year Outcome All Students 227 94% 2% 2% 0% 3% ELL 1 # # # # # Not ELL 226 # # # # #
Westbury Union Free School District
2005 Total Cohort - Aug 2009 Year Outcome All Students 272 82% 1% 11% 1% 4% ELL 31 65% 0% 10% 3% 23% Not ELL 241 85% 1% 11% 1% 2%
2005 Total Cohort - 4 Year Outcome All Students 272 75% 1% 19% 1% 4% ELL 31 55% 0% 19% 3% 23% Not ELL 241 77% 1% 19% 1% 2%
2004 Total Cohort - 5 Year Outcome All Students 268 84% 1% 4% 1% 10% ELL 36 81% 0% 3% 0% 17% Not ELL 232 84% 1% 4% 1% 9%
2003 Total Cohort - 6 Year Outcome All Students 287 85% 1% 1% 0% 13% ELL 36 42% 0% 3% 0% 56% Not ELL 251 91% 2% 0% 0% 7%
Data presented in this report are based on data submitted by school districts to the data repository for the 2008-09 school year. Students are reported based on their date of entry in grade 9 and their last enrollment status as reported in the warehouse on July 31, 2009. The federal Family Education Rights and Privacy Act prohibits the release of personally identifiable student information. This Act precludes the publication of summary information based on fewer than five students or in which subtraction or other simple mathematical operations could be used to obtain personal information. Cells that contain the ("#") symbol have been suppressed to protect student privacy.
District-ell status Thursday, March 4, 2010 Page 138 of 301

Public School District Total Cohort Graduation Rate and Enrollment Outcome Summary - 2008-09 School Year by English Language Learner Status
2005 Total Cohort as of June of the 4th year of school and as of August 2009, 2004 Total Cohort as of June of the 5th year of school, 2003 Total Cohort as of June of the 6th year of school.
Graduated Transferred to Count with Regents GED
County of Cohort or Local Earned IEP Still Preparation DroppedDistrict Members Diplomas Diploma Enrolled Program Out
COUNTY: NYC CENTRAL OFFICE N Y C Alternative Hs District
2005 Total Cohort - Aug 2009 Year Outcome All Students 32 6% 0% 13% 0% 81% ELL 10 0% 0% 10% 0% 90% Not ELL 22 9% 0% 14% 0% 77%
2005 Total Cohort - 4 Year Outcome All Students 32 6% 0% 13% 0% 81% ELL 10 0% 0% 10% 0% 90% Not ELL 22 9% 0% 14% 0% 77%
2004 Total Cohort - 5 Year Outcome All Students 217 31% 1% 22% 0% 45% ELL 65 25% 0% 17% 0% 58% Not ELL 152 34% 1% 24% 1% 39%
2003 Total Cohort - 6 Year Outcome All Students 1388 40% 2% 10% 0% 48% ELL 215 32% 1% 11% 0% 56% Not ELL 1173 41% 2% 10% 0% 47%
Data presented in this report are based on data submitted by school districts to the data repository for the 2008-09 school year. Students are reported based on their date of entry in grade 9 and their last enrollment status as reported in the warehouse on July 31, 2009. The federal Family Education Rights and Privacy Act prohibits the release of personally identifiable student information. This Act precludes the publication of summary information based on fewer than five students or in which subtraction or other simple mathematical operations could be used to obtain personal information. Cells that contain the ("#") symbol have been suppressed to protect student privacy.
District-ell status Thursday, March 4, 2010 Page 139 of 301
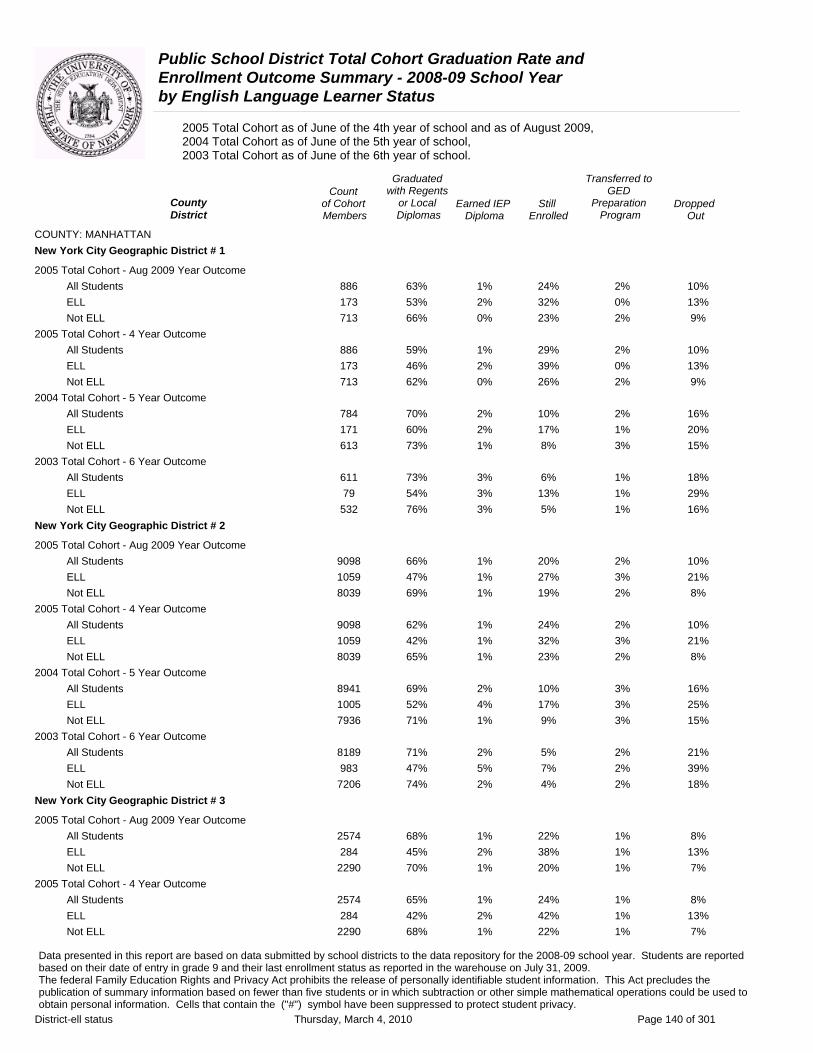
Public School District Total Cohort Graduation Rate and Enrollment Outcome Summary - 2008-09 School Year by English Language Learner Status
2005 Total Cohort as of June of the 4th year of school and as of August 2009, 2004 Total Cohort as of June of the 5th year of school, 2003 Total Cohort as of June of the 6th year of school.
Graduated Transferred to Count with Regents GED
County of Cohort or Local Earned IEP Still Preparation DroppedDistrict Members Diplomas Diploma Enrolled Program Out
COUNTY: MANHATTAN New York City Geographic District # 1
2005 Total Cohort - Aug 2009 Year Outcome All Students 886 63% 1% 24% 2% 10% ELL 173 53% 2% 32% 0% 13% Not ELL 713 66% 0% 23% 2% 9%
2005 Total Cohort - 4 Year Outcome All Students 886 59% 1% 29% 2% 10% ELL 173 46% 2% 39% 0% 13% Not ELL 713 62% 0% 26% 2% 9%
2004 Total Cohort - 5 Year Outcome All Students 784 70% 2% 10% 2% 16% ELL 171 60% 2% 17% 1% 20% Not ELL 613 73% 1% 8% 3% 15%
2003 Total Cohort - 6 Year Outcome All Students 611 73% 3% 6% 1% 18% ELL 79 54% 3% 13% 1% 29% Not ELL 532 76% 3% 5% 1% 16%
New York City Geographic District # 2
2005 Total Cohort - Aug 2009 Year Outcome All Students 9098 66% 1% 20% 2% 10% ELL 1059 47% 1% 27% 3% 21% Not ELL 8039 69% 1% 19% 2% 8%
2005 Total Cohort - 4 Year Outcome All Students 9098 62% 1% 24% 2% 10% ELL 1059 42% 1% 32% 3% 21% Not ELL 8039 65% 1% 23% 2% 8%
2004 Total Cohort - 5 Year Outcome All Students 8941 69% 2% 10% 3% 16% ELL 1005 52% 4% 17% 3% 25% Not ELL 7936 71% 1% 9% 3% 15%
2003 Total Cohort - 6 Year Outcome All Students 8189 71% 2% 5% 2% 21% ELL 983 47% 5% 7% 2% 39% Not ELL 7206 74% 2% 4% 2% 18%
New York City Geographic District # 3
2005 Total Cohort - Aug 2009 Year Outcome All Students 2574 68% 1% 22% 1% 8% ELL 284 45% 2% 38% 1% 13% Not ELL 2290 70% 1% 20% 1% 7%
2005 Total Cohort - 4 Year Outcome All Students 2574 65% 1% 24% 1% 8% ELL 284 42% 2% 42% 1% 13% Not ELL 2290 68% 1% 22% 1% 7%
Data presented in this report are based on data submitted by school districts to the data repository for the 2008-09 school year. Students are reported based on their date of entry in grade 9 and their last enrollment status as reported in the warehouse on July 31, 2009. The federal Family Education Rights and Privacy Act prohibits the release of personally identifiable student information. This Act precludes the publication of summary information based on fewer than five students or in which subtraction or other simple mathematical operations could be used to obtain personal information. Cells that contain the ("#") symbol have been suppressed to protect student privacy.
District-ell status Thursday, March 4, 2010 Page 140 of 301

Public School District Total Cohort Graduation Rate and Enrollment Outcome Summary - 2008-09 School Year by English Language Learner Status
2005 Total Cohort as of June of the 4th year of school and as of August 2009, 2004 Total Cohort as of June of the 5th year of school, 2003 Total Cohort as of June of the 6th year of school.
Graduated Transferred to Count with Regents GED
County of Cohort or Local Earned IEP Still Preparation DroppedDistrict Members Diplomas Diploma Enrolled Program Out
COUNTY: MANHATTAN New York City Geographic District # 3
2004 Total Cohort - 5 Year Outcome All Students 2449 71% 2% 11% 2% 14% ELL 244 49% 2% 18% 3% 28% Not ELL 2205 74% 2% 10% 2% 13%
2003 Total Cohort - 6 Year Outcome All Students 2175 70% 2% 5% 2% 20% ELL 236 40% 6% 9% 1% 44% Not ELL 1939 74% 2% 5% 2% 17%
New York City Geographic District # 4
2005 Total Cohort - Aug 2009 Year Outcome All Students 954 70% 2% 18% 1% 8% ELL 53 47% 11% 21% 2% 19% Not ELL 901 71% 2% 18% 1% 8%
2005 Total Cohort - 4 Year Outcome All Students 954 67% 2% 21% 1% 8% ELL 53 43% 11% 25% 2% 19% Not ELL 901 68% 2% 21% 1% 8%
2004 Total Cohort - 5 Year Outcome All Students 751 73% 5% 7% 1% 15% ELL 41 39% 22% 5% 0% 34% Not ELL 710 75% 4% 7% 1% 14%
2003 Total Cohort - 6 Year Outcome All Students 745 76% 4% 4% 1% 15% ELL 56 48% 14% 5% 0% 32% Not ELL 689 78% 3% 4% 1% 14%
New York City Geographic District # 5
2005 Total Cohort - Aug 2009 Year Outcome All Students 886 67% 2% 20% 2% 10% ELL 29 28% 0% 45% 7% 21% Not ELL 857 68% 2% 19% 2% 9%
2005 Total Cohort - 4 Year Outcome All Students 886 63% 2% 23% 2% 10% ELL 29 28% 0% 45% 7% 21% Not ELL 857 65% 2% 22% 2% 9%
2004 Total Cohort - 5 Year Outcome All Students 794 70% 3% 10% 2% 16% ELL 30 33% 13% 10% 0% 43% Not ELL 764 71% 3% 10% 2% 15%
2003 Total Cohort - 6 Year Outcome All Students 523 68% 7% 4% 2% 18% ELL 31 29% 26% 0% 3% 42% Not ELL 492 71% 5% 4% 2% 17%
Data presented in this report are based on data submitted by school districts to the data repository for the 2008-09 school year. Students are reported based on their date of entry in grade 9 and their last enrollment status as reported in the warehouse on July 31, 2009. The federal Family Education Rights and Privacy Act prohibits the release of personally identifiable student information. This Act precludes the publication of summary information based on fewer than five students or in which subtraction or other simple mathematical operations could be used to obtain personal information. Cells that contain the ("#") symbol have been suppressed to protect student privacy.
District-ell status Thursday, March 4, 2010 Page 141 of 301
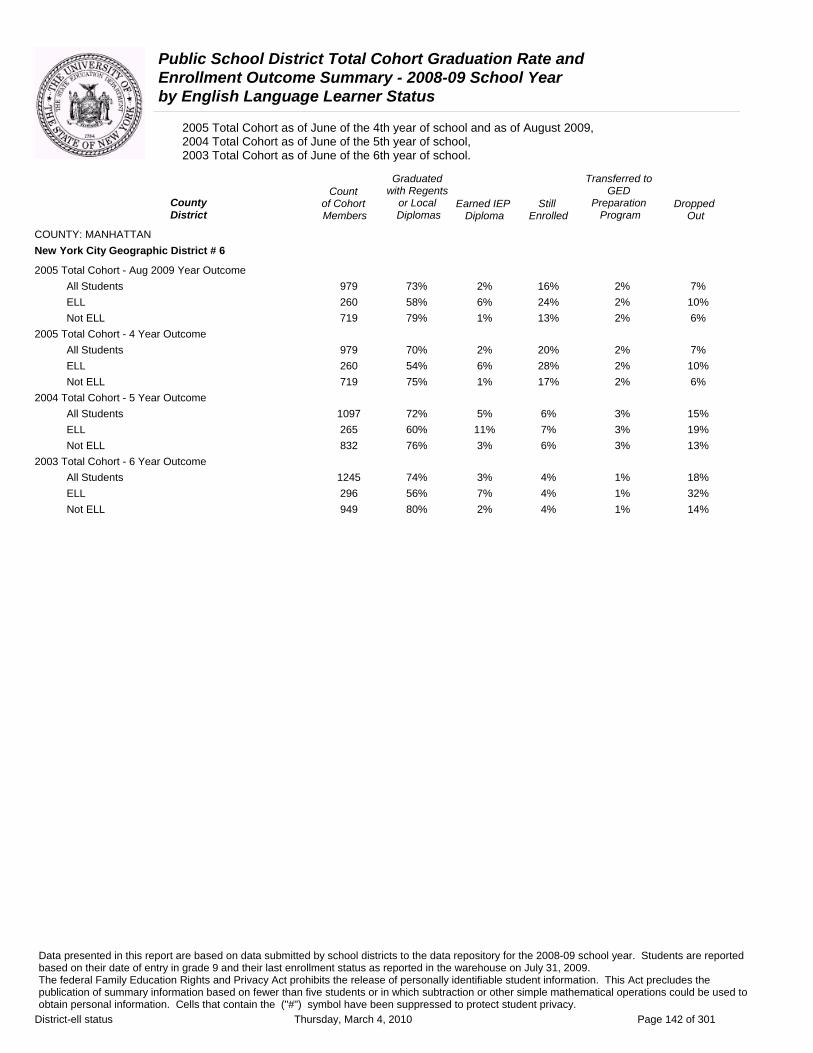
Public School District Total Cohort Graduation Rate and Enrollment Outcome Summary - 2008-09 School Year by English Language Learner Status
2005 Total Cohort as of June of the 4th year of school and as of August 2009, 2004 Total Cohort as of June of the 5th year of school, 2003 Total Cohort as of June of the 6th year of school.
Graduated Transferred to Count with Regents GED
County of Cohort or Local Earned IEP Still Preparation DroppedDistrict Members Diplomas Diploma Enrolled Program Out
COUNTY: MANHATTAN New York City Geographic District # 6
2005 Total Cohort - Aug 2009 Year Outcome All Students 979 73% 2% 16% 2% 7% ELL 260 58% 6% 24% 2% 10% Not ELL 719 79% 1% 13% 2% 6%
2005 Total Cohort - 4 Year Outcome All Students 979 70% 2% 20% 2% 7% ELL 260 54% 6% 28% 2% 10% Not ELL 719 75% 1% 17% 2% 6%
2004 Total Cohort - 5 Year Outcome All Students 1097 72% 5% 6% 3% 15% ELL 265 60% 11% 7% 3% 19% Not ELL 832 76% 3% 6% 3% 13%
2003 Total Cohort - 6 Year Outcome All Students 1245 74% 3% 4% 1% 18% ELL 296 56% 7% 4% 1% 32% Not ELL 949 80% 2% 4% 1% 14%
Data presented in this report are based on data submitted by school districts to the data repository for the 2008-09 school year. Students are reported based on their date of entry in grade 9 and their last enrollment status as reported in the warehouse on July 31, 2009. The federal Family Education Rights and Privacy Act prohibits the release of personally identifiable student information. This Act precludes the publication of summary information based on fewer than five students or in which subtraction or other simple mathematical operations could be used to obtain personal information. Cells that contain the ("#") symbol have been suppressed to protect student privacy.
District-ell status Thursday, March 4, 2010 Page 142 of 301

Public School District Total Cohort Graduation Rate and Enrollment Outcome Summary - 2008-09 School Year by English Language Learner Status
2005 Total Cohort as of June of the 4th year of school and as of August 2009, 2004 Total Cohort as of June of the 5th year of school, 2003 Total Cohort as of June of the 6th year of school.
Graduated Transferred to Count with Regents GED
County of Cohort or Local Earned IEP Still Preparation DroppedDistrict Members Diplomas Diploma Enrolled Program Out
COUNTY: BRONX New York City Geographic District # 7
2005 Total Cohort - Aug 2009 Year Outcome All Students 1584 55% 4% 25% 2% 14% ELL 138 26% 17% 28% 2% 28% Not ELL 1446 57% 3% 25% 2% 13%
2005 Total Cohort - 4 Year Outcome All Students 1584 51% 4% 29% 2% 14% ELL 138 23% 17% 30% 2% 28% Not ELL 1446 53% 3% 29% 2% 13%
2004 Total Cohort - 5 Year Outcome All Students 1494 63% 5% 9% 2% 21% ELL 143 29% 16% 10% 3% 41% Not ELL 1351 66% 4% 9% 1% 19%
2003 Total Cohort - 6 Year Outcome All Students 1302 64% 6% 4% 1% 25% ELL 137 31% 19% 7% 1% 42% Not ELL 1165 68% 4% 4% 1% 22%
New York City Geographic District # 8
2005 Total Cohort - Aug 2009 Year Outcome All Students 2869 46% 3% 30% 3% 17% ELL 297 31% 9% 36% 2% 22% Not ELL 2572 48% 3% 29% 3% 17%
2005 Total Cohort - 4 Year Outcome All Students 2869 42% 3% 35% 3% 17% ELL 297 28% 9% 39% 2% 22% Not ELL 2572 43% 3% 34% 3% 17%
2004 Total Cohort - 5 Year Outcome All Students 2931 52% 4% 14% 4% 26% ELL 304 37% 9% 14% 6% 34% Not ELL 2627 54% 3% 14% 4% 25%
2003 Total Cohort - 6 Year Outcome All Students 2669 53% 6% 9% 3% 29% ELL 319 31% 13% 8% 4% 45% Not ELL 2350 56% 5% 9% 3% 27%
New York City Geographic District # 9
2005 Total Cohort - Aug 2009 Year Outcome All Students 1718 69% 3% 15% 2% 11% ELL 178 48% 8% 20% 6% 18% Not ELL 1540 72% 2% 14% 2% 10%
2005 Total Cohort - 4 Year Outcome All Students 1718 67% 3% 18% 2% 11% ELL 178 48% 8% 20% 6% 18% Not ELL 1540 69% 2% 17% 2% 10%
Data presented in this report are based on data submitted by school districts to the data repository for the 2008-09 school year. Students are reported based on their date of entry in grade 9 and their last enrollment status as reported in the warehouse on July 31, 2009. The federal Family Education Rights and Privacy Act prohibits the release of personally identifiable student information. This Act precludes the publication of summary information based on fewer than five students or in which subtraction or other simple mathematical operations could be used to obtain personal information. Cells that contain the ("#") symbol have been suppressed to protect student privacy.
District-ell status Thursday, March 4, 2010 Page 143 of 301

Public School District Total Cohort Graduation Rate and Enrollment Outcome Summary - 2008-09 School Year by English Language Learner Status
2005 Total Cohort as of June of the 4th year of school and as of August 2009, 2004 Total Cohort as of June of the 5th year of school, 2003 Total Cohort as of June of the 6th year of school.
Graduated Transferred to Count with Regents GED
County of Cohort or Local Earned IEP Still Preparation DroppedDistrict Members Diplomas Diploma Enrolled Program Out
COUNTY: BRONX New York City Geographic District # 9
2004 Total Cohort - 5 Year Outcome All Students 1329 69% 6% 7% 3% 16% ELL 158 57% 11% 6% 6% 20% Not ELL 1171 70% 5% 7% 2% 15%
2003 Total Cohort - 6 Year Outcome All Students 997 62% 7% 6% 2% 23% ELL 148 43% 17% 7% 4% 29% Not ELL 849 65% 5% 6% 2% 22%
New York City Geographic District #10
2005 Total Cohort - Aug 2009 Year Outcome All Students 4878 64% 2% 17% 4% 13% ELL 829 43% 3% 30% 6% 18% Not ELL 4049 69% 2% 14% 3% 12%
2005 Total Cohort - 4 Year Outcome All Students 4878 61% 2% 20% 4% 13% ELL 829 37% 3% 35% 6% 18% Not ELL 4049 66% 2% 17% 3% 12%
2004 Total Cohort - 5 Year Outcome All Students 4670 67% 3% 10% 3% 18% ELL 835 46% 6% 17% 4% 27% Not ELL 3835 71% 2% 8% 2% 16%
2003 Total Cohort - 6 Year Outcome All Students 4977 64% 3% 7% 2% 23% ELL 835 37% 8% 11% 3% 41% Not ELL 4142 69% 2% 6% 2% 20%
New York City Geographic District #11
2005 Total Cohort - Aug 2009 Year Outcome All Students 2543 61% 3% 23% 2% 11% ELL 255 47% 6% 35% 2% 11% Not ELL 2288 63% 3% 21% 2% 11%
2005 Total Cohort - 4 Year Outcome All Students 2543 57% 3% 26% 2% 11% ELL 255 39% 6% 42% 2% 11% Not ELL 2288 59% 3% 25% 2% 11%
2004 Total Cohort - 5 Year Outcome All Students 2707 66% 5% 10% 3% 16% ELL 277 50% 6% 16% 4% 23% Not ELL 2430 68% 5% 9% 3% 15%
2003 Total Cohort - 6 Year Outcome All Students 2492 62% 5% 8% 3% 23% ELL 289 35% 11% 7% 3% 44% Not ELL 2203 65% 4% 8% 3% 20%
Data presented in this report are based on data submitted by school districts to the data repository for the 2008-09 school year. Students are reported based on their date of entry in grade 9 and their last enrollment status as reported in the warehouse on July 31, 2009. The federal Family Education Rights and Privacy Act prohibits the release of personally identifiable student information. This Act precludes the publication of summary information based on fewer than five students or in which subtraction or other simple mathematical operations could be used to obtain personal information. Cells that contain the ("#") symbol have been suppressed to protect student privacy.
District-ell status Thursday, March 4, 2010 Page 144 of 301
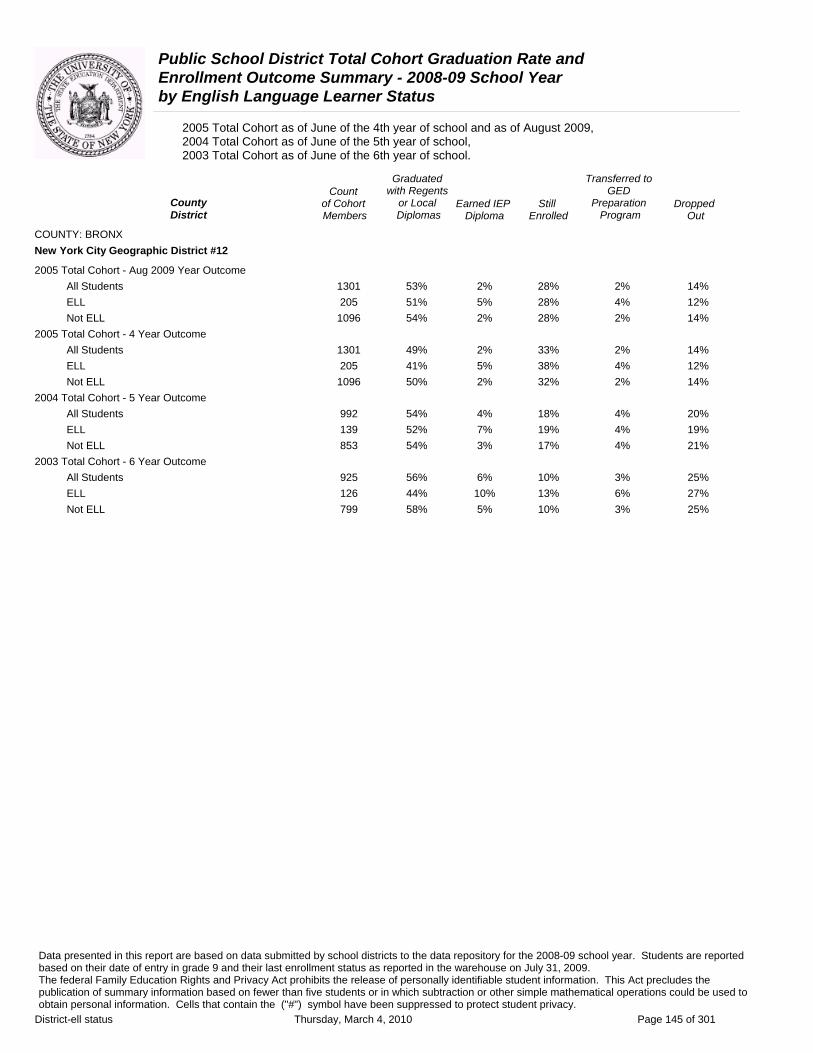
Public School District Total Cohort Graduation Rate and Enrollment Outcome Summary - 2008-09 School Year by English Language Learner Status
2005 Total Cohort as of June of the 4th year of school and as of August 2009, 2004 Total Cohort as of June of the 5th year of school, 2003 Total Cohort as of June of the 6th year of school.
Graduated Transferred to Count with Regents GED
County of Cohort or Local Earned IEP Still Preparation DroppedDistrict Members Diplomas Diploma Enrolled Program Out
COUNTY: BRONX New York City Geographic District #12
2005 Total Cohort - Aug 2009 Year Outcome All Students 1301 53% 2% 28% 2% 14% ELL 205 51% 5% 28% 4% 12% Not ELL 1096 54% 2% 28% 2% 14%
2005 Total Cohort - 4 Year Outcome All Students 1301 49% 2% 33% 2% 14% ELL 205 41% 5% 38% 4% 12% Not ELL 1096 50% 2% 32% 2% 14%
2004 Total Cohort - 5 Year Outcome All Students 992 54% 4% 18% 4% 20% ELL 139 52% 7% 19% 4% 19% Not ELL 853 54% 3% 17% 4% 21%
2003 Total Cohort - 6 Year Outcome All Students 925 56% 6% 10% 3% 25% ELL 126 44% 10% 13% 6% 27% Not ELL 799 58% 5% 10% 3% 25%
Data presented in this report are based on data submitted by school districts to the data repository for the 2008-09 school year. Students are reported based on their date of entry in grade 9 and their last enrollment status as reported in the warehouse on July 31, 2009. The federal Family Education Rights and Privacy Act prohibits the release of personally identifiable student information. This Act precludes the publication of summary information based on fewer than five students or in which subtraction or other simple mathematical operations could be used to obtain personal information. Cells that contain the ("#") symbol have been suppressed to protect student privacy.
District-ell status Thursday, March 4, 2010 Page 145 of 301
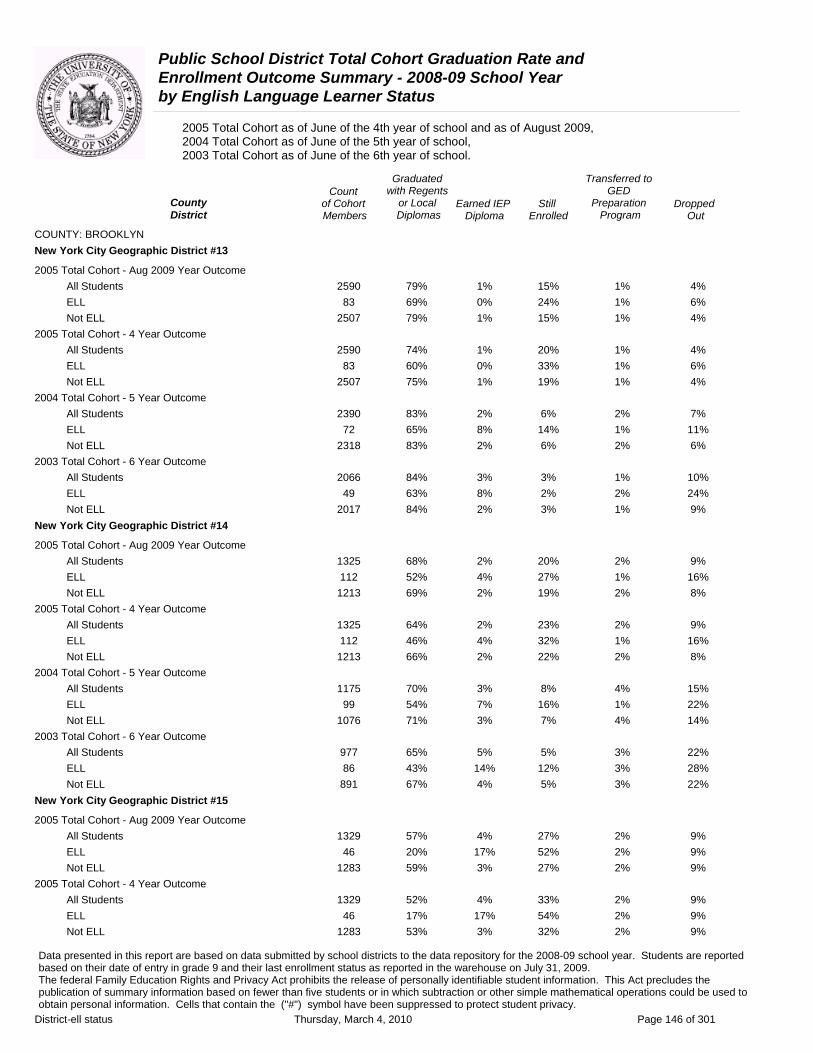
Public School District Total Cohort Graduation Rate and Enrollment Outcome Summary - 2008-09 School Year by English Language Learner Status
2005 Total Cohort as of June of the 4th year of school and as of August 2009, 2004 Total Cohort as of June of the 5th year of school, 2003 Total Cohort as of June of the 6th year of school.
Graduated Transferred to Count with Regents GED
County of Cohort or Local Earned IEP Still Preparation DroppedDistrict Members Diplomas Diploma Enrolled Program Out
COUNTY: BROOKLYN New York City Geographic District #13
2005 Total Cohort - Aug 2009 Year Outcome All Students 2590 79% 1% 15% 1% 4% ELL 83 69% 0% 24% 1% 6% Not ELL 2507 79% 1% 15% 1% 4%
2005 Total Cohort - 4 Year Outcome All Students 2590 74% 1% 20% 1% 4% ELL 83 60% 0% 33% 1% 6% Not ELL 2507 75% 1% 19% 1% 4%
2004 Total Cohort - 5 Year Outcome All Students 2390 83% 2% 6% 2% 7% ELL 72 65% 8% 14% 1% 11% Not ELL 2318 83% 2% 6% 2% 6%
2003 Total Cohort - 6 Year Outcome All Students 2066 84% 3% 3% 1% 10% ELL 49 63% 8% 2% 2% 24% Not ELL 2017 84% 2% 3% 1% 9%
New York City Geographic District #14
2005 Total Cohort - Aug 2009 Year Outcome All Students 1325 68% 2% 20% 2% 9% ELL 112 52% 4% 27% 1% 16% Not ELL 1213 69% 2% 19% 2% 8%
2005 Total Cohort - 4 Year Outcome All Students 1325 64% 2% 23% 2% 9% ELL 112 46% 4% 32% 1% 16% Not ELL 1213 66% 2% 22% 2% 8%
2004 Total Cohort - 5 Year Outcome All Students 1175 70% 3% 8% 4% 15% ELL 99 54% 7% 16% 1% 22% Not ELL 1076 71% 3% 7% 4% 14%
2003 Total Cohort - 6 Year Outcome All Students 977 65% 5% 5% 3% 22% ELL 86 43% 14% 12% 3% 28% Not ELL 891 67% 4% 5% 3% 22%
New York City Geographic District #15
2005 Total Cohort - Aug 2009 Year Outcome All Students 1329 57% 4% 27% 2% 9% ELL 46 20% 17% 52% 2% 9% Not ELL 1283 59% 3% 27% 2% 9%
2005 Total Cohort - 4 Year Outcome All Students 1329 52% 4% 33% 2% 9% ELL 46 17% 17% 54% 2% 9% Not ELL 1283 53% 3% 32% 2% 9%
Data presented in this report are based on data submitted by school districts to the data repository for the 2008-09 school year. Students are reported based on their date of entry in grade 9 and their last enrollment status as reported in the warehouse on July 31, 2009. The federal Family Education Rights and Privacy Act prohibits the release of personally identifiable student information. This Act precludes the publication of summary information based on fewer than five students or in which subtraction or other simple mathematical operations could be used to obtain personal information. Cells that contain the ("#") symbol have been suppressed to protect student privacy.
District-ell status Thursday, March 4, 2010 Page 146 of 301

Public School District Total Cohort Graduation Rate and Enrollment Outcome Summary - 2008-09 School Year by English Language Learner Status
2005 Total Cohort as of June of the 4th year of school and as of August 2009, 2004 Total Cohort as of June of the 5th year of school, 2003 Total Cohort as of June of the 6th year of school.
Graduated Transferred to Count with Regents GED
County of Cohort or Local Earned IEP Still Preparation DroppedDistrict Members Diplomas Diploma Enrolled Program Out
COUNTY: BROOKLYN New York City Geographic District #15
2004 Total Cohort - 5 Year Outcome All Students 1396 57% 4% 18% 3% 18% ELL 38 37% 29% 18% 3% 13% Not ELL 1358 58% 3% 18% 3% 18%
2003 Total Cohort - 6 Year Outcome All Students 1105 63% 5% 9% 2% 21% ELL 47 34% 21% 11% 4% 30% Not ELL 1058 64% 4% 9% 2% 20%
New York City Geographic District #16
2005 Total Cohort - Aug 2009 Year Outcome All Students 949 46% 6% 33% 3% 12% ELL 15 27% 13% 33% 0% 27% Not ELL 934 46% 6% 33% 3% 11%
2005 Total Cohort - 4 Year Outcome All Students 949 39% 6% 40% 3% 12% ELL 15 20% 13% 40% 0% 27% Not ELL 934 39% 6% 40% 3% 11%
2004 Total Cohort - 5 Year Outcome All Students 1060 49% 7% 14% 8% 22% ELL 15 27% 13% 7% 13% 40% Not ELL 1045 49% 7% 14% 8% 21%
2003 Total Cohort - 6 Year Outcome All Students 986 50% 5% 4% 11% 31% ELL 27 33% 7% 15% 7% 37% Not ELL 959 50% 5% 4% 11% 31%
New York City Geographic District #17
2005 Total Cohort - Aug 2009 Year Outcome All Students 2300 62% 1% 26% 2% 8% ELL 166 47% 3% 37% 2% 11% Not ELL 2134 64% 1% 25% 2% 8%
2005 Total Cohort - 4 Year Outcome All Students 2300 59% 1% 30% 2% 8% ELL 166 42% 3% 42% 2% 11% Not ELL 2134 60% 1% 29% 2% 8%
2004 Total Cohort - 5 Year Outcome All Students 2210 70% 3% 11% 3% 12% ELL 138 55% 9% 20% 4% 12% Not ELL 2072 71% 3% 11% 3% 12%
2003 Total Cohort - 6 Year Outcome All Students 1864 72% 3% 6% 2% 17% ELL 62 42% 5% 6% 2% 45% Not ELL 1802 73% 3% 6% 2% 16%
Data presented in this report are based on data submitted by school districts to the data repository for the 2008-09 school year. Students are reported based on their date of entry in grade 9 and their last enrollment status as reported in the warehouse on July 31, 2009. The federal Family Education Rights and Privacy Act prohibits the release of personally identifiable student information. This Act precludes the publication of summary information based on fewer than five students or in which subtraction or other simple mathematical operations could be used to obtain personal information. Cells that contain the ("#") symbol have been suppressed to protect student privacy.
District-ell status Thursday, March 4, 2010 Page 147 of 301

Public School District Total Cohort Graduation Rate and Enrollment Outcome Summary - 2008-09 School Year by English Language Learner Status
2005 Total Cohort as of June of the 4th year of school and as of August 2009, 2004 Total Cohort as of June of the 5th year of school, 2003 Total Cohort as of June of the 6th year of school.
Graduated Transferred to Count with Regents GED
County of Cohort or Local Earned IEP Still Preparation DroppedDistrict Members Diplomas Diploma Enrolled Program Out
COUNTY: BROOKLYN New York City Geographic District #18
2005 Total Cohort - Aug 2009 Year Outcome All Students 1432 38% 2% 39% 3% 17% ELL 163 51% 4% 33% 1% 11% Not ELL 1269 37% 2% 40% 4% 18%
2005 Total Cohort - 4 Year Outcome All Students 1432 35% 2% 42% 3% 17% ELL 163 47% 4% 37% 1% 11% Not ELL 1269 33% 2% 43% 4% 18%
2004 Total Cohort - 5 Year Outcome All Students 1582 44% 4% 19% 6% 27% ELL 140 47% 3% 26% 1% 22% Not ELL 1442 44% 4% 19% 6% 28%
2003 Total Cohort - 6 Year Outcome All Students 1787 50% 4% 10% 2% 33% ELL 130 45% 8% 12% 1% 33% Not ELL 1657 50% 4% 10% 3% 33%
New York City Geographic District #19
2005 Total Cohort - Aug 2009 Year Outcome All Students 1767 52% 3% 28% 3% 15% ELL 239 30% 3% 46% 2% 20% Not ELL 1528 55% 3% 25% 3% 14%
2005 Total Cohort - 4 Year Outcome All Students 1767 48% 3% 32% 3% 15% ELL 239 25% 3% 50% 2% 20% Not ELL 1528 51% 3% 29% 3% 14%
2004 Total Cohort - 5 Year Outcome All Students 1674 53% 4% 15% 4% 24% ELL 211 37% 6% 25% 1% 31% Not ELL 1463 56% 3% 14% 4% 23%
2003 Total Cohort - 6 Year Outcome All Students 1877 51% 3% 9% 2% 35% ELL 275 36% 5% 7% 1% 51% Not ELL 1602 53% 3% 9% 2% 32%
New York City Geographic District #20
2005 Total Cohort - Aug 2009 Year Outcome All Students 2976 62% 1% 22% 1% 14% ELL 722 48% 1% 31% 1% 20% Not ELL 2254 66% 1% 19% 1% 12%
2005 Total Cohort - 4 Year Outcome All Students 2976 58% 1% 26% 1% 14% ELL 722 44% 1% 34% 1% 20% Not ELL 2254 62% 1% 23% 1% 12%
Data presented in this report are based on data submitted by school districts to the data repository for the 2008-09 school year. Students are reported based on their date of entry in grade 9 and their last enrollment status as reported in the warehouse on July 31, 2009. The federal Family Education Rights and Privacy Act prohibits the release of personally identifiable student information. This Act precludes the publication of summary information based on fewer than five students or in which subtraction or other simple mathematical operations could be used to obtain personal information. Cells that contain the ("#") symbol have been suppressed to protect student privacy.
District-ell status Thursday, March 4, 2010 Page 148 of 301

Public School District Total Cohort Graduation Rate and Enrollment Outcome Summary - 2008-09 School Year by English Language Learner Status
2005 Total Cohort as of June of the 4th year of school and as of August 2009, 2004 Total Cohort as of June of the 5th year of school, 2003 Total Cohort as of June of the 6th year of school.
Graduated Transferred to Count with Regents GED
County of Cohort or Local Earned IEP Still Preparation DroppedDistrict Members Diplomas Diploma Enrolled Program Out
COUNTY: BROOKLYN New York City Geographic District #20
2004 Total Cohort - 5 Year Outcome All Students 3022 66% 2% 10% 1% 20% ELL 599 51% 4% 15% 1% 29% Not ELL 2423 70% 2% 9% 1% 18%
2003 Total Cohort - 6 Year Outcome All Students 2944 67% 2% 4% 1% 26% ELL 512 41% 5% 8% 1% 44% Not ELL 2432 73% 1% 3% 1% 22%
New York City Geographic District #21
2005 Total Cohort - Aug 2009 Year Outcome All Students 3067 62% 2% 24% 2% 11% ELL 327 37% 4% 38% 2% 19% Not ELL 2740 65% 1% 22% 2% 10%
2005 Total Cohort - 4 Year Outcome All Students 3067 58% 2% 28% 2% 11% ELL 327 31% 4% 43% 2% 19% Not ELL 2740 61% 1% 26% 2% 10%
2004 Total Cohort - 5 Year Outcome All Students 3127 64% 4% 10% 3% 19% ELL 328 44% 6% 17% 3% 30% Not ELL 2799 67% 3% 9% 3% 18%
2003 Total Cohort - 6 Year Outcome All Students 3154 66% 3% 5% 2% 24% ELL 341 46% 4% 6% 1% 43% Not ELL 2813 69% 3% 5% 2% 22%
New York City Geographic District #22
2005 Total Cohort - Aug 2009 Year Outcome All Students 2795 72% 1% 15% 1% 11% ELL 199 45% 2% 27% 1% 26% Not ELL 2596 74% 1% 14% 1% 10%
2005 Total Cohort - 4 Year Outcome All Students 2795 68% 1% 19% 1% 11% ELL 199 40% 2% 32% 1% 26% Not ELL 2596 71% 1% 18% 1% 10%
2004 Total Cohort - 5 Year Outcome All Students 3202 76% 2% 6% 1% 16% ELL 216 47% 3% 9% 0% 41% Not ELL 2986 78% 2% 6% 1% 14%
2003 Total Cohort - 6 Year Outcome All Students 3160 77% 1% 2% 1% 18% ELL 197 44% 5% 4% 1% 46% Not ELL 2963 79% 1% 2% 1% 16%
Data presented in this report are based on data submitted by school districts to the data repository for the 2008-09 school year. Students are reported based on their date of entry in grade 9 and their last enrollment status as reported in the warehouse on July 31, 2009. The federal Family Education Rights and Privacy Act prohibits the release of personally identifiable student information. This Act precludes the publication of summary information based on fewer than five students or in which subtraction or other simple mathematical operations could be used to obtain personal information. Cells that contain the ("#") symbol have been suppressed to protect student privacy.
District-ell status Thursday, March 4, 2010 Page 149 of 301

Public School District Total Cohort Graduation Rate and Enrollment Outcome Summary - 2008-09 School Year by English Language Learner Status
2005 Total Cohort as of June of the 4th year of school and as of August 2009, 2004 Total Cohort as of June of the 5th year of school, 2003 Total Cohort as of June of the 6th year of school.
Graduated Transferred to Count with Regents GED
County of Cohort or Local Earned IEP Still Preparation DroppedDistrict Members Diplomas Diploma Enrolled Program Out
COUNTY: BROOKLYN New York City Geographic District #23
2005 Total Cohort - Aug 2009 Year Outcome All Students 600 47% 2% 40% 2% 10% ELL 10 0% 10% 70% 0% 20% Not ELL 590 47% 2% 40% 2% 9%
2005 Total Cohort - 4 Year Outcome All Students 600 44% 2% 43% 2% 10% ELL 10 0% 10% 70% 0% 20% Not ELL 590 45% 2% 42% 2% 9%
2004 Total Cohort - 5 Year Outcome All Students 429 63% 6% 15% 3% 12% ELL 14 43% 21% 14% 0% 21% Not ELL 415 64% 6% 15% 4% 12%
2003 Total Cohort - 6 Year Outcome All Students 226 56% 8% 9% 1% 26% ELL 7 14% 43% 0% 14% 29% Not ELL 219 58% 7% 9% 0% 26%
New York City Geographic District #32
2005 Total Cohort - Aug 2009 Year Outcome All Students 788 51% 1% 30% 2% 16% ELL 102 49% 4% 32% 2% 13% Not ELL 686 51% 1% 30% 1% 16%
2005 Total Cohort - 4 Year Outcome All Students 788 48% 1% 33% 2% 16% ELL 102 44% 4% 37% 2% 13% Not ELL 686 49% 1% 33% 1% 16%
2004 Total Cohort - 5 Year Outcome All Students 791 57% 2% 14% 2% 25% ELL 90 57% 3% 13% 0% 27% Not ELL 701 57% 2% 14% 2% 24%
2003 Total Cohort - 6 Year Outcome All Students 791 62% 3% 4% 1% 30% ELL 90 46% 10% 3% 1% 40% Not ELL 701 64% 2% 4% 1% 28%
Data presented in this report are based on data submitted by school districts to the data repository for the 2008-09 school year. Students are reported based on their date of entry in grade 9 and their last enrollment status as reported in the warehouse on July 31, 2009. The federal Family Education Rights and Privacy Act prohibits the release of personally identifiable student information. This Act precludes the publication of summary information based on fewer than five students or in which subtraction or other simple mathematical operations could be used to obtain personal information. Cells that contain the ("#") symbol have been suppressed to protect student privacy.
District-ell status Thursday, March 4, 2010 Page 150 of 301
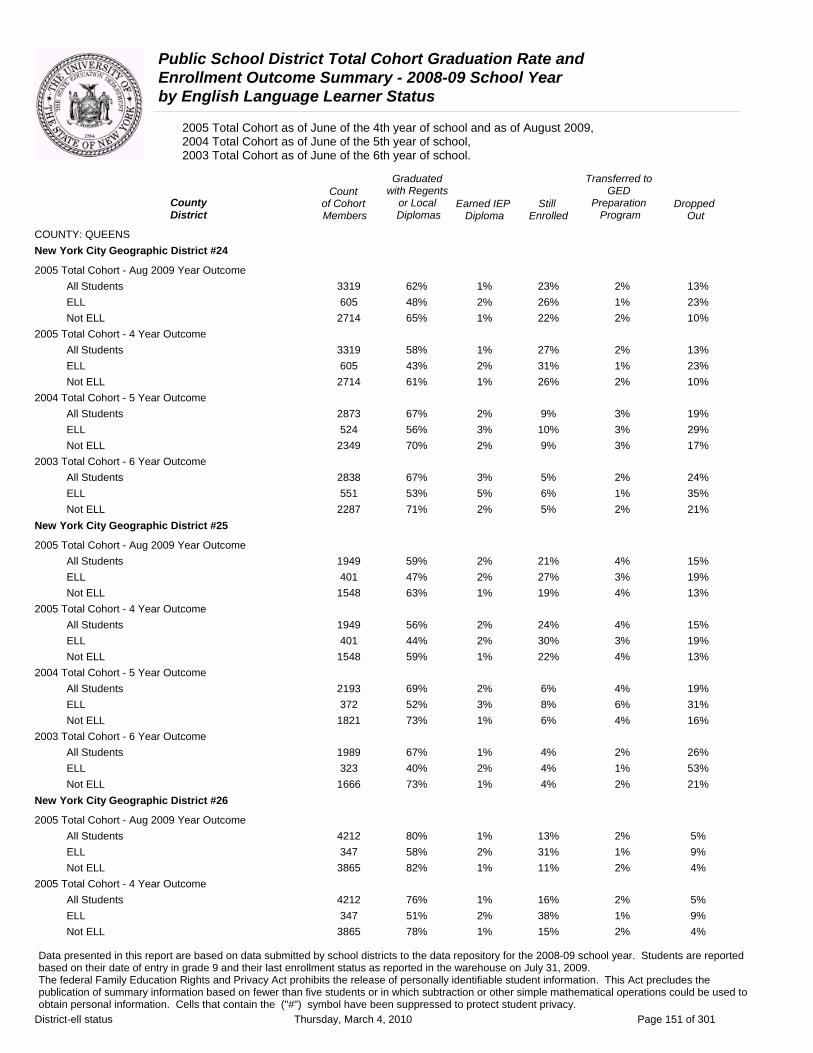
Public School District Total Cohort Graduation Rate and Enrollment Outcome Summary - 2008-09 School Year by English Language Learner Status
2005 Total Cohort as of June of the 4th year of school and as of August 2009, 2004 Total Cohort as of June of the 5th year of school, 2003 Total Cohort as of June of the 6th year of school.
Graduated Transferred to Count with Regents GED
County of Cohort or Local Earned IEP Still Preparation DroppedDistrict Members Diplomas Diploma Enrolled Program Out
COUNTY: QUEENS New York City Geographic District #24
2005 Total Cohort - Aug 2009 Year Outcome All Students 3319 62% 1% 23% 2% 13% ELL 605 48% 2% 26% 1% 23% Not ELL 2714 65% 1% 22% 2% 10%
2005 Total Cohort - 4 Year Outcome All Students 3319 58% 1% 27% 2% 13% ELL 605 43% 2% 31% 1% 23% Not ELL 2714 61% 1% 26% 2% 10%
2004 Total Cohort - 5 Year Outcome All Students 2873 67% 2% 9% 3% 19% ELL 524 56% 3% 10% 3% 29% Not ELL 2349 70% 2% 9% 3% 17%
2003 Total Cohort - 6 Year Outcome All Students 2838 67% 3% 5% 2% 24% ELL 551 53% 5% 6% 1% 35% Not ELL 2287 71% 2% 5% 2% 21%
New York City Geographic District #25
2005 Total Cohort - Aug 2009 Year Outcome All Students 1949 59% 2% 21% 4% 15% ELL 401 47% 2% 27% 3% 19% Not ELL 1548 63% 1% 19% 4% 13%
2005 Total Cohort - 4 Year Outcome All Students 1949 56% 2% 24% 4% 15% ELL 401 44% 2% 30% 3% 19% Not ELL 1548 59% 1% 22% 4% 13%
2004 Total Cohort - 5 Year Outcome All Students 2193 69% 2% 6% 4% 19% ELL 372 52% 3% 8% 6% 31% Not ELL 1821 73% 1% 6% 4% 16%
2003 Total Cohort - 6 Year Outcome All Students 1989 67% 1% 4% 2% 26% ELL 323 40% 2% 4% 1% 53% Not ELL 1666 73% 1% 4% 2% 21%
New York City Geographic District #26
2005 Total Cohort - Aug 2009 Year Outcome All Students 4212 80% 1% 13% 2% 5% ELL 347 58% 2% 31% 1% 9% Not ELL 3865 82% 1% 11% 2% 4%
2005 Total Cohort - 4 Year Outcome All Students 4212 76% 1% 16% 2% 5% ELL 347 51% 2% 38% 1% 9% Not ELL 3865 78% 1% 15% 2% 4%
Data presented in this report are based on data submitted by school districts to the data repository for the 2008-09 school year. Students are reported based on their date of entry in grade 9 and their last enrollment status as reported in the warehouse on July 31, 2009. The federal Family Education Rights and Privacy Act prohibits the release of personally identifiable student information. This Act precludes the publication of summary information based on fewer than five students or in which subtraction or other simple mathematical operations could be used to obtain personal information. Cells that contain the ("#") symbol have been suppressed to protect student privacy.
District-ell status Thursday, March 4, 2010 Page 151 of 301
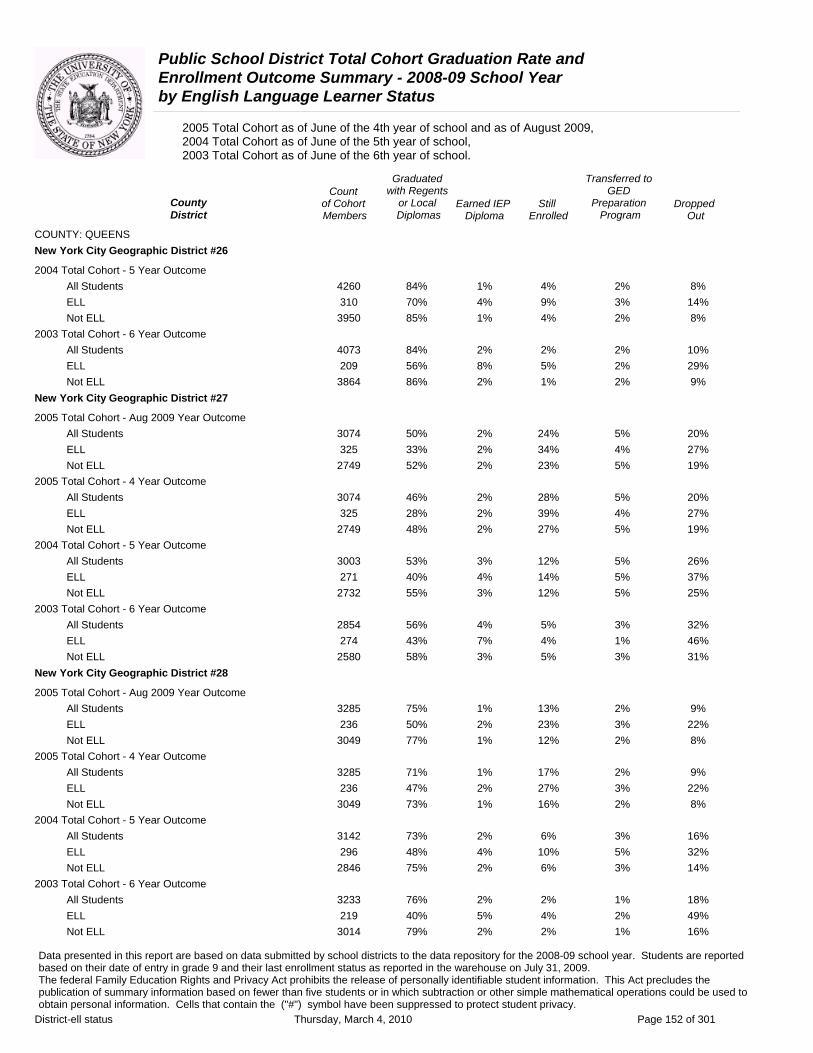
Public School District Total Cohort Graduation Rate and Enrollment Outcome Summary - 2008-09 School Year by English Language Learner Status
2005 Total Cohort as of June of the 4th year of school and as of August 2009, 2004 Total Cohort as of June of the 5th year of school, 2003 Total Cohort as of June of the 6th year of school.
Graduated Transferred to Count with Regents GED
County of Cohort or Local Earned IEP Still Preparation DroppedDistrict Members Diplomas Diploma Enrolled Program Out
COUNTY: QUEENS New York City Geographic District #26
2004 Total Cohort - 5 Year Outcome All Students 4260 84% 1% 4% 2% 8% ELL 310 70% 4% 9% 3% 14% Not ELL 3950 85% 1% 4% 2% 8%
2003 Total Cohort - 6 Year Outcome All Students 4073 84% 2% 2% 2% 10% ELL 209 56% 8% 5% 2% 29% Not ELL 3864 86% 2% 1% 2% 9%
New York City Geographic District #27
2005 Total Cohort - Aug 2009 Year Outcome All Students 3074 50% 2% 24% 5% 20% ELL 325 33% 2% 34% 4% 27% Not ELL 2749 52% 2% 23% 5% 19%
2005 Total Cohort - 4 Year Outcome All Students 3074 46% 2% 28% 5% 20% ELL 325 28% 2% 39% 4% 27% Not ELL 2749 48% 2% 27% 5% 19%
2004 Total Cohort - 5 Year Outcome All Students 3003 53% 3% 12% 5% 26% ELL 271 40% 4% 14% 5% 37% Not ELL 2732 55% 3% 12% 5% 25%
2003 Total Cohort - 6 Year Outcome All Students 2854 56% 4% 5% 3% 32% ELL 274 43% 7% 4% 1% 46% Not ELL 2580 58% 3% 5% 3% 31%
New York City Geographic District #28
2005 Total Cohort - Aug 2009 Year Outcome All Students 3285 75% 1% 13% 2% 9% ELL 236 50% 2% 23% 3% 22% Not ELL 3049 77% 1% 12% 2% 8%
2005 Total Cohort - 4 Year Outcome All Students 3285 71% 1% 17% 2% 9% ELL 236 47% 2% 27% 3% 22% Not ELL 3049 73% 1% 16% 2% 8%
2004 Total Cohort - 5 Year Outcome All Students 3142 73% 2% 6% 3% 16% ELL 296 48% 4% 10% 5% 32% Not ELL 2846 75% 2% 6% 3% 14%
2003 Total Cohort - 6 Year Outcome All Students 3233 76% 2% 2% 1% 18% ELL 219 40% 5% 4% 2% 49% Not ELL 3014 79% 2% 2% 1% 16%
Data presented in this report are based on data submitted by school districts to the data repository for the 2008-09 school year. Students are reported based on their date of entry in grade 9 and their last enrollment status as reported in the warehouse on July 31, 2009. The federal Family Education Rights and Privacy Act prohibits the release of personally identifiable student information. This Act precludes the publication of summary information based on fewer than five students or in which subtraction or other simple mathematical operations could be used to obtain personal information. Cells that contain the ("#") symbol have been suppressed to protect student privacy.
District-ell status Thursday, March 4, 2010 Page 152 of 301
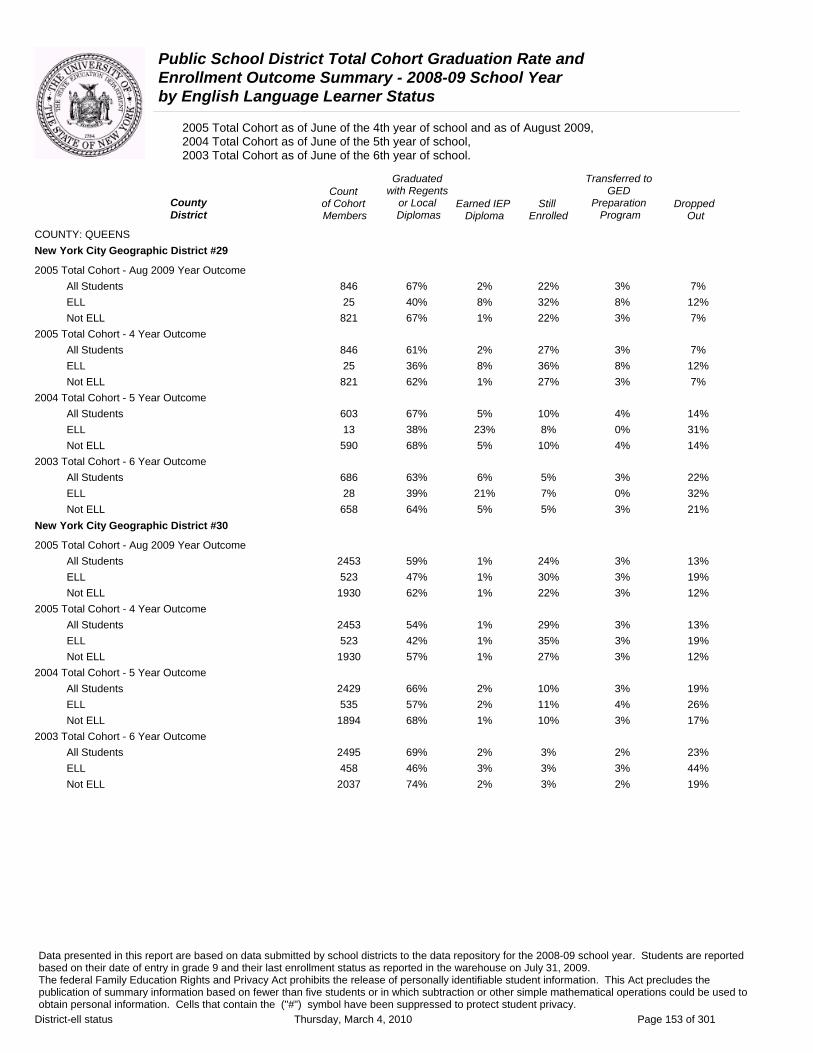
Public School District Total Cohort Graduation Rate and Enrollment Outcome Summary - 2008-09 School Year by English Language Learner Status
2005 Total Cohort as of June of the 4th year of school and as of August 2009, 2004 Total Cohort as of June of the 5th year of school, 2003 Total Cohort as of June of the 6th year of school.
Graduated Transferred to Count with Regents GED
County of Cohort or Local Earned IEP Still Preparation DroppedDistrict Members Diplomas Diploma Enrolled Program Out
COUNTY: QUEENS New York City Geographic District #29
2005 Total Cohort - Aug 2009 Year Outcome All Students 846 67% 2% 22% 3% 7% ELL 25 40% 8% 32% 8% 12% Not ELL 821 67% 1% 22% 3% 7%
2005 Total Cohort - 4 Year Outcome All Students 846 61% 2% 27% 3% 7% ELL 25 36% 8% 36% 8% 12% Not ELL 821 62% 1% 27% 3% 7%
2004 Total Cohort - 5 Year Outcome All Students 603 67% 5% 10% 4% 14% ELL 13 38% 23% 8% 0% 31% Not ELL 590 68% 5% 10% 4% 14%
2003 Total Cohort - 6 Year Outcome All Students 686 63% 6% 5% 3% 22% ELL 28 39% 21% 7% 0% 32% Not ELL 658 64% 5% 5% 3% 21%
New York City Geographic District #30
2005 Total Cohort - Aug 2009 Year Outcome All Students 2453 59% 1% 24% 3% 13% ELL 523 47% 1% 30% 3% 19% Not ELL 1930 62% 1% 22% 3% 12%
2005 Total Cohort - 4 Year Outcome All Students 2453 54% 1% 29% 3% 13% ELL 523 42% 1% 35% 3% 19% Not ELL 1930 57% 1% 27% 3% 12%
2004 Total Cohort - 5 Year Outcome All Students 2429 66% 2% 10% 3% 19% ELL 535 57% 2% 11% 4% 26% Not ELL 1894 68% 1% 10% 3% 17%
2003 Total Cohort - 6 Year Outcome All Students 2495 69% 2% 3% 2% 23% ELL 458 46% 3% 3% 3% 44% Not ELL 2037 74% 2% 3% 2% 19%
Data presented in this report are based on data submitted by school districts to the data repository for the 2008-09 school year. Students are reported based on their date of entry in grade 9 and their last enrollment status as reported in the warehouse on July 31, 2009. The federal Family Education Rights and Privacy Act prohibits the release of personally identifiable student information. This Act precludes the publication of summary information based on fewer than five students or in which subtraction or other simple mathematical operations could be used to obtain personal information. Cells that contain the ("#") symbol have been suppressed to protect student privacy.
District-ell status Thursday, March 4, 2010 Page 153 of 301

Public School District Total Cohort Graduation Rate and Enrollment Outcome Summary - 2008-09 School Year by English Language Learner Status
2005 Total Cohort as of June of the 4th year of school and as of August 2009, 2004 Total Cohort as of June of the 5th year of school, 2003 Total Cohort as of June of the 6th year of school.
Graduated Transferred to Count with Regents GED
County of Cohort or Local Earned IEP Still Preparation DroppedDistrict Members Diplomas Diploma Enrolled Program Out
COUNTY: RICHMOND New York City Geographic District #31
2005 Total Cohort - Aug 2009 Year Outcome All Students 4415 72% 2% 15% 4% 8% ELL 182 36% 11% 29% 4% 20% Not ELL 4233 74% 1% 14% 4% 7%
2005 Total Cohort - 4 Year Outcome All Students 4415 70% 2% 17% 4% 8% ELL 182 32% 11% 32% 4% 20% Not ELL 4233 72% 1% 16% 4% 7%
2004 Total Cohort - 5 Year Outcome All Students 4238 74% 3% 5% 5% 13% ELL 143 38% 7% 11% 8% 36% Not ELL 4095 75% 3% 5% 5% 12%
2003 Total Cohort - 6 Year Outcome All Students 4219 75% 3% 4% 2% 16% ELL 192 52% 9% 5% 4% 31% Not ELL 4027 76% 3% 3% 2% 15%
Data presented in this report are based on data submitted by school districts to the data repository for the 2008-09 school year. Students are reported based on their date of entry in grade 9 and their last enrollment status as reported in the warehouse on July 31, 2009. The federal Family Education Rights and Privacy Act prohibits the release of personally identifiable student information. This Act precludes the publication of summary information based on fewer than five students or in which subtraction or other simple mathematical operations could be used to obtain personal information. Cells that contain the ("#") symbol have been suppressed to protect student privacy.
District-ell status Thursday, March 4, 2010 Page 154 of 301
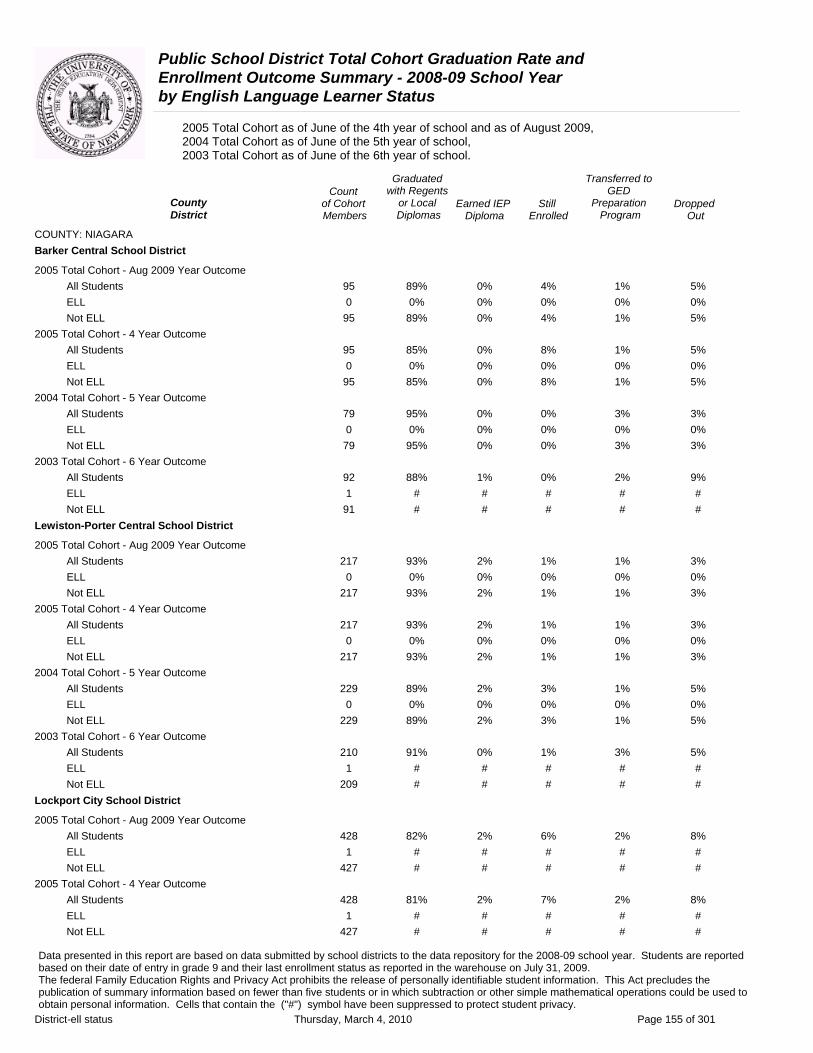
Public School District Total Cohort Graduation Rate and Enrollment Outcome Summary - 2008-09 School Year by English Language Learner Status
2005 Total Cohort as of June of the 4th year of school and as of August 2009, 2004 Total Cohort as of June of the 5th year of school, 2003 Total Cohort as of June of the 6th year of school.
Graduated Transferred to Count with Regents GED
County District
of Cohort Members
or Local Diplomas
Earned IEP Diploma
Still Enrolled
Preparation Program
Dropped Out
COUNTY: NIAGARA Barker Central School District
2005 Total Cohort - Aug 2009 Year Outcome All Students 95 89% 0% 4% 1% 5% ELL 0 0% 0% 0% 0% 0% Not ELL 95 89% 0% 4% 1% 5%
2005 Total Cohort - 4 Year Outcome All Students 95 85% 0% 8% 1% 5% ELL 0 0% 0% 0% 0% 0% Not ELL 95 85% 0% 8% 1% 5%
2004 Total Cohort - 5 Year Outcome All Students 79 95% 0% 0% 3% 3% ELL 0 0% 0% 0% 0% 0% Not ELL 79 95% 0% 0% 3% 3%
2003 Total Cohort - 6 Year Outcome All Students 92 88% 1% 0% 2% 9% ELL 1 # # # # # Not ELL 91 # # # # #
Lewiston-Porter Central School District
2005 Total Cohort - Aug 2009 Year Outcome All Students 217 93% 2% 1% 1% 3% ELL 0 0% 0% 0% 0% 0% Not ELL 217 93% 2% 1% 1% 3%
2005 Total Cohort - 4 Year Outcome All Students 217 93% 2% 1% 1% 3% ELL 0 0% 0% 0% 0% 0% Not ELL 217 93% 2% 1% 1% 3%
2004 Total Cohort - 5 Year Outcome All Students 229 89% 2% 3% 1% 5% ELL 0 0% 0% 0% 0% 0% Not ELL 229 89% 2% 3% 1% 5%
2003 Total Cohort - 6 Year Outcome All Students 210 91% 0% 1% 3% 5% ELL 1 # # # # # Not ELL 209 # # # # #
Lockport City School District
2005 Total Cohort - Aug 2009 Year Outcome All Students 428 82% 2% 6% 2% 8% ELL 1 # # # # # Not ELL 427 # # # # #
2005 Total Cohort - 4 Year Outcome All Students 428 81% 2% 7% 2% 8% ELL 1 # # # # # Not ELL 427 # # # # #
Data presented in this report are based on data submitted by school districts to the data repository for the 2008-09 school year. Students are reported based on their date of entry in grade 9 and their last enrollment status as reported in the warehouse on July 31, 2009. The federal Family Education Rights and Privacy Act prohibits the release of personally identifiable student information. This Act precludes the publication of summary information based on fewer than five students or in which subtraction or other simple mathematical operations could be used to obtain personal information. Cells that contain the ("#") symbol have been suppressed to protect student privacy.
District-ell status Thursday, March 4, 2010 Page 155 of 301

Public School District Total Cohort Graduation Rate and Enrollment Outcome Summary - 2008-09 School Year by English Language Learner Status
2005 Total Cohort as of June of the 4th year of school and as of August 2009, 2004 Total Cohort as of June of the 5th year of school, 2003 Total Cohort as of June of the 6th year of school.
Graduated Transferred to Count with Regents GED
County District
of Cohort Members
or Local Diplomas
Earned IEP Diploma
Still Enrolled
Preparation Program
Dropped Out
COUNTY: NIAGARA Lockport City School District
2004 Total Cohort - 5 Year Outcome All Students 449 80% 2% 4% 2% 11% ELL 0 0% 0% 0% 0% 0% Not ELL 449 80% 2% 4% 2% 11%
2003 Total Cohort - 6 Year Outcome All Students 449 75% 4% 2% 4% 16% ELL 1 # # # # # Not ELL 448 # # # # #
Newfane Central School District
2005 Total Cohort - Aug 2009 Year Outcome All Students 176 81% 2% 8% 7% 3% ELL 0 0% 0% 0% 0% 0% Not ELL 176 81% 2% 8% 7% 3%
2005 Total Cohort - 4 Year Outcome All Students 176 77% 2% 11% 7% 3% ELL 0 0% 0% 0% 0% 0% Not ELL 176 77% 2% 11% 7% 3%
2004 Total Cohort - 5 Year Outcome All Students 178 86% 2% 4% 4% 3% ELL 0 0% 0% 0% 0% 0% Not ELL 178 86% 2% 4% 4% 3%
2003 Total Cohort - 6 Year Outcome All Students 165 84% 4% 4% 1% 8% ELL 0 0% 0% 0% 0% 0% Not ELL 165 84% 4% 4% 1% 8%
Niagara Falls City School District
2005 Total Cohort - Aug 2009 Year Outcome All Students 622 73% 1% 7% 5% 13% ELL 2 # # # # # Not ELL 620 # # # # #
2005 Total Cohort - 4 Year Outcome All Students 622 68% 1% 12% 5% 13% ELL 2 # # # # # Not ELL 620 # # # # #
2004 Total Cohort - 5 Year Outcome All Students 618 76% 3% 5% 3% 13% ELL 1 # # # # # Not ELL 617 # # # # #
2003 Total Cohort - 6 Year Outcome All Students 583 72% 3% 3% 0% 22% ELL 2 # # # # # Not ELL 581 # # # # #
Data presented in this report are based on data submitted by school districts to the data repository for the 2008-09 school year. Students are reported based on their date of entry in grade 9 and their last enrollment status as reported in the warehouse on July 31, 2009. The federal Family Education Rights and Privacy Act prohibits the release of personally identifiable student information. This Act precludes the publication of summary information based on fewer than five students or in which subtraction or other simple mathematical operations could be used to obtain personal information. Cells that contain the ("#") symbol have been suppressed to protect student privacy.
District-ell status Thursday, March 4, 2010 Page 156 of 301
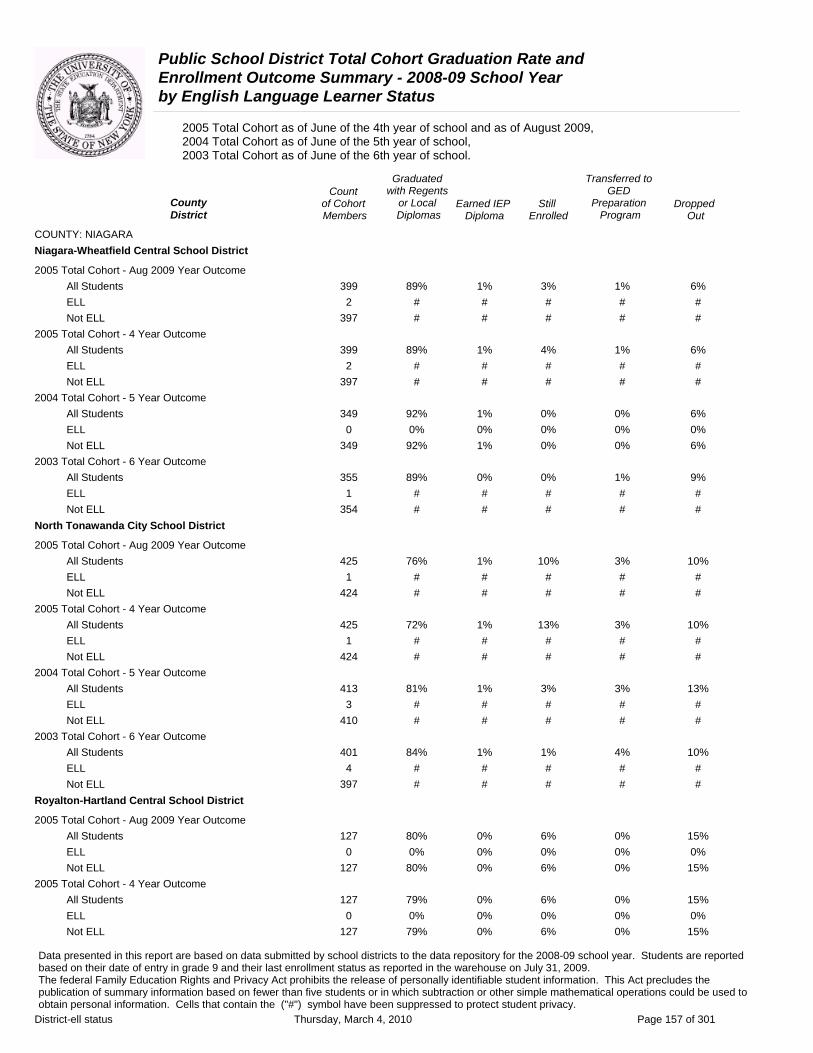
Public School District Total Cohort Graduation Rate and Enrollment Outcome Summary - 2008-09 School Year by English Language Learner Status
2005 Total Cohort as of June of the 4th year of school and as of August 2009, 2004 Total Cohort as of June of the 5th year of school, 2003 Total Cohort as of June of the 6th year of school.
Graduated Transferred to Count with Regents GED
County of Cohort or Local Earned IEP Still Preparation DroppedDistrict Members Diplomas Diploma Enrolled Program Out
COUNTY: NIAGARA Niagara-Wheatfield Central School District
2005 Total Cohort - Aug 2009 Year Outcome All Students 399 89% 1% 3% 1% 6% ELL 2 # # # # # Not ELL 397 # # # # #
2005 Total Cohort - 4 Year Outcome All Students 399 89% 1% 4% 1% 6% ELL 2 # # # # # Not ELL 397 # # # # #
2004 Total Cohort - 5 Year Outcome All Students 349 92% 1% 0% 0% 6% ELL 0 0% 0% 0% 0% 0% Not ELL 349 92% 1% 0% 0% 6%
2003 Total Cohort - 6 Year Outcome All Students 355 89% 0% 0% 1% 9% ELL 1 # # # # # Not ELL 354 # # # # #
North Tonawanda City School District
2005 Total Cohort - Aug 2009 Year Outcome All Students 425 76% 1% 10% 3% 10% ELL 1 # # # # # Not ELL 424 # # # # #
2005 Total Cohort - 4 Year Outcome All Students 425 72% 1% 13% 3% 10% ELL 1 # # # # # Not ELL 424 # # # # #
2004 Total Cohort - 5 Year Outcome All Students 413 81% 1% 3% 3% 13% ELL 3 # # # # # Not ELL 410 # # # # #
2003 Total Cohort - 6 Year Outcome All Students 401 84% 1% 1% 4% 10% ELL 4 # # # # # Not ELL 397 # # # # #
Royalton-Hartland Central School District
2005 Total Cohort - Aug 2009 Year Outcome All Students 127 80% 0% 6% 0% 15% ELL 0 0% 0% 0% 0% 0% Not ELL 127 80% 0% 6% 0% 15%
2005 Total Cohort - 4 Year Outcome All Students 127 79% 0% 6% 0% 15% ELL 0 0% 0% 0% 0% 0% Not ELL 127 79% 0% 6% 0% 15%
Data presented in this report are based on data submitted by school districts to the data repository for the 2008-09 school year. Students are reported based on their date of entry in grade 9 and their last enrollment status as reported in the warehouse on July 31, 2009. The federal Family Education Rights and Privacy Act prohibits the release of personally identifiable student information. This Act precludes the publication of summary information based on fewer than five students or in which subtraction or other simple mathematical operations could be used to obtain personal information. Cells that contain the ("#") symbol have been suppressed to protect student privacy.
District-ell status Thursday, March 4, 2010 Page 157 of 301

Public School District Total Cohort Graduation Rate and Enrollment Outcome Summary - 2008-09 School Year by English Language Learner Status
2005 Total Cohort as of June of the 4th year of school and as of August 2009, 2004 Total Cohort as of June of the 5th year of school, 2003 Total Cohort as of June of the 6th year of school.
Graduated Transferred to Count with Regents GED
County of Cohort or Local Earned IEP Still Preparation DroppedDistrict Members Diplomas Diploma Enrolled Program Out
COUNTY: NIAGARA Royalton-Hartland Central School District
2004 Total Cohort - 5 Year Outcome All Students 122 86% 2% 3% 0% 8% ELL 0 0% 0% 0% 0% 0% Not ELL 122 86% 2% 3% 0% 8%
2003 Total Cohort - 6 Year Outcome All Students 153 82% 5% 1% 1% 12% ELL 0 0% 0% 0% 0% 0% Not ELL 153 82% 5% 1% 1% 12%
Starpoint Central School District
2005 Total Cohort - Aug 2009 Year Outcome All Students 230 90% 3% 1% 1% 6% ELL 0 0% 0% 0% 0% 0% Not ELL 230 90% 3% 1% 1% 6%
2005 Total Cohort - 4 Year Outcome All Students 230 89% 3% 2% 1% 6% ELL 0 0% 0% 0% 0% 0% Not ELL 230 89% 3% 2% 1% 6%
2004 Total Cohort - 5 Year Outcome All Students 272 90% 2% 1% 2% 5% ELL 0 0% 0% 0% 0% 0% Not ELL 272 90% 2% 1% 2% 5%
2003 Total Cohort - 6 Year Outcome All Students 237 89% 3% 0% 1% 7% ELL 1 # # # # # Not ELL 236 # # # # #
Wilson Central School District
2005 Total Cohort - Aug 2009 Year Outcome All Students 128 87% 2% 5% 1% 6% ELL 0 0% 0% 0% 0% 0% Not ELL 128 87% 2% 5% 1% 6%
2005 Total Cohort - 4 Year Outcome All Students 128 87% 2% 5% 1% 6% ELL 0 0% 0% 0% 0% 0% Not ELL 128 87% 2% 5% 1% 6%
2004 Total Cohort - 5 Year Outcome All Students 151 86% 3% 1% 1% 8% ELL 0 0% 0% 0% 0% 0% Not ELL 151 86% 3% 1% 1% 8%
2003 Total Cohort - 6 Year Outcome All Students 114 90% 3% 4% 0% 4% ELL 0 0% 0% 0% 0% 0% Not ELL 114 90% 3% 4% 0% 4%
Data presented in this report are based on data submitted by school districts to the data repository for the 2008-09 school year. Students are reported based on their date of entry in grade 9 and their last enrollment status as reported in the warehouse on July 31, 2009. The federal Family Education Rights and Privacy Act prohibits the release of personally identifiable student information. This Act precludes the publication of summary information based on fewer than five students or in which subtraction or other simple mathematical operations could be used to obtain personal information. Cells that contain the ("#") symbol have been suppressed to protect student privacy.
District-ell status Thursday, March 4, 2010 Page 158 of 301

Public School District Total Cohort Graduation Rate and Enrollment Outcome Summary - 2008-09 School Year by English Language Learner Status
2005 Total Cohort as of June of the 4th year of school and as of August 2009, 2004 Total Cohort as of June of the 5th year of school, 2003 Total Cohort as of June of the 6th year of school.
Graduated Transferred to Count with Regents GED
County of Cohort or Local Earned IEP Still Preparation DroppedDistrict Members Diplomas Diploma Enrolled Program Out
COUNTY: ONEIDA Adirondack Central School District
2005 Total Cohort - Aug 2009 Year Outcome All Students 109 85% 1% 9% 1% 4% ELL 0 0% 0% 0% 0% 0% Not ELL 109 85% 1% 9% 1% 4%
2005 Total Cohort - 4 Year Outcome All Students 109 85% 1% 9% 1% 4% ELL 0 0% 0% 0% 0% 0% Not ELL 109 85% 1% 9% 1% 4%
2004 Total Cohort - 5 Year Outcome All Students 124 84% 2% 2% 2% 9% ELL 0 0% 0% 0% 0% 0% Not ELL 124 84% 2% 2% 2% 9%
2003 Total Cohort - 6 Year Outcome All Students 125 80% 1% 2% 2% 16% ELL 0 0% 0% 0% 0% 0% Not ELL 125 80% 1% 2% 2% 16%
Camden Central School District
2005 Total Cohort - Aug 2009 Year Outcome All Students 230 81% 0% 6% 4% 9% ELL 0 0% 0% 0% 0% 0% Not ELL 230 81% 0% 6% 4% 9%
2005 Total Cohort - 4 Year Outcome All Students 230 80% 0% 7% 4% 9% ELL 0 0% 0% 0% 0% 0% Not ELL 230 80% 0% 7% 4% 9%
2004 Total Cohort - 5 Year Outcome All Students 233 77% 3% 5% 4% 10% ELL 0 0% 0% 0% 0% 0% Not ELL 233 77% 3% 5% 4% 10%
2003 Total Cohort - 6 Year Outcome All Students 225 85% 3% 1% 2% 8% ELL 0 0% 0% 0% 0% 0% Not ELL 225 85% 3% 1% 2% 8%
Clinton Central School District
2005 Total Cohort - Aug 2009 Year Outcome All Students 123 95% 1% 2% 0% 2% ELL 0 0% 0% 0% 0% 0% Not ELL 123 95% 1% 2% 0% 2%
2005 Total Cohort - 4 Year Outcome All Students 123 93% 1% 3% 0% 2% ELL 0 0% 0% 0% 0% 0% Not ELL 123 93% 1% 3% 0% 2%
Data presented in this report are based on data submitted by school districts to the data repository for the 2008-09 school year. Students are reported based on their date of entry in grade 9 and their last enrollment status as reported in the warehouse on July 31, 2009. The federal Family Education Rights and Privacy Act prohibits the release of personally identifiable student information. This Act precludes the publication of summary information based on fewer than five students or in which subtraction or other simple mathematical operations could be used to obtain personal information. Cells that contain the ("#") symbol have been suppressed to protect student privacy.
District-ell status Thursday, March 4, 2010 Page 159 of 301
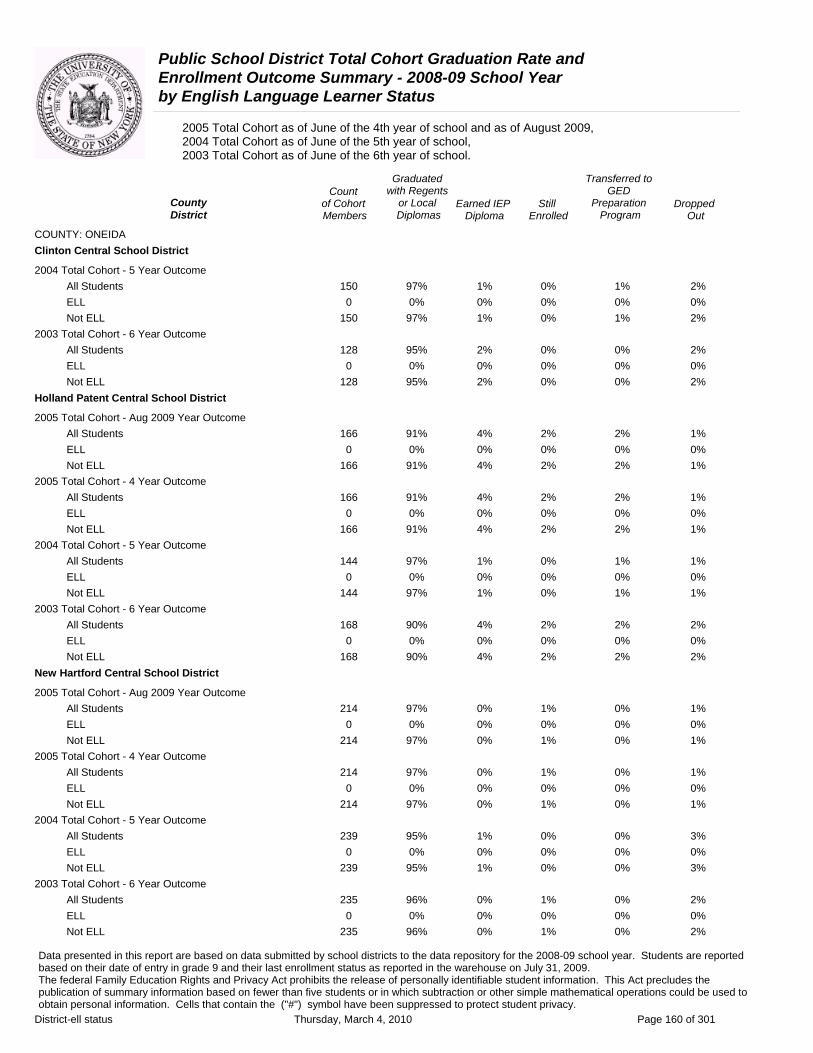
Public School District Total Cohort Graduation Rate and Enrollment Outcome Summary - 2008-09 School Year by English Language Learner Status
2005 Total Cohort as of June of the 4th year of school and as of August 2009, 2004 Total Cohort as of June of the 5th year of school, 2003 Total Cohort as of June of the 6th year of school.
Graduated Transferred to Count with Regents GED
County of Cohort or Local Earned IEP Still Preparation DroppedDistrict Members Diplomas Diploma Enrolled Program Out
COUNTY: ONEIDA Clinton Central School District
2004 Total Cohort - 5 Year Outcome All Students 150 97% 1% 0% 1% 2% ELL 0 0% 0% 0% 0% 0% Not ELL 150 97% 1% 0% 1% 2%
2003 Total Cohort - 6 Year Outcome All Students 128 95% 2% 0% 0% 2% ELL 0 0% 0% 0% 0% 0% Not ELL 128 95% 2% 0% 0% 2%
Holland Patent Central School District
2005 Total Cohort - Aug 2009 Year Outcome All Students 166 91% 4% 2% 2% 1% ELL 0 0% 0% 0% 0% 0% Not ELL 166 91% 4% 2% 2% 1%
2005 Total Cohort - 4 Year Outcome All Students 166 91% 4% 2% 2% 1% ELL 0 0% 0% 0% 0% 0% Not ELL 166 91% 4% 2% 2% 1%
2004 Total Cohort - 5 Year Outcome All Students 144 97% 1% 0% 1% 1% ELL 0 0% 0% 0% 0% 0% Not ELL 144 97% 1% 0% 1% 1%
2003 Total Cohort - 6 Year Outcome All Students 168 90% 4% 2% 2% 2% ELL 0 0% 0% 0% 0% 0% Not ELL 168 90% 4% 2% 2% 2%
New Hartford Central School District
2005 Total Cohort - Aug 2009 Year Outcome All Students 214 97% 0% 1% 0% 1% ELL 0 0% 0% 0% 0% 0% Not ELL 214 97% 0% 1% 0% 1%
2005 Total Cohort - 4 Year Outcome All Students 214 97% 0% 1% 0% 1% ELL 0 0% 0% 0% 0% 0% Not ELL 214 97% 0% 1% 0% 1%
2004 Total Cohort - 5 Year Outcome All Students 239 95% 1% 0% 0% 3% ELL 0 0% 0% 0% 0% 0% Not ELL 239 95% 1% 0% 0% 3%
2003 Total Cohort - 6 Year Outcome All Students 235 96% 0% 1% 0% 2% ELL 0 0% 0% 0% 0% 0% Not ELL 235 96% 0% 1% 0% 2%
Data presented in this report are based on data submitted by school districts to the data repository for the 2008-09 school year. Students are reported based on their date of entry in grade 9 and their last enrollment status as reported in the warehouse on July 31, 2009. The federal Family Education Rights and Privacy Act prohibits the release of personally identifiable student information. This Act precludes the publication of summary information based on fewer than five students or in which subtraction or other simple mathematical operations could be used to obtain personal information. Cells that contain the ("#") symbol have been suppressed to protect student privacy.
District-ell status Thursday, March 4, 2010 Page 160 of 301

Public School District Total Cohort Graduation Rate and Enrollment Outcome Summary - 2008-09 School Year by English Language Learner Status
2005 Total Cohort as of June of the 4th year of school and as of August 2009, 2004 Total Cohort as of June of the 5th year of school, 2003 Total Cohort as of June of the 6th year of school.
Graduated Transferred to Count with Regents GED
County of Cohort or Local Earned IEP Still Preparation DroppedDistrict Members Diplomas Diploma Enrolled Program Out
COUNTY: ONEIDA New York Mills Union Free School District
2005 Total Cohort - Aug 2009 Year Outcome All Students 37 86% 5% 8% 0% 0% ELL 0 0% 0% 0% 0% 0% Not ELL 37 86% 5% 8% 0% 0%
2005 Total Cohort - 4 Year Outcome All Students 37 86% 5% 8% 0% 0% ELL 0 0% 0% 0% 0% 0% Not ELL 37 86% 5% 8% 0% 0%
2004 Total Cohort - 5 Year Outcome All Students 49 92% 2% 2% 0% 4% ELL 0 0% 0% 0% 0% 0% Not ELL 49 92% 2% 2% 0% 4%
2003 Total Cohort - 6 Year Outcome All Students 55 85% 5% 0% 0% 9% ELL 2 # # # # # Not ELL 53 # # # # #
Oriskany Central School District
2005 Total Cohort - Aug 2009 Year Outcome All Students 57 96% 0% 0% 0% 4% ELL 0 0% 0% 0% 0% 0% Not ELL 57 96% 0% 0% 0% 4%
2005 Total Cohort - 4 Year Outcome All Students 57 96% 0% 0% 0% 4% ELL 0 0% 0% 0% 0% 0% Not ELL 57 96% 0% 0% 0% 4%
2004 Total Cohort - 5 Year Outcome All Students 66 88% 0% 3% 2% 8% ELL 0 0% 0% 0% 0% 0% Not ELL 66 88% 0% 3% 2% 8%
2003 Total Cohort - 6 Year Outcome All Students 55 95% 0% 2% 0% 4% ELL 0 0% 0% 0% 0% 0% Not ELL 55 95% 0% 2% 0% 4%
Remsen Central School District
2005 Total Cohort - Aug 2009 Year Outcome All Students 54 87% 0% 13% 0% 0% ELL 0 0% 0% 0% 0% 0% Not ELL 54 87% 0% 13% 0% 0%
2005 Total Cohort - 4 Year Outcome All Students 54 87% 0% 13% 0% 0% ELL 0 0% 0% 0% 0% 0% Not ELL 54 87% 0% 13% 0% 0%
Data presented in this report are based on data submitted by school districts to the data repository for the 2008-09 school year. Students are reported based on their date of entry in grade 9 and their last enrollment status as reported in the warehouse on July 31, 2009. The federal Family Education Rights and Privacy Act prohibits the release of personally identifiable student information. This Act precludes the publication of summary information based on fewer than five students or in which subtraction or other simple mathematical operations could be used to obtain personal information. Cells that contain the ("#") symbol have been suppressed to protect student privacy.
District-ell status Thursday, March 4, 2010 Page 161 of 301

Public School District Total Cohort Graduation Rate and Enrollment Outcome Summary - 2008-09 School Year by English Language Learner Status
2005 Total Cohort as of June of the 4th year of school and as of August 2009, 2004 Total Cohort as of June of the 5th year of school, 2003 Total Cohort as of June of the 6th year of school.
Graduated Transferred to Count with Regents GED
County of Cohort or Local Earned IEP Still Preparation DroppedDistrict Members Diplomas Diploma Enrolled Program Out
COUNTY: ONEIDA Remsen Central School District
2004 Total Cohort - 5 Year Outcome All Students 57 88% 9% 2% 0% 2% ELL 0 0% 0% 0% 0% 0% Not ELL 57 88% 9% 2% 0% 2%
2003 Total Cohort - 6 Year Outcome All Students 45 98% 0% 2% 0% 0% ELL 0 0% 0% 0% 0% 0% Not ELL 45 98% 0% 2% 0% 0%
Rome City School District
2005 Total Cohort - Aug 2009 Year Outcome All Students 497 71% 1% 12% 3% 13% ELL 3 # # # # # Not ELL 494 # # # # #
2005 Total Cohort - 4 Year Outcome All Students 497 70% 1% 13% 3% 13% ELL 3 # # # # # Not ELL 494 # # # # #
2004 Total Cohort - 5 Year Outcome All Students 425 80% 3% 1% 2% 13% ELL 0 0% 0% 0% 0% 0% Not ELL 425 80% 3% 1% 2% 13%
2003 Total Cohort - 6 Year Outcome All Students 488 75% 4% 6% 2% 12% ELL 1 # # # # # Not ELL 487 # # # # #
Sauquoit Valley Central School District
2005 Total Cohort - Aug 2009 Year Outcome All Students 128 83% 5% 4% 3% 5% ELL 0 0% 0% 0% 0% 0% Not ELL 128 83% 5% 4% 3% 5%
2005 Total Cohort - 4 Year Outcome All Students 128 82% 5% 5% 3% 5% ELL 0 0% 0% 0% 0% 0% Not ELL 128 82% 5% 5% 3% 5%
2004 Total Cohort - 5 Year Outcome All Students 115 88% 3% 2% 1% 7% ELL 0 0% 0% 0% 0% 0% Not ELL 115 88% 3% 2% 1% 7%
2003 Total Cohort - 6 Year Outcome All Students 127 89% 3% 4% 2% 2% ELL 0 0% 0% 0% 0% 0% Not ELL 127 89% 3% 4% 2% 2%
Data presented in this report are based on data submitted by school districts to the data repository for the 2008-09 school year. Students are reported based on their date of entry in grade 9 and their last enrollment status as reported in the warehouse on July 31, 2009. The federal Family Education Rights and Privacy Act prohibits the release of personally identifiable student information. This Act precludes the publication of summary information based on fewer than five students or in which subtraction or other simple mathematical operations could be used to obtain personal information. Cells that contain the ("#") symbol have been suppressed to protect student privacy.
District-ell status Thursday, March 4, 2010 Page 162 of 301
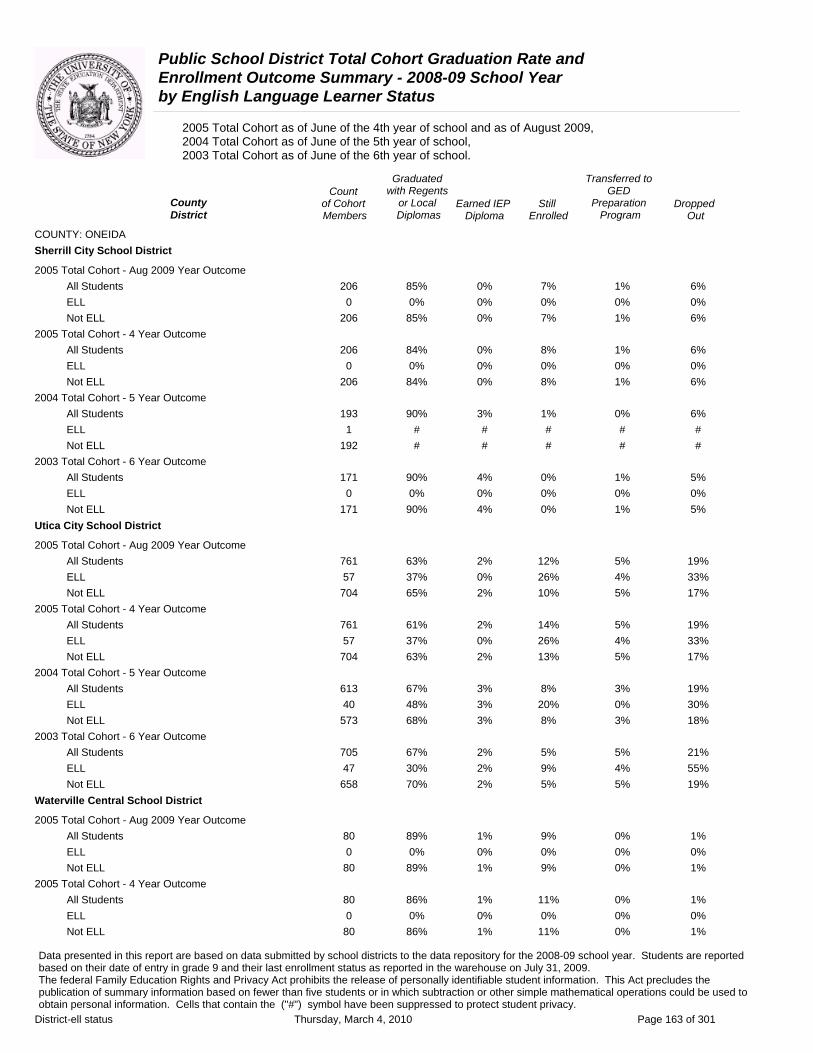
Public School District Total Cohort Graduation Rate and Enrollment Outcome Summary - 2008-09 School Year by English Language Learner Status
2005 Total Cohort as of June of the 4th year of school and as of August 2009, 2004 Total Cohort as of June of the 5th year of school, 2003 Total Cohort as of June of the 6th year of school.
Graduated Transferred to Count with Regents GED
County District
of Cohort Members
or Local Diplomas
Earned IEP Diploma
Still Enrolled
Preparation Program
Dropped Out
COUNTY: ONEIDA Sherrill City School District
2005 Total Cohort - Aug 2009 Year Outcome All Students 206 85% 0% 7% 1% 6% ELL 0 0% 0% 0% 0% 0% Not ELL 206 85% 0% 7% 1% 6%
2005 Total Cohort - 4 Year Outcome All Students 206 84% 0% 8% 1% 6% ELL 0 0% 0% 0% 0% 0% Not ELL 206 84% 0% 8% 1% 6%
2004 Total Cohort - 5 Year Outcome All Students 193 90% 3% 1% 0% 6% ELL 1 # # # # # Not ELL 192 # # # # #
2003 Total Cohort - 6 Year Outcome All Students 171 90% 4% 0% 1% 5% ELL 0 0% 0% 0% 0% 0% Not ELL 171 90% 4% 0% 1% 5%
Utica City School District
2005 Total Cohort - Aug 2009 Year Outcome All Students 761 63% 2% 12% 5% 19% ELL 57 37% 0% 26% 4% 33% Not ELL 704 65% 2% 10% 5% 17%
2005 Total Cohort - 4 Year Outcome All Students 761 61% 2% 14% 5% 19% ELL 57 37% 0% 26% 4% 33% Not ELL 704 63% 2% 13% 5% 17%
2004 Total Cohort - 5 Year Outcome All Students 613 67% 3% 8% 3% 19% ELL 40 48% 3% 20% 0% 30% Not ELL 573 68% 3% 8% 3% 18%
2003 Total Cohort - 6 Year Outcome All Students 705 67% 2% 5% 5% 21% ELL 47 30% 2% 9% 4% 55% Not ELL 658 70% 2% 5% 5% 19%
Waterville Central School District
2005 Total Cohort - Aug 2009 Year Outcome All Students 80 89% 1% 9% 0% 1% ELL 0 0% 0% 0% 0% 0% Not ELL 80 89% 1% 9% 0% 1%
2005 Total Cohort - 4 Year Outcome All Students 80 86% 1% 11% 0% 1% ELL 0 0% 0% 0% 0% 0% Not ELL 80 86% 1% 11% 0% 1%
Data presented in this report are based on data submitted by school districts to the data repository for the 2008-09 school year. Students are reported based on their date of entry in grade 9 and their last enrollment status as reported in the warehouse on July 31, 2009. The federal Family Education Rights and Privacy Act prohibits the release of personally identifiable student information. This Act precludes the publication of summary information based on fewer than five students or in which subtraction or other simple mathematical operations could be used to obtain personal information. Cells that contain the ("#") symbol have been suppressed to protect student privacy.
District-ell status Thursday, March 4, 2010 Page 163 of 301

Public School District Total Cohort Graduation Rate and Enrollment Outcome Summary - 2008-09 School Year by English Language Learner Status
2005 Total Cohort as of June of the 4th year of school and as of August 2009, 2004 Total Cohort as of June of the 5th year of school, 2003 Total Cohort as of June of the 6th year of school.
Graduated Transferred to Count with Regents GED
County of Cohort or Local Earned IEP Still Preparation DroppedDistrict Members Diplomas Diploma Enrolled Program Out
COUNTY: ONEIDA Waterville Central School District
2004 Total Cohort - 5 Year Outcome All Students 86 87% 1% 8% 1% 2% ELL 0 0% 0% 0% 0% 0% Not ELL 86 87% 1% 8% 1% 2%
2003 Total Cohort - 6 Year Outcome All Students 92 92% 2% 2% 0% 3% ELL 0 0% 0% 0% 0% 0% Not ELL 92 92% 2% 2% 0% 3%
Westmoreland Central School District
2005 Total Cohort - Aug 2009 Year Outcome All Students 99 89% 0% 7% 0% 4% ELL 0 0% 0% 0% 0% 0% Not ELL 99 89% 0% 7% 0% 4%
2005 Total Cohort - 4 Year Outcome All Students 99 82% 0% 14% 0% 4% ELL 0 0% 0% 0% 0% 0% Not ELL 99 82% 0% 14% 0% 4%
2004 Total Cohort - 5 Year Outcome All Students 106 90% 1% 3% 4% 3% ELL 0 0% 0% 0% 0% 0% Not ELL 106 90% 1% 3% 4% 3%
2003 Total Cohort - 6 Year Outcome All Students 97 96% 1% 1% 0% 2% ELL 0 0% 0% 0% 0% 0% Not ELL 97 96% 1% 1% 0% 2%
Whitesboro Central School District
2005 Total Cohort - Aug 2009 Year Outcome All Students 340 85% 2% 5% 2% 6% ELL 0 0% 0% 0% 0% 0% Not ELL 340 85% 2% 5% 2% 6%
2005 Total Cohort - 4 Year Outcome All Students 340 84% 2% 6% 2% 6% ELL 0 0% 0% 0% 0% 0% Not ELL 340 84% 2% 6% 2% 6%
2004 Total Cohort - 5 Year Outcome All Students 307 92% 1% 2% 0% 6% ELL 0 0% 0% 0% 0% 0% Not ELL 307 92% 1% 2% 0% 6%
2003 Total Cohort - 6 Year Outcome All Students 298 91% 2% 1% 1% 4% ELL 0 0% 0% 0% 0% 0% Not ELL 298 91% 2% 1% 1% 4%
Data presented in this report are based on data submitted by school districts to the data repository for the 2008-09 school year. Students are reported based on their date of entry in grade 9 and their last enrollment status as reported in the warehouse on July 31, 2009. The federal Family Education Rights and Privacy Act prohibits the release of personally identifiable student information. This Act precludes the publication of summary information based on fewer than five students or in which subtraction or other simple mathematical operations could be used to obtain personal information. Cells that contain the ("#") symbol have been suppressed to protect student privacy.
District-ell status Thursday, March 4, 2010 Page 164 of 301
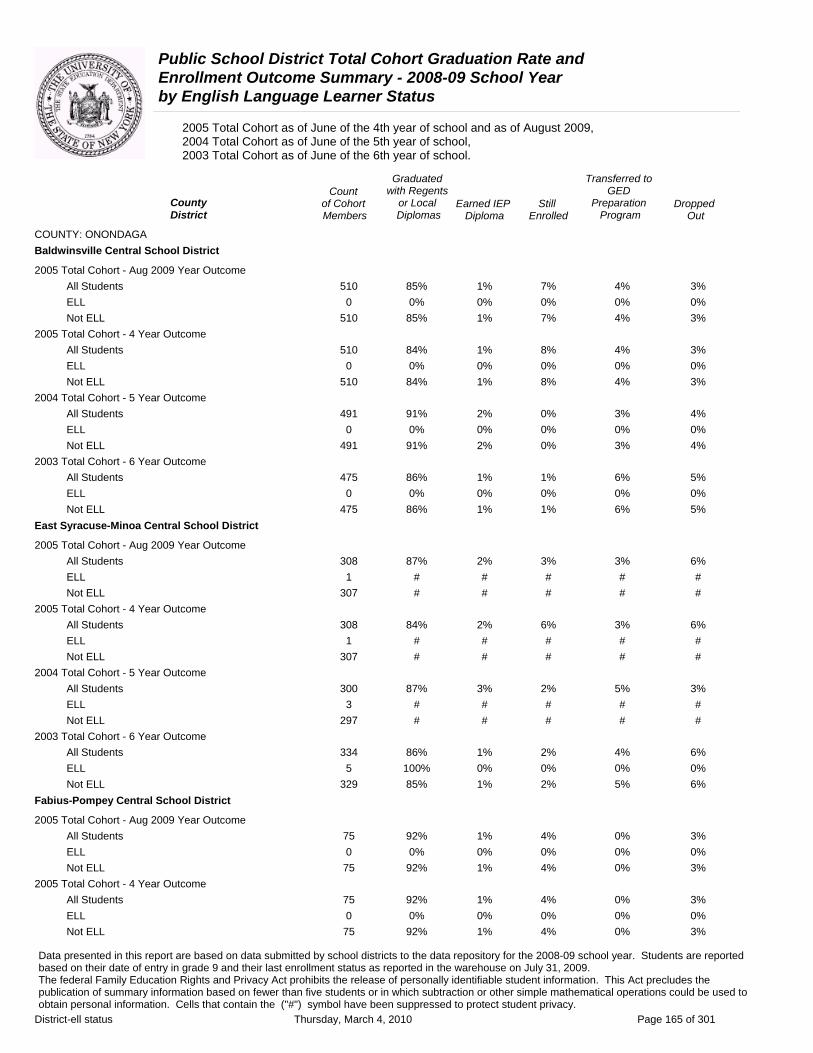
Public School District Total Cohort Graduation Rate and Enrollment Outcome Summary - 2008-09 School Year by English Language Learner Status
2005 Total Cohort as of June of the 4th year of school and as of August 2009, 2004 Total Cohort as of June of the 5th year of school, 2003 Total Cohort as of June of the 6th year of school.
Graduated Transferred to Count with Regents GED
County of Cohort or Local Earned IEP Still Preparation DroppedDistrict Members Diplomas Diploma Enrolled Program Out
COUNTY: ONONDAGA Baldwinsville Central School District
2005 Total Cohort - Aug 2009 Year Outcome All Students 510 85% 1% 7% 4% 3% ELL 0 0% 0% 0% 0% 0% Not ELL 510 85% 1% 7% 4% 3%
2005 Total Cohort - 4 Year Outcome All Students 510 84% 1% 8% 4% 3% ELL 0 0% 0% 0% 0% 0% Not ELL 510 84% 1% 8% 4% 3%
2004 Total Cohort - 5 Year Outcome All Students 491 91% 2% 0% 3% 4% ELL 0 0% 0% 0% 0% 0% Not ELL 491 91% 2% 0% 3% 4%
2003 Total Cohort - 6 Year Outcome All Students 475 86% 1% 1% 6% 5% ELL 0 0% 0% 0% 0% 0% Not ELL 475 86% 1% 1% 6% 5%
East Syracuse-Minoa Central School District
2005 Total Cohort - Aug 2009 Year Outcome All Students 308 87% 2% 3% 3% 6% ELL 1 # # # # # Not ELL 307 # # # # #
2005 Total Cohort - 4 Year Outcome All Students 308 84% 2% 6% 3% 6% ELL 1 # # # # # Not ELL 307 # # # # #
2004 Total Cohort - 5 Year Outcome All Students 300 87% 3% 2% 5% 3% ELL 3 # # # # # Not ELL 297 # # # # #
2003 Total Cohort - 6 Year Outcome All Students 334 86% 1% 2% 4% 6% ELL 5 100% 0% 0% 0% 0% Not ELL 329 85% 1% 2% 5% 6%
Fabius-Pompey Central School District
2005 Total Cohort - Aug 2009 Year Outcome All Students 75 92% 1% 4% 0% 3% ELL 0 0% 0% 0% 0% 0% Not ELL 75 92% 1% 4% 0% 3%
2005 Total Cohort - 4 Year Outcome All Students 75 92% 1% 4% 0% 3% ELL 0 0% 0% 0% 0% 0% Not ELL 75 92% 1% 4% 0% 3%
Data presented in this report are based on data submitted by school districts to the data repository for the 2008-09 school year. Students are reported based on their date of entry in grade 9 and their last enrollment status as reported in the warehouse on July 31, 2009. The federal Family Education Rights and Privacy Act prohibits the release of personally identifiable student information. This Act precludes the publication of summary information based on fewer than five students or in which subtraction or other simple mathematical operations could be used to obtain personal information. Cells that contain the ("#") symbol have been suppressed to protect student privacy.
District-ell status Thursday, March 4, 2010 Page 165 of 301

Public School District Total Cohort Graduation Rate and Enrollment Outcome Summary - 2008-09 School Year by English Language Learner Status
2005 Total Cohort as of June of the 4th year of school and as of August 2009, 2004 Total Cohort as of June of the 5th year of school, 2003 Total Cohort as of June of the 6th year of school.
Graduated Transferred to Count with Regents GED
County of Cohort or Local Earned IEP Still Preparation DroppedDistrict Members Diplomas Diploma Enrolled Program Out
COUNTY: ONONDAGA Fabius-Pompey Central School District
2004 Total Cohort - 5 Year Outcome All Students 79 86% 3% 3% 1% 6% ELL 0 0% 0% 0% 0% 0% Not ELL 79 86% 3% 3% 1% 6%
2003 Total Cohort - 6 Year Outcome All Students 81 91% 1% 0% 1% 6% ELL 0 0% 0% 0% 0% 0% Not ELL 81 91% 1% 0% 1% 6%
Fayetteville-Manlius Central School District
2005 Total Cohort - Aug 2009 Year Outcome All Students 394 95% 1% 2% 1% 3% ELL 1 # # # # # Not ELL 393 # # # # #
2005 Total Cohort - 4 Year Outcome All Students 394 93% 1% 4% 1% 3% ELL 1 # # # # # Not ELL 393 # # # # #
2004 Total Cohort - 5 Year Outcome All Students 392 96% 1% 0% 2% 2% ELL 1 # # # # # Not ELL 391 # # # # #
2003 Total Cohort - 6 Year Outcome All Students 375 93% 1% 1% 2% 3% ELL 1 # # # # # Not ELL 374 # # # # #
Jamesville-Dewitt Central School District
2005 Total Cohort - Aug 2009 Year Outcome All Students 213 92% 0% 4% 1% 2% ELL 1 # # # # # Not ELL 212 # # # # #
2005 Total Cohort - 4 Year Outcome All Students 213 92% 0% 4% 1% 2% ELL 1 # # # # # Not ELL 212 # # # # #
2004 Total Cohort - 5 Year Outcome All Students 253 95% 1% 1% 1% 2% ELL 3 # # # # # Not ELL 250 # # # # #
2003 Total Cohort - 6 Year Outcome All Students 219 97% 0% 0% 1% 1% ELL 0 0% 0% 0% 0% 0% Not ELL 219 97% 0% 0% 1% 1%
Data presented in this report are based on data submitted by school districts to the data repository for the 2008-09 school year. Students are reported based on their date of entry in grade 9 and their last enrollment status as reported in the warehouse on July 31, 2009. The federal Family Education Rights and Privacy Act prohibits the release of personally identifiable student information. This Act precludes the publication of summary information based on fewer than five students or in which subtraction or other simple mathematical operations could be used to obtain personal information. Cells that contain the ("#") symbol have been suppressed to protect student privacy.
District-ell status Thursday, March 4, 2010 Page 166 of 301
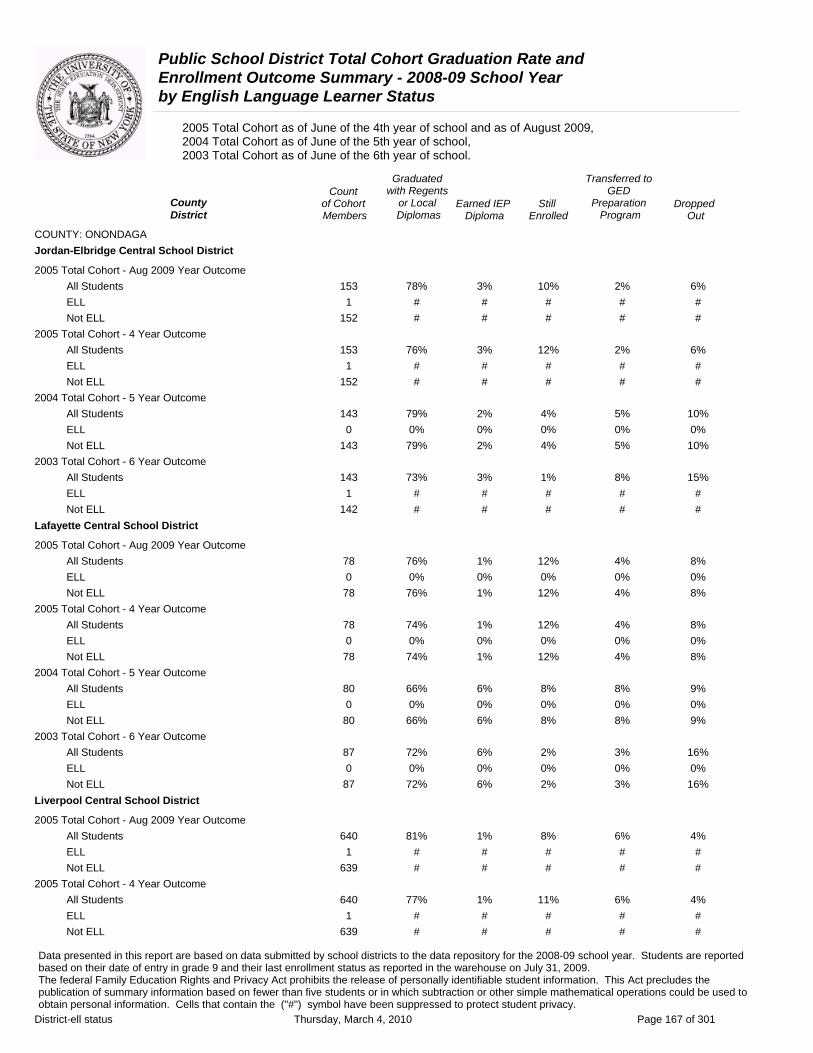
Public School District Total Cohort Graduation Rate and Enrollment Outcome Summary - 2008-09 School Year by English Language Learner Status
2005 Total Cohort as of June of the 4th year of school and as of August 2009, 2004 Total Cohort as of June of the 5th year of school, 2003 Total Cohort as of June of the 6th year of school.
Graduated Transferred to Count with Regents GED
County of Cohort or Local Earned IEP Still Preparation DroppedDistrict Members Diplomas Diploma Enrolled Program Out
COUNTY: ONONDAGA Jordan-Elbridge Central School District
2005 Total Cohort - Aug 2009 Year Outcome All Students 153 78% 3% 10% 2% 6% ELL 1 # # # # # Not ELL 152 # # # # #
2005 Total Cohort - 4 Year Outcome All Students 153 76% 3% 12% 2% 6% ELL 1 # # # # # Not ELL 152 # # # # #
2004 Total Cohort - 5 Year Outcome All Students 143 79% 2% 4% 5% 10% ELL 0 0% 0% 0% 0% 0% Not ELL 143 79% 2% 4% 5% 10%
2003 Total Cohort - 6 Year Outcome All Students 143 73% 3% 1% 8% 15% ELL 1 # # # # # Not ELL 142 # # # # #
Lafayette Central School District
2005 Total Cohort - Aug 2009 Year Outcome All Students 78 76% 1% 12% 4% 8% ELL 0 0% 0% 0% 0% 0% Not ELL 78 76% 1% 12% 4% 8%
2005 Total Cohort - 4 Year Outcome All Students 78 74% 1% 12% 4% 8% ELL 0 0% 0% 0% 0% 0% Not ELL 78 74% 1% 12% 4% 8%
2004 Total Cohort - 5 Year Outcome All Students 80 66% 6% 8% 8% 9% ELL 0 0% 0% 0% 0% 0% Not ELL 80 66% 6% 8% 8% 9%
2003 Total Cohort - 6 Year Outcome All Students 87 72% 6% 2% 3% 16% ELL 0 0% 0% 0% 0% 0% Not ELL 87 72% 6% 2% 3% 16%
Liverpool Central School District
2005 Total Cohort - Aug 2009 Year Outcome All Students 640 81% 1% 8% 6% 4% ELL 1 # # # # # Not ELL 639 # # # # #
2005 Total Cohort - 4 Year Outcome All Students 640 77% 1% 11% 6% 4% ELL 1 # # # # # Not ELL 639 # # # # #
Data presented in this report are based on data submitted by school districts to the data repository for the 2008-09 school year. Students are reported based on their date of entry in grade 9 and their last enrollment status as reported in the warehouse on July 31, 2009. The federal Family Education Rights and Privacy Act prohibits the release of personally identifiable student information. This Act precludes the publication of summary information based on fewer than five students or in which subtraction or other simple mathematical operations could be used to obtain personal information. Cells that contain the ("#") symbol have been suppressed to protect student privacy.
District-ell status Thursday, March 4, 2010 Page 167 of 301

Public School District Total Cohort Graduation Rate and Enrollment Outcome Summary - 2008-09 School Year by English Language Learner Status
2005 Total Cohort as of June of the 4th year of school and as of August 2009, 2004 Total Cohort as of June of the 5th year of school, 2003 Total Cohort as of June of the 6th year of school.
Graduated Transferred to Count with Regents GED
County of Cohort or Local Earned IEP Still Preparation DroppedDistrict Members Diplomas Diploma Enrolled Program Out
COUNTY: ONONDAGA Liverpool Central School District
2004 Total Cohort - 5 Year Outcome All Students 699 81% 2% 4% 8% 5% ELL 4 # # # # # Not ELL 695 # # # # #
2003 Total Cohort - 6 Year Outcome All Students 713 82% 2% 3% 7% 6% ELL 0 0% 0% 0% 0% 0% Not ELL 713 82% 2% 3% 7% 6%
Marcellus Central School District
2005 Total Cohort - Aug 2009 Year Outcome All Students 180 90% 1% 3% 2% 4% ELL 0 0% 0% 0% 0% 0% Not ELL 180 90% 1% 3% 2% 4%
2005 Total Cohort - 4 Year Outcome All Students 180 89% 1% 4% 2% 4% ELL 0 0% 0% 0% 0% 0% Not ELL 180 89% 1% 4% 2% 4%
2004 Total Cohort - 5 Year Outcome All Students 187 89% 2% 1% 3% 5% ELL 0 0% 0% 0% 0% 0% Not ELL 187 89% 2% 1% 3% 5%
2003 Total Cohort - 6 Year Outcome All Students 168 89% 1% 3% 4% 3% ELL 0 0% 0% 0% 0% 0% Not ELL 168 89% 1% 3% 4% 3%
North Syracuse Central School District
2005 Total Cohort - Aug 2009 Year Outcome All Students 899 80% 1% 7% 4% 8% ELL 0 0% 0% 0% 0% 0% Not ELL 899 80% 1% 7% 4% 8%
2005 Total Cohort - 4 Year Outcome All Students 899 79% 1% 8% 4% 8% ELL 0 0% 0% 0% 0% 0% Not ELL 899 79% 1% 8% 4% 8%
2004 Total Cohort - 5 Year Outcome All Students 852 82% 2% 2% 4% 10% ELL 0 0% 0% 0% 0% 0% Not ELL 852 82% 2% 2% 4% 10%
2003 Total Cohort - 6 Year Outcome All Students 801 80% 1% 3% 5% 10% ELL 2 # # # # # Not ELL 799 # # # # #
Data presented in this report are based on data submitted by school districts to the data repository for the 2008-09 school year. Students are reported based on their date of entry in grade 9 and their last enrollment status as reported in the warehouse on July 31, 2009. The federal Family Education Rights and Privacy Act prohibits the release of personally identifiable student information. This Act precludes the publication of summary information based on fewer than five students or in which subtraction or other simple mathematical operations could be used to obtain personal information. Cells that contain the ("#") symbol have been suppressed to protect student privacy.
District-ell status Thursday, March 4, 2010 Page 168 of 301

Public School District Total Cohort Graduation Rate and Enrollment Outcome Summary - 2008-09 School Year by English Language Learner Status
2005 Total Cohort as of June of the 4th year of school and as of August 2009, 2004 Total Cohort as of June of the 5th year of school, 2003 Total Cohort as of June of the 6th year of school.
Graduated Transferred to Count with Regents GED
County of Cohort or Local Earned IEP Still Preparation DroppedDistrict Members Diplomas Diploma Enrolled Program Out
COUNTY: ONONDAGA Onondaga Central School District
2005 Total Cohort - Aug 2009 Year Outcome All Students 88 82% 0% 8% 2% 8% ELL 0 0% 0% 0% 0% 0% Not ELL 88 82% 0% 8% 2% 8%
2005 Total Cohort - 4 Year Outcome All Students 88 81% 0% 9% 2% 8% ELL 0 0% 0% 0% 0% 0% Not ELL 88 81% 0% 9% 2% 8%
2004 Total Cohort - 5 Year Outcome All Students 79 84% 1% 1% 5% 9% ELL 1 # # # # # Not ELL 78 # # # # #
2003 Total Cohort - 6 Year Outcome All Students 80 86% 3% 0% 5% 5% ELL 2 # # # # # Not ELL 78 # # # # #
Skaneateles Central School District
2005 Total Cohort - Aug 2009 Year Outcome All Students 138 93% 3% 1% 2% 0% ELL 0 0% 0% 0% 0% 0% Not ELL 138 93% 3% 1% 2% 0%
2005 Total Cohort - 4 Year Outcome All Students 138 93% 3% 1% 2% 0% ELL 0 0% 0% 0% 0% 0% Not ELL 138 93% 3% 1% 2% 0%
2004 Total Cohort - 5 Year Outcome All Students 156 94% 3% 0% 1% 1% ELL 0 0% 0% 0% 0% 0% Not ELL 156 94% 3% 0% 1% 1%
2003 Total Cohort - 6 Year Outcome All Students 137 93% 2% 1% 4% 1% ELL 0 0% 0% 0% 0% 0% Not ELL 137 93% 2% 1% 4% 1%
Solvay Union Free School District
2005 Total Cohort - Aug 2009 Year Outcome All Students 147 72% 3% 9% 8% 7% ELL 5 100% 0% 0% 0% 0% Not ELL 142 71% 4% 9% 8% 8%
2005 Total Cohort - 4 Year Outcome All Students 147 72% 3% 9% 8% 7% ELL 5 100% 0% 0% 0% 0% Not ELL 142 71% 4% 9% 8% 8%
Data presented in this report are based on data submitted by school districts to the data repository for the 2008-09 school year. Students are reported based on their date of entry in grade 9 and their last enrollment status as reported in the warehouse on July 31, 2009. The federal Family Education Rights and Privacy Act prohibits the release of personally identifiable student information. This Act precludes the publication of summary information based on fewer than five students or in which subtraction or other simple mathematical operations could be used to obtain personal information. Cells that contain the ("#") symbol have been suppressed to protect student privacy.
District-ell status Thursday, March 4, 2010 Page 169 of 301
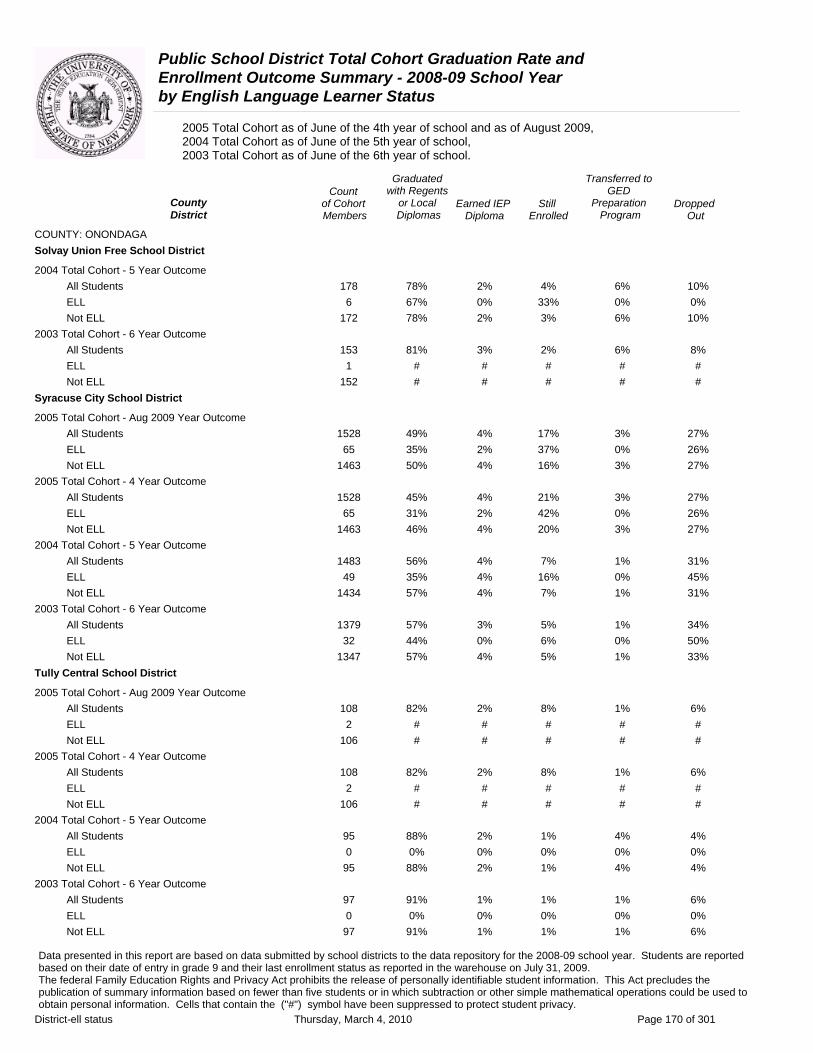
Public School District Total Cohort Graduation Rate and Enrollment Outcome Summary - 2008-09 School Year by English Language Learner Status
2005 Total Cohort as of June of the 4th year of school and as of August 2009, 2004 Total Cohort as of June of the 5th year of school, 2003 Total Cohort as of June of the 6th year of school.
Graduated Transferred to Count with Regents GED
County District
of Cohort Members
or Local Diplomas
Earned IEP Diploma
Still Enrolled
Preparation Program
Dropped Out
COUNTY: ONONDAGA Solvay Union Free School District
2004 Total Cohort - 5 Year Outcome All Students 178 78% 2% 4% 6% 10% ELL 6 67% 0% 33% 0% 0% Not ELL 172 78% 2% 3% 6% 10%
2003 Total Cohort - 6 Year Outcome All Students 153 81% 3% 2% 6% 8% ELL 1 # # # # # Not ELL 152 # # # # #
Syracuse City School District
2005 Total Cohort - Aug 2009 Year Outcome All Students 1528 49% 4% 17% 3% 27% ELL 65 35% 2% 37% 0% 26% Not ELL 1463 50% 4% 16% 3% 27%
2005 Total Cohort - 4 Year Outcome All Students 1528 45% 4% 21% 3% 27% ELL 65 31% 2% 42% 0% 26% Not ELL 1463 46% 4% 20% 3% 27%
2004 Total Cohort - 5 Year Outcome All Students 1483 56% 4% 7% 1% 31% ELL 49 35% 4% 16% 0% 45% Not ELL 1434 57% 4% 7% 1% 31%
2003 Total Cohort - 6 Year Outcome All Students 1379 57% 3% 5% 1% 34% ELL 32 44% 0% 6% 0% 50% Not ELL 1347 57% 4% 5% 1% 33%
Tully Central School District
2005 Total Cohort - Aug 2009 Year Outcome All Students 108 82% 2% 8% 1% 6% ELL 2 # # # # # Not ELL 106 # # # # #
2005 Total Cohort - 4 Year Outcome All Students 108 82% 2% 8% 1% 6% ELL 2 # # # # # Not ELL 106 # # # # #
2004 Total Cohort - 5 Year Outcome All Students 95 88% 2% 1% 4% 4% ELL 0 0% 0% 0% 0% 0% Not ELL 95 88% 2% 1% 4% 4%
2003 Total Cohort - 6 Year Outcome All Students 97 91% 1% 1% 1% 6% ELL 0 0% 0% 0% 0% 0% Not ELL 97 91% 1% 1% 1% 6%
Data presented in this report are based on data submitted by school districts to the data repository for the 2008-09 school year. Students are reported based on their date of entry in grade 9 and their last enrollment status as reported in the warehouse on July 31, 2009. The federal Family Education Rights and Privacy Act prohibits the release of personally identifiable student information. This Act precludes the publication of summary information based on fewer than five students or in which subtraction or other simple mathematical operations could be used to obtain personal information. Cells that contain the ("#") symbol have been suppressed to protect student privacy.
District-ell status Thursday, March 4, 2010 Page 170 of 301

Public School District Total Cohort Graduation Rate and Enrollment Outcome Summary - 2008-09 School Year by English Language Learner Status
2005 Total Cohort as of June of the 4th year of school and as of August 2009, 2004 Total Cohort as of June of the 5th year of school, 2003 Total Cohort as of June of the 6th year of school.
Graduated Transferred to Count with Regents GED
County of Cohort or Local Earned IEP Still Preparation DroppedDistrict Members Diplomas Diploma Enrolled Program Out
COUNTY: ONONDAGA West Genesee Central School District
2005 Total Cohort - Aug 2009 Year Outcome All Students 497 87% 1% 4% 3% 4% ELL 0 0% 0% 0% 0% 0% Not ELL 497 87% 1% 4% 3% 4%
2005 Total Cohort - 4 Year Outcome All Students 497 86% 1% 6% 3% 4% ELL 0 0% 0% 0% 0% 0% Not ELL 497 86% 1% 6% 3% 4%
2004 Total Cohort - 5 Year Outcome All Students 412 90% 0% 1% 5% 4% ELL 1 # # # # # Not ELL 411 # # # # #
2003 Total Cohort - 6 Year Outcome All Students 441 93% 2% 1% 2% 2% ELL 2 # # # # # Not ELL 439 # # # # #
Westhill Central School District
2005 Total Cohort - Aug 2009 Year Outcome All Students 178 91% 0% 5% 2% 2% ELL 0 0% 0% 0% 0% 0% Not ELL 178 91% 0% 5% 2% 2%
2005 Total Cohort - 4 Year Outcome All Students 178 91% 0% 5% 2% 2% ELL 0 0% 0% 0% 0% 0% Not ELL 178 91% 0% 5% 2% 2%
2004 Total Cohort - 5 Year Outcome All Students 172 91% 1% 1% 3% 4% ELL 1 # # # # # Not ELL 171 # # # # #
2003 Total Cohort - 6 Year Outcome All Students 178 90% 1% 1% 1% 7% ELL 0 0% 0% 0% 0% 0% Not ELL 178 90% 1% 1% 1% 7%
Data presented in this report are based on data submitted by school districts to the data repository for the 2008-09 school year. Students are reported based on their date of entry in grade 9 and their last enrollment status as reported in the warehouse on July 31, 2009. The federal Family Education Rights and Privacy Act prohibits the release of personally identifiable student information. This Act precludes the publication of summary information based on fewer than five students or in which subtraction or other simple mathematical operations could be used to obtain personal information. Cells that contain the ("#") symbol have been suppressed to protect student privacy.
District-ell status Thursday, March 4, 2010 Page 171 of 301
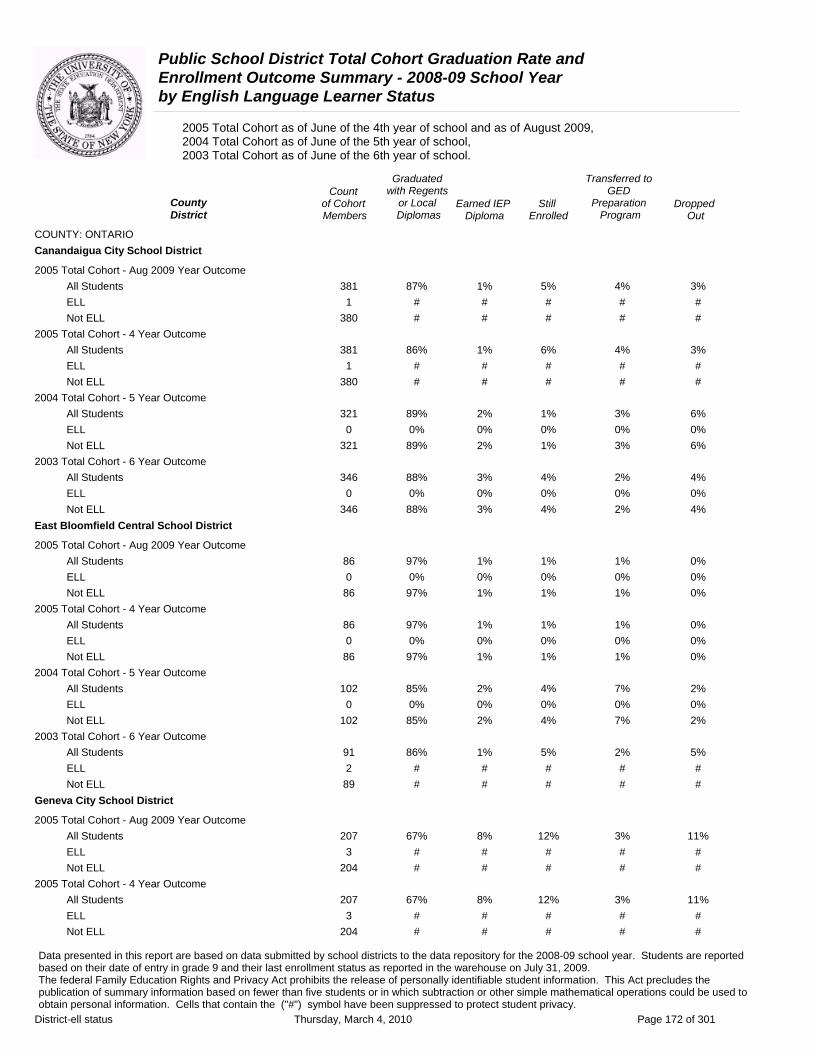
Public School District Total Cohort Graduation Rate and Enrollment Outcome Summary - 2008-09 School Year by English Language Learner Status
2005 Total Cohort as of June of the 4th year of school and as of August 2009, 2004 Total Cohort as of June of the 5th year of school, 2003 Total Cohort as of June of the 6th year of school.
Graduated Transferred to Count with Regents GED
County District
of Cohort Members
or Local Diplomas
Earned IEP Diploma
Still Enrolled
Preparation Program
Dropped Out
COUNTY: ONTARIO Canandaigua City School District
2005 Total Cohort - Aug 2009 Year Outcome All Students 381 87% 1% 5% 4% 3% ELL 1 # # # # # Not ELL 380 # # # # #
2005 Total Cohort - 4 Year Outcome All Students 381 86% 1% 6% 4% 3% ELL 1 # # # # # Not ELL 380 # # # # #
2004 Total Cohort - 5 Year Outcome All Students 321 89% 2% 1% 3% 6% ELL 0 0% 0% 0% 0% 0% Not ELL 321 89% 2% 1% 3% 6%
2003 Total Cohort - 6 Year Outcome All Students 346 88% 3% 4% 2% 4% ELL 0 0% 0% 0% 0% 0% Not ELL 346 88% 3% 4% 2% 4%
East Bloomfield Central School District
2005 Total Cohort - Aug 2009 Year Outcome All Students 86 97% 1% 1% 1% 0% ELL 0 0% 0% 0% 0% 0% Not ELL 86 97% 1% 1% 1% 0%
2005 Total Cohort - 4 Year Outcome All Students 86 97% 1% 1% 1% 0% ELL 0 0% 0% 0% 0% 0% Not ELL 86 97% 1% 1% 1% 0%
2004 Total Cohort - 5 Year Outcome All Students 102 85% 2% 4% 7% 2% ELL 0 0% 0% 0% 0% 0% Not ELL 102 85% 2% 4% 7% 2%
2003 Total Cohort - 6 Year Outcome All Students 91 86% 1% 5% 2% 5% ELL 2 # # # # # Not ELL 89 # # # # #
Geneva City School District
2005 Total Cohort - Aug 2009 Year Outcome All Students 207 67% 8% 12% 3% 11% ELL 3 # # # # # Not ELL 204 # # # # #
2005 Total Cohort - 4 Year Outcome All Students 207 67% 8% 12% 3% 11% ELL 3 # # # # # Not ELL 204 # # # # #
Data presented in this report are based on data submitted by school districts to the data repository for the 2008-09 school year. Students are reported based on their date of entry in grade 9 and their last enrollment status as reported in the warehouse on July 31, 2009. The federal Family Education Rights and Privacy Act prohibits the release of personally identifiable student information. This Act precludes the publication of summary information based on fewer than five students or in which subtraction or other simple mathematical operations could be used to obtain personal information. Cells that contain the ("#") symbol have been suppressed to protect student privacy.
District-ell status Thursday, March 4, 2010 Page 172 of 301
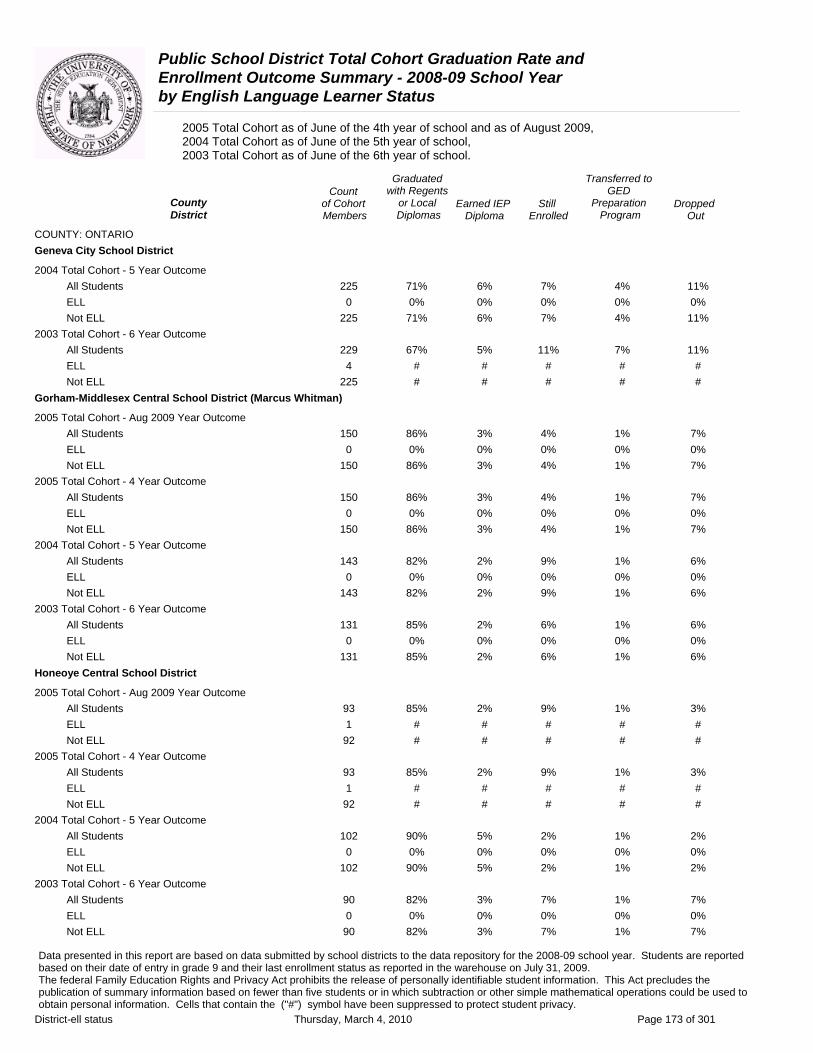
Public School District Total Cohort Graduation Rate and Enrollment Outcome Summary - 2008-09 School Year by English Language Learner Status
2005 Total Cohort as of June of the 4th year of school and as of August 2009, 2004 Total Cohort as of June of the 5th year of school, 2003 Total Cohort as of June of the 6th year of school.
Graduated Transferred to Count with Regents GED
County of Cohort or Local Earned IEP Still Preparation DroppedDistrict Members Diplomas Diploma Enrolled Program Out
COUNTY: ONTARIO Geneva City School District
2004 Total Cohort - 5 Year Outcome All Students 225 71% 6% 7% 4% 11% ELL 0 0% 0% 0% 0% 0% Not ELL 225 71% 6% 7% 4% 11%
2003 Total Cohort - 6 Year Outcome All Students 229 67% 5% 11% 7% 11% ELL 4 # # # # # Not ELL 225 # # # # #
Gorham-Middlesex Central School District (Marcus Whitman)
2005 Total Cohort - Aug 2009 Year Outcome All Students 150 86% 3% 4% 1% 7% ELL 0 0% 0% 0% 0% 0% Not ELL 150 86% 3% 4% 1% 7%
2005 Total Cohort - 4 Year Outcome All Students 150 86% 3% 4% 1% 7% ELL 0 0% 0% 0% 0% 0% Not ELL 150 86% 3% 4% 1% 7%
2004 Total Cohort - 5 Year Outcome All Students 143 82% 2% 9% 1% 6% ELL 0 0% 0% 0% 0% 0% Not ELL 143 82% 2% 9% 1% 6%
2003 Total Cohort - 6 Year Outcome All Students 131 85% 2% 6% 1% 6% ELL 0 0% 0% 0% 0% 0% Not ELL 131 85% 2% 6% 1% 6%
Honeoye Central School District
2005 Total Cohort - Aug 2009 Year Outcome All Students 93 85% 2% 9% 1% 3% ELL 1 # # # # # Not ELL 92 # # # # #
2005 Total Cohort - 4 Year Outcome All Students 93 85% 2% 9% 1% 3% ELL 1 # # # # # Not ELL 92 # # # # #
2004 Total Cohort - 5 Year Outcome All Students 102 90% 5% 2% 1% 2% ELL 0 0% 0% 0% 0% 0% Not ELL 102 90% 5% 2% 1% 2%
2003 Total Cohort - 6 Year Outcome All Students 90 82% 3% 7% 1% 7% ELL 0 0% 0% 0% 0% 0% Not ELL 90 82% 3% 7% 1% 7%
Data presented in this report are based on data submitted by school districts to the data repository for the 2008-09 school year. Students are reported based on their date of entry in grade 9 and their last enrollment status as reported in the warehouse on July 31, 2009. The federal Family Education Rights and Privacy Act prohibits the release of personally identifiable student information. This Act precludes the publication of summary information based on fewer than five students or in which subtraction or other simple mathematical operations could be used to obtain personal information. Cells that contain the ("#") symbol have been suppressed to protect student privacy.
District-ell status Thursday, March 4, 2010 Page 173 of 301
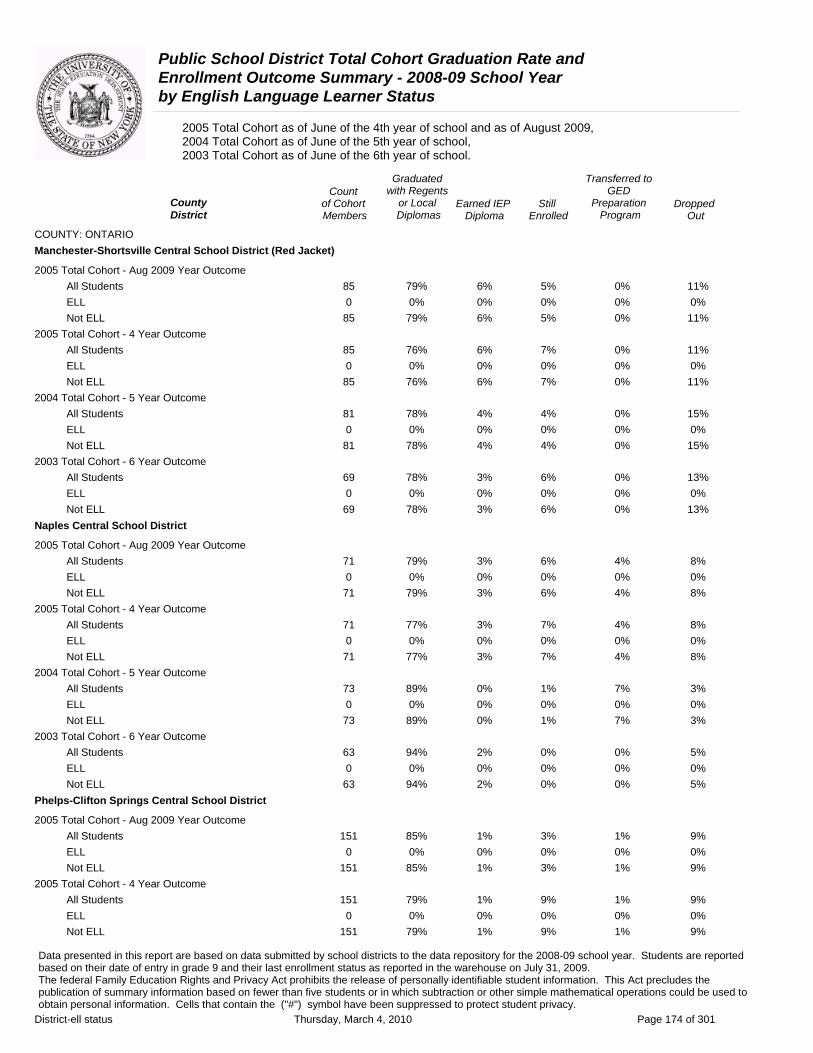
Public School District Total Cohort Graduation Rate and Enrollment Outcome Summary - 2008-09 School Year by English Language Learner Status
2005 Total Cohort as of June of the 4th year of school and as of August 2009, 2004 Total Cohort as of June of the 5th year of school, 2003 Total Cohort as of June of the 6th year of school.
Graduated Transferred to Count with Regents GED
County of Cohort or Local Earned IEP Still Preparation DroppedDistrict Members Diplomas Diploma Enrolled Program Out
COUNTY: ONTARIO Manchester-Shortsville Central School District (Red Jacket)
2005 Total Cohort - Aug 2009 Year Outcome All Students 85 79% 6% 5% 0% 11% ELL 0 0% 0% 0% 0% 0% Not ELL 85 79% 6% 5% 0% 11%
2005 Total Cohort - 4 Year Outcome All Students 85 76% 6% 7% 0% 11% ELL 0 0% 0% 0% 0% 0% Not ELL 85 76% 6% 7% 0% 11%
2004 Total Cohort - 5 Year Outcome All Students 81 78% 4% 4% 0% 15% ELL 0 0% 0% 0% 0% 0% Not ELL 81 78% 4% 4% 0% 15%
2003 Total Cohort - 6 Year Outcome All Students 69 78% 3% 6% 0% 13% ELL 0 0% 0% 0% 0% 0% Not ELL 69 78% 3% 6% 0% 13%
Naples Central School District
2005 Total Cohort - Aug 2009 Year Outcome All Students 71 79% 3% 6% 4% 8% ELL 0 0% 0% 0% 0% 0% Not ELL 71 79% 3% 6% 4% 8%
2005 Total Cohort - 4 Year Outcome All Students 71 77% 3% 7% 4% 8% ELL 0 0% 0% 0% 0% 0% Not ELL 71 77% 3% 7% 4% 8%
2004 Total Cohort - 5 Year Outcome All Students 73 89% 0% 1% 7% 3% ELL 0 0% 0% 0% 0% 0% Not ELL 73 89% 0% 1% 7% 3%
2003 Total Cohort - 6 Year Outcome All Students 63 94% 2% 0% 0% 5% ELL 0 0% 0% 0% 0% 0% Not ELL 63 94% 2% 0% 0% 5%
Phelps-Clifton Springs Central School District
2005 Total Cohort - Aug 2009 Year Outcome All Students 151 85% 1% 3% 1% 9% ELL 0 0% 0% 0% 0% 0% Not ELL 151 85% 1% 3% 1% 9%
2005 Total Cohort - 4 Year Outcome All Students 151 79% 1% 9% 1% 9% ELL 0 0% 0% 0% 0% 0% Not ELL 151 79% 1% 9% 1% 9%
Data presented in this report are based on data submitted by school districts to the data repository for the 2008-09 school year. Students are reported based on their date of entry in grade 9 and their last enrollment status as reported in the warehouse on July 31, 2009. The federal Family Education Rights and Privacy Act prohibits the release of personally identifiable student information. This Act precludes the publication of summary information based on fewer than five students or in which subtraction or other simple mathematical operations could be used to obtain personal information. Cells that contain the ("#") symbol have been suppressed to protect student privacy.
District-ell status Thursday, March 4, 2010 Page 174 of 301
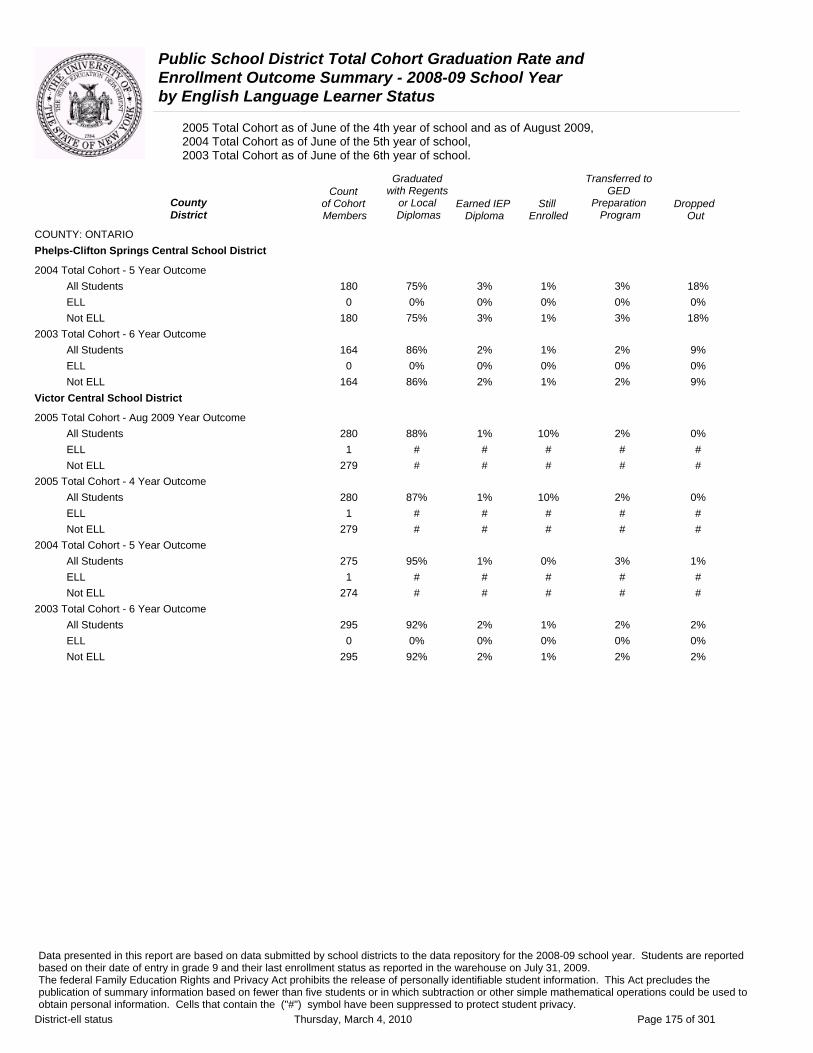
Public School District Total Cohort Graduation Rate and Enrollment Outcome Summary - 2008-09 School Year by English Language Learner Status
2005 Total Cohort as of June of the 4th year of school and as of August 2009, 2004 Total Cohort as of June of the 5th year of school, 2003 Total Cohort as of June of the 6th year of school.
Graduated Transferred to Count with Regents GED
County of Cohort or Local Earned IEP Still Preparation DroppedDistrict Members Diplomas Diploma Enrolled Program Out
COUNTY: ONTARIO Phelps-Clifton Springs Central School District
2004 Total Cohort - 5 Year Outcome All Students 180 75% 3% 1% 3% 18% ELL 0 0% 0% 0% 0% 0% Not ELL 180 75% 3% 1% 3% 18%
2003 Total Cohort - 6 Year Outcome All Students 164 86% 2% 1% 2% 9% ELL 0 0% 0% 0% 0% 0% Not ELL 164 86% 2% 1% 2% 9%
Victor Central School District
2005 Total Cohort - Aug 2009 Year Outcome All Students 280 88% 1% 10% 2% 0% ELL 1 # # # # # Not ELL 279 # # # # #
2005 Total Cohort - 4 Year Outcome All Students 280 87% 1% 10% 2% 0% ELL 1 # # # # # Not ELL 279 # # # # #
2004 Total Cohort - 5 Year Outcome All Students 275 95% 1% 0% 3% 1% ELL 1 # # # # # Not ELL 274 # # # # #
2003 Total Cohort - 6 Year Outcome All Students 295 92% 2% 1% 2% 2% ELL 0 0% 0% 0% 0% 0% Not ELL 295 92% 2% 1% 2% 2%
Data presented in this report are based on data submitted by school districts to the data repository for the 2008-09 school year. Students are reported based on their date of entry in grade 9 and their last enrollment status as reported in the warehouse on July 31, 2009. The federal Family Education Rights and Privacy Act prohibits the release of personally identifiable student information. This Act precludes the publication of summary information based on fewer than five students or in which subtraction or other simple mathematical operations could be used to obtain personal information. Cells that contain the ("#") symbol have been suppressed to protect student privacy.
District-ell status Thursday, March 4, 2010 Page 175 of 301

Public School District Total Cohort Graduation Rate and Enrollment Outcome Summary - 2008-09 School Year by English Language Learner Status
2005 Total Cohort as of June of the 4th year of school and as of August 2009, 2004 Total Cohort as of June of the 5th year of school, 2003 Total Cohort as of June of the 6th year of school.
Graduated Transferred to Count with Regents GED
County of Cohort or Local Earned IEP Still Preparation DroppedDistrict Members Diplomas Diploma Enrolled Program Out
COUNTY: ORANGE Chester Union Free School District
2005 Total Cohort - Aug 2009 Year Outcome All Students 79 84% 4% 9% 0% 4% ELL 0 0% 0% 0% 0% 0% Not ELL 79 84% 4% 9% 0% 4%
2005 Total Cohort - 4 Year Outcome All Students 79 80% 4% 13% 0% 4% ELL 0 0% 0% 0% 0% 0% Not ELL 79 80% 4% 13% 0% 4%
2004 Total Cohort - 5 Year Outcome All Students 81 85% 5% 2% 0% 7% ELL 1 # # # # # Not ELL 80 # # # # #
2003 Total Cohort - 6 Year Outcome All Students 71 93% 4% 0% 0% 1% ELL 0 0% 0% 0% 0% 0% Not ELL 71 93% 4% 0% 0% 1%
Cornwall Central School District
2005 Total Cohort - Aug 2009 Year Outcome All Students 292 91% 1% 5% 0% 3% ELL 0 0% 0% 0% 0% 0% Not ELL 292 91% 1% 5% 0% 3%
2005 Total Cohort - 4 Year Outcome All Students 292 91% 1% 5% 0% 3% ELL 0 0% 0% 0% 0% 0% Not ELL 292 91% 1% 5% 0% 3%
2004 Total Cohort - 5 Year Outcome All Students 280 95% 1% 1% 0% 3% ELL 0 0% 0% 0% 0% 0% Not ELL 280 95% 1% 1% 0% 3%
2003 Total Cohort - 6 Year Outcome All Students 248 96% 0% 1% 0% 2% ELL 1 # # # # # Not ELL 247 # # # # #
Florida Union Free School District
2005 Total Cohort - Aug 2009 Year Outcome All Students 61 87% 2% 3% 5% 3% ELL 0 0% 0% 0% 0% 0% Not ELL 61 87% 2% 3% 5% 3%
2005 Total Cohort - 4 Year Outcome All Students 61 87% 2% 3% 5% 3% ELL 0 0% 0% 0% 0% 0% Not ELL 61 87% 2% 3% 5% 3%
Data presented in this report are based on data submitted by school districts to the data repository for the 2008-09 school year. Students are reported based on their date of entry in grade 9 and their last enrollment status as reported in the warehouse on July 31, 2009. The federal Family Education Rights and Privacy Act prohibits the release of personally identifiable student information. This Act precludes the publication of summary information based on fewer than five students or in which subtraction or other simple mathematical operations could be used to obtain personal information. Cells that contain the ("#") symbol have been suppressed to protect student privacy.
District-ell status Thursday, March 4, 2010 Page 176 of 301
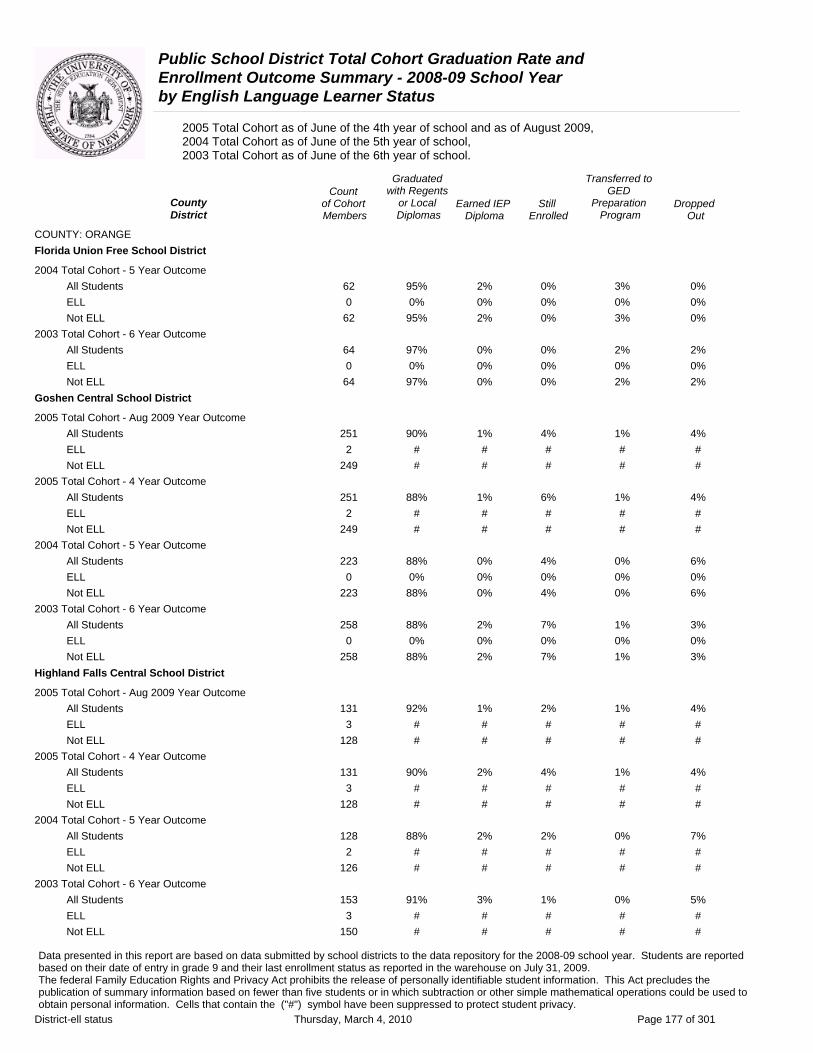
Public School District Total Cohort Graduation Rate and Enrollment Outcome Summary - 2008-09 School Year by English Language Learner Status
2005 Total Cohort as of June of the 4th year of school and as of August 2009, 2004 Total Cohort as of June of the 5th year of school, 2003 Total Cohort as of June of the 6th year of school.
Graduated Transferred to Count with Regents GED
County of Cohort or Local Earned IEP Still Preparation DroppedDistrict Members Diplomas Diploma Enrolled Program Out
COUNTY: ORANGE Florida Union Free School District
2004 Total Cohort - 5 Year Outcome All Students 62 95% 2% 0% 3% 0% ELL 0 0% 0% 0% 0% 0% Not ELL 62 95% 2% 0% 3% 0%
2003 Total Cohort - 6 Year Outcome All Students 64 97% 0% 0% 2% 2% ELL 0 0% 0% 0% 0% 0% Not ELL 64 97% 0% 0% 2% 2%
Goshen Central School District
2005 Total Cohort - Aug 2009 Year Outcome All Students 251 90% 1% 4% 1% 4% ELL 2 # # # # # Not ELL 249 # # # # #
2005 Total Cohort - 4 Year Outcome All Students 251 88% 1% 6% 1% 4% ELL 2 # # # # # Not ELL 249 # # # # #
2004 Total Cohort - 5 Year Outcome All Students 223 88% 0% 4% 0% 6% ELL 0 0% 0% 0% 0% 0% Not ELL 223 88% 0% 4% 0% 6%
2003 Total Cohort - 6 Year Outcome All Students 258 88% 2% 7% 1% 3% ELL 0 0% 0% 0% 0% 0% Not ELL 258 88% 2% 7% 1% 3%
Highland Falls Central School District
2005 Total Cohort - Aug 2009 Year Outcome All Students 131 92% 1% 2% 1% 4% ELL 3 # # # # # Not ELL 128 # # # # #
2005 Total Cohort - 4 Year Outcome All Students 131 90% 2% 4% 1% 4% ELL 3 # # # # # Not ELL 128 # # # # #
2004 Total Cohort - 5 Year Outcome All Students 128 88% 2% 2% 0% 7% ELL 2 # # # # # Not ELL 126 # # # # #
2003 Total Cohort - 6 Year Outcome All Students 153 91% 3% 1% 0% 5% ELL 3 # # # # # Not ELL 150 # # # # #
Data presented in this report are based on data submitted by school districts to the data repository for the 2008-09 school year. Students are reported based on their date of entry in grade 9 and their last enrollment status as reported in the warehouse on July 31, 2009. The federal Family Education Rights and Privacy Act prohibits the release of personally identifiable student information. This Act precludes the publication of summary information based on fewer than five students or in which subtraction or other simple mathematical operations could be used to obtain personal information. Cells that contain the ("#") symbol have been suppressed to protect student privacy.
District-ell status Thursday, March 4, 2010 Page 177 of 301
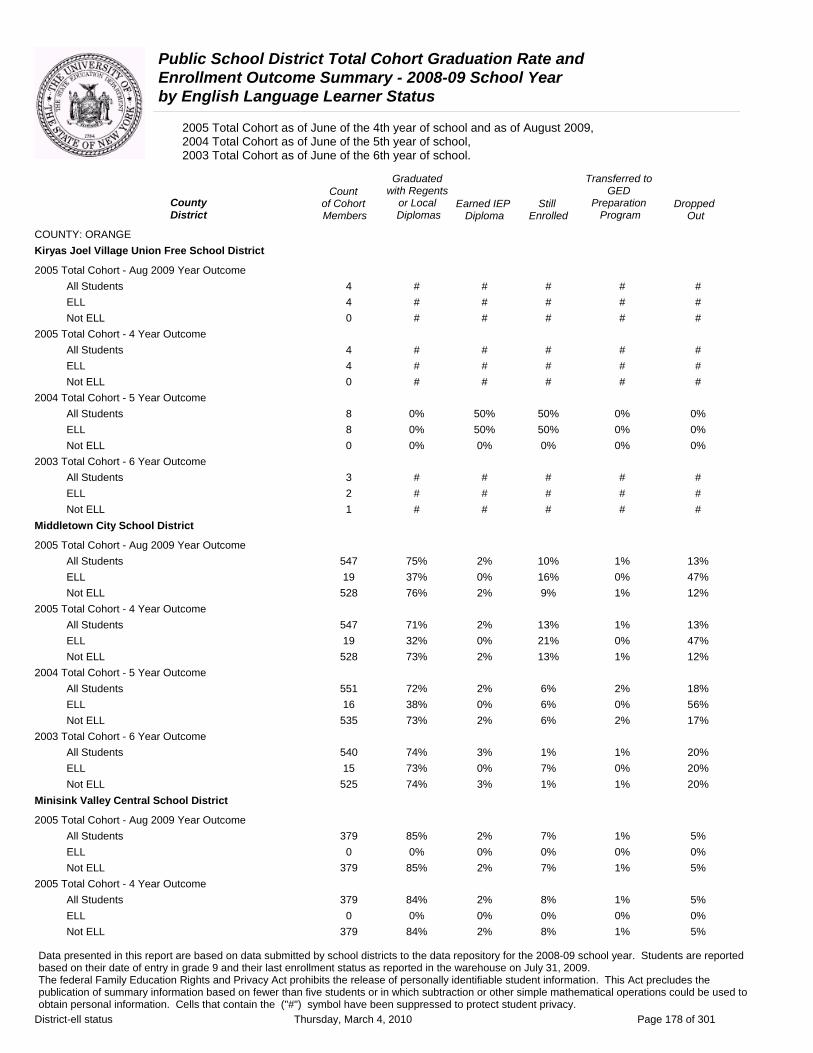
Public School District Total Cohort Graduation Rate and Enrollment Outcome Summary - 2008-09 School Year by English Language Learner Status
2005 Total Cohort as of June of the 4th year of school and as of August 2009, 2004 Total Cohort as of June of the 5th year of school, 2003 Total Cohort as of June of the 6th year of school.
Graduated Transferred to Count with Regents GED
County of Cohort or Local Earned IEP Still Preparation DroppedDistrict Members Diplomas Diploma Enrolled Program Out
COUNTY: ORANGE Kiryas Joel Village Union Free School District
2005 Total Cohort - Aug 2009 Year Outcome All Students 4 # # # # # ELL 4 # # # # # Not ELL 0 # # # # #
2005 Total Cohort - 4 Year Outcome All Students 4 # # # # # ELL 4 # # # # # Not ELL 0 # # # # #
2004 Total Cohort - 5 Year Outcome All Students 8 0% 50% 50% 0% 0% ELL 8 0% 50% 50% 0% 0% Not ELL 0 0% 0% 0% 0% 0%
2003 Total Cohort - 6 Year Outcome All Students 3 # # # # # ELL 2 # # # # # Not ELL 1 # # # # #
Middletown City School District
2005 Total Cohort - Aug 2009 Year Outcome All Students 547 75% 2% 10% 1% 13% ELL 19 37% 0% 16% 0% 47% Not ELL 528 76% 2% 9% 1% 12%
2005 Total Cohort - 4 Year Outcome All Students 547 71% 2% 13% 1% 13% ELL 19 32% 0% 21% 0% 47% Not ELL 528 73% 2% 13% 1% 12%
2004 Total Cohort - 5 Year Outcome All Students 551 72% 2% 6% 2% 18% ELL 16 38% 0% 6% 0% 56% Not ELL 535 73% 2% 6% 2% 17%
2003 Total Cohort - 6 Year Outcome All Students 540 74% 3% 1% 1% 20% ELL 15 73% 0% 7% 0% 20% Not ELL 525 74% 3% 1% 1% 20%
Minisink Valley Central School District
2005 Total Cohort - Aug 2009 Year Outcome All Students 379 85% 2% 7% 1% 5% ELL 0 0% 0% 0% 0% 0% Not ELL 379 85% 2% 7% 1% 5%
2005 Total Cohort - 4 Year Outcome All Students 379 84% 2% 8% 1% 5% ELL 0 0% 0% 0% 0% 0% Not ELL 379 84% 2% 8% 1% 5%
Data presented in this report are based on data submitted by school districts to the data repository for the 2008-09 school year. Students are reported based on their date of entry in grade 9 and their last enrollment status as reported in the warehouse on July 31, 2009. The federal Family Education Rights and Privacy Act prohibits the release of personally identifiable student information. This Act precludes the publication of summary information based on fewer than five students or in which subtraction or other simple mathematical operations could be used to obtain personal information. Cells that contain the ("#") symbol have been suppressed to protect student privacy.
District-ell status Thursday, March 4, 2010 Page 178 of 301
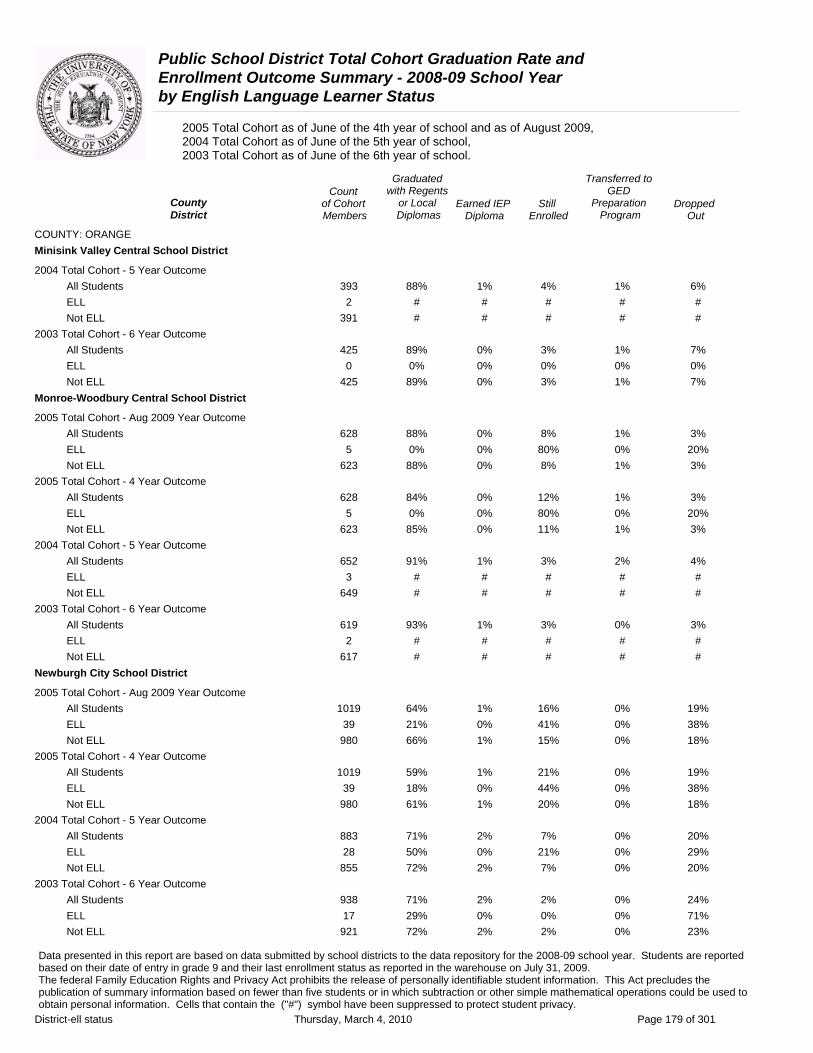
Public School District Total Cohort Graduation Rate and Enrollment Outcome Summary - 2008-09 School Year by English Language Learner Status
2005 Total Cohort as of June of the 4th year of school and as of August 2009, 2004 Total Cohort as of June of the 5th year of school, 2003 Total Cohort as of June of the 6th year of school.
Graduated Transferred to Count with Regents GED
County of Cohort or Local Earned IEP Still Preparation DroppedDistrict Members Diplomas Diploma Enrolled Program Out
COUNTY: ORANGE Minisink Valley Central School District
2004 Total Cohort - 5 Year Outcome All Students 393 88% 1% 4% 1% 6% ELL 2 # # # # # Not ELL 391 # # # # #
2003 Total Cohort - 6 Year Outcome All Students 425 89% 0% 3% 1% 7% ELL 0 0% 0% 0% 0% 0% Not ELL 425 89% 0% 3% 1% 7%
Monroe-Woodbury Central School District
2005 Total Cohort - Aug 2009 Year Outcome All Students 628 88% 0% 8% 1% 3% ELL 5 0% 0% 80% 0% 20% Not ELL 623 88% 0% 8% 1% 3%
2005 Total Cohort - 4 Year Outcome All Students 628 84% 0% 12% 1% 3% ELL 5 0% 0% 80% 0% 20% Not ELL 623 85% 0% 11% 1% 3%
2004 Total Cohort - 5 Year Outcome All Students 652 91% 1% 3% 2% 4% ELL 3 # # # # # Not ELL 649 # # # # #
2003 Total Cohort - 6 Year Outcome All Students 619 93% 1% 3% 0% 3% ELL 2 # # # # # Not ELL 617 # # # # #
Newburgh City School District
2005 Total Cohort - Aug 2009 Year Outcome All Students 1019 64% 1% 16% 0% 19% ELL 39 21% 0% 41% 0% 38% Not ELL 980 66% 1% 15% 0% 18%
2005 Total Cohort - 4 Year Outcome All Students 1019 59% 1% 21% 0% 19% ELL 39 18% 0% 44% 0% 38% Not ELL 980 61% 1% 20% 0% 18%
2004 Total Cohort - 5 Year Outcome All Students 883 71% 2% 7% 0% 20% ELL 28 50% 0% 21% 0% 29% Not ELL 855 72% 2% 7% 0% 20%
2003 Total Cohort - 6 Year Outcome All Students 938 71% 2% 2% 0% 24% ELL 17 29% 0% 0% 0% 71% Not ELL 921 72% 2% 2% 0% 23%
Data presented in this report are based on data submitted by school districts to the data repository for the 2008-09 school year. Students are reported based on their date of entry in grade 9 and their last enrollment status as reported in the warehouse on July 31, 2009. The federal Family Education Rights and Privacy Act prohibits the release of personally identifiable student information. This Act precludes the publication of summary information based on fewer than five students or in which subtraction or other simple mathematical operations could be used to obtain personal information. Cells that contain the ("#") symbol have been suppressed to protect student privacy.
District-ell status Thursday, March 4, 2010 Page 179 of 301
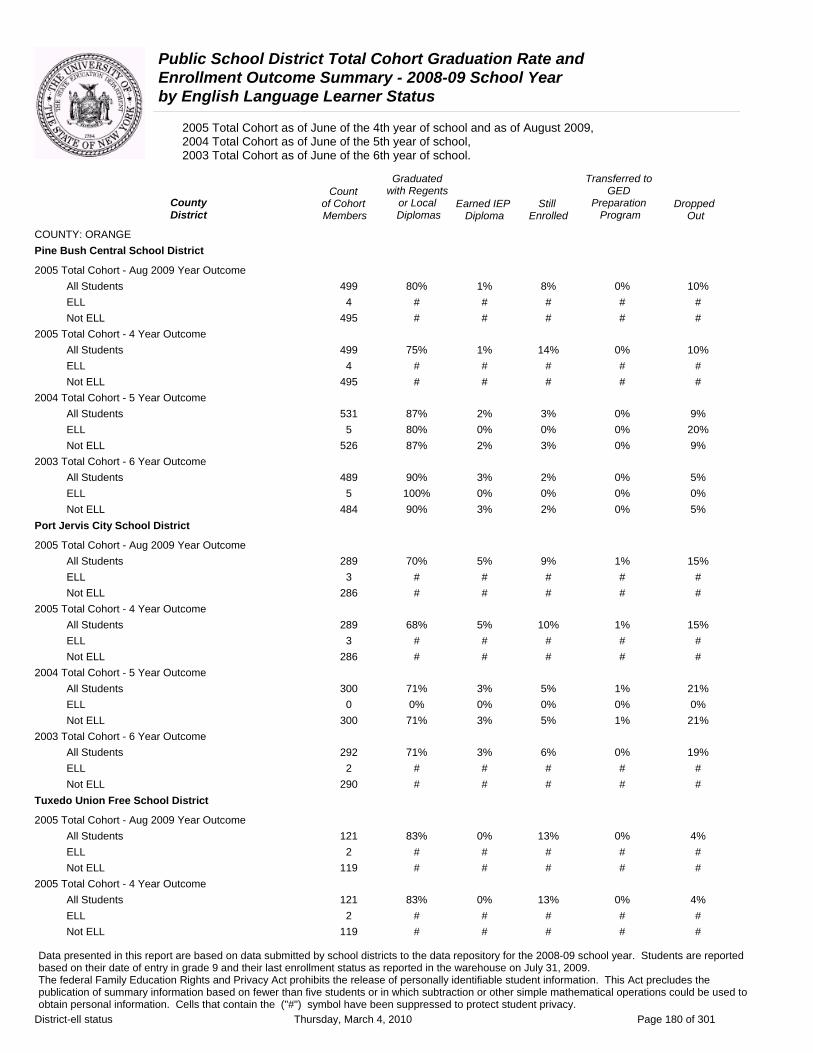
Public School District Total Cohort Graduation Rate and Enrollment Outcome Summary - 2008-09 School Year by English Language Learner Status
2005 Total Cohort as of June of the 4th year of school and as of August 2009, 2004 Total Cohort as of June of the 5th year of school, 2003 Total Cohort as of June of the 6th year of school.
Graduated Transferred to Count with Regents GED
County of Cohort or Local Earned IEP Still Preparation DroppedDistrict Members Diplomas Diploma Enrolled Program Out
COUNTY: ORANGE Pine Bush Central School District
2005 Total Cohort - Aug 2009 Year Outcome All Students 499 80% 1% 8% 0% 10% ELL 4 # # # # # Not ELL 495 # # # # #
2005 Total Cohort - 4 Year Outcome All Students 499 75% 1% 14% 0% 10% ELL 4 # # # # # Not ELL 495 # # # # #
2004 Total Cohort - 5 Year Outcome All Students 531 87% 2% 3% 0% 9% ELL 5 80% 0% 0% 0% 20% Not ELL 526 87% 2% 3% 0% 9%
2003 Total Cohort - 6 Year Outcome All Students 489 90% 3% 2% 0% 5% ELL 5 100% 0% 0% 0% 0% Not ELL 484 90% 3% 2% 0% 5%
Port Jervis City School District
2005 Total Cohort - Aug 2009 Year Outcome All Students 289 70% 5% 9% 1% 15% ELL 3 # # # # # Not ELL 286 # # # # #
2005 Total Cohort - 4 Year Outcome All Students 289 68% 5% 10% 1% 15% ELL 3 # # # # # Not ELL 286 # # # # #
2004 Total Cohort - 5 Year Outcome All Students 300 71% 3% 5% 1% 21% ELL 0 0% 0% 0% 0% 0% Not ELL 300 71% 3% 5% 1% 21%
2003 Total Cohort - 6 Year Outcome All Students 292 71% 3% 6% 0% 19% ELL 2 # # # # # Not ELL 290 # # # # #
Tuxedo Union Free School District
2005 Total Cohort - Aug 2009 Year Outcome All Students 121 83% 0% 13% 0% 4% ELL 2 # # # # # Not ELL 119 # # # # #
2005 Total Cohort - 4 Year Outcome All Students 121 83% 0% 13% 0% 4% ELL 2 # # # # # Not ELL 119 # # # # #
Data presented in this report are based on data submitted by school districts to the data repository for the 2008-09 school year. Students are reported based on their date of entry in grade 9 and their last enrollment status as reported in the warehouse on July 31, 2009. The federal Family Education Rights and Privacy Act prohibits the release of personally identifiable student information. This Act precludes the publication of summary information based on fewer than five students or in which subtraction or other simple mathematical operations could be used to obtain personal information. Cells that contain the ("#") symbol have been suppressed to protect student privacy.
District-ell status Thursday, March 4, 2010 Page 180 of 301
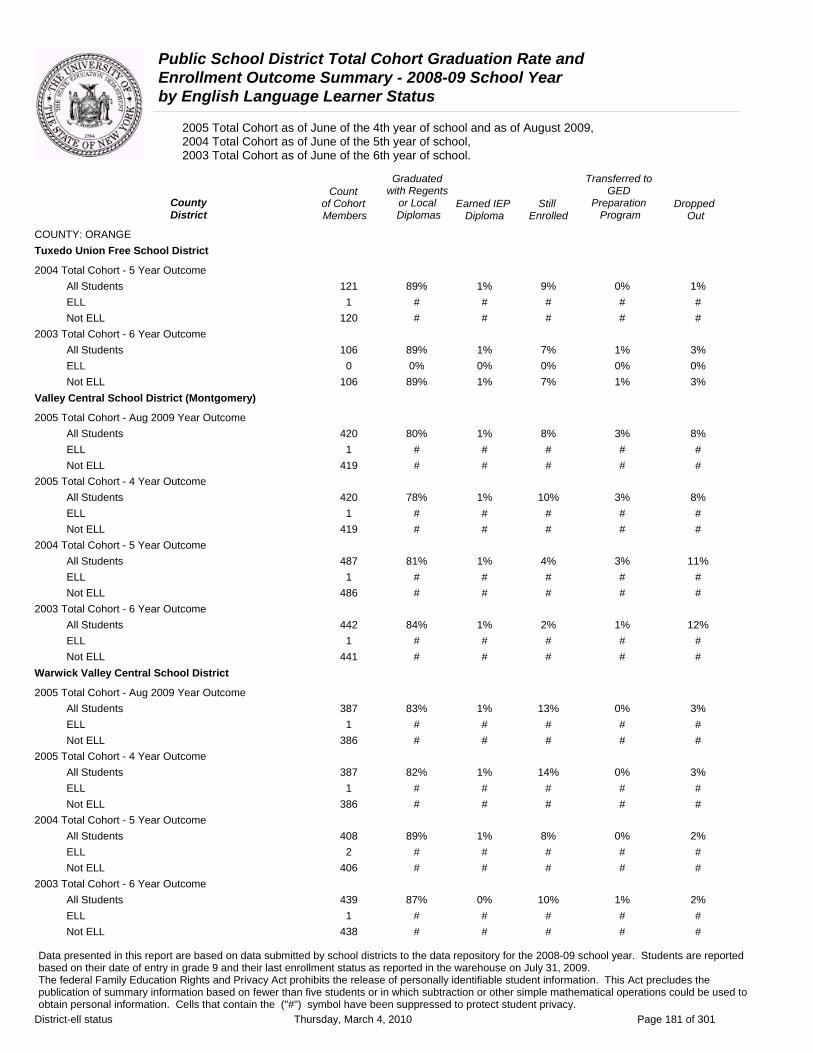
Public School District Total Cohort Graduation Rate and Enrollment Outcome Summary - 2008-09 School Year by English Language Learner Status
2005 Total Cohort as of June of the 4th year of school and as of August 2009, 2004 Total Cohort as of June of the 5th year of school, 2003 Total Cohort as of June of the 6th year of school.
Graduated Transferred to Count with Regents GED
County of Cohort or Local Earned IEP Still Preparation DroppedDistrict Members Diplomas Diploma Enrolled Program Out
COUNTY: ORANGE Tuxedo Union Free School District
2004 Total Cohort - 5 Year Outcome All Students 121 89% 1% 9% 0% 1% ELL 1 # # # # # Not ELL 120 # # # # #
2003 Total Cohort - 6 Year Outcome All Students 106 89% 1% 7% 1% 3% ELL 0 0% 0% 0% 0% 0% Not ELL 106 89% 1% 7% 1% 3%
Valley Central School District (Montgomery)
2005 Total Cohort - Aug 2009 Year Outcome All Students 420 80% 1% 8% 3% 8% ELL 1 # # # # # Not ELL 419 # # # # #
2005 Total Cohort - 4 Year Outcome All Students 420 78% 1% 10% 3% 8% ELL 1 # # # # # Not ELL 419 # # # # #
2004 Total Cohort - 5 Year Outcome All Students 487 81% 1% 4% 3% 11% ELL 1 # # # # # Not ELL 486 # # # # #
2003 Total Cohort - 6 Year Outcome All Students 442 84% 1% 2% 1% 12% ELL 1 # # # # # Not ELL 441 # # # # #
Warwick Valley Central School District
2005 Total Cohort - Aug 2009 Year Outcome All Students 387 83% 1% 13% 0% 3% ELL 1 # # # # # Not ELL 386 # # # # #
2005 Total Cohort - 4 Year Outcome All Students 387 82% 1% 14% 0% 3% ELL 1 # # # # # Not ELL 386 # # # # #
2004 Total Cohort - 5 Year Outcome All Students 408 89% 1% 8% 0% 2% ELL 2 # # # # # Not ELL 406 # # # # #
2003 Total Cohort - 6 Year Outcome All Students 439 87% 0% 10% 1% 2% ELL 1 # # # # # Not ELL 438 # # # # #
Data presented in this report are based on data submitted by school districts to the data repository for the 2008-09 school year. Students are reported based on their date of entry in grade 9 and their last enrollment status as reported in the warehouse on July 31, 2009. The federal Family Education Rights and Privacy Act prohibits the release of personally identifiable student information. This Act precludes the publication of summary information based on fewer than five students or in which subtraction or other simple mathematical operations could be used to obtain personal information. Cells that contain the ("#") symbol have been suppressed to protect student privacy.
District-ell status Thursday, March 4, 2010 Page 181 of 301

Public School District Total Cohort Graduation Rate and Enrollment Outcome Summary - 2008-09 School Year by English Language Learner Status
2005 Total Cohort as of June of the 4th year of school and as of August 2009, 2004 Total Cohort as of June of the 5th year of school, 2003 Total Cohort as of June of the 6th year of school.
Graduated Transferred to Count with Regents GED
County of Cohort or Local Earned IEP Still Preparation DroppedDistrict Members Diplomas Diploma Enrolled Program Out
COUNTY: ORANGE Washingtonville Central School District
2005 Total Cohort - Aug 2009 Year Outcome All Students 436 89% 2% 5% 1% 3% ELL 1 # # # # # Not ELL 435 # # # # #
2005 Total Cohort - 4 Year Outcome All Students 436 89% 2% 5% 1% 3% ELL 1 # # # # # Not ELL 435 # # # # #
2004 Total Cohort - 5 Year Outcome All Students 442 93% 1% 3% 0% 2% ELL 1 # # # # # Not ELL 441 # # # # #
2003 Total Cohort - 6 Year Outcome All Students 460 91% 0% 2% 0% 7% ELL 2 # # # # # Not ELL 458 # # # # #
Data presented in this report are based on data submitted by school districts to the data repository for the 2008-09 school year. Students are reported based on their date of entry in grade 9 and their last enrollment status as reported in the warehouse on July 31, 2009. The federal Family Education Rights and Privacy Act prohibits the release of personally identifiable student information. This Act precludes the publication of summary information based on fewer than five students or in which subtraction or other simple mathematical operations could be used to obtain personal information. Cells that contain the ("#") symbol have been suppressed to protect student privacy.
District-ell status Thursday, March 4, 2010 Page 182 of 301

Public School District Total Cohort Graduation Rate and Enrollment Outcome Summary - 2008-09 School Year by English Language Learner Status
2005 Total Cohort as of June of the 4th year of school and as of August 2009, 2004 Total Cohort as of June of the 5th year of school, 2003 Total Cohort as of June of the 6th year of school.
Graduated Transferred to Count with Regents GED
County of Cohort or Local Earned IEP Still Preparation DroppedDistrict Members Diplomas Diploma Enrolled Program Out
COUNTY: ORLEANS Albion Central School District
2005 Total Cohort - Aug 2009 Year Outcome All Students 203 82% 3% 5% 1% 8% ELL 0 0% 0% 0% 0% 0% Not ELL 203 82% 3% 5% 1% 8%
2005 Total Cohort - 4 Year Outcome All Students 203 82% 3% 5% 1% 8% ELL 0 0% 0% 0% 0% 0% Not ELL 203 82% 3% 5% 1% 8%
2004 Total Cohort - 5 Year Outcome All Students 247 86% 2% 2% 3% 6% ELL 2 # # # # # Not ELL 245 # # # # #
2003 Total Cohort - 6 Year Outcome All Students 200 83% 5% 0% 3% 10% ELL 1 # # # # # Not ELL 199 # # # # #
Holley Central School District
2005 Total Cohort - Aug 2009 Year Outcome All Students 114 86% 0% 2% 1% 11% ELL 0 0% 0% 0% 0% 0% Not ELL 114 86% 0% 2% 1% 11%
2005 Total Cohort - 4 Year Outcome All Students 114 84% 0% 4% 1% 11% ELL 0 0% 0% 0% 0% 0% Not ELL 114 84% 0% 4% 1% 11%
2004 Total Cohort - 5 Year Outcome All Students 123 76% 2% 2% 0% 20% ELL 2 # # # # # Not ELL 121 # # # # #
2003 Total Cohort - 6 Year Outcome All Students 111 82% 4% 0% 0% 14% ELL 0 0% 0% 0% 0% 0% Not ELL 111 82% 4% 0% 0% 14%
Kendall Central School District
2005 Total Cohort - Aug 2009 Year Outcome All Students 84 82% 1% 8% 2% 6% ELL 1 # # # # # Not ELL 83 # # # # #
2005 Total Cohort - 4 Year Outcome All Students 84 82% 1% 8% 2% 6% ELL 1 # # # # # Not ELL 83 # # # # #
Data presented in this report are based on data submitted by school districts to the data repository for the 2008-09 school year. Students are reported based on their date of entry in grade 9 and their last enrollment status as reported in the warehouse on July 31, 2009. The federal Family Education Rights and Privacy Act prohibits the release of personally identifiable student information. This Act precludes the publication of summary information based on fewer than five students or in which subtraction or other simple mathematical operations could be used to obtain personal information. Cells that contain the ("#") symbol have been suppressed to protect student privacy.
District-ell status Thursday, March 4, 2010 Page 183 of 301

Public School District Total Cohort Graduation Rate and Enrollment Outcome Summary - 2008-09 School Year by English Language Learner Status
2005 Total Cohort as of June of the 4th year of school and as of August 2009, 2004 Total Cohort as of June of the 5th year of school, 2003 Total Cohort as of June of the 6th year of school.
Graduated Transferred to Count with Regents GED
County of Cohort or Local Earned IEP Still Preparation DroppedDistrict Members Diplomas Diploma Enrolled Program Out
COUNTY: ORLEANS Kendall Central School District
2004 Total Cohort - 5 Year Outcome All Students 98 90% 0% 4% 1% 5% ELL 0 0% 0% 0% 0% 0% Not ELL 98 90% 0% 4% 1% 5%
2003 Total Cohort - 6 Year Outcome All Students 103 88% 0% 3% 4% 5% ELL 0 0% 0% 0% 0% 0% Not ELL 103 88% 0% 3% 4% 5%
Lyndonville Central School District
2005 Total Cohort - Aug 2009 Year Outcome All Students 73 89% 1% 7% 0% 3% ELL 0 0% 0% 0% 0% 0% Not ELL 73 89% 1% 7% 0% 3%
2005 Total Cohort - 4 Year Outcome All Students 73 89% 1% 7% 0% 3% ELL 0 0% 0% 0% 0% 0% Not ELL 73 89% 1% 7% 0% 3%
2004 Total Cohort - 5 Year Outcome All Students 64 81% 6% 2% 0% 11% ELL 0 0% 0% 0% 0% 0% Not ELL 64 81% 6% 2% 0% 11%
2003 Total Cohort - 6 Year Outcome All Students 68 90% 0% 1% 0% 9% ELL 0 0% 0% 0% 0% 0% Not ELL 68 90% 0% 1% 0% 9%
Medina Central School District
2005 Total Cohort - Aug 2009 Year Outcome All Students 151 78% 2% 5% 0% 15% ELL 0 0% 0% 0% 0% 0% Not ELL 151 78% 2% 5% 0% 15%
2005 Total Cohort - 4 Year Outcome All Students 151 76% 2% 7% 0% 15% ELL 0 0% 0% 0% 0% 0% Not ELL 151 76% 2% 7% 0% 15%
2004 Total Cohort - 5 Year Outcome All Students 181 80% 2% 8% 0% 10% ELL 0 0% 0% 0% 0% 0% Not ELL 181 80% 2% 8% 0% 10%
2003 Total Cohort - 6 Year Outcome All Students 151 77% 3% 4% 0% 16% ELL 0 0% 0% 0% 0% 0% Not ELL 151 77% 3% 4% 0% 16%
Data presented in this report are based on data submitted by school districts to the data repository for the 2008-09 school year. Students are reported based on their date of entry in grade 9 and their last enrollment status as reported in the warehouse on July 31, 2009. The federal Family Education Rights and Privacy Act prohibits the release of personally identifiable student information. This Act precludes the publication of summary information based on fewer than five students or in which subtraction or other simple mathematical operations could be used to obtain personal information. Cells that contain the ("#") symbol have been suppressed to protect student privacy.
District-ell status Thursday, March 4, 2010 Page 184 of 301
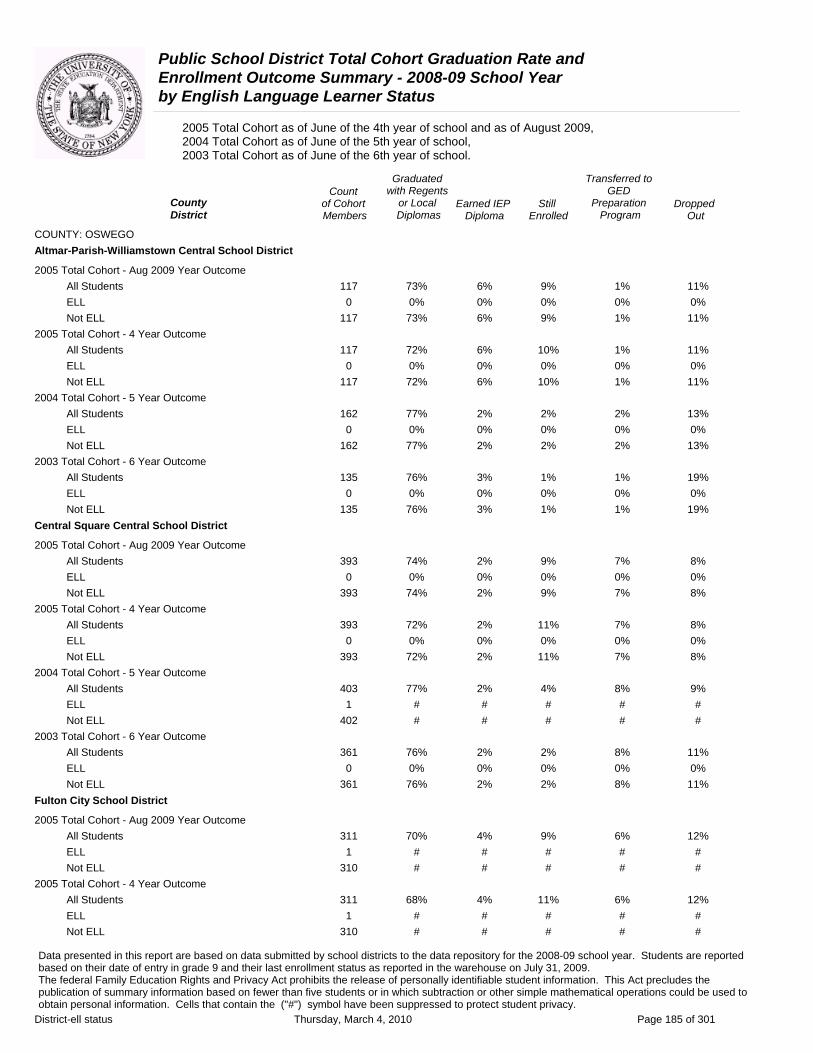
Public School District Total Cohort Graduation Rate and Enrollment Outcome Summary - 2008-09 School Year by English Language Learner Status
2005 Total Cohort as of June of the 4th year of school and as of August 2009, 2004 Total Cohort as of June of the 5th year of school, 2003 Total Cohort as of June of the 6th year of school.
Graduated Transferred to Count with Regents GED
County of Cohort or Local Earned IEP Still Preparation DroppedDistrict Members Diplomas Diploma Enrolled Program Out
COUNTY: OSWEGO Altmar-Parish-Williamstown Central School District
2005 Total Cohort - Aug 2009 Year Outcome All Students 117 73% 6% 9% 1% 11% ELL 0 0% 0% 0% 0% 0% Not ELL 117 73% 6% 9% 1% 11%
2005 Total Cohort - 4 Year Outcome All Students 117 72% 6% 10% 1% 11% ELL 0 0% 0% 0% 0% 0% Not ELL 117 72% 6% 10% 1% 11%
2004 Total Cohort - 5 Year Outcome All Students 162 77% 2% 2% 2% 13% ELL 0 0% 0% 0% 0% 0% Not ELL 162 77% 2% 2% 2% 13%
2003 Total Cohort - 6 Year Outcome All Students 135 76% 3% 1% 1% 19% ELL 0 0% 0% 0% 0% 0% Not ELL 135 76% 3% 1% 1% 19%
Central Square Central School District
2005 Total Cohort - Aug 2009 Year Outcome All Students 393 74% 2% 9% 7% 8% ELL 0 0% 0% 0% 0% 0% Not ELL 393 74% 2% 9% 7% 8%
2005 Total Cohort - 4 Year Outcome All Students 393 72% 2% 11% 7% 8% ELL 0 0% 0% 0% 0% 0% Not ELL 393 72% 2% 11% 7% 8%
2004 Total Cohort - 5 Year Outcome All Students 403 77% 2% 4% 8% 9% ELL 1 # # # # # Not ELL 402 # # # # #
2003 Total Cohort - 6 Year Outcome All Students 361 76% 2% 2% 8% 11% ELL 0 0% 0% 0% 0% 0% Not ELL 361 76% 2% 2% 8% 11%
Fulton City School District
2005 Total Cohort - Aug 2009 Year Outcome All Students 311 70% 4% 9% 6% 12% ELL 1 # # # # # Not ELL 310 # # # # #
2005 Total Cohort - 4 Year Outcome All Students 311 68% 4% 11% 6% 12% ELL 1 # # # # # Not ELL 310 # # # # #
Data presented in this report are based on data submitted by school districts to the data repository for the 2008-09 school year. Students are reported based on their date of entry in grade 9 and their last enrollment status as reported in the warehouse on July 31, 2009. The federal Family Education Rights and Privacy Act prohibits the release of personally identifiable student information. This Act precludes the publication of summary information based on fewer than five students or in which subtraction or other simple mathematical operations could be used to obtain personal information. Cells that contain the ("#") symbol have been suppressed to protect student privacy.
District-ell status Thursday, March 4, 2010 Page 185 of 301

Public School District Total Cohort Graduation Rate and Enrollment Outcome Summary - 2008-09 School Year by English Language Learner Status
2005 Total Cohort as of June of the 4th year of school and as of August 2009, 2004 Total Cohort as of June of the 5th year of school, 2003 Total Cohort as of June of the 6th year of school.
Graduated Transferred to Count with Regents GED
County District
of Cohort Members
or Local Diplomas
Earned IEP Diploma
Still Enrolled
Preparation Program
Dropped Out
COUNTY: OSWEGO Fulton City School District
2004 Total Cohort - 5 Year Outcome All Students 315 74% 4% 2% 3% 17% ELL 0 0% 0% 0% 0% 0% Not ELL 315 74% 4% 2% 3% 17%
2003 Total Cohort - 6 Year Outcome All Students 303 69% 5% 1% 3% 21% ELL 0 0% 0% 0% 0% 0% Not ELL 303 69% 5% 1% 3% 21%
Hannibal Central School District
2005 Total Cohort - Aug 2009 Year Outcome All Students 126 67% 2% 7% 3% 20% ELL 0 0% 0% 0% 0% 0% Not ELL 126 67% 2% 7% 3% 20%
2005 Total Cohort - 4 Year Outcome All Students 126 67% 2% 8% 3% 20% ELL 0 0% 0% 0% 0% 0% Not ELL 126 67% 2% 8% 3% 20%
2004 Total Cohort - 5 Year Outcome All Students 121 69% 6% 5% 4% 16% ELL 0 0% 0% 0% 0% 0% Not ELL 121 69% 6% 5% 4% 16%
2003 Total Cohort - 6 Year Outcome All Students 135 74% 4% 1% 1% 20% ELL 0 0% 0% 0% 0% 0% Not ELL 135 74% 4% 1% 1% 20%
Mexico Central School District
2005 Total Cohort - Aug 2009 Year Outcome All Students 224 83% 4% 5% 0% 7% ELL 1 # # # # # Not ELL 223 # # # # #
2005 Total Cohort - 4 Year Outcome All Students 224 83% 4% 5% 0% 7% ELL 1 # # # # # Not ELL 223 # # # # #
2004 Total Cohort - 5 Year Outcome All Students 249 80% 4% 2% 2% 11% ELL 0 0% 0% 0% 0% 0% Not ELL 249 80% 4% 2% 2% 11%
2003 Total Cohort - 6 Year Outcome All Students 227 78% 5% 0% 2% 14% ELL 0 0% 0% 0% 0% 0% Not ELL 227 78% 5% 0% 2% 14%
Data presented in this report are based on data submitted by school districts to the data repository for the 2008-09 school year. Students are reported based on their date of entry in grade 9 and their last enrollment status as reported in the warehouse on July 31, 2009. The federal Family Education Rights and Privacy Act prohibits the release of personally identifiable student information. This Act precludes the publication of summary information based on fewer than five students or in which subtraction or other simple mathematical operations could be used to obtain personal information. Cells that contain the ("#") symbol have been suppressed to protect student privacy.
District-ell status Thursday, March 4, 2010 Page 186 of 301
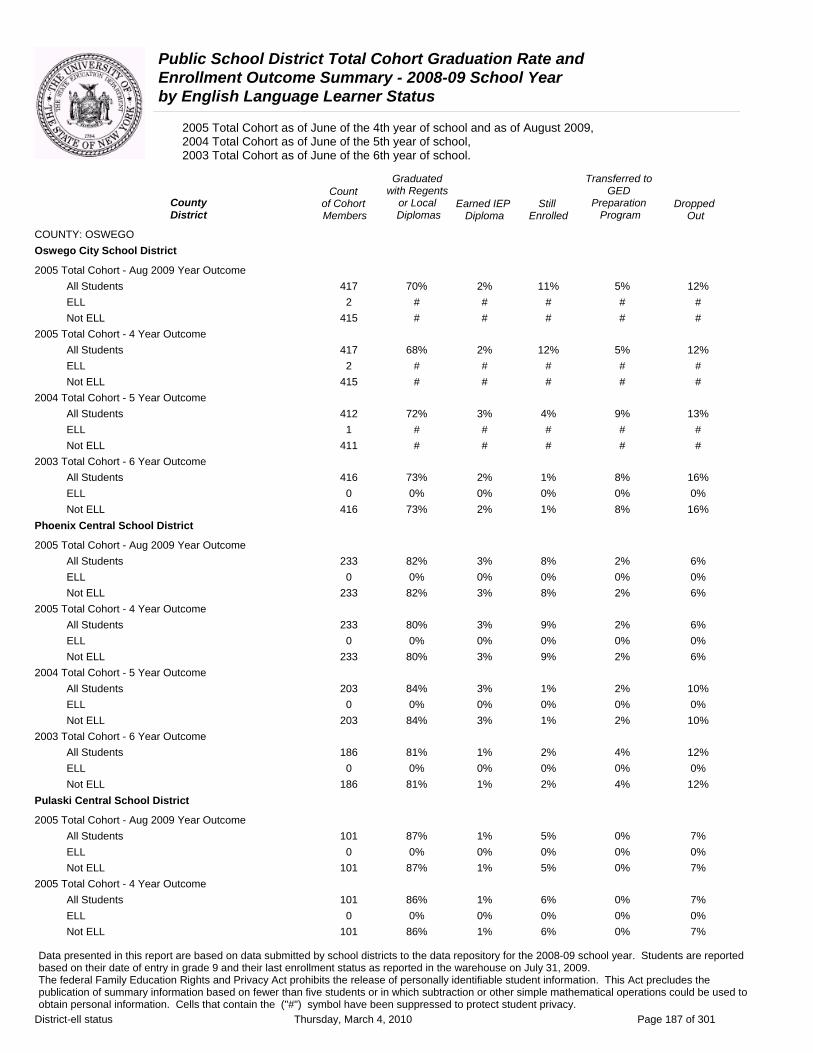
Public School District Total Cohort Graduation Rate and Enrollment Outcome Summary - 2008-09 School Year by English Language Learner Status
2005 Total Cohort as of June of the 4th year of school and as of August 2009, 2004 Total Cohort as of June of the 5th year of school, 2003 Total Cohort as of June of the 6th year of school.
Graduated Transferred to Count with Regents GED
County District
of Cohort Members
or Local Diplomas
Earned IEP Diploma
Still Enrolled
Preparation Program
Dropped Out
COUNTY: OSWEGO Oswego City School District
2005 Total Cohort - Aug 2009 Year Outcome All Students 417 70% 2% 11% 5% 12% ELL 2 # # # # # Not ELL 415 # # # # #
2005 Total Cohort - 4 Year Outcome All Students 417 68% 2% 12% 5% 12% ELL 2 # # # # # Not ELL 415 # # # # #
2004 Total Cohort - 5 Year Outcome All Students 412 72% 3% 4% 9% 13% ELL 1 # # # # # Not ELL 411 # # # # #
2003 Total Cohort - 6 Year Outcome All Students 416 73% 2% 1% 8% 16% ELL 0 0% 0% 0% 0% 0% Not ELL 416 73% 2% 1% 8% 16%
Phoenix Central School District
2005 Total Cohort - Aug 2009 Year Outcome All Students 233 82% 3% 8% 2% 6% ELL 0 0% 0% 0% 0% 0% Not ELL 233 82% 3% 8% 2% 6%
2005 Total Cohort - 4 Year Outcome All Students 233 80% 3% 9% 2% 6% ELL 0 0% 0% 0% 0% 0% Not ELL 233 80% 3% 9% 2% 6%
2004 Total Cohort - 5 Year Outcome All Students 203 84% 3% 1% 2% 10% ELL 0 0% 0% 0% 0% 0% Not ELL 203 84% 3% 1% 2% 10%
2003 Total Cohort - 6 Year Outcome All Students 186 81% 1% 2% 4% 12% ELL 0 0% 0% 0% 0% 0% Not ELL 186 81% 1% 2% 4% 12%
Pulaski Central School District
2005 Total Cohort - Aug 2009 Year Outcome All Students 101 87% 1% 5% 0% 7% ELL 0 0% 0% 0% 0% 0% Not ELL 101 87% 1% 5% 0% 7%
2005 Total Cohort - 4 Year Outcome All Students 101 86% 1% 6% 0% 7% ELL 0 0% 0% 0% 0% 0% Not ELL 101 86% 1% 6% 0% 7%
Data presented in this report are based on data submitted by school districts to the data repository for the 2008-09 school year. Students are reported based on their date of entry in grade 9 and their last enrollment status as reported in the warehouse on July 31, 2009. The federal Family Education Rights and Privacy Act prohibits the release of personally identifiable student information. This Act precludes the publication of summary information based on fewer than five students or in which subtraction or other simple mathematical operations could be used to obtain personal information. Cells that contain the ("#") symbol have been suppressed to protect student privacy.
District-ell status Thursday, March 4, 2010 Page 187 of 301
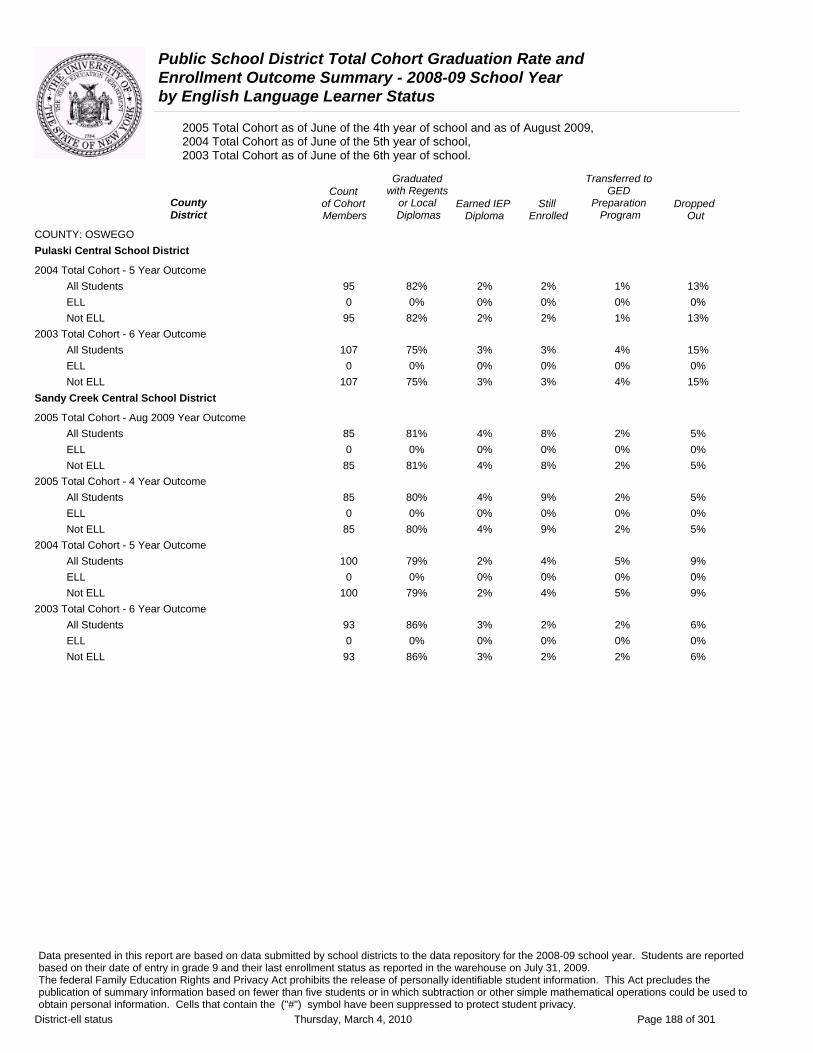
Public School District Total Cohort Graduation Rate and Enrollment Outcome Summary - 2008-09 School Year by English Language Learner Status
2005 Total Cohort as of June of the 4th year of school and as of August 2009, 2004 Total Cohort as of June of the 5th year of school, 2003 Total Cohort as of June of the 6th year of school.
Graduated Transferred to Count with Regents GED
County of Cohort or Local Earned IEP Still Preparation DroppedDistrict Members Diplomas Diploma Enrolled Program Out
COUNTY: OSWEGO Pulaski Central School District
2004 Total Cohort - 5 Year Outcome All Students 95 82% 2% 2% 1% 13% ELL 0 0% 0% 0% 0% 0% Not ELL 95 82% 2% 2% 1% 13%
2003 Total Cohort - 6 Year Outcome All Students 107 75% 3% 3% 4% 15% ELL 0 0% 0% 0% 0% 0% Not ELL 107 75% 3% 3% 4% 15%
Sandy Creek Central School District
2005 Total Cohort - Aug 2009 Year Outcome All Students 85 81% 4% 8% 2% 5% ELL 0 0% 0% 0% 0% 0% Not ELL 85 81% 4% 8% 2% 5%
2005 Total Cohort - 4 Year Outcome All Students 85 80% 4% 9% 2% 5% ELL 0 0% 0% 0% 0% 0% Not ELL 85 80% 4% 9% 2% 5%
2004 Total Cohort - 5 Year Outcome All Students 100 79% 2% 4% 5% 9% ELL 0 0% 0% 0% 0% 0% Not ELL 100 79% 2% 4% 5% 9%
2003 Total Cohort - 6 Year Outcome All Students 93 86% 3% 2% 2% 6% ELL 0 0% 0% 0% 0% 0% Not ELL 93 86% 3% 2% 2% 6%
Data presented in this report are based on data submitted by school districts to the data repository for the 2008-09 school year. Students are reported based on their date of entry in grade 9 and their last enrollment status as reported in the warehouse on July 31, 2009. The federal Family Education Rights and Privacy Act prohibits the release of personally identifiable student information. This Act precludes the publication of summary information based on fewer than five students or in which subtraction or other simple mathematical operations could be used to obtain personal information. Cells that contain the ("#") symbol have been suppressed to protect student privacy.
District-ell status Thursday, March 4, 2010 Page 188 of 301

Public School District Total Cohort Graduation Rate and Enrollment Outcome Summary - 2008-09 School Year by English Language Learner Status
2005 Total Cohort as of June of the 4th year of school and as of August 2009, 2004 Total Cohort as of June of the 5th year of school, 2003 Total Cohort as of June of the 6th year of school.
Graduated Transferred to Count with Regents GED
County of Cohort or Local Earned IEP Still Preparation DroppedDistrict Members Diplomas Diploma Enrolled Program Out
COUNTY: OTSEGO Cherry Valley-Springfield Central School District
2005 Total Cohort - Aug 2009 Year Outcome All Students 65 86% 11% 3% 0% 0% ELL 0 0% 0% 0% 0% 0% Not ELL 65 86% 11% 3% 0% 0%
2005 Total Cohort - 4 Year Outcome All Students 65 86% 11% 3% 0% 0% ELL 0 0% 0% 0% 0% 0% Not ELL 65 86% 11% 3% 0% 0%
2004 Total Cohort - 5 Year Outcome All Students 62 74% 6% 11% 2% 6% ELL 0 0% 0% 0% 0% 0% Not ELL 62 74% 6% 11% 2% 6%
2003 Total Cohort - 6 Year Outcome All Students 55 71% 5% 5% 15% 4% ELL 0 0% 0% 0% 0% 0% Not ELL 55 71% 5% 5% 15% 4%
Cooperstown Central School District
2005 Total Cohort - Aug 2009 Year Outcome All Students 104 83% 2% 10% 1% 5% ELL 0 0% 0% 0% 0% 0% Not ELL 104 83% 2% 10% 1% 5%
2005 Total Cohort - 4 Year Outcome All Students 104 83% 2% 10% 1% 5% ELL 0 0% 0% 0% 0% 0% Not ELL 104 83% 2% 10% 1% 5%
2004 Total Cohort - 5 Year Outcome All Students 97 94% 3% 1% 2% 0% ELL 0 0% 0% 0% 0% 0% Not ELL 97 94% 3% 1% 2% 0%
2003 Total Cohort - 6 Year Outcome All Students 95 94% 2% 0% 0% 4% ELL 0 0% 0% 0% 0% 0% Not ELL 95 94% 2% 0% 0% 4%
Edmeston Central School District
2005 Total Cohort - Aug 2009 Year Outcome All Students 60 85% 7% 7% 2% 0% ELL 0 0% 0% 0% 0% 0% Not ELL 60 85% 7% 7% 2% 0%
2005 Total Cohort - 4 Year Outcome All Students 60 82% 7% 10% 2% 0% ELL 0 0% 0% 0% 0% 0% Not ELL 60 82% 7% 10% 2% 0%
Data presented in this report are based on data submitted by school districts to the data repository for the 2008-09 school year. Students are reported based on their date of entry in grade 9 and their last enrollment status as reported in the warehouse on July 31, 2009. The federal Family Education Rights and Privacy Act prohibits the release of personally identifiable student information. This Act precludes the publication of summary information based on fewer than five students or in which subtraction or other simple mathematical operations could be used to obtain personal information. Cells that contain the ("#") symbol have been suppressed to protect student privacy.
District-ell status Thursday, March 4, 2010 Page 189 of 301
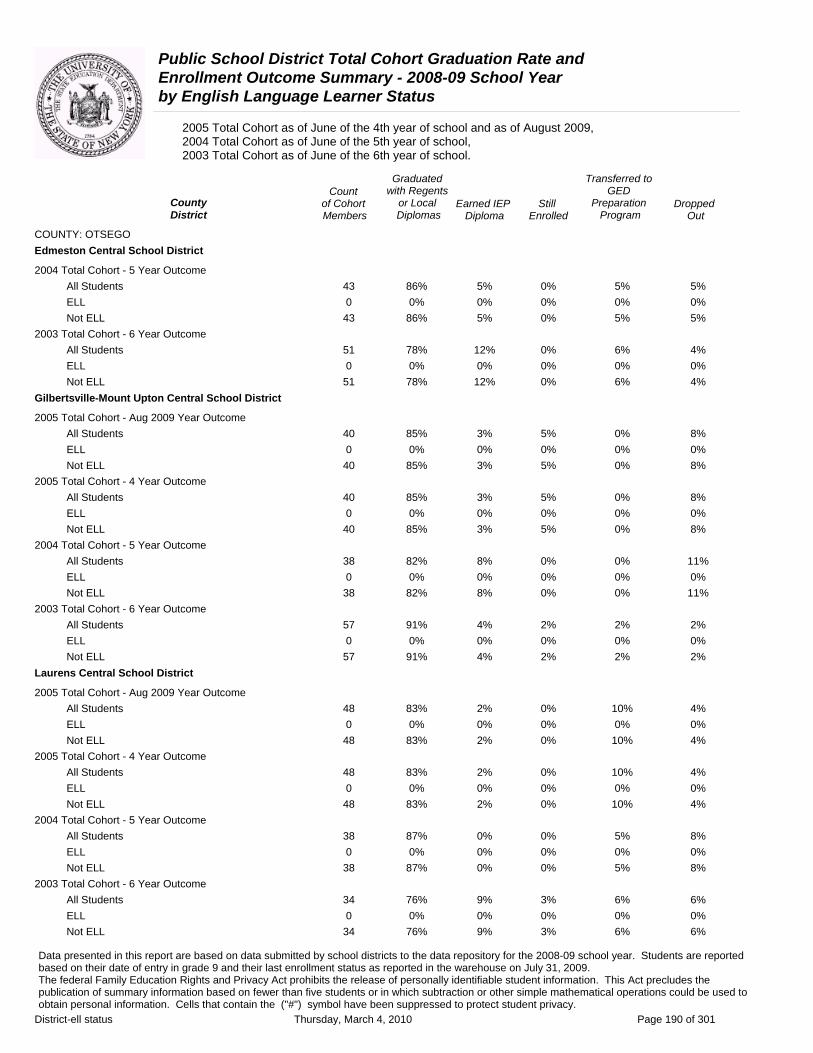
Public School District Total Cohort Graduation Rate and Enrollment Outcome Summary - 2008-09 School Year by English Language Learner Status
2005 Total Cohort as of June of the 4th year of school and as of August 2009, 2004 Total Cohort as of June of the 5th year of school, 2003 Total Cohort as of June of the 6th year of school.
Graduated Transferred to Count with Regents GED
County of Cohort or Local Earned IEP Still Preparation DroppedDistrict Members Diplomas Diploma Enrolled Program Out
COUNTY: OTSEGO Edmeston Central School District
2004 Total Cohort - 5 Year Outcome All Students 43 86% 5% 0% 5% 5% ELL 0 0% 0% 0% 0% 0% Not ELL 43 86% 5% 0% 5% 5%
2003 Total Cohort - 6 Year Outcome All Students 51 78% 12% 0% 6% 4% ELL 0 0% 0% 0% 0% 0% Not ELL 51 78% 12% 0% 6% 4%
Gilbertsville-Mount Upton Central School District
2005 Total Cohort - Aug 2009 Year Outcome All Students 40 85% 3% 5% 0% 8% ELL 0 0% 0% 0% 0% 0% Not ELL 40 85% 3% 5% 0% 8%
2005 Total Cohort - 4 Year Outcome All Students 40 85% 3% 5% 0% 8% ELL 0 0% 0% 0% 0% 0% Not ELL 40 85% 3% 5% 0% 8%
2004 Total Cohort - 5 Year Outcome All Students 38 82% 8% 0% 0% 11% ELL 0 0% 0% 0% 0% 0% Not ELL 38 82% 8% 0% 0% 11%
2003 Total Cohort - 6 Year Outcome All Students 57 91% 4% 2% 2% 2% ELL 0 0% 0% 0% 0% 0% Not ELL 57 91% 4% 2% 2% 2%
Laurens Central School District
2005 Total Cohort - Aug 2009 Year Outcome All Students 48 83% 2% 0% 10% 4% ELL 0 0% 0% 0% 0% 0% Not ELL 48 83% 2% 0% 10% 4%
2005 Total Cohort - 4 Year Outcome All Students 48 83% 2% 0% 10% 4% ELL 0 0% 0% 0% 0% 0% Not ELL 48 83% 2% 0% 10% 4%
2004 Total Cohort - 5 Year Outcome All Students 38 87% 0% 0% 5% 8% ELL 0 0% 0% 0% 0% 0% Not ELL 38 87% 0% 0% 5% 8%
2003 Total Cohort - 6 Year Outcome All Students 34 76% 9% 3% 6% 6% ELL 0 0% 0% 0% 0% 0% Not ELL 34 76% 9% 3% 6% 6%
Data presented in this report are based on data submitted by school districts to the data repository for the 2008-09 school year. Students are reported based on their date of entry in grade 9 and their last enrollment status as reported in the warehouse on July 31, 2009. The federal Family Education Rights and Privacy Act prohibits the release of personally identifiable student information. This Act precludes the publication of summary information based on fewer than five students or in which subtraction or other simple mathematical operations could be used to obtain personal information. Cells that contain the ("#") symbol have been suppressed to protect student privacy.
District-ell status Thursday, March 4, 2010 Page 190 of 301
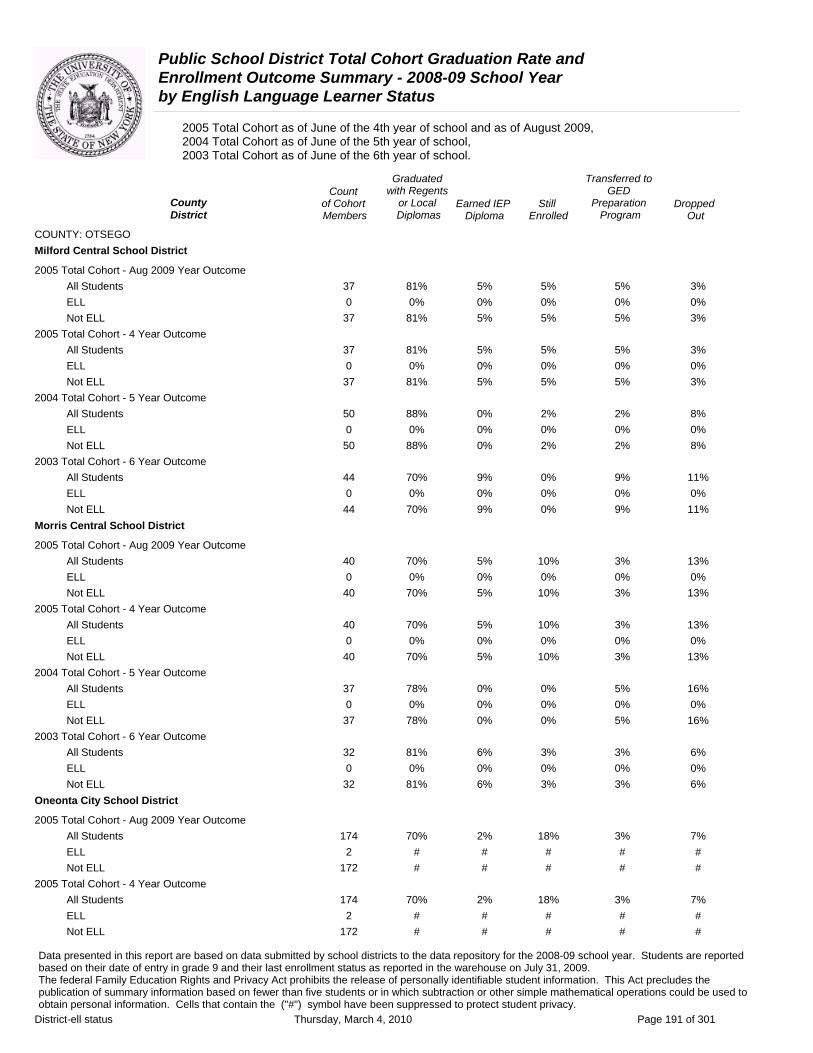
Public School District Total Cohort Graduation Rate and Enrollment Outcome Summary - 2008-09 School Year by English Language Learner Status
2005 Total Cohort as of June of the 4th year of school and as of August 2009, 2004 Total Cohort as of June of the 5th year of school, 2003 Total Cohort as of June of the 6th year of school.
Graduated Transferred to Count with Regents GED
County District
of Cohort Members
or Local Diplomas
Earned IEP Diploma
Still Enrolled
Preparation Program
Dropped Out
COUNTY: OTSEGO Milford Central School District
2005 Total Cohort - Aug 2009 Year Outcome All Students 37 81% 5% 5% 5% 3% ELL 0 0% 0% 0% 0% 0% Not ELL 37 81% 5% 5% 5% 3%
2005 Total Cohort - 4 Year Outcome All Students 37 81% 5% 5% 5% 3% ELL 0 0% 0% 0% 0% 0% Not ELL 37 81% 5% 5% 5% 3%
2004 Total Cohort - 5 Year Outcome All Students 50 88% 0% 2% 2% 8% ELL 0 0% 0% 0% 0% 0% Not ELL 50 88% 0% 2% 2% 8%
2003 Total Cohort - 6 Year Outcome All Students 44 70% 9% 0% 9% 11% ELL 0 0% 0% 0% 0% 0% Not ELL 44 70% 9% 0% 9% 11%
Morris Central School District
2005 Total Cohort - Aug 2009 Year Outcome All Students 40 70% 5% 10% 3% 13% ELL 0 0% 0% 0% 0% 0% Not ELL 40 70% 5% 10% 3% 13%
2005 Total Cohort - 4 Year Outcome All Students 40 70% 5% 10% 3% 13% ELL 0 0% 0% 0% 0% 0% Not ELL 40 70% 5% 10% 3% 13%
2004 Total Cohort - 5 Year Outcome All Students 37 78% 0% 0% 5% 16% ELL 0 0% 0% 0% 0% 0% Not ELL 37 78% 0% 0% 5% 16%
2003 Total Cohort - 6 Year Outcome All Students 32 81% 6% 3% 3% 6% ELL 0 0% 0% 0% 0% 0% Not ELL 32 81% 6% 3% 3% 6%
Oneonta City School District
2005 Total Cohort - Aug 2009 Year Outcome All Students 174 70% 2% 18% 3% 7% ELL 2 # # # # # Not ELL 172 # # # # #
2005 Total Cohort - 4 Year Outcome All Students 174 70% 2% 18% 3% 7% ELL 2 # # # # # Not ELL 172 # # # # #
Data presented in this report are based on data submitted by school districts to the data repository for the 2008-09 school year. Students are reported based on their date of entry in grade 9 and their last enrollment status as reported in the warehouse on July 31, 2009. The federal Family Education Rights and Privacy Act prohibits the release of personally identifiable student information. This Act precludes the publication of summary information based on fewer than five students or in which subtraction or other simple mathematical operations could be used to obtain personal information. Cells that contain the ("#") symbol have been suppressed to protect student privacy.
District-ell status Thursday, March 4, 2010 Page 191 of 301

Public School District Total Cohort Graduation Rate and Enrollment Outcome Summary - 2008-09 School Year by English Language Learner Status
2005 Total Cohort as of June of the 4th year of school and as of August 2009, 2004 Total Cohort as of June of the 5th year of school, 2003 Total Cohort as of June of the 6th year of school.
Graduated Transferred to Count with Regents GED
County District
of Cohort Members
or Local Diplomas
Earned IEP Diploma
Still Enrolled
Preparation Program
Dropped Out
COUNTY: OTSEGO Oneonta City School District
2004 Total Cohort - 5 Year Outcome All Students 211 81% 3% 7% 6% 4% ELL 0 0% 0% 0% 0% 0% Not ELL 211 81% 3% 7% 6% 4%
2003 Total Cohort - 6 Year Outcome All Students 187 72% 2% 6% 12% 7% ELL 0 0% 0% 0% 0% 0% Not ELL 187 72% 2% 6% 12% 7%
Otego-Unadilla Central School District
2005 Total Cohort - Aug 2009 Year Outcome All Students 106 61% 3% 22% 0% 14% ELL 0 0% 0% 0% 0% 0% Not ELL 106 61% 3% 22% 0% 14%
2005 Total Cohort - 4 Year Outcome All Students 106 61% 3% 22% 0% 14% ELL 0 0% 0% 0% 0% 0% Not ELL 106 61% 3% 22% 0% 14%
2004 Total Cohort - 5 Year Outcome All Students 114 75% 2% 8% 2% 14% ELL 0 0% 0% 0% 0% 0% Not ELL 114 75% 2% 8% 2% 14%
2003 Total Cohort - 6 Year Outcome All Students 89 74% 1% 7% 0% 18% ELL 0 0% 0% 0% 0% 0% Not ELL 89 74% 1% 7% 0% 18%
Richfield Springs Central School District
2005 Total Cohort - Aug 2009 Year Outcome All Students 56 82% 2% 9% 2% 5% ELL 0 0% 0% 0% 0% 0% Not ELL 56 82% 2% 9% 2% 5%
2005 Total Cohort - 4 Year Outcome All Students 56 82% 2% 9% 2% 5% ELL 0 0% 0% 0% 0% 0% Not ELL 56 82% 2% 9% 2% 5%
2004 Total Cohort - 5 Year Outcome All Students 44 82% 2% 0% 2% 14% ELL 0 0% 0% 0% 0% 0% Not ELL 44 82% 2% 0% 2% 14%
2003 Total Cohort - 6 Year Outcome All Students 65 74% 2% 6% 9% 9% ELL 0 0% 0% 0% 0% 0% Not ELL 65 74% 2% 6% 9% 9%
Data presented in this report are based on data submitted by school districts to the data repository for the 2008-09 school year. Students are reported based on their date of entry in grade 9 and their last enrollment status as reported in the warehouse on July 31, 2009. The federal Family Education Rights and Privacy Act prohibits the release of personally identifiable student information. This Act precludes the publication of summary information based on fewer than five students or in which subtraction or other simple mathematical operations could be used to obtain personal information. Cells that contain the ("#") symbol have been suppressed to protect student privacy.
District-ell status Thursday, March 4, 2010 Page 192 of 301

Public School District Total Cohort Graduation Rate and Enrollment Outcome Summary - 2008-09 School Year by English Language Learner Status
2005 Total Cohort as of June of the 4th year of school and as of August 2009, 2004 Total Cohort as of June of the 5th year of school, 2003 Total Cohort as of June of the 6th year of school.
Graduated Transferred to Count with Regents GED
County of Cohort or Local Earned IEP Still Preparation DroppedDistrict Members Diplomas Diploma Enrolled Program Out
COUNTY: OTSEGO Schenevus Central School District
2005 Total Cohort - Aug 2009 Year Outcome All Students 37 78% 5% 5% 0% 11% ELL 0 0% 0% 0% 0% 0% Not ELL 37 78% 5% 5% 0% 11%
2005 Total Cohort - 4 Year Outcome All Students 37 76% 5% 8% 0% 11% ELL 0 0% 0% 0% 0% 0% Not ELL 37 76% 5% 8% 0% 11%
2004 Total Cohort - 5 Year Outcome All Students 30 90% 7% 0% 0% 3% ELL 0 0% 0% 0% 0% 0% Not ELL 30 90% 7% 0% 0% 3%
2003 Total Cohort - 6 Year Outcome All Students 29 83% 0% 0% 3% 14% ELL 0 0% 0% 0% 0% 0% Not ELL 29 83% 0% 0% 3% 14%
Worcester Central School District
2005 Total Cohort - Aug 2009 Year Outcome All Students 26 69% 4% 8% 8% 12% ELL 0 0% 0% 0% 0% 0% Not ELL 26 69% 4% 8% 8% 12%
2005 Total Cohort - 4 Year Outcome All Students 26 69% 4% 8% 8% 12% ELL 0 0% 0% 0% 0% 0% Not ELL 26 69% 4% 8% 8% 12%
2004 Total Cohort - 5 Year Outcome All Students 40 75% 0% 3% 10% 13% ELL 0 0% 0% 0% 0% 0% Not ELL 40 75% 0% 3% 10% 13%
2003 Total Cohort - 6 Year Outcome All Students 38 87% 5% 3% 3% 3% ELL 0 0% 0% 0% 0% 0% Not ELL 38 87% 5% 3% 3% 3%
Data presented in this report are based on data submitted by school districts to the data repository for the 2008-09 school year. Students are reported based on their date of entry in grade 9 and their last enrollment status as reported in the warehouse on July 31, 2009. The federal Family Education Rights and Privacy Act prohibits the release of personally identifiable student information. This Act precludes the publication of summary information based on fewer than five students or in which subtraction or other simple mathematical operations could be used to obtain personal information. Cells that contain the ("#") symbol have been suppressed to protect student privacy.
District-ell status Thursday, March 4, 2010 Page 193 of 301

Public School District Total Cohort Graduation Rate and Enrollment Outcome Summary - 2008-09 School Year by English Language Learner Status
2005 Total Cohort as of June of the 4th year of school and as of August 2009, 2004 Total Cohort as of June of the 5th year of school, 2003 Total Cohort as of June of the 6th year of school.
Graduated Transferred to Count with Regents GED
County of Cohort or Local Earned IEP Still Preparation DroppedDistrict Members Diplomas Diploma Enrolled Program Out
COUNTY: PUTNAM Brewster Central School District
2005 Total Cohort - Aug 2009 Year Outcome All Students 288 92% 0% 4% 0% 4% ELL 3 # # # # # Not ELL 285 # # # # #
2005 Total Cohort - 4 Year Outcome All Students 288 90% 0% 6% 0% 4% ELL 3 # # # # # Not ELL 285 # # # # #
2004 Total Cohort - 5 Year Outcome All Students 300 93% 1% 1% 1% 5% ELL 6 100% 0% 0% 0% 0% Not ELL 294 93% 1% 1% 1% 5%
2003 Total Cohort - 6 Year Outcome All Students 313 94% 1% 0% 1% 5% ELL 5 60% 0% 0% 0% 40% Not ELL 308 94% 1% 0% 1% 4%
Carmel Central School District
2005 Total Cohort - Aug 2009 Year Outcome All Students 416 88% 0% 7% 2% 3% ELL 6 33% 0% 17% 0% 50% Not ELL 410 88% 0% 7% 2% 3%
2005 Total Cohort - 4 Year Outcome All Students 416 85% 0% 9% 2% 3% ELL 6 33% 0% 17% 0% 50% Not ELL 410 86% 0% 9% 2% 3%
2004 Total Cohort - 5 Year Outcome All Students 385 87% 1% 5% 4% 3% ELL 0 0% 0% 0% 0% 0% Not ELL 385 87% 1% 5% 4% 3%
2003 Total Cohort - 6 Year Outcome All Students 426 88% 1% 3% 4% 4% ELL 4 # # # # # Not ELL 422 # # # # #
Haldane Central School District
2005 Total Cohort - Aug 2009 Year Outcome All Students 65 89% 0% 8% 0% 3% ELL 1 # # # # # Not ELL 64 # # # # #
2005 Total Cohort - 4 Year Outcome All Students 65 89% 0% 8% 0% 3% ELL 1 # # # # # Not ELL 64 # # # # #
Data presented in this report are based on data submitted by school districts to the data repository for the 2008-09 school year. Students are reported based on their date of entry in grade 9 and their last enrollment status as reported in the warehouse on July 31, 2009. The federal Family Education Rights and Privacy Act prohibits the release of personally identifiable student information. This Act precludes the publication of summary information based on fewer than five students or in which subtraction or other simple mathematical operations could be used to obtain personal information. Cells that contain the ("#") symbol have been suppressed to protect student privacy.
District-ell status Thursday, March 4, 2010 Page 194 of 301

Public School District Total Cohort Graduation Rate and Enrollment Outcome Summary - 2008-09 School Year by English Language Learner Status
2005 Total Cohort as of June of the 4th year of school and as of August 2009, 2004 Total Cohort as of June of the 5th year of school, 2003 Total Cohort as of June of the 6th year of school.
Graduated Transferred to Count with Regents GED
County of Cohort or Local Earned IEP Still Preparation DroppedDistrict Members Diplomas Diploma Enrolled Program Out
COUNTY: PUTNAM Haldane Central School District
2004 Total Cohort - 5 Year Outcome All Students 90 99% 0% 0% 0% 1% ELL 0 0% 0% 0% 0% 0% Not ELL 90 99% 0% 0% 0% 1%
2003 Total Cohort - 6 Year Outcome All Students 73 97% 0% 1% 0% 1% ELL 0 0% 0% 0% 0% 0% Not ELL 73 97% 0% 1% 0% 1%
Mahopac Central School District
2005 Total Cohort - Aug 2009 Year Outcome All Students 471 93% 0% 6% 0% 1% ELL 6 83% 0% 0% 0% 17% Not ELL 465 93% 0% 6% 0% 1%
2005 Total Cohort - 4 Year Outcome All Students 471 91% 0% 8% 0% 1% ELL 6 83% 0% 0% 0% 17% Not ELL 465 91% 0% 8% 0% 1%
2004 Total Cohort - 5 Year Outcome All Students 452 93% 1% 3% 1% 2% ELL 4 # # # # # Not ELL 448 # # # # #
2003 Total Cohort - 6 Year Outcome All Students 390 93% 1% 2% 1% 4% ELL 4 # # # # # Not ELL 386 # # # # #
Putnam Valley Central School District
2005 Total Cohort - Aug 2009 Year Outcome All Students 190 92% 0% 7% 0% 2% ELL 1 # # # # # Not ELL 189 # # # # #
2005 Total Cohort - 4 Year Outcome All Students 190 92% 0% 7% 0% 2% ELL 1 # # # # # Not ELL 189 # # # # #
2004 Total Cohort - 5 Year Outcome All Students 152 92% 0% 5% 0% 3% ELL 0 0% 0% 0% 0% 0% Not ELL 152 92% 0% 5% 0% 3%
2003 Total Cohort - 6 Year Outcome All Students 166 86% 0% 10% 0% 2% ELL 1 # # # # # Not ELL 165 # # # # #
Data presented in this report are based on data submitted by school districts to the data repository for the 2008-09 school year. Students are reported based on their date of entry in grade 9 and their last enrollment status as reported in the warehouse on July 31, 2009. The federal Family Education Rights and Privacy Act prohibits the release of personally identifiable student information. This Act precludes the publication of summary information based on fewer than five students or in which subtraction or other simple mathematical operations could be used to obtain personal information. Cells that contain the ("#") symbol have been suppressed to protect student privacy.
District-ell status Thursday, March 4, 2010 Page 195 of 301
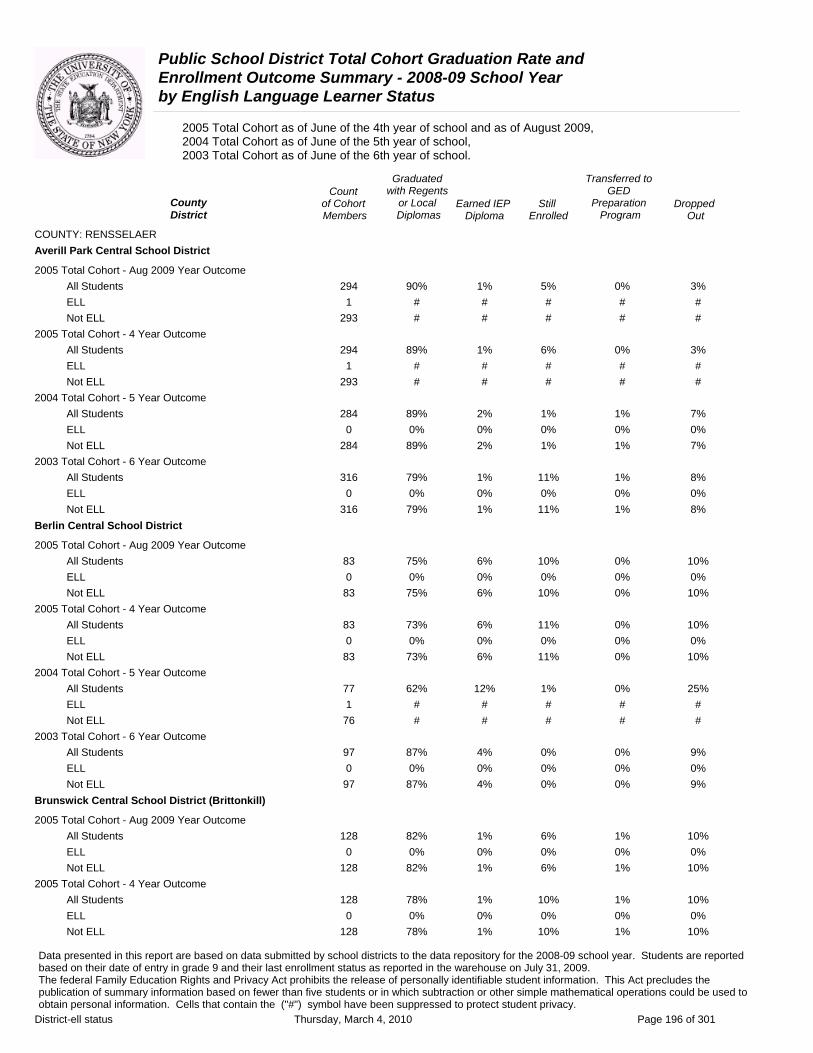
Public School District Total Cohort Graduation Rate and Enrollment Outcome Summary - 2008-09 School Year by English Language Learner Status
2005 Total Cohort as of June of the 4th year of school and as of August 2009, 2004 Total Cohort as of June of the 5th year of school, 2003 Total Cohort as of June of the 6th year of school.
Graduated Transferred to Count with Regents GED
County District
of Cohort Members
or Local Diplomas
Earned IEP Diploma
Still Enrolled
Preparation Program
Dropped Out
COUNTY: RENSSELAER Averill Park Central School District
2005 Total Cohort - Aug 2009 Year Outcome All Students 294 90% 1% 5% 0% 3% ELL 1 # # # # # Not ELL 293 # # # # #
2005 Total Cohort - 4 Year Outcome All Students 294 89% 1% 6% 0% 3% ELL 1 # # # # # Not ELL 293 # # # # #
2004 Total Cohort - 5 Year Outcome All Students 284 89% 2% 1% 1% 7% ELL 0 0% 0% 0% 0% 0% Not ELL 284 89% 2% 1% 1% 7%
2003 Total Cohort - 6 Year Outcome All Students 316 79% 1% 11% 1% 8% ELL 0 0% 0% 0% 0% 0% Not ELL 316 79% 1% 11% 1% 8%
Berlin Central School District
2005 Total Cohort - Aug 2009 Year Outcome All Students 83 75% 6% 10% 0% 10% ELL 0 0% 0% 0% 0% 0% Not ELL 83 75% 6% 10% 0% 10%
2005 Total Cohort - 4 Year Outcome All Students 83 73% 6% 11% 0% 10% ELL 0 0% 0% 0% 0% 0% Not ELL 83 73% 6% 11% 0% 10%
2004 Total Cohort - 5 Year Outcome All Students 77 62% 12% 1% 0% 25% ELL 1 # # # # # Not ELL 76 # # # # #
2003 Total Cohort - 6 Year Outcome All Students 97 87% 4% 0% 0% 9% ELL 0 0% 0% 0% 0% 0% Not ELL 97 87% 4% 0% 0% 9%
Brunswick Central School District (Brittonkill)
2005 Total Cohort - Aug 2009 Year Outcome All Students 128 82% 1% 6% 1% 10% ELL 0 0% 0% 0% 0% 0% Not ELL 128 82% 1% 6% 1% 10%
2005 Total Cohort - 4 Year Outcome All Students 128 78% 1% 10% 1% 10% ELL 0 0% 0% 0% 0% 0% Not ELL 128 78% 1% 10% 1% 10%
Data presented in this report are based on data submitted by school districts to the data repository for the 2008-09 school year. Students are reported based on their date of entry in grade 9 and their last enrollment status as reported in the warehouse on July 31, 2009. The federal Family Education Rights and Privacy Act prohibits the release of personally identifiable student information. This Act precludes the publication of summary information based on fewer than five students or in which subtraction or other simple mathematical operations could be used to obtain personal information. Cells that contain the ("#") symbol have been suppressed to protect student privacy.
District-ell status Thursday, March 4, 2010 Page 196 of 301
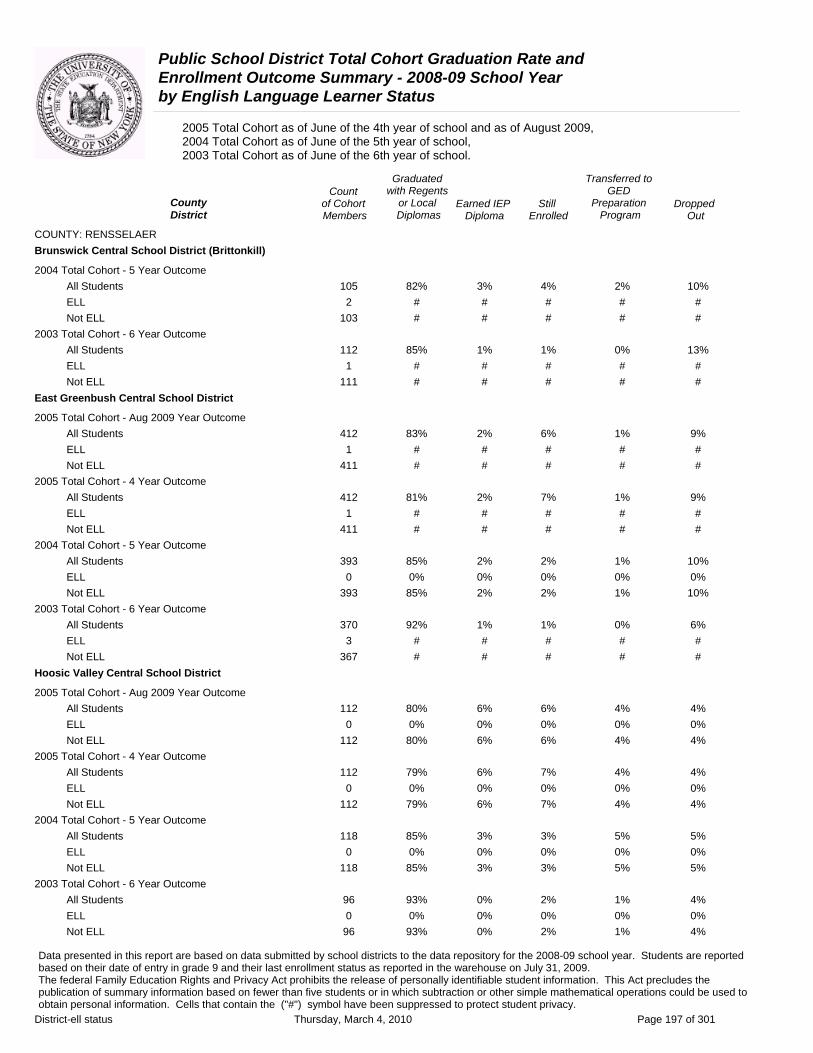
Public School District Total Cohort Graduation Rate and Enrollment Outcome Summary - 2008-09 School Year by English Language Learner Status
2005 Total Cohort as of June of the 4th year of school and as of August 2009, 2004 Total Cohort as of June of the 5th year of school, 2003 Total Cohort as of June of the 6th year of school.
Graduated Transferred to Count with Regents GED
County of Cohort or Local Earned IEP Still Preparation DroppedDistrict Members Diplomas Diploma Enrolled Program Out
COUNTY: RENSSELAER Brunswick Central School District (Brittonkill)
2004 Total Cohort - 5 Year Outcome All Students 105 82% 3% 4% 2% 10% ELL 2 # # # # # Not ELL 103 # # # # #
2003 Total Cohort - 6 Year Outcome All Students 112 85% 1% 1% 0% 13% ELL 1 # # # # # Not ELL 111 # # # # #
East Greenbush Central School District
2005 Total Cohort - Aug 2009 Year Outcome All Students 412 83% 2% 6% 1% 9% ELL 1 # # # # # Not ELL 411 # # # # #
2005 Total Cohort - 4 Year Outcome All Students 412 81% 2% 7% 1% 9% ELL 1 # # # # # Not ELL 411 # # # # #
2004 Total Cohort - 5 Year Outcome All Students 393 85% 2% 2% 1% 10% ELL 0 0% 0% 0% 0% 0% Not ELL 393 85% 2% 2% 1% 10%
2003 Total Cohort - 6 Year Outcome All Students 370 92% 1% 1% 0% 6% ELL 3 # # # # # Not ELL 367 # # # # #
Hoosic Valley Central School District
2005 Total Cohort - Aug 2009 Year Outcome All Students 112 80% 6% 6% 4% 4% ELL 0 0% 0% 0% 0% 0% Not ELL 112 80% 6% 6% 4% 4%
2005 Total Cohort - 4 Year Outcome All Students 112 79% 6% 7% 4% 4% ELL 0 0% 0% 0% 0% 0% Not ELL 112 79% 6% 7% 4% 4%
2004 Total Cohort - 5 Year Outcome All Students 118 85% 3% 3% 5% 5% ELL 0 0% 0% 0% 0% 0% Not ELL 118 85% 3% 3% 5% 5%
2003 Total Cohort - 6 Year Outcome All Students 96 93% 0% 2% 1% 4% ELL 0 0% 0% 0% 0% 0% Not ELL 96 93% 0% 2% 1% 4%
Data presented in this report are based on data submitted by school districts to the data repository for the 2008-09 school year. Students are reported based on their date of entry in grade 9 and their last enrollment status as reported in the warehouse on July 31, 2009. The federal Family Education Rights and Privacy Act prohibits the release of personally identifiable student information. This Act precludes the publication of summary information based on fewer than five students or in which subtraction or other simple mathematical operations could be used to obtain personal information. Cells that contain the ("#") symbol have been suppressed to protect student privacy.
District-ell status Thursday, March 4, 2010 Page 197 of 301

Public School District Total Cohort Graduation Rate and Enrollment Outcome Summary - 2008-09 School Year by English Language Learner Status
2005 Total Cohort as of June of the 4th year of school and as of August 2009, 2004 Total Cohort as of June of the 5th year of school, 2003 Total Cohort as of June of the 6th year of school.
Graduated Transferred to Count with Regents GED
County of Cohort or Local Earned IEP Still Preparation DroppedDistrict Members Diplomas Diploma Enrolled Program Out
COUNTY: RENSSELAER Hoosick Falls Central School District
2005 Total Cohort - Aug 2009 Year Outcome All Students 113 73% 3% 13% 3% 8% ELL 0 0% 0% 0% 0% 0% Not ELL 113 73% 3% 13% 3% 8%
2005 Total Cohort - 4 Year Outcome All Students 113 73% 3% 13% 3% 8% ELL 0 0% 0% 0% 0% 0% Not ELL 113 73% 3% 13% 3% 8%
2004 Total Cohort - 5 Year Outcome All Students 101 81% 3% 1% 0% 15% ELL 1 # # # # # Not ELL 100 # # # # #
2003 Total Cohort - 6 Year Outcome All Students 104 86% 4% 1% 0% 10% ELL 0 0% 0% 0% 0% 0% Not ELL 104 86% 4% 1% 0% 10%
Lansingburgh Central School District
2005 Total Cohort - Aug 2009 Year Outcome All Students 209 80% 3% 8% 3% 6% ELL 1 # # # # # Not ELL 208 # # # # #
2005 Total Cohort - 4 Year Outcome All Students 209 78% 3% 10% 3% 6% ELL 1 # # # # # Not ELL 208 # # # # #
2004 Total Cohort - 5 Year Outcome All Students 230 73% 5% 4% 4% 13% ELL 0 0% 0% 0% 0% 0% Not ELL 230 73% 5% 4% 4% 13%
2003 Total Cohort - 6 Year Outcome All Students 184 82% 2% 4% 7% 6% ELL 0 0% 0% 0% 0% 0% Not ELL 184 82% 2% 4% 7% 6%
Rensselaer City School District
2005 Total Cohort - Aug 2009 Year Outcome All Students 94 77% 3% 7% 0% 13% ELL 1 # # # # # Not ELL 93 # # # # #
2005 Total Cohort - 4 Year Outcome All Students 94 77% 3% 7% 0% 13% ELL 1 # # # # # Not ELL 93 # # # # #
Data presented in this report are based on data submitted by school districts to the data repository for the 2008-09 school year. Students are reported based on their date of entry in grade 9 and their last enrollment status as reported in the warehouse on July 31, 2009. The federal Family Education Rights and Privacy Act prohibits the release of personally identifiable student information. This Act precludes the publication of summary information based on fewer than five students or in which subtraction or other simple mathematical operations could be used to obtain personal information. Cells that contain the ("#") symbol have been suppressed to protect student privacy.
District-ell status Thursday, March 4, 2010 Page 198 of 301
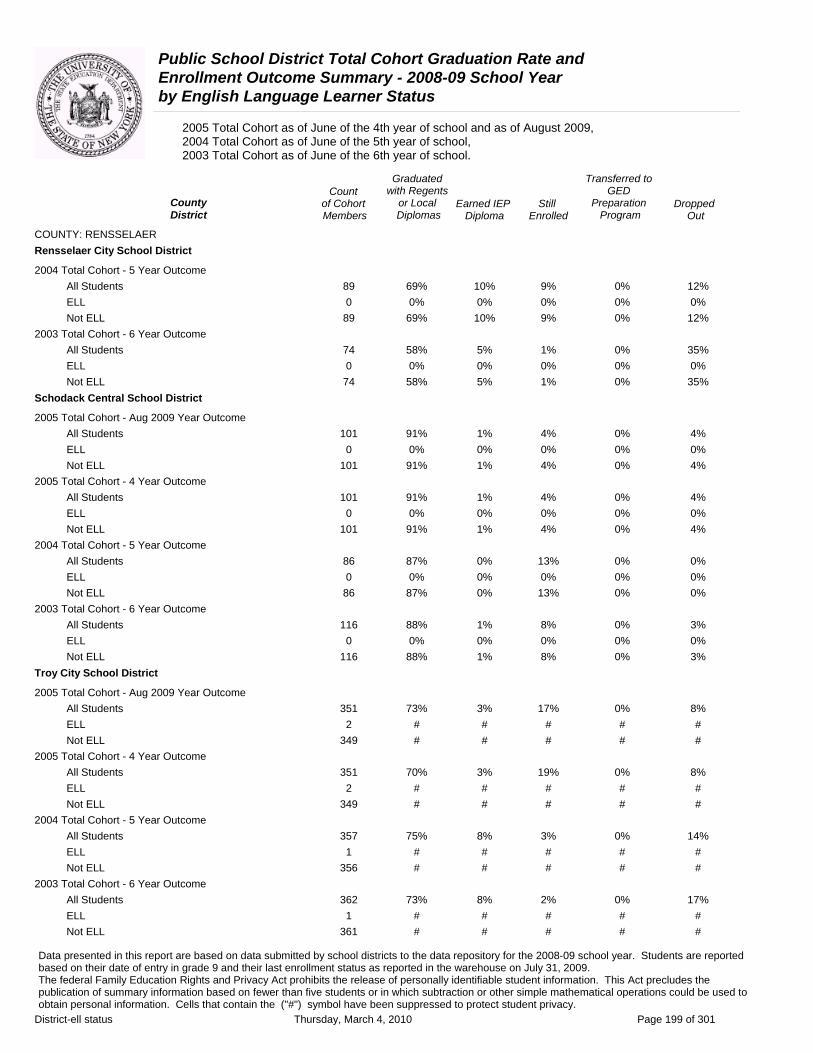
Public School District Total Cohort Graduation Rate and Enrollment Outcome Summary - 2008-09 School Year by English Language Learner Status
2005 Total Cohort as of June of the 4th year of school and as of August 2009, 2004 Total Cohort as of June of the 5th year of school, 2003 Total Cohort as of June of the 6th year of school.
Graduated Transferred to Count with Regents GED
County of Cohort or Local Earned IEP Still Preparation DroppedDistrict Members Diplomas Diploma Enrolled Program Out
COUNTY: RENSSELAER Rensselaer City School District
2004 Total Cohort - 5 Year Outcome All Students 89 69% 10% 9% 0% 12% ELL 0 0% 0% 0% 0% 0% Not ELL 89 69% 10% 9% 0% 12%
2003 Total Cohort - 6 Year Outcome All Students 74 58% 5% 1% 0% 35% ELL 0 0% 0% 0% 0% 0% Not ELL 74 58% 5% 1% 0% 35%
Schodack Central School District
2005 Total Cohort - Aug 2009 Year Outcome All Students 101 91% 1% 4% 0% 4% ELL 0 0% 0% 0% 0% 0% Not ELL 101 91% 1% 4% 0% 4%
2005 Total Cohort - 4 Year Outcome All Students 101 91% 1% 4% 0% 4% ELL 0 0% 0% 0% 0% 0% Not ELL 101 91% 1% 4% 0% 4%
2004 Total Cohort - 5 Year Outcome All Students 86 87% 0% 13% 0% 0% ELL 0 0% 0% 0% 0% 0% Not ELL 86 87% 0% 13% 0% 0%
2003 Total Cohort - 6 Year Outcome All Students 116 88% 1% 8% 0% 3% ELL 0 0% 0% 0% 0% 0% Not ELL 116 88% 1% 8% 0% 3%
Troy City School District
2005 Total Cohort - Aug 2009 Year Outcome All Students 351 73% 3% 17% 0% 8% ELL 2 # # # # # Not ELL 349 # # # # #
2005 Total Cohort - 4 Year Outcome All Students 351 70% 3% 19% 0% 8% ELL 2 # # # # # Not ELL 349 # # # # #
2004 Total Cohort - 5 Year Outcome All Students 357 75% 8% 3% 0% 14% ELL 1 # # # # # Not ELL 356 # # # # #
2003 Total Cohort - 6 Year Outcome All Students 362 73% 8% 2% 0% 17% ELL 1 # # # # # Not ELL 361 # # # # #
Data presented in this report are based on data submitted by school districts to the data repository for the 2008-09 school year. Students are reported based on their date of entry in grade 9 and their last enrollment status as reported in the warehouse on July 31, 2009. The federal Family Education Rights and Privacy Act prohibits the release of personally identifiable student information. This Act precludes the publication of summary information based on fewer than five students or in which subtraction or other simple mathematical operations could be used to obtain personal information. Cells that contain the ("#") symbol have been suppressed to protect student privacy.
District-ell status Thursday, March 4, 2010 Page 199 of 301
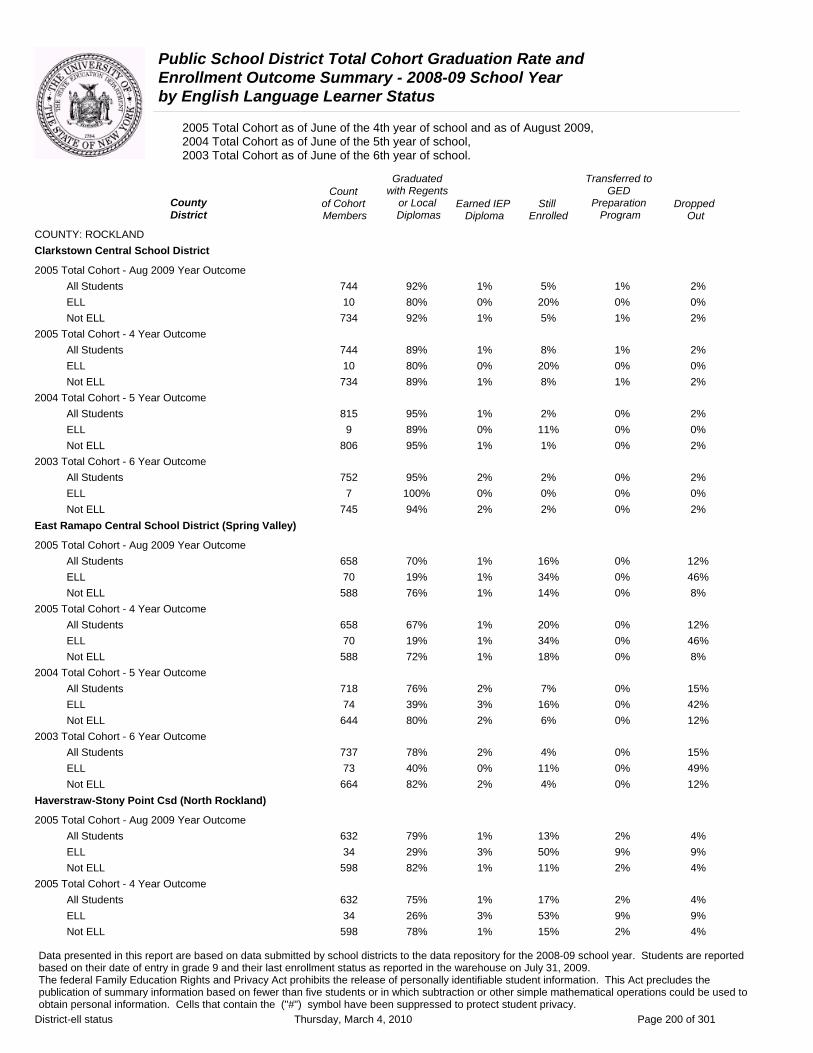
Public School District Total Cohort Graduation Rate and Enrollment Outcome Summary - 2008-09 School Year by English Language Learner Status
2005 Total Cohort as of June of the 4th year of school and as of August 2009, 2004 Total Cohort as of June of the 5th year of school, 2003 Total Cohort as of June of the 6th year of school.
Graduated Transferred to Count with Regents GED
County of Cohort or Local Earned IEP Still Preparation DroppedDistrict Members Diplomas Diploma Enrolled Program Out
COUNTY: ROCKLAND Clarkstown Central School District
2005 Total Cohort - Aug 2009 Year Outcome All Students 744 92% 1% 5% 1% 2% ELL 10 80% 0% 20% 0% 0% Not ELL 734 92% 1% 5% 1% 2%
2005 Total Cohort - 4 Year Outcome All Students 744 89% 1% 8% 1% 2% ELL 10 80% 0% 20% 0% 0% Not ELL 734 89% 1% 8% 1% 2%
2004 Total Cohort - 5 Year Outcome All Students 815 95% 1% 2% 0% 2% ELL 9 89% 0% 11% 0% 0% Not ELL 806 95% 1% 1% 0% 2%
2003 Total Cohort - 6 Year Outcome All Students 752 95% 2% 2% 0% 2% ELL 7 100% 0% 0% 0% 0% Not ELL 745 94% 2% 2% 0% 2%
East Ramapo Central School District (Spring Valley)
2005 Total Cohort - Aug 2009 Year Outcome All Students 658 70% 1% 16% 0% 12% ELL 70 19% 1% 34% 0% 46% Not ELL 588 76% 1% 14% 0% 8%
2005 Total Cohort - 4 Year Outcome All Students 658 67% 1% 20% 0% 12% ELL 70 19% 1% 34% 0% 46% Not ELL 588 72% 1% 18% 0% 8%
2004 Total Cohort - 5 Year Outcome All Students 718 76% 2% 7% 0% 15% ELL 74 39% 3% 16% 0% 42% Not ELL 644 80% 2% 6% 0% 12%
2003 Total Cohort - 6 Year Outcome All Students 737 78% 2% 4% 0% 15% ELL 73 40% 0% 11% 0% 49% Not ELL 664 82% 2% 4% 0% 12%
Haverstraw-Stony Point Csd (North Rockland)
2005 Total Cohort - Aug 2009 Year Outcome All Students 632 79% 1% 13% 2% 4% ELL 34 29% 3% 50% 9% 9% Not ELL 598 82% 1% 11% 2% 4%
2005 Total Cohort - 4 Year Outcome All Students 632 75% 1% 17% 2% 4% ELL 34 26% 3% 53% 9% 9% Not ELL 598 78% 1% 15% 2% 4%
Data presented in this report are based on data submitted by school districts to the data repository for the 2008-09 school year. Students are reported based on their date of entry in grade 9 and their last enrollment status as reported in the warehouse on July 31, 2009. The federal Family Education Rights and Privacy Act prohibits the release of personally identifiable student information. This Act precludes the publication of summary information based on fewer than five students or in which subtraction or other simple mathematical operations could be used to obtain personal information. Cells that contain the ("#") symbol have been suppressed to protect student privacy.
District-ell status Thursday, March 4, 2010 Page 200 of 301
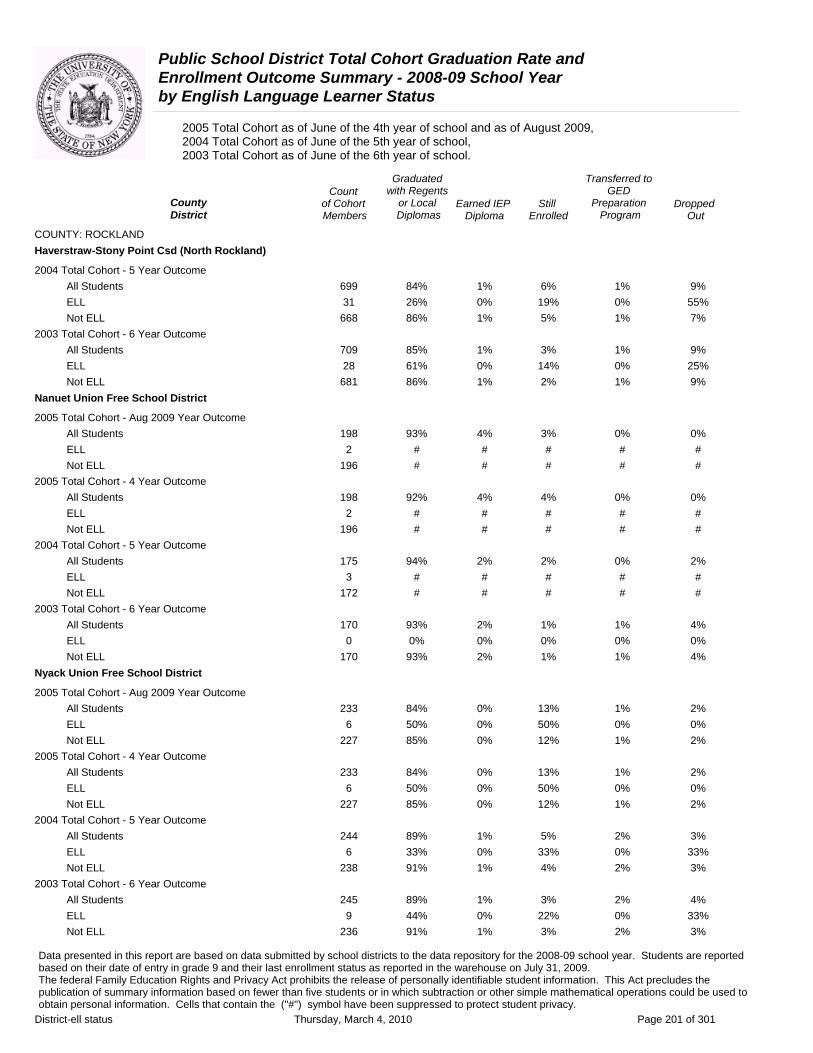
Public School District Total Cohort Graduation Rate and Enrollment Outcome Summary - 2008-09 School Year by English Language Learner Status
2005 Total Cohort as of June of the 4th year of school and as of August 2009, 2004 Total Cohort as of June of the 5th year of school, 2003 Total Cohort as of June of the 6th year of school.
Graduated Transferred to Count with Regents GED
County of Cohort or Local Earned IEP Still Preparation DroppedDistrict Members Diplomas Diploma Enrolled Program Out
COUNTY: ROCKLAND Haverstraw-Stony Point Csd (North Rockland)
2004 Total Cohort - 5 Year Outcome All Students 699 84% 1% 6% 1% 9% ELL 31 26% 0% 19% 0% 55% Not ELL 668 86% 1% 5% 1% 7%
2003 Total Cohort - 6 Year Outcome All Students 709 85% 1% 3% 1% 9% ELL 28 61% 0% 14% 0% 25% Not ELL 681 86% 1% 2% 1% 9%
Nanuet Union Free School District
2005 Total Cohort - Aug 2009 Year Outcome All Students 198 93% 4% 3% 0% 0% ELL 2 # # # # # Not ELL 196 # # # # #
2005 Total Cohort - 4 Year Outcome All Students 198 92% 4% 4% 0% 0% ELL 2 # # # # # Not ELL 196 # # # # #
2004 Total Cohort - 5 Year Outcome All Students 175 94% 2% 2% 0% 2% ELL 3 # # # # # Not ELL 172 # # # # #
2003 Total Cohort - 6 Year Outcome All Students 170 93% 2% 1% 1% 4% ELL 0 0% 0% 0% 0% 0% Not ELL 170 93% 2% 1% 1% 4%
Nyack Union Free School District
2005 Total Cohort - Aug 2009 Year Outcome All Students 233 84% 0% 13% 1% 2% ELL 6 50% 0% 50% 0% 0% Not ELL 227 85% 0% 12% 1% 2%
2005 Total Cohort - 4 Year Outcome All Students 233 84% 0% 13% 1% 2% ELL 6 50% 0% 50% 0% 0% Not ELL 227 85% 0% 12% 1% 2%
2004 Total Cohort - 5 Year Outcome All Students 244 89% 1% 5% 2% 3% ELL 6 33% 0% 33% 0% 33% Not ELL 238 91% 1% 4% 2% 3%
2003 Total Cohort - 6 Year Outcome All Students 245 89% 1% 3% 2% 4% ELL 9 44% 0% 22% 0% 33% Not ELL 236 91% 1% 3% 2% 3%
Data presented in this report are based on data submitted by school districts to the data repository for the 2008-09 school year. Students are reported based on their date of entry in grade 9 and their last enrollment status as reported in the warehouse on July 31, 2009. The federal Family Education Rights and Privacy Act prohibits the release of personally identifiable student information. This Act precludes the publication of summary information based on fewer than five students or in which subtraction or other simple mathematical operations could be used to obtain personal information. Cells that contain the ("#") symbol have been suppressed to protect student privacy.
District-ell status Thursday, March 4, 2010 Page 201 of 301
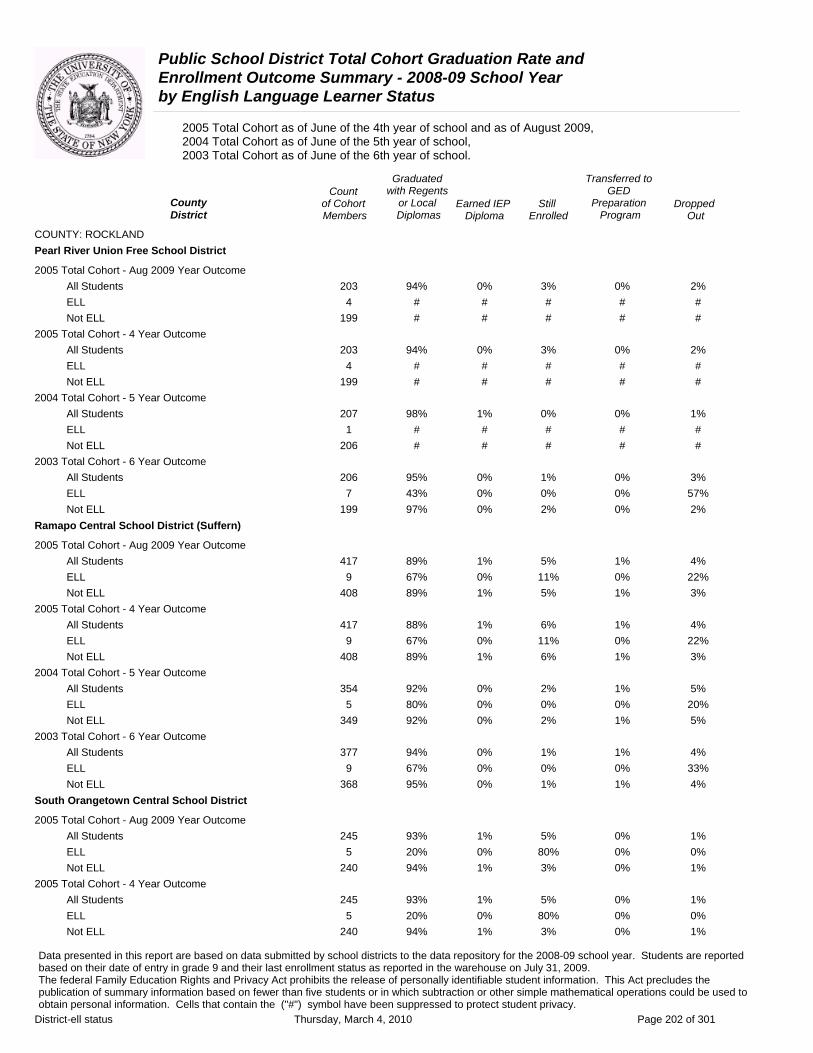
Public School District Total Cohort Graduation Rate and Enrollment Outcome Summary - 2008-09 School Year by English Language Learner Status
2005 Total Cohort as of June of the 4th year of school and as of August 2009, 2004 Total Cohort as of June of the 5th year of school, 2003 Total Cohort as of June of the 6th year of school.
Graduated Transferred to Count with Regents GED
County of Cohort or Local Earned IEP Still Preparation DroppedDistrict Members Diplomas Diploma Enrolled Program Out
COUNTY: ROCKLAND Pearl River Union Free School District
2005 Total Cohort - Aug 2009 Year Outcome All Students 203 94% 0% 3% 0% 2% ELL 4 # # # # # Not ELL 199 # # # # #
2005 Total Cohort - 4 Year Outcome All Students 203 94% 0% 3% 0% 2% ELL 4 # # # # # Not ELL 199 # # # # #
2004 Total Cohort - 5 Year Outcome All Students 207 98% 1% 0% 0% 1% ELL 1 # # # # # Not ELL 206 # # # # #
2003 Total Cohort - 6 Year Outcome All Students 206 95% 0% 1% 0% 3% ELL 7 43% 0% 0% 0% 57% Not ELL 199 97% 0% 2% 0% 2%
Ramapo Central School District (Suffern)
2005 Total Cohort - Aug 2009 Year Outcome All Students 417 89% 1% 5% 1% 4% ELL 9 67% 0% 11% 0% 22% Not ELL 408 89% 1% 5% 1% 3%
2005 Total Cohort - 4 Year Outcome All Students 417 88% 1% 6% 1% 4% ELL 9 67% 0% 11% 0% 22% Not ELL 408 89% 1% 6% 1% 3%
2004 Total Cohort - 5 Year Outcome All Students 354 92% 0% 2% 1% 5% ELL 5 80% 0% 0% 0% 20% Not ELL 349 92% 0% 2% 1% 5%
2003 Total Cohort - 6 Year Outcome All Students 377 94% 0% 1% 1% 4% ELL 9 67% 0% 0% 0% 33% Not ELL 368 95% 0% 1% 1% 4%
South Orangetown Central School District
2005 Total Cohort - Aug 2009 Year Outcome All Students 245 93% 1% 5% 0% 1% ELL 5 20% 0% 80% 0% 0% Not ELL 240 94% 1% 3% 0% 1%
2005 Total Cohort - 4 Year Outcome All Students 245 93% 1% 5% 0% 1% ELL 5 20% 0% 80% 0% 0% Not ELL 240 94% 1% 3% 0% 1%
Data presented in this report are based on data submitted by school districts to the data repository for the 2008-09 school year. Students are reported based on their date of entry in grade 9 and their last enrollment status as reported in the warehouse on July 31, 2009. The federal Family Education Rights and Privacy Act prohibits the release of personally identifiable student information. This Act precludes the publication of summary information based on fewer than five students or in which subtraction or other simple mathematical operations could be used to obtain personal information. Cells that contain the ("#") symbol have been suppressed to protect student privacy.
District-ell status Thursday, March 4, 2010 Page 202 of 301
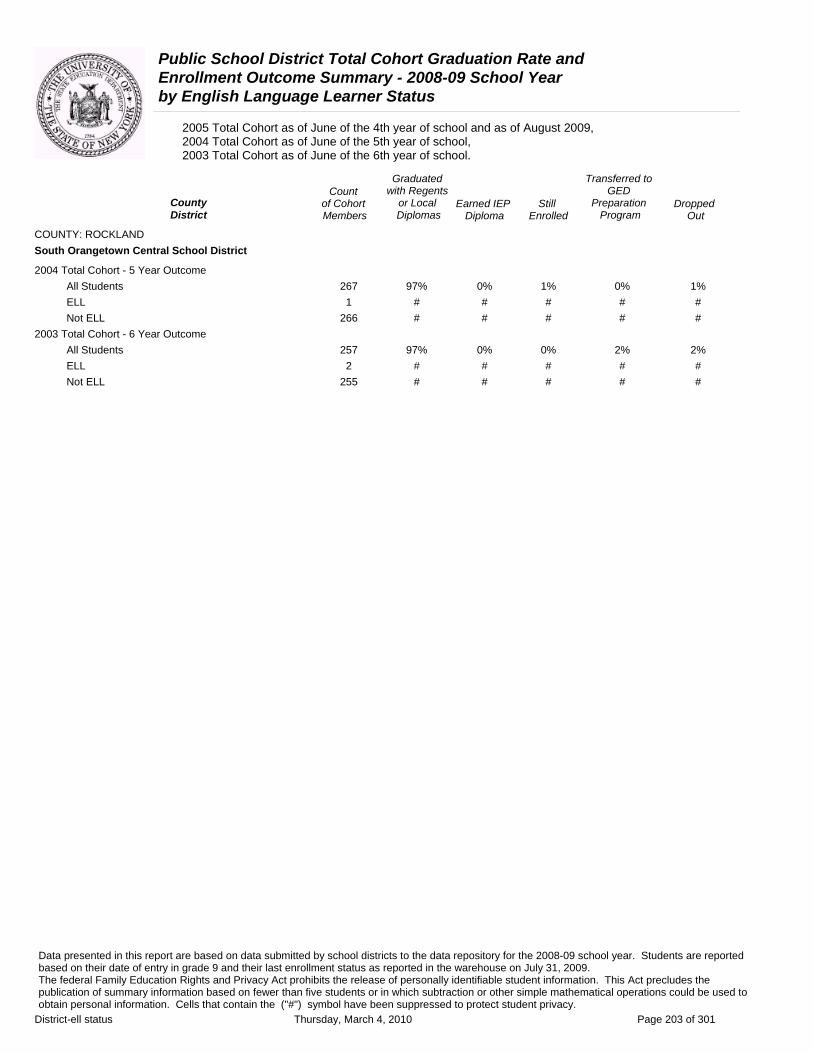
Public School District Total Cohort Graduation Rate and Enrollment Outcome Summary - 2008-09 School Year by English Language Learner Status
2005 Total Cohort as of June of the 4th year of school and as of August 2009, 2004 Total Cohort as of June of the 5th year of school, 2003 Total Cohort as of June of the 6th year of school.
Graduated Transferred to Count with Regents GED
County of Cohort or Local Earned IEP Still Preparation DroppedDistrict Members Diplomas Diploma Enrolled Program Out
COUNTY: ROCKLAND South Orangetown Central School District
2004 Total Cohort - 5 Year Outcome All Students 267 97% 0% 1% 0% 1% ELL 1 # # # # # Not ELL 266 # # # # #
2003 Total Cohort - 6 Year Outcome All Students 257 97% 0% 0% 2% 2% ELL 2 # # # # # Not ELL 255 # # # # #
Data presented in this report are based on data submitted by school districts to the data repository for the 2008-09 school year. Students are reported based on their date of entry in grade 9 and their last enrollment status as reported in the warehouse on July 31, 2009. The federal Family Education Rights and Privacy Act prohibits the release of personally identifiable student information. This Act precludes the publication of summary information based on fewer than five students or in which subtraction or other simple mathematical operations could be used to obtain personal information. Cells that contain the ("#") symbol have been suppressed to protect student privacy.
District-ell status Thursday, March 4, 2010 Page 203 of 301
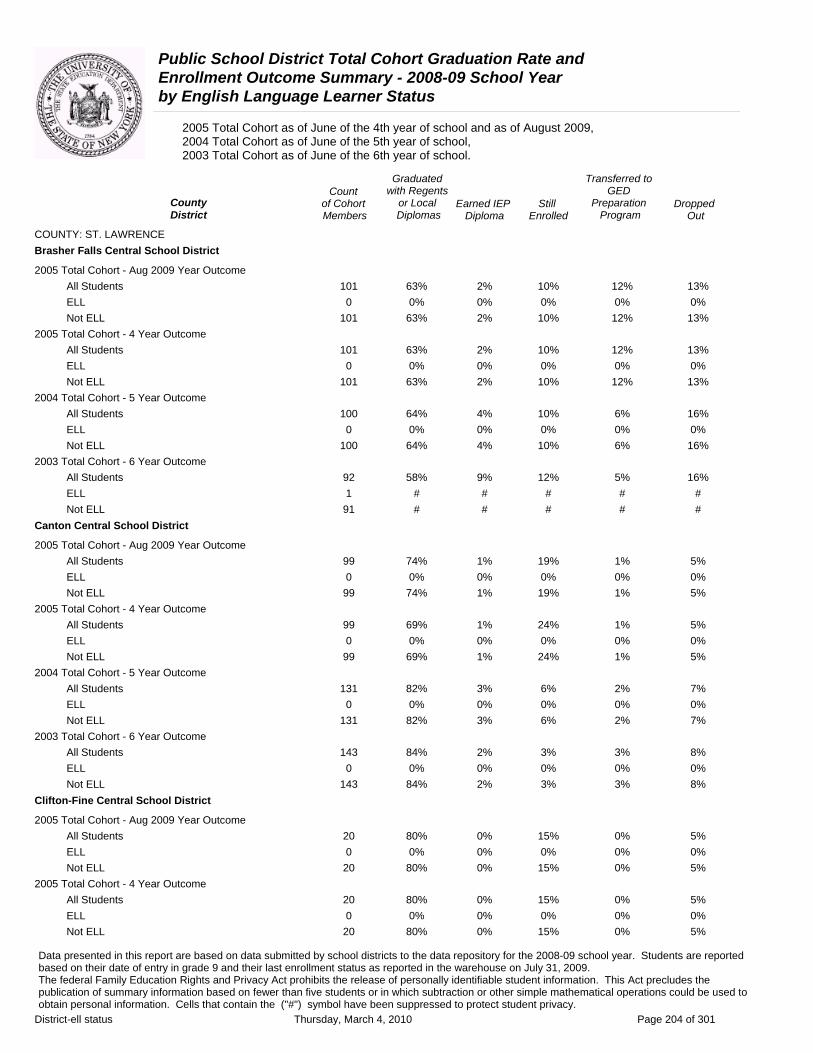
Public School District Total Cohort Graduation Rate and Enrollment Outcome Summary - 2008-09 School Year by English Language Learner Status
2005 Total Cohort as of June of the 4th year of school and as of August 2009, 2004 Total Cohort as of June of the 5th year of school, 2003 Total Cohort as of June of the 6th year of school.
Graduated Transferred to Count with Regents GED
County of Cohort or Local Earned IEP Still Preparation DroppedDistrict Members Diplomas Diploma Enrolled Program Out
COUNTY: ST. LAWRENCE Brasher Falls Central School District
2005 Total Cohort - Aug 2009 Year Outcome All Students 101 63% 2% 10% 12% 13% ELL 0 0% 0% 0% 0% 0% Not ELL 101 63% 2% 10% 12% 13%
2005 Total Cohort - 4 Year Outcome All Students 101 63% 2% 10% 12% 13% ELL 0 0% 0% 0% 0% 0% Not ELL 101 63% 2% 10% 12% 13%
2004 Total Cohort - 5 Year Outcome All Students 100 64% 4% 10% 6% 16% ELL 0 0% 0% 0% 0% 0% Not ELL 100 64% 4% 10% 6% 16%
2003 Total Cohort - 6 Year Outcome All Students 92 58% 9% 12% 5% 16% ELL 1 # # # # # Not ELL 91 # # # # #
Canton Central School District
2005 Total Cohort - Aug 2009 Year Outcome All Students 99 74% 1% 19% 1% 5% ELL 0 0% 0% 0% 0% 0% Not ELL 99 74% 1% 19% 1% 5%
2005 Total Cohort - 4 Year Outcome All Students 99 69% 1% 24% 1% 5% ELL 0 0% 0% 0% 0% 0% Not ELL 99 69% 1% 24% 1% 5%
2004 Total Cohort - 5 Year Outcome All Students 131 82% 3% 6% 2% 7% ELL 0 0% 0% 0% 0% 0% Not ELL 131 82% 3% 6% 2% 7%
2003 Total Cohort - 6 Year Outcome All Students 143 84% 2% 3% 3% 8% ELL 0 0% 0% 0% 0% 0% Not ELL 143 84% 2% 3% 3% 8%
Clifton-Fine Central School District
2005 Total Cohort - Aug 2009 Year Outcome All Students 20 80% 0% 15% 0% 5% ELL 0 0% 0% 0% 0% 0% Not ELL 20 80% 0% 15% 0% 5%
2005 Total Cohort - 4 Year Outcome All Students 20 80% 0% 15% 0% 5% ELL 0 0% 0% 0% 0% 0% Not ELL 20 80% 0% 15% 0% 5%
Data presented in this report are based on data submitted by school districts to the data repository for the 2008-09 school year. Students are reported based on their date of entry in grade 9 and their last enrollment status as reported in the warehouse on July 31, 2009. The federal Family Education Rights and Privacy Act prohibits the release of personally identifiable student information. This Act precludes the publication of summary information based on fewer than five students or in which subtraction or other simple mathematical operations could be used to obtain personal information. Cells that contain the ("#") symbol have been suppressed to protect student privacy.
District-ell status Thursday, March 4, 2010 Page 204 of 301

Public School District Total Cohort Graduation Rate and Enrollment Outcome Summary - 2008-09 School Year by English Language Learner Status
2005 Total Cohort as of June of the 4th year of school and as of August 2009, 2004 Total Cohort as of June of the 5th year of school, 2003 Total Cohort as of June of the 6th year of school.
Graduated Transferred to Count with Regents GED
County of Cohort or Local Earned IEP Still Preparation DroppedDistrict Members Diplomas Diploma Enrolled Program Out
COUNTY: ST. LAWRENCE Clifton-Fine Central School District
2004 Total Cohort - 5 Year Outcome All Students 19 74% 5% 5% 0% 16% ELL 0 0% 0% 0% 0% 0% Not ELL 19 74% 5% 5% 0% 16%
2003 Total Cohort - 6 Year Outcome All Students 34 65% 3% 9% 0% 24% ELL 0 0% 0% 0% 0% 0% Not ELL 34 65% 3% 9% 0% 24%
Colton-Pierrepont Central School District
2005 Total Cohort - Aug 2009 Year Outcome All Students 38 84% 3% 11% 0% 3% ELL 0 0% 0% 0% 0% 0% Not ELL 38 84% 3% 11% 0% 3%
2005 Total Cohort - 4 Year Outcome All Students 38 84% 3% 11% 0% 3% ELL 0 0% 0% 0% 0% 0% Not ELL 38 84% 3% 11% 0% 3%
2004 Total Cohort - 5 Year Outcome All Students 26 77% 4% 12% 0% 8% ELL 0 0% 0% 0% 0% 0% Not ELL 26 77% 4% 12% 0% 8%
2003 Total Cohort - 6 Year Outcome All Students 38 82% 3% 8% 0% 8% ELL 0 0% 0% 0% 0% 0% Not ELL 38 82% 3% 8% 0% 8%
Edwards-Knox Central School District
2005 Total Cohort - Aug 2009 Year Outcome All Students 60 80% 5% 5% 7% 3% ELL 0 0% 0% 0% 0% 0% Not ELL 60 80% 5% 5% 7% 3%
2005 Total Cohort - 4 Year Outcome All Students 60 80% 5% 5% 7% 3% ELL 0 0% 0% 0% 0% 0% Not ELL 60 80% 5% 5% 7% 3%
2004 Total Cohort - 5 Year Outcome All Students 54 80% 0% 2% 13% 6% ELL 0 0% 0% 0% 0% 0% Not ELL 54 80% 0% 2% 13% 6%
2003 Total Cohort - 6 Year Outcome All Students 44 82% 2% 2% 11% 2% ELL 0 0% 0% 0% 0% 0% Not ELL 44 82% 2% 2% 11% 2%
Data presented in this report are based on data submitted by school districts to the data repository for the 2008-09 school year. Students are reported based on their date of entry in grade 9 and their last enrollment status as reported in the warehouse on July 31, 2009. The federal Family Education Rights and Privacy Act prohibits the release of personally identifiable student information. This Act precludes the publication of summary information based on fewer than five students or in which subtraction or other simple mathematical operations could be used to obtain personal information. Cells that contain the ("#") symbol have been suppressed to protect student privacy.
District-ell status Thursday, March 4, 2010 Page 205 of 301

Public School District Total Cohort Graduation Rate and Enrollment Outcome Summary - 2008-09 School Year by English Language Learner Status
2005 Total Cohort as of June of the 4th year of school and as of August 2009, 2004 Total Cohort as of June of the 5th year of school, 2003 Total Cohort as of June of the 6th year of school.
Graduated Transferred to Count with Regents GED
County of Cohort or Local Earned IEP Still Preparation DroppedDistrict Members Diplomas Diploma Enrolled Program Out
COUNTY: ST. LAWRENCE Gouverneur Central School District
2005 Total Cohort - Aug 2009 Year Outcome All Students 160 83% 2% 4% 2% 9% ELL 0 0% 0% 0% 0% 0% Not ELL 160 83% 2% 4% 2% 9%
2005 Total Cohort - 4 Year Outcome All Students 160 83% 2% 5% 2% 9% ELL 0 0% 0% 0% 0% 0% Not ELL 160 83% 2% 5% 2% 9%
2004 Total Cohort - 5 Year Outcome All Students 151 80% 3% 3% 1% 13% ELL 0 0% 0% 0% 0% 0% Not ELL 151 80% 3% 3% 1% 13%
2003 Total Cohort - 6 Year Outcome All Students 148 72% 4% 4% 2% 18% ELL 0 0% 0% 0% 0% 0% Not ELL 148 72% 4% 4% 2% 18%
Hammond Central School District
2005 Total Cohort - Aug 2009 Year Outcome All Students 22 86% 5% 9% 0% 0% ELL 0 0% 0% 0% 0% 0% Not ELL 22 86% 5% 9% 0% 0%
2005 Total Cohort - 4 Year Outcome All Students 22 86% 5% 9% 0% 0% ELL 0 0% 0% 0% 0% 0% Not ELL 22 86% 5% 9% 0% 0%
2004 Total Cohort - 5 Year Outcome All Students 37 78% 5% 14% 0% 3% ELL 0 0% 0% 0% 0% 0% Not ELL 37 78% 5% 14% 0% 3%
2003 Total Cohort - 6 Year Outcome All Students 28 86% 7% 0% 0% 7% ELL 0 0% 0% 0% 0% 0% Not ELL 28 86% 7% 0% 0% 7%
Hermon-Dekalb Central School District
2005 Total Cohort - Aug 2009 Year Outcome All Students 36 72% 6% 11% 3% 8% ELL 0 0% 0% 0% 0% 0% Not ELL 36 72% 6% 11% 3% 8%
2005 Total Cohort - 4 Year Outcome All Students 36 72% 6% 11% 3% 8% ELL 0 0% 0% 0% 0% 0% Not ELL 36 72% 6% 11% 3% 8%
Data presented in this report are based on data submitted by school districts to the data repository for the 2008-09 school year. Students are reported based on their date of entry in grade 9 and their last enrollment status as reported in the warehouse on July 31, 2009. The federal Family Education Rights and Privacy Act prohibits the release of personally identifiable student information. This Act precludes the publication of summary information based on fewer than five students or in which subtraction or other simple mathematical operations could be used to obtain personal information. Cells that contain the ("#") symbol have been suppressed to protect student privacy.
District-ell status Thursday, March 4, 2010 Page 206 of 301

Public School District Total Cohort Graduation Rate and Enrollment Outcome Summary - 2008-09 School Year by English Language Learner Status
2005 Total Cohort as of June of the 4th year of school and as of August 2009, 2004 Total Cohort as of June of the 5th year of school, 2003 Total Cohort as of June of the 6th year of school.
Graduated Transferred to Count with Regents GED
County of Cohort or Local Earned IEP Still Preparation DroppedDistrict Members Diplomas Diploma Enrolled Program Out
COUNTY: ST. LAWRENCE Hermon-Dekalb Central School District
2004 Total Cohort - 5 Year Outcome All Students 33 73% 9% 0% 6% 12% ELL 0 0% 0% 0% 0% 0% Not ELL 33 73% 9% 0% 6% 12%
2003 Total Cohort - 6 Year Outcome All Students 38 79% 0% 8% 0% 13% ELL 0 0% 0% 0% 0% 0% Not ELL 38 79% 0% 8% 0% 13%
Heuvelton Central School District
2005 Total Cohort - Aug 2009 Year Outcome All Students 63 76% 0% 14% 2% 8% ELL 0 0% 0% 0% 0% 0% Not ELL 63 76% 0% 14% 2% 8%
2005 Total Cohort - 4 Year Outcome All Students 63 75% 0% 16% 2% 8% ELL 0 0% 0% 0% 0% 0% Not ELL 63 75% 0% 16% 2% 8%
2004 Total Cohort - 5 Year Outcome All Students 47 89% 2% 2% 6% 0% ELL 0 0% 0% 0% 0% 0% Not ELL 47 89% 2% 2% 6% 0%
2003 Total Cohort - 6 Year Outcome All Students 62 85% 2% 0% 5% 8% ELL 0 0% 0% 0% 0% 0% Not ELL 62 85% 2% 0% 5% 8%
Lisbon Central School District
2005 Total Cohort - Aug 2009 Year Outcome All Students 50 80% 0% 8% 4% 8% ELL 0 0% 0% 0% 0% 0% Not ELL 50 80% 0% 8% 4% 8%
2005 Total Cohort - 4 Year Outcome All Students 50 78% 0% 10% 4% 8% ELL 0 0% 0% 0% 0% 0% Not ELL 50 78% 0% 10% 4% 8%
2004 Total Cohort - 5 Year Outcome All Students 41 93% 2% 0% 0% 5% ELL 0 0% 0% 0% 0% 0% Not ELL 41 93% 2% 0% 0% 5%
2003 Total Cohort - 6 Year Outcome All Students 43 93% 0% 0% 5% 2% ELL 0 0% 0% 0% 0% 0% Not ELL 43 93% 0% 0% 5% 2%
Data presented in this report are based on data submitted by school districts to the data repository for the 2008-09 school year. Students are reported based on their date of entry in grade 9 and their last enrollment status as reported in the warehouse on July 31, 2009. The federal Family Education Rights and Privacy Act prohibits the release of personally identifiable student information. This Act precludes the publication of summary information based on fewer than five students or in which subtraction or other simple mathematical operations could be used to obtain personal information. Cells that contain the ("#") symbol have been suppressed to protect student privacy.
District-ell status Thursday, March 4, 2010 Page 207 of 301
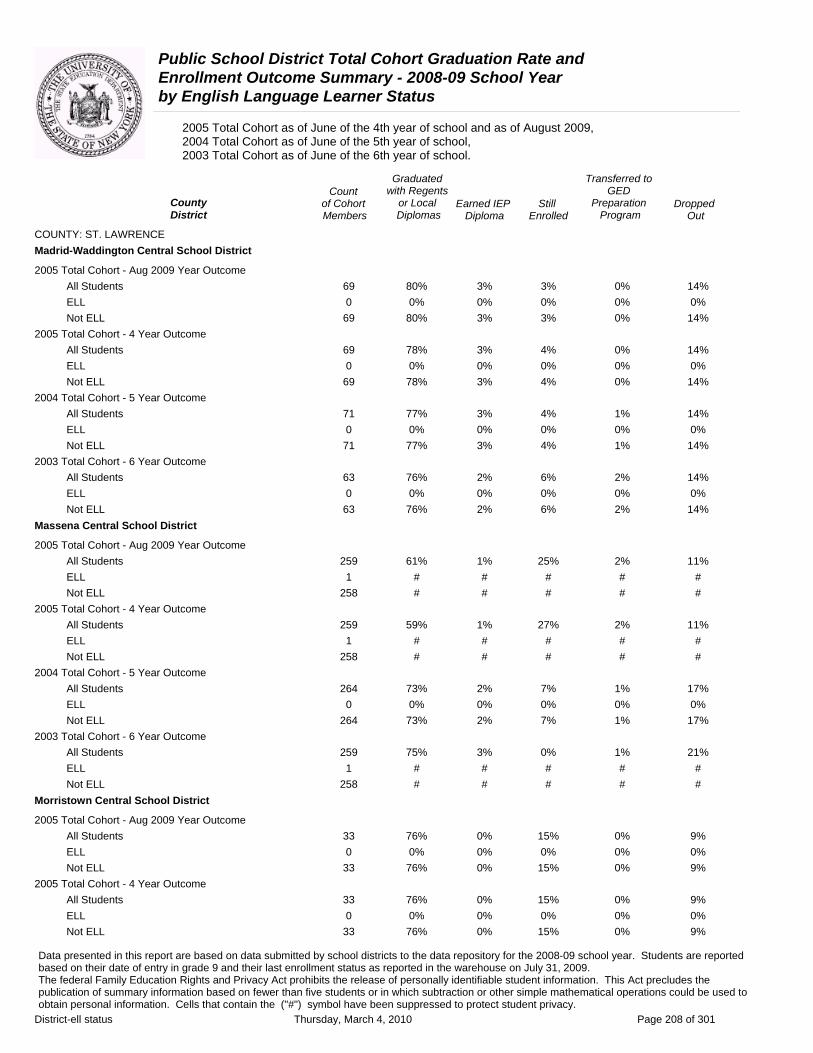
Public School District Total Cohort Graduation Rate and Enrollment Outcome Summary - 2008-09 School Year by English Language Learner Status
2005 Total Cohort as of June of the 4th year of school and as of August 2009, 2004 Total Cohort as of June of the 5th year of school, 2003 Total Cohort as of June of the 6th year of school.
Graduated Transferred to Count with Regents GED
County of Cohort or Local Earned IEP Still Preparation DroppedDistrict Members Diplomas Diploma Enrolled Program Out
COUNTY: ST. LAWRENCE Madrid-Waddington Central School District
2005 Total Cohort - Aug 2009 Year Outcome All Students 69 80% 3% 3% 0% 14% ELL 0 0% 0% 0% 0% 0% Not ELL 69 80% 3% 3% 0% 14%
2005 Total Cohort - 4 Year Outcome All Students 69 78% 3% 4% 0% 14% ELL 0 0% 0% 0% 0% 0% Not ELL 69 78% 3% 4% 0% 14%
2004 Total Cohort - 5 Year Outcome All Students 71 77% 3% 4% 1% 14% ELL 0 0% 0% 0% 0% 0% Not ELL 71 77% 3% 4% 1% 14%
2003 Total Cohort - 6 Year Outcome All Students 63 76% 2% 6% 2% 14% ELL 0 0% 0% 0% 0% 0% Not ELL 63 76% 2% 6% 2% 14%
Massena Central School District
2005 Total Cohort - Aug 2009 Year Outcome All Students 259 61% 1% 25% 2% 11% ELL 1 # # # # # Not ELL 258 # # # # #
2005 Total Cohort - 4 Year Outcome All Students 259 59% 1% 27% 2% 11% ELL 1 # # # # # Not ELL 258 # # # # #
2004 Total Cohort - 5 Year Outcome All Students 264 73% 2% 7% 1% 17% ELL 0 0% 0% 0% 0% 0% Not ELL 264 73% 2% 7% 1% 17%
2003 Total Cohort - 6 Year Outcome All Students 259 75% 3% 0% 1% 21% ELL 1 # # # # # Not ELL 258 # # # # #
Morristown Central School District
2005 Total Cohort - Aug 2009 Year Outcome All Students 33 76% 0% 15% 0% 9% ELL 0 0% 0% 0% 0% 0% Not ELL 33 76% 0% 15% 0% 9%
2005 Total Cohort - 4 Year Outcome All Students 33 76% 0% 15% 0% 9% ELL 0 0% 0% 0% 0% 0% Not ELL 33 76% 0% 15% 0% 9%
Data presented in this report are based on data submitted by school districts to the data repository for the 2008-09 school year. Students are reported based on their date of entry in grade 9 and their last enrollment status as reported in the warehouse on July 31, 2009. The federal Family Education Rights and Privacy Act prohibits the release of personally identifiable student information. This Act precludes the publication of summary information based on fewer than five students or in which subtraction or other simple mathematical operations could be used to obtain personal information. Cells that contain the ("#") symbol have been suppressed to protect student privacy.
District-ell status Thursday, March 4, 2010 Page 208 of 301

Public School District Total Cohort Graduation Rate and Enrollment Outcome Summary - 2008-09 School Year by English Language Learner Status
2005 Total Cohort as of June of the 4th year of school and as of August 2009, 2004 Total Cohort as of June of the 5th year of school, 2003 Total Cohort as of June of the 6th year of school.
Graduated Transferred to Count with Regents GED
County of Cohort or Local Earned IEP Still Preparation DroppedDistrict Members Diplomas Diploma Enrolled Program Out
COUNTY: ST. LAWRENCE Morristown Central School District
2004 Total Cohort - 5 Year Outcome All Students 38 76% 3% 5% 5% 11% ELL 0 0% 0% 0% 0% 0% Not ELL 38 76% 3% 5% 5% 11%
2003 Total Cohort - 6 Year Outcome All Students 36 72% 3% 8% 6% 11% ELL 0 0% 0% 0% 0% 0% Not ELL 36 72% 3% 8% 6% 11%
Norwood-Norfolk Central School District
2005 Total Cohort - Aug 2009 Year Outcome All Students 100 63% 3% 9% 5% 20% ELL 0 0% 0% 0% 0% 0% Not ELL 100 63% 3% 9% 5% 20%
2005 Total Cohort - 4 Year Outcome All Students 100 62% 3% 10% 5% 20% ELL 0 0% 0% 0% 0% 0% Not ELL 100 62% 3% 10% 5% 20%
2004 Total Cohort - 5 Year Outcome All Students 97 79% 1% 1% 3% 15% ELL 0 0% 0% 0% 0% 0% Not ELL 97 79% 1% 1% 3% 15%
2003 Total Cohort - 6 Year Outcome All Students 85 71% 4% 4% 4% 19% ELL 0 0% 0% 0% 0% 0% Not ELL 85 71% 4% 4% 4% 19%
Ogdensburg City School District
2005 Total Cohort - Aug 2009 Year Outcome All Students 150 65% 4% 8% 2% 21% ELL 0 0% 0% 0% 0% 0% Not ELL 150 65% 4% 8% 2% 21%
2005 Total Cohort - 4 Year Outcome All Students 150 63% 4% 9% 2% 21% ELL 0 0% 0% 0% 0% 0% Not ELL 150 63% 4% 9% 2% 21%
2004 Total Cohort - 5 Year Outcome All Students 148 77% 1% 3% 3% 15% ELL 0 0% 0% 0% 0% 0% Not ELL 148 77% 1% 3% 3% 15%
2003 Total Cohort - 6 Year Outcome All Students 140 72% 4% 1% 5% 18% ELL 0 0% 0% 0% 0% 0% Not ELL 140 72% 4% 1% 5% 18%
Data presented in this report are based on data submitted by school districts to the data repository for the 2008-09 school year. Students are reported based on their date of entry in grade 9 and their last enrollment status as reported in the warehouse on July 31, 2009. The federal Family Education Rights and Privacy Act prohibits the release of personally identifiable student information. This Act precludes the publication of summary information based on fewer than five students or in which subtraction or other simple mathematical operations could be used to obtain personal information. Cells that contain the ("#") symbol have been suppressed to protect student privacy.
District-ell status Thursday, March 4, 2010 Page 209 of 301
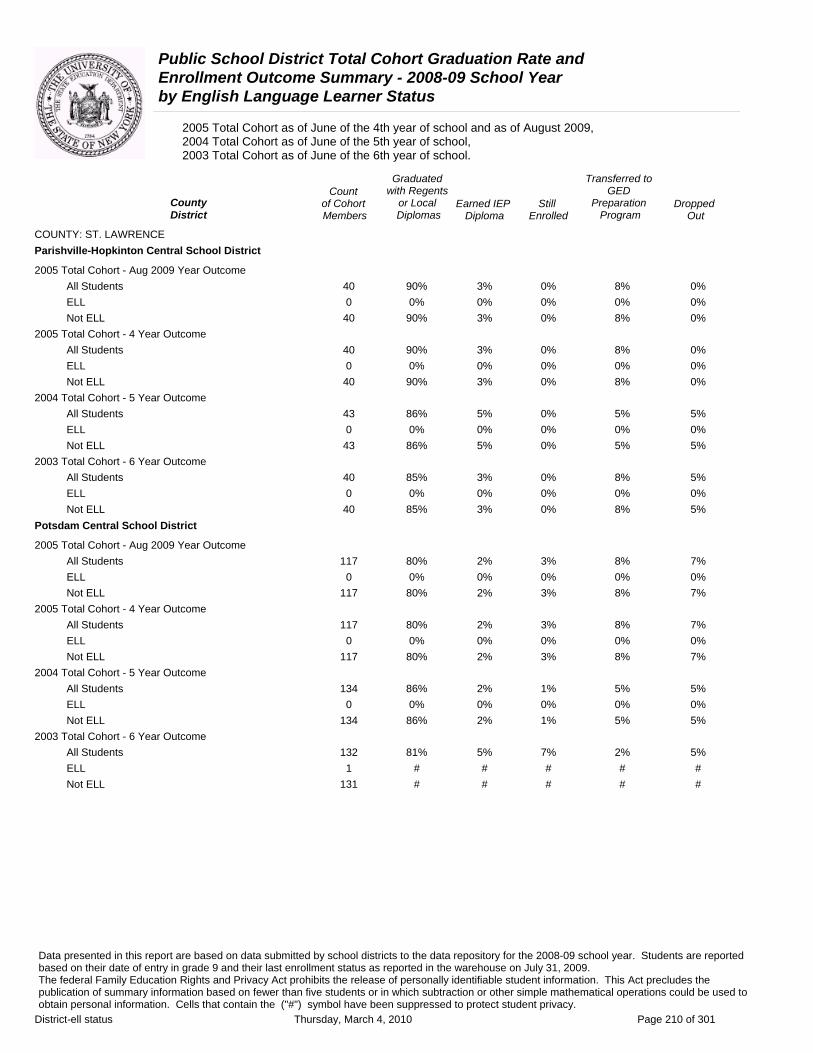
Public School District Total Cohort Graduation Rate and Enrollment Outcome Summary - 2008-09 School Year by English Language Learner Status
2005 Total Cohort as of June of the 4th year of school and as of August 2009, 2004 Total Cohort as of June of the 5th year of school, 2003 Total Cohort as of June of the 6th year of school.
Graduated Transferred to Count with Regents GED
County of Cohort or Local Earned IEP Still Preparation DroppedDistrict Members Diplomas Diploma Enrolled Program Out
COUNTY: ST. LAWRENCE Parishville-Hopkinton Central School District
2005 Total Cohort - Aug 2009 Year Outcome All Students 40 90% 3% 0% 8% 0% ELL 0 0% 0% 0% 0% 0% Not ELL 40 90% 3% 0% 8% 0%
2005 Total Cohort - 4 Year Outcome All Students 40 90% 3% 0% 8% 0% ELL 0 0% 0% 0% 0% 0% Not ELL 40 90% 3% 0% 8% 0%
2004 Total Cohort - 5 Year Outcome All Students 43 86% 5% 0% 5% 5% ELL 0 0% 0% 0% 0% 0% Not ELL 43 86% 5% 0% 5% 5%
2003 Total Cohort - 6 Year Outcome All Students 40 85% 3% 0% 8% 5% ELL 0 0% 0% 0% 0% 0% Not ELL 40 85% 3% 0% 8% 5%
Potsdam Central School District
2005 Total Cohort - Aug 2009 Year Outcome All Students 117 80% 2% 3% 8% 7% ELL 0 0% 0% 0% 0% 0% Not ELL 117 80% 2% 3% 8% 7%
2005 Total Cohort - 4 Year Outcome All Students 117 80% 2% 3% 8% 7% ELL 0 0% 0% 0% 0% 0% Not ELL 117 80% 2% 3% 8% 7%
2004 Total Cohort - 5 Year Outcome All Students 134 86% 2% 1% 5% 5% ELL 0 0% 0% 0% 0% 0% Not ELL 134 86% 2% 1% 5% 5%
2003 Total Cohort - 6 Year Outcome All Students 132 81% 5% 7% 2% 5% ELL 1 # # # # # Not ELL 131 # # # # #
Data presented in this report are based on data submitted by school districts to the data repository for the 2008-09 school year. Students are reported based on their date of entry in grade 9 and their last enrollment status as reported in the warehouse on July 31, 2009. The federal Family Education Rights and Privacy Act prohibits the release of personally identifiable student information. This Act precludes the publication of summary information based on fewer than five students or in which subtraction or other simple mathematical operations could be used to obtain personal information. Cells that contain the ("#") symbol have been suppressed to protect student privacy.
District-ell status Thursday, March 4, 2010 Page 210 of 301

Public School District Total Cohort Graduation Rate and Enrollment Outcome Summary - 2008-09 School Year by English Language Learner Status
2005 Total Cohort as of June of the 4th year of school and as of August 2009, 2004 Total Cohort as of June of the 5th year of school, 2003 Total Cohort as of June of the 6th year of school.
Graduated Transferred to Count with Regents GED
County of Cohort or Local Earned IEP Still Preparation DroppedDistrict Members Diplomas Diploma Enrolled Program Out
COUNTY: SARATOGA Ballston Spa Central School District
2005 Total Cohort - Aug 2009 Year Outcome All Students 345 81% 3% 4% 4% 7% ELL 0 0% 0% 0% 0% 0% Not ELL 345 81% 3% 4% 4% 7%
2005 Total Cohort - 4 Year Outcome All Students 345 79% 3% 6% 4% 7% ELL 0 0% 0% 0% 0% 0% Not ELL 345 79% 3% 6% 4% 7%
2004 Total Cohort - 5 Year Outcome All Students 364 85% 2% 2% 1% 10% ELL 0 0% 0% 0% 0% 0% Not ELL 364 85% 2% 2% 1% 10%
2003 Total Cohort - 6 Year Outcome All Students 293 81% 3% 3% 2% 11% ELL 0 0% 0% 0% 0% 0% Not ELL 293 81% 3% 3% 2% 11%
Burnt Hills-Ballston Lake Central School District
2005 Total Cohort - Aug 2009 Year Outcome All Students 298 92% 2% 3% 2% 1% ELL 0 0% 0% 0% 0% 0% Not ELL 298 92% 2% 3% 2% 1%
2005 Total Cohort - 4 Year Outcome All Students 298 91% 2% 4% 2% 1% ELL 0 0% 0% 0% 0% 0% Not ELL 298 91% 2% 4% 2% 1%
2004 Total Cohort - 5 Year Outcome All Students 295 93% 0% 1% 2% 3% ELL 0 0% 0% 0% 0% 0% Not ELL 295 93% 0% 1% 2% 3%
2003 Total Cohort - 6 Year Outcome All Students 298 94% 0% 3% 1% 2% ELL 0 0% 0% 0% 0% 0% Not ELL 298 94% 0% 3% 1% 2%
Corinth Central School District
2005 Total Cohort - Aug 2009 Year Outcome All Students 108 72% 1% 14% 6% 7% ELL 0 0% 0% 0% 0% 0% Not ELL 108 72% 1% 14% 6% 7%
2005 Total Cohort - 4 Year Outcome All Students 108 72% 1% 14% 6% 7% ELL 0 0% 0% 0% 0% 0% Not ELL 108 72% 1% 14% 6% 7%
Data presented in this report are based on data submitted by school districts to the data repository for the 2008-09 school year. Students are reported based on their date of entry in grade 9 and their last enrollment status as reported in the warehouse on July 31, 2009. The federal Family Education Rights and Privacy Act prohibits the release of personally identifiable student information. This Act precludes the publication of summary information based on fewer than five students or in which subtraction or other simple mathematical operations could be used to obtain personal information. Cells that contain the ("#") symbol have been suppressed to protect student privacy.
District-ell status Thursday, March 4, 2010 Page 211 of 301

Public School District Total Cohort Graduation Rate and Enrollment Outcome Summary - 2008-09 School Year by English Language Learner Status
2005 Total Cohort as of June of the 4th year of school and as of August 2009, 2004 Total Cohort as of June of the 5th year of school, 2003 Total Cohort as of June of the 6th year of school.
Graduated Transferred to Count with Regents GED
County of Cohort or Local Earned IEP Still Preparation DroppedDistrict Members Diplomas Diploma Enrolled Program Out
COUNTY: SARATOGA Corinth Central School District
2004 Total Cohort - 5 Year Outcome All Students 105 86% 1% 4% 1% 9% ELL 0 0% 0% 0% 0% 0% Not ELL 105 86% 1% 4% 1% 9%
2003 Total Cohort - 6 Year Outcome All Students 112 81% 3% 3% 1% 13% ELL 0 0% 0% 0% 0% 0% Not ELL 112 81% 3% 3% 1% 13%
Galway Central School District
2005 Total Cohort - Aug 2009 Year Outcome All Students 103 82% 1% 12% 3% 3% ELL 0 0% 0% 0% 0% 0% Not ELL 103 82% 1% 12% 3% 3%
2005 Total Cohort - 4 Year Outcome All Students 103 79% 1% 15% 3% 3% ELL 0 0% 0% 0% 0% 0% Not ELL 103 79% 1% 15% 3% 3%
2004 Total Cohort - 5 Year Outcome All Students 94 93% 1% 3% 1% 2% ELL 0 0% 0% 0% 0% 0% Not ELL 94 93% 1% 3% 1% 2%
2003 Total Cohort - 6 Year Outcome All Students 83 92% 0% 1% 0% 7% ELL 0 0% 0% 0% 0% 0% Not ELL 83 92% 0% 1% 0% 7%
Mechanicville City School District
2005 Total Cohort - Aug 2009 Year Outcome All Students 94 72% 2% 6% 3% 16% ELL 0 0% 0% 0% 0% 0% Not ELL 94 72% 2% 6% 3% 16%
2005 Total Cohort - 4 Year Outcome All Students 94 72% 2% 6% 3% 16% ELL 0 0% 0% 0% 0% 0% Not ELL 94 72% 2% 6% 3% 16%
2004 Total Cohort - 5 Year Outcome All Students 112 91% 2% 0% 0% 7% ELL 0 0% 0% 0% 0% 0% Not ELL 112 91% 2% 0% 0% 7%
2003 Total Cohort - 6 Year Outcome All Students 114 81% 3% 4% 6% 7% ELL 0 0% 0% 0% 0% 0% Not ELL 114 81% 3% 4% 6% 7%
Data presented in this report are based on data submitted by school districts to the data repository for the 2008-09 school year. Students are reported based on their date of entry in grade 9 and their last enrollment status as reported in the warehouse on July 31, 2009. The federal Family Education Rights and Privacy Act prohibits the release of personally identifiable student information. This Act precludes the publication of summary information based on fewer than five students or in which subtraction or other simple mathematical operations could be used to obtain personal information. Cells that contain the ("#") symbol have been suppressed to protect student privacy.
District-ell status Thursday, March 4, 2010 Page 212 of 301
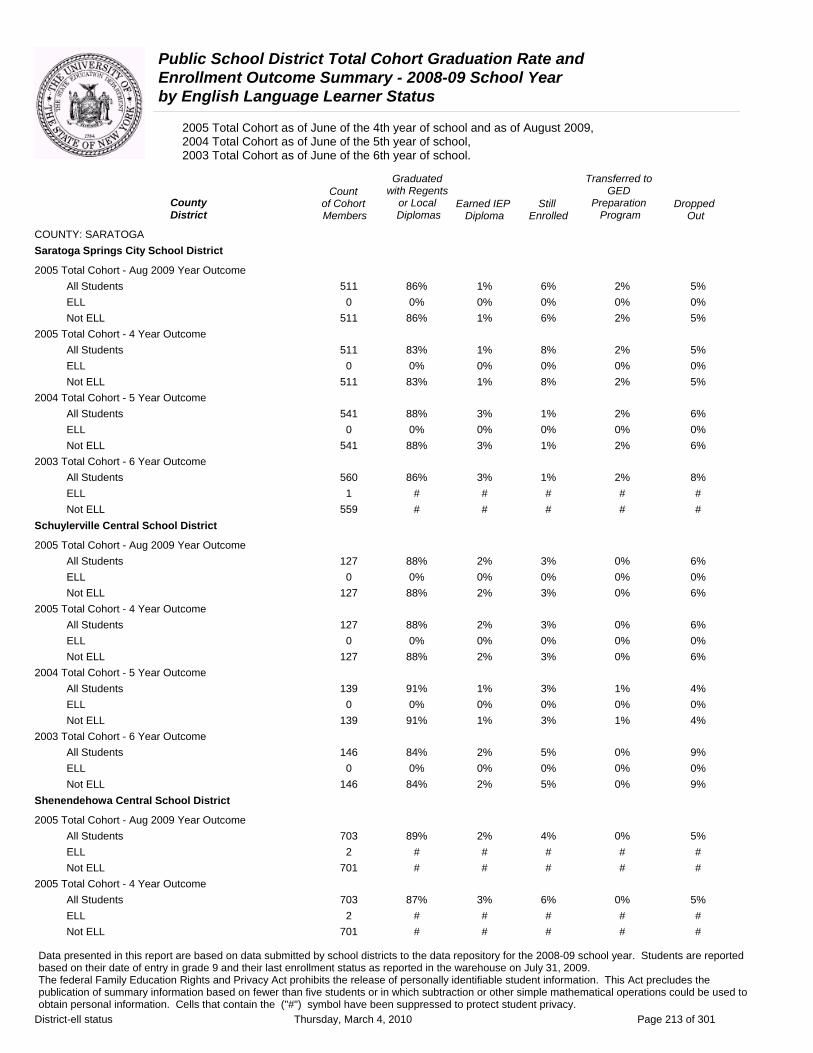
Public School District Total Cohort Graduation Rate and Enrollment Outcome Summary - 2008-09 School Year by English Language Learner Status
2005 Total Cohort as of June of the 4th year of school and as of August 2009, 2004 Total Cohort as of June of the 5th year of school, 2003 Total Cohort as of June of the 6th year of school.
Graduated Transferred to Count with Regents GED
County of Cohort or Local Earned IEP Still Preparation DroppedDistrict Members Diplomas Diploma Enrolled Program Out
COUNTY: SARATOGA Saratoga Springs City School District
2005 Total Cohort - Aug 2009 Year Outcome All Students 511 86% 1% 6% 2% 5% ELL 0 0% 0% 0% 0% 0% Not ELL 511 86% 1% 6% 2% 5%
2005 Total Cohort - 4 Year Outcome All Students 511 83% 1% 8% 2% 5% ELL 0 0% 0% 0% 0% 0% Not ELL 511 83% 1% 8% 2% 5%
2004 Total Cohort - 5 Year Outcome All Students 541 88% 3% 1% 2% 6% ELL 0 0% 0% 0% 0% 0% Not ELL 541 88% 3% 1% 2% 6%
2003 Total Cohort - 6 Year Outcome All Students 560 86% 3% 1% 2% 8% ELL 1 # # # # # Not ELL 559 # # # # #
Schuylerville Central School District
2005 Total Cohort - Aug 2009 Year Outcome All Students 127 88% 2% 3% 0% 6% ELL 0 0% 0% 0% 0% 0% Not ELL 127 88% 2% 3% 0% 6%
2005 Total Cohort - 4 Year Outcome All Students 127 88% 2% 3% 0% 6% ELL 0 0% 0% 0% 0% 0% Not ELL 127 88% 2% 3% 0% 6%
2004 Total Cohort - 5 Year Outcome All Students 139 91% 1% 3% 1% 4% ELL 0 0% 0% 0% 0% 0% Not ELL 139 91% 1% 3% 1% 4%
2003 Total Cohort - 6 Year Outcome All Students 146 84% 2% 5% 0% 9% ELL 0 0% 0% 0% 0% 0% Not ELL 146 84% 2% 5% 0% 9%
Shenendehowa Central School District
2005 Total Cohort - Aug 2009 Year Outcome All Students 703 89% 2% 4% 0% 5% ELL 2 # # # # # Not ELL 701 # # # # #
2005 Total Cohort - 4 Year Outcome All Students 703 87% 3% 6% 0% 5% ELL 2 # # # # # Not ELL 701 # # # # #
Data presented in this report are based on data submitted by school districts to the data repository for the 2008-09 school year. Students are reported based on their date of entry in grade 9 and their last enrollment status as reported in the warehouse on July 31, 2009. The federal Family Education Rights and Privacy Act prohibits the release of personally identifiable student information. This Act precludes the publication of summary information based on fewer than five students or in which subtraction or other simple mathematical operations could be used to obtain personal information. Cells that contain the ("#") symbol have been suppressed to protect student privacy.
District-ell status Thursday, March 4, 2010 Page 213 of 301
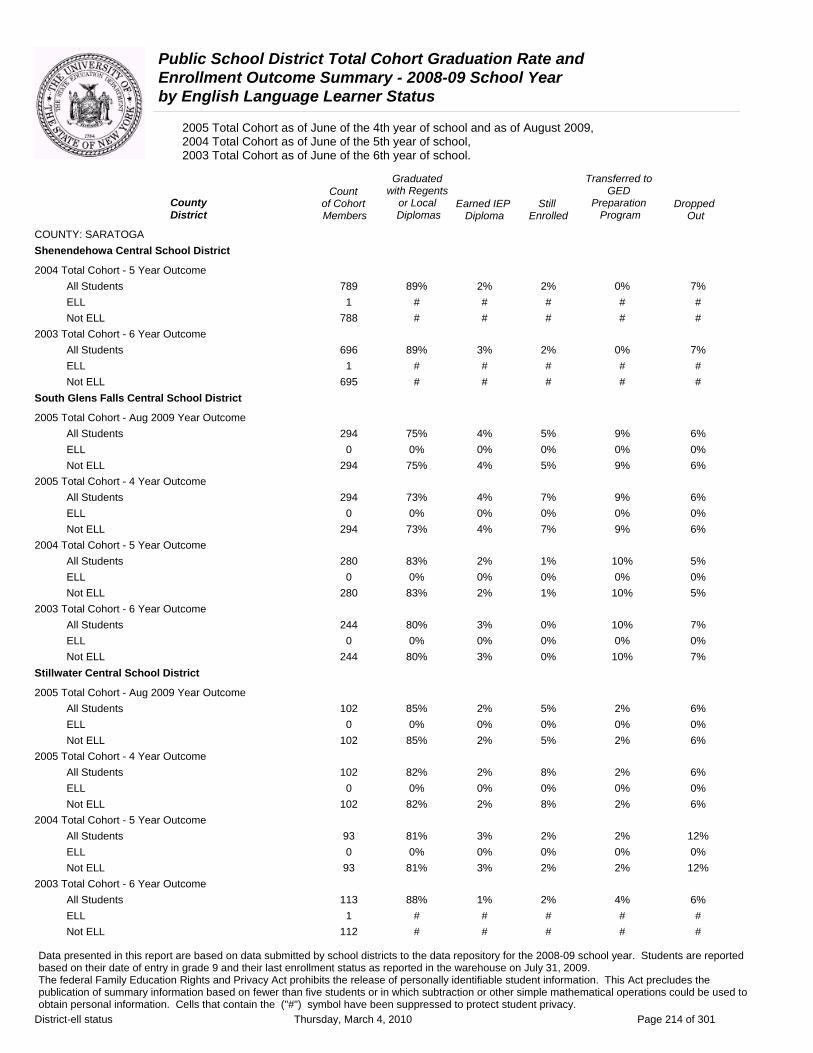
Public School District Total Cohort Graduation Rate and Enrollment Outcome Summary - 2008-09 School Year by English Language Learner Status
2005 Total Cohort as of June of the 4th year of school and as of August 2009, 2004 Total Cohort as of June of the 5th year of school, 2003 Total Cohort as of June of the 6th year of school.
Graduated Transferred to Count with Regents GED
County of Cohort or Local Earned IEP Still Preparation DroppedDistrict Members Diplomas Diploma Enrolled Program Out
COUNTY: SARATOGA Shenendehowa Central School District
2004 Total Cohort - 5 Year Outcome All Students 789 89% 2% 2% 0% 7% ELL 1 # # # # # Not ELL 788 # # # # #
2003 Total Cohort - 6 Year Outcome All Students 696 89% 3% 2% 0% 7% ELL 1 # # # # # Not ELL 695 # # # # #
South Glens Falls Central School District
2005 Total Cohort - Aug 2009 Year Outcome All Students 294 75% 4% 5% 9% 6% ELL 0 0% 0% 0% 0% 0% Not ELL 294 75% 4% 5% 9% 6%
2005 Total Cohort - 4 Year Outcome All Students 294 73% 4% 7% 9% 6% ELL 0 0% 0% 0% 0% 0% Not ELL 294 73% 4% 7% 9% 6%
2004 Total Cohort - 5 Year Outcome All Students 280 83% 2% 1% 10% 5% ELL 0 0% 0% 0% 0% 0% Not ELL 280 83% 2% 1% 10% 5%
2003 Total Cohort - 6 Year Outcome All Students 244 80% 3% 0% 10% 7% ELL 0 0% 0% 0% 0% 0% Not ELL 244 80% 3% 0% 10% 7%
Stillwater Central School District
2005 Total Cohort - Aug 2009 Year Outcome All Students 102 85% 2% 5% 2% 6% ELL 0 0% 0% 0% 0% 0% Not ELL 102 85% 2% 5% 2% 6%
2005 Total Cohort - 4 Year Outcome All Students 102 82% 2% 8% 2% 6% ELL 0 0% 0% 0% 0% 0% Not ELL 102 82% 2% 8% 2% 6%
2004 Total Cohort - 5 Year Outcome All Students 93 81% 3% 2% 2% 12% ELL 0 0% 0% 0% 0% 0% Not ELL 93 81% 3% 2% 2% 12%
2003 Total Cohort - 6 Year Outcome All Students 113 88% 1% 2% 4% 6% ELL 1 # # # # # Not ELL 112 # # # # #
Data presented in this report are based on data submitted by school districts to the data repository for the 2008-09 school year. Students are reported based on their date of entry in grade 9 and their last enrollment status as reported in the warehouse on July 31, 2009. The federal Family Education Rights and Privacy Act prohibits the release of personally identifiable student information. This Act precludes the publication of summary information based on fewer than five students or in which subtraction or other simple mathematical operations could be used to obtain personal information. Cells that contain the ("#") symbol have been suppressed to protect student privacy.
District-ell status Thursday, March 4, 2010 Page 214 of 301
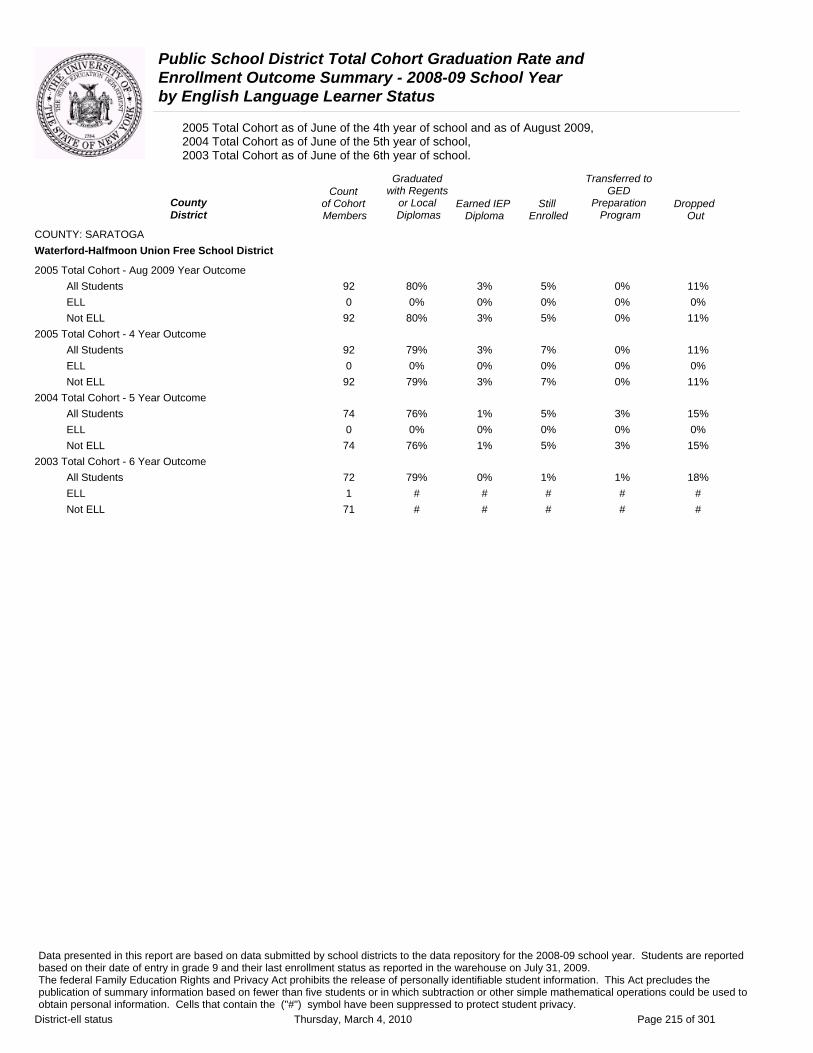
Public School District Total Cohort Graduation Rate and Enrollment Outcome Summary - 2008-09 School Year by English Language Learner Status
2005 Total Cohort as of June of the 4th year of school and as of August 2009, 2004 Total Cohort as of June of the 5th year of school, 2003 Total Cohort as of June of the 6th year of school.
Graduated Transferred to Count with Regents GED
County of Cohort or Local Earned IEP Still Preparation DroppedDistrict Members Diplomas Diploma Enrolled Program Out
COUNTY: SARATOGA Waterford-Halfmoon Union Free School District
2005 Total Cohort - Aug 2009 Year Outcome All Students 92 80% 3% 5% 0% 11% ELL 0 0% 0% 0% 0% 0% Not ELL 92 80% 3% 5% 0% 11%
2005 Total Cohort - 4 Year Outcome All Students 92 79% 3% 7% 0% 11% ELL 0 0% 0% 0% 0% 0% Not ELL 92 79% 3% 7% 0% 11%
2004 Total Cohort - 5 Year Outcome All Students 74 76% 1% 5% 3% 15% ELL 0 0% 0% 0% 0% 0% Not ELL 74 76% 1% 5% 3% 15%
2003 Total Cohort - 6 Year Outcome All Students 72 79% 0% 1% 1% 18% ELL 1 # # # # # Not ELL 71 # # # # #
Data presented in this report are based on data submitted by school districts to the data repository for the 2008-09 school year. Students are reported based on their date of entry in grade 9 and their last enrollment status as reported in the warehouse on July 31, 2009. The federal Family Education Rights and Privacy Act prohibits the release of personally identifiable student information. This Act precludes the publication of summary information based on fewer than five students or in which subtraction or other simple mathematical operations could be used to obtain personal information. Cells that contain the ("#") symbol have been suppressed to protect student privacy.
District-ell status Thursday, March 4, 2010 Page 215 of 301
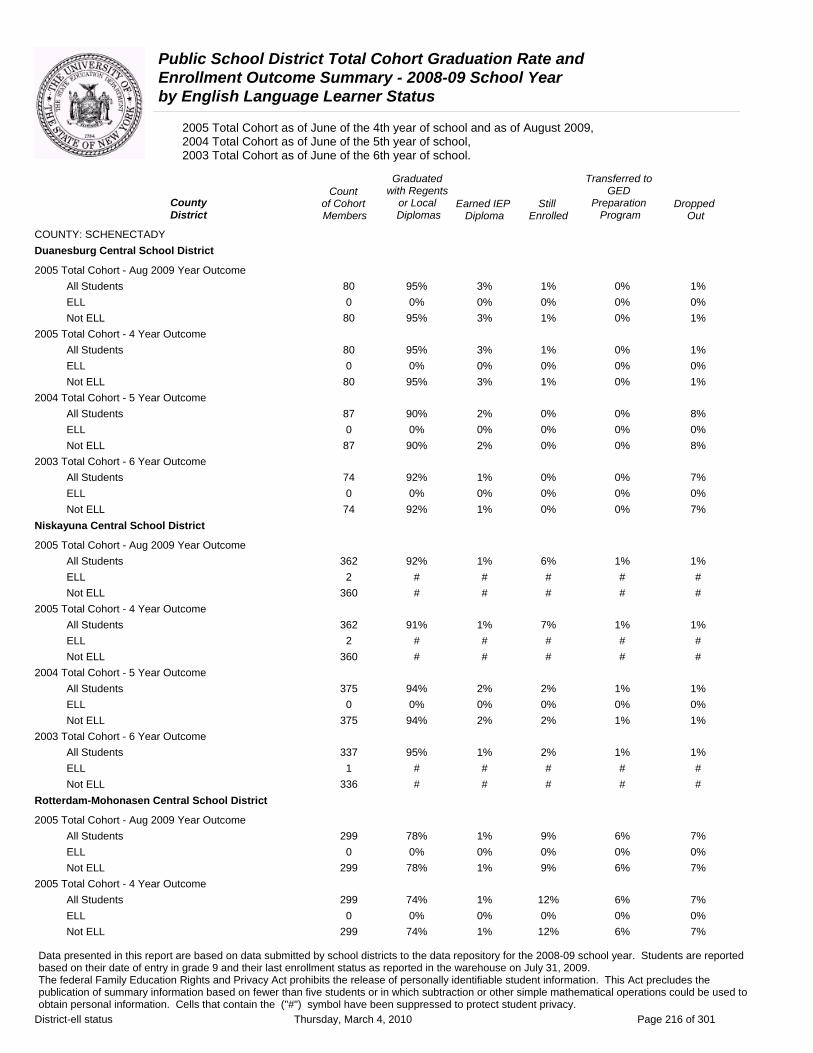
Public School District Total Cohort Graduation Rate and Enrollment Outcome Summary - 2008-09 School Year by English Language Learner Status
2005 Total Cohort as of June of the 4th year of school and as of August 2009, 2004 Total Cohort as of June of the 5th year of school, 2003 Total Cohort as of June of the 6th year of school.
Graduated Transferred to Count with Regents GED
County of Cohort or Local Earned IEP Still Preparation DroppedDistrict Members Diplomas Diploma Enrolled Program Out
COUNTY: SCHENECTADY Duanesburg Central School District
2005 Total Cohort - Aug 2009 Year Outcome All Students 80 95% 3% 1% 0% 1% ELL 0 0% 0% 0% 0% 0% Not ELL 80 95% 3% 1% 0% 1%
2005 Total Cohort - 4 Year Outcome All Students 80 95% 3% 1% 0% 1% ELL 0 0% 0% 0% 0% 0% Not ELL 80 95% 3% 1% 0% 1%
2004 Total Cohort - 5 Year Outcome All Students 87 90% 2% 0% 0% 8% ELL 0 0% 0% 0% 0% 0% Not ELL 87 90% 2% 0% 0% 8%
2003 Total Cohort - 6 Year Outcome All Students 74 92% 1% 0% 0% 7% ELL 0 0% 0% 0% 0% 0% Not ELL 74 92% 1% 0% 0% 7%
Niskayuna Central School District
2005 Total Cohort - Aug 2009 Year Outcome All Students 362 92% 1% 6% 1% 1% ELL 2 # # # # # Not ELL 360 # # # # #
2005 Total Cohort - 4 Year Outcome All Students 362 91% 1% 7% 1% 1% ELL 2 # # # # # Not ELL 360 # # # # #
2004 Total Cohort - 5 Year Outcome All Students 375 94% 2% 2% 1% 1% ELL 0 0% 0% 0% 0% 0% Not ELL 375 94% 2% 2% 1% 1%
2003 Total Cohort - 6 Year Outcome All Students 337 95% 1% 2% 1% 1% ELL 1 # # # # # Not ELL 336 # # # # #
Rotterdam-Mohonasen Central School District
2005 Total Cohort - Aug 2009 Year Outcome All Students 299 78% 1% 9% 6% 7% ELL 0 0% 0% 0% 0% 0% Not ELL 299 78% 1% 9% 6% 7%
2005 Total Cohort - 4 Year Outcome All Students 299 74% 1% 12% 6% 7% ELL 0 0% 0% 0% 0% 0% Not ELL 299 74% 1% 12% 6% 7%
Data presented in this report are based on data submitted by school districts to the data repository for the 2008-09 school year. Students are reported based on their date of entry in grade 9 and their last enrollment status as reported in the warehouse on July 31, 2009. The federal Family Education Rights and Privacy Act prohibits the release of personally identifiable student information. This Act precludes the publication of summary information based on fewer than five students or in which subtraction or other simple mathematical operations could be used to obtain personal information. Cells that contain the ("#") symbol have been suppressed to protect student privacy.
District-ell status Thursday, March 4, 2010 Page 216 of 301

Public School District Total Cohort Graduation Rate and Enrollment Outcome Summary - 2008-09 School Year by English Language Learner Status
2005 Total Cohort as of June of the 4th year of school and as of August 2009, 2004 Total Cohort as of June of the 5th year of school, 2003 Total Cohort as of June of the 6th year of school.
Graduated Transferred to Count with Regents GED
County of Cohort or Local Earned IEP Still Preparation DroppedDistrict Members Diplomas Diploma Enrolled Program Out
COUNTY: SCHENECTADY Rotterdam-Mohonasen Central School District
2004 Total Cohort - 5 Year Outcome All Students 273 79% 1% 3% 8% 10% ELL 1 # # # # # Not ELL 272 # # # # #
2003 Total Cohort - 6 Year Outcome All Students 288 82% 2% 2% 7% 8% ELL 3 # # # # # Not ELL 285 # # # # #
Schalmont Central School District
2005 Total Cohort - Aug 2009 Year Outcome All Students 177 85% 2% 5% 2% 6% ELL 1 # # # # # Not ELL 176 # # # # #
2005 Total Cohort - 4 Year Outcome All Students 177 84% 2% 6% 2% 6% ELL 1 # # # # # Not ELL 176 # # # # #
2004 Total Cohort - 5 Year Outcome All Students 185 85% 4% 2% 2% 7% ELL 0 0% 0% 0% 0% 0% Not ELL 185 85% 4% 2% 2% 7%
2003 Total Cohort - 6 Year Outcome All Students 191 84% 2% 2% 2% 11% ELL 2 # # # # # Not ELL 189 # # # # #
Schenectady City School District
2005 Total Cohort - Aug 2009 Year Outcome All Students 825 56% 3% 18% 6% 18% ELL 7 14% 0% 57% 0% 29% Not ELL 818 56% 3% 18% 6% 17%
2005 Total Cohort - 4 Year Outcome All Students 825 52% 3% 22% 6% 18% ELL 7 14% 0% 57% 0% 29% Not ELL 818 52% 3% 22% 6% 17%
2004 Total Cohort - 5 Year Outcome All Students 755 56% 4% 9% 9% 22% ELL 12 17% 0% 17% 25% 42% Not ELL 743 57% 4% 9% 9% 22%
2003 Total Cohort - 6 Year Outcome All Students 696 63% 5% 4% 6% 22% ELL 2 # # # # # Not ELL 694 # # # # #
Data presented in this report are based on data submitted by school districts to the data repository for the 2008-09 school year. Students are reported based on their date of entry in grade 9 and their last enrollment status as reported in the warehouse on July 31, 2009. The federal Family Education Rights and Privacy Act prohibits the release of personally identifiable student information. This Act precludes the publication of summary information based on fewer than five students or in which subtraction or other simple mathematical operations could be used to obtain personal information. Cells that contain the ("#") symbol have been suppressed to protect student privacy.
District-ell status Thursday, March 4, 2010 Page 217 of 301
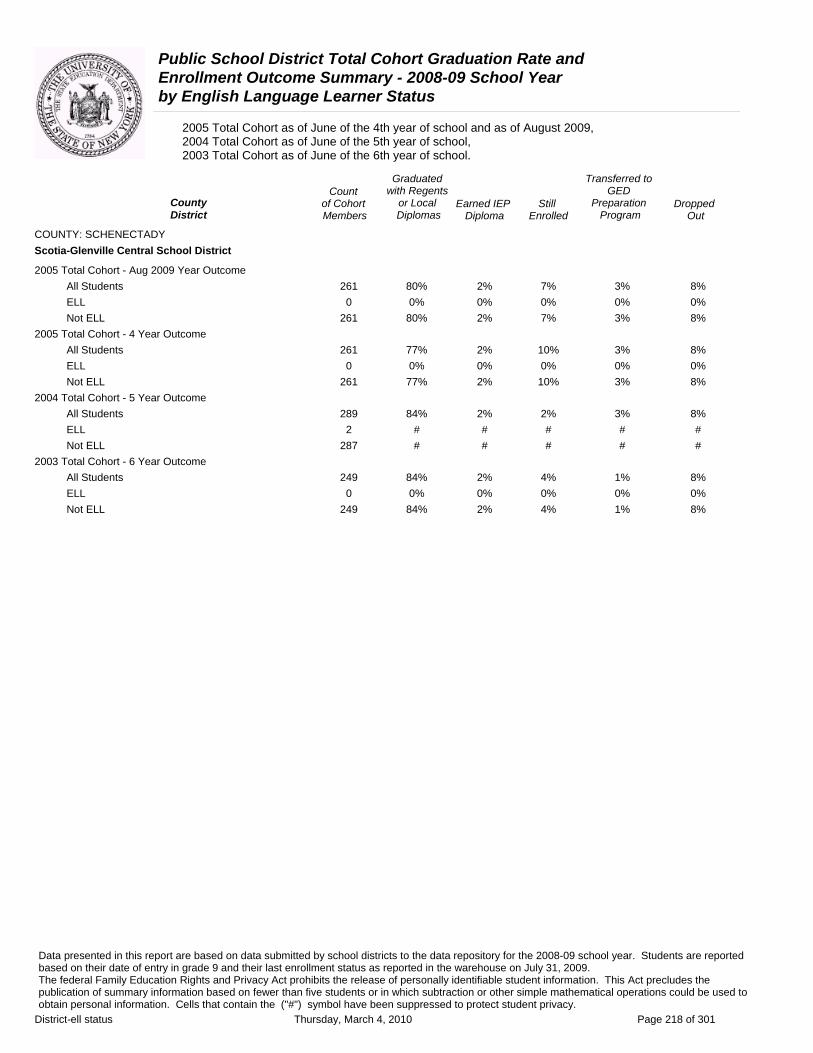
Public School District Total Cohort Graduation Rate and Enrollment Outcome Summary - 2008-09 School Year by English Language Learner Status
2005 Total Cohort as of June of the 4th year of school and as of August 2009, 2004 Total Cohort as of June of the 5th year of school, 2003 Total Cohort as of June of the 6th year of school.
Graduated Transferred to Count with Regents GED
County of Cohort or Local Earned IEP Still Preparation DroppedDistrict Members Diplomas Diploma Enrolled Program Out
COUNTY: SCHENECTADY Scotia-Glenville Central School District
2005 Total Cohort - Aug 2009 Year Outcome All Students 261 80% 2% 7% 3% 8% ELL 0 0% 0% 0% 0% 0% Not ELL 261 80% 2% 7% 3% 8%
2005 Total Cohort - 4 Year Outcome All Students 261 77% 2% 10% 3% 8% ELL 0 0% 0% 0% 0% 0% Not ELL 261 77% 2% 10% 3% 8%
2004 Total Cohort - 5 Year Outcome All Students 289 84% 2% 2% 3% 8% ELL 2 # # # # # Not ELL 287 # # # # #
2003 Total Cohort - 6 Year Outcome All Students 249 84% 2% 4% 1% 8% ELL 0 0% 0% 0% 0% 0% Not ELL 249 84% 2% 4% 1% 8%
Data presented in this report are based on data submitted by school districts to the data repository for the 2008-09 school year. Students are reported based on their date of entry in grade 9 and their last enrollment status as reported in the warehouse on July 31, 2009. The federal Family Education Rights and Privacy Act prohibits the release of personally identifiable student information. This Act precludes the publication of summary information based on fewer than five students or in which subtraction or other simple mathematical operations could be used to obtain personal information. Cells that contain the ("#") symbol have been suppressed to protect student privacy.
District-ell status Thursday, March 4, 2010 Page 218 of 301

Public School District Total Cohort Graduation Rate and Enrollment Outcome Summary - 2008-09 School Year by English Language Learner Status
2005 Total Cohort as of June of the 4th year of school and as of August 2009, 2004 Total Cohort as of June of the 5th year of school, 2003 Total Cohort as of June of the 6th year of school.
Graduated Transferred to Count with Regents GED
County of Cohort or Local Earned IEP Still Preparation DroppedDistrict Members Diplomas Diploma Enrolled Program Out
COUNTY: SCHOHARIE Cobleskill-Richmondville Central School District
2005 Total Cohort - Aug 2009 Year Outcome All Students 162 86% 2% 5% 0% 7% ELL 0 0% 0% 0% 0% 0% Not ELL 162 86% 2% 5% 0% 7%
2005 Total Cohort - 4 Year Outcome All Students 162 85% 2% 6% 0% 7% ELL 0 0% 0% 0% 0% 0% Not ELL 162 85% 2% 6% 0% 7%
2004 Total Cohort - 5 Year Outcome All Students 167 83% 2% 1% 0% 14% ELL 0 0% 0% 0% 0% 0% Not ELL 167 83% 2% 1% 0% 14%
2003 Total Cohort - 6 Year Outcome All Students 173 78% 2% 1% 0% 18% ELL 0 0% 0% 0% 0% 0% Not ELL 173 78% 2% 1% 0% 18%
Gilboa-Conesville Central School District
2005 Total Cohort - Aug 2009 Year Outcome All Students 27 85% 4% 0% 0% 11% ELL 0 0% 0% 0% 0% 0% Not ELL 27 85% 4% 0% 0% 11%
2005 Total Cohort - 4 Year Outcome All Students 27 85% 4% 0% 0% 11% ELL 0 0% 0% 0% 0% 0% Not ELL 27 85% 4% 0% 0% 11%
2004 Total Cohort - 5 Year Outcome All Students 34 79% 9% 3% 0% 9% ELL 0 0% 0% 0% 0% 0% Not ELL 34 79% 9% 3% 0% 9%
2003 Total Cohort - 6 Year Outcome All Students 33 73% 3% 0% 3% 21% ELL 0 0% 0% 0% 0% 0% Not ELL 33 73% 3% 0% 3% 21%
Jefferson Central School District
2005 Total Cohort - Aug 2009 Year Outcome All Students 19 79% 5% 0% 5% 11% ELL 0 0% 0% 0% 0% 0% Not ELL 19 79% 5% 0% 5% 11%
2005 Total Cohort - 4 Year Outcome All Students 19 79% 5% 0% 5% 11% ELL 0 0% 0% 0% 0% 0% Not ELL 19 79% 5% 0% 5% 11%
Data presented in this report are based on data submitted by school districts to the data repository for the 2008-09 school year. Students are reported based on their date of entry in grade 9 and their last enrollment status as reported in the warehouse on July 31, 2009. The federal Family Education Rights and Privacy Act prohibits the release of personally identifiable student information. This Act precludes the publication of summary information based on fewer than five students or in which subtraction or other simple mathematical operations could be used to obtain personal information. Cells that contain the ("#") symbol have been suppressed to protect student privacy.
District-ell status Thursday, March 4, 2010 Page 219 of 301

Public School District Total Cohort Graduation Rate and Enrollment Outcome Summary - 2008-09 School Year by English Language Learner Status
2005 Total Cohort as of June of the 4th year of school and as of August 2009, 2004 Total Cohort as of June of the 5th year of school, 2003 Total Cohort as of June of the 6th year of school.
Graduated Transferred to Count with Regents GED
County of Cohort or Local Earned IEP Still Preparation DroppedDistrict Members Diplomas Diploma Enrolled Program Out
COUNTY: SCHOHARIE Jefferson Central School District
2004 Total Cohort - 5 Year Outcome All Students 23 83% 0% 0% 0% 17% ELL 0 0% 0% 0% 0% 0% Not ELL 23 83% 0% 0% 0% 17%
2003 Total Cohort - 6 Year Outcome All Students 19 89% 0% 5% 0% 5% ELL 0 0% 0% 0% 0% 0% Not ELL 19 89% 0% 5% 0% 5%
Middleburgh Central School District
2005 Total Cohort - Aug 2009 Year Outcome All Students 79 84% 3% 4% 0% 10% ELL 0 0% 0% 0% 0% 0% Not ELL 79 84% 3% 4% 0% 10%
2005 Total Cohort - 4 Year Outcome All Students 79 84% 3% 4% 0% 10% ELL 0 0% 0% 0% 0% 0% Not ELL 79 84% 3% 4% 0% 10%
2004 Total Cohort - 5 Year Outcome All Students 78 83% 5% 5% 0% 6% ELL 0 0% 0% 0% 0% 0% Not ELL 78 83% 5% 5% 0% 6%
2003 Total Cohort - 6 Year Outcome All Students 73 79% 1% 3% 0% 16% ELL 0 0% 0% 0% 0% 0% Not ELL 73 79% 1% 3% 0% 16%
Schoharie Central School District
2005 Total Cohort - Aug 2009 Year Outcome All Students 91 79% 0% 10% 0% 11% ELL 0 0% 0% 0% 0% 0% Not ELL 91 79% 0% 10% 0% 11%
2005 Total Cohort - 4 Year Outcome All Students 91 79% 0% 10% 0% 11% ELL 0 0% 0% 0% 0% 0% Not ELL 91 79% 0% 10% 0% 11%
2004 Total Cohort - 5 Year Outcome All Students 92 84% 3% 9% 0% 4% ELL 0 0% 0% 0% 0% 0% Not ELL 92 84% 3% 9% 0% 4%
2003 Total Cohort - 6 Year Outcome All Students 68 88% 1% 4% 0% 6% ELL 0 0% 0% 0% 0% 0% Not ELL 68 88% 1% 4% 0% 6%
Data presented in this report are based on data submitted by school districts to the data repository for the 2008-09 school year. Students are reported based on their date of entry in grade 9 and their last enrollment status as reported in the warehouse on July 31, 2009. The federal Family Education Rights and Privacy Act prohibits the release of personally identifiable student information. This Act precludes the publication of summary information based on fewer than five students or in which subtraction or other simple mathematical operations could be used to obtain personal information. Cells that contain the ("#") symbol have been suppressed to protect student privacy.
District-ell status Thursday, March 4, 2010 Page 220 of 301

Public School District Total Cohort Graduation Rate and Enrollment Outcome Summary - 2008-09 School Year by English Language Learner Status
2005 Total Cohort as of June of the 4th year of school and as of August 2009, 2004 Total Cohort as of June of the 5th year of school, 2003 Total Cohort as of June of the 6th year of school.
Graduated Transferred to Count with Regents GED
County of Cohort or Local Earned IEP Still Preparation DroppedDistrict Members Diplomas Diploma Enrolled Program Out
COUNTY: SCHOHARIE Sharon Springs Central School District
2005 Total Cohort - Aug 2009 Year Outcome All Students 26 100% 0% 0% 0% 0% ELL 0 0% 0% 0% 0% 0% Not ELL 26 100% 0% 0% 0% 0%
2005 Total Cohort - 4 Year Outcome All Students 26 100% 0% 0% 0% 0% ELL 0 0% 0% 0% 0% 0% Not ELL 26 100% 0% 0% 0% 0%
2004 Total Cohort - 5 Year Outcome All Students 35 91% 0% 0% 3% 6% ELL 0 0% 0% 0% 0% 0% Not ELL 35 91% 0% 0% 3% 6%
2003 Total Cohort - 6 Year Outcome All Students 40 78% 0% 13% 10% 0% ELL 0 0% 0% 0% 0% 0% Not ELL 40 78% 0% 13% 10% 0%
Data presented in this report are based on data submitted by school districts to the data repository for the 2008-09 school year. Students are reported based on their date of entry in grade 9 and their last enrollment status as reported in the warehouse on July 31, 2009. The federal Family Education Rights and Privacy Act prohibits the release of personally identifiable student information. This Act precludes the publication of summary information based on fewer than five students or in which subtraction or other simple mathematical operations could be used to obtain personal information. Cells that contain the ("#") symbol have been suppressed to protect student privacy.
District-ell status Thursday, March 4, 2010 Page 221 of 301

Public School District Total Cohort Graduation Rate and Enrollment Outcome Summary - 2008-09 School Year by English Language Learner Status
2005 Total Cohort as of June of the 4th year of school and as of August 2009, 2004 Total Cohort as of June of the 5th year of school, 2003 Total Cohort as of June of the 6th year of school.
Graduated Transferred to Count with Regents GED
County of Cohort or Local Earned IEP Still Preparation DroppedDistrict Members Diplomas Diploma Enrolled Program Out
COUNTY: SCHUYLER Odessa-Montour Central School District
2005 Total Cohort - Aug 2009 Year Outcome All Students 54 78% 7% 6% 0% 9% ELL 0 0% 0% 0% 0% 0% Not ELL 54 78% 7% 6% 0% 9%
2005 Total Cohort - 4 Year Outcome All Students 54 78% 7% 6% 0% 9% ELL 0 0% 0% 0% 0% 0% Not ELL 54 78% 7% 6% 0% 9%
2004 Total Cohort - 5 Year Outcome All Students 59 75% 7% 7% 0% 12% ELL 0 0% 0% 0% 0% 0% Not ELL 59 75% 7% 7% 0% 12%
2003 Total Cohort - 6 Year Outcome All Students 68 68% 1% 1% 0% 29% ELL 0 0% 0% 0% 0% 0% Not ELL 68 68% 1% 1% 0% 29%
Watkins Glen Central School District
2005 Total Cohort - Aug 2009 Year Outcome All Students 133 81% 2% 9% 2% 6% ELL 0 0% 0% 0% 0% 0% Not ELL 133 81% 2% 9% 2% 6%
2005 Total Cohort - 4 Year Outcome All Students 133 80% 2% 10% 2% 6% ELL 0 0% 0% 0% 0% 0% Not ELL 133 80% 2% 10% 2% 6%
2004 Total Cohort - 5 Year Outcome All Students 112 80% 1% 7% 3% 9% ELL 0 0% 0% 0% 0% 0% Not ELL 112 80% 1% 7% 3% 9%
2003 Total Cohort - 6 Year Outcome All Students 116 84% 3% 6% 3% 5% ELL 0 0% 0% 0% 0% 0% Not ELL 116 84% 3% 6% 3% 5%
Data presented in this report are based on data submitted by school districts to the data repository for the 2008-09 school year. Students are reported based on their date of entry in grade 9 and their last enrollment status as reported in the warehouse on July 31, 2009. The federal Family Education Rights and Privacy Act prohibits the release of personally identifiable student information. This Act precludes the publication of summary information based on fewer than five students or in which subtraction or other simple mathematical operations could be used to obtain personal information. Cells that contain the ("#") symbol have been suppressed to protect student privacy.
District-ell status Thursday, March 4, 2010 Page 222 of 301

Public School District Total Cohort Graduation Rate and Enrollment Outcome Summary - 2008-09 School Year by English Language Learner Status
2005 Total Cohort as of June of the 4th year of school and as of August 2009, 2004 Total Cohort as of June of the 5th year of school, 2003 Total Cohort as of June of the 6th year of school.
Graduated Transferred to Count with Regents GED
County of Cohort or Local Earned IEP Still Preparation DroppedDistrict Members Diplomas Diploma Enrolled Program Out
COUNTY: SENECA Romulus Central School District
2005 Total Cohort - Aug 2009 Year Outcome All Students 49 63% 0% 18% 6% 12% ELL 0 0% 0% 0% 0% 0% Not ELL 49 63% 0% 18% 6% 12%
2005 Total Cohort - 4 Year Outcome All Students 49 61% 0% 20% 6% 12% ELL 0 0% 0% 0% 0% 0% Not ELL 49 61% 0% 20% 6% 12%
2004 Total Cohort - 5 Year Outcome All Students 51 84% 4% 0% 0% 12% ELL 0 0% 0% 0% 0% 0% Not ELL 51 84% 4% 0% 0% 12%
2003 Total Cohort - 6 Year Outcome All Students 53 74% 6% 9% 2% 8% ELL 0 0% 0% 0% 0% 0% Not ELL 53 74% 6% 9% 2% 8%
Seneca Falls Central School District
2005 Total Cohort - Aug 2009 Year Outcome All Students 122 89% 0% 7% 0% 4% ELL 0 0% 0% 0% 0% 0% Not ELL 122 89% 0% 7% 0% 4%
2005 Total Cohort - 4 Year Outcome All Students 122 85% 0% 11% 0% 4% ELL 0 0% 0% 0% 0% 0% Not ELL 122 85% 0% 11% 0% 4%
2004 Total Cohort - 5 Year Outcome All Students 140 75% 6% 7% 1% 11% ELL 0 0% 0% 0% 0% 0% Not ELL 140 75% 6% 7% 1% 11%
2003 Total Cohort - 6 Year Outcome All Students 125 78% 4% 1% 2% 14% ELL 0 0% 0% 0% 0% 0% Not ELL 125 78% 4% 1% 2% 14%
South Seneca Central School District
2005 Total Cohort - Aug 2009 Year Outcome All Students 74 74% 1% 8% 3% 14% ELL 0 0% 0% 0% 0% 0% Not ELL 74 74% 1% 8% 3% 14%
2005 Total Cohort - 4 Year Outcome All Students 74 72% 1% 11% 3% 14% ELL 0 0% 0% 0% 0% 0% Not ELL 74 72% 1% 11% 3% 14%
Data presented in this report are based on data submitted by school districts to the data repository for the 2008-09 school year. Students are reported based on their date of entry in grade 9 and their last enrollment status as reported in the warehouse on July 31, 2009. The federal Family Education Rights and Privacy Act prohibits the release of personally identifiable student information. This Act precludes the publication of summary information based on fewer than five students or in which subtraction or other simple mathematical operations could be used to obtain personal information. Cells that contain the ("#") symbol have been suppressed to protect student privacy.
District-ell status Thursday, March 4, 2010 Page 223 of 301
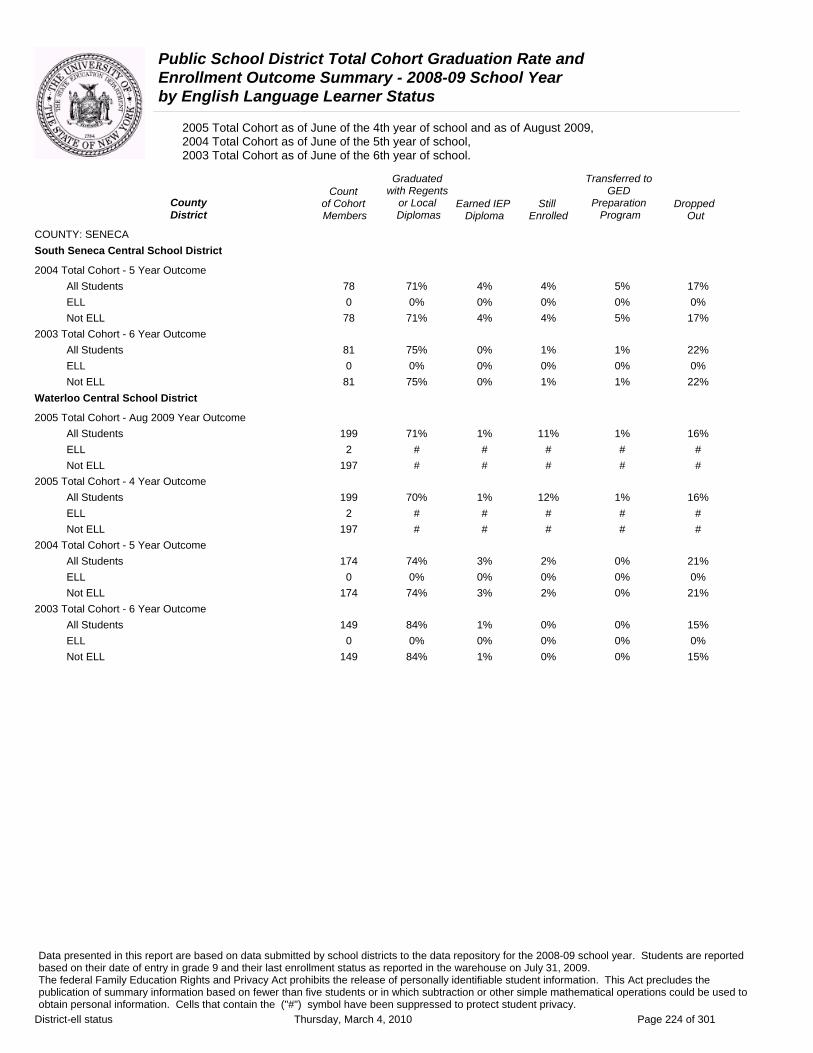
Public School District Total Cohort Graduation Rate and Enrollment Outcome Summary - 2008-09 School Year by English Language Learner Status
2005 Total Cohort as of June of the 4th year of school and as of August 2009, 2004 Total Cohort as of June of the 5th year of school, 2003 Total Cohort as of June of the 6th year of school.
Graduated Transferred to Count with Regents GED
County of Cohort or Local Earned IEP Still Preparation DroppedDistrict Members Diplomas Diploma Enrolled Program Out
COUNTY: SENECA South Seneca Central School District
2004 Total Cohort - 5 Year Outcome All Students 78 71% 4% 4% 5% 17% ELL 0 0% 0% 0% 0% 0% Not ELL 78 71% 4% 4% 5% 17%
2003 Total Cohort - 6 Year Outcome All Students 81 75% 0% 1% 1% 22% ELL 0 0% 0% 0% 0% 0% Not ELL 81 75% 0% 1% 1% 22%
Waterloo Central School District
2005 Total Cohort - Aug 2009 Year Outcome All Students 199 71% 1% 11% 1% 16% ELL 2 # # # # # Not ELL 197 # # # # #
2005 Total Cohort - 4 Year Outcome All Students 199 70% 1% 12% 1% 16% ELL 2 # # # # # Not ELL 197 # # # # #
2004 Total Cohort - 5 Year Outcome All Students 174 74% 3% 2% 0% 21% ELL 0 0% 0% 0% 0% 0% Not ELL 174 74% 3% 2% 0% 21%
2003 Total Cohort - 6 Year Outcome All Students 149 84% 1% 0% 0% 15% ELL 0 0% 0% 0% 0% 0% Not ELL 149 84% 1% 0% 0% 15%
Data presented in this report are based on data submitted by school districts to the data repository for the 2008-09 school year. Students are reported based on their date of entry in grade 9 and their last enrollment status as reported in the warehouse on July 31, 2009. The federal Family Education Rights and Privacy Act prohibits the release of personally identifiable student information. This Act precludes the publication of summary information based on fewer than five students or in which subtraction or other simple mathematical operations could be used to obtain personal information. Cells that contain the ("#") symbol have been suppressed to protect student privacy.
District-ell status Thursday, March 4, 2010 Page 224 of 301
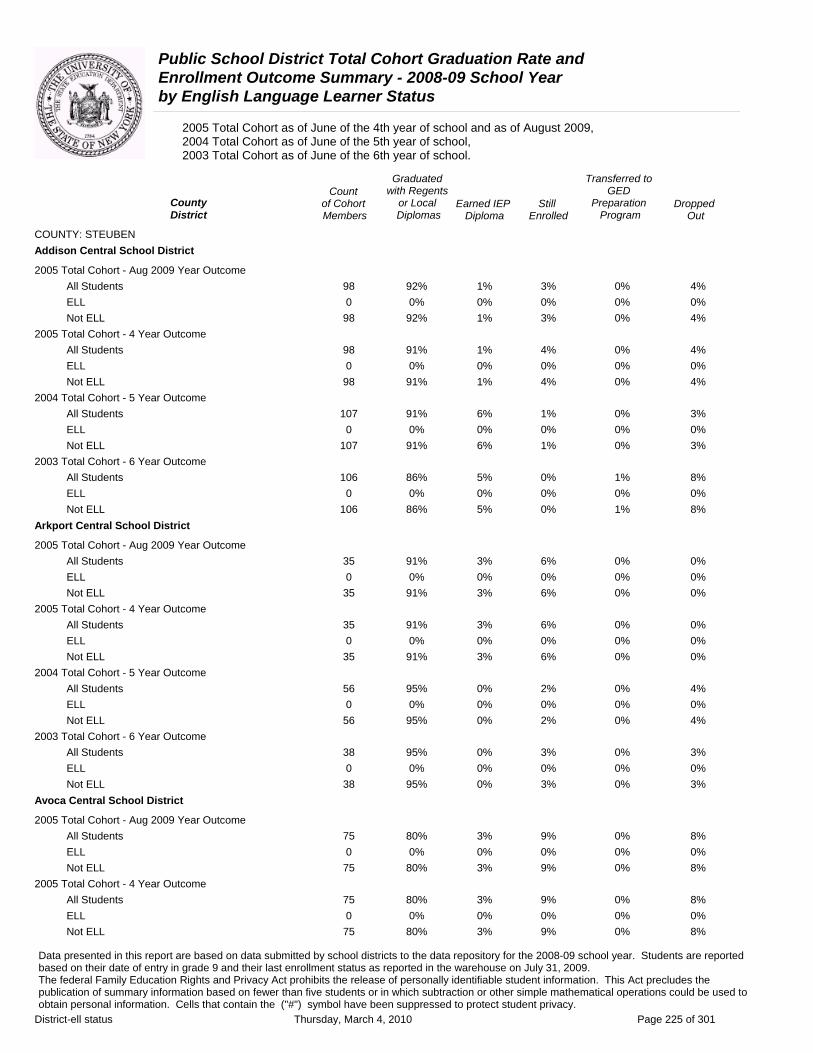
Public School District Total Cohort Graduation Rate and Enrollment Outcome Summary - 2008-09 School Year by English Language Learner Status
2005 Total Cohort as of June of the 4th year of school and as of August 2009, 2004 Total Cohort as of June of the 5th year of school, 2003 Total Cohort as of June of the 6th year of school.
Graduated Transferred to Count with Regents GED
County of Cohort or Local Earned IEP Still Preparation DroppedDistrict Members Diplomas Diploma Enrolled Program Out
COUNTY: STEUBEN Addison Central School District
2005 Total Cohort - Aug 2009 Year Outcome All Students 98 92% 1% 3% 0% 4% ELL 0 0% 0% 0% 0% 0% Not ELL 98 92% 1% 3% 0% 4%
2005 Total Cohort - 4 Year Outcome All Students 98 91% 1% 4% 0% 4% ELL 0 0% 0% 0% 0% 0% Not ELL 98 91% 1% 4% 0% 4%
2004 Total Cohort - 5 Year Outcome All Students 107 91% 6% 1% 0% 3% ELL 0 0% 0% 0% 0% 0% Not ELL 107 91% 6% 1% 0% 3%
2003 Total Cohort - 6 Year Outcome All Students 106 86% 5% 0% 1% 8% ELL 0 0% 0% 0% 0% 0% Not ELL 106 86% 5% 0% 1% 8%
Arkport Central School District
2005 Total Cohort - Aug 2009 Year Outcome All Students 35 91% 3% 6% 0% 0% ELL 0 0% 0% 0% 0% 0% Not ELL 35 91% 3% 6% 0% 0%
2005 Total Cohort - 4 Year Outcome All Students 35 91% 3% 6% 0% 0% ELL 0 0% 0% 0% 0% 0% Not ELL 35 91% 3% 6% 0% 0%
2004 Total Cohort - 5 Year Outcome All Students 56 95% 0% 2% 0% 4% ELL 0 0% 0% 0% 0% 0% Not ELL 56 95% 0% 2% 0% 4%
2003 Total Cohort - 6 Year Outcome All Students 38 95% 0% 3% 0% 3% ELL 0 0% 0% 0% 0% 0% Not ELL 38 95% 0% 3% 0% 3%
Avoca Central School District
2005 Total Cohort - Aug 2009 Year Outcome All Students 75 80% 3% 9% 0% 8% ELL 0 0% 0% 0% 0% 0% Not ELL 75 80% 3% 9% 0% 8%
2005 Total Cohort - 4 Year Outcome All Students 75 80% 3% 9% 0% 8% ELL 0 0% 0% 0% 0% 0% Not ELL 75 80% 3% 9% 0% 8%
Data presented in this report are based on data submitted by school districts to the data repository for the 2008-09 school year. Students are reported based on their date of entry in grade 9 and their last enrollment status as reported in the warehouse on July 31, 2009. The federal Family Education Rights and Privacy Act prohibits the release of personally identifiable student information. This Act precludes the publication of summary information based on fewer than five students or in which subtraction or other simple mathematical operations could be used to obtain personal information. Cells that contain the ("#") symbol have been suppressed to protect student privacy.
District-ell status Thursday, March 4, 2010 Page 225 of 301

Public School District Total Cohort Graduation Rate and Enrollment Outcome Summary - 2008-09 School Year by English Language Learner Status
2005 Total Cohort as of June of the 4th year of school and as of August 2009, 2004 Total Cohort as of June of the 5th year of school, 2003 Total Cohort as of June of the 6th year of school.
Graduated Transferred to Count with Regents GED
County District
of Cohort Members
or Local Diplomas
Earned IEP Diploma
Still Enrolled
Preparation Program
Dropped Out
COUNTY: STEUBEN Avoca Central School District
2004 Total Cohort - 5 Year Outcome All Students 45 82% 0% 2% 0% 16% ELL 0 0% 0% 0% 0% 0% Not ELL 45 82% 0% 2% 0% 16%
2003 Total Cohort - 6 Year Outcome All Students 64 89% 0% 3% 0% 8% ELL 0 0% 0% 0% 0% 0% Not ELL 64 89% 0% 3% 0% 8%
Bath Central School District
2005 Total Cohort - Aug 2009 Year Outcome All Students 162 81% 4% 2% 0% 12% ELL 1 # # # # # Not ELL 161 # # # # #
2005 Total Cohort - 4 Year Outcome All Students 162 81% 4% 3% 0% 12% ELL 1 # # # # # Not ELL 161 # # # # #
2004 Total Cohort - 5 Year Outcome All Students 160 86% 4% 1% 0% 10% ELL 1 # # # # # Not ELL 159 # # # # #
2003 Total Cohort - 6 Year Outcome All Students 147 86% 1% 1% 0% 11% ELL 0 0% 0% 0% 0% 0% Not ELL 147 86% 1% 1% 0% 11%
Bradford Central School District
2005 Total Cohort - Aug 2009 Year Outcome All Students 32 88% 6% 3% 0% 3% ELL 0 0% 0% 0% 0% 0% Not ELL 32 88% 6% 3% 0% 3%
2005 Total Cohort - 4 Year Outcome All Students 32 88% 6% 3% 0% 3% ELL 0 0% 0% 0% 0% 0% Not ELL 32 88% 6% 3% 0% 3%
2004 Total Cohort - 5 Year Outcome All Students 24 79% 17% 0% 0% 4% ELL 0 0% 0% 0% 0% 0% Not ELL 24 79% 17% 0% 0% 4%
2003 Total Cohort - 6 Year Outcome All Students 24 88% 4% 4% 0% 4% ELL 0 0% 0% 0% 0% 0% Not ELL 24 88% 4% 4% 0% 4%
Data presented in this report are based on data submitted by school districts to the data repository for the 2008-09 school year. Students are reported based on their date of entry in grade 9 and their last enrollment status as reported in the warehouse on July 31, 2009. The federal Family Education Rights and Privacy Act prohibits the release of personally identifiable student information. This Act precludes the publication of summary information based on fewer than five students or in which subtraction or other simple mathematical operations could be used to obtain personal information. Cells that contain the ("#") symbol have been suppressed to protect student privacy.
District-ell status Thursday, March 4, 2010 Page 226 of 301
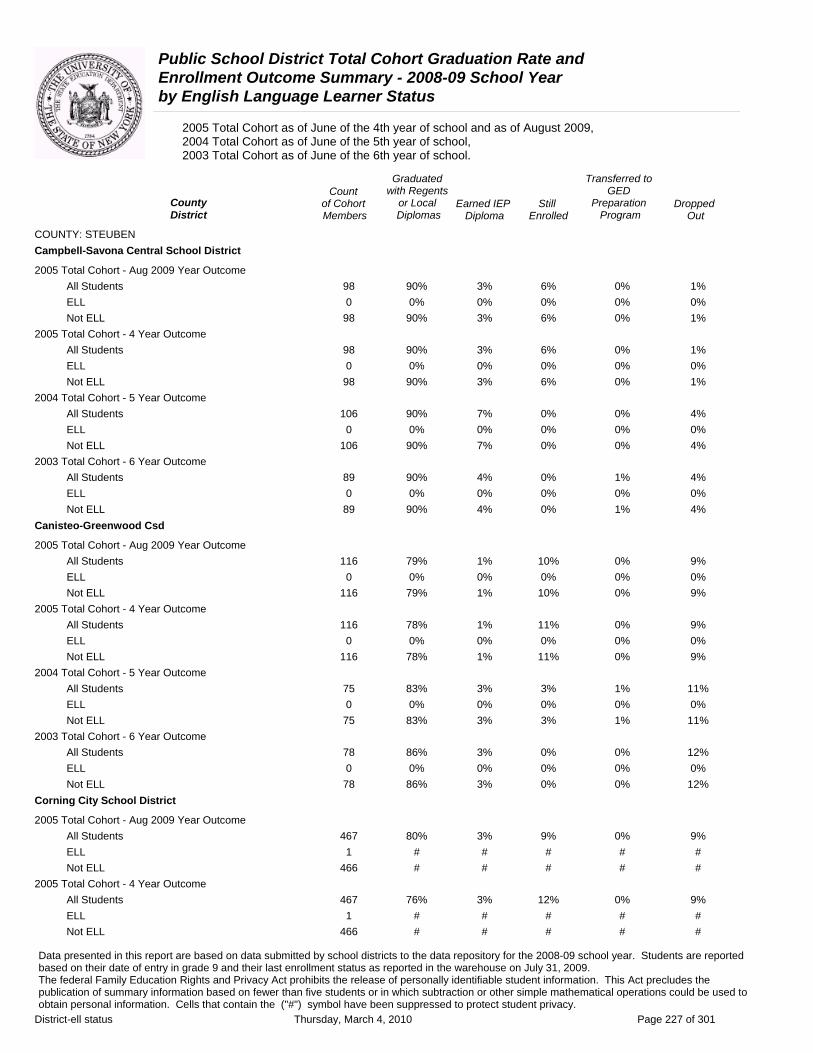
Public School District Total Cohort Graduation Rate and Enrollment Outcome Summary - 2008-09 School Year by English Language Learner Status
2005 Total Cohort as of June of the 4th year of school and as of August 2009, 2004 Total Cohort as of June of the 5th year of school, 2003 Total Cohort as of June of the 6th year of school.
Graduated Transferred to Count with Regents GED
County District
of Cohort Members
or Local Diplomas
Earned IEP Diploma
Still Enrolled
Preparation Program
Dropped Out
COUNTY: STEUBEN Campbell-Savona Central School District
2005 Total Cohort - Aug 2009 Year Outcome All Students 98 90% 3% 6% 0% 1% ELL 0 0% 0% 0% 0% 0% Not ELL 98 90% 3% 6% 0% 1%
2005 Total Cohort - 4 Year Outcome All Students 98 90% 3% 6% 0% 1% ELL 0 0% 0% 0% 0% 0% Not ELL 98 90% 3% 6% 0% 1%
2004 Total Cohort - 5 Year Outcome All Students 106 90% 7% 0% 0% 4% ELL 0 0% 0% 0% 0% 0% Not ELL 106 90% 7% 0% 0% 4%
2003 Total Cohort - 6 Year Outcome All Students 89 90% 4% 0% 1% 4% ELL 0 0% 0% 0% 0% 0% Not ELL 89 90% 4% 0% 1% 4%
Canisteo-Greenwood Csd
2005 Total Cohort - Aug 2009 Year Outcome All Students 116 79% 1% 10% 0% 9% ELL 0 0% 0% 0% 0% 0% Not ELL 116 79% 1% 10% 0% 9%
2005 Total Cohort - 4 Year Outcome All Students 116 78% 1% 11% 0% 9% ELL 0 0% 0% 0% 0% 0% Not ELL 116 78% 1% 11% 0% 9%
2004 Total Cohort - 5 Year Outcome All Students 75 83% 3% 3% 1% 11% ELL 0 0% 0% 0% 0% 0% Not ELL 75 83% 3% 3% 1% 11%
2003 Total Cohort - 6 Year Outcome All Students 78 86% 3% 0% 0% 12% ELL 0 0% 0% 0% 0% 0% Not ELL 78 86% 3% 0% 0% 12%
Corning City School District
2005 Total Cohort - Aug 2009 Year Outcome All Students 467 80% 3% 9% 0% 9% ELL 1 # # # # # Not ELL 466 # # # # #
2005 Total Cohort - 4 Year Outcome All Students 467 76% 3% 12% 0% 9% ELL 1 # # # # # Not ELL 466 # # # # #
Data presented in this report are based on data submitted by school districts to the data repository for the 2008-09 school year. Students are reported based on their date of entry in grade 9 and their last enrollment status as reported in the warehouse on July 31, 2009. The federal Family Education Rights and Privacy Act prohibits the release of personally identifiable student information. This Act precludes the publication of summary information based on fewer than five students or in which subtraction or other simple mathematical operations could be used to obtain personal information. Cells that contain the ("#") symbol have been suppressed to protect student privacy.
District-ell status Thursday, March 4, 2010 Page 227 of 301

Public School District Total Cohort Graduation Rate and Enrollment Outcome Summary - 2008-09 School Year by English Language Learner Status
2005 Total Cohort as of June of the 4th year of school and as of August 2009, 2004 Total Cohort as of June of the 5th year of school, 2003 Total Cohort as of June of the 6th year of school.
Graduated Transferred to Count with Regents GED
County District
of Cohort Members
or Local Diplomas
Earned IEP Diploma
Still Enrolled
Preparation Program
Dropped Out
COUNTY: STEUBEN Corning City School District
2004 Total Cohort - 5 Year Outcome All Students 475 83% 2% 3% 0% 12% ELL 1 # # # # # Not ELL 474 # # # # #
2003 Total Cohort - 6 Year Outcome All Students 448 82% 3% 2% 0% 13% ELL 1 # # # # # Not ELL 447 # # # # #
Hammondsport Central School District
2005 Total Cohort - Aug 2009 Year Outcome All Students 55 93% 0% 4% 0% 4% ELL 0 0% 0% 0% 0% 0% Not ELL 55 93% 0% 4% 0% 4%
2005 Total Cohort - 4 Year Outcome All Students 55 89% 0% 7% 0% 4% ELL 0 0% 0% 0% 0% 0% Not ELL 55 89% 0% 7% 0% 4%
2004 Total Cohort - 5 Year Outcome All Students 45 96% 2% 0% 0% 2% ELL 0 0% 0% 0% 0% 0% Not ELL 45 96% 2% 0% 0% 2%
2003 Total Cohort - 6 Year Outcome All Students 60 90% 0% 2% 0% 8% ELL 0 0% 0% 0% 0% 0% Not ELL 60 90% 0% 2% 0% 8%
Hornell City School District
2005 Total Cohort - Aug 2009 Year Outcome All Students 147 81% 3% 10% 1% 5% ELL 2 # # # # # Not ELL 145 # # # # #
2005 Total Cohort - 4 Year Outcome All Students 147 80% 3% 10% 1% 5% ELL 2 # # # # # Not ELL 145 # # # # #
2004 Total Cohort - 5 Year Outcome All Students 168 74% 2% 8% 0% 15% ELL 1 # # # # # Not ELL 167 # # # # #
2003 Total Cohort - 6 Year Outcome All Students 135 72% 4% 4% 1% 20% ELL 1 # # # # # Not ELL 134 # # # # #
Data presented in this report are based on data submitted by school districts to the data repository for the 2008-09 school year. Students are reported based on their date of entry in grade 9 and their last enrollment status as reported in the warehouse on July 31, 2009. The federal Family Education Rights and Privacy Act prohibits the release of personally identifiable student information. This Act precludes the publication of summary information based on fewer than five students or in which subtraction or other simple mathematical operations could be used to obtain personal information. Cells that contain the ("#") symbol have been suppressed to protect student privacy.
District-ell status Thursday, March 4, 2010 Page 228 of 301

Public School District Total Cohort Graduation Rate and Enrollment Outcome Summary - 2008-09 School Year by English Language Learner Status
2005 Total Cohort as of June of the 4th year of school and as of August 2009, 2004 Total Cohort as of June of the 5th year of school, 2003 Total Cohort as of June of the 6th year of school.
Graduated Transferred to Count with Regents GED
County of Cohort or Local Earned IEP Still Preparation DroppedDistrict Members Diplomas Diploma Enrolled Program Out
COUNTY: STEUBEN Jasper-Troupsburg Central School District
2005 Total Cohort - Aug 2009 Year Outcome All Students 58 86% 0% 2% 0% 12% ELL 0 0% 0% 0% 0% 0% Not ELL 58 86% 0% 2% 0% 12%
2005 Total Cohort - 4 Year Outcome All Students 58 86% 0% 2% 0% 12% ELL 0 0% 0% 0% 0% 0% Not ELL 58 86% 0% 2% 0% 12%
2004 Total Cohort - 5 Year Outcome All Students 48 94% 0% 0% 0% 6% ELL 0 0% 0% 0% 0% 0% Not ELL 48 94% 0% 0% 0% 6%
2003 Total Cohort - 6 Year Outcome All Students 42 83% 10% 0% 0% 7% ELL 0 0% 0% 0% 0% 0% Not ELL 42 83% 10% 0% 0% 7%
Prattsburgh Central School District
2005 Total Cohort - Aug 2009 Year Outcome All Students 35 89% 0% 3% 0% 9% ELL 0 0% 0% 0% 0% 0% Not ELL 35 89% 0% 3% 0% 9%
2005 Total Cohort - 4 Year Outcome All Students 35 89% 0% 3% 0% 9% ELL 0 0% 0% 0% 0% 0% Not ELL 35 89% 0% 3% 0% 9%
2004 Total Cohort - 5 Year Outcome All Students 45 98% 0% 0% 0% 2% ELL 0 0% 0% 0% 0% 0% Not ELL 45 98% 0% 0% 0% 2%
2003 Total Cohort - 6 Year Outcome All Students 42 95% 0% 0% 0% 5% ELL 0 0% 0% 0% 0% 0% Not ELL 42 95% 0% 0% 0% 5%
Wayland-Cohocton Central School District
2005 Total Cohort - Aug 2009 Year Outcome All Students 168 79% 2% 9% 1% 8% ELL 0 0% 0% 0% 0% 0% Not ELL 168 79% 2% 9% 1% 8%
2005 Total Cohort - 4 Year Outcome All Students 168 78% 2% 10% 1% 8% ELL 0 0% 0% 0% 0% 0% Not ELL 168 78% 2% 10% 1% 8%
Data presented in this report are based on data submitted by school districts to the data repository for the 2008-09 school year. Students are reported based on their date of entry in grade 9 and their last enrollment status as reported in the warehouse on July 31, 2009. The federal Family Education Rights and Privacy Act prohibits the release of personally identifiable student information. This Act precludes the publication of summary information based on fewer than five students or in which subtraction or other simple mathematical operations could be used to obtain personal information. Cells that contain the ("#") symbol have been suppressed to protect student privacy.
District-ell status Thursday, March 4, 2010 Page 229 of 301

Public School District Total Cohort Graduation Rate and Enrollment Outcome Summary - 2008-09 School Year by English Language Learner Status
2005 Total Cohort as of June of the 4th year of school and as of August 2009, 2004 Total Cohort as of June of the 5th year of school, 2003 Total Cohort as of June of the 6th year of school.
Graduated Transferred to Count with Regents GED
County of Cohort or Local Earned IEP Still Preparation DroppedDistrict Members Diplomas Diploma Enrolled Program Out
COUNTY: STEUBEN Wayland-Cohocton Central School District
2004 Total Cohort - 5 Year Outcome All Students 152 84% 3% 3% 1% 9% ELL 0 0% 0% 0% 0% 0% Not ELL 152 84% 3% 3% 1% 9%
2003 Total Cohort - 6 Year Outcome All Students 142 85% 5% 2% 0% 8% ELL 0 0% 0% 0% 0% 0% Not ELL 142 85% 5% 2% 0% 8%
Data presented in this report are based on data submitted by school districts to the data repository for the 2008-09 school year. Students are reported based on their date of entry in grade 9 and their last enrollment status as reported in the warehouse on July 31, 2009. The federal Family Education Rights and Privacy Act prohibits the release of personally identifiable student information. This Act precludes the publication of summary information based on fewer than five students or in which subtraction or other simple mathematical operations could be used to obtain personal information. Cells that contain the ("#") symbol have been suppressed to protect student privacy.
District-ell status Thursday, March 4, 2010 Page 230 of 301
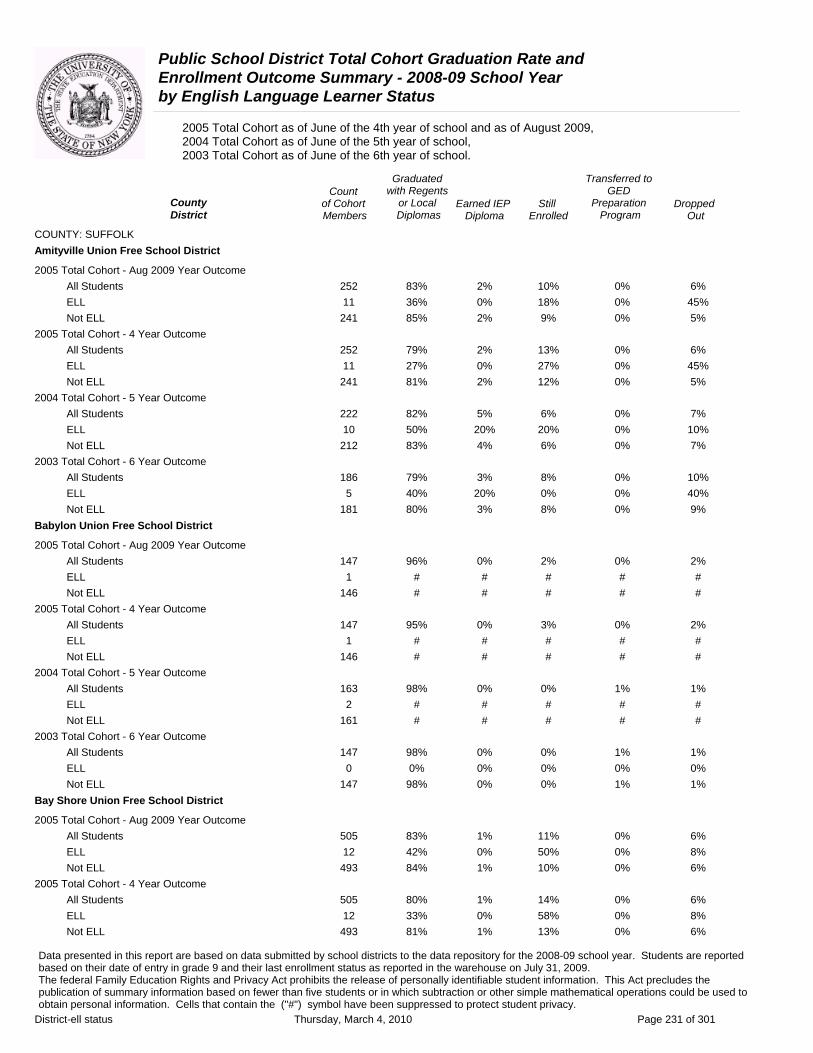
Public School District Total Cohort Graduation Rate and Enrollment Outcome Summary - 2008-09 School Year by English Language Learner Status
2005 Total Cohort as of June of the 4th year of school and as of August 2009, 2004 Total Cohort as of June of the 5th year of school, 2003 Total Cohort as of June of the 6th year of school.
Graduated Transferred to Count with Regents GED
County of Cohort or Local Earned IEP Still Preparation DroppedDistrict Members Diplomas Diploma Enrolled Program Out
COUNTY: SUFFOLK Amityville Union Free School District
2005 Total Cohort - Aug 2009 Year Outcome All Students 252 83% 2% 10% 0% 6% ELL 11 36% 0% 18% 0% 45% Not ELL 241 85% 2% 9% 0% 5%
2005 Total Cohort - 4 Year Outcome All Students 252 79% 2% 13% 0% 6% ELL 11 27% 0% 27% 0% 45% Not ELL 241 81% 2% 12% 0% 5%
2004 Total Cohort - 5 Year Outcome All Students 222 82% 5% 6% 0% 7% ELL 10 50% 20% 20% 0% 10% Not ELL 212 83% 4% 6% 0% 7%
2003 Total Cohort - 6 Year Outcome All Students 186 79% 3% 8% 0% 10% ELL 5 40% 20% 0% 0% 40% Not ELL 181 80% 3% 8% 0% 9%
Babylon Union Free School District
2005 Total Cohort - Aug 2009 Year Outcome All Students 147 96% 0% 2% 0% 2% ELL 1 # # # # # Not ELL 146 # # # # #
2005 Total Cohort - 4 Year Outcome All Students 147 95% 0% 3% 0% 2% ELL 1 # # # # # Not ELL 146 # # # # #
2004 Total Cohort - 5 Year Outcome All Students 163 98% 0% 0% 1% 1% ELL 2 # # # # # Not ELL 161 # # # # #
2003 Total Cohort - 6 Year Outcome All Students 147 98% 0% 0% 1% 1% ELL 0 0% 0% 0% 0% 0% Not ELL 147 98% 0% 0% 1% 1%
Bay Shore Union Free School District
2005 Total Cohort - Aug 2009 Year Outcome All Students 505 83% 1% 11% 0% 6% ELL 12 42% 0% 50% 0% 8% Not ELL 493 84% 1% 10% 0% 6%
2005 Total Cohort - 4 Year Outcome All Students 505 80% 1% 14% 0% 6% ELL 12 33% 0% 58% 0% 8% Not ELL 493 81% 1% 13% 0% 6%
Data presented in this report are based on data submitted by school districts to the data repository for the 2008-09 school year. Students are reported based on their date of entry in grade 9 and their last enrollment status as reported in the warehouse on July 31, 2009. The federal Family Education Rights and Privacy Act prohibits the release of personally identifiable student information. This Act precludes the publication of summary information based on fewer than five students or in which subtraction or other simple mathematical operations could be used to obtain personal information. Cells that contain the ("#") symbol have been suppressed to protect student privacy.
District-ell status Thursday, March 4, 2010 Page 231 of 301

Public School District Total Cohort Graduation Rate and Enrollment Outcome Summary - 2008-09 School Year by English Language Learner Status
2005 Total Cohort as of June of the 4th year of school and as of August 2009, 2004 Total Cohort as of June of the 5th year of school, 2003 Total Cohort as of June of the 6th year of school.
Graduated Transferred to Count with Regents GED
County of Cohort or Local Earned IEP Still Preparation DroppedDistrict Members Diplomas Diploma Enrolled Program Out
COUNTY: SUFFOLK Bay Shore Union Free School District
2004 Total Cohort - 5 Year Outcome All Students 464 85% 2% 6% 0% 7% ELL 12 33% 0% 42% 0% 25% Not ELL 452 86% 2% 5% 0% 7%
2003 Total Cohort - 6 Year Outcome All Students 426 87% 1% 1% 0% 10% ELL 14 64% 0% 0% 0% 36% Not ELL 412 88% 1% 1% 0% 9%
Bayport-Blue Point Union Free School District
2005 Total Cohort - Aug 2009 Year Outcome All Students 181 94% 1% 3% 0% 1% ELL 0 0% 0% 0% 0% 0% Not ELL 181 94% 1% 3% 0% 1%
2005 Total Cohort - 4 Year Outcome All Students 181 94% 1% 3% 0% 1% ELL 0 0% 0% 0% 0% 0% Not ELL 181 94% 1% 3% 0% 1%
2004 Total Cohort - 5 Year Outcome All Students 180 96% 1% 2% 0% 2% ELL 1 # # # # # Not ELL 179 # # # # #
2003 Total Cohort - 6 Year Outcome All Students 202 94% 1% 0% 0% 4% ELL 4 # # # # # Not ELL 198 # # # # #
Brentwood Union Free School District
2005 Total Cohort - Aug 2009 Year Outcome All Students 1305 67% 1% 26% 0% 7% ELL 144 42% 0% 50% 0% 8% Not ELL 1161 70% 1% 23% 0% 6%
2005 Total Cohort - 4 Year Outcome All Students 1305 64% 1% 29% 0% 7% ELL 144 38% 0% 54% 0% 8% Not ELL 1161 67% 1% 25% 0% 6%
2004 Total Cohort - 5 Year Outcome All Students 1276 74% 1% 12% 0% 13% ELL 112 55% 0% 18% 0% 27% Not ELL 1164 76% 1% 11% 0% 12%
2003 Total Cohort - 6 Year Outcome All Students 1172 79% 2% 6% 0% 14% ELL 66 45% 2% 15% 0% 38% Not ELL 1106 81% 2% 5% 0% 12%
Data presented in this report are based on data submitted by school districts to the data repository for the 2008-09 school year. Students are reported based on their date of entry in grade 9 and their last enrollment status as reported in the warehouse on July 31, 2009. The federal Family Education Rights and Privacy Act prohibits the release of personally identifiable student information. This Act precludes the publication of summary information based on fewer than five students or in which subtraction or other simple mathematical operations could be used to obtain personal information. Cells that contain the ("#") symbol have been suppressed to protect student privacy.
District-ell status Thursday, March 4, 2010 Page 232 of 301
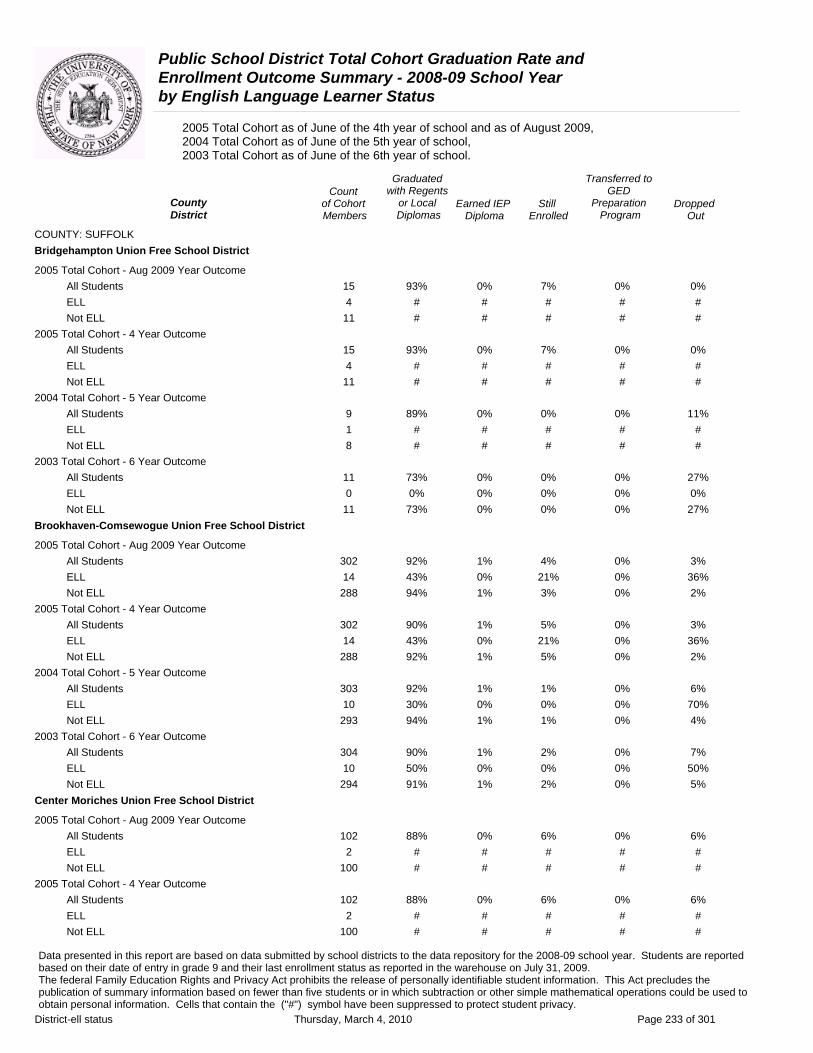
Public School District Total Cohort Graduation Rate and Enrollment Outcome Summary - 2008-09 School Year by English Language Learner Status
2005 Total Cohort as of June of the 4th year of school and as of August 2009, 2004 Total Cohort as of June of the 5th year of school, 2003 Total Cohort as of June of the 6th year of school.
Graduated Transferred to Count with Regents GED
County of Cohort or Local Earned IEP Still Preparation DroppedDistrict Members Diplomas Diploma Enrolled Program Out
COUNTY: SUFFOLK Bridgehampton Union Free School District
2005 Total Cohort - Aug 2009 Year Outcome All Students 15 93% 0% 7% 0% 0% ELL 4 # # # # # Not ELL 11 # # # # #
2005 Total Cohort - 4 Year Outcome All Students 15 93% 0% 7% 0% 0% ELL 4 # # # # # Not ELL 11 # # # # #
2004 Total Cohort - 5 Year Outcome All Students 9 89% 0% 0% 0% 11% ELL 1 # # # # # Not ELL 8 # # # # #
2003 Total Cohort - 6 Year Outcome All Students 11 73% 0% 0% 0% 27% ELL 0 0% 0% 0% 0% 0% Not ELL 11 73% 0% 0% 0% 27%
Brookhaven-Comsewogue Union Free School District
2005 Total Cohort - Aug 2009 Year Outcome All Students 302 92% 1% 4% 0% 3% ELL 14 43% 0% 21% 0% 36% Not ELL 288 94% 1% 3% 0% 2%
2005 Total Cohort - 4 Year Outcome All Students 302 90% 1% 5% 0% 3% ELL 14 43% 0% 21% 0% 36% Not ELL 288 92% 1% 5% 0% 2%
2004 Total Cohort - 5 Year Outcome All Students 303 92% 1% 1% 0% 6% ELL 10 30% 0% 0% 0% 70% Not ELL 293 94% 1% 1% 0% 4%
2003 Total Cohort - 6 Year Outcome All Students 304 90% 1% 2% 0% 7% ELL 10 50% 0% 0% 0% 50% Not ELL 294 91% 1% 2% 0% 5%
Center Moriches Union Free School District
2005 Total Cohort - Aug 2009 Year Outcome All Students 102 88% 0% 6% 0% 6% ELL 2 # # # # # Not ELL 100 # # # # #
2005 Total Cohort - 4 Year Outcome All Students 102 88% 0% 6% 0% 6% ELL 2 # # # # # Not ELL 100 # # # # #
Data presented in this report are based on data submitted by school districts to the data repository for the 2008-09 school year. Students are reported based on their date of entry in grade 9 and their last enrollment status as reported in the warehouse on July 31, 2009. The federal Family Education Rights and Privacy Act prohibits the release of personally identifiable student information. This Act precludes the publication of summary information based on fewer than five students or in which subtraction or other simple mathematical operations could be used to obtain personal information. Cells that contain the ("#") symbol have been suppressed to protect student privacy.
District-ell status Thursday, March 4, 2010 Page 233 of 301

Public School District Total Cohort Graduation Rate and Enrollment Outcome Summary - 2008-09 School Year by English Language Learner Status
2005 Total Cohort as of June of the 4th year of school and as of August 2009, 2004 Total Cohort as of June of the 5th year of school, 2003 Total Cohort as of June of the 6th year of school.
Graduated Transferred to Count with Regents GED
County of Cohort or Local Earned IEP Still Preparation DroppedDistrict Members Diplomas Diploma Enrolled Program Out
COUNTY: SUFFOLK Center Moriches Union Free School District
2004 Total Cohort - 5 Year Outcome All Students 103 83% 3% 8% 0% 6% ELL 1 # # # # # Not ELL 102 # # # # #
2003 Total Cohort - 6 Year Outcome All Students 137 87% 1% 4% 0% 7% ELL 2 # # # # # Not ELL 135 # # # # #
Central Islip Union Free School District
2005 Total Cohort - Aug 2009 Year Outcome All Students 443 57% 1% 32% 0% 10% ELL 44 20% 2% 48% 0% 30% Not ELL 399 61% 1% 31% 0% 8%
2005 Total Cohort - 4 Year Outcome All Students 443 52% 1% 37% 0% 10% ELL 44 20% 2% 48% 0% 30% Not ELL 399 56% 1% 35% 0% 8%
2004 Total Cohort - 5 Year Outcome All Students 456 63% 5% 15% 0% 16% ELL 45 38% 2% 11% 0% 49% Not ELL 411 66% 6% 16% 0% 12%
2003 Total Cohort - 6 Year Outcome All Students 406 74% 3% 9% 0% 13% ELL 31 45% 0% 10% 0% 42% Not ELL 375 77% 3% 9% 0% 11%
Cold Spring Harbor Central School District
2005 Total Cohort - Aug 2009 Year Outcome All Students 177 99% 0% 1% 0% 0% ELL 0 0% 0% 0% 0% 0% Not ELL 177 99% 0% 1% 0% 0%
2005 Total Cohort - 4 Year Outcome All Students 177 99% 0% 1% 0% 0% ELL 0 0% 0% 0% 0% 0% Not ELL 177 99% 0% 1% 0% 0%
2004 Total Cohort - 5 Year Outcome All Students 167 99% 1% 0% 0% 0% ELL 0 0% 0% 0% 0% 0% Not ELL 167 99% 1% 0% 0% 0%
2003 Total Cohort - 6 Year Outcome All Students 173 98% 0% 2% 0% 0% ELL 0 0% 0% 0% 0% 0% Not ELL 173 98% 0% 2% 0% 0%
Data presented in this report are based on data submitted by school districts to the data repository for the 2008-09 school year. Students are reported based on their date of entry in grade 9 and their last enrollment status as reported in the warehouse on July 31, 2009. The federal Family Education Rights and Privacy Act prohibits the release of personally identifiable student information. This Act precludes the publication of summary information based on fewer than five students or in which subtraction or other simple mathematical operations could be used to obtain personal information. Cells that contain the ("#") symbol have been suppressed to protect student privacy.
District-ell status Thursday, March 4, 2010 Page 234 of 301
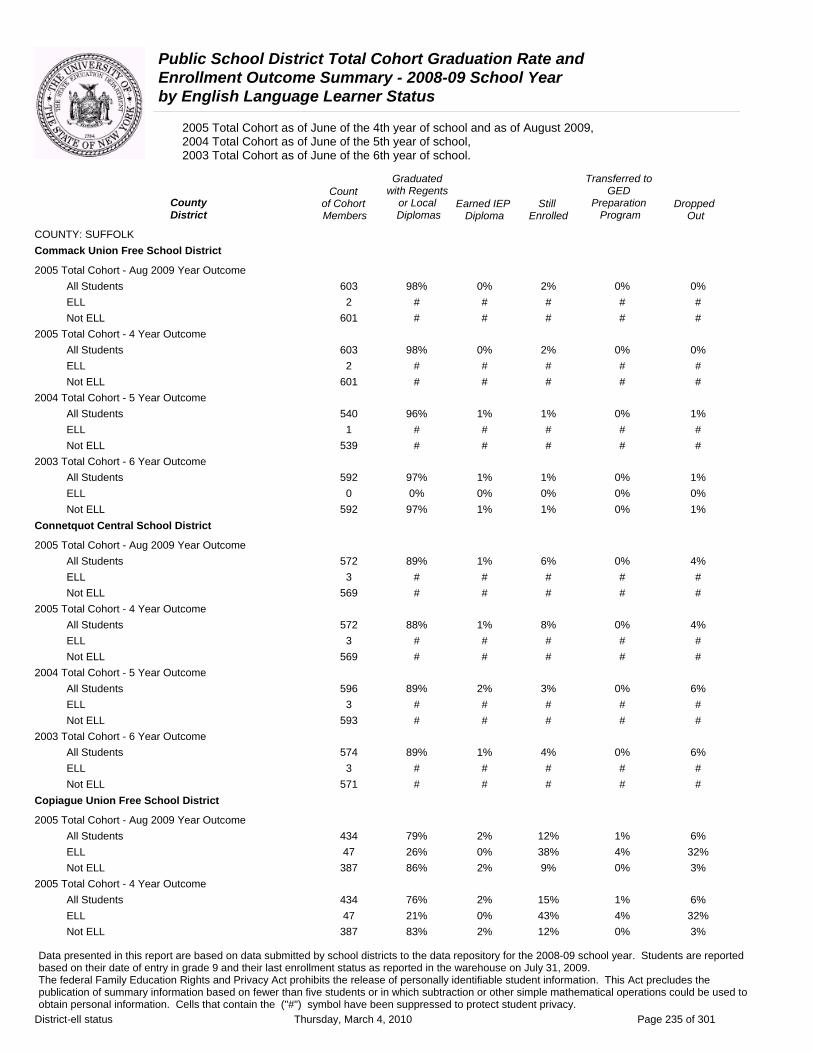
Public School District Total Cohort Graduation Rate and Enrollment Outcome Summary - 2008-09 School Year by English Language Learner Status
2005 Total Cohort as of June of the 4th year of school and as of August 2009, 2004 Total Cohort as of June of the 5th year of school, 2003 Total Cohort as of June of the 6th year of school.
Graduated Transferred to Count with Regents GED
County of Cohort or Local Earned IEP Still Preparation DroppedDistrict Members Diplomas Diploma Enrolled Program Out
COUNTY: SUFFOLK Commack Union Free School District
2005 Total Cohort - Aug 2009 Year Outcome All Students 603 98% 0% 2% 0% 0% ELL 2 # # # # # Not ELL 601 # # # # #
2005 Total Cohort - 4 Year Outcome All Students 603 98% 0% 2% 0% 0% ELL 2 # # # # # Not ELL 601 # # # # #
2004 Total Cohort - 5 Year Outcome All Students 540 96% 1% 1% 0% 1% ELL 1 # # # # # Not ELL 539 # # # # #
2003 Total Cohort - 6 Year Outcome All Students 592 97% 1% 1% 0% 1% ELL 0 0% 0% 0% 0% 0% Not ELL 592 97% 1% 1% 0% 1%
Connetquot Central School District
2005 Total Cohort - Aug 2009 Year Outcome All Students 572 89% 1% 6% 0% 4% ELL 3 # # # # # Not ELL 569 # # # # #
2005 Total Cohort - 4 Year Outcome All Students 572 88% 1% 8% 0% 4% ELL 3 # # # # # Not ELL 569 # # # # #
2004 Total Cohort - 5 Year Outcome All Students 596 89% 2% 3% 0% 6% ELL 3 # # # # # Not ELL 593 # # # # #
2003 Total Cohort - 6 Year Outcome All Students 574 89% 1% 4% 0% 6% ELL 3 # # # # # Not ELL 571 # # # # #
Copiague Union Free School District
2005 Total Cohort - Aug 2009 Year Outcome All Students 434 79% 2% 12% 1% 6% ELL 47 26% 0% 38% 4% 32% Not ELL 387 86% 2% 9% 0% 3%
2005 Total Cohort - 4 Year Outcome All Students 434 76% 2% 15% 1% 6% ELL 47 21% 0% 43% 4% 32% Not ELL 387 83% 2% 12% 0% 3%
Data presented in this report are based on data submitted by school districts to the data repository for the 2008-09 school year. Students are reported based on their date of entry in grade 9 and their last enrollment status as reported in the warehouse on July 31, 2009. The federal Family Education Rights and Privacy Act prohibits the release of personally identifiable student information. This Act precludes the publication of summary information based on fewer than five students or in which subtraction or other simple mathematical operations could be used to obtain personal information. Cells that contain the ("#") symbol have been suppressed to protect student privacy.
District-ell status Thursday, March 4, 2010 Page 235 of 301

Public School District Total Cohort Graduation Rate and Enrollment Outcome Summary - 2008-09 School Year by English Language Learner Status
2005 Total Cohort as of June of the 4th year of school and as of August 2009, 2004 Total Cohort as of June of the 5th year of school, 2003 Total Cohort as of June of the 6th year of school.
Graduated Transferred to Count with Regents GED
County of Cohort or Local Earned IEP Still Preparation DroppedDistrict Members Diplomas Diploma Enrolled Program Out
COUNTY: SUFFOLK Copiague Union Free School District
2004 Total Cohort - 5 Year Outcome All Students 441 78% 3% 10% 0% 8% ELL 37 41% 3% 41% 0% 16% Not ELL 404 82% 3% 8% 0% 7%
2003 Total Cohort - 6 Year Outcome All Students 389 79% 2% 11% 1% 8% ELL 32 34% 3% 28% 0% 34% Not ELL 357 83% 2% 9% 1% 6%
Deer Park Union Free School District
2005 Total Cohort - Aug 2009 Year Outcome All Students 362 92% 0% 4% 0% 4% ELL 3 # # # # # Not ELL 359 # # # # #
2005 Total Cohort - 4 Year Outcome All Students 362 91% 0% 5% 0% 4% ELL 3 # # # # # Not ELL 359 # # # # #
2004 Total Cohort - 5 Year Outcome All Students 337 88% 3% 3% 1% 6% ELL 1 # # # # # Not ELL 336 # # # # #
2003 Total Cohort - 6 Year Outcome All Students 348 89% 1% 4% 1% 5% ELL 3 # # # # # Not ELL 345 # # # # #
East Hampton Union Free School District
2005 Total Cohort - Aug 2009 Year Outcome All Students 249 87% 0% 6% 2% 4% ELL 27 59% 0% 33% 0% 7% Not ELL 222 91% 0% 3% 2% 4%
2005 Total Cohort - 4 Year Outcome All Students 249 84% 0% 10% 2% 4% ELL 27 56% 0% 37% 0% 7% Not ELL 222 87% 0% 6% 2% 4%
2004 Total Cohort - 5 Year Outcome All Students 268 82% 1% 3% 3% 11% ELL 20 60% 0% 0% 5% 35% Not ELL 248 83% 1% 3% 3% 9%
2003 Total Cohort - 6 Year Outcome All Students 256 87% 0% 1% 4% 8% ELL 20 70% 0% 5% 5% 20% Not ELL 236 88% 0% 1% 3% 7%
Data presented in this report are based on data submitted by school districts to the data repository for the 2008-09 school year. Students are reported based on their date of entry in grade 9 and their last enrollment status as reported in the warehouse on July 31, 2009. The federal Family Education Rights and Privacy Act prohibits the release of personally identifiable student information. This Act precludes the publication of summary information based on fewer than five students or in which subtraction or other simple mathematical operations could be used to obtain personal information. Cells that contain the ("#") symbol have been suppressed to protect student privacy.
District-ell status Thursday, March 4, 2010 Page 236 of 301
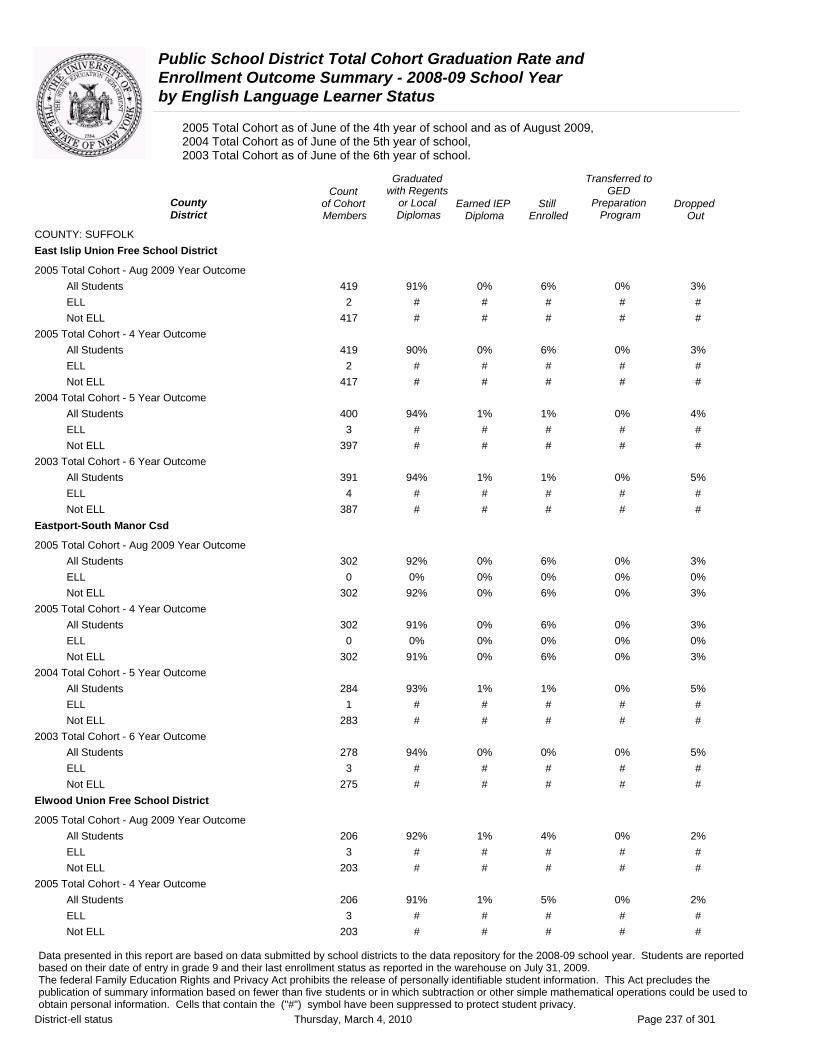
Public School District Total Cohort Graduation Rate and Enrollment Outcome Summary - 2008-09 School Year by English Language Learner Status
2005 Total Cohort as of June of the 4th year of school and as of August 2009, 2004 Total Cohort as of June of the 5th year of school, 2003 Total Cohort as of June of the 6th year of school.
Graduated Transferred to Count with Regents GED
County District
of Cohort Members
or Local Diplomas
Earned IEP Diploma
Still Enrolled
Preparation Program
Dropped Out
COUNTY: SUFFOLK East Islip Union Free School District
2005 Total Cohort - Aug 2009 Year Outcome All Students 419 91% 0% 6% 0% 3% ELL 2 # # # # # Not ELL 417 # # # # #
2005 Total Cohort - 4 Year Outcome All Students 419 90% 0% 6% 0% 3% ELL 2 # # # # # Not ELL 417 # # # # #
2004 Total Cohort - 5 Year Outcome All Students 400 94% 1% 1% 0% 4% ELL 3 # # # # # Not ELL 397 # # # # #
2003 Total Cohort - 6 Year Outcome All Students 391 94% 1% 1% 0% 5% ELL 4 # # # # # Not ELL 387 # # # # #
Eastport-South Manor Csd
2005 Total Cohort - Aug 2009 Year Outcome All Students 302 92% 0% 6% 0% 3% ELL 0 0% 0% 0% 0% 0% Not ELL 302 92% 0% 6% 0% 3%
2005 Total Cohort - 4 Year Outcome All Students 302 91% 0% 6% 0% 3% ELL 0 0% 0% 0% 0% 0% Not ELL 302 91% 0% 6% 0% 3%
2004 Total Cohort - 5 Year Outcome All Students 284 93% 1% 1% 0% 5% ELL 1 # # # # # Not ELL 283 # # # # #
2003 Total Cohort - 6 Year Outcome All Students 278 94% 0% 0% 0% 5% ELL 3 # # # # # Not ELL 275 # # # # #
Elwood Union Free School District
2005 Total Cohort - Aug 2009 Year Outcome All Students 206 92% 1% 4% 0% 2% ELL 3 # # # # # Not ELL 203 # # # # #
2005 Total Cohort - 4 Year Outcome All Students 206 91% 1% 5% 0% 2% ELL 3 # # # # # Not ELL 203 # # # # #
Data presented in this report are based on data submitted by school districts to the data repository for the 2008-09 school year. Students are reported based on their date of entry in grade 9 and their last enrollment status as reported in the warehouse on July 31, 2009. The federal Family Education Rights and Privacy Act prohibits the release of personally identifiable student information. This Act precludes the publication of summary information based on fewer than five students or in which subtraction or other simple mathematical operations could be used to obtain personal information. Cells that contain the ("#") symbol have been suppressed to protect student privacy.
District-ell status Thursday, March 4, 2010 Page 237 of 301
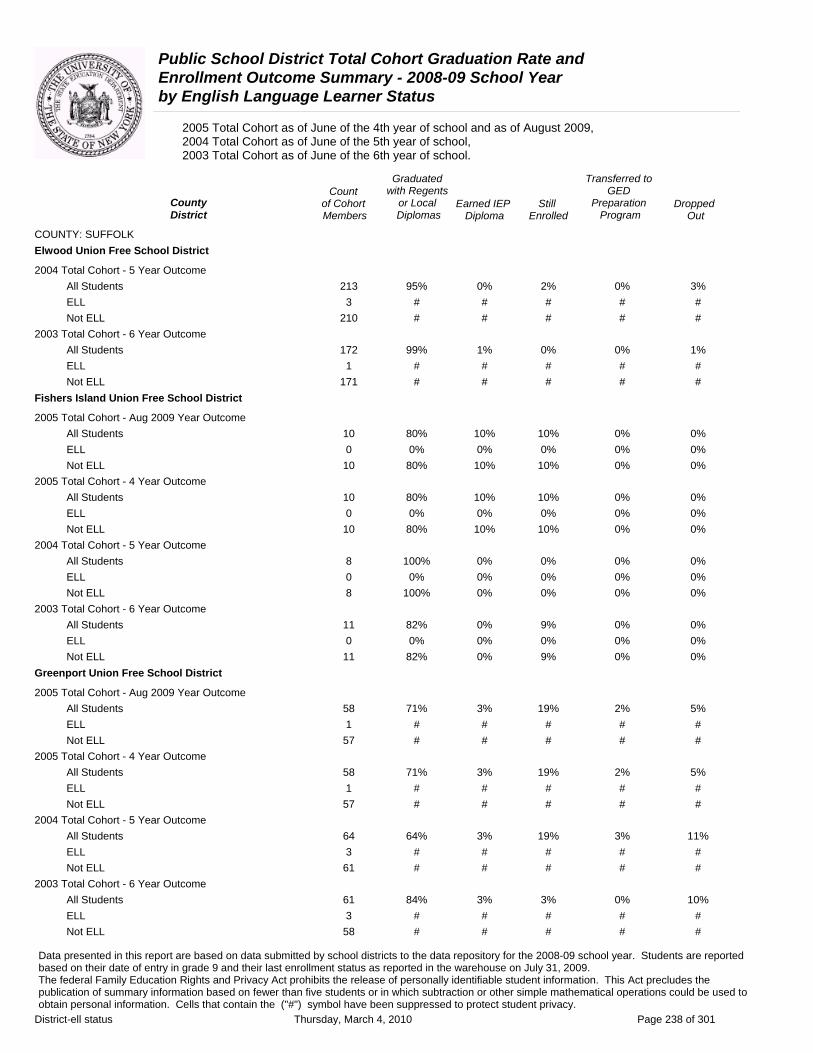
Public School District Total Cohort Graduation Rate and Enrollment Outcome Summary - 2008-09 School Year by English Language Learner Status
2005 Total Cohort as of June of the 4th year of school and as of August 2009, 2004 Total Cohort as of June of the 5th year of school, 2003 Total Cohort as of June of the 6th year of school.
Graduated Transferred to Count with Regents GED
County of Cohort or Local Earned IEP Still Preparation DroppedDistrict Members Diplomas Diploma Enrolled Program Out
COUNTY: SUFFOLK Elwood Union Free School District
2004 Total Cohort - 5 Year Outcome All Students 213 95% 0% 2% 0% 3% ELL 3 # # # # # Not ELL 210 # # # # #
2003 Total Cohort - 6 Year Outcome All Students 172 99% 1% 0% 0% 1% ELL 1 # # # # # Not ELL 171 # # # # #
Fishers Island Union Free School District
2005 Total Cohort - Aug 2009 Year Outcome All Students 10 80% 10% 10% 0% 0% ELL 0 0% 0% 0% 0% 0% Not ELL 10 80% 10% 10% 0% 0%
2005 Total Cohort - 4 Year Outcome All Students 10 80% 10% 10% 0% 0% ELL 0 0% 0% 0% 0% 0% Not ELL 10 80% 10% 10% 0% 0%
2004 Total Cohort - 5 Year Outcome All Students 8 100% 0% 0% 0% 0% ELL 0 0% 0% 0% 0% 0% Not ELL 8 100% 0% 0% 0% 0%
2003 Total Cohort - 6 Year Outcome All Students 11 82% 0% 9% 0% 0% ELL 0 0% 0% 0% 0% 0% Not ELL 11 82% 0% 9% 0% 0%
Greenport Union Free School District
2005 Total Cohort - Aug 2009 Year Outcome All Students 58 71% 3% 19% 2% 5% ELL 1 # # # # # Not ELL 57 # # # # #
2005 Total Cohort - 4 Year Outcome All Students 58 71% 3% 19% 2% 5% ELL 1 # # # # # Not ELL 57 # # # # #
2004 Total Cohort - 5 Year Outcome All Students 64 64% 3% 19% 3% 11% ELL 3 # # # # # Not ELL 61 # # # # #
2003 Total Cohort - 6 Year Outcome All Students 61 84% 3% 3% 0% 10% ELL 3 # # # # # Not ELL 58 # # # # #
Data presented in this report are based on data submitted by school districts to the data repository for the 2008-09 school year. Students are reported based on their date of entry in grade 9 and their last enrollment status as reported in the warehouse on July 31, 2009. The federal Family Education Rights and Privacy Act prohibits the release of personally identifiable student information. This Act precludes the publication of summary information based on fewer than five students or in which subtraction or other simple mathematical operations could be used to obtain personal information. Cells that contain the ("#") symbol have been suppressed to protect student privacy.
District-ell status Thursday, March 4, 2010 Page 238 of 301

Public School District Total Cohort Graduation Rate and Enrollment Outcome Summary - 2008-09 School Year by English Language Learner Status
2005 Total Cohort as of June of the 4th year of school and as of August 2009, 2004 Total Cohort as of June of the 5th year of school, 2003 Total Cohort as of June of the 6th year of school.
Graduated Transferred to Count with Regents GED
County of Cohort or Local Earned IEP Still Preparation DroppedDistrict Members Diplomas Diploma Enrolled Program Out
COUNTY: SUFFOLK Half Hollow Hills Central School District
2005 Total Cohort - Aug 2009 Year Outcome All Students 750 93% 2% 5% 0% 1% ELL 7 57% 14% 29% 0% 0% Not ELL 743 93% 2% 5% 0% 1%
2005 Total Cohort - 4 Year Outcome All Students 750 92% 2% 6% 0% 1% ELL 7 57% 14% 29% 0% 0% Not ELL 743 92% 2% 6% 0% 1%
2004 Total Cohort - 5 Year Outcome All Students 835 94% 2% 3% 0% 1% ELL 9 100% 0% 0% 0% 0% Not ELL 826 94% 2% 3% 0% 1%
2003 Total Cohort - 6 Year Outcome All Students 693 94% 1% 3% 0% 1% ELL 2 # # # # # Not ELL 691 # # # # #
Hampton Bays Union Free School District
2005 Total Cohort - Aug 2009 Year Outcome All Students 125 90% 0% 5% 0% 6% ELL 8 63% 0% 13% 0% 25% Not ELL 117 91% 0% 4% 0% 4%
2005 Total Cohort - 4 Year Outcome All Students 125 84% 0% 10% 0% 6% ELL 8 50% 0% 25% 0% 25% Not ELL 117 86% 0% 9% 0% 4%
2004 Total Cohort - 5 Year Outcome All Students 147 86% 3% 1% 0% 10% ELL 11 64% 0% 9% 0% 27% Not ELL 136 88% 3% 1% 0% 8%
2003 Total Cohort - 6 Year Outcome All Students 121 81% 3% 2% 0% 14% ELL 13 54% 8% 8% 0% 31% Not ELL 108 84% 3% 1% 0% 12%
Harborfields Central School District
2005 Total Cohort - Aug 2009 Year Outcome All Students 278 97% 0% 2% 0% 1% ELL 2 # # # # # Not ELL 276 # # # # #
2005 Total Cohort - 4 Year Outcome All Students 278 96% 0% 3% 0% 1% ELL 2 # # # # # Not ELL 276 # # # # #
Data presented in this report are based on data submitted by school districts to the data repository for the 2008-09 school year. Students are reported based on their date of entry in grade 9 and their last enrollment status as reported in the warehouse on July 31, 2009. The federal Family Education Rights and Privacy Act prohibits the release of personally identifiable student information. This Act precludes the publication of summary information based on fewer than five students or in which subtraction or other simple mathematical operations could be used to obtain personal information. Cells that contain the ("#") symbol have been suppressed to protect student privacy.
District-ell status Thursday, March 4, 2010 Page 239 of 301
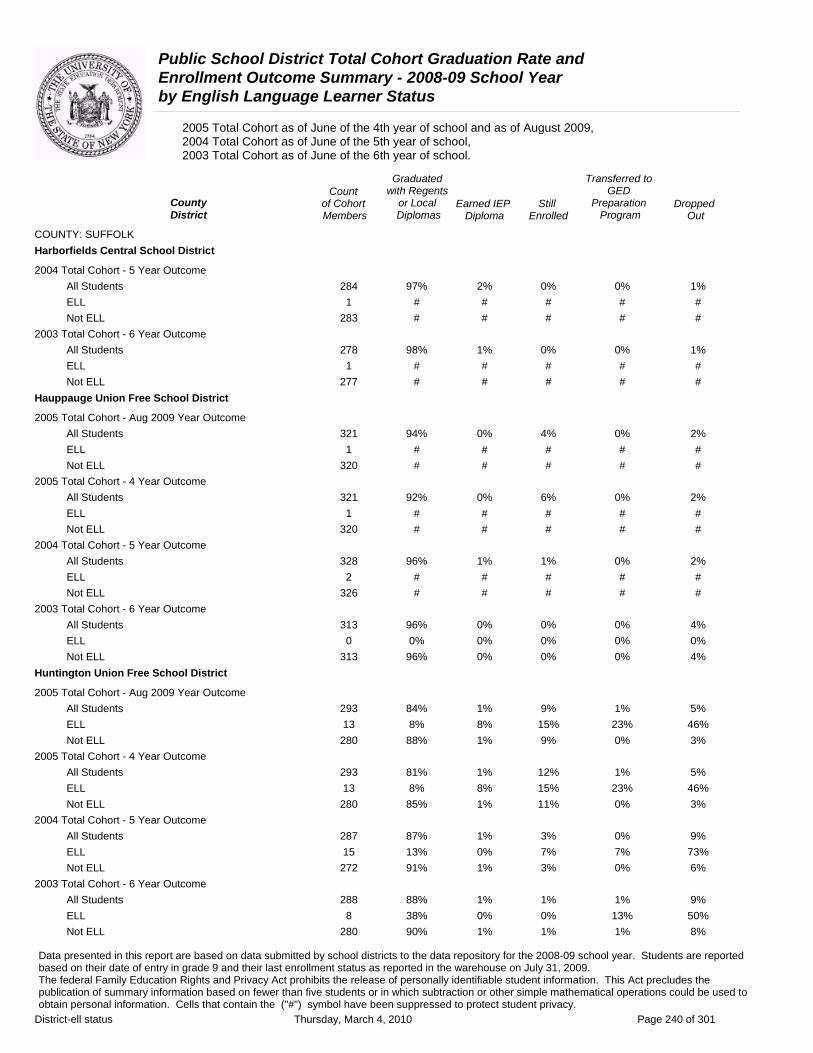
Public School District Total Cohort Graduation Rate and Enrollment Outcome Summary - 2008-09 School Year by English Language Learner Status
2005 Total Cohort as of June of the 4th year of school and as of August 2009, 2004 Total Cohort as of June of the 5th year of school, 2003 Total Cohort as of June of the 6th year of school.
Graduated Transferred to Count with Regents GED
County of Cohort or Local Earned IEP Still Preparation DroppedDistrict Members Diplomas Diploma Enrolled Program Out
COUNTY: SUFFOLK Harborfields Central School District
2004 Total Cohort - 5 Year Outcome All Students 284 97% 2% 0% 0% 1% ELL 1 # # # # # Not ELL 283 # # # # #
2003 Total Cohort - 6 Year Outcome All Students 278 98% 1% 0% 0% 1% ELL 1 # # # # # Not ELL 277 # # # # #
Hauppauge Union Free School District
2005 Total Cohort - Aug 2009 Year Outcome All Students 321 94% 0% 4% 0% 2% ELL 1 # # # # # Not ELL 320 # # # # #
2005 Total Cohort - 4 Year Outcome All Students 321 92% 0% 6% 0% 2% ELL 1 # # # # # Not ELL 320 # # # # #
2004 Total Cohort - 5 Year Outcome All Students 328 96% 1% 1% 0% 2% ELL 2 # # # # # Not ELL 326 # # # # #
2003 Total Cohort - 6 Year Outcome All Students 313 96% 0% 0% 0% 4% ELL 0 0% 0% 0% 0% 0% Not ELL 313 96% 0% 0% 0% 4%
Huntington Union Free School District
2005 Total Cohort - Aug 2009 Year Outcome All Students 293 84% 1% 9% 1% 5% ELL 13 8% 8% 15% 23% 46% Not ELL 280 88% 1% 9% 0% 3%
2005 Total Cohort - 4 Year Outcome All Students 293 81% 1% 12% 1% 5% ELL 13 8% 8% 15% 23% 46% Not ELL 280 85% 1% 11% 0% 3%
2004 Total Cohort - 5 Year Outcome All Students 287 87% 1% 3% 0% 9% ELL 15 13% 0% 7% 7% 73% Not ELL 272 91% 1% 3% 0% 6%
2003 Total Cohort - 6 Year Outcome All Students 288 88% 1% 1% 1% 9% ELL 8 38% 0% 0% 13% 50% Not ELL 280 90% 1% 1% 1% 8%
Data presented in this report are based on data submitted by school districts to the data repository for the 2008-09 school year. Students are reported based on their date of entry in grade 9 and their last enrollment status as reported in the warehouse on July 31, 2009. The federal Family Education Rights and Privacy Act prohibits the release of personally identifiable student information. This Act precludes the publication of summary information based on fewer than five students or in which subtraction or other simple mathematical operations could be used to obtain personal information. Cells that contain the ("#") symbol have been suppressed to protect student privacy.
District-ell status Thursday, March 4, 2010 Page 240 of 301

Public School District Total Cohort Graduation Rate and Enrollment Outcome Summary - 2008-09 School Year by English Language Learner Status
2005 Total Cohort as of June of the 4th year of school and as of August 2009, 2004 Total Cohort as of June of the 5th year of school, 2003 Total Cohort as of June of the 6th year of school.
Graduated Transferred to Count with Regents GED
County of Cohort or Local Earned IEP Still Preparation DroppedDistrict Members Diplomas Diploma Enrolled Program Out
COUNTY: SUFFOLK Islip Union Free School District
2005 Total Cohort - Aug 2009 Year Outcome All Students 283 94% 1% 2% 0% 2% ELL 2 # # # # # Not ELL 281 # # # # #
2005 Total Cohort - 4 Year Outcome All Students 283 94% 1% 2% 0% 2% ELL 2 # # # # # Not ELL 281 # # # # #
2004 Total Cohort - 5 Year Outcome All Students 285 96% 0% 1% 0% 2% ELL 2 # # # # # Not ELL 283 # # # # #
2003 Total Cohort - 6 Year Outcome All Students 297 96% 1% 1% 0% 2% ELL 1 # # # # # Not ELL 296 # # # # #
Kings Park Central School District
2005 Total Cohort - Aug 2009 Year Outcome All Students 335 97% 0% 2% 0% 1% ELL 0 0% 0% 0% 0% 0% Not ELL 335 97% 0% 2% 0% 1%
2005 Total Cohort - 4 Year Outcome All Students 335 96% 0% 2% 0% 1% ELL 0 0% 0% 0% 0% 0% Not ELL 335 96% 0% 2% 0% 1%
2004 Total Cohort - 5 Year Outcome All Students 327 97% 1% 0% 0% 2% ELL 0 0% 0% 0% 0% 0% Not ELL 327 97% 1% 0% 0% 2%
2003 Total Cohort - 6 Year Outcome All Students 329 95% 2% 1% 0% 2% ELL 2 # # # # # Not ELL 327 # # # # #
Lindenhurst Union Free School District
2005 Total Cohort - Aug 2009 Year Outcome All Students 630 89% 0% 4% 0% 6% ELL 5 0% 0% 40% 0% 60% Not ELL 625 90% 0% 4% 0% 6%
2005 Total Cohort - 4 Year Outcome All Students 630 87% 0% 6% 0% 6% ELL 5 0% 0% 40% 0% 60% Not ELL 625 88% 0% 6% 0% 6%
Data presented in this report are based on data submitted by school districts to the data repository for the 2008-09 school year. Students are reported based on their date of entry in grade 9 and their last enrollment status as reported in the warehouse on July 31, 2009. The federal Family Education Rights and Privacy Act prohibits the release of personally identifiable student information. This Act precludes the publication of summary information based on fewer than five students or in which subtraction or other simple mathematical operations could be used to obtain personal information. Cells that contain the ("#") symbol have been suppressed to protect student privacy.
District-ell status Thursday, March 4, 2010 Page 241 of 301

Public School District Total Cohort Graduation Rate and Enrollment Outcome Summary - 2008-09 School Year by English Language Learner Status
2005 Total Cohort as of June of the 4th year of school and as of August 2009, 2004 Total Cohort as of June of the 5th year of school, 2003 Total Cohort as of June of the 6th year of school.
Graduated Transferred to Count with Regents GED
County of Cohort or Local Earned IEP Still Preparation DroppedDistrict Members Diplomas Diploma Enrolled Program Out
COUNTY: SUFFOLK Lindenhurst Union Free School District
2004 Total Cohort - 5 Year Outcome All Students 611 89% 2% 1% 0% 8% ELL 16 69% 6% 0% 0% 25% Not ELL 595 90% 2% 1% 0% 8%
2003 Total Cohort - 6 Year Outcome All Students 592 90% 1% 1% 1% 7% ELL 13 23% 0% 15% 0% 62% Not ELL 579 92% 1% 0% 1% 6%
Little Flower Union Free School District
2005 Total Cohort - Aug 2009 Year Outcome All Students 2 # # # # # ELL 0 # # # # # Not ELL 2 # # # # #
2005 Total Cohort - 4 Year Outcome All Students 2 # # # # # ELL 0 # # # # # Not ELL 2 # # # # #
2004 Total Cohort - 5 Year Outcome All Students 4 # # # # # ELL 0 # # # # # Not ELL 4 # # # # #
2003 Total Cohort - 6 Year Outcome All Students 1 # # # # # ELL 0 # # # # # Not ELL 1 # # # # #
Longwood Central School District
2005 Total Cohort - Aug 2009 Year Outcome All Students 803 77% 1% 16% 0% 7% ELL 14 14% 0% 57% 0% 29% Not ELL 789 78% 1% 15% 0% 6%
2005 Total Cohort - 4 Year Outcome All Students 803 76% 1% 17% 0% 7% ELL 14 14% 0% 57% 0% 29% Not ELL 789 77% 1% 16% 0% 6%
2004 Total Cohort - 5 Year Outcome All Students 788 82% 3% 5% 0% 10% ELL 10 40% 0% 40% 0% 20% Not ELL 778 83% 3% 4% 0% 10%
2003 Total Cohort - 6 Year Outcome All Students 752 82% 1% 2% 0% 15% ELL 7 29% 0% 14% 0% 57% Not ELL 745 83% 1% 1% 0% 15%
Data presented in this report are based on data submitted by school districts to the data repository for the 2008-09 school year. Students are reported based on their date of entry in grade 9 and their last enrollment status as reported in the warehouse on July 31, 2009. The federal Family Education Rights and Privacy Act prohibits the release of personally identifiable student information. This Act precludes the publication of summary information based on fewer than five students or in which subtraction or other simple mathematical operations could be used to obtain personal information. Cells that contain the ("#") symbol have been suppressed to protect student privacy.
District-ell status Thursday, March 4, 2010 Page 242 of 301
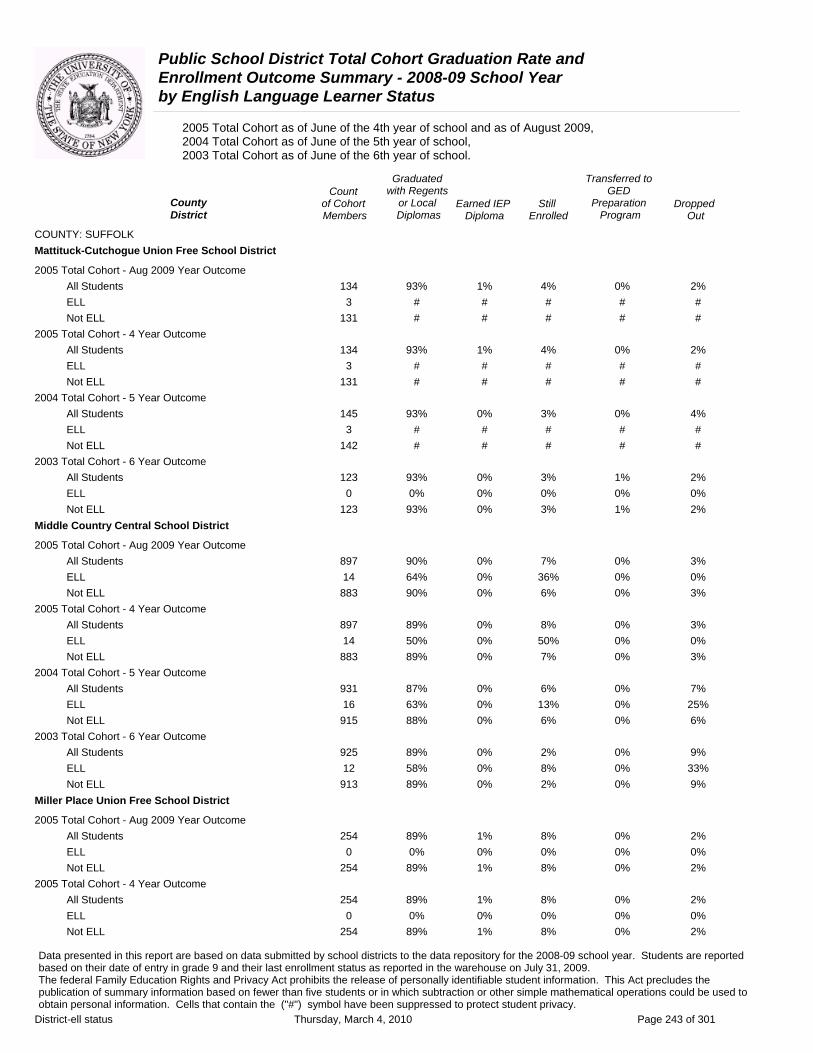
Public School District Total Cohort Graduation Rate and Enrollment Outcome Summary - 2008-09 School Year by English Language Learner Status
2005 Total Cohort as of June of the 4th year of school and as of August 2009, 2004 Total Cohort as of June of the 5th year of school, 2003 Total Cohort as of June of the 6th year of school.
Graduated Transferred to Count with Regents GED
County of Cohort or Local Earned IEP Still Preparation DroppedDistrict Members Diplomas Diploma Enrolled Program Out
COUNTY: SUFFOLK Mattituck-Cutchogue Union Free School District
2005 Total Cohort - Aug 2009 Year Outcome All Students 134 93% 1% 4% 0% 2% ELL 3 # # # # # Not ELL 131 # # # # #
2005 Total Cohort - 4 Year Outcome All Students 134 93% 1% 4% 0% 2% ELL 3 # # # # # Not ELL 131 # # # # #
2004 Total Cohort - 5 Year Outcome All Students 145 93% 0% 3% 0% 4% ELL 3 # # # # # Not ELL 142 # # # # #
2003 Total Cohort - 6 Year Outcome All Students 123 93% 0% 3% 1% 2% ELL 0 0% 0% 0% 0% 0% Not ELL 123 93% 0% 3% 1% 2%
Middle Country Central School District
2005 Total Cohort - Aug 2009 Year Outcome All Students 897 90% 0% 7% 0% 3% ELL 14 64% 0% 36% 0% 0% Not ELL 883 90% 0% 6% 0% 3%
2005 Total Cohort - 4 Year Outcome All Students 897 89% 0% 8% 0% 3% ELL 14 50% 0% 50% 0% 0% Not ELL 883 89% 0% 7% 0% 3%
2004 Total Cohort - 5 Year Outcome All Students 931 87% 0% 6% 0% 7% ELL 16 63% 0% 13% 0% 25% Not ELL 915 88% 0% 6% 0% 6%
2003 Total Cohort - 6 Year Outcome All Students 925 89% 0% 2% 0% 9% ELL 12 58% 0% 8% 0% 33% Not ELL 913 89% 0% 2% 0% 9%
Miller Place Union Free School District
2005 Total Cohort - Aug 2009 Year Outcome All Students 254 89% 1% 8% 0% 2% ELL 0 0% 0% 0% 0% 0% Not ELL 254 89% 1% 8% 0% 2%
2005 Total Cohort - 4 Year Outcome All Students 254 89% 1% 8% 0% 2% ELL 0 0% 0% 0% 0% 0% Not ELL 254 89% 1% 8% 0% 2%
Data presented in this report are based on data submitted by school districts to the data repository for the 2008-09 school year. Students are reported based on their date of entry in grade 9 and their last enrollment status as reported in the warehouse on July 31, 2009. The federal Family Education Rights and Privacy Act prohibits the release of personally identifiable student information. This Act precludes the publication of summary information based on fewer than five students or in which subtraction or other simple mathematical operations could be used to obtain personal information. Cells that contain the ("#") symbol have been suppressed to protect student privacy.
District-ell status Thursday, March 4, 2010 Page 243 of 301

Public School District Total Cohort Graduation Rate and Enrollment Outcome Summary - 2008-09 School Year by English Language Learner Status
2005 Total Cohort as of June of the 4th year of school and as of August 2009, 2004 Total Cohort as of June of the 5th year of school, 2003 Total Cohort as of June of the 6th year of school.
Graduated Transferred to Count with Regents GED
County of Cohort or Local Earned IEP Still Preparation DroppedDistrict Members Diplomas Diploma Enrolled Program Out
COUNTY: SUFFOLK Miller Place Union Free School District
2004 Total Cohort - 5 Year Outcome All Students 264 93% 1% 2% 0% 4% ELL 2 # # # # # Not ELL 262 # # # # #
2003 Total Cohort - 6 Year Outcome All Students 236 95% 1% 0% 0% 3% ELL 2 # # # # # Not ELL 234 # # # # #
Mount Sinai Union Free School District
2005 Total Cohort - Aug 2009 Year Outcome All Students 217 93% 0% 6% 0% 1% ELL 0 0% 0% 0% 0% 0% Not ELL 217 93% 0% 6% 0% 1%
2005 Total Cohort - 4 Year Outcome All Students 217 93% 0% 6% 0% 1% ELL 0 0% 0% 0% 0% 0% Not ELL 217 93% 0% 6% 0% 1%
2004 Total Cohort - 5 Year Outcome All Students 213 96% 1% 0% 0% 3% ELL 0 0% 0% 0% 0% 0% Not ELL 213 96% 1% 0% 0% 3%
2003 Total Cohort - 6 Year Outcome All Students 207 95% 1% 0% 0% 3% ELL 1 # # # # # Not ELL 206 # # # # #
North Babylon Union Free School District
2005 Total Cohort - Aug 2009 Year Outcome All Students 384 85% 1% 9% 1% 4% ELL 9 22% 11% 56% 0% 11% Not ELL 375 86% 1% 8% 1% 4%
2005 Total Cohort - 4 Year Outcome All Students 384 83% 1% 11% 1% 4% ELL 9 22% 11% 56% 0% 11% Not ELL 375 85% 1% 10% 1% 4%
2004 Total Cohort - 5 Year Outcome All Students 383 88% 3% 2% 2% 5% ELL 5 80% 0% 0% 0% 20% Not ELL 378 88% 3% 2% 2% 5%
2003 Total Cohort - 6 Year Outcome All Students 376 87% 4% 2% 2% 5% ELL 3 # # # # # Not ELL 373 # # # # #
Data presented in this report are based on data submitted by school districts to the data repository for the 2008-09 school year. Students are reported based on their date of entry in grade 9 and their last enrollment status as reported in the warehouse on July 31, 2009. The federal Family Education Rights and Privacy Act prohibits the release of personally identifiable student information. This Act precludes the publication of summary information based on fewer than five students or in which subtraction or other simple mathematical operations could be used to obtain personal information. Cells that contain the ("#") symbol have been suppressed to protect student privacy.
District-ell status Thursday, March 4, 2010 Page 244 of 301
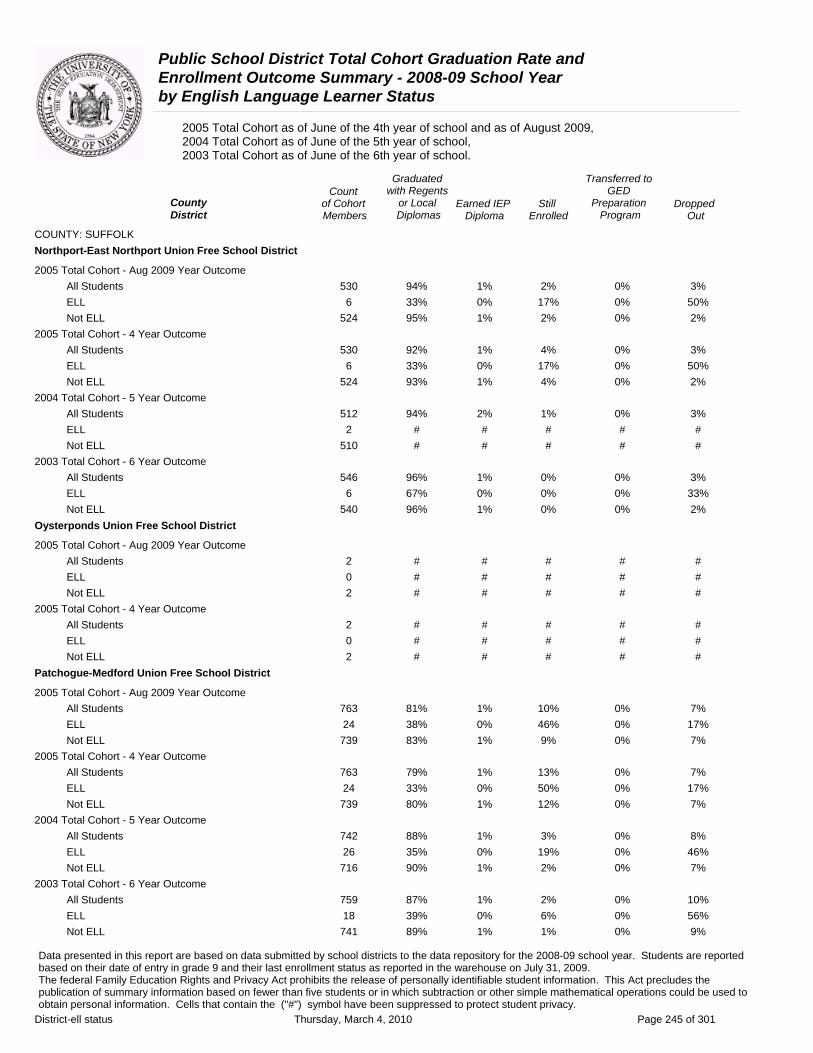
Public School District Total Cohort Graduation Rate and Enrollment Outcome Summary - 2008-09 School Year by English Language Learner Status
2005 Total Cohort as of June of the 4th year of school and as of August 2009, 2004 Total Cohort as of June of the 5th year of school, 2003 Total Cohort as of June of the 6th year of school.
Graduated Transferred to Count with Regents GED
County of Cohort or Local Earned IEP Still Preparation DroppedDistrict Members Diplomas Diploma Enrolled Program Out
COUNTY: SUFFOLK Northport-East Northport Union Free School District
2005 Total Cohort - Aug 2009 Year Outcome All Students 530 94% 1% 2% 0% 3% ELL 6 33% 0% 17% 0% 50% Not ELL 524 95% 1% 2% 0% 2%
2005 Total Cohort - 4 Year Outcome All Students 530 92% 1% 4% 0% 3% ELL 6 33% 0% 17% 0% 50% Not ELL 524 93% 1% 4% 0% 2%
2004 Total Cohort - 5 Year Outcome All Students 512 94% 2% 1% 0% 3% ELL 2 # # # # # Not ELL 510 # # # # #
2003 Total Cohort - 6 Year Outcome All Students 546 96% 1% 0% 0% 3% ELL 6 67% 0% 0% 0% 33% Not ELL 540 96% 1% 0% 0% 2%
Oysterponds Union Free School District
2005 Total Cohort - Aug 2009 Year Outcome All Students 2 # # # # # ELL 0 # # # # # Not ELL 2 # # # # #
2005 Total Cohort - 4 Year Outcome All Students 2 # # # # # ELL 0 # # # # # Not ELL 2 # # # # #
Patchogue-Medford Union Free School District
2005 Total Cohort - Aug 2009 Year Outcome All Students 763 81% 1% 10% 0% 7% ELL 24 38% 0% 46% 0% 17% Not ELL 739 83% 1% 9% 0% 7%
2005 Total Cohort - 4 Year Outcome All Students 763 79% 1% 13% 0% 7% ELL 24 33% 0% 50% 0% 17% Not ELL 739 80% 1% 12% 0% 7%
2004 Total Cohort - 5 Year Outcome All Students 742 88% 1% 3% 0% 8% ELL 26 35% 0% 19% 0% 46% Not ELL 716 90% 1% 2% 0% 7%
2003 Total Cohort - 6 Year Outcome All Students 759 87% 1% 2% 0% 10% ELL 18 39% 0% 6% 0% 56% Not ELL 741 89% 1% 1% 0% 9%
Data presented in this report are based on data submitted by school districts to the data repository for the 2008-09 school year. Students are reported based on their date of entry in grade 9 and their last enrollment status as reported in the warehouse on July 31, 2009. The federal Family Education Rights and Privacy Act prohibits the release of personally identifiable student information. This Act precludes the publication of summary information based on fewer than five students or in which subtraction or other simple mathematical operations could be used to obtain personal information. Cells that contain the ("#") symbol have been suppressed to protect student privacy.
District-ell status Thursday, March 4, 2010 Page 245 of 301
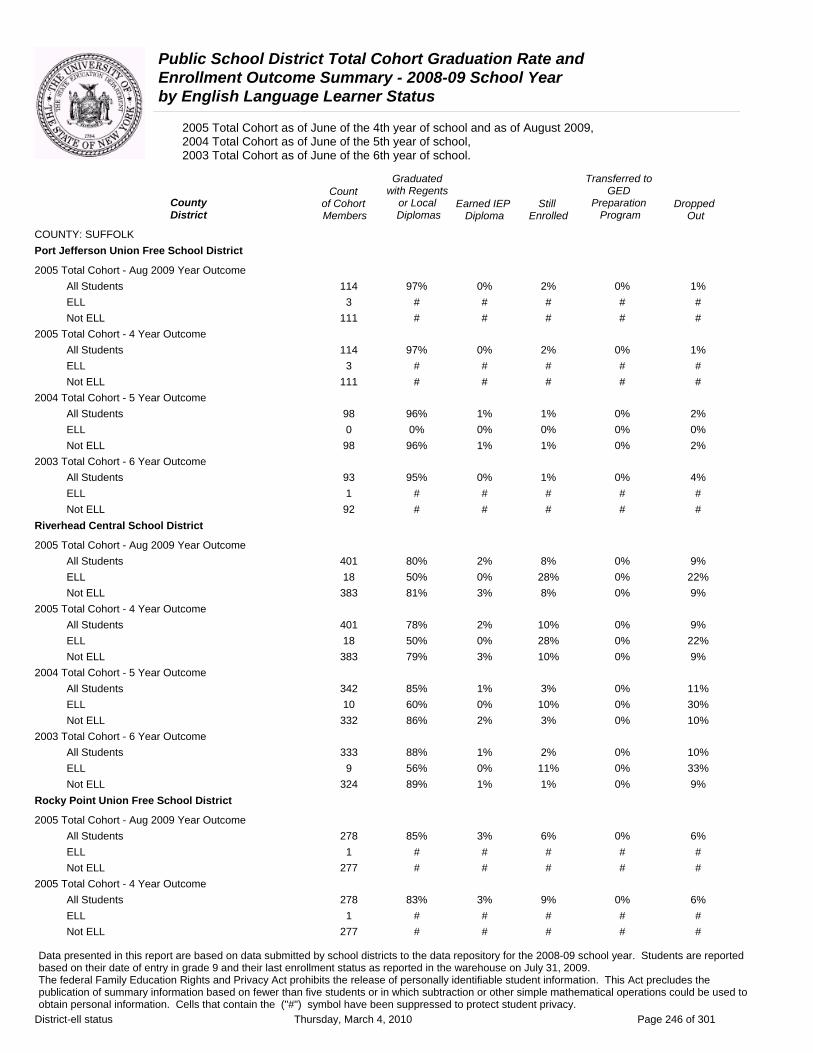
Public School District Total Cohort Graduation Rate and Enrollment Outcome Summary - 2008-09 School Year by English Language Learner Status
2005 Total Cohort as of June of the 4th year of school and as of August 2009, 2004 Total Cohort as of June of the 5th year of school, 2003 Total Cohort as of June of the 6th year of school.
Graduated Transferred to Count with Regents GED
County of Cohort or Local Earned IEP Still Preparation DroppedDistrict Members Diplomas Diploma Enrolled Program Out
COUNTY: SUFFOLK Port Jefferson Union Free School District
2005 Total Cohort - Aug 2009 Year Outcome All Students 114 97% 0% 2% 0% 1% ELL 3 # # # # # Not ELL 111 # # # # #
2005 Total Cohort - 4 Year Outcome All Students 114 97% 0% 2% 0% 1% ELL 3 # # # # # Not ELL 111 # # # # #
2004 Total Cohort - 5 Year Outcome All Students 98 96% 1% 1% 0% 2% ELL 0 0% 0% 0% 0% 0% Not ELL 98 96% 1% 1% 0% 2%
2003 Total Cohort - 6 Year Outcome All Students 93 95% 0% 1% 0% 4% ELL 1 # # # # # Not ELL 92 # # # # #
Riverhead Central School District
2005 Total Cohort - Aug 2009 Year Outcome All Students 401 80% 2% 8% 0% 9% ELL 18 50% 0% 28% 0% 22% Not ELL 383 81% 3% 8% 0% 9%
2005 Total Cohort - 4 Year Outcome All Students 401 78% 2% 10% 0% 9% ELL 18 50% 0% 28% 0% 22% Not ELL 383 79% 3% 10% 0% 9%
2004 Total Cohort - 5 Year Outcome All Students 342 85% 1% 3% 0% 11% ELL 10 60% 0% 10% 0% 30% Not ELL 332 86% 2% 3% 0% 10%
2003 Total Cohort - 6 Year Outcome All Students 333 88% 1% 2% 0% 10% ELL 9 56% 0% 11% 0% 33% Not ELL 324 89% 1% 1% 0% 9%
Rocky Point Union Free School District
2005 Total Cohort - Aug 2009 Year Outcome All Students 278 85% 3% 6% 0% 6% ELL 1 # # # # # Not ELL 277 # # # # #
2005 Total Cohort - 4 Year Outcome All Students 278 83% 3% 9% 0% 6% ELL 1 # # # # # Not ELL 277 # # # # #
Data presented in this report are based on data submitted by school districts to the data repository for the 2008-09 school year. Students are reported based on their date of entry in grade 9 and their last enrollment status as reported in the warehouse on July 31, 2009. The federal Family Education Rights and Privacy Act prohibits the release of personally identifiable student information. This Act precludes the publication of summary information based on fewer than five students or in which subtraction or other simple mathematical operations could be used to obtain personal information. Cells that contain the ("#") symbol have been suppressed to protect student privacy.
District-ell status Thursday, March 4, 2010 Page 246 of 301

Public School District Total Cohort Graduation Rate and Enrollment Outcome Summary - 2008-09 School Year by English Language Learner Status
2005 Total Cohort as of June of the 4th year of school and as of August 2009, 2004 Total Cohort as of June of the 5th year of school, 2003 Total Cohort as of June of the 6th year of school.
Graduated Transferred to Count with Regents GED
County of Cohort or Local Earned IEP Still Preparation DroppedDistrict Members Diplomas Diploma Enrolled Program Out
COUNTY: SUFFOLK Rocky Point Union Free School District
2004 Total Cohort - 5 Year Outcome All Students 283 88% 5% 1% 0% 6% ELL 2 # # # # # Not ELL 281 # # # # #
2003 Total Cohort - 6 Year Outcome All Students 263 88% 3% 0% 0% 8% ELL 0 0% 0% 0% 0% 0% Not ELL 263 88% 3% 0% 0% 8%
Sachem Central School District
2005 Total Cohort - Aug 2009 Year Outcome All Students 1272 90% 0% 5% 0% 4% ELL 9 22% 0% 44% 0% 33% Not ELL 1263 91% 0% 5% 0% 4%
2005 Total Cohort - 4 Year Outcome All Students 1272 90% 0% 5% 0% 5% ELL 9 22% 0% 44% 0% 33% Not ELL 1263 90% 0% 5% 0% 5%
2004 Total Cohort - 5 Year Outcome All Students 1294 92% 1% 1% 0% 6% ELL 11 73% 0% 0% 0% 27% Not ELL 1283 92% 1% 1% 0% 6%
2003 Total Cohort - 6 Year Outcome All Students 1298 92% 0% 1% 0% 6% ELL 9 100% 0% 0% 0% 0% Not ELL 1289 92% 0% 1% 0% 6%
Sag Harbor Union Free School District
2005 Total Cohort - Aug 2009 Year Outcome All Students 66 94% 0% 5% 0% 2% ELL 2 # # # # # Not ELL 64 # # # # #
2005 Total Cohort - 4 Year Outcome All Students 66 94% 0% 5% 0% 2% ELL 2 # # # # # Not ELL 64 # # # # #
2004 Total Cohort - 5 Year Outcome All Students 69 94% 0% 1% 0% 4% ELL 1 # # # # # Not ELL 68 # # # # #
2003 Total Cohort - 6 Year Outcome All Students 80 98% 0% 0% 0% 3% ELL 0 0% 0% 0% 0% 0% Not ELL 80 98% 0% 0% 0% 3%
Data presented in this report are based on data submitted by school districts to the data repository for the 2008-09 school year. Students are reported based on their date of entry in grade 9 and their last enrollment status as reported in the warehouse on July 31, 2009. The federal Family Education Rights and Privacy Act prohibits the release of personally identifiable student information. This Act precludes the publication of summary information based on fewer than five students or in which subtraction or other simple mathematical operations could be used to obtain personal information. Cells that contain the ("#") symbol have been suppressed to protect student privacy.
District-ell status Thursday, March 4, 2010 Page 247 of 301
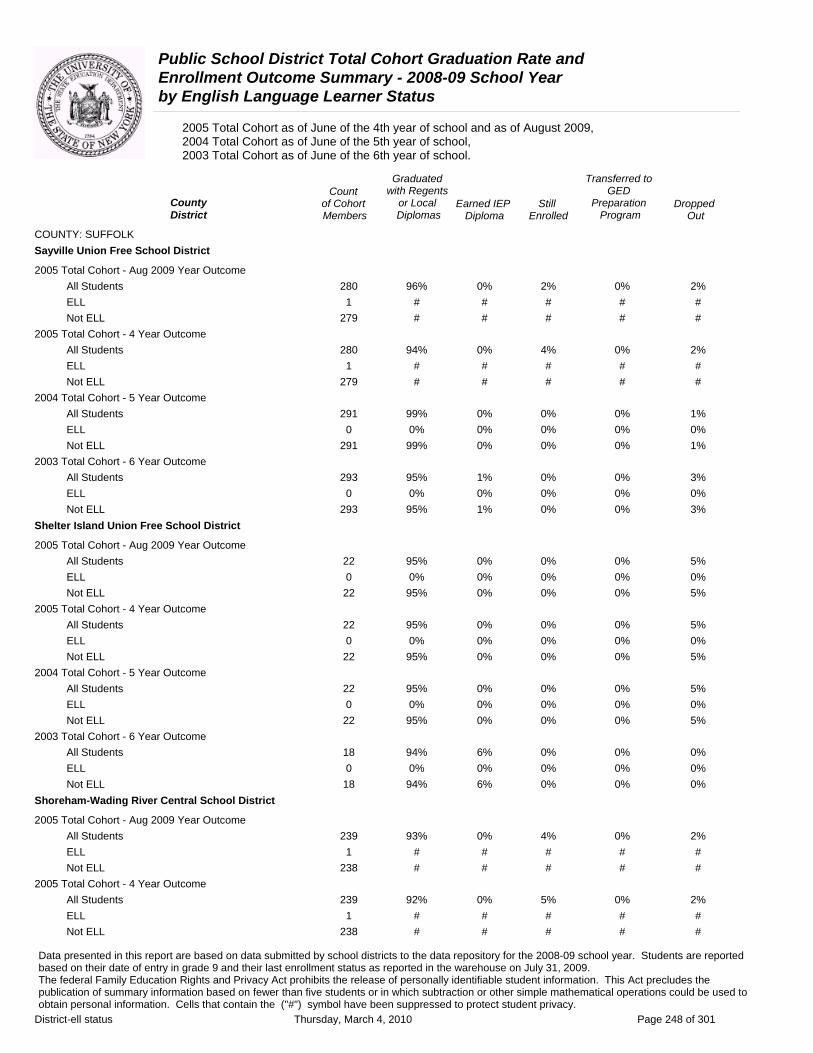
Public School District Total Cohort Graduation Rate and Enrollment Outcome Summary - 2008-09 School Year by English Language Learner Status
2005 Total Cohort as of June of the 4th year of school and as of August 2009, 2004 Total Cohort as of June of the 5th year of school, 2003 Total Cohort as of June of the 6th year of school.
Graduated Transferred to Count with Regents GED
County of Cohort or Local Earned IEP Still Preparation DroppedDistrict Members Diplomas Diploma Enrolled Program Out
COUNTY: SUFFOLK Sayville Union Free School District
2005 Total Cohort - Aug 2009 Year Outcome All Students 280 96% 0% 2% 0% 2% ELL 1 # # # # # Not ELL 279 # # # # #
2005 Total Cohort - 4 Year Outcome All Students 280 94% 0% 4% 0% 2% ELL 1 # # # # # Not ELL 279 # # # # #
2004 Total Cohort - 5 Year Outcome All Students 291 99% 0% 0% 0% 1% ELL 0 0% 0% 0% 0% 0% Not ELL 291 99% 0% 0% 0% 1%
2003 Total Cohort - 6 Year Outcome All Students 293 95% 1% 0% 0% 3% ELL 0 0% 0% 0% 0% 0% Not ELL 293 95% 1% 0% 0% 3%
Shelter Island Union Free School District
2005 Total Cohort - Aug 2009 Year Outcome All Students 22 95% 0% 0% 0% 5% ELL 0 0% 0% 0% 0% 0% Not ELL 22 95% 0% 0% 0% 5%
2005 Total Cohort - 4 Year Outcome All Students 22 95% 0% 0% 0% 5% ELL 0 0% 0% 0% 0% 0% Not ELL 22 95% 0% 0% 0% 5%
2004 Total Cohort - 5 Year Outcome All Students 22 95% 0% 0% 0% 5% ELL 0 0% 0% 0% 0% 0% Not ELL 22 95% 0% 0% 0% 5%
2003 Total Cohort - 6 Year Outcome All Students 18 94% 6% 0% 0% 0% ELL 0 0% 0% 0% 0% 0% Not ELL 18 94% 6% 0% 0% 0%
Shoreham-Wading River Central School District
2005 Total Cohort - Aug 2009 Year Outcome All Students 239 93% 0% 4% 0% 2% ELL 1 # # # # # Not ELL 238 # # # # #
2005 Total Cohort - 4 Year Outcome All Students 239 92% 0% 5% 0% 2% ELL 1 # # # # # Not ELL 238 # # # # #
Data presented in this report are based on data submitted by school districts to the data repository for the 2008-09 school year. Students are reported based on their date of entry in grade 9 and their last enrollment status as reported in the warehouse on July 31, 2009. The federal Family Education Rights and Privacy Act prohibits the release of personally identifiable student information. This Act precludes the publication of summary information based on fewer than five students or in which subtraction or other simple mathematical operations could be used to obtain personal information. Cells that contain the ("#") symbol have been suppressed to protect student privacy.
District-ell status Thursday, March 4, 2010 Page 248 of 301
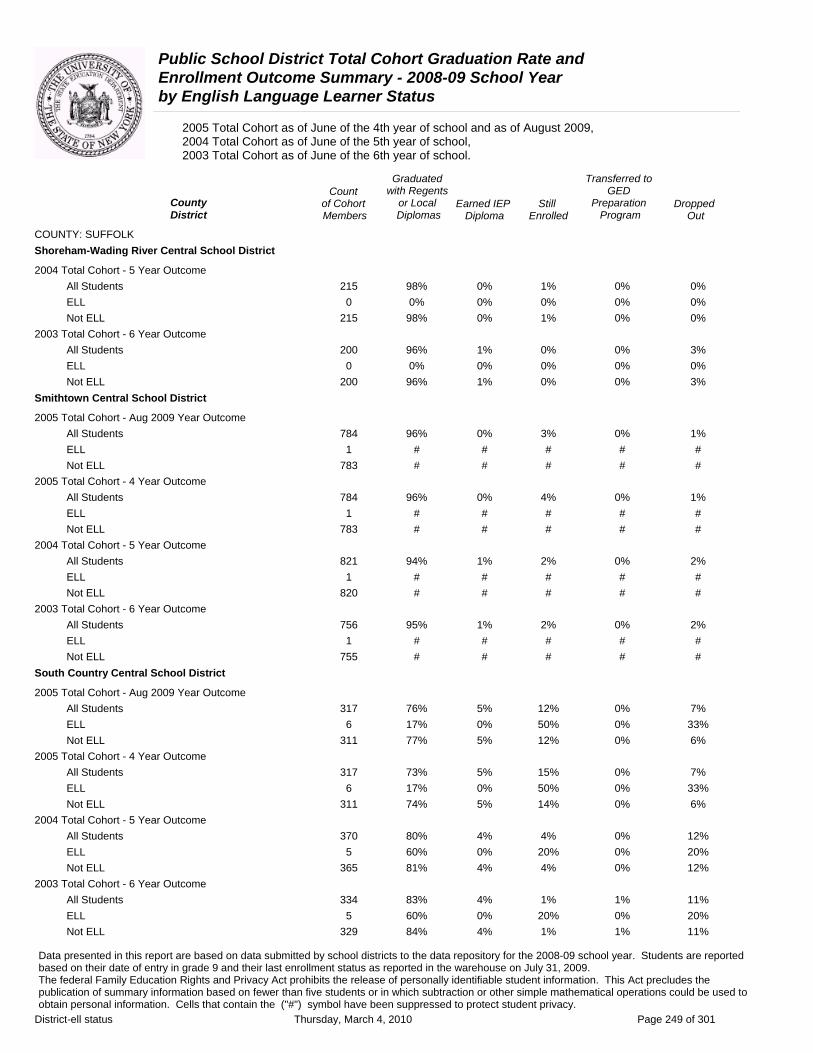
Public School District Total Cohort Graduation Rate and Enrollment Outcome Summary - 2008-09 School Year by English Language Learner Status
2005 Total Cohort as of June of the 4th year of school and as of August 2009, 2004 Total Cohort as of June of the 5th year of school, 2003 Total Cohort as of June of the 6th year of school.
Graduated Transferred to Count with Regents GED
County of Cohort or Local Earned IEP Still Preparation DroppedDistrict Members Diplomas Diploma Enrolled Program Out
COUNTY: SUFFOLK Shoreham-Wading River Central School District
2004 Total Cohort - 5 Year Outcome All Students 215 98% 0% 1% 0% 0% ELL 0 0% 0% 0% 0% 0% Not ELL 215 98% 0% 1% 0% 0%
2003 Total Cohort - 6 Year Outcome All Students 200 96% 1% 0% 0% 3% ELL 0 0% 0% 0% 0% 0% Not ELL 200 96% 1% 0% 0% 3%
Smithtown Central School District
2005 Total Cohort - Aug 2009 Year Outcome All Students 784 96% 0% 3% 0% 1% ELL 1 # # # # # Not ELL 783 # # # # #
2005 Total Cohort - 4 Year Outcome All Students 784 96% 0% 4% 0% 1% ELL 1 # # # # # Not ELL 783 # # # # #
2004 Total Cohort - 5 Year Outcome All Students 821 94% 1% 2% 0% 2% ELL 1 # # # # # Not ELL 820 # # # # #
2003 Total Cohort - 6 Year Outcome All Students 756 95% 1% 2% 0% 2% ELL 1 # # # # # Not ELL 755 # # # # #
South Country Central School District
2005 Total Cohort - Aug 2009 Year Outcome All Students 317 76% 5% 12% 0% 7% ELL 6 17% 0% 50% 0% 33% Not ELL 311 77% 5% 12% 0% 6%
2005 Total Cohort - 4 Year Outcome All Students 317 73% 5% 15% 0% 7% ELL 6 17% 0% 50% 0% 33% Not ELL 311 74% 5% 14% 0% 6%
2004 Total Cohort - 5 Year Outcome All Students 370 80% 4% 4% 0% 12% ELL 5 60% 0% 20% 0% 20% Not ELL 365 81% 4% 4% 0% 12%
2003 Total Cohort - 6 Year Outcome All Students 334 83% 4% 1% 1% 11% ELL 5 60% 0% 20% 0% 20% Not ELL 329 84% 4% 1% 1% 11%
Data presented in this report are based on data submitted by school districts to the data repository for the 2008-09 school year. Students are reported based on their date of entry in grade 9 and their last enrollment status as reported in the warehouse on July 31, 2009. The federal Family Education Rights and Privacy Act prohibits the release of personally identifiable student information. This Act precludes the publication of summary information based on fewer than five students or in which subtraction or other simple mathematical operations could be used to obtain personal information. Cells that contain the ("#") symbol have been suppressed to protect student privacy.
District-ell status Thursday, March 4, 2010 Page 249 of 301
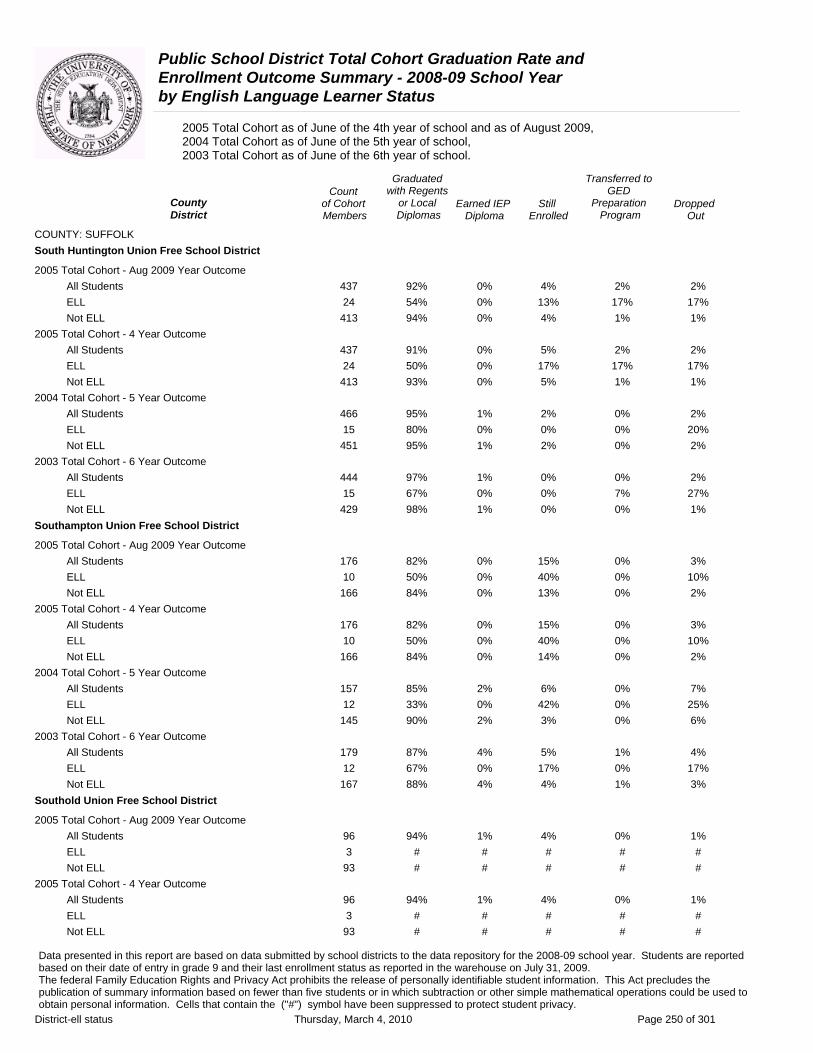
Public School District Total Cohort Graduation Rate and Enrollment Outcome Summary - 2008-09 School Year by English Language Learner Status
2005 Total Cohort as of June of the 4th year of school and as of August 2009, 2004 Total Cohort as of June of the 5th year of school, 2003 Total Cohort as of June of the 6th year of school.
Graduated Transferred to Count with Regents GED
County of Cohort or Local Earned IEP Still Preparation DroppedDistrict Members Diplomas Diploma Enrolled Program Out
COUNTY: SUFFOLK South Huntington Union Free School District
2005 Total Cohort - Aug 2009 Year Outcome All Students 437 92% 0% 4% 2% 2% ELL 24 54% 0% 13% 17% 17% Not ELL 413 94% 0% 4% 1% 1%
2005 Total Cohort - 4 Year Outcome All Students 437 91% 0% 5% 2% 2% ELL 24 50% 0% 17% 17% 17% Not ELL 413 93% 0% 5% 1% 1%
2004 Total Cohort - 5 Year Outcome All Students 466 95% 1% 2% 0% 2% ELL 15 80% 0% 0% 0% 20% Not ELL 451 95% 1% 2% 0% 2%
2003 Total Cohort - 6 Year Outcome All Students 444 97% 1% 0% 0% 2% ELL 15 67% 0% 0% 7% 27% Not ELL 429 98% 1% 0% 0% 1%
Southampton Union Free School District
2005 Total Cohort - Aug 2009 Year Outcome All Students 176 82% 0% 15% 0% 3% ELL 10 50% 0% 40% 0% 10% Not ELL 166 84% 0% 13% 0% 2%
2005 Total Cohort - 4 Year Outcome All Students 176 82% 0% 15% 0% 3% ELL 10 50% 0% 40% 0% 10% Not ELL 166 84% 0% 14% 0% 2%
2004 Total Cohort - 5 Year Outcome All Students 157 85% 2% 6% 0% 7% ELL 12 33% 0% 42% 0% 25% Not ELL 145 90% 2% 3% 0% 6%
2003 Total Cohort - 6 Year Outcome All Students 179 87% 4% 5% 1% 4% ELL 12 67% 0% 17% 0% 17% Not ELL 167 88% 4% 4% 1% 3%
Southold Union Free School District
2005 Total Cohort - Aug 2009 Year Outcome All Students 96 94% 1% 4% 0% 1% ELL 3 # # # # # Not ELL 93 # # # # #
2005 Total Cohort - 4 Year Outcome All Students 96 94% 1% 4% 0% 1% ELL 3 # # # # # Not ELL 93 # # # # #
Data presented in this report are based on data submitted by school districts to the data repository for the 2008-09 school year. Students are reported based on their date of entry in grade 9 and their last enrollment status as reported in the warehouse on July 31, 2009. The federal Family Education Rights and Privacy Act prohibits the release of personally identifiable student information. This Act precludes the publication of summary information based on fewer than five students or in which subtraction or other simple mathematical operations could be used to obtain personal information. Cells that contain the ("#") symbol have been suppressed to protect student privacy.
District-ell status Thursday, March 4, 2010 Page 250 of 301
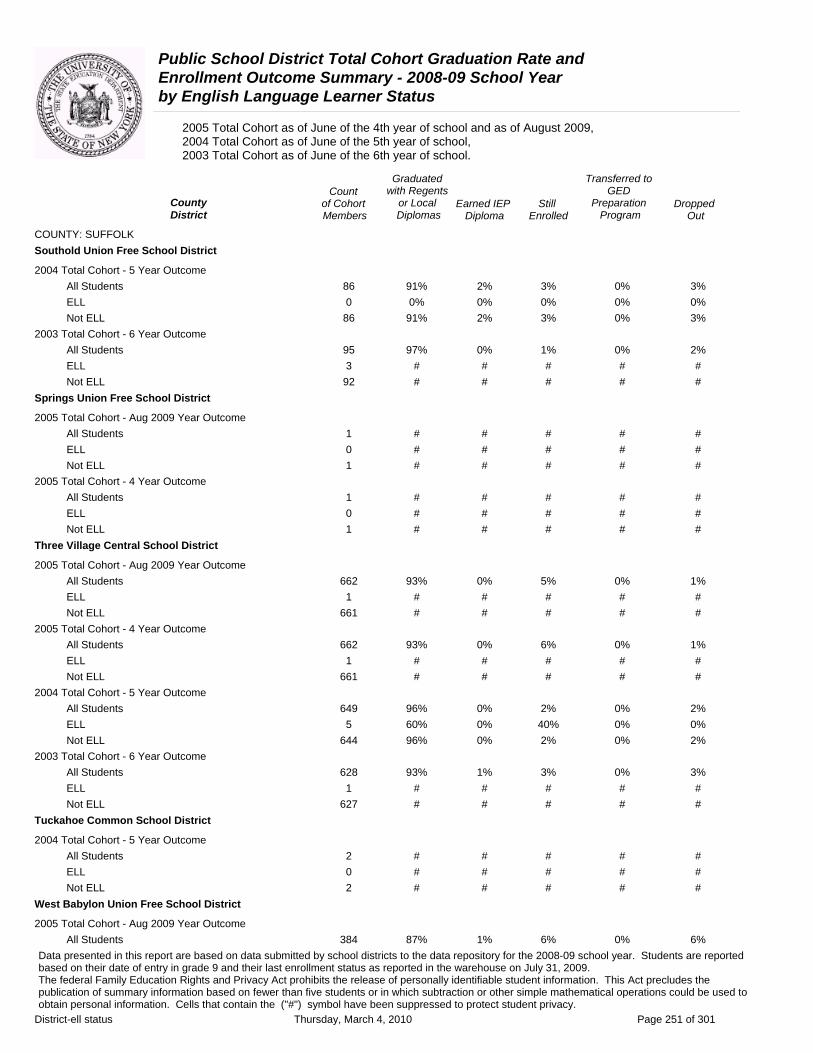
Public School District Total Cohort Graduation Rate and Enrollment Outcome Summary - 2008-09 School Year by English Language Learner Status
2005 Total Cohort as of June of the 4th year of school and as of August 2009, 2004 Total Cohort as of June of the 5th year of school, 2003 Total Cohort as of June of the 6th year of school.
Graduated Transferred to Count with Regents GED
County of Cohort or Local Earned IEP Still Preparation DroppedDistrict Members Diplomas Diploma Enrolled Program Out
COUNTY: SUFFOLK Southold Union Free School District
2004 Total Cohort - 5 Year Outcome All Students 86 91% 2% 3% 0% 3% ELL 0 0% 0% 0% 0% 0% Not ELL 86 91% 2% 3% 0% 3%
2003 Total Cohort - 6 Year Outcome All Students 95 97% 0% 1% 0% 2% ELL 3 # # # # # Not ELL 92 # # # # #
Springs Union Free School District
2005 Total Cohort - Aug 2009 Year Outcome All Students 1 # # # # # ELL 0 # # # # # Not ELL 1 # # # # #
2005 Total Cohort - 4 Year Outcome All Students 1 # # # # # ELL 0 # # # # # Not ELL 1 # # # # #
Three Village Central School District
2005 Total Cohort - Aug 2009 Year Outcome All Students 662 93% 0% 5% 0% 1% ELL 1 # # # # # Not ELL 661 # # # # #
2005 Total Cohort - 4 Year Outcome All Students 662 93% 0% 6% 0% 1% ELL 1 # # # # # Not ELL 661 # # # # #
2004 Total Cohort - 5 Year Outcome All Students 649 96% 0% 2% 0% 2% ELL 5 60% 0% 40% 0% 0% Not ELL 644 96% 0% 2% 0% 2%
2003 Total Cohort - 6 Year Outcome All Students 628 93% 1% 3% 0% 3% ELL 1 # # # # # Not ELL 627 # # # # #
Tuckahoe Common School District
2004 Total Cohort - 5 Year Outcome All Students 2 # # # # # ELL 0 # # # # # Not ELL 2 # # # # #
West Babylon Union Free School District
2005 Total Cohort - Aug 2009 Year Outcome All Students 384 87% 1% 6% 0% 6%
Data presented in this report are based on data submitted by school districts to the data repository for the 2008-09 school year. Students are reported based on their date of entry in grade 9 and their last enrollment status as reported in the warehouse on July 31, 2009. The federal Family Education Rights and Privacy Act prohibits the release of personally identifiable student information. This Act precludes the publication of summary information based on fewer than five students or in which subtraction or other simple mathematical operations could be used to obtain personal information. Cells that contain the ("#") symbol have been suppressed to protect student privacy.
District-ell status Thursday, March 4, 2010 Page 251 of 301
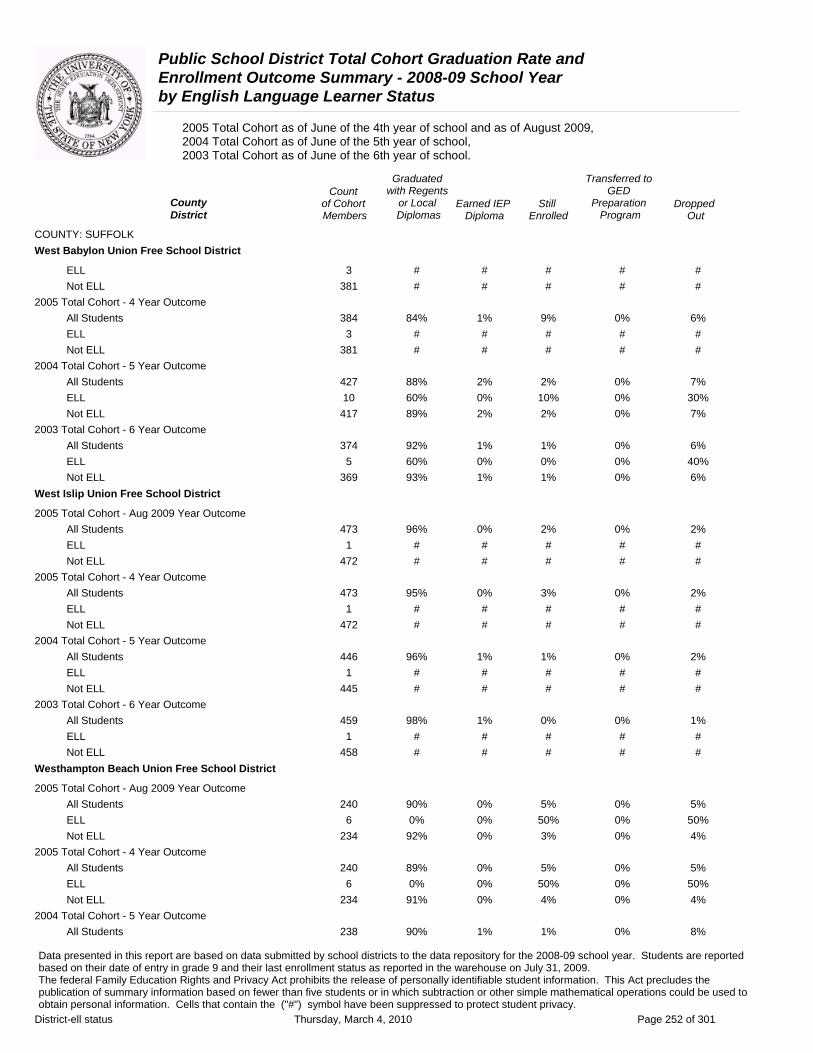
Public School District Total Cohort Graduation Rate and Enrollment Outcome Summary - 2008-09 School Year by English Language Learner Status
2005 Total Cohort as of June of the 4th year of school and as of August 2009, 2004 Total Cohort as of June of the 5th year of school, 2003 Total Cohort as of June of the 6th year of school.
Graduated Transferred to Count with Regents GED
County of Cohort or Local Earned IEP Still Preparation DroppedDistrict Members Diplomas Diploma Enrolled Program Out
COUNTY: SUFFOLK West Babylon Union Free School District
ELL 3 # # # # # Not ELL 381 # # # # #
2005 Total Cohort - 4 Year Outcome All Students 384 84% 1% 9% 0% 6% ELL 3 # # # # # Not ELL 381 # # # # #
2004 Total Cohort - 5 Year Outcome All Students 427 88% 2% 2% 0% 7% ELL 10 60% 0% 10% 0% 30% Not ELL 417 89% 2% 2% 0% 7%
2003 Total Cohort - 6 Year Outcome All Students 374 92% 1% 1% 0% 6% ELL 5 60% 0% 0% 0% 40% Not ELL 369 93% 1% 1% 0% 6%
West Islip Union Free School District
2005 Total Cohort - Aug 2009 Year Outcome All Students 473 96% 0% 2% 0% 2% ELL 1 # # # # # Not ELL 472 # # # # #
2005 Total Cohort - 4 Year Outcome All Students 473 95% 0% 3% 0% 2% ELL 1 # # # # # Not ELL 472 # # # # #
2004 Total Cohort - 5 Year Outcome All Students 446 96% 1% 1% 0% 2% ELL 1 # # # # # Not ELL 445 # # # # #
2003 Total Cohort - 6 Year Outcome All Students 459 98% 1% 0% 0% 1% ELL 1 # # # # # Not ELL 458 # # # # #
Westhampton Beach Union Free School District
2005 Total Cohort - Aug 2009 Year Outcome All Students 240 90% 0% 5% 0% 5% ELL 6 0% 0% 50% 0% 50% Not ELL 234 92% 0% 3% 0% 4%
2005 Total Cohort - 4 Year Outcome All Students 240 89% 0% 5% 0% 5% ELL 6 0% 0% 50% 0% 50% Not ELL 234 91% 0% 4% 0% 4%
2004 Total Cohort - 5 Year Outcome All Students 238 90% 1% 1% 0% 8%
Data presented in this report are based on data submitted by school districts to the data repository for the 2008-09 school year. Students are reported based on their date of entry in grade 9 and their last enrollment status as reported in the warehouse on July 31, 2009. The federal Family Education Rights and Privacy Act prohibits the release of personally identifiable student information. This Act precludes the publication of summary information based on fewer than five students or in which subtraction or other simple mathematical operations could be used to obtain personal information. Cells that contain the ("#") symbol have been suppressed to protect student privacy.
District-ell status Thursday, March 4, 2010 Page 252 of 301
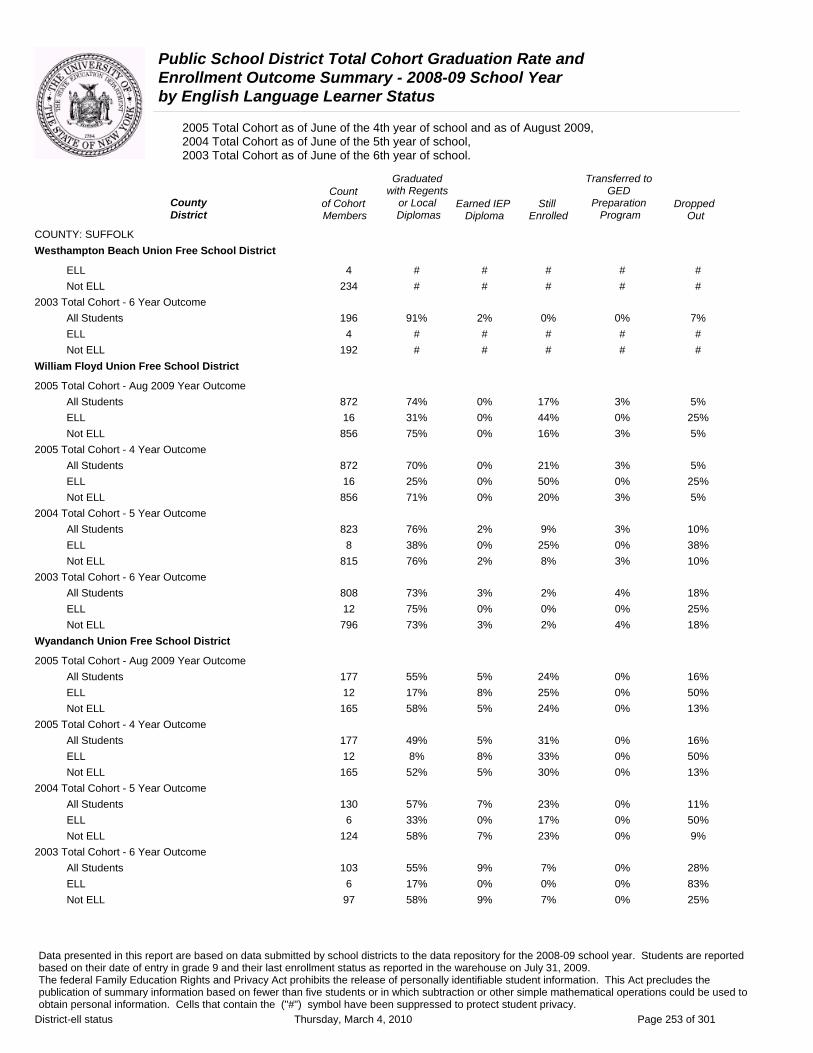
Public School District Total Cohort Graduation Rate and Enrollment Outcome Summary - 2008-09 School Year by English Language Learner Status
2005 Total Cohort as of June of the 4th year of school and as of August 2009, 2004 Total Cohort as of June of the 5th year of school, 2003 Total Cohort as of June of the 6th year of school.
Graduated Transferred to Count with Regents GED
County of Cohort or Local Earned IEP Still Preparation DroppedDistrict Members Diplomas Diploma Enrolled Program Out
COUNTY: SUFFOLK Westhampton Beach Union Free School District
ELL 4 # # # # # Not ELL 234 # # # # #
2003 Total Cohort - 6 Year Outcome All Students 196 91% 2% 0% 0% 7% ELL 4 # # # # # Not ELL 192 # # # # #
William Floyd Union Free School District
2005 Total Cohort - Aug 2009 Year Outcome All Students 872 74% 0% 17% 3% 5% ELL 16 31% 0% 44% 0% 25% Not ELL 856 75% 0% 16% 3% 5%
2005 Total Cohort - 4 Year Outcome All Students 872 70% 0% 21% 3% 5% ELL 16 25% 0% 50% 0% 25% Not ELL 856 71% 0% 20% 3% 5%
2004 Total Cohort - 5 Year Outcome All Students 823 76% 2% 9% 3% 10% ELL 8 38% 0% 25% 0% 38% Not ELL 815 76% 2% 8% 3% 10%
2003 Total Cohort - 6 Year Outcome All Students 808 73% 3% 2% 4% 18% ELL 12 75% 0% 0% 0% 25% Not ELL 796 73% 3% 2% 4% 18%
Wyandanch Union Free School District
2005 Total Cohort - Aug 2009 Year Outcome All Students 177 55% 5% 24% 0% 16% ELL 12 17% 8% 25% 0% 50% Not ELL 165 58% 5% 24% 0% 13%
2005 Total Cohort - 4 Year Outcome All Students 177 49% 5% 31% 0% 16% ELL 12 8% 8% 33% 0% 50% Not ELL 165 52% 5% 30% 0% 13%
2004 Total Cohort - 5 Year Outcome All Students 130 57% 7% 23% 0% 11% ELL 6 33% 0% 17% 0% 50% Not ELL 124 58% 7% 23% 0% 9%
2003 Total Cohort - 6 Year Outcome All Students 103 55% 9% 7% 0% 28% ELL 6 17% 0% 0% 0% 83% Not ELL 97 58% 9% 7% 0% 25%
Data presented in this report are based on data submitted by school districts to the data repository for the 2008-09 school year. Students are reported based on their date of entry in grade 9 and their last enrollment status as reported in the warehouse on July 31, 2009. The federal Family Education Rights and Privacy Act prohibits the release of personally identifiable student information. This Act precludes the publication of summary information based on fewer than five students or in which subtraction or other simple mathematical operations could be used to obtain personal information. Cells that contain the ("#") symbol have been suppressed to protect student privacy.
District-ell status Thursday, March 4, 2010 Page 253 of 301

Public School District Total Cohort Graduation Rate and Enrollment Outcome Summary - 2008-09 School Year by English Language Learner Status
2005 Total Cohort as of June of the 4th year of school and as of August 2009, 2004 Total Cohort as of June of the 5th year of school, 2003 Total Cohort as of June of the 6th year of school.
Graduated Transferred to Count with Regents GED
County of Cohort or Local Earned IEP Still Preparation DroppedDistrict Members Diplomas Diploma Enrolled Program Out
COUNTY: SULLIVAN Eldred Central School District
2005 Total Cohort - Aug 2009 Year Outcome All Students 64 83% 2% 11% 2% 3% ELL 0 0% 0% 0% 0% 0% Not ELL 64 83% 2% 11% 2% 3%
2005 Total Cohort - 4 Year Outcome All Students 64 83% 2% 11% 2% 3% ELL 0 0% 0% 0% 0% 0% Not ELL 64 83% 2% 11% 2% 3%
2004 Total Cohort - 5 Year Outcome All Students 68 84% 3% 1% 1% 10% ELL 0 0% 0% 0% 0% 0% Not ELL 68 84% 3% 1% 1% 10%
2003 Total Cohort - 6 Year Outcome All Students 60 87% 2% 3% 2% 7% ELL 0 0% 0% 0% 0% 0% Not ELL 60 87% 2% 3% 2% 7%
Fallsburg Central School District
2005 Total Cohort - Aug 2009 Year Outcome All Students 129 67% 5% 10% 2% 17% ELL 5 60% 0% 40% 0% 0% Not ELL 124 67% 5% 9% 2% 18%
2005 Total Cohort - 4 Year Outcome All Students 129 66% 5% 11% 2% 17% ELL 5 60% 0% 40% 0% 0% Not ELL 124 66% 5% 10% 2% 18%
2004 Total Cohort - 5 Year Outcome All Students 128 71% 3% 5% 2% 19% ELL 4 # # # # # Not ELL 124 # # # # #
2003 Total Cohort - 6 Year Outcome All Students 111 60% 5% 5% 3% 27% ELL 1 # # # # # Not ELL 110 # # # # #
Liberty Central School District
2005 Total Cohort - Aug 2009 Year Outcome All Students 146 62% 2% 8% 12% 17% ELL 6 0% 0% 17% 0% 83% Not ELL 140 64% 2% 7% 12% 14%
2005 Total Cohort - 4 Year Outcome All Students 146 59% 2% 10% 12% 17% ELL 6 0% 0% 17% 0% 83% Not ELL 140 61% 2% 10% 12% 14%
Data presented in this report are based on data submitted by school districts to the data repository for the 2008-09 school year. Students are reported based on their date of entry in grade 9 and their last enrollment status as reported in the warehouse on July 31, 2009. The federal Family Education Rights and Privacy Act prohibits the release of personally identifiable student information. This Act precludes the publication of summary information based on fewer than five students or in which subtraction or other simple mathematical operations could be used to obtain personal information. Cells that contain the ("#") symbol have been suppressed to protect student privacy.
District-ell status Thursday, March 4, 2010 Page 254 of 301
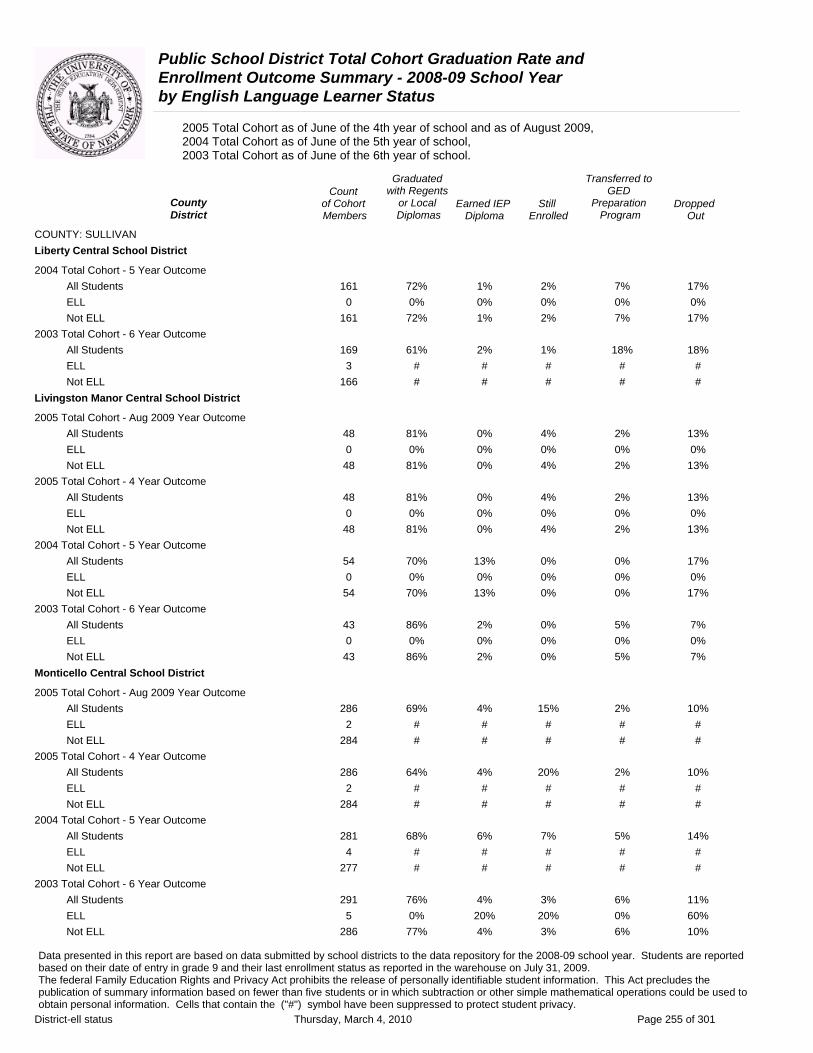
Public School District Total Cohort Graduation Rate and Enrollment Outcome Summary - 2008-09 School Year by English Language Learner Status
2005 Total Cohort as of June of the 4th year of school and as of August 2009, 2004 Total Cohort as of June of the 5th year of school, 2003 Total Cohort as of June of the 6th year of school.
Graduated Transferred to Count with Regents GED
County of Cohort or Local Earned IEP Still Preparation DroppedDistrict Members Diplomas Diploma Enrolled Program Out
COUNTY: SULLIVAN Liberty Central School District
2004 Total Cohort - 5 Year Outcome All Students 161 72% 1% 2% 7% 17% ELL 0 0% 0% 0% 0% 0% Not ELL 161 72% 1% 2% 7% 17%
2003 Total Cohort - 6 Year Outcome All Students 169 61% 2% 1% 18% 18% ELL 3 # # # # # Not ELL 166 # # # # #
Livingston Manor Central School District
2005 Total Cohort - Aug 2009 Year Outcome All Students 48 81% 0% 4% 2% 13% ELL 0 0% 0% 0% 0% 0% Not ELL 48 81% 0% 4% 2% 13%
2005 Total Cohort - 4 Year Outcome All Students 48 81% 0% 4% 2% 13% ELL 0 0% 0% 0% 0% 0% Not ELL 48 81% 0% 4% 2% 13%
2004 Total Cohort - 5 Year Outcome All Students 54 70% 13% 0% 0% 17% ELL 0 0% 0% 0% 0% 0% Not ELL 54 70% 13% 0% 0% 17%
2003 Total Cohort - 6 Year Outcome All Students 43 86% 2% 0% 5% 7% ELL 0 0% 0% 0% 0% 0% Not ELL 43 86% 2% 0% 5% 7%
Monticello Central School District
2005 Total Cohort - Aug 2009 Year Outcome All Students 286 69% 4% 15% 2% 10% ELL 2 # # # # # Not ELL 284 # # # # #
2005 Total Cohort - 4 Year Outcome All Students 286 64% 4% 20% 2% 10% ELL 2 # # # # # Not ELL 284 # # # # #
2004 Total Cohort - 5 Year Outcome All Students 281 68% 6% 7% 5% 14% ELL 4 # # # # # Not ELL 277 # # # # #
2003 Total Cohort - 6 Year Outcome All Students 291 76% 4% 3% 6% 11% ELL 5 0% 20% 20% 0% 60% Not ELL 286 77% 4% 3% 6% 10%
Data presented in this report are based on data submitted by school districts to the data repository for the 2008-09 school year. Students are reported based on their date of entry in grade 9 and their last enrollment status as reported in the warehouse on July 31, 2009. The federal Family Education Rights and Privacy Act prohibits the release of personally identifiable student information. This Act precludes the publication of summary information based on fewer than five students or in which subtraction or other simple mathematical operations could be used to obtain personal information. Cells that contain the ("#") symbol have been suppressed to protect student privacy.
District-ell status Thursday, March 4, 2010 Page 255 of 301

Public School District Total Cohort Graduation Rate and Enrollment Outcome Summary - 2008-09 School Year by English Language Learner Status
2005 Total Cohort as of June of the 4th year of school and as of August 2009, 2004 Total Cohort as of June of the 5th year of school, 2003 Total Cohort as of June of the 6th year of school.
Graduated Transferred to Count with Regents GED
County of Cohort or Local Earned IEP Still Preparation DroppedDistrict Members Diplomas Diploma Enrolled Program Out
COUNTY: SULLIVAN Roscoe Central School District
2005 Total Cohort - Aug 2009 Year Outcome All Students 28 79% 0% 4% 7% 11% ELL 0 0% 0% 0% 0% 0% Not ELL 28 79% 0% 4% 7% 11%
2005 Total Cohort - 4 Year Outcome All Students 28 79% 0% 4% 7% 11% ELL 0 0% 0% 0% 0% 0% Not ELL 28 79% 0% 4% 7% 11%
2004 Total Cohort - 5 Year Outcome All Students 27 78% 7% 0% 7% 7% ELL 0 0% 0% 0% 0% 0% Not ELL 27 78% 7% 0% 7% 7%
2003 Total Cohort - 6 Year Outcome All Students 24 79% 4% 0% 0% 17% ELL 0 0% 0% 0% 0% 0% Not ELL 24 79% 4% 0% 0% 17%
Sullivan West Central School District
2005 Total Cohort - Aug 2009 Year Outcome All Students 128 82% 0% 11% 0% 7% ELL 0 0% 0% 0% 0% 0% Not ELL 128 82% 0% 11% 0% 7%
2005 Total Cohort - 4 Year Outcome All Students 128 82% 0% 11% 0% 7% ELL 0 0% 0% 0% 0% 0% Not ELL 128 82% 0% 11% 0% 7%
2004 Total Cohort - 5 Year Outcome All Students 132 86% 2% 5% 0% 8% ELL 1 # # # # # Not ELL 131 # # # # #
2003 Total Cohort - 6 Year Outcome All Students 144 78% 1% 6% 0% 15% ELL 0 0% 0% 0% 0% 0% Not ELL 144 78% 1% 6% 0% 15%
Tri-Valley Central School District
2005 Total Cohort - Aug 2009 Year Outcome All Students 114 83% 3% 9% 1% 4% ELL 1 # # # # # Not ELL 113 # # # # #
2005 Total Cohort - 4 Year Outcome All Students 114 82% 3% 11% 1% 4% ELL 1 # # # # # Not ELL 113 # # # # #
Data presented in this report are based on data submitted by school districts to the data repository for the 2008-09 school year. Students are reported based on their date of entry in grade 9 and their last enrollment status as reported in the warehouse on July 31, 2009. The federal Family Education Rights and Privacy Act prohibits the release of personally identifiable student information. This Act precludes the publication of summary information based on fewer than five students or in which subtraction or other simple mathematical operations could be used to obtain personal information. Cells that contain the ("#") symbol have been suppressed to protect student privacy.
District-ell status Thursday, March 4, 2010 Page 256 of 301

Public School District Total Cohort Graduation Rate and Enrollment Outcome Summary - 2008-09 School Year by English Language Learner Status
2005 Total Cohort as of June of the 4th year of school and as of August 2009, 2004 Total Cohort as of June of the 5th year of school, 2003 Total Cohort as of June of the 6th year of school.
Graduated Transferred to Count with Regents GED
County of Cohort or Local Earned IEP Still Preparation DroppedDistrict Members Diplomas Diploma Enrolled Program Out
COUNTY: SULLIVAN Tri-Valley Central School District
2004 Total Cohort - 5 Year Outcome All Students 108 91% 0% 2% 0% 7% ELL 0 0% 0% 0% 0% 0% Not ELL 108 91% 0% 2% 0% 7%
2003 Total Cohort - 6 Year Outcome All Students 89 83% 2% 0% 1% 13% ELL 0 0% 0% 0% 0% 0% Not ELL 89 83% 2% 0% 1% 13%
Data presented in this report are based on data submitted by school districts to the data repository for the 2008-09 school year. Students are reported based on their date of entry in grade 9 and their last enrollment status as reported in the warehouse on July 31, 2009. The federal Family Education Rights and Privacy Act prohibits the release of personally identifiable student information. This Act precludes the publication of summary information based on fewer than five students or in which subtraction or other simple mathematical operations could be used to obtain personal information. Cells that contain the ("#") symbol have been suppressed to protect student privacy.
District-ell status Thursday, March 4, 2010 Page 257 of 301
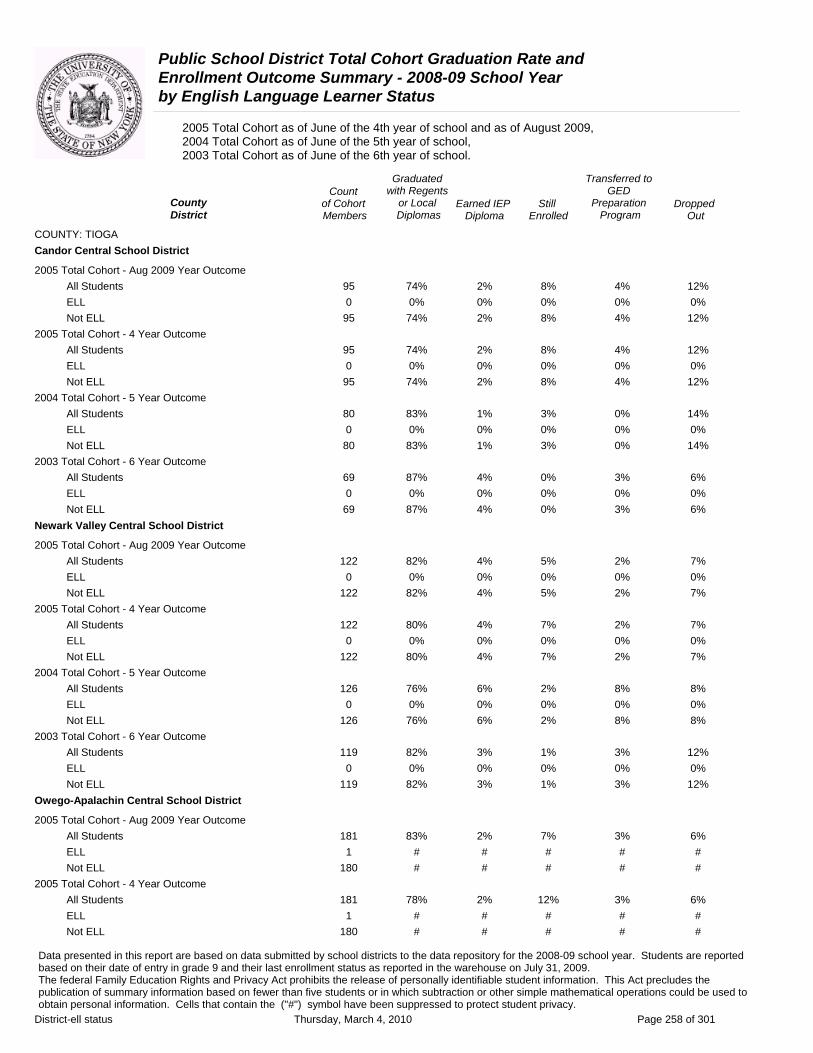
Public School District Total Cohort Graduation Rate and Enrollment Outcome Summary - 2008-09 School Year by English Language Learner Status
2005 Total Cohort as of June of the 4th year of school and as of August 2009, 2004 Total Cohort as of June of the 5th year of school, 2003 Total Cohort as of June of the 6th year of school.
Graduated Transferred to Count with Regents GED
County of Cohort or Local Earned IEP Still Preparation DroppedDistrict Members Diplomas Diploma Enrolled Program Out
COUNTY: TIOGA Candor Central School District
2005 Total Cohort - Aug 2009 Year Outcome All Students 95 74% 2% 8% 4% 12% ELL 0 0% 0% 0% 0% 0% Not ELL 95 74% 2% 8% 4% 12%
2005 Total Cohort - 4 Year Outcome All Students 95 74% 2% 8% 4% 12% ELL 0 0% 0% 0% 0% 0% Not ELL 95 74% 2% 8% 4% 12%
2004 Total Cohort - 5 Year Outcome All Students 80 83% 1% 3% 0% 14% ELL 0 0% 0% 0% 0% 0% Not ELL 80 83% 1% 3% 0% 14%
2003 Total Cohort - 6 Year Outcome All Students 69 87% 4% 0% 3% 6% ELL 0 0% 0% 0% 0% 0% Not ELL 69 87% 4% 0% 3% 6%
Newark Valley Central School District
2005 Total Cohort - Aug 2009 Year Outcome All Students 122 82% 4% 5% 2% 7% ELL 0 0% 0% 0% 0% 0% Not ELL 122 82% 4% 5% 2% 7%
2005 Total Cohort - 4 Year Outcome All Students 122 80% 4% 7% 2% 7% ELL 0 0% 0% 0% 0% 0% Not ELL 122 80% 4% 7% 2% 7%
2004 Total Cohort - 5 Year Outcome All Students 126 76% 6% 2% 8% 8% ELL 0 0% 0% 0% 0% 0% Not ELL 126 76% 6% 2% 8% 8%
2003 Total Cohort - 6 Year Outcome All Students 119 82% 3% 1% 3% 12% ELL 0 0% 0% 0% 0% 0% Not ELL 119 82% 3% 1% 3% 12%
Owego-Apalachin Central School District
2005 Total Cohort - Aug 2009 Year Outcome All Students 181 83% 2% 7% 3% 6% ELL 1 # # # # # Not ELL 180 # # # # #
2005 Total Cohort - 4 Year Outcome All Students 181 78% 2% 12% 3% 6% ELL 1 # # # # # Not ELL 180 # # # # #
Data presented in this report are based on data submitted by school districts to the data repository for the 2008-09 school year. Students are reported based on their date of entry in grade 9 and their last enrollment status as reported in the warehouse on July 31, 2009. The federal Family Education Rights and Privacy Act prohibits the release of personally identifiable student information. This Act precludes the publication of summary information based on fewer than five students or in which subtraction or other simple mathematical operations could be used to obtain personal information. Cells that contain the ("#") symbol have been suppressed to protect student privacy.
District-ell status Thursday, March 4, 2010 Page 258 of 301

Public School District Total Cohort Graduation Rate and Enrollment Outcome Summary - 2008-09 School Year by English Language Learner Status
2005 Total Cohort as of June of the 4th year of school and as of August 2009, 2004 Total Cohort as of June of the 5th year of school, 2003 Total Cohort as of June of the 6th year of school.
County District
COUNTY: TIOGA Owego-Apalachin Central School District
2004 Total Cohort - 5 Year Outcome All Students ELL Not ELL
2003 Total Cohort - 6 Year Outcome All Students ELL Not ELL
Spencer-Van Etten Central School District
2005 Total Cohort - Aug 2009 Year Outcome All Students ELL Not ELL
2005 Total Cohort - 4 Year Outcome All Students ELL Not ELL
2004 Total Cohort - 5 Year Outcome All Students ELL Not ELL
2003 Total Cohort - 6 Year Outcome All Students ELL Not ELL
Tioga Central School District
2005 Total Cohort - Aug 2009 Year Outcome All Students ELL Not ELL
2005 Total Cohort - 4 Year Outcome All Students ELL Not ELL
2004 Total Cohort - 5 Year Outcome All Students ELL Not ELL
2003 Total Cohort - 6 Year Outcome All Students ELL Not ELL
Count of Cohort Members
206 1
205
212 0
212
87 0 87
87 0 87
90 0 90
85 0 85
102 0
102
102 0
102
103 0
103
96 0 96
Graduated with Regents
or Local Diplomas
78%
#
#
82%
0%
82%
80%
0%
80%
80%
0%
80%
81%
0%
81%
85%
0%
85%
78%
0%
78%
77%
0%
77%
78%
0%
78%
82%
0%
82%
Earned IEP Diploma
5% # #
7% 0% 7%
5% 0% 5%
5% 0% 5%
7% 0% 7%
2% 0% 2%
3% 0% 3%
3% 0% 3%
6% 0% 6%
6% 0% 6%
Still Enrolled
2% # #
1% 0% 1%
6% 0% 6%
6% 0% 6%
3% 0% 3%
5% 0% 5%
3% 0% 3%
4% 0% 4%
1% 0% 1%
1% 0% 1%
Transferred to GED
Preparation Program
Dropped Out
4% 10% # # # #
1% 9% 0% 0% 1% 9%
0% 9% 0% 0% 0% 9%
0% 9% 0% 0% 0% 9%
0% 9% 0% 0% 0% 9%
0% 8% 0% 0% 0% 8%
1% 15% 0% 0% 1% 15%
1% 15% 0% 0% 1% 15%
4% 12% 0% 0% 4% 12%
4% 6% 0% 0% 4% 6%
Data presented in this report are based on data submitted by school districts to the data repository for the 2008-09 school year. Students are reported based on their date of entry in grade 9 and their last enrollment status as reported in the warehouse on July 31, 2009. The federal Family Education Rights and Privacy Act prohibits the release of personally identifiable student information. This Act precludes the publication of summary information based on fewer than five students or in which subtraction or other simple mathematical operations could be used to obtain personal information. Cells that contain the ("#") symbol have been suppressed to protect student privacy.
District-ell status Thursday, March 4, 2010 Page 259 of 301
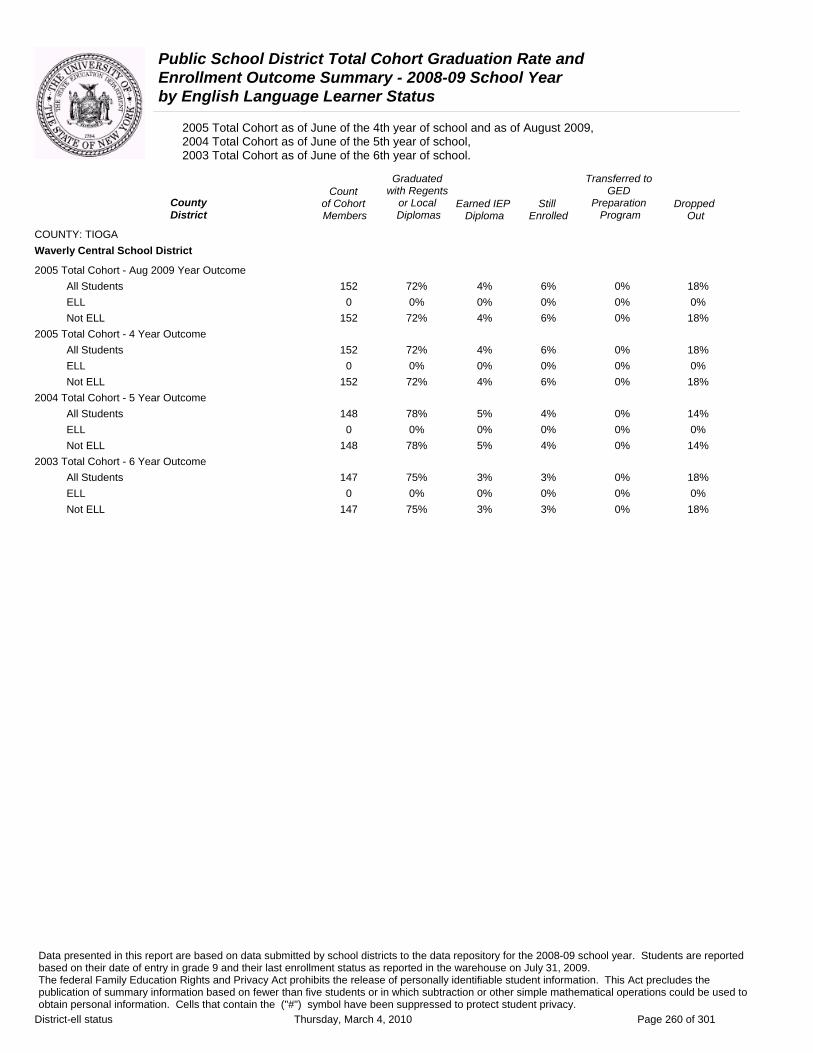
Public School District Total Cohort Graduation Rate and Enrollment Outcome Summary - 2008-09 School Year by English Language Learner Status
2005 Total Cohort as of June of the 4th year of school and as of August 2009, 2004 Total Cohort as of June of the 5th year of school, 2003 Total Cohort as of June of the 6th year of school.
Graduated Transferred to Count with Regents GED
County of Cohort or Local Earned IEP Still Preparation DroppedDistrict Members Diplomas Diploma Enrolled Program Out
COUNTY: TIOGA Waverly Central School District
2005 Total Cohort - Aug 2009 Year Outcome All Students 152 72% 4% 6% 0% 18% ELL 0 0% 0% 0% 0% 0% Not ELL 152 72% 4% 6% 0% 18%
2005 Total Cohort - 4 Year Outcome All Students 152 72% 4% 6% 0% 18% ELL 0 0% 0% 0% 0% 0% Not ELL 152 72% 4% 6% 0% 18%
2004 Total Cohort - 5 Year Outcome All Students 148 78% 5% 4% 0% 14% ELL 0 0% 0% 0% 0% 0% Not ELL 148 78% 5% 4% 0% 14%
2003 Total Cohort - 6 Year Outcome All Students 147 75% 3% 3% 0% 18% ELL 0 0% 0% 0% 0% 0% Not ELL 147 75% 3% 3% 0% 18%
Data presented in this report are based on data submitted by school districts to the data repository for the 2008-09 school year. Students are reported based on their date of entry in grade 9 and their last enrollment status as reported in the warehouse on July 31, 2009. The federal Family Education Rights and Privacy Act prohibits the release of personally identifiable student information. This Act precludes the publication of summary information based on fewer than five students or in which subtraction or other simple mathematical operations could be used to obtain personal information. Cells that contain the ("#") symbol have been suppressed to protect student privacy.
District-ell status Thursday, March 4, 2010 Page 260 of 301
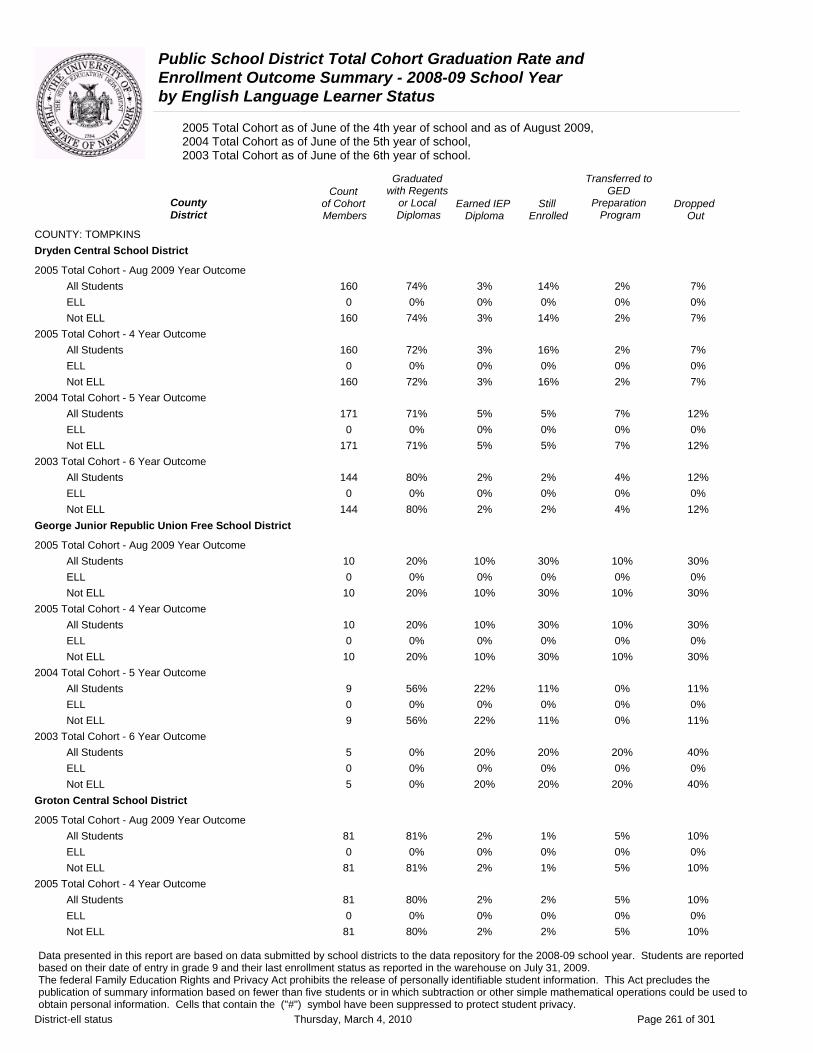
Public School District Total Cohort Graduation Rate and Enrollment Outcome Summary - 2008-09 School Year by English Language Learner Status
2005 Total Cohort as of June of the 4th year of school and as of August 2009, 2004 Total Cohort as of June of the 5th year of school, 2003 Total Cohort as of June of the 6th year of school.
Graduated Transferred to Count with Regents GED
County of Cohort or Local Earned IEP Still Preparation DroppedDistrict Members Diplomas Diploma Enrolled Program Out
COUNTY: TOMPKINS Dryden Central School District
2005 Total Cohort - Aug 2009 Year Outcome All Students 160 74% 3% 14% 2% 7% ELL 0 0% 0% 0% 0% 0% Not ELL 160 74% 3% 14% 2% 7%
2005 Total Cohort - 4 Year Outcome All Students 160 72% 3% 16% 2% 7% ELL 0 0% 0% 0% 0% 0% Not ELL 160 72% 3% 16% 2% 7%
2004 Total Cohort - 5 Year Outcome All Students 171 71% 5% 5% 7% 12% ELL 0 0% 0% 0% 0% 0% Not ELL 171 71% 5% 5% 7% 12%
2003 Total Cohort - 6 Year Outcome All Students 144 80% 2% 2% 4% 12% ELL 0 0% 0% 0% 0% 0% Not ELL 144 80% 2% 2% 4% 12%
George Junior Republic Union Free School District
2005 Total Cohort - Aug 2009 Year Outcome All Students 10 20% 10% 30% 10% 30% ELL 0 0% 0% 0% 0% 0% Not ELL 10 20% 10% 30% 10% 30%
2005 Total Cohort - 4 Year Outcome All Students 10 20% 10% 30% 10% 30% ELL 0 0% 0% 0% 0% 0% Not ELL 10 20% 10% 30% 10% 30%
2004 Total Cohort - 5 Year Outcome All Students 9 56% 22% 11% 0% 11% ELL 0 0% 0% 0% 0% 0% Not ELL 9 56% 22% 11% 0% 11%
2003 Total Cohort - 6 Year Outcome All Students 5 0% 20% 20% 20% 40% ELL 0 0% 0% 0% 0% 0% Not ELL 5 0% 20% 20% 20% 40%
Groton Central School District
2005 Total Cohort - Aug 2009 Year Outcome All Students 81 81% 2% 1% 5% 10% ELL 0 0% 0% 0% 0% 0% Not ELL 81 81% 2% 1% 5% 10%
2005 Total Cohort - 4 Year Outcome All Students 81 80% 2% 2% 5% 10% ELL 0 0% 0% 0% 0% 0% Not ELL 81 80% 2% 2% 5% 10%
Data presented in this report are based on data submitted by school districts to the data repository for the 2008-09 school year. Students are reported based on their date of entry in grade 9 and their last enrollment status as reported in the warehouse on July 31, 2009. The federal Family Education Rights and Privacy Act prohibits the release of personally identifiable student information. This Act precludes the publication of summary information based on fewer than five students or in which subtraction or other simple mathematical operations could be used to obtain personal information. Cells that contain the ("#") symbol have been suppressed to protect student privacy.
District-ell status Thursday, March 4, 2010 Page 261 of 301

Public School District Total Cohort Graduation Rate and Enrollment Outcome Summary - 2008-09 School Year by English Language Learner Status
2005 Total Cohort as of June of the 4th year of school and as of August 2009, 2004 Total Cohort as of June of the 5th year of school, 2003 Total Cohort as of June of the 6th year of school.
Graduated Transferred to Count with Regents GED
County of Cohort or Local Earned IEP Still Preparation DroppedDistrict Members Diplomas Diploma Enrolled Program Out
COUNTY: TOMPKINS Groton Central School District
2004 Total Cohort - 5 Year Outcome All Students 93 68% 10% 1% 4% 17% ELL 0 0% 0% 0% 0% 0% Not ELL 93 68% 10% 1% 4% 17%
2003 Total Cohort - 6 Year Outcome All Students 74 77% 4% 4% 3% 12% ELL 0 0% 0% 0% 0% 0% Not ELL 74 77% 4% 4% 3% 12%
Ithaca City School District
2005 Total Cohort - Aug 2009 Year Outcome All Students 412 77% 2% 10% 5% 6% ELL 6 17% 0% 33% 17% 33% Not ELL 406 78% 2% 10% 5% 5%
2005 Total Cohort - 4 Year Outcome All Students 412 76% 2% 11% 5% 6% ELL 6 17% 0% 33% 17% 33% Not ELL 406 77% 2% 11% 5% 5%
2004 Total Cohort - 5 Year Outcome All Students 510 83% 2% 3% 4% 7% ELL 11 55% 0% 27% 0% 18% Not ELL 499 84% 2% 3% 4% 7%
2003 Total Cohort - 6 Year Outcome All Students 469 81% 3% 2% 3% 10% ELL 11 55% 9% 0% 0% 36% Not ELL 458 82% 3% 2% 3% 10%
Lansing Central School District
2005 Total Cohort - Aug 2009 Year Outcome All Students 109 89% 1% 6% 2% 2% ELL 2 # # # # # Not ELL 107 # # # # #
2005 Total Cohort - 4 Year Outcome All Students 109 88% 1% 7% 2% 2% ELL 2 # # # # # Not ELL 107 # # # # #
2004 Total Cohort - 5 Year Outcome All Students 111 90% 2% 5% 0% 3% ELL 0 0% 0% 0% 0% 0% Not ELL 111 90% 2% 5% 0% 3%
2003 Total Cohort - 6 Year Outcome All Students 124 93% 0% 6% 0% 2% ELL 0 0% 0% 0% 0% 0% Not ELL 124 93% 0% 6% 0% 2%
Data presented in this report are based on data submitted by school districts to the data repository for the 2008-09 school year. Students are reported based on their date of entry in grade 9 and their last enrollment status as reported in the warehouse on July 31, 2009. The federal Family Education Rights and Privacy Act prohibits the release of personally identifiable student information. This Act precludes the publication of summary information based on fewer than five students or in which subtraction or other simple mathematical operations could be used to obtain personal information. Cells that contain the ("#") symbol have been suppressed to protect student privacy.
District-ell status Thursday, March 4, 2010 Page 262 of 301

Public School District Total Cohort Graduation Rate and Enrollment Outcome Summary - 2008-09 School Year by English Language Learner Status
2005 Total Cohort as of June of the 4th year of school and as of August 2009, 2004 Total Cohort as of June of the 5th year of school, 2003 Total Cohort as of June of the 6th year of school.
Graduated Transferred to Count with Regents GED
County of Cohort or Local Earned IEP Still Preparation DroppedDistrict Members Diplomas Diploma Enrolled Program Out
COUNTY: TOMPKINS Newfield Central School District
2005 Total Cohort - Aug 2009 Year Outcome All Students 88 72% 3% 17% 2% 6% ELL 0 0% 0% 0% 0% 0% Not ELL 88 72% 3% 17% 2% 6%
2005 Total Cohort - 4 Year Outcome All Students 88 72% 3% 17% 2% 6% ELL 0 0% 0% 0% 0% 0% Not ELL 88 72% 3% 17% 2% 6%
2004 Total Cohort - 5 Year Outcome All Students 65 82% 3% 5% 2% 9% ELL 0 0% 0% 0% 0% 0% Not ELL 65 82% 3% 5% 2% 9%
2003 Total Cohort - 6 Year Outcome All Students 65 82% 2% 2% 5% 11% ELL 0 0% 0% 0% 0% 0% Not ELL 65 82% 2% 2% 5% 11%
Trumansburg Central School District
2005 Total Cohort - Aug 2009 Year Outcome All Students 136 89% 3% 5% 1% 2% ELL 0 0% 0% 0% 0% 0% Not ELL 136 89% 3% 5% 1% 2%
2005 Total Cohort - 4 Year Outcome All Students 136 86% 3% 8% 1% 2% ELL 0 0% 0% 0% 0% 0% Not ELL 136 86% 3% 8% 1% 2%
2004 Total Cohort - 5 Year Outcome All Students 121 79% 2% 1% 5% 12% ELL 0 0% 0% 0% 0% 0% Not ELL 121 79% 2% 1% 5% 12%
2003 Total Cohort - 6 Year Outcome All Students 112 77% 6% 3% 4% 10% ELL 0 0% 0% 0% 0% 0% Not ELL 112 77% 6% 3% 4% 10%
Data presented in this report are based on data submitted by school districts to the data repository for the 2008-09 school year. Students are reported based on their date of entry in grade 9 and their last enrollment status as reported in the warehouse on July 31, 2009. The federal Family Education Rights and Privacy Act prohibits the release of personally identifiable student information. This Act precludes the publication of summary information based on fewer than five students or in which subtraction or other simple mathematical operations could be used to obtain personal information. Cells that contain the ("#") symbol have been suppressed to protect student privacy.
District-ell status Thursday, March 4, 2010 Page 263 of 301

Public School District Total Cohort Graduation Rate and Enrollment Outcome Summary - 2008-09 School Year by English Language Learner Status
2005 Total Cohort as of June of the 4th year of school and as of August 2009, 2004 Total Cohort as of June of the 5th year of school, 2003 Total Cohort as of June of the 6th year of school.
County District
COUNTY: ULSTER Ellenville Central School District
2005 Total Cohort - Aug 2009 Year Outcome All Students ELL Not ELL
2005 Total Cohort - 4 Year Outcome All Students ELL Not ELL
2004 Total Cohort - 5 Year Outcome All Students ELL Not ELL
2003 Total Cohort - 6 Year Outcome All Students ELL Not ELL
Highland Central School District
2005 Total Cohort - Aug 2009 Year Outcome All Students ELL Not ELL
2005 Total Cohort - 4 Year Outcome All Students ELL Not ELL
2004 Total Cohort - 5 Year Outcome All Students ELL Not ELL
2003 Total Cohort - 6 Year Outcome All Students ELL Not ELL
Kingston City School District
2005 Total Cohort - Aug 2009 Year Outcome All Students ELL Not ELL
2005 Total Cohort - 4 Year Outcome All Students ELL Not ELL
Count of Cohort Members
135 5
130
135 5
130
177 6
171
153 2
151
151 1
150
151 1
150
157 1
156
181 2
179
723 8
715
723 8
715
Graduated with Regents
or Local Diplomas
80% 80% 80%
76% 80% 76%
76% 83% 75%
75% # #
87% # #
87% # #
90% # #
80% # #
63% 38% 63%
60% 38% 60%
Earned IEP Diploma
1% 0% 1%
1% 0% 1%
1% 0% 1%
4% # #
0% # #
0% # #
1% # #
3% # #
2% 0% 2%
2% 0% 2%
Still Enrolled
7% 0% 7%
10% 0% 11%
2% 0% 2%
1% # #
8% # #
8% # #
5% # #
5% # #
11% 50% 10%
14% 50% 14%
Transferred to GED
Preparation Program
Dropped Out
0% 13% 0% 20% 0% 12%
0% 13% 0% 20% 0% 12%
0% 21% 0% 17% 0% 21%
1% 19% # # # #
0% 5% # # # #
0% 5% # # # #
1% 3% # # # #
0% 12% # # # #
0% 24% 0% 13% 0% 24%
0% 24% 0% 13% 0% 24%
Data presented in this report are based on data submitted by school districts to the data repository for the 2008-09 school year. Students are reported based on their date of entry in grade 9 and their last enrollment status as reported in the warehouse on July 31, 2009. The federal Family Education Rights and Privacy Act prohibits the release of personally identifiable student information. This Act precludes the publication of summary information based on fewer than five students or in which subtraction or other simple mathematical operations could be used to obtain personal information. Cells that contain the ("#") symbol have been suppressed to protect student privacy.
District-ell status Thursday, March 4, 2010 Page 264 of 301
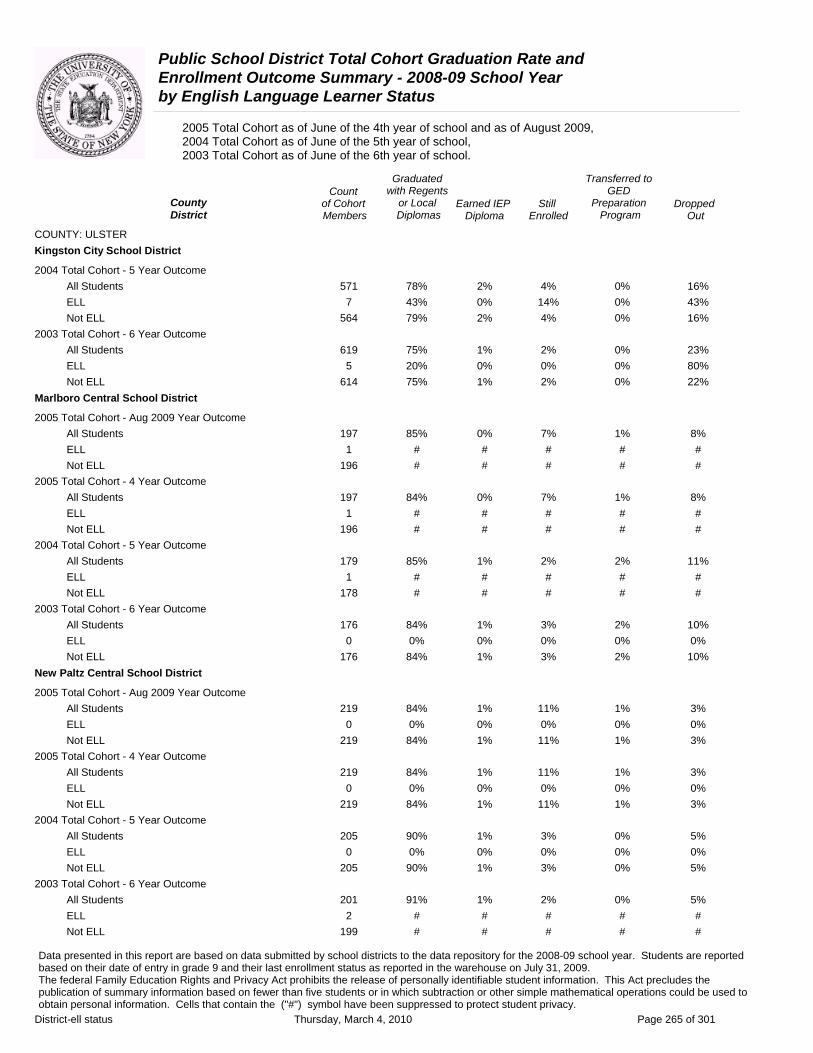
Public School District Total Cohort Graduation Rate and Enrollment Outcome Summary - 2008-09 School Year by English Language Learner Status
2005 Total Cohort as of June of the 4th year of school and as of August 2009, 2004 Total Cohort as of June of the 5th year of school, 2003 Total Cohort as of June of the 6th year of school.
Graduated Transferred to Count with Regents GED
County District
of Cohort Members
or Local Diplomas
Earned IEP Diploma
Still Enrolled
Preparation Program
Dropped Out
COUNTY: ULSTER Kingston City School District
2004 Total Cohort - 5 Year Outcome All Students 571 78% 2% 4% 0% 16% ELL 7 43% 0% 14% 0% 43% Not ELL 564 79% 2% 4% 0% 16%
2003 Total Cohort - 6 Year Outcome All Students 619 75% 1% 2% 0% 23% ELL 5 20% 0% 0% 0% 80% Not ELL 614 75% 1% 2% 0% 22%
Marlboro Central School District
2005 Total Cohort - Aug 2009 Year Outcome All Students 197 85% 0% 7% 1% 8% ELL 1 # # # # # Not ELL 196 # # # # #
2005 Total Cohort - 4 Year Outcome All Students 197 84% 0% 7% 1% 8% ELL 1 # # # # # Not ELL 196 # # # # #
2004 Total Cohort - 5 Year Outcome All Students 179 85% 1% 2% 2% 11% ELL 1 # # # # # Not ELL 178 # # # # #
2003 Total Cohort - 6 Year Outcome All Students 176 84% 1% 3% 2% 10% ELL 0 0% 0% 0% 0% 0% Not ELL 176 84% 1% 3% 2% 10%
New Paltz Central School District
2005 Total Cohort - Aug 2009 Year Outcome All Students 219 84% 1% 11% 1% 3% ELL 0 0% 0% 0% 0% 0% Not ELL 219 84% 1% 11% 1% 3%
2005 Total Cohort - 4 Year Outcome All Students 219 84% 1% 11% 1% 3% ELL 0 0% 0% 0% 0% 0% Not ELL 219 84% 1% 11% 1% 3%
2004 Total Cohort - 5 Year Outcome All Students 205 90% 1% 3% 0% 5% ELL 0 0% 0% 0% 0% 0% Not ELL 205 90% 1% 3% 0% 5%
2003 Total Cohort - 6 Year Outcome All Students 201 91% 1% 2% 0% 5% ELL 2 # # # # # Not ELL 199 # # # # #
Data presented in this report are based on data submitted by school districts to the data repository for the 2008-09 school year. Students are reported based on their date of entry in grade 9 and their last enrollment status as reported in the warehouse on July 31, 2009. The federal Family Education Rights and Privacy Act prohibits the release of personally identifiable student information. This Act precludes the publication of summary information based on fewer than five students or in which subtraction or other simple mathematical operations could be used to obtain personal information. Cells that contain the ("#") symbol have been suppressed to protect student privacy.
District-ell status Thursday, March 4, 2010 Page 265 of 301

Public School District Total Cohort Graduation Rate and Enrollment Outcome Summary - 2008-09 School Year by English Language Learner Status
2005 Total Cohort as of June of the 4th year of school and as of August 2009, 2004 Total Cohort as of June of the 5th year of school, 2003 Total Cohort as of June of the 6th year of school.
Graduated Transferred to Count with Regents GED
County of Cohort or Local Earned IEP Still Preparation DroppedDistrict Members Diplomas Diploma Enrolled Program Out
COUNTY: ULSTER Onteora Central School District
2005 Total Cohort - Aug 2009 Year Outcome All Students 205 78% 0% 8% 6% 8% ELL 0 0% 0% 0% 0% 0% Not ELL 205 78% 0% 8% 6% 8%
2005 Total Cohort - 4 Year Outcome All Students 205 73% 0% 13% 6% 8% ELL 0 0% 0% 0% 0% 0% Not ELL 205 73% 0% 13% 6% 8%
2004 Total Cohort - 5 Year Outcome All Students 198 80% 1% 7% 3% 10% ELL 2 # # # # # Not ELL 196 # # # # #
2003 Total Cohort - 6 Year Outcome All Students 203 82% 1% 4% 2% 11% ELL 0 0% 0% 0% 0% 0% Not ELL 203 82% 1% 4% 2% 11%
Rondout Valley Central School District
2005 Total Cohort - Aug 2009 Year Outcome All Students 257 80% 3% 5% 1% 11% ELL 0 0% 0% 0% 0% 0% Not ELL 257 80% 3% 5% 1% 11%
2005 Total Cohort - 4 Year Outcome All Students 257 77% 3% 8% 1% 11% ELL 0 0% 0% 0% 0% 0% Not ELL 257 77% 3% 8% 1% 11%
2004 Total Cohort - 5 Year Outcome All Students 268 80% 2% 1% 0% 17% ELL 2 # # # # # Not ELL 266 # # # # #
2003 Total Cohort - 6 Year Outcome All Students 264 74% 2% 1% 1% 22% ELL 1 # # # # # Not ELL 263 # # # # #
Saugerties Central School District
2005 Total Cohort - Aug 2009 Year Outcome All Students 292 79% 2% 5% 4% 9% ELL 0 0% 0% 0% 0% 0% Not ELL 292 79% 2% 5% 4% 9%
2005 Total Cohort - 4 Year Outcome All Students 292 77% 2% 7% 4% 9% ELL 0 0% 0% 0% 0% 0% Not ELL 292 77% 2% 7% 4% 9%
Data presented in this report are based on data submitted by school districts to the data repository for the 2008-09 school year. Students are reported based on their date of entry in grade 9 and their last enrollment status as reported in the warehouse on July 31, 2009. The federal Family Education Rights and Privacy Act prohibits the release of personally identifiable student information. This Act precludes the publication of summary information based on fewer than five students or in which subtraction or other simple mathematical operations could be used to obtain personal information. Cells that contain the ("#") symbol have been suppressed to protect student privacy.
District-ell status Thursday, March 4, 2010 Page 266 of 301
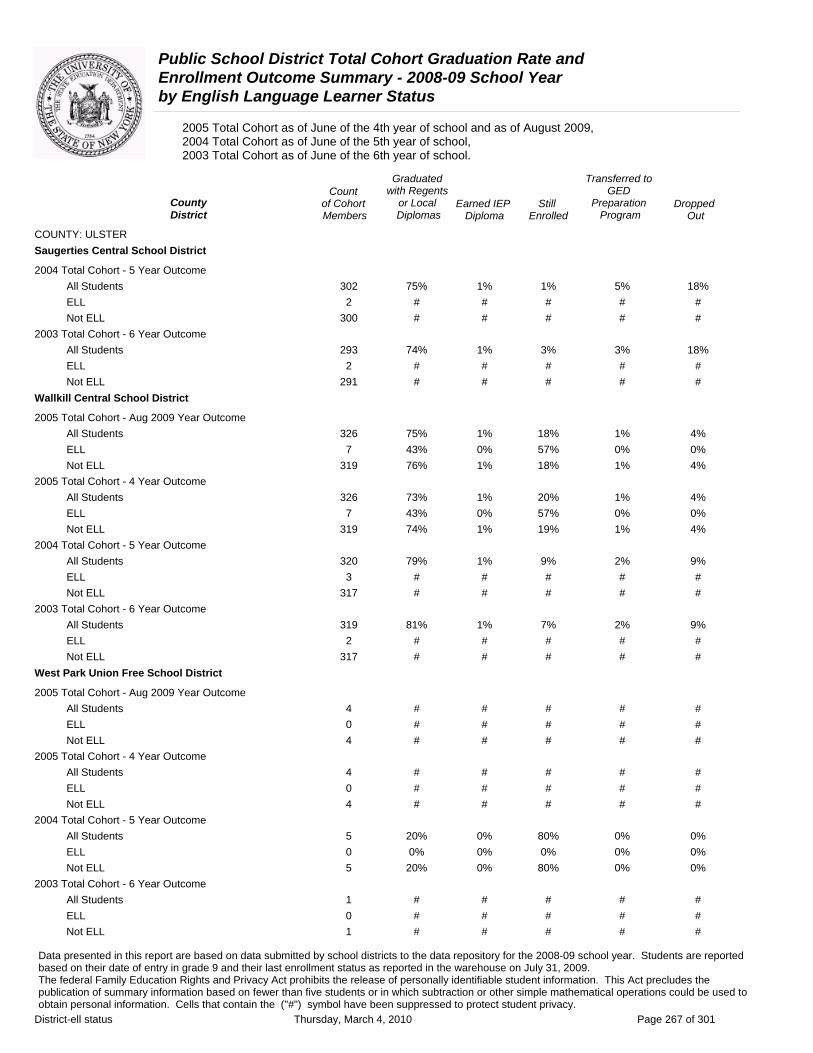
Public School District Total Cohort Graduation Rate and Enrollment Outcome Summary - 2008-09 School Year by English Language Learner Status
2005 Total Cohort as of June of the 4th year of school and as of August 2009, 2004 Total Cohort as of June of the 5th year of school, 2003 Total Cohort as of June of the 6th year of school.
Graduated Transferred to Count with Regents GED
County of Cohort or Local Earned IEP Still Preparation DroppedDistrict Members Diplomas Diploma Enrolled Program Out
COUNTY: ULSTER Saugerties Central School District
2004 Total Cohort - 5 Year Outcome All Students 302 75% 1% 1% 5% 18% ELL 2 # # # # # Not ELL 300 # # # # #
2003 Total Cohort - 6 Year Outcome All Students 293 74% 1% 3% 3% 18% ELL 2 # # # # # Not ELL 291 # # # # #
Wallkill Central School District
2005 Total Cohort - Aug 2009 Year Outcome All Students 326 75% 1% 18% 1% 4% ELL 7 43% 0% 57% 0% 0% Not ELL 319 76% 1% 18% 1% 4%
2005 Total Cohort - 4 Year Outcome All Students 326 73% 1% 20% 1% 4% ELL 7 43% 0% 57% 0% 0% Not ELL 319 74% 1% 19% 1% 4%
2004 Total Cohort - 5 Year Outcome All Students 320 79% 1% 9% 2% 9% ELL 3 # # # # # Not ELL 317 # # # # #
2003 Total Cohort - 6 Year Outcome All Students 319 81% 1% 7% 2% 9% ELL 2 # # # # # Not ELL 317 # # # # #
West Park Union Free School District
2005 Total Cohort - Aug 2009 Year Outcome All Students 4 # # # # # ELL 0 # # # # # Not ELL 4 # # # # #
2005 Total Cohort - 4 Year Outcome All Students 4 # # # # # ELL 0 # # # # # Not ELL 4 # # # # #
2004 Total Cohort - 5 Year Outcome All Students 5 20% 0% 80% 0% 0% ELL 0 0% 0% 0% 0% 0% Not ELL 5 20% 0% 80% 0% 0%
2003 Total Cohort - 6 Year Outcome All Students 1 # # # # # ELL 0 # # # # # Not ELL 1 # # # # #
Data presented in this report are based on data submitted by school districts to the data repository for the 2008-09 school year. Students are reported based on their date of entry in grade 9 and their last enrollment status as reported in the warehouse on July 31, 2009. The federal Family Education Rights and Privacy Act prohibits the release of personally identifiable student information. This Act precludes the publication of summary information based on fewer than five students or in which subtraction or other simple mathematical operations could be used to obtain personal information. Cells that contain the ("#") symbol have been suppressed to protect student privacy.
District-ell status Thursday, March 4, 2010 Page 267 of 301
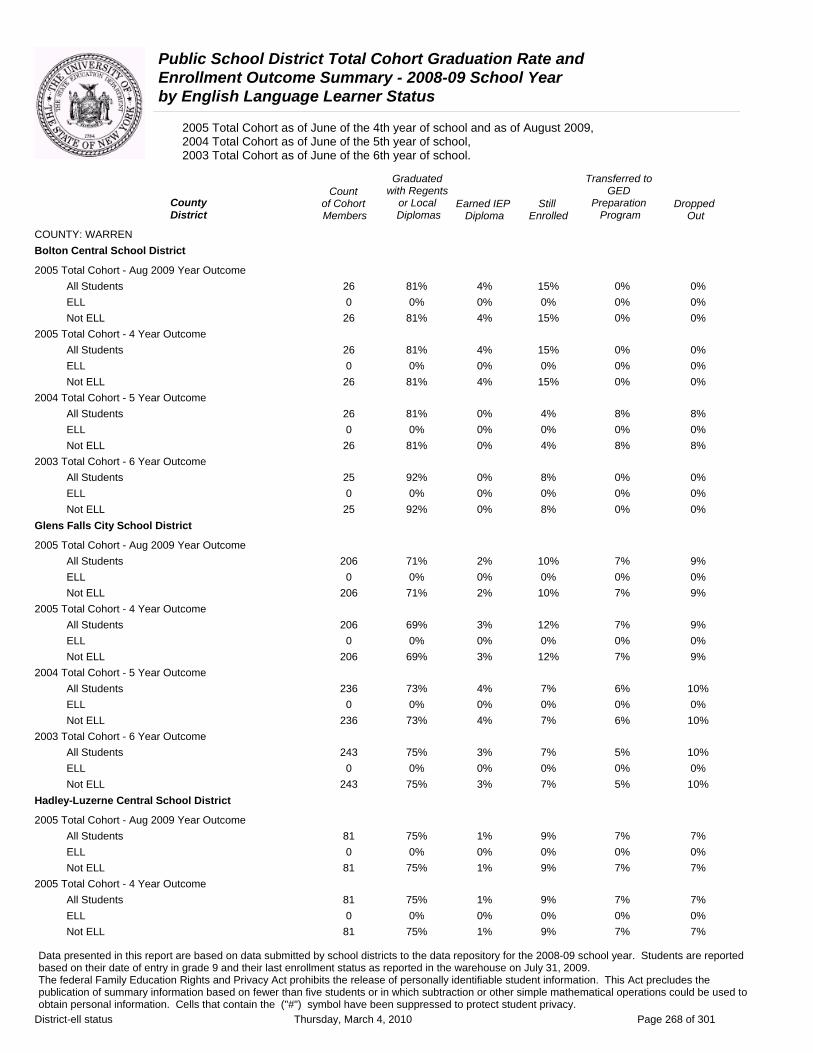
Public School District Total Cohort Graduation Rate and Enrollment Outcome Summary - 2008-09 School Year by English Language Learner Status
2005 Total Cohort as of June of the 4th year of school and as of August 2009, 2004 Total Cohort as of June of the 5th year of school, 2003 Total Cohort as of June of the 6th year of school.
Graduated Transferred to Count with Regents GED
County of Cohort or Local Earned IEP Still Preparation DroppedDistrict Members Diplomas Diploma Enrolled Program Out
COUNTY: WARREN Bolton Central School District
2005 Total Cohort - Aug 2009 Year Outcome All Students 26 81% 4% 15% 0% 0% ELL 0 0% 0% 0% 0% 0% Not ELL 26 81% 4% 15% 0% 0%
2005 Total Cohort - 4 Year Outcome All Students 26 81% 4% 15% 0% 0% ELL 0 0% 0% 0% 0% 0% Not ELL 26 81% 4% 15% 0% 0%
2004 Total Cohort - 5 Year Outcome All Students 26 81% 0% 4% 8% 8% ELL 0 0% 0% 0% 0% 0% Not ELL 26 81% 0% 4% 8% 8%
2003 Total Cohort - 6 Year Outcome All Students 25 92% 0% 8% 0% 0% ELL 0 0% 0% 0% 0% 0% Not ELL 25 92% 0% 8% 0% 0%
Glens Falls City School District
2005 Total Cohort - Aug 2009 Year Outcome All Students 206 71% 2% 10% 7% 9% ELL 0 0% 0% 0% 0% 0% Not ELL 206 71% 2% 10% 7% 9%
2005 Total Cohort - 4 Year Outcome All Students 206 69% 3% 12% 7% 9% ELL 0 0% 0% 0% 0% 0% Not ELL 206 69% 3% 12% 7% 9%
2004 Total Cohort - 5 Year Outcome All Students 236 73% 4% 7% 6% 10% ELL 0 0% 0% 0% 0% 0% Not ELL 236 73% 4% 7% 6% 10%
2003 Total Cohort - 6 Year Outcome All Students 243 75% 3% 7% 5% 10% ELL 0 0% 0% 0% 0% 0% Not ELL 243 75% 3% 7% 5% 10%
Hadley-Luzerne Central School District
2005 Total Cohort - Aug 2009 Year Outcome All Students 81 75% 1% 9% 7% 7% ELL 0 0% 0% 0% 0% 0% Not ELL 81 75% 1% 9% 7% 7%
2005 Total Cohort - 4 Year Outcome All Students 81 75% 1% 9% 7% 7% ELL 0 0% 0% 0% 0% 0% Not ELL 81 75% 1% 9% 7% 7%
Data presented in this report are based on data submitted by school districts to the data repository for the 2008-09 school year. Students are reported based on their date of entry in grade 9 and their last enrollment status as reported in the warehouse on July 31, 2009. The federal Family Education Rights and Privacy Act prohibits the release of personally identifiable student information. This Act precludes the publication of summary information based on fewer than five students or in which subtraction or other simple mathematical operations could be used to obtain personal information. Cells that contain the ("#") symbol have been suppressed to protect student privacy.
District-ell status Thursday, March 4, 2010 Page 268 of 301
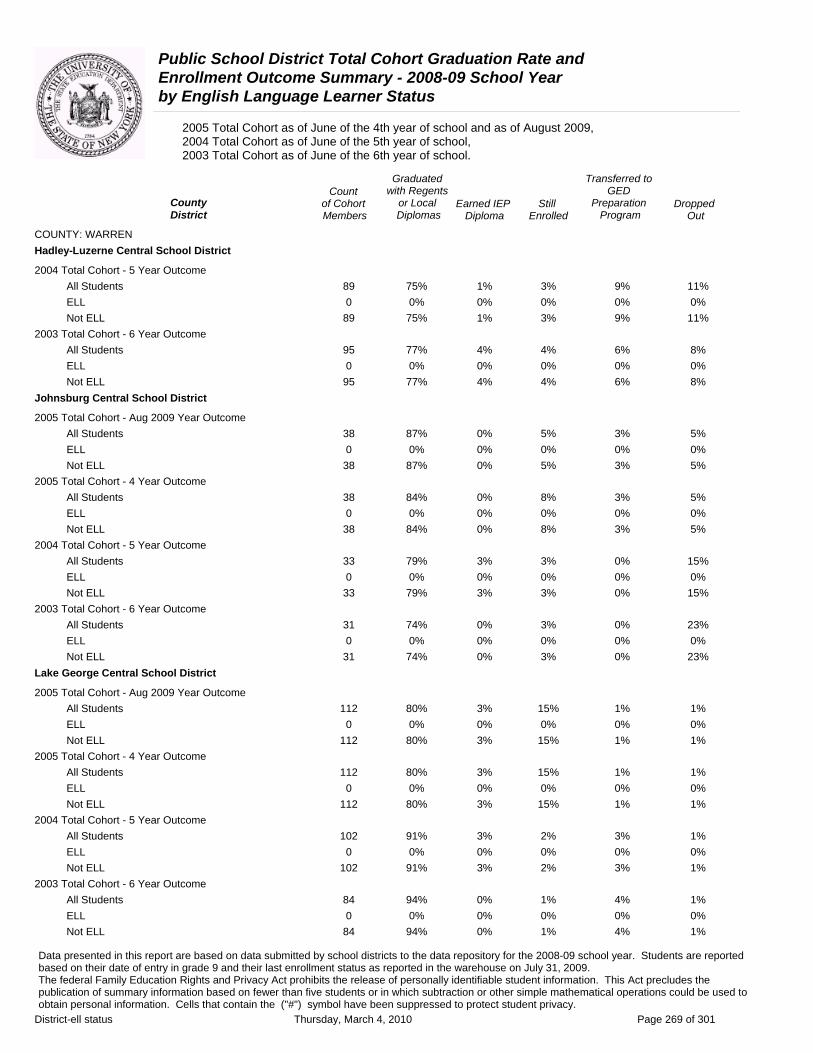
Public School District Total Cohort Graduation Rate and Enrollment Outcome Summary - 2008-09 School Year by English Language Learner Status
2005 Total Cohort as of June of the 4th year of school and as of August 2009, 2004 Total Cohort as of June of the 5th year of school, 2003 Total Cohort as of June of the 6th year of school.
Graduated Transferred to Count with Regents GED
County of Cohort or Local Earned IEP Still Preparation DroppedDistrict Members Diplomas Diploma Enrolled Program Out
COUNTY: WARREN Hadley-Luzerne Central School District
2004 Total Cohort - 5 Year Outcome All Students 89 75% 1% 3% 9% 11% ELL 0 0% 0% 0% 0% 0% Not ELL 89 75% 1% 3% 9% 11%
2003 Total Cohort - 6 Year Outcome All Students 95 77% 4% 4% 6% 8% ELL 0 0% 0% 0% 0% 0% Not ELL 95 77% 4% 4% 6% 8%
Johnsburg Central School District
2005 Total Cohort - Aug 2009 Year Outcome All Students 38 87% 0% 5% 3% 5% ELL 0 0% 0% 0% 0% 0% Not ELL 38 87% 0% 5% 3% 5%
2005 Total Cohort - 4 Year Outcome All Students 38 84% 0% 8% 3% 5% ELL 0 0% 0% 0% 0% 0% Not ELL 38 84% 0% 8% 3% 5%
2004 Total Cohort - 5 Year Outcome All Students 33 79% 3% 3% 0% 15% ELL 0 0% 0% 0% 0% 0% Not ELL 33 79% 3% 3% 0% 15%
2003 Total Cohort - 6 Year Outcome All Students 31 74% 0% 3% 0% 23% ELL 0 0% 0% 0% 0% 0% Not ELL 31 74% 0% 3% 0% 23%
Lake George Central School District
2005 Total Cohort - Aug 2009 Year Outcome All Students 112 80% 3% 15% 1% 1% ELL 0 0% 0% 0% 0% 0% Not ELL 112 80% 3% 15% 1% 1%
2005 Total Cohort - 4 Year Outcome All Students 112 80% 3% 15% 1% 1% ELL 0 0% 0% 0% 0% 0% Not ELL 112 80% 3% 15% 1% 1%
2004 Total Cohort - 5 Year Outcome All Students 102 91% 3% 2% 3% 1% ELL 0 0% 0% 0% 0% 0% Not ELL 102 91% 3% 2% 3% 1%
2003 Total Cohort - 6 Year Outcome All Students 84 94% 0% 1% 4% 1% ELL 0 0% 0% 0% 0% 0% Not ELL 84 94% 0% 1% 4% 1%
Data presented in this report are based on data submitted by school districts to the data repository for the 2008-09 school year. Students are reported based on their date of entry in grade 9 and their last enrollment status as reported in the warehouse on July 31, 2009. The federal Family Education Rights and Privacy Act prohibits the release of personally identifiable student information. This Act precludes the publication of summary information based on fewer than five students or in which subtraction or other simple mathematical operations could be used to obtain personal information. Cells that contain the ("#") symbol have been suppressed to protect student privacy.
District-ell status Thursday, March 4, 2010 Page 269 of 301
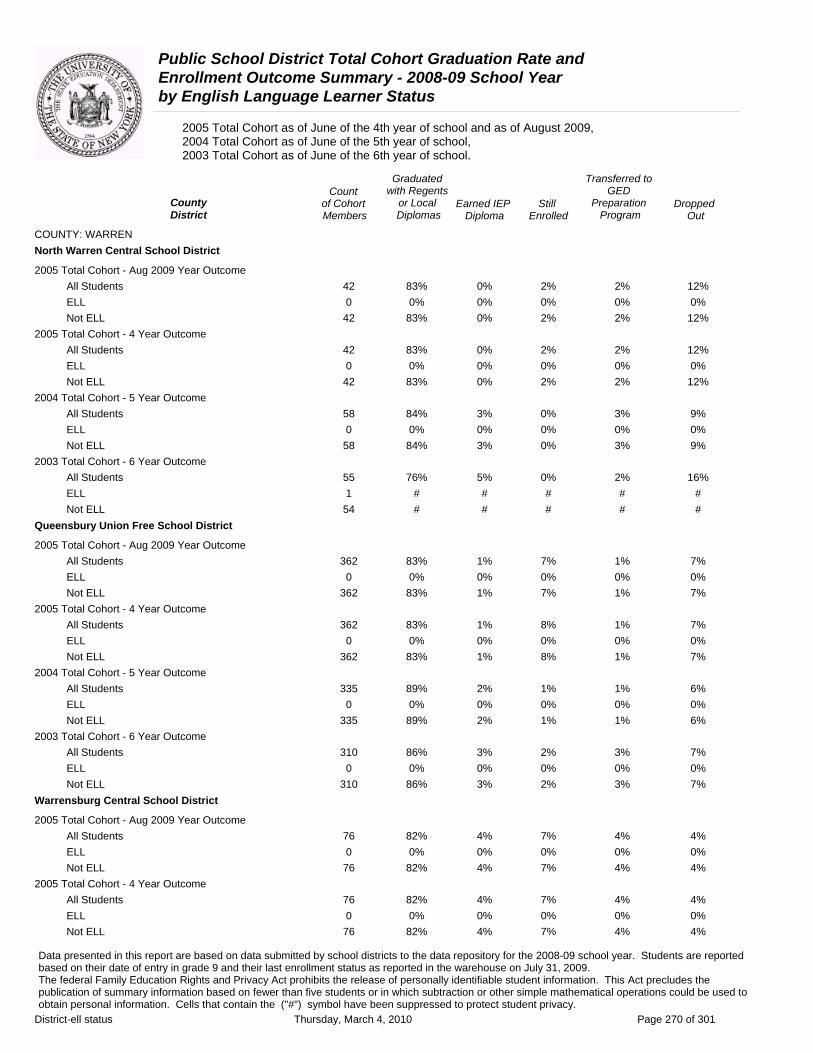
Public School District Total Cohort Graduation Rate and Enrollment Outcome Summary - 2008-09 School Year by English Language Learner Status
2005 Total Cohort as of June of the 4th year of school and as of August 2009, 2004 Total Cohort as of June of the 5th year of school, 2003 Total Cohort as of June of the 6th year of school.
Graduated Transferred to Count with Regents GED
County of Cohort or Local Earned IEP Still Preparation DroppedDistrict Members Diplomas Diploma Enrolled Program Out
COUNTY: WARREN North Warren Central School District
2005 Total Cohort - Aug 2009 Year Outcome All Students 42 83% 0% 2% 2% 12% ELL 0 0% 0% 0% 0% 0% Not ELL 42 83% 0% 2% 2% 12%
2005 Total Cohort - 4 Year Outcome All Students 42 83% 0% 2% 2% 12% ELL 0 0% 0% 0% 0% 0% Not ELL 42 83% 0% 2% 2% 12%
2004 Total Cohort - 5 Year Outcome All Students 58 84% 3% 0% 3% 9% ELL 0 0% 0% 0% 0% 0% Not ELL 58 84% 3% 0% 3% 9%
2003 Total Cohort - 6 Year Outcome All Students 55 76% 5% 0% 2% 16% ELL 1 # # # # # Not ELL 54 # # # # #
Queensbury Union Free School District
2005 Total Cohort - Aug 2009 Year Outcome All Students 362 83% 1% 7% 1% 7% ELL 0 0% 0% 0% 0% 0% Not ELL 362 83% 1% 7% 1% 7%
2005 Total Cohort - 4 Year Outcome All Students 362 83% 1% 8% 1% 7% ELL 0 0% 0% 0% 0% 0% Not ELL 362 83% 1% 8% 1% 7%
2004 Total Cohort - 5 Year Outcome All Students 335 89% 2% 1% 1% 6% ELL 0 0% 0% 0% 0% 0% Not ELL 335 89% 2% 1% 1% 6%
2003 Total Cohort - 6 Year Outcome All Students 310 86% 3% 2% 3% 7% ELL 0 0% 0% 0% 0% 0% Not ELL 310 86% 3% 2% 3% 7%
Warrensburg Central School District
2005 Total Cohort - Aug 2009 Year Outcome All Students 76 82% 4% 7% 4% 4% ELL 0 0% 0% 0% 0% 0% Not ELL 76 82% 4% 7% 4% 4%
2005 Total Cohort - 4 Year Outcome All Students 76 82% 4% 7% 4% 4% ELL 0 0% 0% 0% 0% 0% Not ELL 76 82% 4% 7% 4% 4%
Data presented in this report are based on data submitted by school districts to the data repository for the 2008-09 school year. Students are reported based on their date of entry in grade 9 and their last enrollment status as reported in the warehouse on July 31, 2009. The federal Family Education Rights and Privacy Act prohibits the release of personally identifiable student information. This Act precludes the publication of summary information based on fewer than five students or in which subtraction or other simple mathematical operations could be used to obtain personal information. Cells that contain the ("#") symbol have been suppressed to protect student privacy.
District-ell status Thursday, March 4, 2010 Page 270 of 301

Public School District Total Cohort Graduation Rate and Enrollment Outcome Summary - 2008-09 School Year by English Language Learner Status
2005 Total Cohort as of June of the 4th year of school and as of August 2009, 2004 Total Cohort as of June of the 5th year of school, 2003 Total Cohort as of June of the 6th year of school.
Graduated Transferred to Count with Regents GED
County of Cohort or Local Earned IEP Still Preparation DroppedDistrict Members Diplomas Diploma Enrolled Program Out
COUNTY: WARREN Warrensburg Central School District
2004 Total Cohort - 5 Year Outcome All Students 94 87% 4% 6% 0% 2% ELL 0 0% 0% 0% 0% 0% Not ELL 94 87% 4% 6% 0% 2%
2003 Total Cohort - 6 Year Outcome All Students 72 78% 4% 3% 0% 15% ELL 0 0% 0% 0% 0% 0% Not ELL 72 78% 4% 3% 0% 15%
Data presented in this report are based on data submitted by school districts to the data repository for the 2008-09 school year. Students are reported based on their date of entry in grade 9 and their last enrollment status as reported in the warehouse on July 31, 2009. The federal Family Education Rights and Privacy Act prohibits the release of personally identifiable student information. This Act precludes the publication of summary information based on fewer than five students or in which subtraction or other simple mathematical operations could be used to obtain personal information. Cells that contain the ("#") symbol have been suppressed to protect student privacy.
District-ell status Thursday, March 4, 2010 Page 271 of 301

Public School District Total Cohort Graduation Rate and Enrollment Outcome Summary - 2008-09 School Year by English Language Learner Status
2005 Total Cohort as of June of the 4th year of school and as of August 2009, 2004 Total Cohort as of June of the 5th year of school, 2003 Total Cohort as of June of the 6th year of school.
Graduated Transferred to Count with Regents GED
County of Cohort or Local Earned IEP Still Preparation DroppedDistrict Members Diplomas Diploma Enrolled Program Out
COUNTY: WASHINGTON Argyle Central School District
2005 Total Cohort - Aug 2009 Year Outcome All Students 71 89% 4% 6% 0% 1% ELL 0 0% 0% 0% 0% 0% Not ELL 71 89% 4% 6% 0% 1%
2005 Total Cohort - 4 Year Outcome All Students 71 87% 4% 7% 0% 1% ELL 0 0% 0% 0% 0% 0% Not ELL 71 87% 4% 7% 0% 1%
2004 Total Cohort - 5 Year Outcome All Students 55 85% 4% 2% 0% 9% ELL 0 0% 0% 0% 0% 0% Not ELL 55 85% 4% 2% 0% 9%
2003 Total Cohort - 6 Year Outcome All Students 69 83% 3% 1% 3% 10% ELL 0 0% 0% 0% 0% 0% Not ELL 69 83% 3% 1% 3% 10%
Cambridge Central School District
2005 Total Cohort - Aug 2009 Year Outcome All Students 87 85% 2% 0% 10% 2% ELL 0 0% 0% 0% 0% 0% Not ELL 87 85% 2% 0% 10% 2%
2005 Total Cohort - 4 Year Outcome All Students 87 85% 2% 0% 10% 2% ELL 0 0% 0% 0% 0% 0% Not ELL 87 85% 2% 0% 10% 2%
2004 Total Cohort - 5 Year Outcome All Students 117 83% 4% 0% 9% 4% ELL 0 0% 0% 0% 0% 0% Not ELL 117 83% 4% 0% 9% 4%
2003 Total Cohort - 6 Year Outcome All Students 100 82% 8% 1% 5% 4% ELL 0 0% 0% 0% 0% 0% Not ELL 100 82% 8% 1% 5% 4%
Fort Ann Central School District
2005 Total Cohort - Aug 2009 Year Outcome All Students 49 73% 2% 14% 0% 10% ELL 0 0% 0% 0% 0% 0% Not ELL 49 73% 2% 14% 0% 10%
2005 Total Cohort - 4 Year Outcome All Students 49 73% 2% 14% 0% 10% ELL 0 0% 0% 0% 0% 0% Not ELL 49 73% 2% 14% 0% 10%
Data presented in this report are based on data submitted by school districts to the data repository for the 2008-09 school year. Students are reported based on their date of entry in grade 9 and their last enrollment status as reported in the warehouse on July 31, 2009. The federal Family Education Rights and Privacy Act prohibits the release of personally identifiable student information. This Act precludes the publication of summary information based on fewer than five students or in which subtraction or other simple mathematical operations could be used to obtain personal information. Cells that contain the ("#") symbol have been suppressed to protect student privacy.
District-ell status Thursday, March 4, 2010 Page 272 of 301

Public School District Total Cohort Graduation Rate and Enrollment Outcome Summary - 2008-09 School Year by English Language Learner Status
2005 Total Cohort as of June of the 4th year of school and as of August 2009, 2004 Total Cohort as of June of the 5th year of school, 2003 Total Cohort as of June of the 6th year of school.
Graduated Transferred to Count with Regents GED
County of Cohort or Local Earned IEP Still Preparation DroppedDistrict Members Diplomas Diploma Enrolled Program Out
COUNTY: WASHINGTON Fort Ann Central School District
2004 Total Cohort - 5 Year Outcome All Students 49 84% 0% 6% 0% 10% ELL 0 0% 0% 0% 0% 0% Not ELL 49 84% 0% 6% 0% 10%
2003 Total Cohort - 6 Year Outcome All Students 65 83% 3% 0% 2% 12% ELL 0 0% 0% 0% 0% 0% Not ELL 65 83% 3% 0% 2% 12%
Fort Edward Union Free School District
2005 Total Cohort - Aug 2009 Year Outcome All Students 32 59% 6% 22% 0% 13% ELL 0 0% 0% 0% 0% 0% Not ELL 32 59% 6% 22% 0% 13%
2005 Total Cohort - 4 Year Outcome All Students 32 59% 6% 22% 0% 13% ELL 0 0% 0% 0% 0% 0% Not ELL 32 59% 6% 22% 0% 13%
2004 Total Cohort - 5 Year Outcome All Students 45 69% 2% 7% 2% 20% ELL 0 0% 0% 0% 0% 0% Not ELL 45 69% 2% 7% 2% 20%
2003 Total Cohort - 6 Year Outcome All Students 40 73% 15% 5% 0% 8% ELL 0 0% 0% 0% 0% 0% Not ELL 40 73% 15% 5% 0% 8%
Granville Central School District
2005 Total Cohort - Aug 2009 Year Outcome All Students 146 77% 1% 9% 1% 12% ELL 0 0% 0% 0% 0% 0% Not ELL 146 77% 1% 9% 1% 12%
2005 Total Cohort - 4 Year Outcome All Students 146 77% 1% 10% 1% 12% ELL 0 0% 0% 0% 0% 0% Not ELL 146 77% 1% 10% 1% 12%
2004 Total Cohort - 5 Year Outcome All Students 122 71% 3% 13% 0% 12% ELL 0 0% 0% 0% 0% 0% Not ELL 122 71% 3% 13% 0% 12%
2003 Total Cohort - 6 Year Outcome All Students 151 83% 0% 7% 1% 9% ELL 0 0% 0% 0% 0% 0% Not ELL 151 83% 0% 7% 1% 9%
Data presented in this report are based on data submitted by school districts to the data repository for the 2008-09 school year. Students are reported based on their date of entry in grade 9 and their last enrollment status as reported in the warehouse on July 31, 2009. The federal Family Education Rights and Privacy Act prohibits the release of personally identifiable student information. This Act precludes the publication of summary information based on fewer than five students or in which subtraction or other simple mathematical operations could be used to obtain personal information. Cells that contain the ("#") symbol have been suppressed to protect student privacy.
District-ell status Thursday, March 4, 2010 Page 273 of 301
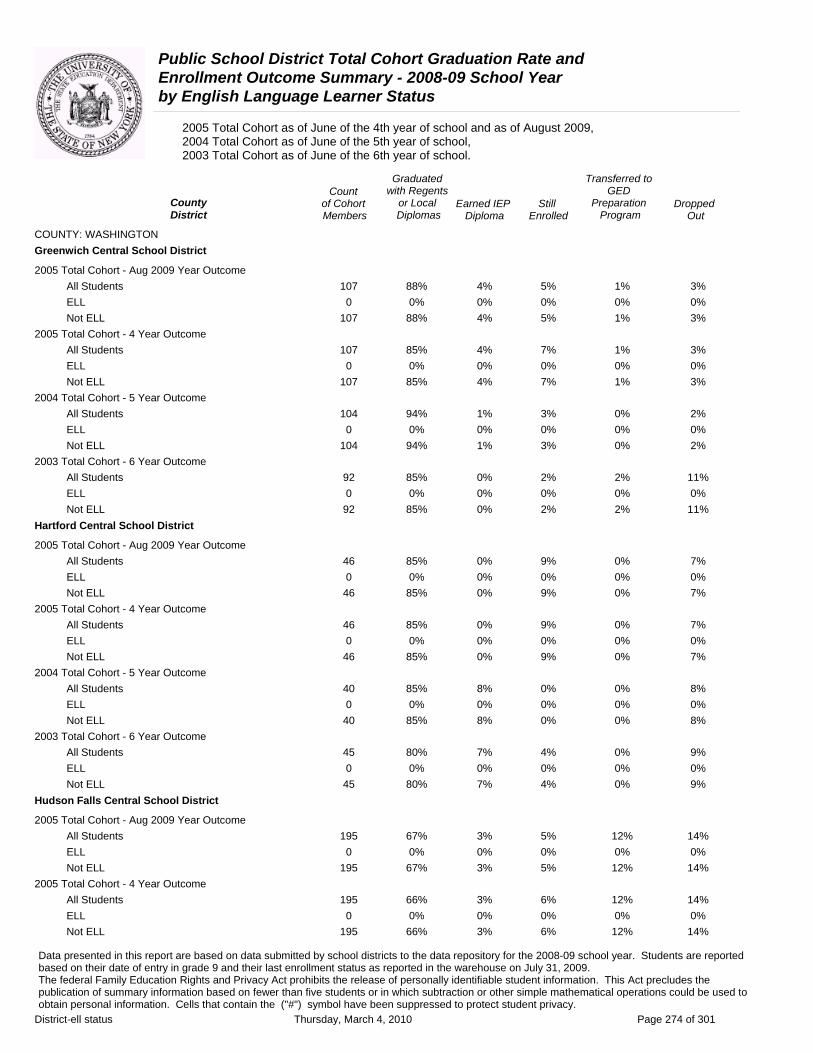
Public School District Total Cohort Graduation Rate and Enrollment Outcome Summary - 2008-09 School Year by English Language Learner Status
2005 Total Cohort as of June of the 4th year of school and as of August 2009, 2004 Total Cohort as of June of the 5th year of school, 2003 Total Cohort as of June of the 6th year of school.
Graduated Transferred to Count with Regents GED
County of Cohort or Local Earned IEP Still Preparation DroppedDistrict Members Diplomas Diploma Enrolled Program Out
COUNTY: WASHINGTON Greenwich Central School District
2005 Total Cohort - Aug 2009 Year Outcome All Students 107 88% 4% 5% 1% 3% ELL 0 0% 0% 0% 0% 0% Not ELL 107 88% 4% 5% 1% 3%
2005 Total Cohort - 4 Year Outcome All Students 107 85% 4% 7% 1% 3% ELL 0 0% 0% 0% 0% 0% Not ELL 107 85% 4% 7% 1% 3%
2004 Total Cohort - 5 Year Outcome All Students 104 94% 1% 3% 0% 2% ELL 0 0% 0% 0% 0% 0% Not ELL 104 94% 1% 3% 0% 2%
2003 Total Cohort - 6 Year Outcome All Students 92 85% 0% 2% 2% 11% ELL 0 0% 0% 0% 0% 0% Not ELL 92 85% 0% 2% 2% 11%
Hartford Central School District
2005 Total Cohort - Aug 2009 Year Outcome All Students 46 85% 0% 9% 0% 7% ELL 0 0% 0% 0% 0% 0% Not ELL 46 85% 0% 9% 0% 7%
2005 Total Cohort - 4 Year Outcome All Students 46 85% 0% 9% 0% 7% ELL 0 0% 0% 0% 0% 0% Not ELL 46 85% 0% 9% 0% 7%
2004 Total Cohort - 5 Year Outcome All Students 40 85% 8% 0% 0% 8% ELL 0 0% 0% 0% 0% 0% Not ELL 40 85% 8% 0% 0% 8%
2003 Total Cohort - 6 Year Outcome All Students 45 80% 7% 4% 0% 9% ELL 0 0% 0% 0% 0% 0% Not ELL 45 80% 7% 4% 0% 9%
Hudson Falls Central School District
2005 Total Cohort - Aug 2009 Year Outcome All Students 195 67% 3% 5% 12% 14% ELL 0 0% 0% 0% 0% 0% Not ELL 195 67% 3% 5% 12% 14%
2005 Total Cohort - 4 Year Outcome All Students 195 66% 3% 6% 12% 14% ELL 0 0% 0% 0% 0% 0% Not ELL 195 66% 3% 6% 12% 14%
Data presented in this report are based on data submitted by school districts to the data repository for the 2008-09 school year. Students are reported based on their date of entry in grade 9 and their last enrollment status as reported in the warehouse on July 31, 2009. The federal Family Education Rights and Privacy Act prohibits the release of personally identifiable student information. This Act precludes the publication of summary information based on fewer than five students or in which subtraction or other simple mathematical operations could be used to obtain personal information. Cells that contain the ("#") symbol have been suppressed to protect student privacy.
District-ell status Thursday, March 4, 2010 Page 274 of 301

Public School District Total Cohort Graduation Rate and Enrollment Outcome Summary - 2008-09 School Year by English Language Learner Status
2005 Total Cohort as of June of the 4th year of school and as of August 2009, 2004 Total Cohort as of June of the 5th year of school, 2003 Total Cohort as of June of the 6th year of school.
Graduated Transferred to Count with Regents GED
County of Cohort or Local Earned IEP Still Preparation DroppedDistrict Members Diplomas Diploma Enrolled Program Out
COUNTY: WASHINGTON Hudson Falls Central School District
2004 Total Cohort - 5 Year Outcome All Students 175 73% 5% 2% 6% 14% ELL 0 0% 0% 0% 0% 0% Not ELL 175 73% 5% 2% 6% 14%
2003 Total Cohort - 6 Year Outcome All Students 181 72% 7% 1% 6% 14% ELL 0 0% 0% 0% 0% 0% Not ELL 181 72% 7% 1% 6% 14%
Salem Central School District
2005 Total Cohort - Aug 2009 Year Outcome All Students 55 67% 0% 13% 0% 20% ELL 0 0% 0% 0% 0% 0% Not ELL 55 67% 0% 13% 0% 20%
2005 Total Cohort - 4 Year Outcome All Students 55 65% 0% 15% 0% 20% ELL 0 0% 0% 0% 0% 0% Not ELL 55 65% 0% 15% 0% 20%
2004 Total Cohort - 5 Year Outcome All Students 63 83% 0% 5% 2% 11% ELL 0 0% 0% 0% 0% 0% Not ELL 63 83% 0% 5% 2% 11%
2003 Total Cohort - 6 Year Outcome All Students 53 79% 6% 6% 2% 8% ELL 0 0% 0% 0% 0% 0% Not ELL 53 79% 6% 6% 2% 8%
Whitehall Central School District
2005 Total Cohort - Aug 2009 Year Outcome All Students 70 73% 0% 21% 0% 6% ELL 0 0% 0% 0% 0% 0% Not ELL 70 73% 0% 21% 0% 6%
2005 Total Cohort - 4 Year Outcome All Students 70 73% 0% 21% 0% 6% ELL 0 0% 0% 0% 0% 0% Not ELL 70 73% 0% 21% 0% 6%
2004 Total Cohort - 5 Year Outcome All Students 76 71% 0% 12% 7% 11% ELL 0 0% 0% 0% 0% 0% Not ELL 76 71% 0% 12% 7% 11%
2003 Total Cohort - 6 Year Outcome All Students 68 79% 1% 4% 3% 12% ELL 0 0% 0% 0% 0% 0% Not ELL 68 79% 1% 4% 3% 12%
Data presented in this report are based on data submitted by school districts to the data repository for the 2008-09 school year. Students are reported based on their date of entry in grade 9 and their last enrollment status as reported in the warehouse on July 31, 2009. The federal Family Education Rights and Privacy Act prohibits the release of personally identifiable student information. This Act precludes the publication of summary information based on fewer than five students or in which subtraction or other simple mathematical operations could be used to obtain personal information. Cells that contain the ("#") symbol have been suppressed to protect student privacy.
District-ell status Thursday, March 4, 2010 Page 275 of 301

Public School District Total Cohort Graduation Rate and Enrollment Outcome Summary - 2008-09 School Year by English Language Learner Status
2005 Total Cohort as of June of the 4th year of school and as of August 2009, 2004 Total Cohort as of June of the 5th year of school, 2003 Total Cohort as of June of the 6th year of school.
Graduated Transferred to Count with Regents GED
County of Cohort or Local Earned IEP Still Preparation DroppedDistrict Members Diplomas Diploma Enrolled Program Out
COUNTY: WAYNE Clyde-Savannah Central School District
2005 Total Cohort - Aug 2009 Year Outcome All Students 86 80% 2% 6% 2% 9% ELL 0 0% 0% 0% 0% 0% Not ELL 86 80% 2% 6% 2% 9%
2005 Total Cohort - 4 Year Outcome All Students 86 80% 2% 6% 2% 9% ELL 0 0% 0% 0% 0% 0% Not ELL 86 80% 2% 6% 2% 9%
2004 Total Cohort - 5 Year Outcome All Students 84 75% 4% 0% 7% 14% ELL 0 0% 0% 0% 0% 0% Not ELL 84 75% 4% 0% 7% 14%
2003 Total Cohort - 6 Year Outcome All Students 81 72% 7% 2% 1% 17% ELL 1 # # # # # Not ELL 80 # # # # #
Gananda Central School District
2005 Total Cohort - Aug 2009 Year Outcome All Students 77 79% 3% 6% 8% 4% ELL 0 0% 0% 0% 0% 0% Not ELL 77 79% 3% 6% 8% 4%
2005 Total Cohort - 4 Year Outcome All Students 77 78% 3% 8% 8% 4% ELL 0 0% 0% 0% 0% 0% Not ELL 77 78% 3% 8% 8% 4%
2004 Total Cohort - 5 Year Outcome All Students 71 85% 0% 4% 7% 4% ELL 0 0% 0% 0% 0% 0% Not ELL 71 85% 0% 4% 7% 4%
2003 Total Cohort - 6 Year Outcome All Students 88 78% 6% 1% 11% 3% ELL 0 0% 0% 0% 0% 0% Not ELL 88 78% 6% 1% 11% 3%
Lyons Central School District
2005 Total Cohort - Aug 2009 Year Outcome All Students 95 68% 9% 7% 4% 11% ELL 3 # # # # # Not ELL 92 # # # # #
2005 Total Cohort - 4 Year Outcome All Students 95 66% 9% 9% 4% 11% ELL 3 # # # # # Not ELL 92 # # # # #
Data presented in this report are based on data submitted by school districts to the data repository for the 2008-09 school year. Students are reported based on their date of entry in grade 9 and their last enrollment status as reported in the warehouse on July 31, 2009. The federal Family Education Rights and Privacy Act prohibits the release of personally identifiable student information. This Act precludes the publication of summary information based on fewer than five students or in which subtraction or other simple mathematical operations could be used to obtain personal information. Cells that contain the ("#") symbol have been suppressed to protect student privacy.
District-ell status Thursday, March 4, 2010 Page 276 of 301
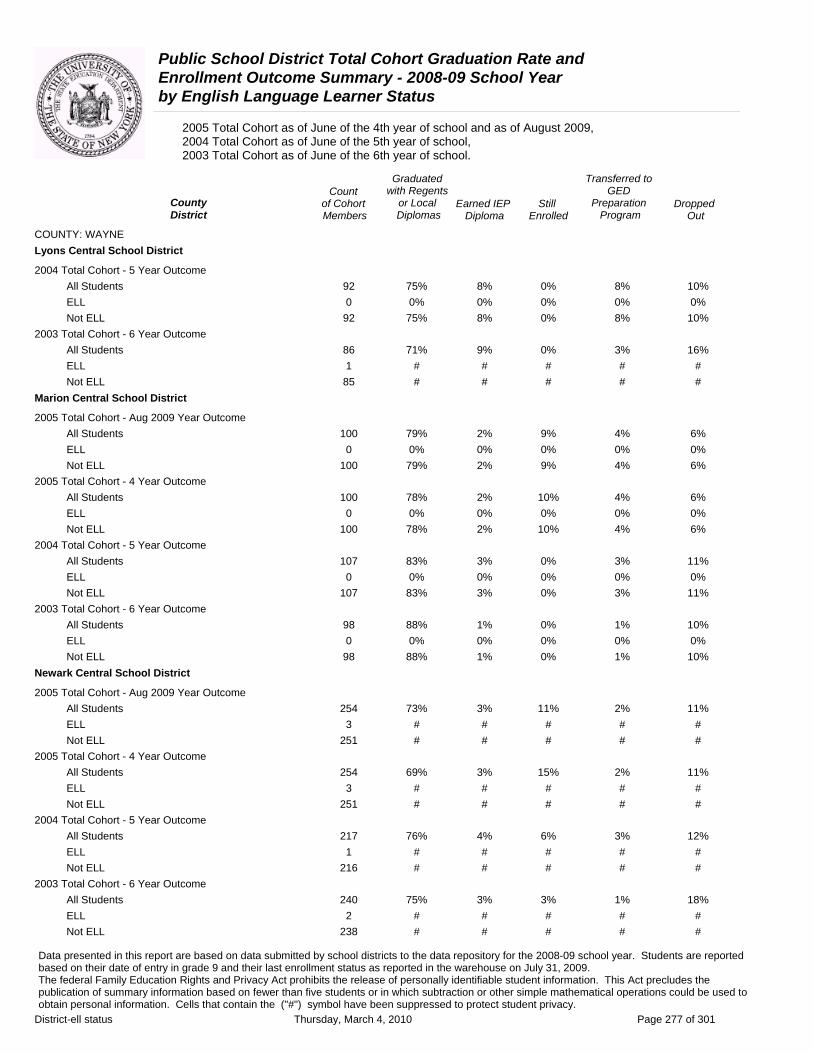
Public School District Total Cohort Graduation Rate and Enrollment Outcome Summary - 2008-09 School Year by English Language Learner Status
2005 Total Cohort as of June of the 4th year of school and as of August 2009, 2004 Total Cohort as of June of the 5th year of school, 2003 Total Cohort as of June of the 6th year of school.
Graduated Transferred to Count with Regents GED
County of Cohort or Local Earned IEP Still Preparation DroppedDistrict Members Diplomas Diploma Enrolled Program Out
COUNTY: WAYNE Lyons Central School District
2004 Total Cohort - 5 Year Outcome All Students 92 75% 8% 0% 8% 10% ELL 0 0% 0% 0% 0% 0% Not ELL 92 75% 8% 0% 8% 10%
2003 Total Cohort - 6 Year Outcome All Students 86 71% 9% 0% 3% 16% ELL 1 # # # # # Not ELL 85 # # # # #
Marion Central School District
2005 Total Cohort - Aug 2009 Year Outcome All Students 100 79% 2% 9% 4% 6% ELL 0 0% 0% 0% 0% 0% Not ELL 100 79% 2% 9% 4% 6%
2005 Total Cohort - 4 Year Outcome All Students 100 78% 2% 10% 4% 6% ELL 0 0% 0% 0% 0% 0% Not ELL 100 78% 2% 10% 4% 6%
2004 Total Cohort - 5 Year Outcome All Students 107 83% 3% 0% 3% 11% ELL 0 0% 0% 0% 0% 0% Not ELL 107 83% 3% 0% 3% 11%
2003 Total Cohort - 6 Year Outcome All Students 98 88% 1% 0% 1% 10% ELL 0 0% 0% 0% 0% 0% Not ELL 98 88% 1% 0% 1% 10%
Newark Central School District
2005 Total Cohort - Aug 2009 Year Outcome All Students 254 73% 3% 11% 2% 11% ELL 3 # # # # # Not ELL 251 # # # # #
2005 Total Cohort - 4 Year Outcome All Students 254 69% 3% 15% 2% 11% ELL 3 # # # # # Not ELL 251 # # # # #
2004 Total Cohort - 5 Year Outcome All Students 217 76% 4% 6% 3% 12% ELL 1 # # # # # Not ELL 216 # # # # #
2003 Total Cohort - 6 Year Outcome All Students 240 75% 3% 3% 1% 18% ELL 2 # # # # # Not ELL 238 # # # # #
Data presented in this report are based on data submitted by school districts to the data repository for the 2008-09 school year. Students are reported based on their date of entry in grade 9 and their last enrollment status as reported in the warehouse on July 31, 2009. The federal Family Education Rights and Privacy Act prohibits the release of personally identifiable student information. This Act precludes the publication of summary information based on fewer than five students or in which subtraction or other simple mathematical operations could be used to obtain personal information. Cells that contain the ("#") symbol have been suppressed to protect student privacy.
District-ell status Thursday, March 4, 2010 Page 277 of 301

Public School District Total Cohort Graduation Rate and Enrollment Outcome Summary - 2008-09 School Year by English Language Learner Status
2005 Total Cohort as of June of the 4th year of school and as of August 2009, 2004 Total Cohort as of June of the 5th year of school, 2003 Total Cohort as of June of the 6th year of school.
Graduated Transferred to Count with Regents GED
County of Cohort or Local Earned IEP Still Preparation DroppedDistrict Members Diplomas Diploma Enrolled Program Out
COUNTY: WAYNE North Rose-Wolcott Central School District
2005 Total Cohort - Aug 2009 Year Outcome All Students 133 71% 4% 11% 0% 15% ELL 0 0% 0% 0% 0% 0% Not ELL 133 71% 4% 11% 0% 15%
2005 Total Cohort - 4 Year Outcome All Students 133 68% 4% 14% 0% 15% ELL 0 0% 0% 0% 0% 0% Not ELL 133 68% 4% 14% 0% 15%
2004 Total Cohort - 5 Year Outcome All Students 127 76% 5% 5% 1% 14% ELL 0 0% 0% 0% 0% 0% Not ELL 127 76% 5% 5% 1% 14%
2003 Total Cohort - 6 Year Outcome All Students 136 77% 3% 4% 1% 15% ELL 1 # # # # # Not ELL 135 # # # # #
Palmyra-Macedon Central School District
2005 Total Cohort - Aug 2009 Year Outcome All Students 188 86% 3% 4% 1% 6% ELL 0 0% 0% 0% 0% 0% Not ELL 188 86% 3% 4% 1% 6%
2005 Total Cohort - 4 Year Outcome All Students 188 85% 3% 5% 1% 6% ELL 0 0% 0% 0% 0% 0% Not ELL 188 85% 3% 5% 1% 6%
2004 Total Cohort - 5 Year Outcome All Students 186 92% 1% 3% 2% 3% ELL 0 0% 0% 0% 0% 0% Not ELL 186 92% 1% 3% 2% 3%
2003 Total Cohort - 6 Year Outcome All Students 155 84% 3% 3% 3% 7% ELL 0 0% 0% 0% 0% 0% Not ELL 155 84% 3% 3% 3% 7%
Red Creek Central School District
2005 Total Cohort - Aug 2009 Year Outcome All Students 87 68% 10% 7% 1% 14% ELL 0 0% 0% 0% 0% 0% Not ELL 87 68% 10% 7% 1% 14%
2005 Total Cohort - 4 Year Outcome All Students 87 68% 10% 7% 1% 14% ELL 0 0% 0% 0% 0% 0% Not ELL 87 68% 10% 7% 1% 14%
Data presented in this report are based on data submitted by school districts to the data repository for the 2008-09 school year. Students are reported based on their date of entry in grade 9 and their last enrollment status as reported in the warehouse on July 31, 2009. The federal Family Education Rights and Privacy Act prohibits the release of personally identifiable student information. This Act precludes the publication of summary information based on fewer than five students or in which subtraction or other simple mathematical operations could be used to obtain personal information. Cells that contain the ("#") symbol have been suppressed to protect student privacy.
District-ell status Thursday, March 4, 2010 Page 278 of 301
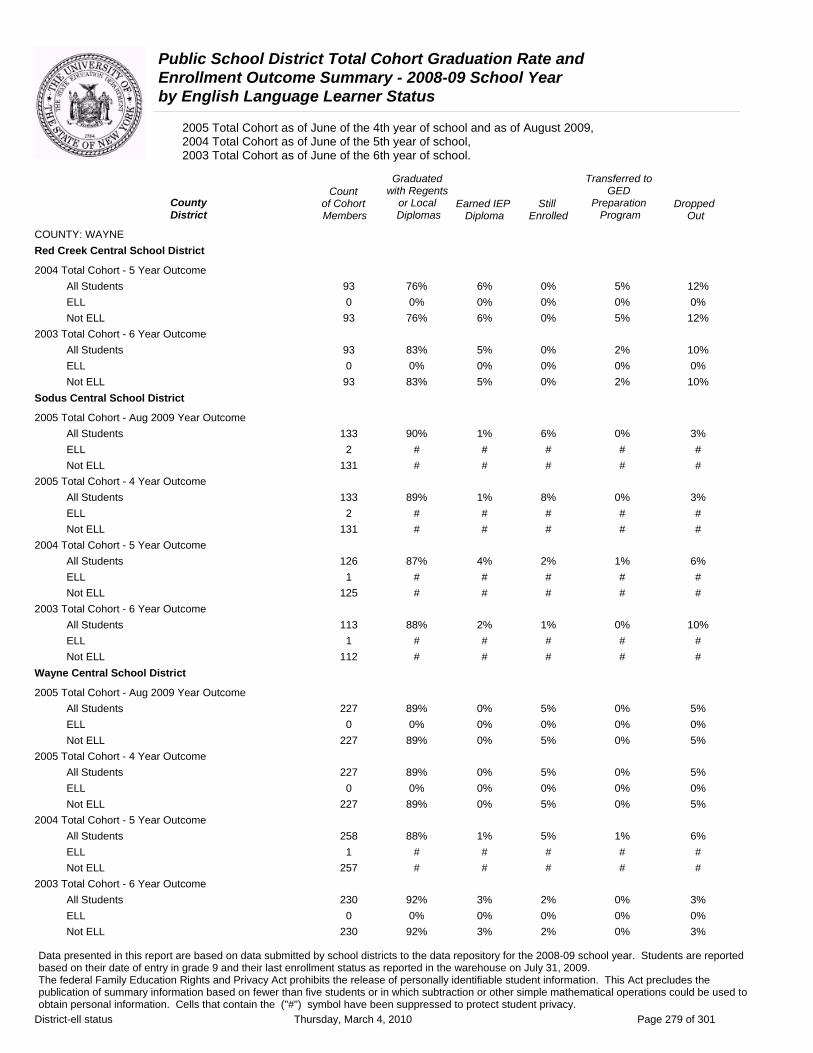
Public School District Total Cohort Graduation Rate and Enrollment Outcome Summary - 2008-09 School Year by English Language Learner Status
2005 Total Cohort as of June of the 4th year of school and as of August 2009, 2004 Total Cohort as of June of the 5th year of school, 2003 Total Cohort as of June of the 6th year of school.
Graduated Transferred to Count with Regents GED
County of Cohort or Local Earned IEP Still Preparation DroppedDistrict Members Diplomas Diploma Enrolled Program Out
COUNTY: WAYNE Red Creek Central School District
2004 Total Cohort - 5 Year Outcome All Students 93 76% 6% 0% 5% 12% ELL 0 0% 0% 0% 0% 0% Not ELL 93 76% 6% 0% 5% 12%
2003 Total Cohort - 6 Year Outcome All Students 93 83% 5% 0% 2% 10% ELL 0 0% 0% 0% 0% 0% Not ELL 93 83% 5% 0% 2% 10%
Sodus Central School District
2005 Total Cohort - Aug 2009 Year Outcome All Students 133 90% 1% 6% 0% 3% ELL 2 # # # # # Not ELL 131 # # # # #
2005 Total Cohort - 4 Year Outcome All Students 133 89% 1% 8% 0% 3% ELL 2 # # # # # Not ELL 131 # # # # #
2004 Total Cohort - 5 Year Outcome All Students 126 87% 4% 2% 1% 6% ELL 1 # # # # # Not ELL 125 # # # # #
2003 Total Cohort - 6 Year Outcome All Students 113 88% 2% 1% 0% 10% ELL 1 # # # # # Not ELL 112 # # # # #
Wayne Central School District
2005 Total Cohort - Aug 2009 Year Outcome All Students 227 89% 0% 5% 0% 5% ELL 0 0% 0% 0% 0% 0% Not ELL 227 89% 0% 5% 0% 5%
2005 Total Cohort - 4 Year Outcome All Students 227 89% 0% 5% 0% 5% ELL 0 0% 0% 0% 0% 0% Not ELL 227 89% 0% 5% 0% 5%
2004 Total Cohort - 5 Year Outcome All Students 258 88% 1% 5% 1% 6% ELL 1 # # # # # Not ELL 257 # # # # #
2003 Total Cohort - 6 Year Outcome All Students 230 92% 3% 2% 0% 3% ELL 0 0% 0% 0% 0% 0% Not ELL 230 92% 3% 2% 0% 3%
Data presented in this report are based on data submitted by school districts to the data repository for the 2008-09 school year. Students are reported based on their date of entry in grade 9 and their last enrollment status as reported in the warehouse on July 31, 2009. The federal Family Education Rights and Privacy Act prohibits the release of personally identifiable student information. This Act precludes the publication of summary information based on fewer than five students or in which subtraction or other simple mathematical operations could be used to obtain personal information. Cells that contain the ("#") symbol have been suppressed to protect student privacy.
District-ell status Thursday, March 4, 2010 Page 279 of 301
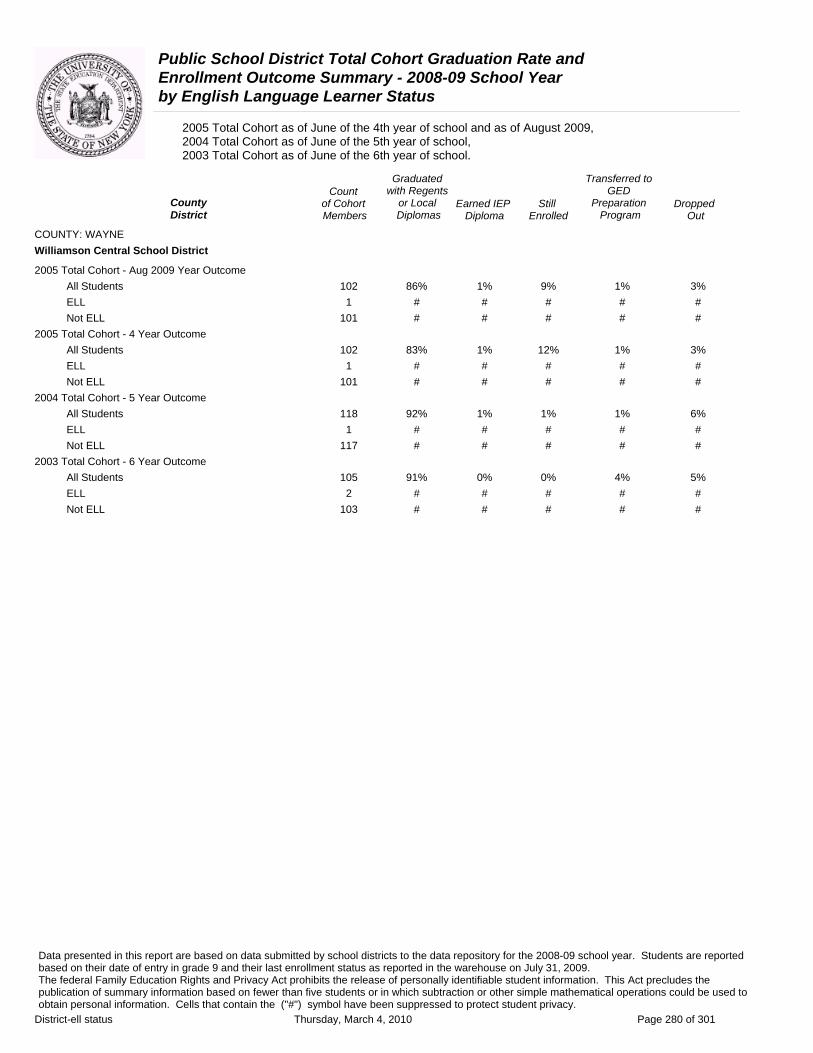
Public School District Total Cohort Graduation Rate and Enrollment Outcome Summary - 2008-09 School Year by English Language Learner Status
2005 Total Cohort as of June of the 4th year of school and as of August 2009, 2004 Total Cohort as of June of the 5th year of school, 2003 Total Cohort as of June of the 6th year of school.
Graduated Transferred to Count with Regents GED
County of Cohort or Local Earned IEP Still Preparation DroppedDistrict Members Diplomas Diploma Enrolled Program Out
COUNTY: WAYNE Williamson Central School District
2005 Total Cohort - Aug 2009 Year Outcome All Students 102 86% 1% 9% 1% 3% ELL 1 # # # # # Not ELL 101 # # # # #
2005 Total Cohort - 4 Year Outcome All Students 102 83% 1% 12% 1% 3% ELL 1 # # # # # Not ELL 101 # # # # #
2004 Total Cohort - 5 Year Outcome All Students 118 92% 1% 1% 1% 6% ELL 1 # # # # # Not ELL 117 # # # # #
2003 Total Cohort - 6 Year Outcome All Students 105 91% 0% 0% 4% 5% ELL 2 # # # # # Not ELL 103 # # # # #
Data presented in this report are based on data submitted by school districts to the data repository for the 2008-09 school year. Students are reported based on their date of entry in grade 9 and their last enrollment status as reported in the warehouse on July 31, 2009. The federal Family Education Rights and Privacy Act prohibits the release of personally identifiable student information. This Act precludes the publication of summary information based on fewer than five students or in which subtraction or other simple mathematical operations could be used to obtain personal information. Cells that contain the ("#") symbol have been suppressed to protect student privacy.
District-ell status Thursday, March 4, 2010 Page 280 of 301
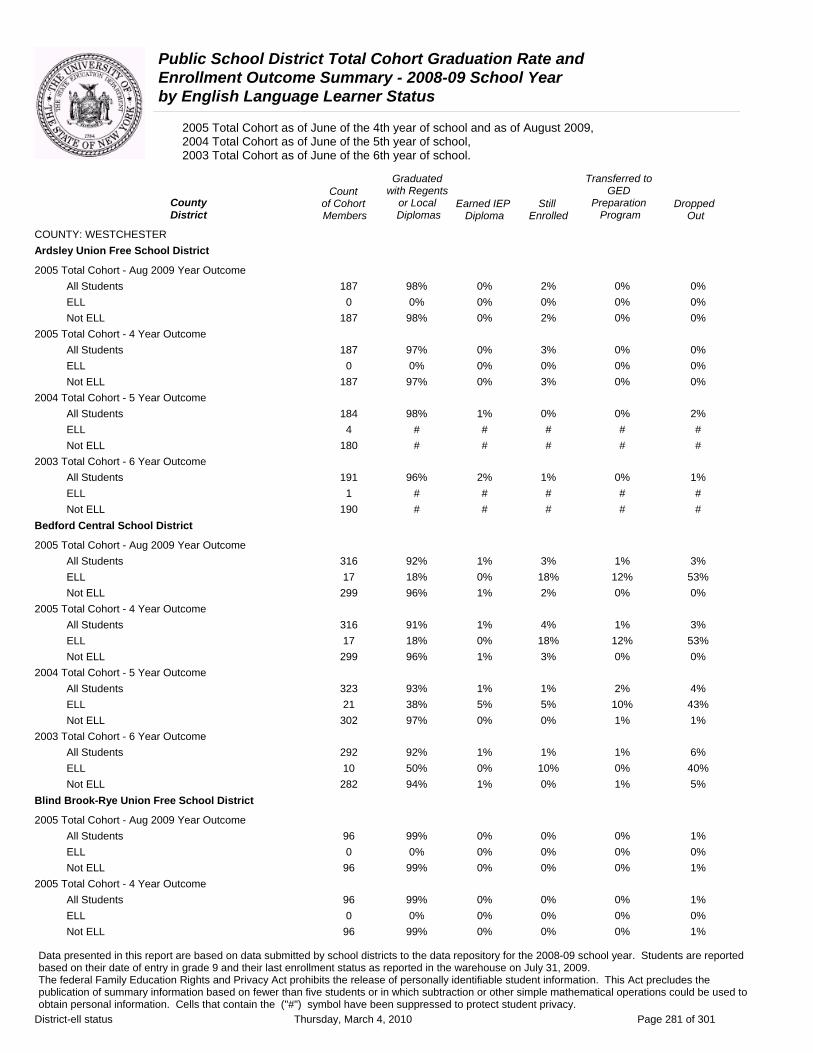
Public School District Total Cohort Graduation Rate and Enrollment Outcome Summary - 2008-09 School Year by English Language Learner Status
2005 Total Cohort as of June of the 4th year of school and as of August 2009, 2004 Total Cohort as of June of the 5th year of school, 2003 Total Cohort as of June of the 6th year of school.
County District
COUNTY: WESTCHESTER Ardsley Union Free School District
2005 Total Cohort - Aug 2009 Year Outcome All Students ELL Not ELL
2005 Total Cohort - 4 Year Outcome All Students ELL Not ELL
2004 Total Cohort - 5 Year Outcome All Students ELL Not ELL
2003 Total Cohort - 6 Year Outcome All Students ELL Not ELL
Bedford Central School District
2005 Total Cohort - Aug 2009 Year Outcome All Students ELL Not ELL
2005 Total Cohort - 4 Year Outcome All Students ELL Not ELL
2004 Total Cohort - 5 Year Outcome All Students ELL Not ELL
2003 Total Cohort - 6 Year Outcome All Students ELL Not ELL
Blind Brook-Rye Union Free School District
2005 Total Cohort - Aug 2009 Year Outcome All Students ELL Not ELL
2005 Total Cohort - 4 Year Outcome All Students ELL Not ELL
Count of Cohort Members
187 0
187
187 0
187
184 4
180
191 1
190
316 17
299
316 17
299
323 21
302
292 10
282
96 0 96
96 0 96
Graduated with Regents
or Local Diplomas
98%
0%
98%
97%
0%
97%
98%
#
#
96%
#
#
92% 18% 96%
91% 18% 96%
93% 38% 97%
92% 50% 94%
99% 0%
99%
99% 0%
99%
Earned IEP Diploma
0% 0% 0%
0% 0% 0%
1% # #
2% # #
1% 0% 1%
1% 0% 1%
1% 5% 0%
1% 0% 1%
0% 0% 0%
0% 0% 0%
Still Enrolled
2% 0% 2%
3% 0% 3%
0% # #
1% # #
3% 18% 2%
4% 18% 3%
1% 5% 0%
1% 10% 0%
0% 0% 0%
0% 0% 0%
Transferred to GED
Preparation DroppedProgram Out
0% 0% 0% 0% 0% 0%
0% 0% 0% 0% 0% 0%
0% 2% # # # #
0% 1% # # # #
1% 3% 12% 53% 0% 0%
1% 3% 12% 53% 0% 0%
2% 4% 10% 43% 1% 1%
1% 6% 0% 40% 1% 5%
0% 1% 0% 0% 0% 1%
0% 1% 0% 0% 0% 1%
Data presented in this report are based on data submitted by school districts to the data repository for the 2008-09 school year. Students are reported based on their date of entry in grade 9 and their last enrollment status as reported in the warehouse on July 31, 2009. The federal Family Education Rights and Privacy Act prohibits the release of personally identifiable student information. This Act precludes the publication of summary information based on fewer than five students or in which subtraction or other simple mathematical operations could be used to obtain personal information. Cells that contain the ("#") symbol have been suppressed to protect student privacy.
District-ell status Thursday, March 4, 2010 Page 281 of 301

Public School District Total Cohort Graduation Rate and Enrollment Outcome Summary - 2008-09 School Year by English Language Learner Status
2005 Total Cohort as of June of the 4th year of school and as of August 2009, 2004 Total Cohort as of June of the 5th year of school, 2003 Total Cohort as of June of the 6th year of school.
Graduated Transferred to Count with Regents GED
County District
of Cohort Members
or Local Diplomas
Earned IEP Diploma
Still Enrolled
Preparation Program
Dropped Out
COUNTY: WESTCHESTER Blind Brook-Rye Union Free School District
2004 Total Cohort - 5 Year Outcome All Students 98 100% 0% 0% 0% 0% ELL 1 # # # # # Not ELL 97 # # # # #
2003 Total Cohort - 6 Year Outcome All Students 92 98% 0% 1% 1% 0% ELL 0 0% 0% 0% 0% 0% Not ELL 92 98% 0% 1% 1% 0%
Briarcliff Manor Union Free School District
2005 Total Cohort - Aug 2009 Year Outcome All Students 179 99% 0% 1% 0% 0% ELL 1 # # # # # Not ELL 178 # # # # #
2005 Total Cohort - 4 Year Outcome All Students 179 99% 0% 1% 0% 0% ELL 1 # # # # # Not ELL 178 # # # # #
2004 Total Cohort - 5 Year Outcome All Students 158 100% 0% 0% 0% 0% ELL 1 # # # # # Not ELL 157 # # # # #
2003 Total Cohort - 6 Year Outcome All Students 158 100% 0% 0% 0% 0% ELL 1 # # # # # Not ELL 157 # # # # #
Bronxville Union Free School District
2005 Total Cohort - Aug 2009 Year Outcome All Students 111 98% 0% 2% 0% 0% ELL 0 0% 0% 0% 0% 0% Not ELL 111 98% 0% 2% 0% 0%
2005 Total Cohort - 4 Year Outcome All Students 111 98% 0% 2% 0% 0% ELL 0 0% 0% 0% 0% 0% Not ELL 111 98% 0% 2% 0% 0%
2004 Total Cohort - 5 Year Outcome All Students 110 100% 0% 0% 0% 0% ELL 0 0% 0% 0% 0% 0% Not ELL 110 100% 0% 0% 0% 0%
2003 Total Cohort - 6 Year Outcome All Students 119 99% 1% 0% 0% 0% ELL 0 0% 0% 0% 0% 0% Not ELL 119 99% 1% 0% 0% 0%
Data presented in this report are based on data submitted by school districts to the data repository for the 2008-09 school year. Students are reported based on their date of entry in grade 9 and their last enrollment status as reported in the warehouse on July 31, 2009. The federal Family Education Rights and Privacy Act prohibits the release of personally identifiable student information. This Act precludes the publication of summary information based on fewer than five students or in which subtraction or other simple mathematical operations could be used to obtain personal information. Cells that contain the ("#") symbol have been suppressed to protect student privacy.
District-ell status Thursday, March 4, 2010 Page 282 of 301
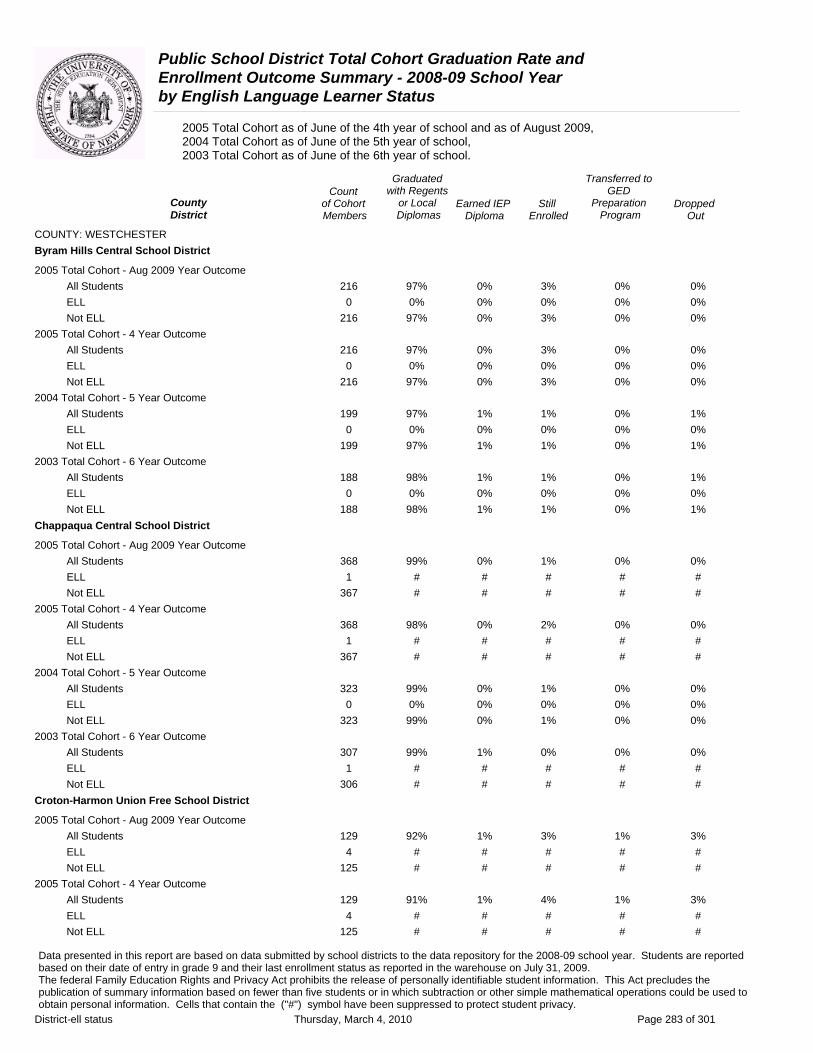
Public School District Total Cohort Graduation Rate and Enrollment Outcome Summary - 2008-09 School Year by English Language Learner Status
2005 Total Cohort as of June of the 4th year of school and as of August 2009, 2004 Total Cohort as of June of the 5th year of school, 2003 Total Cohort as of June of the 6th year of school.
Graduated Transferred to Count with Regents GED
County District
of Cohort Members
or Local Diplomas
Earned IEP Diploma
Still Enrolled
Preparation Program
Dropped Out
COUNTY: WESTCHESTER Byram Hills Central School District
2005 Total Cohort - Aug 2009 Year Outcome All Students 216 97% 0% 3% 0% 0% ELL 0 0% 0% 0% 0% 0% Not ELL 216 97% 0% 3% 0% 0%
2005 Total Cohort - 4 Year Outcome All Students 216 97% 0% 3% 0% 0% ELL 0 0% 0% 0% 0% 0% Not ELL 216 97% 0% 3% 0% 0%
2004 Total Cohort - 5 Year Outcome All Students 199 97% 1% 1% 0% 1% ELL 0 0% 0% 0% 0% 0% Not ELL 199 97% 1% 1% 0% 1%
2003 Total Cohort - 6 Year Outcome All Students 188 98% 1% 1% 0% 1% ELL 0 0% 0% 0% 0% 0% Not ELL 188 98% 1% 1% 0% 1%
Chappaqua Central School District
2005 Total Cohort - Aug 2009 Year Outcome All Students 368 99% 0% 1% 0% 0% ELL 1 # # # # # Not ELL 367 # # # # #
2005 Total Cohort - 4 Year Outcome All Students 368 98% 0% 2% 0% 0% ELL 1 # # # # # Not ELL 367 # # # # #
2004 Total Cohort - 5 Year Outcome All Students 323 99% 0% 1% 0% 0% ELL 0 0% 0% 0% 0% 0% Not ELL 323 99% 0% 1% 0% 0%
2003 Total Cohort - 6 Year Outcome All Students 307 99% 1% 0% 0% 0% ELL 1 # # # # # Not ELL 306 # # # # #
Croton-Harmon Union Free School District
2005 Total Cohort - Aug 2009 Year Outcome All Students 129 92% 1% 3% 1% 3% ELL 4 # # # # # Not ELL 125 # # # # #
2005 Total Cohort - 4 Year Outcome All Students 129 91% 1% 4% 1% 3% ELL 4 # # # # # Not ELL 125 # # # # #
Data presented in this report are based on data submitted by school districts to the data repository for the 2008-09 school year. Students are reported based on their date of entry in grade 9 and their last enrollment status as reported in the warehouse on July 31, 2009. The federal Family Education Rights and Privacy Act prohibits the release of personally identifiable student information. This Act precludes the publication of summary information based on fewer than five students or in which subtraction or other simple mathematical operations could be used to obtain personal information. Cells that contain the ("#") symbol have been suppressed to protect student privacy.
District-ell status Thursday, March 4, 2010 Page 283 of 301

Public School District Total Cohort Graduation Rate and Enrollment Outcome Summary - 2008-09 School Year by English Language Learner Status
2005 Total Cohort as of June of the 4th year of school and as of August 2009, 2004 Total Cohort as of June of the 5th year of school, 2003 Total Cohort as of June of the 6th year of school.
Graduated Transferred to Count with Regents GED
County District
of Cohort Members
or Local Diplomas
Earned IEP Diploma
Still Enrolled
Preparation Program
Dropped Out
COUNTY: WESTCHESTER Croton-Harmon Union Free School District
2004 Total Cohort - 5 Year Outcome All Students 127 93% 4% 0% 0% 3% ELL 3 # # # # # Not ELL 124 # # # # #
2003 Total Cohort - 6 Year Outcome All Students 123 97% 1% 0% 2% 1% ELL 1 # # # # # Not ELL 122 # # # # #
Dobbs Ferry Union Free School District
2005 Total Cohort - Aug 2009 Year Outcome All Students 125 94% 0% 3% 0% 2% ELL 1 # # # # # Not ELL 124 # # # # #
2005 Total Cohort - 4 Year Outcome All Students 125 94% 0% 3% 0% 2% ELL 1 # # # # # Not ELL 124 # # # # #
2004 Total Cohort - 5 Year Outcome All Students 109 97% 0% 1% 1% 1% ELL 2 # # # # # Not ELL 107 # # # # #
2003 Total Cohort - 6 Year Outcome All Students 102 97% 1% 1% 0% 1% ELL 1 # # # # # Not ELL 101 # # # # #
Eastchester Union Free School District
2005 Total Cohort - Aug 2009 Year Outcome All Students 204 95% 1% 3% 0% 0% ELL 1 # # # # # Not ELL 203 # # # # #
2005 Total Cohort - 4 Year Outcome All Students 204 93% 1% 5% 0% 0% ELL 1 # # # # # Not ELL 203 # # # # #
2004 Total Cohort - 5 Year Outcome All Students 205 99% 0% 0% 0% 1% ELL 5 100% 0% 0% 0% 0% Not ELL 200 99% 1% 0% 0% 1%
2003 Total Cohort - 6 Year Outcome All Students 169 96% 1% 0% 0% 2% ELL 3 # # # # # Not ELL 166 # # # # #
Data presented in this report are based on data submitted by school districts to the data repository for the 2008-09 school year. Students are reported based on their date of entry in grade 9 and their last enrollment status as reported in the warehouse on July 31, 2009. The federal Family Education Rights and Privacy Act prohibits the release of personally identifiable student information. This Act precludes the publication of summary information based on fewer than five students or in which subtraction or other simple mathematical operations could be used to obtain personal information. Cells that contain the ("#") symbol have been suppressed to protect student privacy.
District-ell status Thursday, March 4, 2010 Page 284 of 301
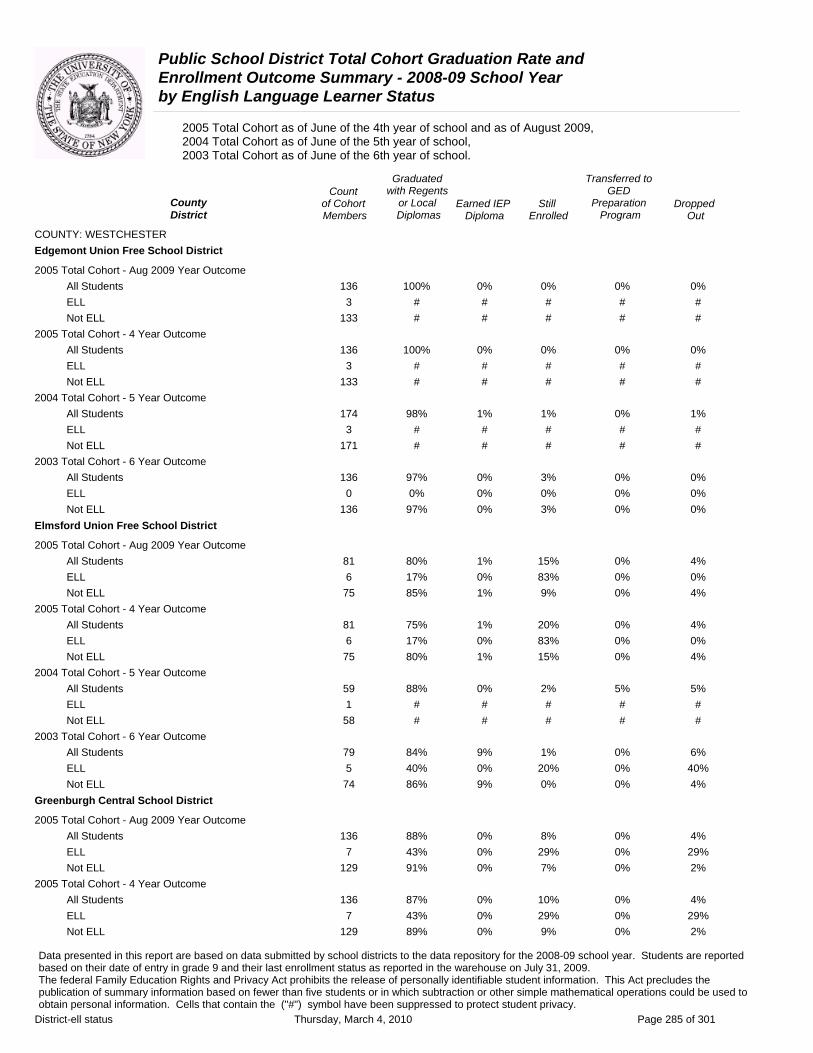
Public School District Total Cohort Graduation Rate and Enrollment Outcome Summary - 2008-09 School Year by English Language Learner Status
2005 Total Cohort as of June of the 4th year of school and as of August 2009, 2004 Total Cohort as of June of the 5th year of school, 2003 Total Cohort as of June of the 6th year of school.
Graduated Transferred to Count with Regents GED
County District
of Cohort Members
or Local Diplomas
Earned IEP Diploma
Still Enrolled
Preparation Program
Dropped Out
COUNTY: WESTCHESTER Edgemont Union Free School District
2005 Total Cohort - Aug 2009 Year Outcome All Students 136 100% 0% 0% 0% 0% ELL 3 # # # # # Not ELL 133 # # # # #
2005 Total Cohort - 4 Year Outcome All Students 136 100% 0% 0% 0% 0% ELL 3 # # # # # Not ELL 133 # # # # #
2004 Total Cohort - 5 Year Outcome All Students 174 98% 1% 1% 0% 1% ELL 3 # # # # # Not ELL 171 # # # # #
2003 Total Cohort - 6 Year Outcome All Students 136 97% 0% 3% 0% 0% ELL 0 0% 0% 0% 0% 0% Not ELL 136 97% 0% 3% 0% 0%
Elmsford Union Free School District
2005 Total Cohort - Aug 2009 Year Outcome All Students 81 80% 1% 15% 0% 4% ELL 6 17% 0% 83% 0% 0% Not ELL 75 85% 1% 9% 0% 4%
2005 Total Cohort - 4 Year Outcome All Students 81 75% 1% 20% 0% 4% ELL 6 17% 0% 83% 0% 0% Not ELL 75 80% 1% 15% 0% 4%
2004 Total Cohort - 5 Year Outcome All Students 59 88% 0% 2% 5% 5% ELL 1 # # # # # Not ELL 58 # # # # #
2003 Total Cohort - 6 Year Outcome All Students 79 84% 9% 1% 0% 6% ELL 5 40% 0% 20% 0% 40% Not ELL 74 86% 9% 0% 0% 4%
Greenburgh Central School District
2005 Total Cohort - Aug 2009 Year Outcome All Students 136 88% 0% 8% 0% 4% ELL 7 43% 0% 29% 0% 29% Not ELL 129 91% 0% 7% 0% 2%
2005 Total Cohort - 4 Year Outcome All Students 136 87% 0% 10% 0% 4% ELL 7 43% 0% 29% 0% 29% Not ELL 129 89% 0% 9% 0% 2%
Data presented in this report are based on data submitted by school districts to the data repository for the 2008-09 school year. Students are reported based on their date of entry in grade 9 and their last enrollment status as reported in the warehouse on July 31, 2009. The federal Family Education Rights and Privacy Act prohibits the release of personally identifiable student information. This Act precludes the publication of summary information based on fewer than five students or in which subtraction or other simple mathematical operations could be used to obtain personal information. Cells that contain the ("#") symbol have been suppressed to protect student privacy.
District-ell status Thursday, March 4, 2010 Page 285 of 301
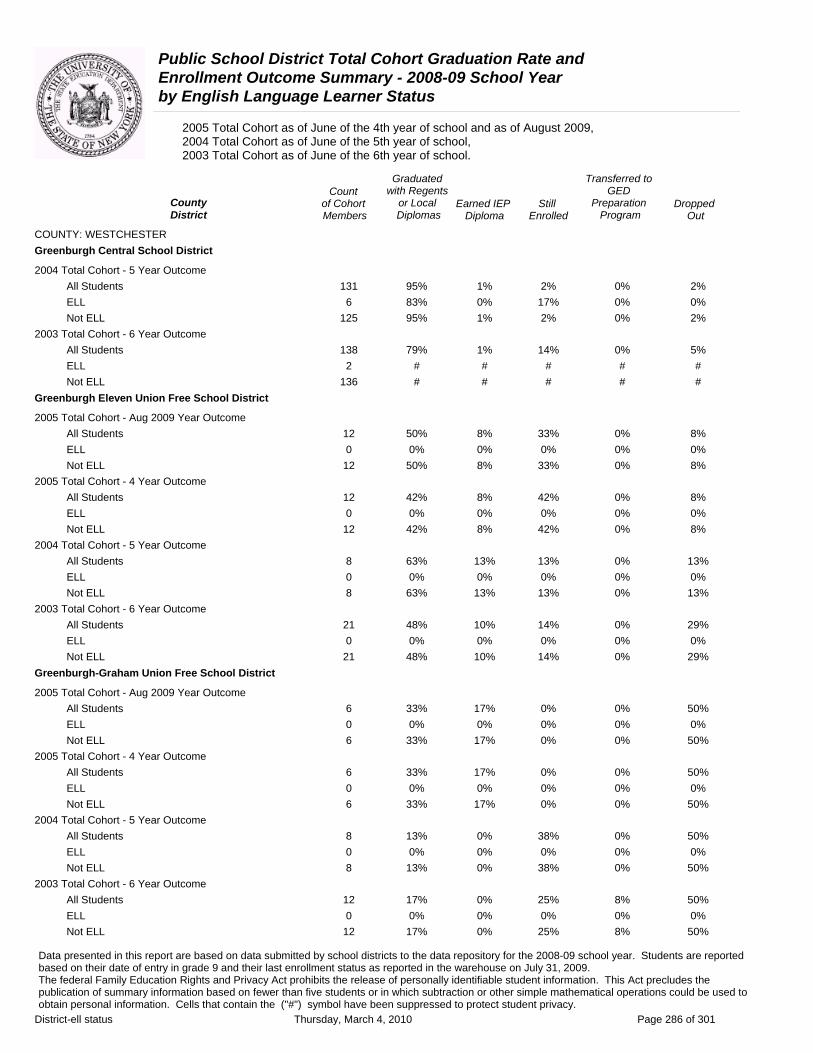
Public School District Total Cohort Graduation Rate and Enrollment Outcome Summary - 2008-09 School Year by English Language Learner Status
2005 Total Cohort as of June of the 4th year of school and as of August 2009, 2004 Total Cohort as of June of the 5th year of school, 2003 Total Cohort as of June of the 6th year of school.
Graduated Transferred to Count with Regents GED
County District
of Cohort Members
or Local Diplomas
Earned IEP Diploma
Still Enrolled
Preparation Program
Dropped Out
COUNTY: WESTCHESTER Greenburgh Central School District
2004 Total Cohort - 5 Year Outcome All Students 131 95% 1% 2% 0% 2% ELL 6 83% 0% 17% 0% 0% Not ELL 125 95% 1% 2% 0% 2%
2003 Total Cohort - 6 Year Outcome All Students 138 79% 1% 14% 0% 5% ELL 2 # # # # # Not ELL 136 # # # # #
Greenburgh Eleven Union Free School District
2005 Total Cohort - Aug 2009 Year Outcome All Students 12 50% 8% 33% 0% 8% ELL 0 0% 0% 0% 0% 0% Not ELL 12 50% 8% 33% 0% 8%
2005 Total Cohort - 4 Year Outcome All Students 12 42% 8% 42% 0% 8% ELL 0 0% 0% 0% 0% 0% Not ELL 12 42% 8% 42% 0% 8%
2004 Total Cohort - 5 Year Outcome All Students 8 63% 13% 13% 0% 13% ELL 0 0% 0% 0% 0% 0% Not ELL 8 63% 13% 13% 0% 13%
2003 Total Cohort - 6 Year Outcome All Students 21 48% 10% 14% 0% 29% ELL 0 0% 0% 0% 0% 0% Not ELL 21 48% 10% 14% 0% 29%
Greenburgh-Graham Union Free School District
2005 Total Cohort - Aug 2009 Year Outcome All Students 6 33% 17% 0% 0% 50% ELL 0 0% 0% 0% 0% 0% Not ELL 6 33% 17% 0% 0% 50%
2005 Total Cohort - 4 Year Outcome All Students 6 33% 17% 0% 0% 50% ELL 0 0% 0% 0% 0% 0% Not ELL 6 33% 17% 0% 0% 50%
2004 Total Cohort - 5 Year Outcome All Students 8 13% 0% 38% 0% 50% ELL 0 0% 0% 0% 0% 0% Not ELL 8 13% 0% 38% 0% 50%
2003 Total Cohort - 6 Year Outcome All Students 12 17% 0% 25% 8% 50% ELL 0 0% 0% 0% 0% 0% Not ELL 12 17% 0% 25% 8% 50%
Data presented in this report are based on data submitted by school districts to the data repository for the 2008-09 school year. Students are reported based on their date of entry in grade 9 and their last enrollment status as reported in the warehouse on July 31, 2009. The federal Family Education Rights and Privacy Act prohibits the release of personally identifiable student information. This Act precludes the publication of summary information based on fewer than five students or in which subtraction or other simple mathematical operations could be used to obtain personal information. Cells that contain the ("#") symbol have been suppressed to protect student privacy.
District-ell status Thursday, March 4, 2010 Page 286 of 301

Public School District Total Cohort Graduation Rate and Enrollment Outcome Summary - 2008-09 School Year by English Language Learner Status
2005 Total Cohort as of June of the 4th year of school and as of August 2009, 2004 Total Cohort as of June of the 5th year of school, 2003 Total Cohort as of June of the 6th year of school.
Graduated Transferred to Count with Regents GED
County of Cohort or Local Earned IEP Still Preparation DroppedDistrict Members Diplomas Diploma Enrolled Program Out
COUNTY: WESTCHESTER Greenburgh-North Castle Union Free School District
2005 Total Cohort - Aug 2009 Year Outcome All Students 2 # # # # # ELL 0 # # # # # Not ELL 2 # # # # #
2005 Total Cohort - 4 Year Outcome All Students 2 # # # # # ELL 0 # # # # # Not ELL 2 # # # # #
2004 Total Cohort - 5 Year Outcome All Students 1 # # # # # ELL 0 # # # # # Not ELL 1 # # # # #
2003 Total Cohort - 6 Year Outcome All Students 2 # # # # # ELL 0 # # # # # Not ELL 2 # # # # #
Harrison Central School District
2005 Total Cohort - Aug 2009 Year Outcome All Students 242 91% 0% 7% 0% 2% ELL 4 # # # # # Not ELL 238 # # # # #
2005 Total Cohort - 4 Year Outcome All Students 242 90% 0% 7% 0% 2% ELL 4 # # # # # Not ELL 238 # # # # #
2004 Total Cohort - 5 Year Outcome All Students 246 95% 1% 2% 0% 2% ELL 2 # # # # # Not ELL 244 # # # # #
2003 Total Cohort - 6 Year Outcome All Students 266 93% 0% 2% 0% 5% ELL 4 # # # # # Not ELL 262 # # # # #
Hastings-On-Hudson Union Free School District
2005 Total Cohort - Aug 2009 Year Outcome All Students 130 96% 0% 2% 0% 2% ELL 2 # # # # # Not ELL 128 # # # # #
2005 Total Cohort - 4 Year Outcome All Students 130 95% 0% 4% 0% 2% ELL 2 # # # # # Not ELL 128 # # # # #
Data presented in this report are based on data submitted by school districts to the data repository for the 2008-09 school year. Students are reported based on their date of entry in grade 9 and their last enrollment status as reported in the warehouse on July 31, 2009. The federal Family Education Rights and Privacy Act prohibits the release of personally identifiable student information. This Act precludes the publication of summary information based on fewer than five students or in which subtraction or other simple mathematical operations could be used to obtain personal information. Cells that contain the ("#") symbol have been suppressed to protect student privacy.
District-ell status Thursday, March 4, 2010 Page 287 of 301
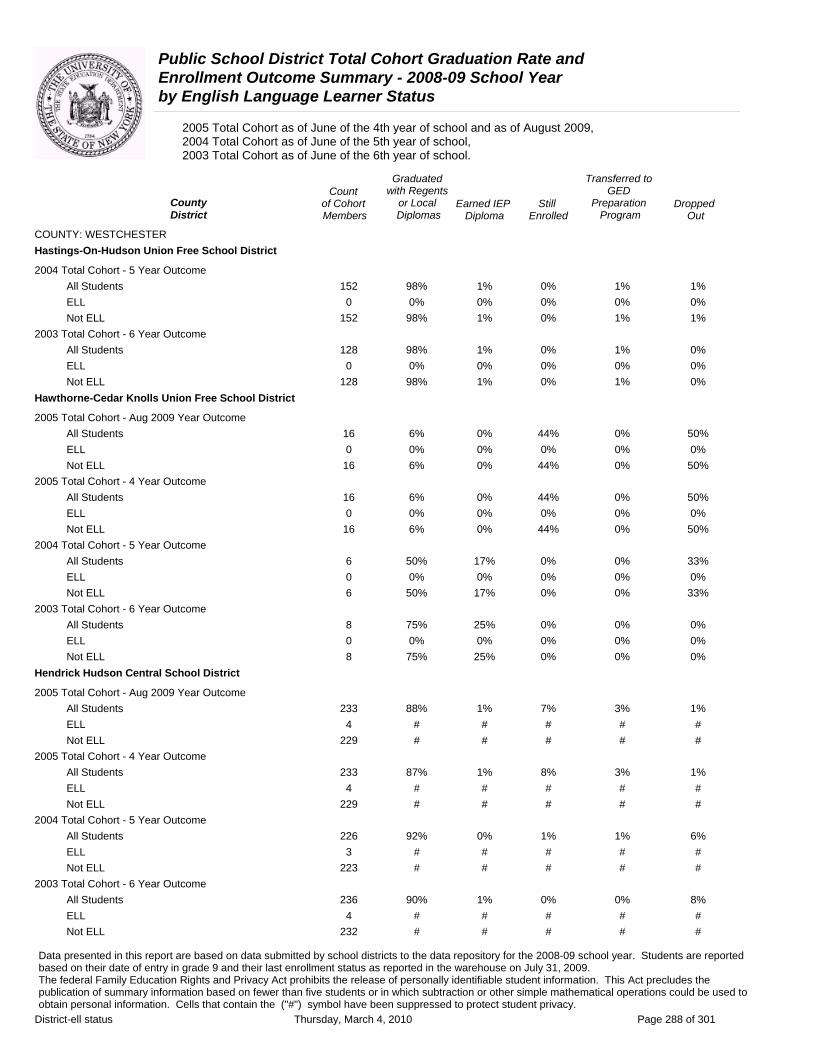
Public School District Total Cohort Graduation Rate and Enrollment Outcome Summary - 2008-09 School Year by English Language Learner Status
2005 Total Cohort as of June of the 4th year of school and as of August 2009, 2004 Total Cohort as of June of the 5th year of school, 2003 Total Cohort as of June of the 6th year of school.
Graduated Transferred to Count with Regents GED
County of Cohort or Local Earned IEP Still Preparation DroppedDistrict Members Diplomas Diploma Enrolled Program Out
COUNTY: WESTCHESTER Hastings-On-Hudson Union Free School District
2004 Total Cohort - 5 Year Outcome All Students ELL Not ELL
2003 Total Cohort - 6 Year Outcome All Students ELL Not ELL
Hawthorne-Cedar Knolls Union Free School District
2005 Total Cohort - Aug 2009 Year Outcome All Students ELL Not ELL
2005 Total Cohort - 4 Year Outcome All Students ELL Not ELL
2004 Total Cohort - 5 Year Outcome All Students ELL Not ELL
2003 Total Cohort - 6 Year Outcome All Students ELL Not ELL
Hendrick Hudson Central School District
2005 Total Cohort - Aug 2009 Year Outcome All Students ELL Not ELL
2005 Total Cohort - 4 Year Outcome All Students ELL Not ELL
2004 Total Cohort - 5 Year Outcome All Students ELL Not ELL
2003 Total Cohort - 6 Year Outcome All Students ELL Not ELL
152 0
152
128 0
128
16 0 16
16 0 16
6 0 6
8 0 8
233 4
229
233 4
229
226 3
223
236 4
232
98% 1% 0% 1% 1% 0% 0% 0% 0% 0%
98% 1% 0% 1% 1%
98% 1% 0% 1% 0% 0% 0% 0% 0% 0%
98% 1% 0% 1% 0%
6% 0% 44% 0% 50% 0% 0% 0% 0% 0% 6% 0% 44% 0% 50%
6% 0% 44% 0% 50% 0% 0% 0% 0% 0% 6% 0% 44% 0% 50%
50% 17% 0% 0% 33% 0% 0% 0% 0% 0%
50% 17% 0% 0% 33%
75% 25% 0% 0% 0% 0% 0% 0% 0% 0%
75% 25% 0% 0% 0%
88% 1% 7% 3% 1% # # # # # # # # # #
87% 1% 8% 3% 1% # # # # # # # # # #
92% 0% 1% 1% 6% # # # # # # # # # #
90% 1% 0% 0% 8% # # # # # # # # # #
Data presented in this report are based on data submitted by school districts to the data repository for the 2008-09 school year. Students are reported based on their date of entry in grade 9 and their last enrollment status as reported in the warehouse on July 31, 2009. The federal Family Education Rights and Privacy Act prohibits the release of personally identifiable student information. This Act precludes the publication of summary information based on fewer than five students or in which subtraction or other simple mathematical operations could be used to obtain personal information. Cells that contain the ("#") symbol have been suppressed to protect student privacy.
District-ell status Thursday, March 4, 2010 Page 288 of 301
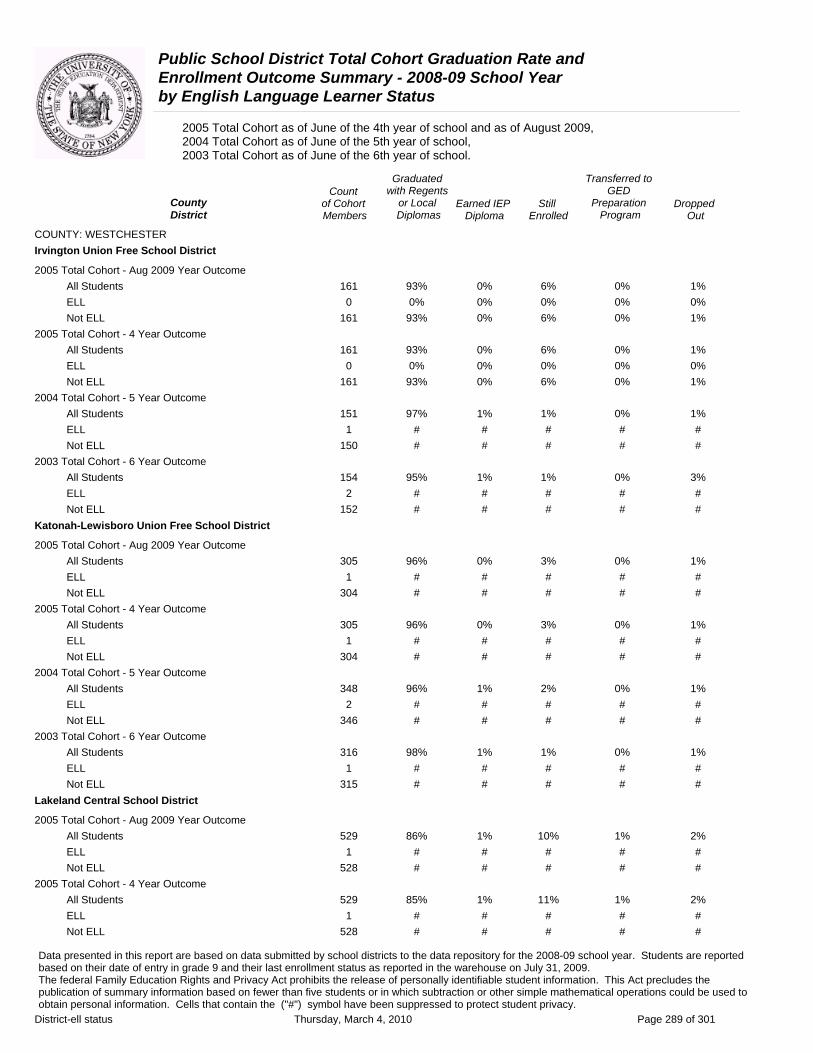
Public School District Total Cohort Graduation Rate and Enrollment Outcome Summary - 2008-09 School Year by English Language Learner Status
2005 Total Cohort as of June of the 4th year of school and as of August 2009, 2004 Total Cohort as of June of the 5th year of school, 2003 Total Cohort as of June of the 6th year of school.
County District
COUNTY: WESTCHESTER Irvington Union Free School District
2005 Total Cohort - Aug 2009 Year Outcome All Students ELL Not ELL
2005 Total Cohort - 4 Year Outcome All Students ELL Not ELL
2004 Total Cohort - 5 Year Outcome All Students ELL Not ELL
2003 Total Cohort - 6 Year Outcome All Students ELL Not ELL
Katonah-Lewisboro Union Free School District
2005 Total Cohort - Aug 2009 Year Outcome All Students ELL Not ELL
2005 Total Cohort - 4 Year Outcome All Students ELL Not ELL
2004 Total Cohort - 5 Year Outcome All Students ELL Not ELL
2003 Total Cohort - 6 Year Outcome All Students ELL Not ELL
Lakeland Central School District
2005 Total Cohort - Aug 2009 Year Outcome All Students ELL Not ELL
2005 Total Cohort - 4 Year Outcome All Students ELL Not ELL
Count of Cohort Members
161 0
161
161 0
161
151 1
150
154 2
152
305 1
304
305 1
304
348 2
346
316 1
315
529 1
528
529 1
528
Graduated with Regents
or Local Diplomas
93%
0%
93%
93%
0%
93%
97%
#
#
95%
#
#
96%
#
#
96%
#
#
96%
#
#
98%
#
#
86%
#
#
85%
#
#
Earned IEP Diploma
0% 0% 0%
0% 0% 0%
1% # #
1% # #
0% # #
0% # #
1% # #
1% # #
1% # #
1% # #
Still Enrolled
6% 0% 6%
6% 0% 6%
1% # #
1% # #
3% # #
3% # #
2% # #
1% # #
10% # #
11% # #
Transferred to GED
Preparation Program
Dropped Out
0% 1% 0% 0% 0% 1%
0% 1% 0% 0% 0% 1%
0% 1% # # # #
0% 3% # # # #
0% 1% # # # #
0% 1% # # # #
0% 1% # # # #
0% 1% # # # #
1% 2% # # # #
1% 2% # # # #
Data presented in this report are based on data submitted by school districts to the data repository for the 2008-09 school year. Students are reported based on their date of entry in grade 9 and their last enrollment status as reported in the warehouse on July 31, 2009. The federal Family Education Rights and Privacy Act prohibits the release of personally identifiable student information. This Act precludes the publication of summary information based on fewer than five students or in which subtraction or other simple mathematical operations could be used to obtain personal information. Cells that contain the ("#") symbol have been suppressed to protect student privacy.
District-ell status Thursday, March 4, 2010 Page 289 of 301

Public School District Total Cohort Graduation Rate and Enrollment Outcome Summary - 2008-09 School Year by English Language Learner Status
2005 Total Cohort as of June of the 4th year of school and as of August 2009, 2004 Total Cohort as of June of the 5th year of school, 2003 Total Cohort as of June of the 6th year of school.
Graduated Transferred to Count with Regents GED
County District
of Cohort Members
or Local Diplomas
Earned IEP Diploma
Still Enrolled
Preparation Program
Dropped Out
COUNTY: WESTCHESTER Lakeland Central School District
2004 Total Cohort - 5 Year Outcome All Students 549 94% 1% 2% 0% 3% ELL 5 80% 0% 0% 0% 20% Not ELL 544 94% 1% 2% 0% 3%
2003 Total Cohort - 6 Year Outcome All Students 482 93% 1% 2% 0% 4% ELL 5 60% 0% 20% 0% 20% Not ELL 477 93% 1% 2% 0% 4%
Mamaroneck Union Free School District
2005 Total Cohort - Aug 2009 Year Outcome All Students 375 89% 1% 7% 1% 2% ELL 5 20% 0% 20% 20% 40% Not ELL 370 90% 1% 7% 1% 2%
2005 Total Cohort - 4 Year Outcome All Students 375 89% 1% 7% 1% 2% ELL 5 20% 0% 20% 20% 40% Not ELL 370 90% 1% 7% 1% 2%
2004 Total Cohort - 5 Year Outcome All Students 347 95% 1% 1% 0% 3% ELL 7 57% 0% 14% 14% 14% Not ELL 340 95% 1% 1% 0% 3%
2003 Total Cohort - 6 Year Outcome All Students 379 92% 1% 0% 0% 7% ELL 7 14% 0% 0% 14% 71% Not ELL 372 94% 1% 0% 0% 5%
Mount Pleasant Central School District
2005 Total Cohort - Aug 2009 Year Outcome All Students 131 97% 1% 2% 0% 1% ELL 1 # # # # # Not ELL 130 # # # # #
2005 Total Cohort - 4 Year Outcome All Students 131 97% 1% 2% 0% 1% ELL 1 # # # # # Not ELL 130 # # # # #
2004 Total Cohort - 5 Year Outcome All Students 144 97% 3% 0% 1% 0% ELL 2 # # # # # Not ELL 142 # # # # #
2003 Total Cohort - 6 Year Outcome All Students 139 96% 1% 1% 0% 1% ELL 5 80% 0% 20% 0% 0% Not ELL 134 97% 1% 0% 0% 1%
Data presented in this report are based on data submitted by school districts to the data repository for the 2008-09 school year. Students are reported based on their date of entry in grade 9 and their last enrollment status as reported in the warehouse on July 31, 2009. The federal Family Education Rights and Privacy Act prohibits the release of personally identifiable student information. This Act precludes the publication of summary information based on fewer than five students or in which subtraction or other simple mathematical operations could be used to obtain personal information. Cells that contain the ("#") symbol have been suppressed to protect student privacy.
District-ell status Thursday, March 4, 2010 Page 290 of 301

Public School District Total Cohort Graduation Rate and Enrollment Outcome Summary - 2008-09 School Year by English Language Learner Status
2005 Total Cohort as of June of the 4th year of school and as of August 2009, 2004 Total Cohort as of June of the 5th year of school, 2003 Total Cohort as of June of the 6th year of school.
Graduated Transferred to Count with Regents GED
County of Cohort or Local Earned IEP Still Preparation DroppedDistrict Members Diplomas Diploma Enrolled Program Out
COUNTY: WESTCHESTER Mount Pleasant-Blythedale Union Free School District
2005 Total Cohort - Aug 2009 Year Outcome All Students 1 # # # # # ELL 0 # # # # # Not ELL 1 # # # # #
2005 Total Cohort - 4 Year Outcome All Students 1 # # # # # ELL 0 # # # # # Not ELL 1 # # # # #
2004 Total Cohort - 5 Year Outcome All Students 7 14% 0% 86% 0% 0% ELL 0 0% 0% 0% 0% 0% Not ELL 7 14% 0% 86% 0% 0%
Mount Pleasant-Cottage Union Free School District
2005 Total Cohort - Aug 2009 Year Outcome All Students 63 2% 0% 95% 0% 3% ELL 0 0% 0% 0% 0% 0% Not ELL 63 2% 0% 95% 0% 3%
2005 Total Cohort - 4 Year Outcome All Students 63 2% 0% 95% 0% 3% ELL 0 0% 0% 0% 0% 0% Not ELL 63 2% 0% 95% 0% 3%
2004 Total Cohort - 5 Year Outcome All Students 28 7% 4% 79% 0% 11% ELL 0 0% 0% 0% 0% 0% Not ELL 28 7% 4% 79% 0% 11%
2003 Total Cohort - 6 Year Outcome All Students 24 0% 8% 83% 0% 8% ELL 0 0% 0% 0% 0% 0% Not ELL 24 0% 8% 83% 0% 8%
Mount Vernon City School District
2005 Total Cohort - Aug 2009 Year Outcome All Students 577 64% 0% 19% 2% 16% ELL 9 33% 0% 33% 11% 22% Not ELL 568 65% 0% 18% 1% 15%
2005 Total Cohort - 4 Year Outcome All Students 577 62% 0% 21% 2% 16% ELL 9 22% 0% 44% 11% 22% Not ELL 568 63% 0% 20% 1% 15%
2004 Total Cohort - 5 Year Outcome All Students 632 72% 0% 13% 1% 14% ELL 23 48% 0% 22% 0% 30% Not ELL 609 73% 0% 13% 1% 13%
Data presented in this report are based on data submitted by school districts to the data repository for the 2008-09 school year. Students are reported based on their date of entry in grade 9 and their last enrollment status as reported in the warehouse on July 31, 2009. The federal Family Education Rights and Privacy Act prohibits the release of personally identifiable student information. This Act precludes the publication of summary information based on fewer than five students or in which subtraction or other simple mathematical operations could be used to obtain personal information. Cells that contain the ("#") symbol have been suppressed to protect student privacy.
District-ell status Thursday, March 4, 2010 Page 291 of 301
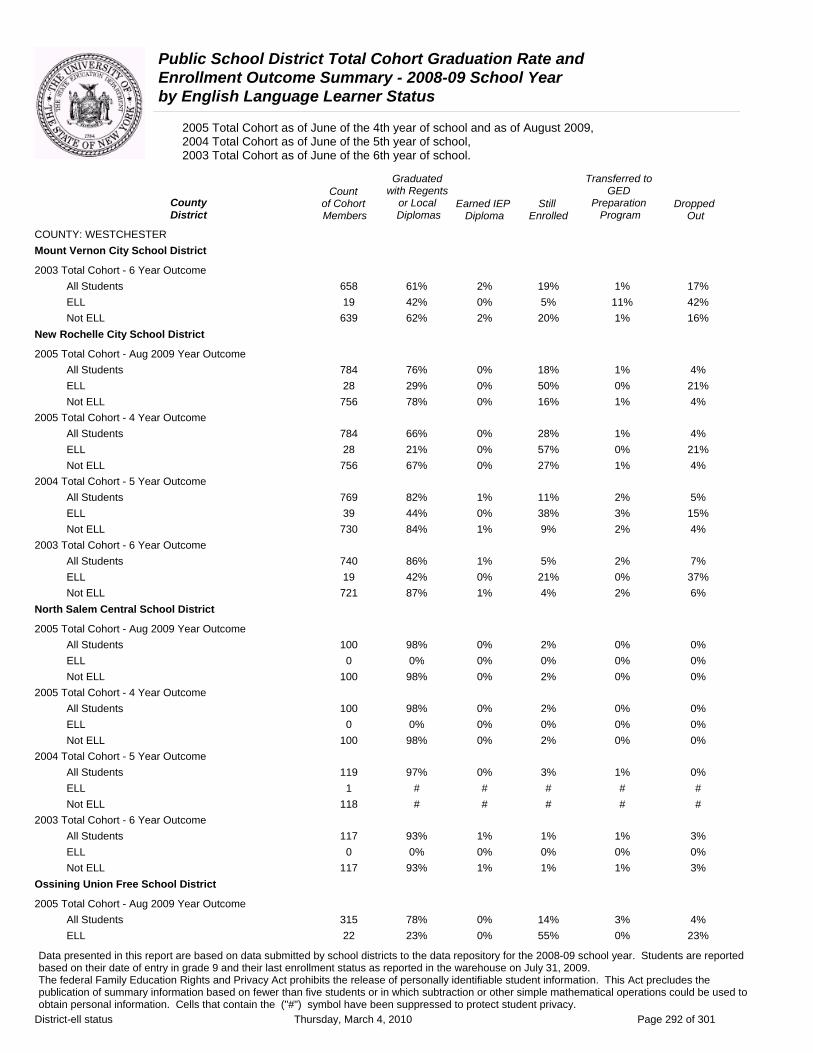
Public School District Total Cohort Graduation Rate and Enrollment Outcome Summary - 2008-09 School Year by English Language Learner Status
2005 Total Cohort as of June of the 4th year of school and as of August 2009, 2004 Total Cohort as of June of the 5th year of school, 2003 Total Cohort as of June of the 6th year of school.
County District
COUNTY: WESTCHESTER Mount Vernon City School District
2003 Total Cohort - 6 Year Outcome All Students ELL Not ELL
New Rochelle City School District
2005 Total Cohort - Aug 2009 Year Outcome All Students ELL Not ELL
2005 Total Cohort - 4 Year Outcome All Students ELL Not ELL
2004 Total Cohort - 5 Year Outcome All Students ELL Not ELL
2003 Total Cohort - 6 Year Outcome All Students ELL Not ELL
North Salem Central School District
2005 Total Cohort - Aug 2009 Year Outcome All Students ELL Not ELL
2005 Total Cohort - 4 Year Outcome All Students ELL Not ELL
2004 Total Cohort - 5 Year Outcome All Students ELL Not ELL
2003 Total Cohort - 6 Year Outcome All Students ELL Not ELL
Ossining Union Free School District
2005 Total Cohort - Aug 2009 Year Outcome All Students ELL
Count of Cohort Members
658 19
639
784 28
756
784 28
756
769 39
730
740 19
721
100 0
100
100 0
100
119 1
118
117 0
117
315 22
Graduated with Regents
or Local Diplomas
61% 42% 62%
76% 29% 78%
66% 21% 67%
82% 44% 84%
86% 42% 87%
98%
0%
98%
98%
0%
98%
97%
#
#
93%
0%
93%
78%
23%
Earned IEP Diploma
2% 0% 2%
0% 0% 0%
0% 0% 0%
1% 0% 1%
1% 0% 1%
0% 0% 0%
0% 0% 0%
0% # #
1% 0% 1%
0% 0%
Still Enrolled
19% 5% 20%
18% 50% 16%
28% 57% 27%
11% 38% 9%
5% 21% 4%
2% 0% 2%
2% 0% 2%
3% # #
1% 0% 1%
14% 55%
Transferred to GED
Preparation Program
Dropped Out
1% 17% 11% 42% 1% 16%
1% 4% 0% 21% 1% 4%
1% 4% 0% 21% 1% 4%
2% 5% 3% 15% 2% 4%
2% 7% 0% 37% 2% 6%
0% 0% 0% 0% 0% 0%
0% 0% 0% 0% 0% 0%
1% 0% # # # #
1% 3% 0% 0% 1% 3%
3% 4% 0% 23%
Data presented in this report are based on data submitted by school districts to the data repository for the 2008-09 school year. Students are reported based on their date of entry in grade 9 and their last enrollment status as reported in the warehouse on July 31, 2009. The federal Family Education Rights and Privacy Act prohibits the release of personally identifiable student information. This Act precludes the publication of summary information based on fewer than five students or in which subtraction or other simple mathematical operations could be used to obtain personal information. Cells that contain the ("#") symbol have been suppressed to protect student privacy.
District-ell status Thursday, March 4, 2010 Page 292 of 301
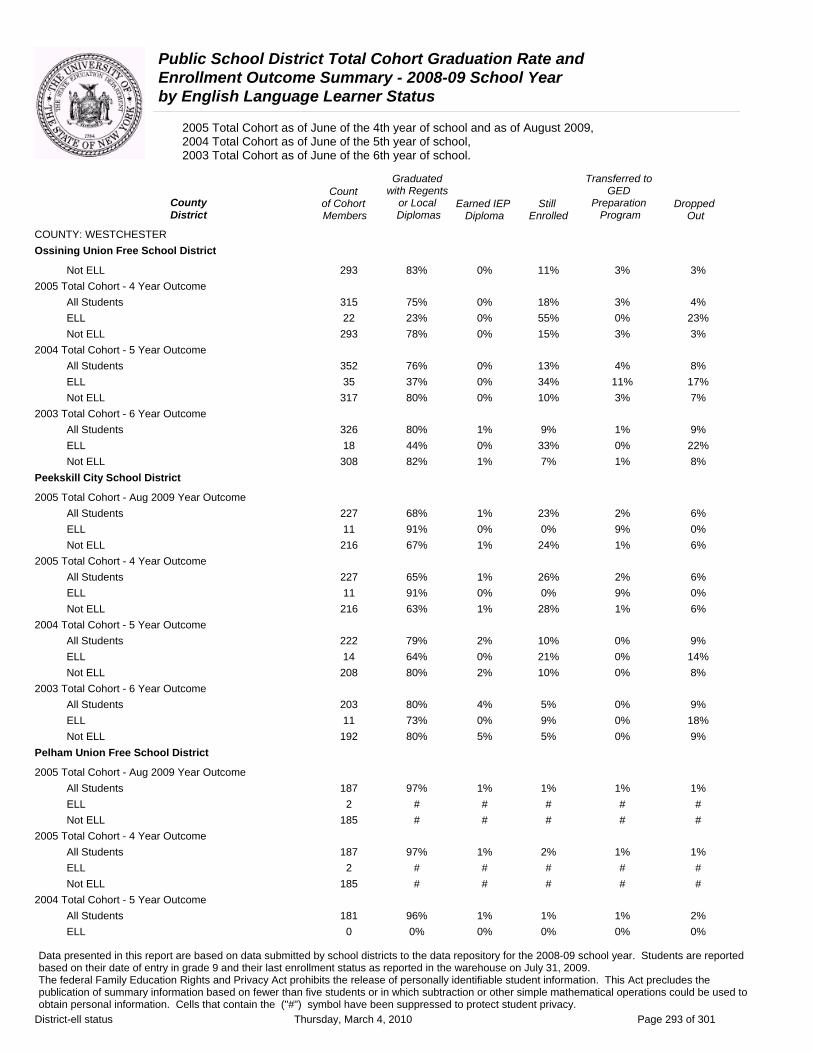
Public School District Total Cohort Graduation Rate and Enrollment Outcome Summary - 2008-09 School Year by English Language Learner Status
2005 Total Cohort as of June of the 4th year of school and as of August 2009, 2004 Total Cohort as of June of the 5th year of school, 2003 Total Cohort as of June of the 6th year of school.
Graduated Transferred to Count with Regents GED
County District
of Cohort Members
or Local Diplomas
Earned IEP Diploma
Still Enrolled
Preparation Program
Dropped Out
COUNTY: WESTCHESTER Ossining Union Free School District
Not ELL 293 83% 0% 11% 3% 3% 2005 Total Cohort - 4 Year Outcome
All Students 315 75% 0% 18% 3% 4% ELL 22 23% 0% 55% 0% 23% Not ELL 293 78% 0% 15% 3% 3%
2004 Total Cohort - 5 Year Outcome All Students 352 76% 0% 13% 4% 8% ELL 35 37% 0% 34% 11% 17% Not ELL 317 80% 0% 10% 3% 7%
2003 Total Cohort - 6 Year Outcome All Students 326 80% 1% 9% 1% 9% ELL 18 44% 0% 33% 0% 22% Not ELL 308 82% 1% 7% 1% 8%
Peekskill City School District
2005 Total Cohort - Aug 2009 Year Outcome All Students 227 68% 1% 23% 2% 6% ELL 11 91% 0% 0% 9% 0% Not ELL 216 67% 1% 24% 1% 6%
2005 Total Cohort - 4 Year Outcome All Students 227 65% 1% 26% 2% 6% ELL 11 91% 0% 0% 9% 0% Not ELL 216 63% 1% 28% 1% 6%
2004 Total Cohort - 5 Year Outcome All Students 222 79% 2% 10% 0% 9% ELL 14 64% 0% 21% 0% 14% Not ELL 208 80% 2% 10% 0% 8%
2003 Total Cohort - 6 Year Outcome All Students 203 80% 4% 5% 0% 9% ELL 11 73% 0% 9% 0% 18% Not ELL 192 80% 5% 5% 0% 9%
Pelham Union Free School District
2005 Total Cohort - Aug 2009 Year Outcome All Students 187 97% 1% 1% 1% 1% ELL 2 # # # # # Not ELL 185 # # # # #
2005 Total Cohort - 4 Year Outcome All Students 187 97% 1% 2% 1% 1% ELL 2 # # # # # Not ELL 185 # # # # #
2004 Total Cohort - 5 Year Outcome All Students 181 96% 1% 1% 1% 2% ELL 0 0% 0% 0% 0% 0%
Data presented in this report are based on data submitted by school districts to the data repository for the 2008-09 school year. Students are reported based on their date of entry in grade 9 and their last enrollment status as reported in the warehouse on July 31, 2009. The federal Family Education Rights and Privacy Act prohibits the release of personally identifiable student information. This Act precludes the publication of summary information based on fewer than five students or in which subtraction or other simple mathematical operations could be used to obtain personal information. Cells that contain the ("#") symbol have been suppressed to protect student privacy.
District-ell status Thursday, March 4, 2010 Page 293 of 301
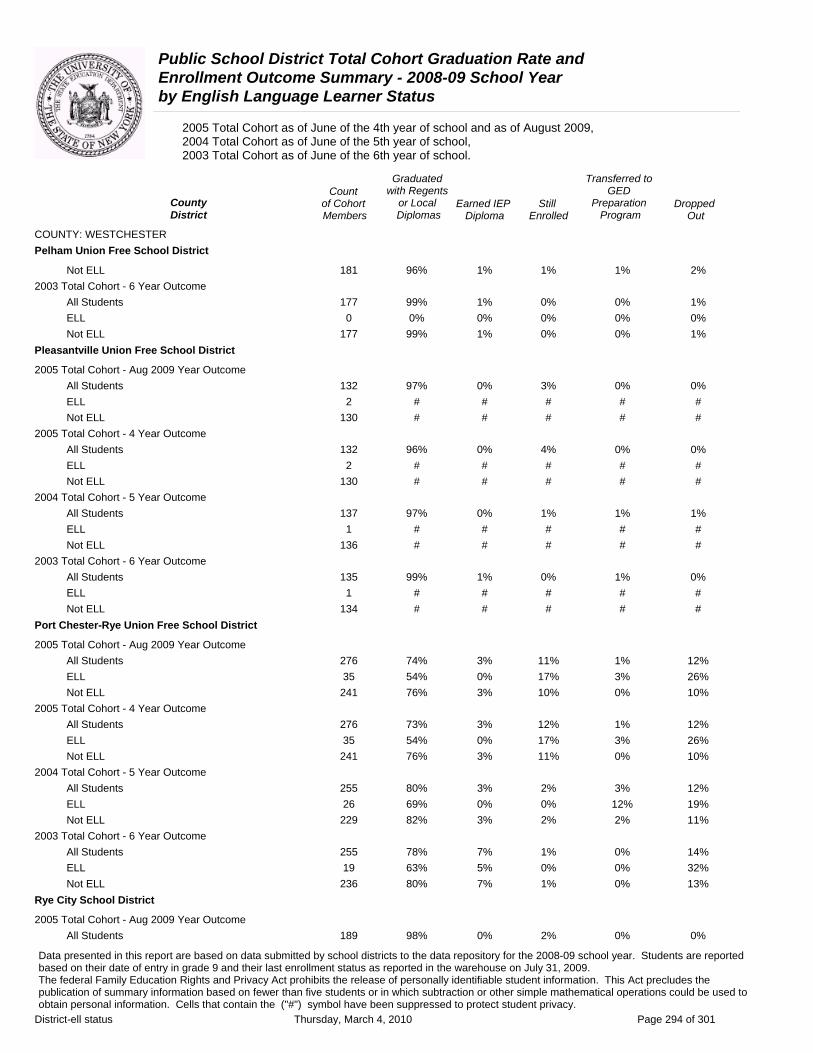
Public School District Total Cohort Graduation Rate and Enrollment Outcome Summary - 2008-09 School Year by English Language Learner Status
2005 Total Cohort as of June of the 4th year of school and as of August 2009, 2004 Total Cohort as of June of the 5th year of school, 2003 Total Cohort as of June of the 6th year of school.
County District
COUNTY: WESTCHESTER Pelham Union Free School District
Not ELL 2003 Total Cohort - 6 Year Outcome
All Students ELL Not ELL
Pleasantville Union Free School District
2005 Total Cohort - Aug 2009 Year Outcome All Students ELL Not ELL
2005 Total Cohort - 4 Year Outcome All Students ELL Not ELL
2004 Total Cohort - 5 Year Outcome All Students ELL Not ELL
2003 Total Cohort - 6 Year Outcome All Students ELL Not ELL
Port Chester-Rye Union Free School District
2005 Total Cohort - Aug 2009 Year Outcome All Students ELL Not ELL
2005 Total Cohort - 4 Year Outcome All Students ELL Not ELL
2004 Total Cohort - 5 Year Outcome All Students ELL Not ELL
2003 Total Cohort - 6 Year Outcome All Students ELL Not ELL
Rye City School District
2005 Total Cohort - Aug 2009 Year Outcome All Students
Count of Cohort Members
181
177 0
177
132 2
130
132 2
130
137 1
136
135 1
134
276 35
241
276 35
241
255 26
229
255 19
236
189
Graduated with Regents
or Local Diplomas
96% 1% 1%
99% 1% 0% 0% 0% 0%
99% 1% 0%
97% 0% 3% # # # # # #
96% 0% 4% # # # # # #
97% 0% 1% # # # # # #
99% 1% 0% # # # # # #
74% 3% 11% 54% 0% 17% 76% 3% 10%
73% 3% 12% 54% 0% 17% 76% 3% 11%
80% 3% 2% 69% 0% 0% 82% 3% 2%
78% 7% 1% 63% 5% 0% 80% 7% 1%
98%
Earned IEP Diploma
0%
Still Enrolled
2%
Transferred to GED
Preparation Program
Dropped Out
1% 2%
0% 0% 0%
1% 0% 1%
0% # #
0% # #
0% # #
0% # #
1% # #
1% # #
1% # #
0% # #
1% 3% 0%
12% 26% 10%
1% 3% 0%
12% 26% 10%
3% 12% 2%
12% 19% 11%
0% 0% 0%
14% 32% 13%
0% 0%
Data presented in this report are based on data submitted by school districts to the data repository for the 2008-09 school year. Students are reported based on their date of entry in grade 9 and their last enrollment status as reported in the warehouse on July 31, 2009. The federal Family Education Rights and Privacy Act prohibits the release of personally identifiable student information. This Act precludes the publication of summary information based on fewer than five students or in which subtraction or other simple mathematical operations could be used to obtain personal information. Cells that contain the ("#") symbol have been suppressed to protect student privacy.
District-ell status Thursday, March 4, 2010 Page 294 of 301
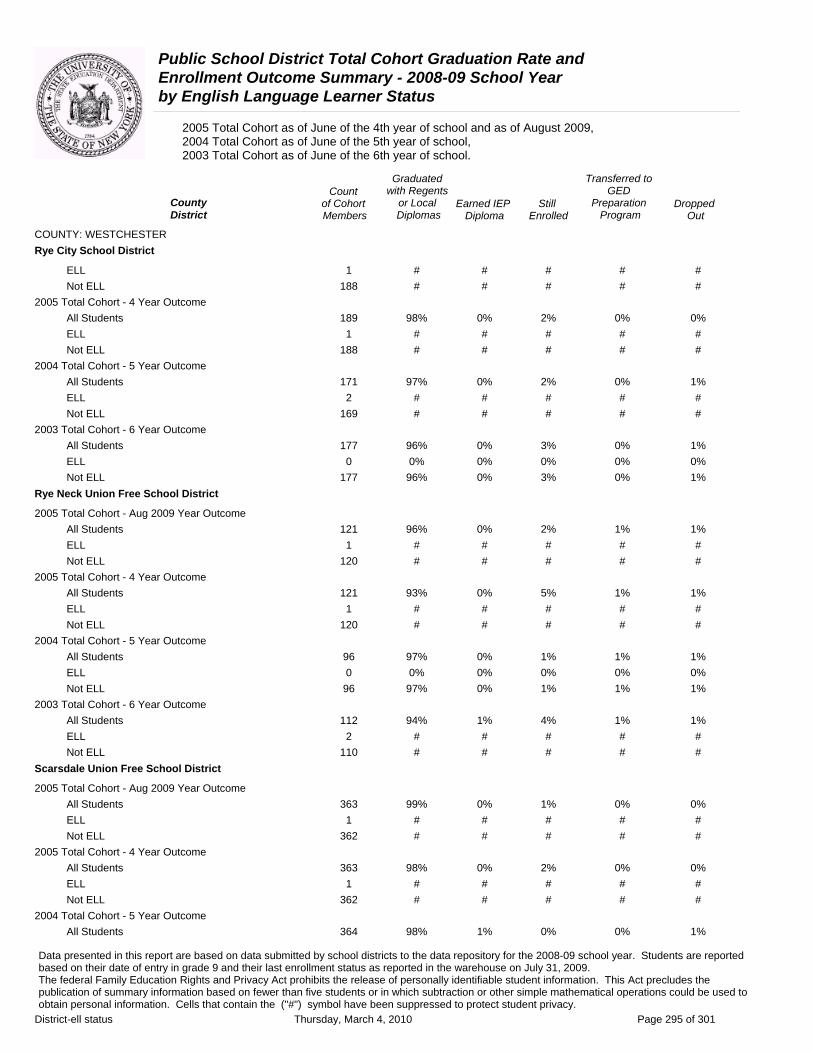
Public School District Total Cohort Graduation Rate and Enrollment Outcome Summary - 2008-09 School Year by English Language Learner Status
2005 Total Cohort as of June of the 4th year of school and as of August 2009, 2004 Total Cohort as of June of the 5th year of school, 2003 Total Cohort as of June of the 6th year of school.
County District
COUNTY: WESTCHESTER Rye City School District
ELL
Not ELL
2005 Total Cohort - 4 Year Outcome All Students ELL Not ELL
2004 Total Cohort - 5 Year Outcome All Students ELL Not ELL
2003 Total Cohort - 6 Year Outcome All Students ELL Not ELL
Rye Neck Union Free School District
2005 Total Cohort - Aug 2009 Year Outcome All Students ELL Not ELL
2005 Total Cohort - 4 Year Outcome All Students ELL Not ELL
2004 Total Cohort - 5 Year Outcome All Students ELL Not ELL
2003 Total Cohort - 6 Year Outcome All Students ELL Not ELL
Scarsdale Union Free School District
2005 Total Cohort - Aug 2009 Year Outcome All Students ELL Not ELL
2005 Total Cohort - 4 Year Outcome All Students ELL Not ELL
2004 Total Cohort - 5 Year Outcome All Students
Count of Cohort Members
1 188
189 1
188
171 2
169
177 0
177
121 1
120
121 1
120
96 0 96
112 2
110
363 1
362
363 1
362
364
Graduated with Regents
or Local Diplomas
#
#
98%
#
#
97%
#
#
96%
0%
96%
96%
#
#
93%
#
#
97%
0%
97%
94%
#
#
99%
#
#
98%
#
#
98%
Earned IEP Diploma
# # # #
0% 2% # # # #
0% 2% # # # #
0% 3% 0% 0% 0% 3%
0% 2% # # # #
0% 5% # # # #
0% 1% 0% 0% 0% 1%
1% 4% # # # #
0% 1% # # # #
0% 2% # # # #
1%
Still Enrolled
0%
Transferred to GED
Preparation Program
Dropped Out
# #
# #
0% # #
0% # #
0% # #
1% # #
0% 0% 0%
1% 0% 1%
1% # #
1% # #
1% # #
1% # #
1% 0% 1%
1% 0% 1%
1% # #
1% # #
0% # #
0% # #
0% # #
0% # #
0% 1%
Data presented in this report are based on data submitted by school districts to the data repository for the 2008-09 school year. Students are reported based on their date of entry in grade 9 and their last enrollment status as reported in the warehouse on July 31, 2009. The federal Family Education Rights and Privacy Act prohibits the release of personally identifiable student information. This Act precludes the publication of summary information based on fewer than five students or in which subtraction or other simple mathematical operations could be used to obtain personal information. Cells that contain the ("#") symbol have been suppressed to protect student privacy.
District-ell status Thursday, March 4, 2010 Page 295 of 301

Public School District Total Cohort Graduation Rate and Enrollment Outcome Summary - 2008-09 School Year by English Language Learner Status
2005 Total Cohort as of June of the 4th year of school and as of August 2009, 2004 Total Cohort as of June of the 5th year of school, 2003 Total Cohort as of June of the 6th year of school.
Graduated Transferred to Count with Regents GED
County of Cohort or Local Earned IEP Still Preparation DroppedDistrict Members Diplomas Diploma Enrolled Program Out
COUNTY: WESTCHESTER Scarsdale Union Free School District
ELL 4 # # # # # Not ELL 360 # # # # #
2003 Total Cohort - 6 Year Outcome All Students 348 99% 0% 0% 0% 1% ELL 1 # # # # # Not ELL 347 # # # # #
Somers Central School District
2005 Total Cohort - Aug 2009 Year Outcome All Students 237 95% 0% 3% 0% 1% ELL 1 # # # # # Not ELL 236 # # # # #
2005 Total Cohort - 4 Year Outcome All Students 237 95% 0% 4% 0% 1% ELL 1 # # # # # Not ELL 236 # # # # #
2004 Total Cohort - 5 Year Outcome All Students 232 97% 0% 1% 1% 1% ELL 0 0% 0% 0% 0% 0% Not ELL 232 97% 0% 1% 1% 1%
2003 Total Cohort - 6 Year Outcome All Students 239 98% 1% 0% 0% 1% ELL 0 0% 0% 0% 0% 0% Not ELL 239 98% 1% 0% 0% 1%
Tuckahoe Union Free School District
2005 Total Cohort - Aug 2009 Year Outcome All Students 71 92% 4% 3% 0% 1% ELL 1 # # # # # Not ELL 70 # # # # #
2005 Total Cohort - 4 Year Outcome All Students 71 90% 4% 4% 0% 1% ELL 1 # # # # # Not ELL 70 # # # # #
2004 Total Cohort - 5 Year Outcome All Students 61 97% 2% 0% 0% 2% ELL 1 # # # # # Not ELL 60 # # # # #
2003 Total Cohort - 6 Year Outcome All Students 67 93% 0% 0% 3% 4% ELL 2 # # # # # Not ELL 65 # # # # #
Data presented in this report are based on data submitted by school districts to the data repository for the 2008-09 school year. Students are reported based on their date of entry in grade 9 and their last enrollment status as reported in the warehouse on July 31, 2009. The federal Family Education Rights and Privacy Act prohibits the release of personally identifiable student information. This Act precludes the publication of summary information based on fewer than five students or in which subtraction or other simple mathematical operations could be used to obtain personal information. Cells that contain the ("#") symbol have been suppressed to protect student privacy.
District-ell status Thursday, March 4, 2010 Page 296 of 301

Public School District Total Cohort Graduation Rate and Enrollment Outcome Summary - 2008-09 School Year by English Language Learner Status
2005 Total Cohort as of June of the 4th year of school and as of August 2009, 2004 Total Cohort as of June of the 5th year of school, 2003 Total Cohort as of June of the 6th year of school.
Graduated Transferred to Count with Regents GED
County District
of Cohort Members
or Local Diplomas
Earned IEP Diploma
Still Enrolled
Preparation Program
Dropped Out
COUNTY: WESTCHESTER Union Free School District Of The Tarrytowns
2005 Total Cohort - Aug 2009 Year Outcome All Students 214 86% 1% 4% 1% 7% ELL 17 59% 0% 6% 0% 35% Not ELL 197 89% 2% 4% 1% 5%
2005 Total Cohort - 4 Year Outcome All Students 214 86% 1% 4% 1% 7% ELL 17 59% 0% 6% 0% 35% Not ELL 197 89% 2% 4% 1% 5%
2004 Total Cohort - 5 Year Outcome All Students 191 86% 2% 1% 2% 9% ELL 17 65% 0% 0% 0% 35% Not ELL 174 89% 2% 1% 2% 7%
2003 Total Cohort - 6 Year Outcome All Students 178 85% 3% 1% 2% 8% ELL 16 75% 6% 13% 0% 6% Not ELL 162 86% 2% 0% 2% 9%
Valhalla Union Free School District
2005 Total Cohort - Aug 2009 Year Outcome All Students 95 94% 0% 3% 0% 3% ELL 1 # # # # # Not ELL 94 # # # # #
2005 Total Cohort - 4 Year Outcome All Students 95 94% 0% 3% 0% 3% ELL 1 # # # # # Not ELL 94 # # # # #
2004 Total Cohort - 5 Year Outcome All Students 124 96% 2% 1% 0% 2% ELL 0 0% 0% 0% 0% 0% Not ELL 124 96% 2% 1% 0% 2%
2003 Total Cohort - 6 Year Outcome All Students 108 98% 0% 2% 0% 0% ELL 3 # # # # # Not ELL 105 # # # # #
White Plains City School District
2005 Total Cohort - Aug 2009 Year Outcome All Students 581 77% 0% 14% 3% 5% ELL 52 46% 0% 19% 8% 27% Not ELL 529 80% 0% 14% 3% 3%
2005 Total Cohort - 4 Year Outcome All Students 581 73% 1% 18% 3% 5% ELL 52 46% 0% 19% 8% 27% Not ELL 529 76% 1% 18% 3% 3%
Data presented in this report are based on data submitted by school districts to the data repository for the 2008-09 school year. Students are reported based on their date of entry in grade 9 and their last enrollment status as reported in the warehouse on July 31, 2009. The federal Family Education Rights and Privacy Act prohibits the release of personally identifiable student information. This Act precludes the publication of summary information based on fewer than five students or in which subtraction or other simple mathematical operations could be used to obtain personal information. Cells that contain the ("#") symbol have been suppressed to protect student privacy.
District-ell status Thursday, March 4, 2010 Page 297 of 301
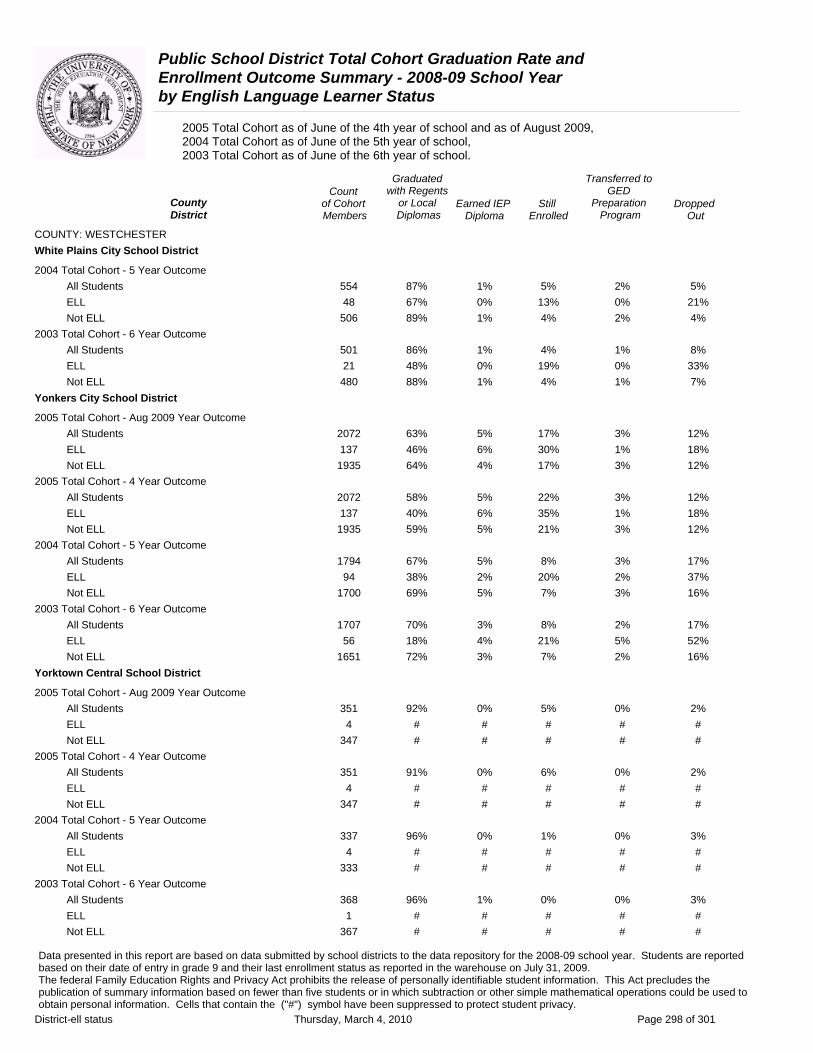
Public School District Total Cohort Graduation Rate and Enrollment Outcome Summary - 2008-09 School Year by English Language Learner Status
2005 Total Cohort as of June of the 4th year of school and as of August 2009, 2004 Total Cohort as of June of the 5th year of school, 2003 Total Cohort as of June of the 6th year of school.
Graduated Transferred to Count with Regents GED
County District
of Cohort Members
or Local Diplomas
Earned IEP Diploma
Still Enrolled
Preparation Program
Dropped Out
COUNTY: WESTCHESTER White Plains City School District
2004 Total Cohort - 5 Year Outcome All Students 554 87% 1% 5% 2% 5% ELL 48 67% 0% 13% 0% 21% Not ELL 506 89% 1% 4% 2% 4%
2003 Total Cohort - 6 Year Outcome All Students 501 86% 1% 4% 1% 8% ELL 21 48% 0% 19% 0% 33% Not ELL 480 88% 1% 4% 1% 7%
Yonkers City School District
2005 Total Cohort - Aug 2009 Year Outcome All Students 2072 63% 5% 17% 3% 12% ELL 137 46% 6% 30% 1% 18% Not ELL 1935 64% 4% 17% 3% 12%
2005 Total Cohort - 4 Year Outcome All Students 2072 58% 5% 22% 3% 12% ELL 137 40% 6% 35% 1% 18% Not ELL 1935 59% 5% 21% 3% 12%
2004 Total Cohort - 5 Year Outcome All Students 1794 67% 5% 8% 3% 17% ELL 94 38% 2% 20% 2% 37% Not ELL 1700 69% 5% 7% 3% 16%
2003 Total Cohort - 6 Year Outcome All Students 1707 70% 3% 8% 2% 17% ELL 56 18% 4% 21% 5% 52% Not ELL 1651 72% 3% 7% 2% 16%
Yorktown Central School District
2005 Total Cohort - Aug 2009 Year Outcome All Students 351 92% 0% 5% 0% 2% ELL 4 # # # # # Not ELL 347 # # # # #
2005 Total Cohort - 4 Year Outcome All Students 351 91% 0% 6% 0% 2% ELL 4 # # # # # Not ELL 347 # # # # #
2004 Total Cohort - 5 Year Outcome All Students 337 96% 0% 1% 0% 3% ELL 4 # # # # # Not ELL 333 # # # # #
2003 Total Cohort - 6 Year Outcome All Students 368 96% 1% 0% 0% 3% ELL 1 # # # # # Not ELL 367 # # # # #
Data presented in this report are based on data submitted by school districts to the data repository for the 2008-09 school year. Students are reported based on their date of entry in grade 9 and their last enrollment status as reported in the warehouse on July 31, 2009. The federal Family Education Rights and Privacy Act prohibits the release of personally identifiable student information. This Act precludes the publication of summary information based on fewer than five students or in which subtraction or other simple mathematical operations could be used to obtain personal information. Cells that contain the ("#") symbol have been suppressed to protect student privacy.
District-ell status Thursday, March 4, 2010 Page 298 of 301

Public School District Total Cohort Graduation Rate and Enrollment Outcome Summary - 2008-09 School Year by English Language Learner Status
2005 Total Cohort as of June of the 4th year of school and as of August 2009, 2004 Total Cohort as of June of the 5th year of school, 2003 Total Cohort as of June of the 6th year of school.
Graduated Transferred to Count with Regents GED
County District
of Cohort Members
or Local Diplomas
Earned IEP Diploma
Still Enrolled
Preparation Program
Dropped Out
COUNTY: WYOMING Attica Central School District
2005 Total Cohort - Aug 2009 Year Outcome All Students 153 88% 3% 7% 1% 1% ELL 0 0% 0% 0% 0% 0% Not ELL 153 88% 3% 7% 1% 1%
2005 Total Cohort - 4 Year Outcome All Students 153 88% 3% 7% 1% 1% ELL 0 0% 0% 0% 0% 0% Not ELL 153 88% 3% 7% 1% 1%
2004 Total Cohort - 5 Year Outcome All Students 146 90% 2% 3% 2% 2% ELL 0 0% 0% 0% 0% 0% Not ELL 146 90% 2% 3% 2% 2%
2003 Total Cohort - 6 Year Outcome All Students 148 92% 1% 3% 2% 2% ELL 0 0% 0% 0% 0% 0% Not ELL 148 92% 1% 3% 2% 2%
Letchworth Central School District
2005 Total Cohort - Aug 2009 Year Outcome All Students 103 88% 3% 7% 0% 2% ELL 0 0% 0% 0% 0% 0% Not ELL 103 88% 3% 7% 0% 2%
2005 Total Cohort - 4 Year Outcome All Students 103 88% 3% 7% 0% 2% ELL 0 0% 0% 0% 0% 0% Not ELL 103 88% 3% 7% 0% 2%
2004 Total Cohort - 5 Year Outcome All Students 81 74% 4% 2% 1% 19% ELL 0 0% 0% 0% 0% 0% Not ELL 81 74% 4% 2% 1% 19%
2003 Total Cohort - 6 Year Outcome All Students 109 83% 5% 1% 0% 11% ELL 0 0% 0% 0% 0% 0% Not ELL 109 83% 5% 1% 0% 11%
Perry Central School District
2005 Total Cohort - Aug 2009 Year Outcome All Students 95 72% 1% 8% 2% 17% ELL 0 0% 0% 0% 0% 0% Not ELL 95 72% 1% 8% 2% 17%
2005 Total Cohort - 4 Year Outcome All Students 95 72% 1% 8% 2% 17% ELL 0 0% 0% 0% 0% 0% Not ELL 95 72% 1% 8% 2% 17%
Data presented in this report are based on data submitted by school districts to the data repository for the 2008-09 school year. Students are reported based on their date of entry in grade 9 and their last enrollment status as reported in the warehouse on July 31, 2009. The federal Family Education Rights and Privacy Act prohibits the release of personally identifiable student information. This Act precludes the publication of summary information based on fewer than five students or in which subtraction or other simple mathematical operations could be used to obtain personal information. Cells that contain the ("#") symbol have been suppressed to protect student privacy.
District-ell status Thursday, March 4, 2010 Page 299 of 301
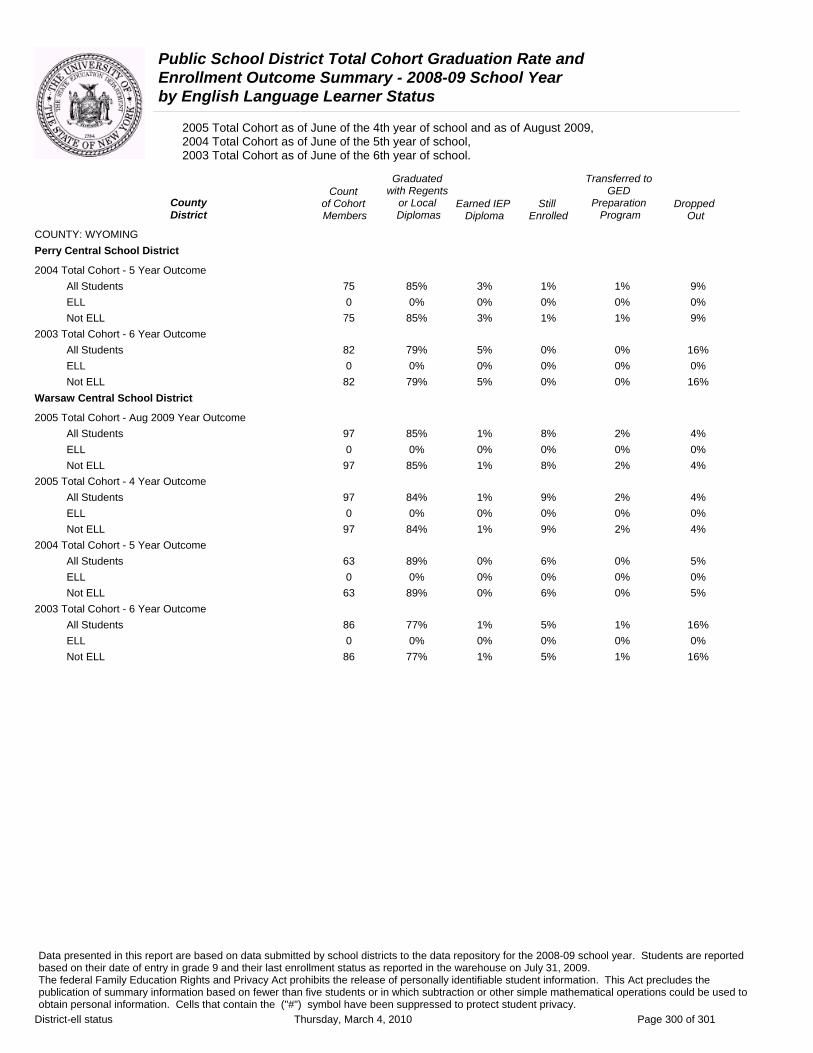
Public School District Total Cohort Graduation Rate and Enrollment Outcome Summary - 2008-09 School Year by English Language Learner Status
2005 Total Cohort as of June of the 4th year of school and as of August 2009, 2004 Total Cohort as of June of the 5th year of school, 2003 Total Cohort as of June of the 6th year of school.
Graduated Transferred to Count with Regents GED
County of Cohort or Local Earned IEP Still Preparation DroppedDistrict Members Diplomas Diploma Enrolled Program Out
COUNTY: WYOMING Perry Central School District
2004 Total Cohort - 5 Year Outcome All Students 75 85% 3% 1% 1% 9% ELL 0 0% 0% 0% 0% 0% Not ELL 75 85% 3% 1% 1% 9%
2003 Total Cohort - 6 Year Outcome All Students 82 79% 5% 0% 0% 16% ELL 0 0% 0% 0% 0% 0% Not ELL 82 79% 5% 0% 0% 16%
Warsaw Central School District
2005 Total Cohort - Aug 2009 Year Outcome All Students 97 85% 1% 8% 2% 4% ELL 0 0% 0% 0% 0% 0% Not ELL 97 85% 1% 8% 2% 4%
2005 Total Cohort - 4 Year Outcome All Students 97 84% 1% 9% 2% 4% ELL 0 0% 0% 0% 0% 0% Not ELL 97 84% 1% 9% 2% 4%
2004 Total Cohort - 5 Year Outcome All Students 63 89% 0% 6% 0% 5% ELL 0 0% 0% 0% 0% 0% Not ELL 63 89% 0% 6% 0% 5%
2003 Total Cohort - 6 Year Outcome All Students 86 77% 1% 5% 1% 16% ELL 0 0% 0% 0% 0% 0% Not ELL 86 77% 1% 5% 1% 16%
Data presented in this report are based on data submitted by school districts to the data repository for the 2008-09 school year. Students are reported based on their date of entry in grade 9 and their last enrollment status as reported in the warehouse on July 31, 2009. The federal Family Education Rights and Privacy Act prohibits the release of personally identifiable student information. This Act precludes the publication of summary information based on fewer than five students or in which subtraction or other simple mathematical operations could be used to obtain personal information. Cells that contain the ("#") symbol have been suppressed to protect student privacy.
District-ell status Thursday, March 4, 2010 Page 300 of 301

Public School District Total Cohort Graduation Rate and Enrollment Outcome Summary - 2008-09 School Year by English Language Learner Status
2005 Total Cohort as of June of the 4th year of school and as of August 2009, 2004 Total Cohort as of June of the 5th year of school, 2003 Total Cohort as of June of the 6th year of school.
Graduated Transferred to Count with Regents GED
County of Cohort or Local Earned IEP Still Preparation DroppedDistrict Members Diplomas Diploma Enrolled Program Out
COUNTY: YATES Dundee Central School District
2005 Total Cohort - Aug 2009 Year Outcome All Students 69 78% 4% 4% 0% 13% ELL 0 0% 0% 0% 0% 0% Not ELL 69 78% 4% 4% 0% 13%
2005 Total Cohort - 4 Year Outcome All Students 69 77% 4% 6% 0% 13% ELL 0 0% 0% 0% 0% 0% Not ELL 69 77% 4% 6% 0% 13%
2004 Total Cohort - 5 Year Outcome All Students 76 80% 3% 8% 1% 8% ELL 0 0% 0% 0% 0% 0% Not ELL 76 80% 3% 8% 1% 8%
2003 Total Cohort - 6 Year Outcome All Students 79 77% 6% 8% 3% 6% ELL 0 0% 0% 0% 0% 0% Not ELL 79 77% 6% 8% 3% 6%
Penn Yan Central School District
2005 Total Cohort - Aug 2009 Year Outcome All Students 178 67% 6% 7% 6% 13% ELL 1 # # # # # Not ELL 177 # # # # #
2005 Total Cohort - 4 Year Outcome All Students 178 61% 6% 13% 6% 13% ELL 1 # # # # # Not ELL 177 # # # # #
2004 Total Cohort - 5 Year Outcome All Students 158 84% 3% 0% 5% 8% ELL 0 0% 0% 0% 0% 0% Not ELL 158 84% 3% 0% 5% 8%
2003 Total Cohort - 6 Year Outcome All Students 155 85% 3% 1% 5% 6% ELL 0 0% 0% 0% 0% 0% Not ELL 155 85% 3% 1% 5% 6%
Data presented in this report are based on data submitted by school districts to the data repository for the 2008-09 school year. Students are reported based on their date of entry in grade 9 and their last enrollment status as reported in the warehouse on July 31, 2009. The federal Family Education Rights and Privacy Act prohibits the release of personally identifiable student information. This Act precludes the publication of summary information based on fewer than five students or in which subtraction or other simple mathematical operations could be used to obtain personal information. Cells that contain the ("#") symbol have been suppressed to protect student privacy.
District-ell status Thursday, March 4, 2010 Page 301 of 301