public school teachers’ perceptions of administrative
TRANSCRIPT
.
Public School Teachers’ Perceptions of Administrative Support and its Mediating
Effect on Their Job Satisfaction and Intent to Stay in Teaching
Benjamin R. Tickle
Dissertation submitted to the faculty of the Virginia Polytechnic Institute and State University in partial fulfillment of the requirements for the degree of
Doctor of Philosophy
In Administration and Supervision of Special Education
Dr. Richard Salmon, Co-Chair Dr. Mido Chang, Co-Chair
Dr. David Alexander Dr. Rose Martin
Dr. Robert McCracken
August 29, 2008 Blacksburg, Virginia
Keywords: Administrative Support, Job Satisfaction, Teacher Attrition, Teaching
Experience, Student Behavior, Teachers’ Satisfaction with their Salary, Environmental Setting of the School
Copyright 2008, Benjamin Tickle

.
Public School Teachers’ Perceptions of Administrative Support and its Mediating Effect
on Their Job Satisfaction and Intent to Stay in Teaching
Benjamin R. Tickle
ABSTRACT
Due to a high rate of teacher attrition currently being experienced in public
schools, a teacher shortage may be looming in the near future. Research shows that attrition rates are highest among novice teachers. In part, teacher attrition has also made it increasingly difficult for schools to meet the “highly qualified” requirement of the No Child Left Behind Act of 2001. Past efforts to reverse this trend have concentrated on increasing the supply of qualified teachers; however, more recent studies have shown that the solution lies partially in raising retention rates. Research has identified several reasons teachers have left the profession, such as, low salary, student misbehavior and working conditions, including administrative support. Another common thread among teachers who leave the profession has been dissatisfaction with working conditions in their school.
This study examined the relationship between teachers’ intent to stay in teaching, teachers’ job satisfaction, perceived administrative support, teaching experience, perceived student behavior, and teachers’ satisfaction with their salaries. After the conduct of a preliminary descriptive analysis, a hypothesized path model was employed through the use of four different samples derived from the 2003-04 Schools and Staffing Survey, Public School Teacher Questionnaire (Form SASS-4A). The first sample was the combined environmental setting. The second, third, and fourth sub-samples were urban, urban fringe, and rural samples, respectively, as identified by the respondent.
Based on the path analysis, perceived administrative support, teaching experience, perceived student behavior, and teachers’ satisfaction with their salary were identified as significant predictors of teachers’ job satisfaction and intent to stay in teaching. Administrative support was the most significant predictor of teachers’ job satisfaction, while teachers’ job satisfaction was the most significant predictor of teachers’ intent to stay in teaching. The path analysis also confirmed that perceived administrative support mediates the effect of teaching experience, perceived student behavior, and teachers’ satisfaction with their salary relative to both teachers’ job satisfaction and intent to stay in teaching. No significant differences were found among the sample and their sub-samples based on the environmental setting of the school.
iii
Dedication
First and foremost, I dedicate this dissertation to God the Father from whom all
blessings flow. My prayer is that I will continue to be a good steward of the abilities and
gifts which you have loaned me. God has blessed me with an amazing family; I dedicate
this dissertation to you. To my “Proverbs 31” wife and best friend, Amy, we have
persevered and overcome this process together. To Lauren and Logan, my babies, the joy
that comes from being your father is indescribable. To my father, Dan, thank you for
your unconditional love and support over the years. To mom, you never had any doubt
that I could accomplish such a feat, rest peacefully. Last, I dedicate this dissertation to
Brie Anne Reynolds. You inspired me immensely for the twenty-one short years you
were here on earth, and you continue to inspire me from heaven. You were and will
always be the first doctor in the family.
iv
Acknowledgements
First, I give all the glory for this dissertation to God the Father and His Son, Jesus
Christ, my Lord and Savior. According to your word in Philippians 4:13 (NKJV), “I can
do all things through Christ who strengthens me.” Your plan is perfect!
I want to acknowledge all of my family and friends, too many to name, God
placed all of you in my life for a specific purpose. I love you all! Specifically, I would
like to thank my wife, Amy, for all of your love and support. I want to thank my
daughter, Lauren, and son, Logan, for your love, patience, and understanding. To my
father, Dan, I want to thank you for always believing in me. Debbie and Lindley, I love
you both, thanks for your support. To Ms. Brenda Waller, the best English teacher in the
world, thank you for never accepting anything less than my best effort. And, to my
T/TAC family, thank you for all of your support and encouragement.
I want to acknowledge Dr. Mido Chang for all of your help, support, and
guidance. You are definitely part of God’s perfect plan for my life. You are a great
friend and a wonderful mentor. I also want to thank Dr. Richard Salmon for your
assistance and encouragement. You took me under your wing as an “orphan” and never
gave up on me. To Dr. Rose Martin, thank you for your willingness to support me. Your
insight and knowledge of the process was so valuable. To Dr. Bob McCracken, thanks
for your encouragement and words of wisdom. Your dedication inspires me. Finally, I
would like to thank Dr. David Alexander for sharing your insight and wisdom.
Hellen Keller once said, “Alone we can do so little; together we can do so much.”
My success is a reflection of the contributions and sacrifices made by my family, friends,
and committee. Thank you all!
v
Table of Contents
Abstract ............................................................................................................................... ii
Dedication .......................................................................................................................... iii
Acknowledgements............................................................................................................ iv
Table of Contents.................................................................................................................v
List of Tables ..................................................................................................................... ix
List of Figures .................................................................................................................... xi
Chapter One: Introduction to the Study ..............................................................................1
Statement of the Problem.........................................................................................3
Teacher Attrition .........................................................................................3
Teachers Job Satisfaction.............................................................................3
The Relationship between Teacher Attrition, Teacher Job
Satisfaction, and Student Achievement .......................................................4
Policy Context of the Problem.................................................................................4
Teacher Attrition and NCLB .......................................................................4
Administrative Support and the ISLLC Standards ......................................5
Need and Purpose for the Study...............................................................................6
Research Questions..................................................................................................7
Theoretical Framework............................................................................................7
Definitions of the Variables Used in the Study .....................................................10
Limitations of the Study.........................................................................................12
Significance of the Study .......................................................................................12
Chapter Two: Review of the Related Literature ...............................................................13
Teachers’ Intent to Stay in Teaching .....................................................................14
Teacher Turnover.......................................................................................14
Reasons for Teacher Attrition....................................................................15
Teacher Recruitment as a Response to Teacher Attrition..........................16
Characteristics of Teachers Who Remain in Teaching..............................17
Teachers’ Job Satisfaction .....................................................................................17
vi
Administrative Support..........................................................................................19
Administrative Support and Teachers’ Intent to Stay in Teaching............21
Administrative Support and Teachers’ Job Satisfaction............................22
Teaching Experience..............................................................................................22
Teaching Experience and Teachers’ Intent to Stay in
Teaching.....................................................................................................22
Teaching Experience and Teachers’ Job Satisfaction................................23
Teaching Experience and Administrative Support ....................................23
Student Behavior....................................................................................................23
Student Behavior and Teachers’ Intent to Stay in Teaching......................23
Student Behavior and Teachers’ Job Satisfaction......................................23
Student Behavior and Teaching Experience ..............................................24
Teachers’ Satisfaction with their Salary ................................................................24
Teachers’ Satisfaction with their Salary and Teachers’ Intent to Stay in
Teaching.....................................................................................................24
Teachers’ Satisfaction with their Salary and Teachers’ Job Satisfaction ..24
Teachers’ Satisfaction with their Salary and Administrative Support.......25
Teachers’ Satisfaction with their Salary and Teaching Experience...........25
Environmental Setting of the School .....................................................................25
Environmental Setting of the School and Teachers’ Intent to Stay in
Teaching.....................................................................................................25
Environmental Setting of the School and Teachers’ Job Satisfaction .......25
Environmental Setting of the School and Administrative Support............26
Environmental Setting of the School and Student Behavior .....................26
Environmental Setting of the School and Teachers’ Satisfaction with their
Salary .........................................................................................................26
Summary of the Literature Review........................................................................26
Chapter Three: Methodology............................................................................................31
Research Design.....................................................................................................31
Model Specification ...................................................................................31
vii
Data ........................................................................................................................34
Sampling Method.......................................................................................37
Population and Sample ..............................................................................40
Variables ................................................................................................................44
Teachers’ Intent to Stay in Teaching .........................................................44
Teachers’ Job Satisfaction .........................................................................44
Perceived Administrative Support .............................................................44
Teaching Experience..................................................................................45
Perceived Student Behavior.......................................................................46
Teachers’ Satisfaction with their Salary ....................................................46
Chapter Four: Results of the Study...................................................................................49
Preliminary Analysis..............................................................................................50
Descriptive Statistics..................................................................................50
Pearson Correlation....................................................................................54
Path Model Analysis ..............................................................................................57
Overall Sample...........................................................................................57
Urban Sample.............................................................................................59
Urban Fringe Sample .................................................................................61
Rural Sample..............................................................................................63
Proportion of Variance Explained as Effect Size ..................................................65
R2 and Adjusted R2 for the Dependent Variable of Perceived
Administrative Support..............................................................................65
R2 and Adjusted R2 for the Dependent Variable of Teachers’ Job
Satisfaction.................................................................................................67
R2 and Adjusted R2 for the Dependent Variable Teachers’ Intent to Stay in
Teaching.....................................................................................................68
Mediating Variable Analysis .................................................................................69
Chapter Five: Discussion ..................................................................................................75
Teaching Experience..............................................................................................77
Perceived Student Behavior...................................................................................79
Teachers’ Satisfaction with their Salary ................................................................81
viii
Perceived Administrative Support .........................................................................82
The Mediating Effect of Perceived Administrative Support .....................84
Teachers’ Job Satisfaction .....................................................................................84
Environmental Setting of the School .....................................................................86
Summary ................................................................................................................86
Recommendations for Practice ..............................................................................87
Recommendations for Future Research .................................................................88
References..........................................................................................................................90
ix
List of Tables
Table 1.1: Definitions for the Theoretical Framework: The Relationship between Teacher Intent to Stay in Teaching, Teacher Job Satisfaction, Perceived Administrative Support, Teaching Experience, Perceived Student Behavior, and Teacher Satisfaction with Salary...............................................................10
Table 3.1: Unweighted and Base-Weighted response rate for the 2003-04 form SASS-4A, Public School Teacher Questionnaire ............................................37 Table 3.2: 2003-04 SASS Sample ....................................................................................40 Table 3.3: Average number of new and experienced teachers selected per public school
for the 2003-04 SASS, excluding Asian or Pacific Islander or American Indian or Alaska Native teachers .....................................................................41
Table 3.4: Number of Public School Teachers Selected for the 2003-04 SASS, by School Type and Teacher Stratum...................................................................42 Table 3.5: Selection criteria of participants from the SASS-4A respondents...................43 Table 3.6: Cross Tabulation results for the selection of regular full-time teachers..........43 Table 3.7: Form SASS-4A Questions used to measure independent and dependent
variables ...........................................................................................................47 Table 4.1: Descriptive Statistics using SPSS, no weight or design effect was
considered ........................................................................................................53 Table 4.2: Descriptive Statistics using AM Statistical Software, weights and design effect applied....................................................................................................53 Table 4.3: Pearson correlation coefficients (r) using SPSS with no weights or design
effect applied, including the level of significance. The number in parentheses indicates the Pearson correlation coefficients with the weight and design effect applied through the use of AM statistical software .............56 Table 4.4: The R2 and adjusted R2 when perceived administrative support was regressed on the combined independent variables of teaching experience,
perceived student behavior, and teachers’ satisfaction with their salary, according to the environmental setting of the school ......................................66
Table 4.5: The R2 and adjusted R2 when teachers’ job satisfaction was regressed on the combined independent variables of teaching experience, perceived student behavior, teachers’ satisfaction with their salary, and perceived
administrative support, according to the environmental setting of the school ...............................................................................................................67
x
Table 4.6: The R2 and adjusted R2 when teachers’ intent to stay in teaching was regressed on the combined independent variables of teaching experience, perceived student behavior, teachers’ satisfaction with their salary,
perceived administrative support, and teachers’ job satisfaction, according to the environmental setting of the school .......................................................68 Table 4.7: Pearson correlation coefficients (r) using SPSS, including the level of
significance ......................................................................................................69 Table 4.8: Regression coefficients and standard errors for the two parts of the mediating path of each mediating path being evaluated to test for the
mediating effect of perceived administrative support......................................71 Table 4.9: Path coefficient and standard error for the combined path for each path a and b being analyzed to determine the possible mediating effect of perceived administrative support .....................................................................72 Table 4.10:The t ratio and mediating status based on the determining criteria for each
suspected mediating path .................................................................................73 Table 5.1: The standardized coefficient beta for the variable teaching experience relative to perceived administrative support, teachers’ job satisfaction, and
teachers’ intent to stay in teaching, according to the environmental setting of the teacher’s (respondent’s) school .............................................................78 Table 5.2: The standardized coefficient beta for the variable perceived student behavior relative to perceived administrative support, teachers’ job
satisfaction, and teachers’ intent to stay in teaching, according to the environmental setting of the teacher’s (respondent’s) school..........................80
Table 5.3: The standardized coefficient beta for the variable teachers’ satisfaction with their salary relative to perceived administrative support, teachers’ job
satisfaction, and teachers’ intent to stay in teaching, according to the environmental setting of the teacher’s (respondent’s) school..........................82
Table 5.4: The standardized coefficient beta for the variable perceived administrative
support, according to the environmental setting of the teacher’s (respondent’s) school .......................................................................................83 Table 5.5: The standardized coefficient beta for the variable teachers’ job satisfaction,
according to the environmental setting of the teacher’s (respondent’s) School ..............................................................................................................85
xi
List of Figures
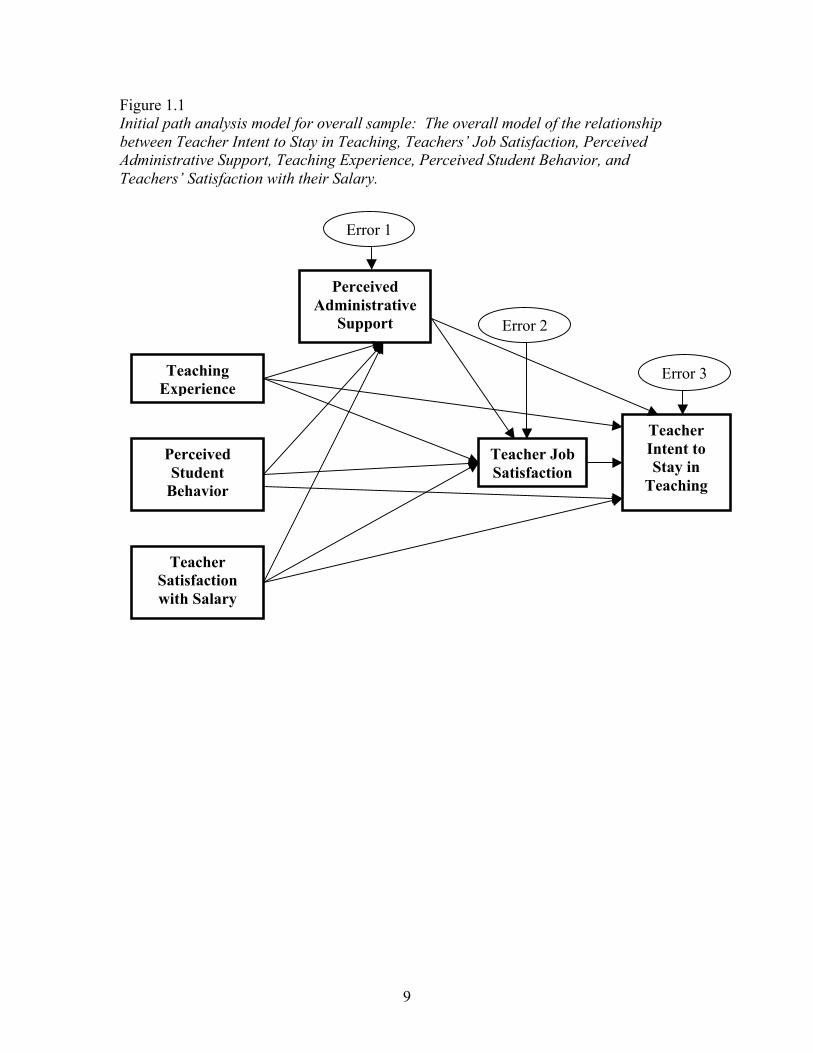
Figure 1.1: Initial path analysis model for overall sample: The overall model of the relationship between Teacher Intent to Stay in Teaching, Teachers’ Job Satisfaction, Perceived Administrative Support, Teaching Experience, Perceived Student Behavior, and Teachers’ Satisfaction with Salary ............9
Figure 3.1: Initial path analysis model for overall sample: The overall model of the
relationship between Teacher Intent to Stay in Teaching, Teachers’ Job Satisfaction, Perceived Administrative Support, Teaching Experience, Perceived Student Behavior, and Teachers’ Satisfaction with Salary ..........33
Figure 4.1: Path analysis model for the overall sample ..................................................58 Figure 4.2: Path analysis model for the urban sample ....................................................60 Figure 4.3: Path analysis model for the urban fringe sample .........................................62 Figure 4.4: Path analysis model for the rural sample......................................................64

1
Chapter One:
Introduction to the Study
The teacher attrition rate in public education, or the velocity at which teachers
leave the profession, is disproportionately higher than for other professions (Liu &
Meyer, 2005). Ingersoll and Smith (2003) report that “after just five years between forty
to fifty percent of all beginning teachers have left the profession (pg.31).” This
consistent loss of teachers, especially novice teachers, from the already limited supply of
those entering the field is likely to create a teacher shortage as student populations
continue to rise. This shortage will be compounded by the oncoming retirement wave of
teachers from the baby boom generation (Liu & Meyer, 2005). In addition, the
phenomenon of teacher attrition is making it increasingly difficult for school districts to
secure “highly qualified” teachers (Bush & Department of Education, 2001), and thus
compromises the quality of instruction.
Policymakers have responded by implementing programs intended to increase the
supply of qualified teachers. Both state and local education agencies have offered
various career incentives to prospective teachers in an effort to increase the number of
qualified applicants, but have often neglected to properly address teacher attrition. The
problem of a teacher shortage must include efforts to improve teacher retention (Ingersoll
& Smith, 2003). Failing to address the issue of retaining teachers defeats the purpose for
increasing the supply of teachers.
It has also been established that increased teacher job satisfaction reduces
attrition, enhances collegiality, improves job performance, and positively affects student
outcomes (Shann, 1998). Liu and Meyer (2005) suggest there is a direct link between job
satisfaction and teacher attrition. Therefore, identifying strategies that increase teacher
job satisfaction should increase teacher retention (Woods & Weasmer, 2004).
One variable that has over time remained a consistent predictor of teacher attrition
and job satisfaction is compensation. Liu and Meyer (2005) found that low compensation
was the leading cause of teachers’ lack of satisfaction with their job. Among beginning
teachers who left the profession, more than seventy five percent linked their departure to
low salary (Ingersoll & Smith, 2003). Darling-Hammond (2003) found that teacher
2
salaries are about twenty percent lower, on average, compared to other professions that
require similar education and training.
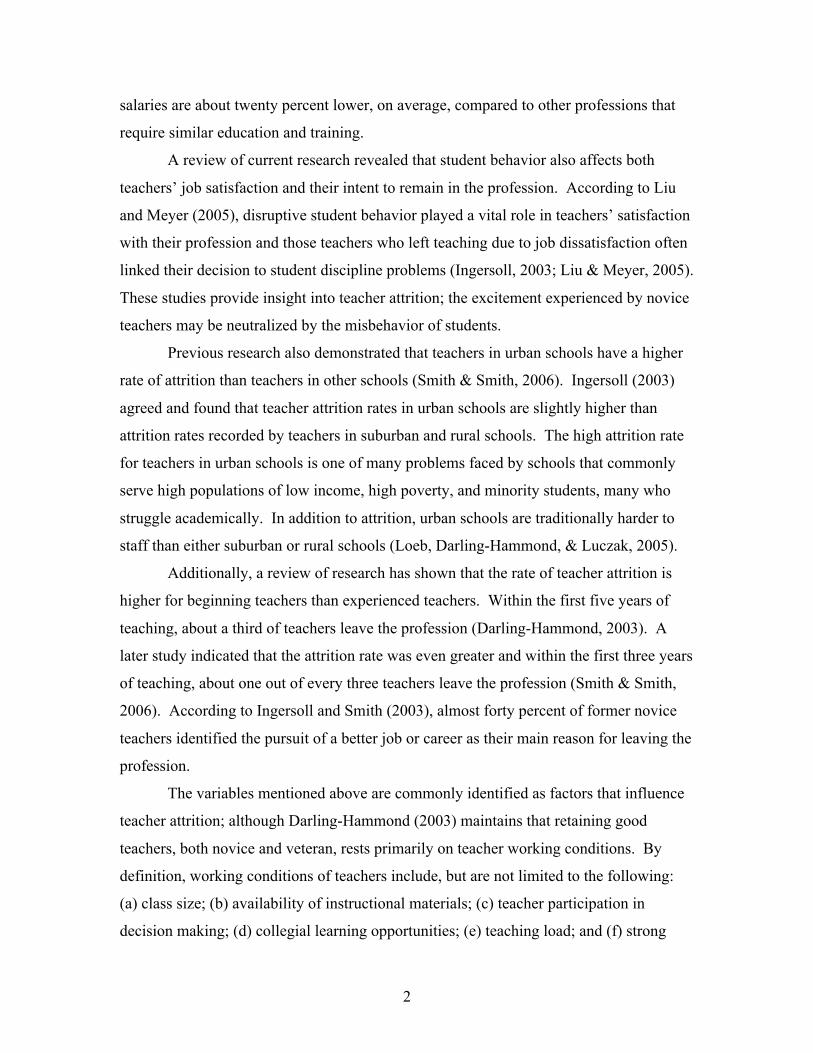
A review of current research revealed that student behavior also affects both
teachers’ job satisfaction and their intent to remain in the profession. According to Liu
and Meyer (2005), disruptive student behavior played a vital role in teachers’ satisfaction
with their profession and those teachers who left teaching due to job dissatisfaction often
linked their decision to student discipline problems (Ingersoll, 2003; Liu & Meyer, 2005).
These studies provide insight into teacher attrition; the excitement experienced by novice
teachers may be neutralized by the misbehavior of students.
Previous research also demonstrated that teachers in urban schools have a higher
rate of attrition than teachers in other schools (Smith & Smith, 2006). Ingersoll (2003)
agreed and found that teacher attrition rates in urban schools are slightly higher than
attrition rates recorded by teachers in suburban and rural schools. The high attrition rate
for teachers in urban schools is one of many problems faced by schools that commonly
serve high populations of low income, high poverty, and minority students, many who
struggle academically. In addition to attrition, urban schools are traditionally harder to
staff than either suburban or rural schools (Loeb, Darling-Hammond, & Luczak, 2005).
Additionally, a review of research has shown that the rate of teacher attrition is
higher for beginning teachers than experienced teachers. Within the first five years of
teaching, about a third of teachers leave the profession (Darling-Hammond, 2003). A
later study indicated that the attrition rate was even greater and within the first three years
of teaching, about one out of every three teachers leave the profession (Smith & Smith,
2006). According to Ingersoll and Smith (2003), almost forty percent of former novice
teachers identified the pursuit of a better job or career as their main reason for leaving the
profession.
The variables mentioned above are commonly identified as factors that influence
teacher attrition; although Darling-Hammond (2003) maintains that retaining good
teachers, both novice and veteran, rests primarily on teacher working conditions. By
definition, working conditions of teachers include, but are not limited to the following:
(a) class size; (b) availability of instructional materials; (c) teacher participation in
decision making; (d) collegial learning opportunities; (e) teaching load; and (f) strong
3
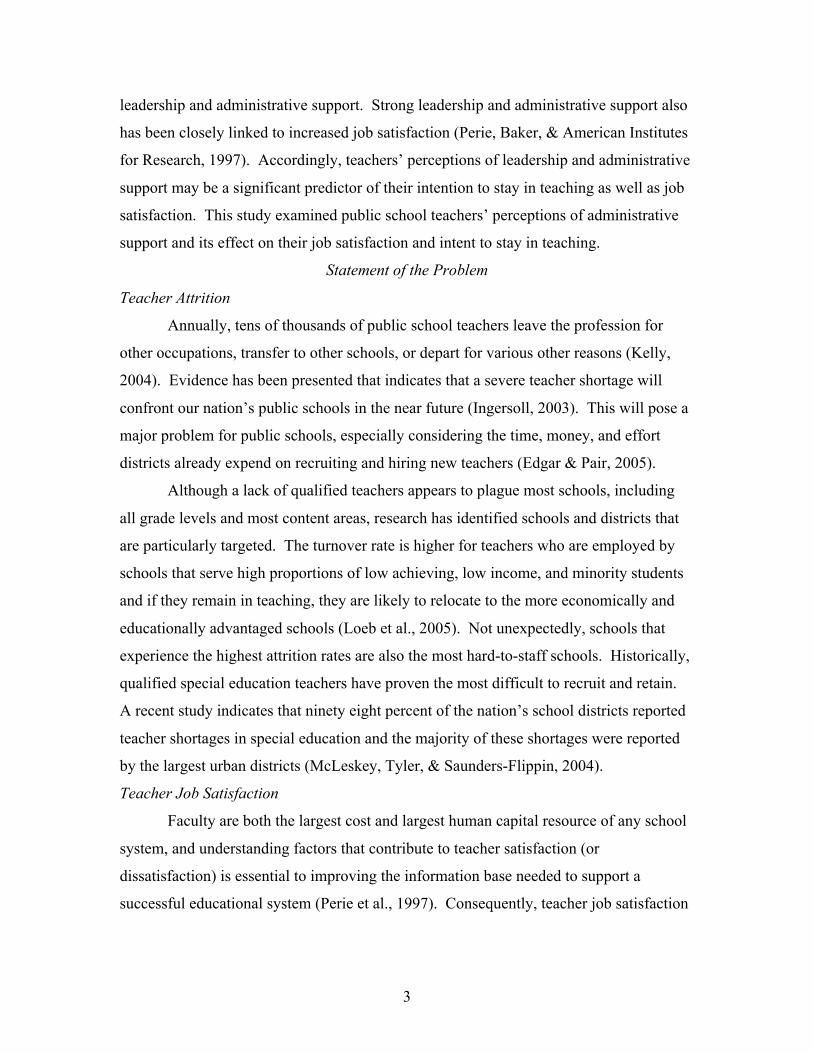
leadership and administrative support. Strong leadership and administrative support also
has been closely linked to increased job satisfaction (Perie, Baker, & American Institutes
for Research, 1997). Accordingly, teachers’ perceptions of leadership and administrative
support may be a significant predictor of their intention to stay in teaching as well as job
satisfaction. This study examined public school teachers’ perceptions of administrative
support and its effect on their job satisfaction and intent to stay in teaching.
Statement of the Problem
Teacher Attrition
Annually, tens of thousands of public school teachers leave the profession for
other occupations, transfer to other schools, or depart for various other reasons (Kelly,
2004). Evidence has been presented that indicates that a severe teacher shortage will
confront our nation’s public schools in the near future (Ingersoll, 2003). This will pose a
major problem for public schools, especially considering the time, money, and effort
districts already expend on recruiting and hiring new teachers (Edgar & Pair, 2005).
Although a lack of qualified teachers appears to plague most schools, including
all grade levels and most content areas, research has identified schools and districts that
are particularly targeted. The turnover rate is higher for teachers who are employed by
schools that serve high proportions of low achieving, low income, and minority students
and if they remain in teaching, they are likely to relocate to the more economically and
educationally advantaged schools (Loeb et al., 2005). Not unexpectedly, schools that
experience the highest attrition rates are also the most hard-to-staff schools. Historically,
qualified special education teachers have proven the most difficult to recruit and retain.
A recent study indicates that ninety eight percent of the nation’s school districts reported
teacher shortages in special education and the majority of these shortages were reported
by the largest urban districts (McLeskey, Tyler, & Saunders-Flippin, 2004).
Teacher Job Satisfaction
Faculty are both the largest cost and largest human capital resource of any school
system, and understanding factors that contribute to teacher satisfaction (or
dissatisfaction) is essential to improving the information base needed to support a
successful educational system (Perie et al., 1997). Consequently, teacher job satisfaction
4
has been shown to be a predictor of teacher retention and a determinant of teacher
commitment, which contributes to school effectiveness (Shann, 1998).
Unfortunately, many teachers report that they are not satisfied with their jobs.
According to Perie et al. (1997) thirty four percent of their participants from a national
data set indicated they were not sure if they would again choose a teaching career. A
majority indicated that it was a waste of time to try to do their best job as a teacher.
The Relationship between Teacher Attrition, Teacher Job Satisfaction, and Student
Achievement
Teacher turnover, when teachers either cease teaching (attrition) or transfer to
other schools, disrupts the learning process and leads to substandard instruction (Liu &
Meyer, 2005). According to Ingersoll and Smith (2003) a high turnover rate of teachers
does not only create staffing problems; but also harms the school environment and
student performance. Liu and Meyer (2005) suggest that the inability of school districts
to recruit qualified replacements in a timely manner will force them to hire temporary
teachers, or relax employment criteria so that non-qualified teachers are employed. Both
the inability to recruit and the employment of non-qualified teachers compromise the
quality of instruction. Further, as noted by Edgar and Pair (2005), even experienced
teachers require time before they settle into new assignments and become acquainted
with new students, new colleagues, and new routines. Even when a replacement is
employed promptly, the transition period disrupts the learning environment.
Research has shown that the level of the teachers’ job satisfaction is related
positively to student achievement. Shann (1998) maintains that teacher job satisfaction
improves job performance and positively affects student outcomes. Accordingly, a
teacher’s job satisfaction may influence the quality and stability of instruction given to
students (Perie et al., 1997). Therefore, both low teacher turnover and teacher job
satisfaction positively influence student achievement.
Policy Context of the Problem
Teacher Attrition and NCLB
The National Commission on Teaching and America’s Future (1996) maintained
that the teacher shortage had forced many school systems to lower their standards for
teacher quality, and sometimes waive their standards to allow less qualified individuals to
5
teach (Teaching & America's Future, 1996). Five years later, President George W.
Bush’s No Child Left Behind (NCLB) act of (2001) was enacted including a requirement
that teachers in all schools be “highly qualified.” Specifically, NCLB, which became law
on January 8, 2002, required that all public school teachers become highly qualified in
the core academic subjects they teach by the end of the 2005-2006 school year (Spradlin
& Prendergast, 2006). NCLB also requires that newly hired teachers in Title I programs
or schools be highly qualified immediately. To be highly qualified, a teacher must
possess at minimum a bachelor’s degree, have full state certification, and demonstrate
subject matter knowledge in each subject taught (Office of the Deputy Secretary, 2004).
Obviously, one of the primary goals of NCLB was to ensure that every child was
taught by a well-prepared, highly qualified teacher; however, many districts across the
nation continue to struggle to meet this goal (Spradlin & Prendergast, 2006). Harrell and
Jackson (2004) maintain that NCLB was a bold effort to improve education in the United
States, but may be facilitating a decrease in the quality of student learning. They note
that the removal of barriers to teacher certification under the belief that it will increase
both quantity and quality is a misconception. The teacher shortage is not an inexpensive
problem that can be solved quickly and easily (Harrell & Jackson, 2004). The process of
recruiting new teachers, without addressing teacher retention, is much like pouring water
into a bucket filled with holes (Ingersoll, 2002). On the contrary, Ingersoll and Smith
(2003) argue that findings on teacher dissatisfaction, which are related to teacher attrition,
are important because they point to issues that may be fixed through policy initiatives.
Administrative Support and the ISLLC Standards
Under the guidance of the Council of Chief State School Officers (CCSO), the
Interstate School Leaders Licensure Consortium (ISLLC) was developed in 1988 as part
of an effort to improve the quality of educational leadership in the public schools. ISLLC
developed a framework for redefining school leadership commonly referred to as the
standards (Murphy, Yff, & Shipman, 2000). The ISLLC standards were first adopted in
November of 1999 and their most recent revision was adopted by the National Policy
Board for Educational Administration on December 12, 2007. The six ISLLC standards
are: (1) an education leader promotes the success of every student by facilitating the
development, articulation, implementation, and stewardship of a vision of learning that is
6
shared and supported by all stakeholders; (2) an education leader promotes the success of
every student by advocating, nurturing, and sustaining a school culture and instructional
program conducive to student learning and staff professional growth; (3) an education
leader promotes the success of every student by ensuring management of the
organization, operation, and resources for a safe, efficient, and effective learning
environment; (4) an education leader promotes the success of every student by
collaborating with faculty and community members, responding to diverse community
interests and needs, and mobilizing community resources; (5) an education leader
promotes the success of every student by acting with integrity, fairness, and in an ethical
manner; and (6) an education leader promotes the success of every student by
understanding, responding to, and influencing the political, social, economic, legal, and
cultural context.
The ISLLC standards address the administrative support school leaders should be
exhibiting and implementing when working with teachers, and their primary purpose is to
strengthen leadership in the public schools. The ISLLC standards are either being
implemented, at least partially, or used by most states as a reference to develop
educational leadership policy (Murphy et al., 2000). This study examined public school
teachers' perceptions of administrative support in their present school, and its effect on
the teachers' job satisfaction and intent to stay in teaching.
Need and Purpose for the Study
Although a moderate amount of research has demonstrated the influence of
specific variables, i.e. - teaching experience, student behavior, and compensation, on
teachers' job satisfaction and intent to stay in teaching, a modest amount of research has
examined the influence of working conditions on teachers’ decisions to stay in or leave
teaching (Loeb et al., 2005). A review of these data suggests that the cause of teacher
attrition and job dissatisfaction may be related to teachers’ working conditions.
Therefore, addressing the working conditions identified by teachers as factors that
influenced their decision to leave teaching is an important, practical, and effective focus
for our efforts to increase teacher retention (Ingersoll, 2001). Improved working
conditions should contribute to lower rates of beginning teacher attrition, and in turn,
7
diminish school staffing problems and improve the academic performance of students
(Ingersoll & Smith, 2003).
An undeveloped research core has addressed working conditions and their effect
on teachers' job satisfaction and intent to stay in teaching. Understanding the effect of
individual teacher working conditions enables policy makers to develop precise, explicit,
and measurable goals. This study is specifically focused on the influence of a single
working condition, administrative support. Ingersoll (2003) maintains that teachers who
leave teaching have often attributed their departure to working conditions, including
inadequate administrative support. For the purpose of this study, perceived
administrative support is defined as the behaviors exhibited by the building level
principals identified by the respondent.
Research Questions
The three research questions examined are as follows:
(1) Does perceived administrative support mediate the effect of teaching
experience, perceived student behavior and teachers’ satisfaction with their
salary relative to teachers’ job satisfaction?
(2) Does perceived administrative support mediate the effect of teaching
experience, perceived student behavior, and teachers’ satisfaction with their
salary relative to teachers’ intent to stay in teaching?
(3) Does the mediating effect of perceived administrative support differ
according to the environmental setting of the school?
Theoretical Framework
In order to answer the research questions stated above, a hypothesized theoretical
framework was constructed and contained the following hypotheses: (a) teaching
experience, perceived student behavior, and teachers’ satisfaction with their salary are
significant predictors of perceived administrative support; (b) perceived administrative
support, teaching experience, perceived student behavior, and teachers’ satisfaction with
their salary are significant predictors of teachers’ job satisfaction and intent to stay in
teaching; (c) perceived administrative support mediates the effects of teaching
experience, perceived student behavior, and teachers’ satisfaction with their salary
relative to teachers’ job satisfaction and intent to stay in teaching; and (d) teachers’ job
8
satisfaction is a significant predictor of teachers’ intent to stay in teaching. A path
analysis model was employed using SPSS 14.0 to analyze data from the 2003-04 Schools
and Staffing Survey (SASS) public school teacher questionnaire (SASS-4A). Specifically,
the SASS-4A gathered responses from a national sample of approximately 34,810 full-
time public school teachers who held regular or standard state certification. No part-time
teachers, teachers of private or Bureau of Indian Affairs schools, or teachers with any
type of certification other than regular or standard certification in the state in which they
were teaching at the time of the survey were included in this study. The application of
appropriate weights and design effect make the findings of this study generalizable and
representative of teachers throughout the United States. The initial path analysis model
is presented in Figure 1.1 below.
9
Figure 1.1 Initial path analysis model for overall sample: The overall model of the relationship between Teacher Intent to Stay in Teaching, Teachers’ Job Satisfaction, Perceived Administrative Support, Teaching Experience, Perceived Student Behavior, and Teachers’ Satisfaction with their Salary.
Teaching Experience
Perceived Student
Behavior
Perceived Administrative
Support
Teacher Intent to Stay in
Teaching
Teacher Job Satisfaction
Teacher Satisfaction with Salary
Error 2
Error 3
Error 1
10
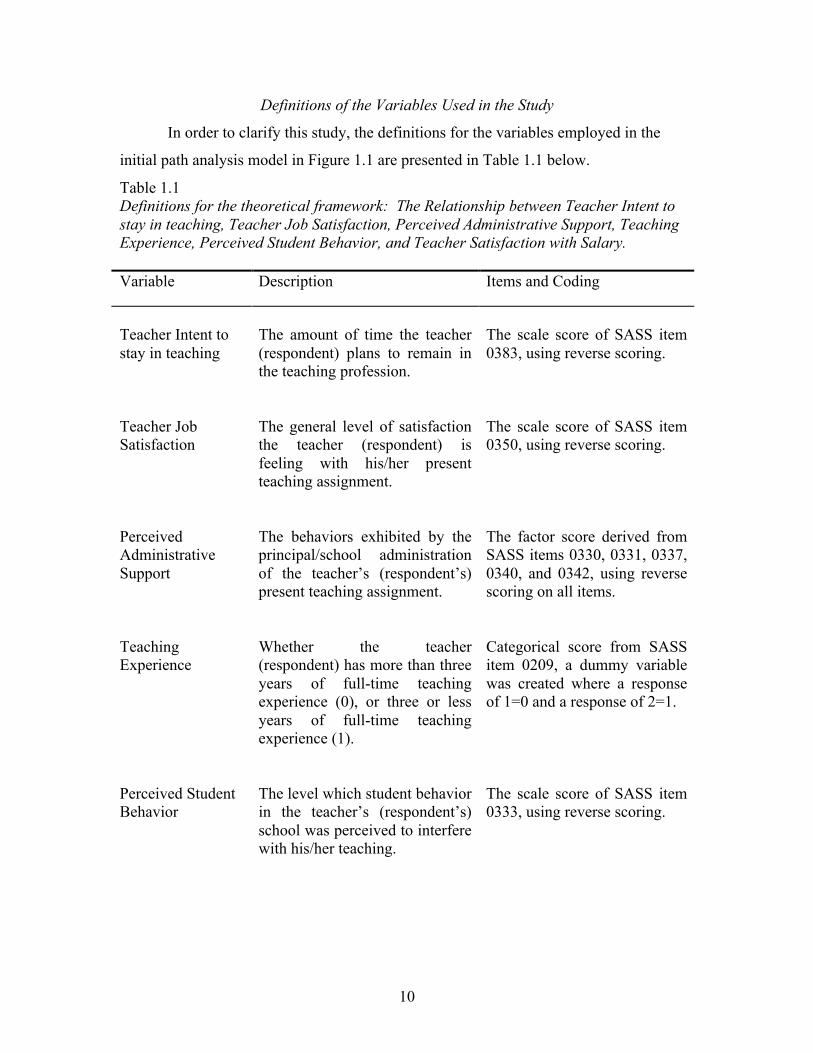
Definitions of the Variables Used in the Study
In order to clarify this study, the definitions for the variables employed in the
initial path analysis model in Figure 1.1 are presented in Table 1.1 below.
Table 1.1 Definitions for the theoretical framework: The Relationship between Teacher Intent to stay in teaching, Teacher Job Satisfaction, Perceived Administrative Support, Teaching Experience, Perceived Student Behavior, and Teacher Satisfaction with Salary. Variable Description Items and Coding
Teacher Intent to stay in teaching
The amount of time the teacher (respondent) plans to remain in the teaching profession.
The scale score of SASS item 0383, using reverse scoring.
Teacher Job Satisfaction
The general level of satisfaction the teacher (respondent) is feeling with his/her present teaching assignment.
The scale score of SASS item 0350, using reverse scoring.
Perceived Administrative Support
The behaviors exhibited by the principal/school administration of the teacher’s (respondent’s) present teaching assignment.
The factor score derived from SASS items 0330, 0331, 0337, 0340, and 0342, using reverse scoring on all items.
Teaching Experience
Whether the teacher (respondent) has more than three years of full-time teaching experience (0), or three or less years of full-time teaching experience (1).
Categorical score from SASS item 0209, a dummy variable was created where a response of 1=0 and a response of 2=1.
Perceived Student Behavior
The level which student behavior in the teacher’s (respondent’s) school was perceived to interfere with his/her teaching.
The scale score of SASS item 0333, using reverse scoring.
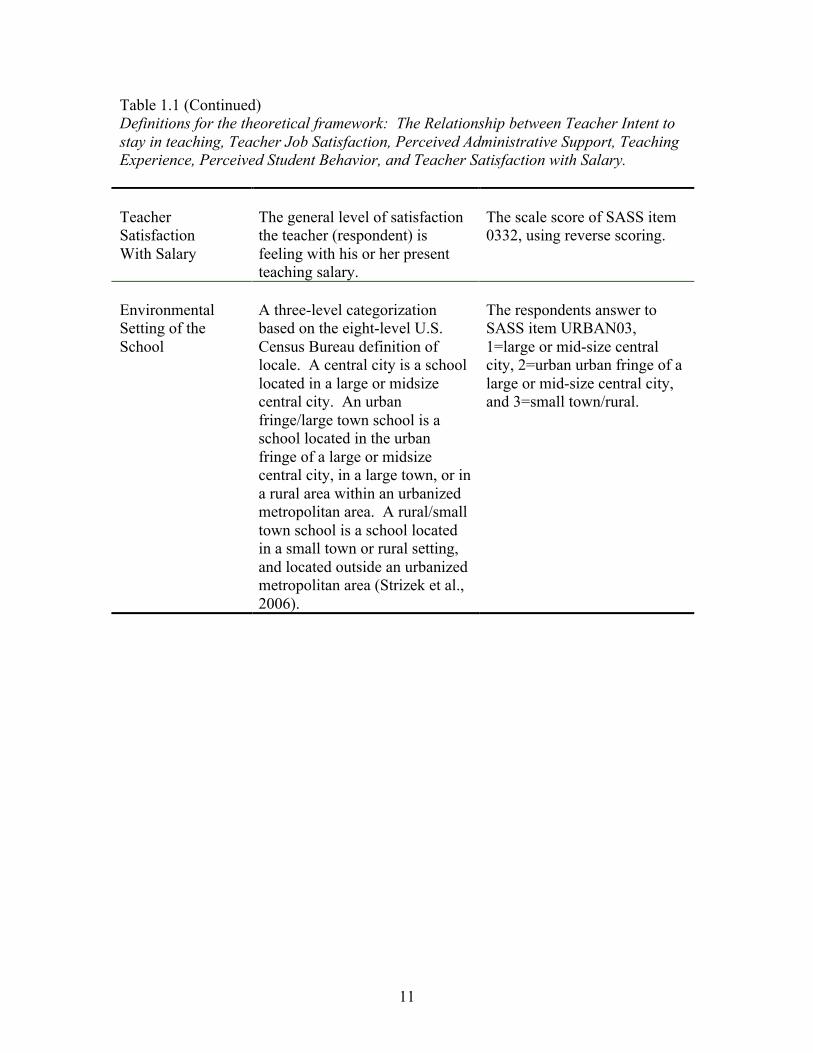
11
Table 1.1 (Continued) Definitions for the theoretical framework: The Relationship between Teacher Intent to stay in teaching, Teacher Job Satisfaction, Perceived Administrative Support, Teaching Experience, Perceived Student Behavior, and Teacher Satisfaction with Salary. Teacher Satisfaction With Salary
The general level of satisfaction the teacher (respondent) is feeling with his or her present teaching salary.
The scale score of SASS item 0332, using reverse scoring.
Environmental Setting of the School
A three-level categorization based on the eight-level U.S. Census Bureau definition of locale. A central city is a school located in a large or midsize central city. An urban fringe/large town school is a school located in the urban fringe of a large or midsize central city, in a large town, or in a rural area within an urbanized metropolitan area. A rural/small town school is a school located in a small town or rural setting, and located outside an urbanized metropolitan area (Strizek et al., 2006).
The respondents answer to SASS item URBAN03, 1=large or mid-size central city, 2=urban urban fringe of a large or mid-size central city, and 3=small town/rural.
12
Limitations of the Study
The principal limitation of this study restricts the statistical analysis to the data
collected from a previous national survey. The use of secondary data limits further
analysis to the questions asked by the original survey and can only measure what was
asked by those questions. Further, controls were not made for student or individual
teacher characteristics, other than two categories for the years of teaching experience.
Nor did this study control for student or teacher demographics, other than three
environmental categories.
Significance of the Study
Woods and Weasmer (2004) suggest that if factors that constitute job satisfaction
are identified, policy and procedures can be developed that will provide support for both
novice and veteran teachers to increase their levels of job satisfaction and reduce attrition
rates. This study sought to establish relationships between teachers’ intent to stay in
teaching, teachers’ job satisfaction, perceived administrative support, teaching
experience, perceived student behavior, and teachers’ satisfaction with their salary. Once
these relationships are established, factors may be identified that increase job satisfaction
and, in turn, decrease attrition rates among teachers. These findings could lead to
significant changes in principal preparation programs, professional development, teacher
pre-service training, and administrative and teacher mentoring programs.
13
Chapter Two:
Review of the Related Literature
The purpose of this chapter is to review literature related to the topics of teachers’
intent to stay in teaching, teachers’ job satisfaction, administrative support, teaching
experience, student behavior, teachers’ satisfaction with their salary, and the
environmental setting of the school. An overview of notable studies concerning these
variables is presented.
This chapter is arranged into seven categories, with six of those categories
containing subcategories. Each category and subcategory is considered necessary for a
clear understanding of this research study. The categories and subcategories are as
follows: (1) teachers’ intent to stay in teaching; (a) teacher turnover; (b) reasons for
teacher attrition; (c) teacher recruitment as a response to teacher attrition; and (d)
characteristics of teachers who remain in teaching (2) teachers’ job satisfaction; (3)
administrative support; (a) administrative support and teachers’ intent to stay in teaching;
and (b) administrative support and teachers’ job satisfaction; (4) teaching experience, (a)
teaching experience and teachers’ intent to stay in teaching; and (b) teaching experience
and teachers’ job satisfaction; and (c) teaching experience and administrative support; (5)
student behavior; (a) student behavior and teachers’ intent to stay in teaching; (b) student
behavior and teachers’ job satisfaction; and (c) student behavior and teaching experience;
(6) teachers’ satisfaction with their salary; (a) teachers’ satisfaction with their salary and
teachers’ intent to stay in teaching; (b) teachers’ satisfaction with their salary and
teachers’ job satisfaction; (c) teachers’ satisfaction with their salary and administrative
support; and (d) teachers’ satisfaction with their salary and teaching experience; and (7)
environmental setting of the school, (a) environmental setting of the school and teachers’
intent to stay in teaching; (b) environmental setting of the school and teachers’ job
satisfaction; (c) environmental setting of the school and administrative support; (d)
environmental setting of the school and student behavior; and (e) environmental setting
of the school and teachers’ satisfaction with their salary.
14
Teacher Intent to Stay in Teaching
Teacher Turnover
The teaching profession suffers from chronic and a relatively high annual
turnover rate compared to many other occupations (Ingersoll, 2003). Ingersoll and Smith
(2003) indicate that total teacher turnover is fairly evenly split between two components:
(1) attrition, or those who leave teaching altogether; and (2) migration, or those who
move to teaching jobs in other schools and/or school districts. Both components
constitute an instructional disruption. Edgar and Pair (2005) note that newly-appointed
teachers, even those with experience, require time to become acclimated to their new
jobs, students, colleagues, and routines.
The size of the teaching force, combined with a high turnover rate, has resulted in
a large number of teachers who flow into, between, and out of schools annually (Ingersoll
& Smith, 2003), and has developed into a major problem for public education (Edgar &
Pair, 2005). Those subject areas that do not report a lack of qualified teachers still find it
difficult to find replacements in a timely manner (Liu & Meyer, 2005), which forces them
to hire temporary teachers, or use non-certified personnel. Obviously, the use of
temporary teachers compromises the quality of instruction.
Liu and Meyer (2005) note that the early research studies on teacher attrition and
teacher turnover primarily focused on teacher demographics and individual teacher
characteristics. More recent research on teacher attrition and teacher turnover has tended
to focus on the influence of several school factors, including, organization, reform efforts,
climate, and leadership.
Ingersoll and Smith (2003) maintain that a low rate of turnover is beneficial to
public education. Too little annual turnover in any organization, including public
schools, may indicate stagnancy. They suggest that effective organizations benefit from a
limited degree of turnover, which eliminates low-caliber performers and employs outside
personnel to facilitate innovation. However, Liu and Meyer (2005) remind us that the
teacher attrition rate in public education is disproportionately higher than for other
professions. The higher rate of attrition experienced by the teaching profession surpasses
the healthy turnover rate suggested by Ingersoll and Smith (2003). Liu and Meyer (2005)
suggest that after just five years, between forty to fifty percent of all beginning teachers
15
have left the profession. This extensive migration is straining the already limited supply
of those entering the field. Furthermore, as student populations continue to rise, the
teacher shortage will be compounded by the increasing number of retirements.
Conventional wisdom places the causes for the teacher shortage external to the
institution itself. Researchers and policymakers point to an increased demand for new
teachers, resulting partially from the growth of student enrollments and teacher retirement
thus predicting a severe teacher shortage compounded with a greater demand for
resources by other governmental agencies (Ingersoll & Smith, 2003). However, Ingersoll
and Smith (2003) suggest that student enrollment increases and teacher retirements are
not the primary causes for the increasingly high demand for new teachers and subsequent
staffing difficulties. They indicate that the more prominent reason is due to the high rates
of teacher attrition recorded by novice teachers.
Reasons for Teacher Attrition
According to, Teacher Attrition and Mobility: Results from the 2004-2005
Teacher Follow-up Survey, nearly two-thirds of former teachers surveyed for the prior
year who are now working outside of the field of education stated that their current
workload can be managed better, and a similar percentage of those former teachers
indicated that they are better able to balance their personal life and professional
responsibilities. Over sixty percent identified their current working conditions as
superior to teaching, and approximately forty-five percent stated that their salaries are
better than their prior teaching compensation (Marvel et al., 2007).
Ingersoll & Smith (2003) relied on the results of the 2000-2001 Teacher Follow-
Up Survey, and the 1999-2000 Schools and Staffing Survey to determine the reasons
teachers left their profession for other employment opportunities. For responding novice
teachers who had left their teaching job from the previous year, approximately twenty
percent left as a result of staffing actions, including layoffs, reorganization, school
closing, or termination. Over forty percent cited personal reasons, including pregnancy,
child rearing, health problems, and family relocation for departing, while approximately
forty percent indicated that they left to pursue a better job, another career, and/or because
of job dissatisfaction.
16
According to Ingersoll and Smith (2003), more than three-fourths of the departing
novice teachers left teaching due to inadequate compensation. An even higher
percentage of teachers suggested that various working conditions affected their decision
to leave teaching. The working conditions included: (1) student discipline problems; (2)
lack of support from the school administration; (3) poor student motivation; and (4) lack
of teacher influence over school-wide and classroom decision making. Over the past
decade working conditions emerged as the major source of teacher job dissatisfaction,
and significantly contributed to teacher attrition.
Teacher Recruitment as a Response to Teacher Attrition
According to Ingersoll and Smith (2003) policymakers responded primarily to the
impending teacher shortage and its imbedded problem of teacher attrition solely by
increasing the production of teachers. However, they warn that the simple increased
production of additional teachers is misguided. Merely replacing departing teachers
ignores the problem created by turnover. Instead, specific causes of teacher attrition need
to be identified and remedied.
Many public school districts offer various incentives to prospective teachers in an
effort to increase the number of qualified applicants (Ingersoll & Smith, 2003). Those
incentives include career-change programs designed to entice prospective teachers from
other professions to the public schools. Alternative teacher certification programs have
been enacted by some states to allow college graduates of any degree to postpone their
formal education training and begin teaching immediately. In addition, states and their
school districts have offered financial incentives, such as, signing bonuses, student loan
forgiveness, housing assistance, scholarships, and tuition reimbursements.
Such initiatives may prove cost-efficient and helpful, but as noted previously, are
unlikely to solve the teacher staffing problems faced by the public schools. Since the
early 1990’s, there has been a negative gap between the number of teachers entering and
departing from the public schools. And, more ominously, this gap has widened,
suggesting an even greater shortage of qualified teachers (Darling-Hammond, 2003).
Thus, the efforts to solve the staffing problems faced by schools should include teacher
retention; however, retaining good teachers, both novices and veterans, requires attention
to working conditions. Teacher working conditions include class size, teaching load,
17
availability of materials, teacher participation in decision making, strong and supportive
instructional leadership, and collegial learning opportunities (Darling-Hammond, 2003).
Characteristics of Teachers Who Remain in Teaching
Teachers who remain in the profession possess certain characteristics. Novice
teachers who “make it”, or stay in the profession, often have two important
characteristics, perceived self-efficacy and persistence. Persistence has several
definitions, including, perseverance, determination, commitment, and stick-with-it-ness
(Grant, 2006, p. 50). Perceived self-efficacy is a person’s beliefs about their capabilities
to fulfill different levels of performance that influence life affecting events. Self-efficacy
beliefs determine how people feel, think, and motivate them to make things happen rather
than observe (Bandura, 1989). Further, research suggests that increasing teachers’ sense
of self-efficacy and persistence may decrease teacher attrition and increase retention
(Yost, 2006).
Resiliency is another characteristic of individuals who remain in teaching despite
experiencing difficult circumstances. Resilient individuals seem to “bounce back” from
negative events quite effectively (Tugade & Fredrickson, 2004, p. 320). Resiliency, or
the ability to recover strength and spirits quickly and persevere in the face of obstacles, is
a characteristic common to teachers who remain in the profession. The three variables
persistence, self-efficacy, and resiliency are intricately related and connected to teachers’
tenure in the teaching profession (Yost, 2006). Accordingly, efforts to retain teachers
should include professional development, in-service training, and leadership development
that facilitate persistence, self-efficacy, and resiliency.
Teachers’ Job Satisfaction
Improving teachers’ job satisfaction is paramount at a time when fifty percent of
novice teachers leave the profession during the first five years of employment (Colbert &
Wolff, 1992). Accordingly, job dissatisfaction leads to stress and ultimately burnout for
teachers (Pearson & Moomaw, 2005). Shann (1998) maintains that teacher job
satisfaction is a pivotal link in the chain of successful educational reform. Thus,
identifying variables that have a direct effect on teachers’ job satisfaction is vital to
decreasing teacher attrition and facilitating true reform in education.
18
In their landmark study, Perie et al. (1997) maintain that teachers’ job satisfaction
is one of the main factors associated with teacher quality and retention. According to
Perie et al. (1997) job satisfaction has been widely studied by organizational researchers
representing several fields, and has been linked to organizational commitment and
performance. The study of teachers’ job satisfaction holds similar importance.
Compensation for instructional personnel is the largest cost of a school system, and
understanding the factors associated with the teachers’ job satisfaction (or dissatisfaction)
is essential for the success of the educational system.
Perie et al. (1997) examined characteristics of teachers’ schools, teachers’
backgrounds, salaries, benefits, as well as working conditions, in order to identify their
respective relationships to teachers’ job satisfaction. Within the category of working
conditions, administrative support and leadership, student behavior, school atmosphere,
and teacher autonomy were found to be associated with teachers’ job satisfaction. Not
surprisingly, there was a positive relationship between favorable working conditions and
job satisfaction.
According to Woods and Weasmer (2004), when teachers share a voice in
establishing and moving toward organizational goals, their commitment to a school and
job satisfaction increase. Teachers should be given opportunities to contribute to
curriculum development and help implement new instructional practices. It is also vital
that teachers be recognized for their efforts. Woods and Weasmer (2004) maintain that in
order to be a true stakeholder, teachers must be recognized and honored for their
contributions. Teachers who collaborate toward mutual goals are more likely to assume a
shared investment and collaboration among faculty helps unify their purpose and
strengthen their commitment to the school (Woods & Weasmer, 2004). Hence,
professional collegiality is a strong contributor to teachers’ job satisfaction.
Shann (1998) indicated that although measuring job satisfaction can be difficult
its study is worthwhile. “Teacher job satisfaction has been shown to be a predictor of
teacher retention, a determinant of teacher commitment, and in turn, a contributor to
school effectiveness (Shann, 1998, p. 67).” Liu and Meyer (2005) regarding job
satisfaction among three groups of stayers, leavers, and movers found there was a direct
link between teachers’ job satisfaction and teacher turnover. Their findings further
19
demonstrated that teachers’ perceptions show varying degrees of satisfaction with
different aspects of their jobs that eventually have an effect on their decision to stay in
teaching, leave teaching, or move to another school.
Administrative Support
Vroom and Jago (2007) define leadership as “a process of motivating people to
work together collaboratively to accomplish great things.” As such, some implications of
this definition are as follows: (1) leadership is a process, not a property of a person; (2)
the process involves a particular form of influence called motivation; (3) the nature of
incentives, extrinsic or intrinsic, is not part of the definition; (4) the consequence of the
influence is collaboration in pursuit of a common goal; and (5) the “great things” are in
the minds of both leader and followers and are not necessarily viewed as desirable by all
other parties (Vroom & Jago, 2007, p. 18). We must consider the important role of
situational leadership; if we restrict leadership to a character trait of the individual,
without consideration of the context, we form an inaccurate measure.
In addition, Vroom and Jago (2007, p. 22) identified three roles that situational
leadership variables play in the leadership process: (1) organizational effectiveness (often
taken to be an indication of its leadership) is affected by situational factors not under
leader control; (2) situations that shape how leaders behave; and (3) situations that
influence the consequences of leader behavior. If these three specific roles of the
situation in leadership are taken into consideration, those who study leadership should
examine behavior for specific types of situations, rather than assessing behavior across
situations. By studying leadership in the context of other variables, such as teaching
experience, student behavior, teachers’ satisfaction with their salary, and the
environmental setting of the school, more accurate generalizations regarding effective
leadership and administrative support will be possible.
According to Leithwood and Jantzi (2006, p. 202), considerable progress has been
made over the past 15 years in identifying the significant effects of school leadership on
school reform; nevertheless, the nature of effective school leadership still remains to be
much more of a “black box” than an exact model. “Instructional leadership,” is a popular
concept in the United States, but it is usually more of a slogan than a precise measurable
model of school leadership. They contend that new “qualifying terms” are added

20
annually to the word leadership, giving the false impression that something new,
“leadership by adjective,” has been discovered. These characteristics and limitations of
contemporary research on educational leadership suggest the need for more large-scale,
sustained studies.
Leithwood and Jantzi (2006) have also identified a model encompassing three
broad categories of leadership practices, including a total of nine more specific
dimensions of practice. The first category, setting directions, includes the following
specific dimensions of practice: (1) building school vision; (2) developing specific goals
and priorities; and (3) holding high performance expectations. The second category,
developing people, includes the following specific dimensions of practice: (1) providing
intellectual stimulation; (2) offering individualized support; and (3) modeling desirable
professional practices and values. The third broad category, redesigning the
organization, includes the following specific dimensions of practice: (1) developing a
collaborative school culture; (2) creating structures to foster participation in school
decisions; and (3) creating productive community relationship. These categories consist
of characteristics that are considered desirable among building principals, according to
the transformational leadership model.
The above characteristics of good school leadership and administrative support
have been accepted by the Interstate School Leaders Licensure Consortium (ISLLC).
The Interstate School Leaders Licensure Consortium (ISLLC) was developed in 1988 by
the Council of Chief State School Officers (CCSO) as part of an effort to restructure and
strengthen the leadership in our public schools. The ISLLC standards provide a
framework for the redefinition of school leadership (Murphy et al., 2000). These
standards evolved out of conceptual metaphors describing the leadership necessary for
the schools of tomorrow. The four metaphors are: (a) community servant; (b)
organizational architect; (c) social architect; and (d) moral educator. ISLLC based the
development of its standards on the following three central tenets: (1) there is a single set
of standards that should apply to all leadership positions; (2) the focus and grounds for
the standard should be the core of productive leadership; and (3) the standards should not
simply codify what is; they should help elevate the profession to a higher level. Finally,
in an effort to guide and orient the thinking of the consortium during the creation of the
21
standards, the following seven principles were developed: (1) standards should reflect
the centrality of student learning; (2) standards should acknowledge the changing role of
the school leader; (3) standards should recognize the collaborative nature of school
leadership; (4) standards should be high, upgrading the quality of the profession; (5)
standards should inform performance-based systems that contain both assessment and
evaluation of school leaders; (6) standards should be integrated and coherent; and (7)
standards should be predicted on the concepts of access, opportunity, and empowerment
for all members of the school community. While considering the previous, six standards
for reshaping educational leadership were created.
The ISLLC standards were first adopted in November of 1999, and recently,
December 12, 2007, the National Policy Board for Educational Administration adopted
the following standards as educational leadership policy: (1) an education leader
promotes the success of every student by facilitating the development, articulation,
implementation, and stewardship of a vision of learning that is shared and supported by
all stakeholders; (2) an education leader promotes the success of every student by
advocating, nurturing, and sustaining a school culture and instructional program
conducive to student learning and staff professional growth; (3) an educator leader
promotes the success of every student by ensuring management of the organization,
operation, and resources for a safe, efficient, and effective learning environment; (4) an
education leader promotes the success of every student by collaborating with faculty and
community members, responding to diverse community interests and needs, and
mobilizing community resources; (5) an education leader promotes the success of every
student by acting with integrity, fairness, and in an ethical manner; and (6) an education
leader promotes the success of every student by understanding, responding to, and
influencing the political, social, economic, legal, and cultural context.
Administrative Support and Teachers’ Intent to Stay in Teaching
The influence of administrative support relative to teacher attrition has been
researched. For example, Loeb et al. (2005) used survey data administered to California
teachers that revealed that the lack of administrative support was one of the key reasons
teachers left the profession. In agreement, Luekens (2004) found that nearly forty
percent of teachers who left teaching cited a lack of administrative support as the main
22
reason for their departure. Moreover, Weiss (1999) indicated that administrative support
was also one of the most significant predictors of the teachers’ intent to stay in teaching.
In a qualitative study of teacher attrition, the perceptions of a first-year teacher
were described by Worthy (2005) through the use of a case study. The novice teacher
identified a lack of administrative support as almost causing him to leave teaching
forever, and described the actions of his principal as mean and disheartening. He
indicated that the principal in his urban school used a “coarse, militant style of discipline
(Worthy, 2005, p. 391).” Ingersoll and Smith (2003) add that administrative support for
teachers includes providing classroom materials and supplies, facilitating teacher
involvement in the decision making process, and furnishing reliable mentors for new
teachers.
Administrative Support and Teachers’ Job Satisfaction
A modest amount of research has demonstrated that administrative support
influences teachers’ job satisfaction. One such study, Liu and Meyer (2005) found a high
correlation (r = 0.77) between school climate and working conditions and suggested that
school leadership was a significant contributor to both teachers’ job satisfaction and
intent to stay or leave teaching. An earlier study by Ingersoll and Smith (2003) found that
teachers who were dissatisfied with their jobs often identified a lack of administrative
support as a primary cause.
In their landmark study of teachers’ job satisfaction, using a nationally
representative sample from the SASS, Perie et al. (1997) discovered that positive teacher
perceptions of administrative support and leadership led to higher job satisfaction scores.
Administrative support, as indicated by the item “staff members are recognized for a job
well done,” was strongly associated with teachers’ job satisfaction. These, and similar
findings, enabled Shann (1998) to conclude that it is imperative for school administrators
to work toward increased job satisfaction for their teachers.
Teaching Experience
Teaching Experience and Teachers’ Intent to Stay in Teaching
As indicated previously, teacher attrition is highest during the first few years of
service (Ingersoll & Smith, 2003). Liu (2007) stated, “first-year teachers stand a higher
risk of leaving the teaching profession than experienced teachers (p. 1)” and “almost half
23
of beginning teachers leave teaching in their first five years (p. 2).” Luekens et al. (2004)
indicated that teachers with one to three years of experience were slightly more likely to
leave the profession. Because beginning teachers are at a higher risk of leaving the
profession, it is vital to understand the specific reasons that they leave teaching.
Teaching Experience and Teachers’ Job Satisfaction
According to Ingersoll and Smith (2003), two-thirds of former first year teachers
reported that dissatisfaction with teaching was their main reason for leaving the teaching
profession. In contrast, Perie et al. (1997) found that less experienced teachers reported
higher levels of job satisfaction than the more experienced teachers, and that
administrative support was more significant in explaining teachers’ job satisfaction than
years of teaching experience.
Teaching Experience and Administrative Support
Stockard and Lehman (2004) reported that social support and school management
were significantly related to job satisfaction and attrition rates for new teachers.
According to Ingersoll and Smith (2003), former new teachers identified the lack of
administrative support as one of their main reasons for leaving the profession.
Student Behavior
Student Behavior and Teachers’ Intent to Stay in Teaching
Kelly (2004) stated, “The behavioral climate of a school is important to teacher
attrition (p. 206).” Moreover, student behavior is one of the main factors identified by
former new teachers that made a decision to leave teaching (Ingersoll & Smith, 2003). In
addition, Harrell and Jackson (2004) found that student behavior was a significant
influence on teacher attrition, second only to teacher income (Harrell & Jackson, 2004).
Student Behavior and Teachers’ Job Satisfaction
Studies have shown that student behavior is related to teachers’ job satisfaction
(Shann, 1998). Ingersoll and Smith (2003), through the use of advanced statistical
analysis, found that teachers who were dissatisfied with their job often cited student
discipline problems for their dissatisfaction. Perie et al. (1997), in an earlier study, found
a strong relationship between student behavior and teachers’ job satisfaction and a more
favorable student behavior yielded higher job satisfaction for all teachers.
24
Liu and Meyer (2005) found that teachers’ dissatisfaction level with student
behavior was almost as strong as their dissatisfaction with their income. However, they
found little relationship between teachers’ satisfaction with their income and their
perception of student discipline problems.
Student Behavior and Teaching Experience
Student behavior has traditionally been an important concern for novice teachers.
Liu (2007) determined that student behavior and classroom management are major
concerns for first-year teachers, and a previous study by Weiss (1999) suggested that
student discipline problems were inversely highly correlated with the morale and
commitment of first year teachers.
Teachers’ Satisfaction with their Salary
Teachers’ Satisfaction with their Salary and Teachers Intent to Stay in Teaching
Several studies have studied teacher compensation and attrition (Harrell &
Jackson, 2004). Teacher compensation has consistently appeared in studies of teacher
satisfaction and teacher attrition over the last twenty years. According to Darling-
Hammond (2003), teacher salaries are moderately low when compared to other
professions; in fact, “teacher salaries are about twenty percent below the salaries of other
professionals with comparable education and training (p. 7).”
Increasing teacher compensation may help decrease teacher attrition since many
studies have identified low salaries as the main predictor of teacher attrition (Liu, 2007).
According to Loeb et al. (2005), a substantial amount of research exists that suggests
teacher compensation plays a significant role in retaining teachers. In addition, there is
current data that suggests raising teacher salaries as an effective way to retain teachers.
Studies by Ingersoll and Smith (2003) and Kelly (2004) recommend higher teacher
salaries would be an effective strategy for reducing teacher attrition.
Teachers’ Satisfaction with their Salary and Teachers’ Job Satisfaction
Shann (1998) indicated that low salaries contribute to teachers’ job
dissatisfaction, and a later study by Liu and Meyer (2005), found that low teacher
compensation was the leading cause of teachers’ dissatisfaction with their job. However,
it is unlikely that teachers’ dissatisfaction concerning student behavior can be easily
corrected by increasing teacher compensation. According to Ingersoll and Smith (2003),
25
teachers who were dissatisfied with their jobs often cited low salaries as a reason. Perie
et al. (1997) agreed and found a positive relationship between salary and teachers’ job
satisfaction.
Teachers’ Satisfaction with their Salary and Administrative Support
Very little research has focused on the relationship between teachers’ satisfaction
with their salary and administrative support. However, a related study of California
teachers by Darling-Hammond (2003) found working conditions, including
administrative support, was a better predictor of teacher attrition than student
demographics.
Teachers’ Satisfaction with their Salary and Teaching Experience
According to Kelly (2004) the amount of teachers’ salaries does affect teacher
attrition, although the predicted variance is small. Discussion regarding compensation,
among recent college graduates of various professions, may contribute to the stronger
relationship between salaries and attrition for beginning teachers.
Environmental Setting of the School
Environmental Setting of the School and Teachers’ Intent to Stay in Teaching
The highest teacher attrition rates in the nation are found in urban school districts
(Adams & Dial, 1993). Although, urban schools only have a slightly higher attrition rate
than urban fringe or rural schools (Ingersoll & Smith, 2003). According to Shann (1998)
recruiting and retaining good teachers is a challenge for many urban school districts, and
many graduates of traditional teacher education programs are reluctant to take positions
in inner city schools. A study in the southeast, i.e. – Georgia, North Carolina, found that
poor working conditions was a strong predictor of teacher burnout in rural schools, while
poor working conditions and student misbehavior were both found to be strong predictors
of teacher burnout in urban schools (Abel & Sewell, 1999).
Environmental Setting of the School and Teachers’ Job Satisfaction
According to Perie et al. (1997) both elementary and secondary teachers in urban
schools experience lower overall levels of job satisfaction than their peers in urban fringe
and rural schools.
26
Environmental Setting of the School and Administrative Support
Urban teachers report that a combination of a lack of support from administration,
limited resources, and an inflexible bureaucracy as a major contributors to their intent to
continue teaching (Gonzalez & National Association of State Directors of Special
Education, 1995). Abel and Sewell (1999), report that inadequate administrative support
and a lack of recognition for good teaching were principal causes of stress for urban
teachers. “Teachers in urban schools experience significantly more stress from poor
working conditions and poor staff relations than teachers in rural schools (Abel & Sewell,
1999, p. 287).”
Environmental Setting of the School and Student Behavior
Smith and Smith (2006) used inductive analysis through qualitative interviews to
determine the reasons why former urban school teachers left teaching. The data revealed
that perceptions and fears of violence play a major role in the decision of urban school
teachers to abandon teaching. According to Abel and Sewell (1999) both urban and rural
teachers experience significantly more stress created by student misbehavior than from
either poor working conditions or poor staff relations. Both rural and urban teachers
identified student misbehavior and lack of classroom discipline as significant stressors
and agreed that student misbehavior was a more significant stressor than working
conditions. Teachers in the urban districts indicated that student misbehavior coupled
with a heavy workload, added stress and affected their decisions to teaching. In contrast,
rural teachers identified working conditions as a more significant influence on their
decisions to leave teaching (Abel & Sewell, 1999).
Environmental Setting of the School and Teachers’ Satisfaction with their Salary
According to Liu and Meyer (2005), teachers in urban areas, in schools usually
characterized by student misbehavior, are more likely to leave teaching or relocate,
although their salaries are often higher than teachers from other districts. Shann (1998)
studied the perception of teachers of urban middle schools and found that their salary was
less important than working conditions.
Summary of the Literature Review
Liu (2007) identified two strands of research in the area of teacher attrition. One
strand focused on teacher factors, such as, “teacher demographics, teacher characteristics,
27
and salary (p. 2).” The other strand focused on environmental factors, such as, “school
characteristics, governance, and working conditions (p. 2).” Liu (2007) also recognized
the need to examine the interaction between the two strands and among the several
factors. This literature review presents an overview of notable studies concerning
teachers’ attrition and a discussion of the need for further studies examining the specific
relationship between teachers’ satisfaction with their salary, student behavior, teaching
experience, administrative support, teachers’ job satisfaction, and teachers’ intent to stay
in teaching.
Studies have shown that teacher turnover, through attrition and migration, are
disrupting the educational process in schools (Edgar & Pair, 2005; Ingersoll, 2003;
Ingersoll & Smith, 2003). This is especially difficult for districts to manage considering
resources they have invested in teacher recruitment (Edgar & Pair, 2005). School
districts are finding it particularly difficult to fill their vacancies with “highly-qualified
teachers” in a timely manner (Liu & Meyer, 2005).
While earlier research on the causes of teacher attrition focused on teacher
characteristics, more recent studies have investigated other reasons for teacher attrition
(Ingersoll & Smith 2003; Liu & Meyer, 2005; Marvel et al., 2007). Specifically, the later
studies have identified working conditions as a major influence on the decisions of
teachers’ intent to stay in teaching (Ingersoll & Smith, 2003; Marvel et al. 2007). Also,
recent studies have warned that reducing teacher attrition will not be resolved by simply
increasing the supply of teachers (Darling-Hammond, 2003; Ingersoll, 2002; Ingersoll &
Smith, 2003). Previous research also indicated a strong relationship among teachers’ job
satisfaction and teacher attrition (Liu & Meyer, 2005; Shann, 1998). In their landmark
study, Perie et al. (1997) found that administrative support and student behavior were
strongly associated with teachers’ job satisfaction.
While the relationship between working conditions, teachers’ job satisfaction, and
teachers’ intent to stay in teaching has been established, there are few studies that have
focused on the direct relationship between administrative support and these variables.
Most of the existing research on teacher job satisfaction and teacher attrition treated
administrative support as only one of several working conditions. This gap in the
28
research prohibits us from understanding the direct effect, and possible mediating effect,
of administrative support on teachers’ job satisfaction and intent to stay in teaching.
According to Ingersoll and Smith (2003), administrative support, among working
conditions, has shown the strongest relationship with teachers’ decision to remain in
teaching. Although progress has been made in the study of administrative support,
evidence of its direct effects on teacher attrition is extremely thin (Shann, 1998).
Studies have demonstrated a relationship between the transformational leadership
model, teacher performance, organizational commitment, and teacher job satisfaction
(Leithwood & Jantzi, 2006). However, studies on transformational leadership are usually
based on broad categories of effective principal behaviors that serve as the theoretical
framework of the model.
The ISLLC standards, developed by the Council of Chief State School Officers
(CCSO), have established the characteristics of good school leadership and
administrative support. These standards have been adopted, at least partially, by most
states and identify the characteristics that should be exhibited by school principals
(Murphy et al., 2000). Further studies examining the relationship between administrative
support, teachers’ job satisfaction, and teachers’ intent to stay in teaching could provide
insight into the implementation and effect of the ISLLC standards.
Vroom and Jago (2007) make the argument that any study of leadership without
considering the context in which the leadership occurs will likely prove inaccurate. In
essence, the role of the situation where the leadership occurs is extremely important.
Other factors that have significantly effected teachers’ job satisfaction and intent to stay
in teaching should be considered, including teaching experience, student behavior,
teacher compensation, and environmental setting.
It is well documented that attrition rates are higher among novice teachers
(Ingersoll & Smith, 2003; Liu, 2007; Luekens et al, 2004). Ingersoll and Smith (2003)
found that two-thirds of former first-year teachers left teaching due to job dissatisfaction.
In contrast, an earlier study by Perie et al. (1997) found that teachers with less teaching
experience actually experienced more job satisfaction. Further research is needed to
clarify the effect of teaching experience on job satisfaction. Moreover, the need exists to
29
clarify the relationship between teaching experience and administrative support in terms
of teachers’ job satisfaction and intent to stay in teaching.
Existing studies have established strong relationships among student behavior,
teachers’ job satisfaction, and teachers’ intent to stay in teaching (Kelly, 2006; Luekens
et al., 2004; Perie et al., 1997; Weiss, 1999) and show that more favorable student
behavior yields higher teacher job satisfaction. However, studies examining the specific
effects of student behavior in regard to teachers’ job satisfaction and teachers’ intent to
stay in teaching are lacking. As with administrative support, the role of the situation
when considering student behavior is vital to the development of a conceptual
framework. The need also exists to examine the relationship between student behavior
and the environmental setting of the teachers’ school.
Previous research has documented the effect of teacher salary on teachers’ job
satisfaction and intent to stay in teaching. Many studies have found that raising teacher
salaries may reduce attrition (Ingersoll & Smith, 2003; Kelly, 2004; Liu, 2007; Loeb et
al, 2005). Other studies have also noted that increased salary is related to increased job
satisfaction among teachers (Ingersoll & Smith, 2003; Liu & Meyer, 2005; Perie et al.,
1997; Shann, 1998).
Studies have demonstrated that retaining good teachers is more difficult for urban
districts than for either urban fringe or rural districts (Abel & Sewell, 1999; Adams &
Dial, 1993; Shann, 1998; Smith & Smith, 2006). Although the effect of the
environmental setting of the school has been well documented, studies on the effect of
administrative support, student behavior, teachers’ job satisfaction, and teachers’ intent to
stay in teaching are less conclusive (Luekens et al., 2004; Perie et al. 1997).
Based on the findings provided by this literature review, a theoretical framework
has been constructed that tested the effects of perceived administrative support, teaching
experience, perceived student behavior, and teachers’ satisfaction with their salary on
teachers’ job satisfaction and intent to stay in teaching. Four models have been examined
based on data derived from four samples. Those four samples are: (1) the overall
sample; (2) the urban sample; (3) the urban fringe sample; and (4) the rural sample. This
allowed the researcher to consider the context or situation in which these findings
occurred. A large, representative, stratified sample was used in order to test the
30
theoretical framework and allows for greater generalization of these findings. The
findings of this study could play a significant role in the development of school district
policy for teacher retention efforts, administrative preparation programs, preservice
teacher education programs, professional development for both administrators and
teachers, and selection and placement of administrators and teachers.
The following chapter provides detailed methodology that was used to test the
theoretical framework. A description of the data collection procedures and research
design are provided. The following variables were studied based on the literature review
presented in Chapter Two: (a) Teachers’ Intent to Stay in Teaching; (b) Teachers’ Job
Satisfaction; (c) Perceived Administrative Support; (d) Teaching Experience; (e)
Perceived Student Behavior; and (f) Teachers’ Satisfaction with their Salary.
31
Chapter Three:
Methodology
Provided in this chapter is a detailed description of the methods used to conduct
this study. The research design, data, and variables are presented and discussed.
Research Design
A path model analysis was used to investigate the relationship among teachers’
intent to stay in teaching, teachers’ job satisfaction, perceived administrative support,
teaching experience, perceived student behavior, and teachers’ satisfaction with their
salary. According to Schumacker and Lomax (2004, ch. 7), path model analysis is the
logical extension of a multiple regression model where any number of independent and
dependent variables may be used to establish any number of equations. The path analysis
was developed by Sewall Wright as a method for studying the direct and indirect effects
of variables (Wright, 1921, 1934, 1960). The path analysis is not a method for
discovering causes, but it does test theoretical relationships. However; a specified path
model might actually establish a causal relationship among two variables if (1) temporal
ordering of variables exists; (2) covariation or correlation is present among all variables;
and (3) other causes are controlled for (Schumacker & Lomax, 2004).
According to Schumacker & Lomax (2004, ch. 7), path models adhere to certain
drawing conventions. The observed variables are always enclosed in boxes or rectangles,
and a line directly from one observed variable to another denotes a direct effect. A direct
effect can be defined as “the direct influence of one variable on another” (p. 51). In
addition, each dependent variable always has an error term demonstrated by a circle
pointing to that dependent variable. The part of the dependent variable that is not
explained by the corresponding independent variable becomes the error term.
Model Specification
According to Schumacker and Lomax (2004, ch. 7), model specification is a
necessary element in examining the multiple variable relationships in a path model
analysis. Many different path models may be developed based on the hypothesized
relationships of the study. Determining the correct model is known as model
specification. This demonstrates the important role of theory in justifying a hypothesized
model. Path analysis is used in order to estimate the effects among the variables once the
32
model has been specified according to theoretical considerations, not to provide a way to
specify the model.
Based on the hypothesized model for the overall sample presented in figure 3.1,
the overall guiding research questions for this study were as follows:
(1) Does perceived administrative support mediate the effect of teaching
experience, perceived student behavior and teachers’ satisfaction with their
salary relative to teachers’ job satisfaction?
(2) Does perceived administrative support mediate the effect of teaching
experience, perceived student behavior, and teachers’ satisfaction with their
salary relative to teachers’ intent to stay in teaching?
(3) Does the mediating effect of perceived administrative support differ
according to the environmental setting of the school?

33
Figure 3.1 Initial path analysis model for overall sample: The overall model of the relationship between Teacher Intent to Stay in Teaching, Teachers’ Job Satisfaction, Perceived Administrative Support, Teaching Experience, Perceived Student Behavior, and Teachers’ Satisfaction with Salary.
Teaching Experience
Perceived Student
Behavior
Perceived Administrative
Support
Teacher Intent to Stay in
Teaching
Teacher Job Satisfaction
Teacher Satisfaction with Salary
Error 2
Error 3
Error 1
34
Therefore, the model specification for this study hypothesized that (a) teaching
experience has a direct effect on teachers’ job satisfaction and teachers’ intent to stay in
teaching; (b) teaching experience has an indirect effect on teachers’ job satisfaction and
teachers’ intent to stay in teaching through perceived administrative support; (c)
perceived student behavior has a direct effect on teachers’ job satisfaction and teachers’
intent to stay in teaching; (d) perceived student behavior has an indirect effect on
teachers’ job satisfaction and teachers’ intent to stay in teaching through perceived
administrative support; (e) teachers’ satisfaction with their salary has a direct effect on
teachers’ job satisfaction and teachers’ intent to stay in teaching; (f) teachers’ satisfaction
with their salary has an indirect effect on teachers’ job satisfaction and teachers’ intent to
stay in teaching through perceived administrative support; (g) perceived administrative
support has a direct effect on teachers’ job satisfaction and teachers’ intent to stay in
teaching; and (h) teachers’ job satisfaction has a direct effect on teachers’ intent to stay in
teaching.
Each of these hypothesized relationships was tested according to four different
models, based on the environmental setting of the school. The first model, the overall
model, included all cases selected for this study according to the selection criteria
discussed later in this chapter. The second model, the urban model, included selected
cases of public school teachers according to the selection criteria for this study, and who
identified their school on the SASS as being located in a large or mid-sized central city.
The third model, the urban fringe model, included selected cases of public school
teachers according to the selection criteria for this study, and who identified their school
on the SASS as being located in the urban fringe of a large or mid-sized central city. The
fourth model, the rural model, included selected cases of public school teachers according
to the selection criteria for this study, and who identified their school on the SASS as
being located in a small town/rural area.
Data
The data used in this study were collected through the 2003-04 administration of
the Schools and Staffing Survey (SASS). According to Tourkin, S. C., Warner, T.,
Parmer, R., Cole, C., Jackson, B., Zukerberg, A., et al. (2007), the SASS is conducted by
the National Center for Education Statistics (NCES) on behalf of the United States
35
Department of Education (USDOE). The purpose of the SASS is to collect extensive
data on public, public charter, Bureau of Indian Affairs (BIA) funded, and private schools
in the United States. These data are collected on both elementary and secondary schools.
It offers a source of data on the characteristics of teachers and principals, teacher hiring
practices, professional development, class size, and other working conditions. These data
are then made available for policymakers, educators, educational researchers, and the
general public for analysis.
The SASS is the nation’s largest, most extensive survey of K-12 schools,
districts, teachers, and administrators conducted. In addition, the SASS is representative
of teachers, administrators, schools, and school districts grades K-12 nationwide. The
2003-04 administration of the SASS represented the fifth data collection cycle. Previous
administrations of the data collection took place during the 1987-1988, 1990-1991, 1993-
1994, and 1999-2000 school years.
A major addition of the 2003-04 SASS to the previous data was to incorporate a
revised data collection procedure suggested by the United States Bureau of the Census
(hereinafter referred to as the Census Bureau). In order to establish rapport with school
personnel, a primary in-person contact was assigned to each sample school. Field
representatives from the Census Bureau were used to collect the data for the principal,
school, library media center, and teacher surveys at the sampled schools. Twelve
regional offices were responsible for making assignments, supervising fieldwork,
checking-in completed questionnaires, editing questionnaires, and implementing quality
control procedures (Strizek et al., 2006).
The 2003-04 SASS consisted of five different questionnaires: (a) a school district
questionnaire; (b) principal questionnaires; (c) school questionnaires; (d) teacher
questionnaires; and (e) a school library media center questionnaire (Tourkin et al., 2007).
Specifically, the data used in this study were gathered from the SASS Teacher
Questionnaire (form SASS-4). Form SASS-4 gathers data about teachers according to
the following eleven sections:
1. General Information;
2. Class Organization;
3. Educational Background;
36
4. Certification and Training;
5. Professional Development;
6. Resources and Assessments of Students;
7. Working Conditions;
8. Decision Making;
9. Teacher Attitudes and School Climate;
10. General Employment Information; and
11. Contact Information.
Form SASS-4 was distributed in two versions. One version of form SASS-4 was
provided for teachers in public schools (form SASS-4A) and another was provided for
teachers in private schools (form SASS-4B). Because this study focused on regular, full
time, public school teachers, only data from form SASS-4A were used. Form SASS-4A
consisted of eighty-three questions. Many of the questions have individual components,
which were assigned a specific item number. The item numbers range from 0010 to
0420.
Table 3.1 below presents the unweighted response rate (84.0) and the base-
weighted response rate (84.8) for form SASS-4A, the Public School Teacher
Questionnaire. According to Strizek et al. (2006), unit response rates were defined as
“the rate at which the sampled units respond by substantially completing the
questionnaire. The response rates can either be unweighted or weighted. The
unweighted response rates are the number of interviewed sample units divided by the
number of eligible (responses plus nonresponses but not ineligible units). The weighted
response rates are the base-weighted number of interviewed cases divided by the base
weighted number of eligible cases. The base weight for each sampled unit is the inverse
of the probability of selection (p.192).”
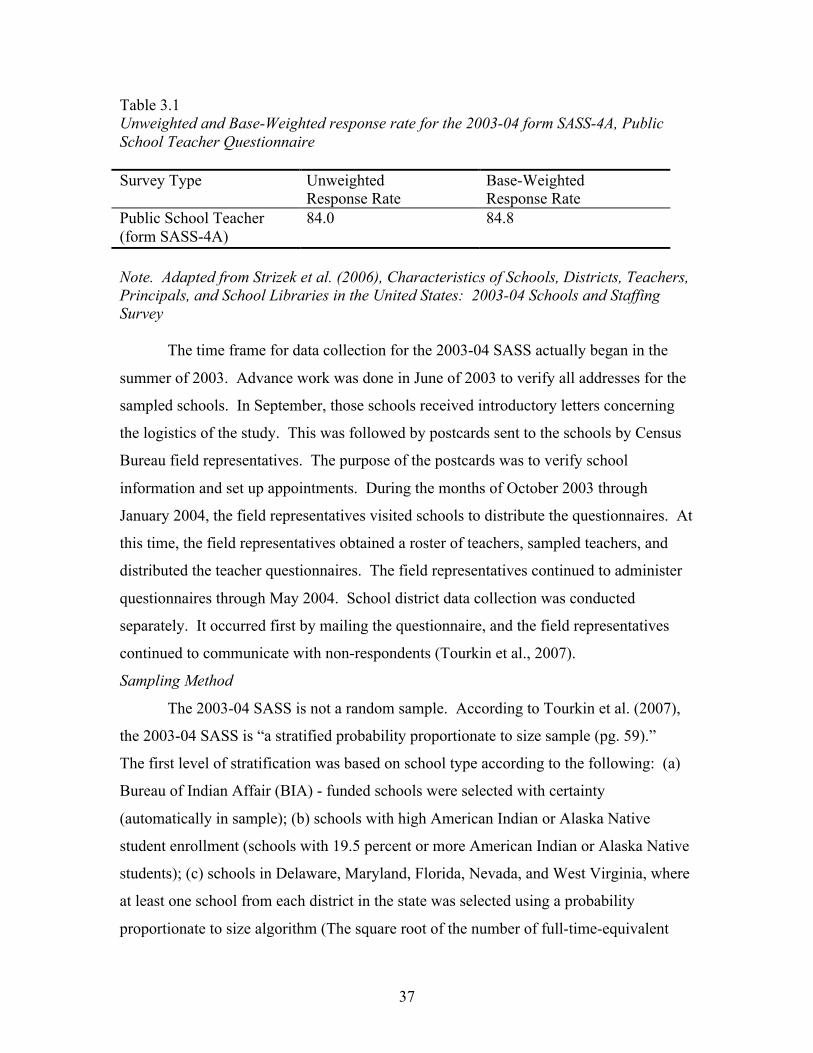
37
Table 3.1 Unweighted and Base-Weighted response rate for the 2003-04 form SASS-4A, Public School Teacher Questionnaire Survey Type Unweighted
Response Rate Base-Weighted Response Rate
Public School Teacher (form SASS-4A)
84.0 84.8
Note. Adapted from Strizek et al. (2006), Characteristics of Schools, Districts, Teachers, Principals, and School Libraries in the United States: 2003-04 Schools and Staffing Survey
The time frame for data collection for the 2003-04 SASS actually began in the
summer of 2003. Advance work was done in June of 2003 to verify all addresses for the
sampled schools. In September, those schools received introductory letters concerning
the logistics of the study. This was followed by postcards sent to the schools by Census
Bureau field representatives. The purpose of the postcards was to verify school
information and set up appointments. During the months of October 2003 through
January 2004, the field representatives visited schools to distribute the questionnaires. At
this time, the field representatives obtained a roster of teachers, sampled teachers, and
distributed the teacher questionnaires. The field representatives continued to administer
questionnaires through May 2004. School district data collection was conducted
separately. It occurred first by mailing the questionnaire, and the field representatives
continued to communicate with non-respondents (Tourkin et al., 2007).
Sampling Method
The 2003-04 SASS is not a random sample. According to Tourkin et al. (2007),
the 2003-04 SASS is “a stratified probability proportionate to size sample (pg. 59).”
The first level of stratification was based on school type according to the following: (a)
Bureau of Indian Affair (BIA) - funded schools were selected with certainty
(automatically in sample); (b) schools with high American Indian or Alaska Native
student enrollment (schools with 19.5 percent or more American Indian or Alaska Native
students); (c) schools in Delaware, Maryland, Florida, Nevada, and West Virginia, where
at least one school from each district in the state was selected using a probability
proportionate to size algorithm (The square root of the number of full-time-equivalent
38
teachers reported for each school or imputed during the sampling frame creation); (d)
public charter schools; and (e) all other schools. Any school that fell into more than one
category was assigned to a, b, c, d, and e in that order.
The second stratification level varied according to the category of school type.
Any BIA - funded schools, type a, were selected for the sample, so there was no need for
additional stratification. Type b schools were stratified according to state (Arizona,
California, Montana, New Mexico, Washington, the remaining Western states,
Minnesota, North Dakota, South Dakota, the remaining Midwestern states, North
Carolina, Oklahoma, and the remaining states except Alaska). Schools meeting the
criteria for type c were first stratified by state and then by school district. Type d schools
were also stratified by state (Arizona, California, Colorado, the remaining Western states,
Michigan, Ohio, Wisconsin, the remaining Midwestern states, Florida, North Carolina,
Texas, the remaining Southern states, Pennsylvania, and the remaining Northeastern
states). The last group, type e schools, were stratified by state for all the remaining states,
including the District of Columbia (Tourkin et al., 2007).
The third stratification was by grade level. Each school, type b through e, was
stratified according to the following definitions:
1. Elementary: lowest grade ≤ 6 and highest grade ≤ 8
2. Secondary: lowest grade ≥ 7 and highest grade ≤ 12
3. Combined: lowest grade ≤ 6 and highest grade > 8, or school is ungraded
According to Tourkin et al. (2007), “the 2003-04 SASS sample was allocated so
that state-level elementary and secondary public school estimates and national estimates
of combined public schools could be made, and the sample was allocated to each state by
grade range and school type (traditional public, public charter, and schools with high
American Indian enrollment) (p. 60).”
The three school sectors covered by the 2003-04 SASS were public, Bureau of
Indian Affairs (BIA), and private. This study focused on the public school sector. The
sampling frame foundation for the 2003-04 SASS public school sample came from an
adjusted version of the 2001-02, Common Core of Data (CCD). The CCD represents
data collected annually by the National Center for Education Statistics (NCES) from all
state education agencies. The CCD includes regular public schools, United States
39
Department of Defense (DoD) operated military base schools, public charter schools,
Bureau of Indian Affairs – funded schools and special purpose schools within the United
States (Strizek et al., 2006). The data from the CCD provide the most complete public
school listing available at the time the 2003-04 SASS was administered. There were
97,623 schools in the CCD sampling frame, including regular public schools, public
charter schools, Bureau of Indian Affairs (BIA) funded schools, Department of Defense
(DoD) operated domestic military base schools, and special purpose schools. Special
purpose schools included special education, vocational, and alternative schools.
According to Strizek et al. (2006), “public schools include traditional public
schools and public charter schools. Traditional public schools are defined as institutions
that provide educational services for at least one of grades 1-12 (or comparable grade
levels), have one or more teachers who give instruction, are located in one or more
buildings, receive public funds as primary support, and are operated by an education
agency. They include regular schools, special education schools, vocational/technical
schools, and alternative schools. They also include schools in juvenile detention centers,
and domestic schools located on military bases and operated by the DoD. Public charter
schools are public schools that, in accordance with an enabling state statute, have been
granted a charter exempting them from selected state and local rules and regulations (p.
1).” Once the public schools were selected, the principals and districts associated with
those public schools were included in the sample. The district sample; however, did not
include districts with public charter schools unless they were associated with one of the
public schools included in the sample
The complex sample design of the 2003-04 SASS created the need to calculate
sampling errors. Replication was used in order to calculate these sampling errors.
According to Strizek et al. (2006), “Replication methods involve constructing a number
of sub samples, or replicates, from the full sample and computing the statistic of interest
for each replicate. The mean square error of the replicate estimates around the full
sample estimate provides an estimate of the variance of the statistic. The replicate
weights are used to compute the variance of a given statistic (p. 198).” The restricted use
data file for the 2003-04 data included a set of 88 replicate weight variables.
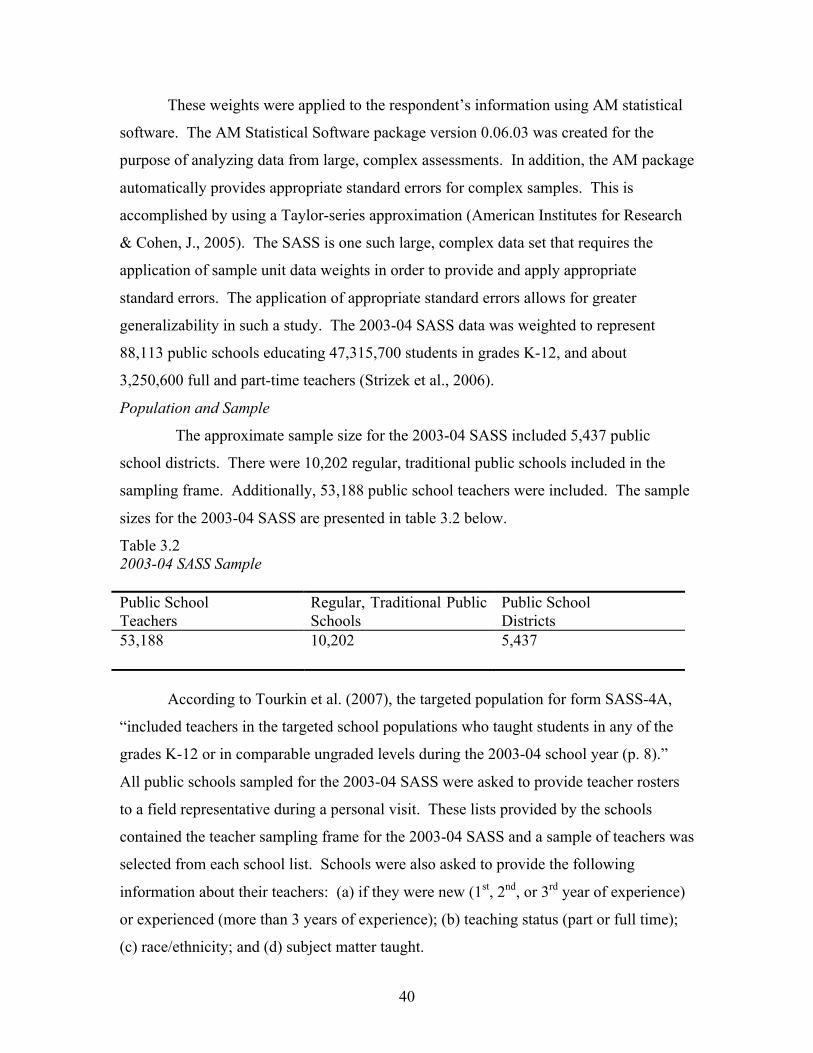
40
These weights were applied to the respondent’s information using AM statistical
software. The AM Statistical Software package version 0.06.03 was created for the
purpose of analyzing data from large, complex assessments. In addition, the AM package
automatically provides appropriate standard errors for complex samples. This is
accomplished by using a Taylor-series approximation (American Institutes for Research
& Cohen, J., 2005). The SASS is one such large, complex data set that requires the
application of sample unit data weights in order to provide and apply appropriate
standard errors. The application of appropriate standard errors allows for greater
generalizability in such a study. The 2003-04 SASS data was weighted to represent
88,113 public schools educating 47,315,700 students in grades K-12, and about
3,250,600 full and part-time teachers (Strizek et al., 2006).
Population and Sample
The approximate sample size for the 2003-04 SASS included 5,437 public
school districts. There were 10,202 regular, traditional public schools included in the
sampling frame. Additionally, 53,188 public school teachers were included. The sample
sizes for the 2003-04 SASS are presented in table 3.2 below.
Table 3.2 2003-04 SASS Sample Public School Teachers
Regular, Traditional Public Schools
Public School Districts
53,188 10,202 5,437
According to Tourkin et al. (2007), the targeted population for form SASS-4A,
“included teachers in the targeted school populations who taught students in any of the
grades K-12 or in comparable ungraded levels during the 2003-04 school year (p. 8).”
All public schools sampled for the 2003-04 SASS were asked to provide teacher rosters
to a field representative during a personal visit. These lists provided by the schools
contained the teacher sampling frame for the 2003-04 SASS and a sample of teachers was
selected from each school list. Schools were also asked to provide the following
information about their teachers: (a) if they were new (1st, 2nd, or 3rd year of experience)
or experienced (more than 3 years of experience); (b) teaching status (part or full time);
(c) race/ethnicity; and (d) subject matter taught.
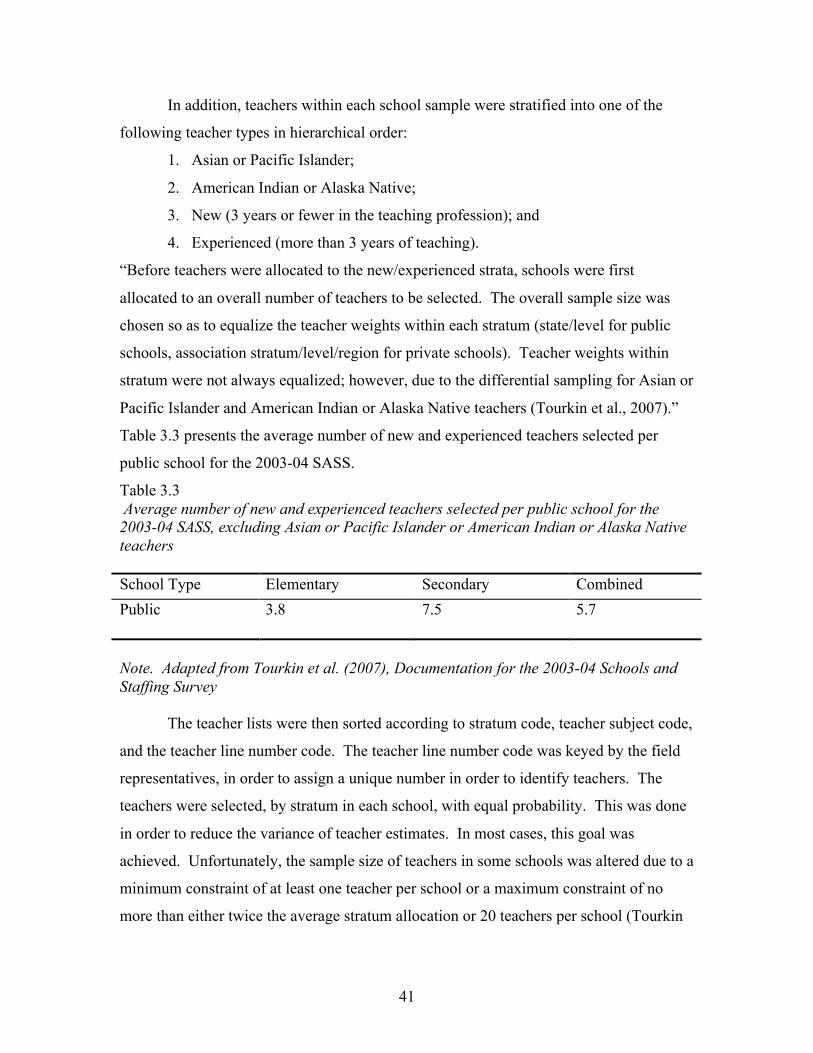
41
In addition, teachers within each school sample were stratified into one of the
following teacher types in hierarchical order:
1. Asian or Pacific Islander;
2. American Indian or Alaska Native;
3. New (3 years or fewer in the teaching profession); and
4. Experienced (more than 3 years of teaching).
“Before teachers were allocated to the new/experienced strata, schools were first
allocated to an overall number of teachers to be selected. The overall sample size was
chosen so as to equalize the teacher weights within each stratum (state/level for public
schools, association stratum/level/region for private schools). Teacher weights within
stratum were not always equalized; however, due to the differential sampling for Asian or
Pacific Islander and American Indian or Alaska Native teachers (Tourkin et al., 2007).”
Table 3.3 presents the average number of new and experienced teachers selected per
public school for the 2003-04 SASS.
Table 3.3 Average number of new and experienced teachers selected per public school for the 2003-04 SASS, excluding Asian or Pacific Islander or American Indian or Alaska Native teachers School Type Elementary Secondary Combined Public 3.8 7.5 5.7
Note. Adapted from Tourkin et al. (2007), Documentation for the 2003-04 Schools and Staffing Survey
The teacher lists were then sorted according to stratum code, teacher subject code,
and the teacher line number code. The teacher line number code was keyed by the field
representatives, in order to assign a unique number in order to identify teachers. The
teachers were selected, by stratum in each school, with equal probability. This was done
in order to reduce the variance of teacher estimates. In most cases, this goal was
achieved. Unfortunately, the sample size of teachers in some schools was altered due to a
minimum constraint of at least one teacher per school or a maximum constraint of no
more than either twice the average stratum allocation or 20 teachers per school (Tourkin
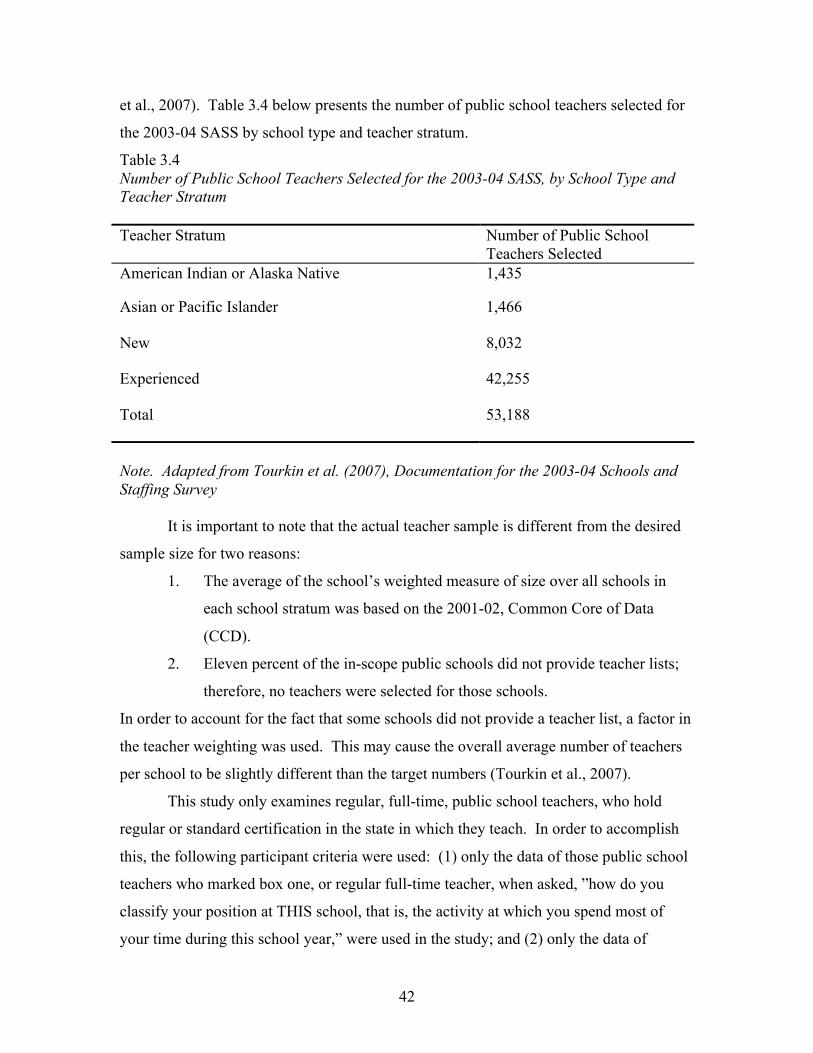
42
et al., 2007). Table 3.4 below presents the number of public school teachers selected for
the 2003-04 SASS by school type and teacher stratum.
Table 3.4 Number of Public School Teachers Selected for the 2003-04 SASS, by School Type and Teacher Stratum Teacher Stratum Number of Public School
Teachers Selected American Indian or Alaska Native 1,435
Asian or Pacific Islander 1,466
New 8,032
Experienced 42,255
Total 53,188
Note. Adapted from Tourkin et al. (2007), Documentation for the 2003-04 Schools and Staffing Survey
It is important to note that the actual teacher sample is different from the desired
sample size for two reasons:
1. The average of the school’s weighted measure of size over all schools in
each school stratum was based on the 2001-02, Common Core of Data
(CCD).
2. Eleven percent of the in-scope public schools did not provide teacher lists;
therefore, no teachers were selected for those schools.
In order to account for the fact that some schools did not provide a teacher list, a factor in
the teacher weighting was used. This may cause the overall average number of teachers
per school to be slightly different than the target numbers (Tourkin et al., 2007).
This study only examines regular, full-time, public school teachers, who hold
regular or standard certification in the state in which they teach. In order to accomplish
this, the following participant criteria were used: (1) only the data of those public school
teachers who marked box one, or regular full-time teacher, when asked, ”how do you
classify your position at THIS school, that is, the activity at which you spend most of
your time during this school year,” were used in the study; and (2) only the data of
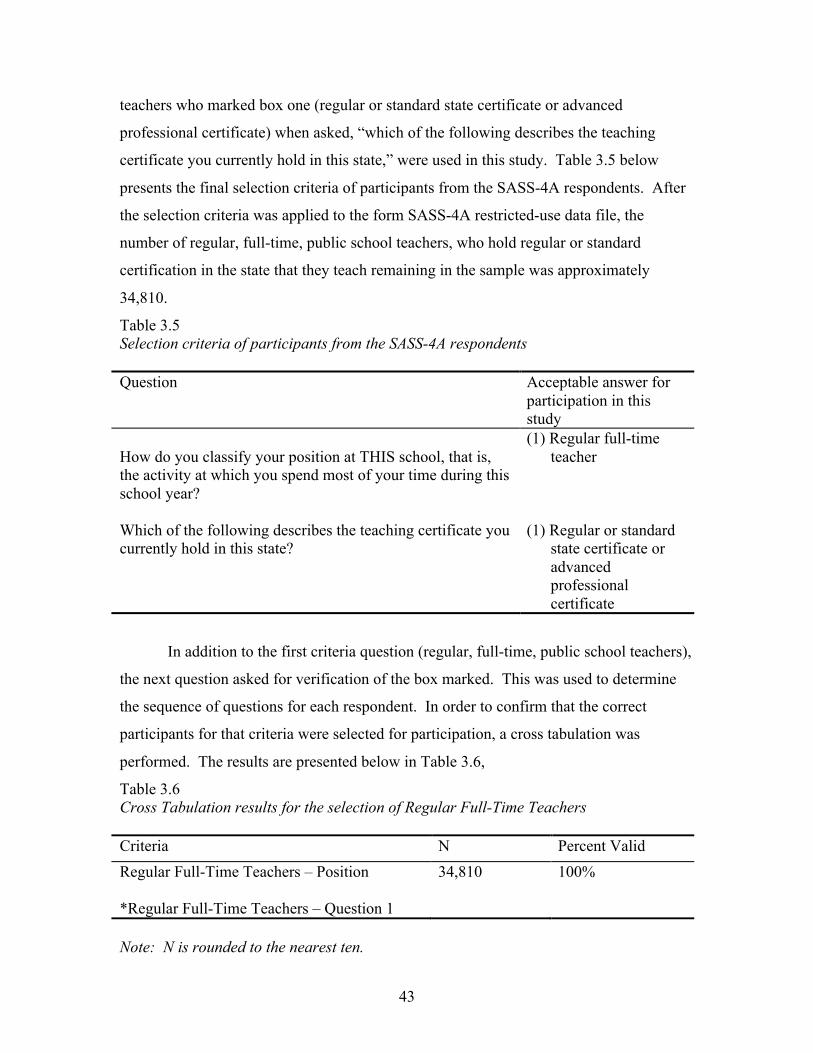
43
teachers who marked box one (regular or standard state certificate or advanced
professional certificate) when asked, “which of the following describes the teaching
certificate you currently hold in this state,” were used in this study. Table 3.5 below
presents the final selection criteria of participants from the SASS-4A respondents. After
the selection criteria was applied to the form SASS-4A restricted-use data file, the
number of regular, full-time, public school teachers, who hold regular or standard
certification in the state that they teach remaining in the sample was approximately
34,810.
Table 3.5 Selection criteria of participants from the SASS-4A respondents Question Acceptable answer for
participation in this study
How do you classify your position at THIS school, that is, the activity at which you spend most of your time during this school year?
(1) Regular full-time teacher
Which of the following describes the teaching certificate you currently hold in this state?
(1) Regular or standard state certificate or advanced professional certificate
In addition to the first criteria question (regular, full-time, public school teachers),
the next question asked for verification of the box marked. This was used to determine
the sequence of questions for each respondent. In order to confirm that the correct
participants for that criteria were selected for participation, a cross tabulation was
performed. The results are presented below in Table 3.6,
Table 3.6 Cross Tabulation results for the selection of Regular Full-Time Teachers Criteria N Percent Valid Regular Full-Time Teachers – Position
*Regular Full-Time Teachers – Question 1
34,810 100%
Note: N is rounded to the nearest ten.
44
Variables
Teachers’ Intent to Stay in Teaching
A major endogenous variable in this study was the teachers’ intent to stay in
teaching. An endogenous variable indicates a variable with a path (single arrow) leading
to it from another variable in the model (Raykov & Marcoulides, 2006). In other words,
the variable has a clear cause from within the model. Using the 2003-04 SASS Public
School Teacher Questionnaire, form SASS-4A, teachers’ intent to stay in teaching was
measured with one question. The question for that variable asks, “How long do you plan
to remain in teaching?” This item is measured using an ordered response scale. The
possible answers were as follows: (1) definitely plan to leave as soon as I can; (2) will
probably continue unless something better comes along; (3) until I am eligible for
retirement; and (4) as long as I am able. The ordered response scale for this variable was
reverse coded from the original scale so that teachers’ intent to stay in teaching increases
as the response increases. It should also be noted that the variable for teachers’ intent to
stay in teaching originally had a fifth answer choice, “undecided at this time.” This was
treated as a missing value (12.6% of respondents) and was removed from the data
analysis.
Teachers’ Job Satisfaction
A second major endogenous variable in this study was the teachers’ job
satisfaction. Using the 2003-04 SASS Public School Teacher Questionnaire, form SASS-
4A; teachers’ job satisfaction will be measured with one question. The question for that
item asks, “To what extent do you agree or disagree with each of the following
statements? – I am generally satisfied with being a teacher at this school.” This item is
measured using a Likert scale. The Likert scale for this variable was reverse coded from
the original scale in order to create the positive correlation that one would expect. In
other words, as the number of the response increases, a teachers’ job satisfaction
increases. The possible answers were as follows: (1) strongly disagree; (2) somewhat
disagree; (3) somewhat agree; and (4) strongly agree.
Perceived Administrative Support
Because form SASS-4A has several items that might be useful for measuring the
independent variable of perceived administrative support, a factor analysis was conducted

45
by this researcher prior to the path analysis. Factor analysis is “a statistical technique
applied to a single set of variables where the researcher is interested in discovering which
variables in the set form coherent subsets that are relatively independent of one another
(Tabachnick & Fidell, 1996, p. 635).” According to Tabachnick and Fidell (1996),
factors are derived from a set of variables that are highly correlated with one another, but
independent of other subsets that may be formed.
Factor analysis provided a pattern of correlations among the items finally
determined to be used for the variable. In addition, it allowed the researcher to reduce the
high number of observed variables to a small number of items that derived the factor.
This allows the researcher to construct an operational definition (presented in table 1.1)
of administrative support (Tabachnick & Fidell, 1996). Based on the result of the factor
analysis, a composite variable was created by using the mean scores of the following five
items which loaded to derive that variable: (a) the principal lets staff members know
what is expected of them; (b) the school administration’s behavior toward the staff is
supportive and encouraging; (c) my principal enforces school rules for student conduct
and backs me up when I need it; (d) the principal knows what kind of school he/she
wants and has communicated it to the staff; and (e) in this school, staff members are
recognized for a job well done.
In part IX of the 2003-04 SASS Public School Teacher Questionnaire, form
SASS-4A, participants were asked, “Do you agree or disagree with each of the following
questions?” Each item was measured through the use of a Likert type scale. The
possible answers were as follows: (1) strongly disagree; (2) somewhat disagree; (3)
somewhat agree; and (4) strongly agree. The Likert scale for this variable was also
reverse coded from the original scale. Therefore, as the amount of perceived
administrative support responses increased, teachers’ job satisfaction and teachers’ intent
to stay in teaching would increase.
Teaching Experience
The second independent variable in this study was the teachers’ job experience.
This variable was used to distinguish between teachers with three or less years of
experience and teachers with more than three years of experience. Using the 2003-04
SASS Public School Teacher Questionnaire, form SASS-4A, the teachers’ job experience
46
was measured with the following question: “Was your FIRST year of teaching before the
1999-2000 school year?” Originally, this item was measured categorically, using a one
for yes and two for no. Through the use of SPSS, a dummy variable was created in order
to identify novice teachers. All answers of one (1) were recoded to a zero (0), meaning
that any respondent answering zero (0) had more than three years of teaching experience.
All answers of two (2) were then recoded to one (1), meaning that any respondent
answering one (1) had three or less years of teaching experience.
Perceived Student Behavior
The third independent variable in this study was perceived student behavior.
Using the 2003-04 SASS Public School Teacher Questionnaire, form SASS-4A, student
behavior was measured with the following question: “To what extent do you agree or
disagree with each of the following statements? – the level of student misbehavior in this
school (such as noise, horseplay, or fighting in the halls, cafeteria or student lounge)
interferes with my teaching.” This item is measured using a Likert scale. The possible
answers were as follows: (1) strongly disagree; (2) somewhat disagree; (3) somewhat
agree; and (4) strongly agree. The Likert scale for this variable was also reverse coded
from the original scale. Thus, as the number of the response increased, the more a
teacher agreed that perceived student misbehavior interfered with their teaching.
Teachers’ Satisfaction with their Salary
A fourth independent variable in this study was the teachers’ satisfaction with
their salary. Using the 2003-04 SASS Public School Teacher Questionnaire, form SASS-
4A, teachers’ satisfaction with their salary was measured with the following question:
“To what extent do you agree or disagree with each of the following statements? – I am
satisfied with my teaching salary.” This item was measured using a Likert scale. The
possible answers were as follows: (1) strongly disagree; (2) somewhat disagree; (3)
somewhat agree; and (4) strongly agree. The Likert scale for this variable was also
reverse coded from the original scale. After the reverse coding, as the number of the
response increased, a teachers’ satisfaction with their salary increased. The questions
used to measure the variables and possible answer choices discussed above are presented
in Table 3.7 below.
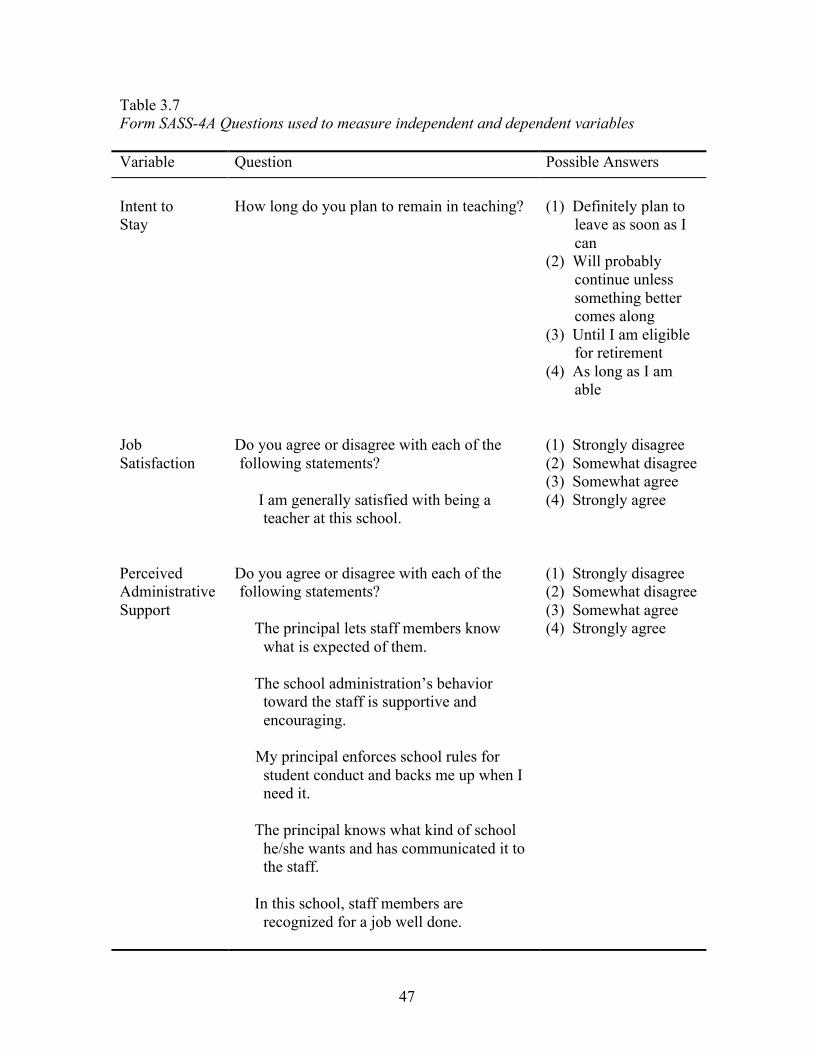
47
Table 3.7 Form SASS-4A Questions used to measure independent and dependent variables Variable Question Possible Answers Intent to Stay
How long do you plan to remain in teaching?
(1) Definitely plan to
leave as soon as I can
(2) Will probably continue unless something better comes along
(3) Until I am eligible for retirement
(4) As long as I am able
Job Satisfaction
Do you agree or disagree with each of the following statements?
I am generally satisfied with being a
teacher at this school.
(1) Strongly disagree (2) Somewhat disagree (3) Somewhat agree (4) Strongly agree
Perceived Administrative Support
Do you agree or disagree with each of the following statements?
The principal lets staff members know
what is expected of them. The school administration’s behavior
toward the staff is supportive and encouraging.
My principal enforces school rules for
student conduct and backs me up when I need it.
The principal knows what kind of school
he/she wants and has communicated it to the staff.
In this school, staff members are
recognized for a job well done.
(1) Strongly disagree (2) Somewhat disagree (3) Somewhat agree (4) Strongly agree
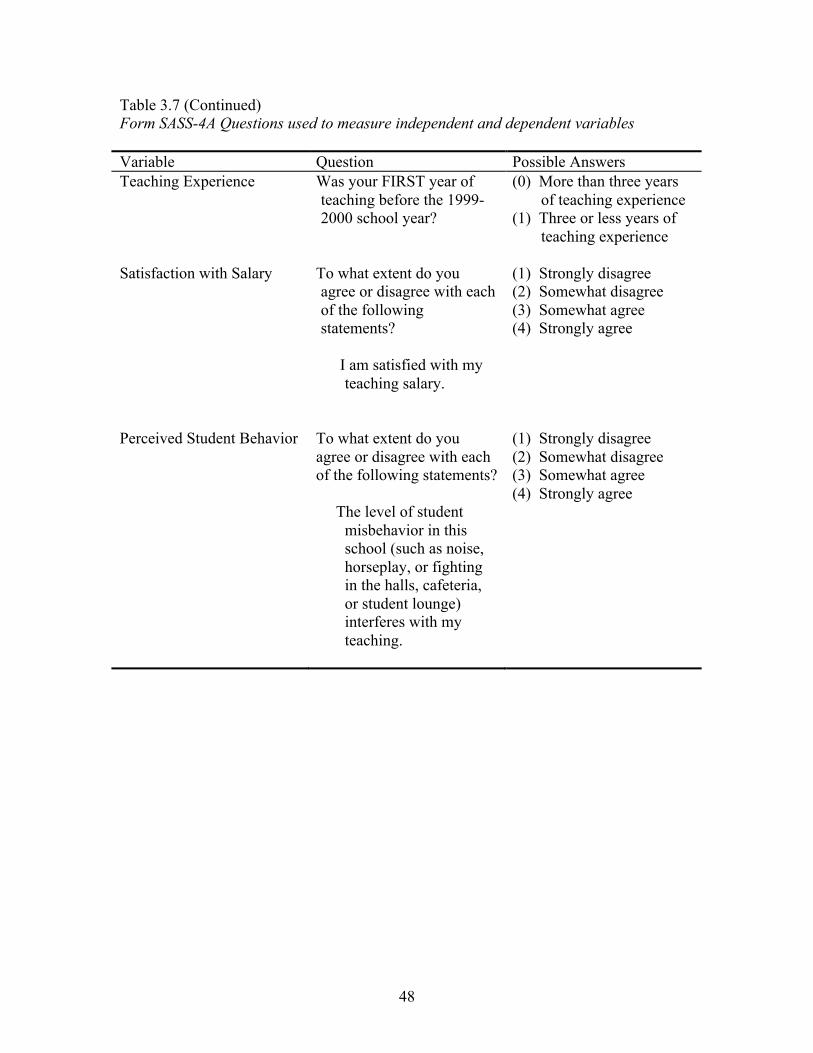
48
Table 3.7 (Continued) Form SASS-4A Questions used to measure independent and dependent variables Variable Question Possible Answers Teaching Experience Was your FIRST year of
teaching before the 1999-2000 school year?
(0) More than three years of teaching experience
(1) Three or less years of teaching experience
Satisfaction with Salary To what extent do you
agree or disagree with each of the following statements?
I am satisfied with my
teaching salary.
(1) Strongly disagree (2) Somewhat disagree (3) Somewhat agree (4) Strongly agree
Perceived Student Behavior
To what extent do you agree or disagree with each of the following statements? The level of student
misbehavior in this school (such as noise, horseplay, or fighting in the halls, cafeteria, or student lounge) interferes with my teaching.
(1) Strongly disagree (2) Somewhat disagree (3) Somewhat agree (4) Strongly agree

49
Chapter Four:
Results of the Study
This chapter presents the results of the path model statistical analysis described in
Chapter Three and is organized into four sections. The first section provides statistical
information gathered during the preliminary analysis, and is sub-divided into two
sections. The first sub-section contains the application of two sets of descriptive statistics
for the following variables: (a) teachers’ intent to stay in teaching; (b) teachers’ job
satisfaction; (c) perceived administrative support; (d) teaching experience; (e) perceived
student behavior; and (f) teachers’ satisfaction with salary. The first set of descriptive
statistics was derived through the use of SPSS 14.0 and do not apply the weight and
design effect of the study. The second set of descriptive statistics was derived via AM
statistical software and includes the weight and design effect. Specifically, the sample
size, mean, and standard deviation are presented and discussed for each variable. Sample
size was defined as the number of scores (N); mean was defined as the sum of the scores
divided by the number of scores ( ); and standard deviation (SD) was defined as the
positive square root of the variance (Howell, 2007). The second sub-section presented,
described and compared the Pearson correlations (r) for each of the six variables
identified above. Two sets of correlations were conducted. The first was derived through
the use of SPSS 14.0, including computation of the significance level, but did not apply
the weight and design effect. The second was derived by application of AM statistical
software, including the weight and design effect, but the significance level was not
computed.
Presented in the second section are descriptions for each of the four hypothesized,
path models analyzed and are organized into the following four subsections: (1) the
overall model; (2) the urban model; (3) the urban fringe model; and (4) the rural model.
A saturated model and a final model are presented and discussed for each of the four sub-
sections. A saturated model is defined as, “the model with all parameters indicated
(Schumacker & Lomax, 2004, p. 49). Any parameter that is not significant, based on the
analysis, is removed for the final model. The standardized coefficient beta ( ) and
significance level for each variable are also reported, described, and compared.
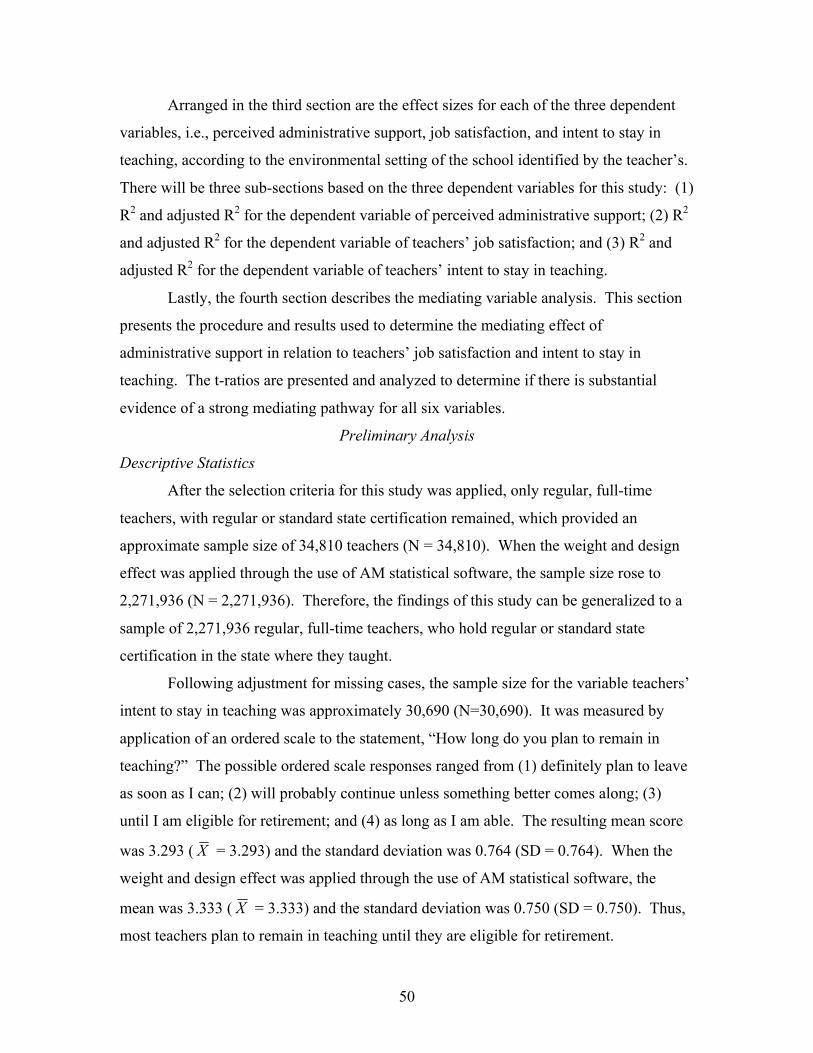
50
Arranged in the third section are the effect sizes for each of the three dependent
variables, i.e., perceived administrative support, job satisfaction, and intent to stay in
teaching, according to the environmental setting of the school identified by the teacher’s.
There will be three sub-sections based on the three dependent variables for this study: (1)
R2 and adjusted R2 for the dependent variable of perceived administrative support; (2) R2
and adjusted R2 for the dependent variable of teachers’ job satisfaction; and (3) R2 and
adjusted R2 for the dependent variable of teachers’ intent to stay in teaching.
Lastly, the fourth section describes the mediating variable analysis. This section
presents the procedure and results used to determine the mediating effect of
administrative support in relation to teachers’ job satisfaction and intent to stay in
teaching. The t-ratios are presented and analyzed to determine if there is substantial
evidence of a strong mediating pathway for all six variables.
Preliminary Analysis
Descriptive Statistics
After the selection criteria for this study was applied, only regular, full-time
teachers, with regular or standard state certification remained, which provided an
approximate sample size of 34,810 teachers (N = 34,810). When the weight and design
effect was applied through the use of AM statistical software, the sample size rose to
2,271,936 (N = 2,271,936). Therefore, the findings of this study can be generalized to a
sample of 2,271,936 regular, full-time teachers, who hold regular or standard state
certification in the state where they taught.
Following adjustment for missing cases, the sample size for the variable teachers’
intent to stay in teaching was approximately 30,690 (N=30,690). It was measured by
application of an ordered scale to the statement, “How long do you plan to remain in
teaching?” The possible ordered scale responses ranged from (1) definitely plan to leave
as soon as I can; (2) will probably continue unless something better comes along; (3)
until I am eligible for retirement; and (4) as long as I am able. The resulting mean score
was 3.293 ( = 3.293) and the standard deviation was 0.764 (SD = 0.764). When the
weight and design effect was applied through the use of AM statistical software, the
mean was 3.333 ( = 3.333) and the standard deviation was 0.750 (SD = 0.750). Thus,
most teachers plan to remain in teaching until they are eligible for retirement.
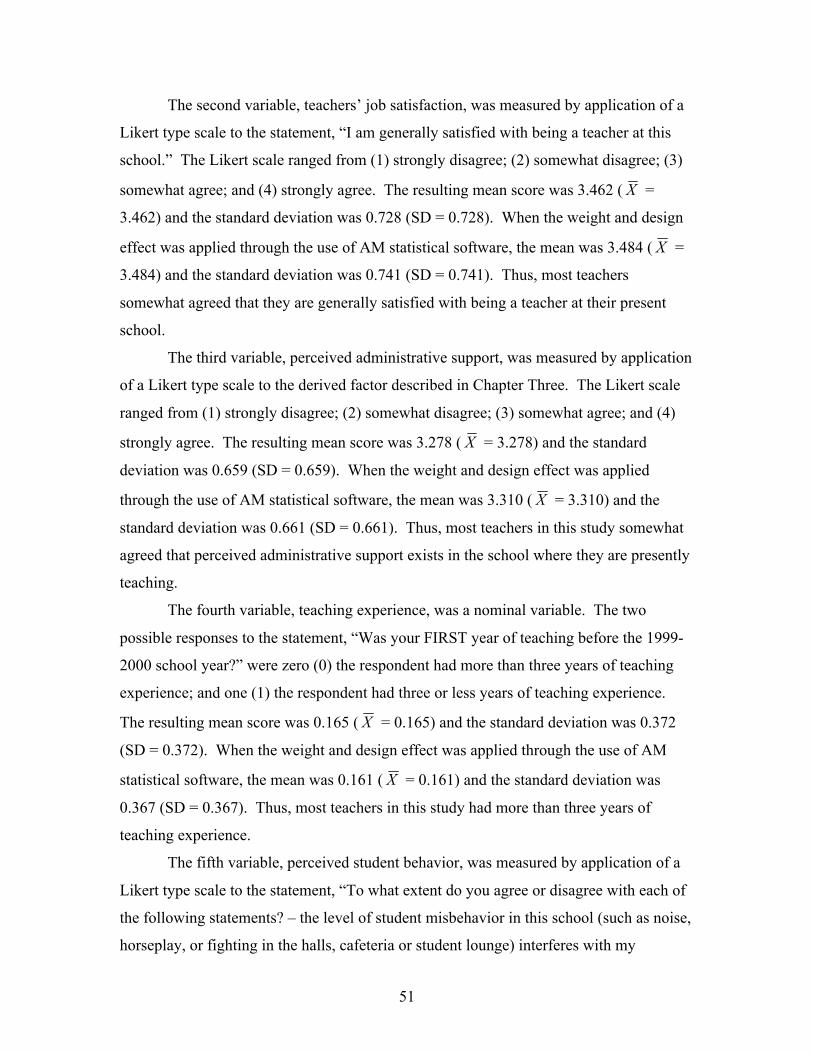
51
The second variable, teachers’ job satisfaction, was measured by application of a
Likert type scale to the statement, “I am generally satisfied with being a teacher at this
school.” The Likert scale ranged from (1) strongly disagree; (2) somewhat disagree; (3)
somewhat agree; and (4) strongly agree. The resulting mean score was 3.462 ( =
3.462) and the standard deviation was 0.728 (SD = 0.728). When the weight and design
effect was applied through the use of AM statistical software, the mean was 3.484 ( =
3.484) and the standard deviation was 0.741 (SD = 0.741). Thus, most teachers
somewhat agreed that they are generally satisfied with being a teacher at their present
school.
The third variable, perceived administrative support, was measured by application
of a Likert type scale to the derived factor described in Chapter Three. The Likert scale
ranged from (1) strongly disagree; (2) somewhat disagree; (3) somewhat agree; and (4)
strongly agree. The resulting mean score was 3.278 ( = 3.278) and the standard
deviation was 0.659 (SD = 0.659). When the weight and design effect was applied
through the use of AM statistical software, the mean was 3.310 ( = 3.310) and the
standard deviation was 0.661 (SD = 0.661). Thus, most teachers in this study somewhat
agreed that perceived administrative support exists in the school where they are presently
teaching.
The fourth variable, teaching experience, was a nominal variable. The two
possible responses to the statement, “Was your FIRST year of teaching before the 1999-
2000 school year?” were zero (0) the respondent had more than three years of teaching
experience; and one (1) the respondent had three or less years of teaching experience.
The resulting mean score was 0.165 ( = 0.165) and the standard deviation was 0.372
(SD = 0.372). When the weight and design effect was applied through the use of AM
statistical software, the mean was 0.161 ( = 0.161) and the standard deviation was
0.367 (SD = 0.367). Thus, most teachers in this study had more than three years of
teaching experience.
The fifth variable, perceived student behavior, was measured by application of a
Likert type scale to the statement, “To what extent do you agree or disagree with each of
the following statements? – the level of student misbehavior in this school (such as noise,
horseplay, or fighting in the halls, cafeteria or student lounge) interferes with my
52
teaching.” The Likert scale ranged from (1) strongly disagree; (2) somewhat disagree;
(3) somewhat agree; (4) strongly agree. The resulting mean score was 2.141 ( =
2.141) and the standard deviation was 0.999 (SD = 0.999). When the weight and design
effect was applied through the use of AM statistical software, the mean was 2.106 ( =
2.106) and the standard deviation was 1.015 (SD = 1.015). Thus, most teachers in this
study somewhat disagree that the level of perceived student misbehavior in their present
school interferes with their teaching.
The sixth and final variable, teachers’ satisfaction with salary, was measured by
application of a Likert type scale to the statement, “To what extent do you agree or
disagree with each of the following statements? – I am satisfied with my teaching salary.”
The Likert scale ranged from (1) strongly disagree; (2) somewhat disagree; (3) somewhat
agree; and (4) strongly agree. The resulting mean score was 2.215 ( = 2.215) and the
standard deviation was 0.994 (SD = 0.994). When the weight and design effect was
applied through the use of AM statistical software, the mean for this variable was 2.278
( = 2.278) and the standard deviation was 1.002 (SD = 1.002). Thus, most teachers in
this study somewhat disagree that they are satisfied with their current teaching salary.
It is important to note that the mean scores before and after the weights and
design effect were applied are very similar. Also, there was very little variance, as
measured by the standard deviation, in the responses. Table 4.1 below displays the
sample size, mean, and standard deviation for each variable in the study without the
weights and design effect applied. Table 4.2 displays the sample size, mean, and
standard deviation with the weights and design effect applied.

53
Table 4.1 Descriptive Statistics using SPSS, no weight or design effect was considered Variable N Mean Standard
Deviation Teachers Intent to Stay in Teaching
30,690 3.293 0.764
Teachers Job Satisfaction 34,810 3.462 0.728
Perceived Administrative Support 34,810 3.278 0.659
Teaching Experience 34,810 0.165 0.372
Perceived Student Behavior 34,810 2.141 .999
Teachers Satisfaction with Salary 34,810 2.215 .994
Note: N is rounded to the nearest ten. Table 4.2 Descriptive Statistics using AM Statistical Software, weights and design effect applied Variable Weighted N Mean Standard
Deviation Teachers Intent to Stay in Teaching
2,271,936 3.333 0.750
Teachers Job Satisfaction 2,271,936 3.484 0.741
Perceived Administrative Support 2,271,936 3.310 0.661
Teaching Experience 2,271,936 0.161 0.367
Perceived Student Behavior 2,271,936 2.106 1.015
Teachers Satisfaction with Salary 2,271,936 2.278 1.002
54
Pearson Correlation
The Pearson’s correlation coefficient (r) is defined as the covariance divided by
the standard deviation. The correlation coefficient is a point on the scale between -1 and
1. The closer the value gets to either of those limits, the stronger the relationship is
between the two variables (Howell, 2007).
All Pearson correlation coefficients were significant at 0.01 significance level (p <
0.01), except one. The Pearson correlation coefficients (r) discussed below were
obtained through the application of SPSS. The highest correlation was between teachers’
job satisfaction and perceived administrative support (r = 0.460, p < 0.01) and
demonstrates that as teachers’ perceptions of administrative support increase, their job
satisfaction increases. The second highest correlation was between student behavior and
teachers’ job satisfaction (r = -0.291, p < 0.01) suggests that as teachers’ perceptions of
student behavior interfering with their teaching increases, their job satisfaction decreases.
The next highest correlation existed between teachers’ job satisfaction and teachers’
intent to stay in teaching (r = 0.268, p < 0.01). This suggests that as teachers’ job
satisfaction increases, their intent to stay in teaching increases. The fourth highest
correlation was between perceived student behavior and perceived administrative support
(r = -0.253, p < 0.01) and suggests that as teachers’ perceptions of student behavior
interfering with their teaching increases, their perception of administrative support
decreases. The fifth highest correlation existed between teachers’ satisfaction with salary
and teachers’ job satisfaction (r = 0.181, p < 0.01). This correlation reveals that as
teachers’ satisfaction with their salary increases, their job satisfaction increases. The
sixth highest correlation was between teachers’ satisfaction with salary and perceived
administrative support (r = 0.163, p < 0.01), revealing that as teachers’ satisfaction with
their salary increases, their perception of administrative support increases. The seventh
highest correlation existed between perceived administrative support and teachers’ intent
to stay in teaching (r = 0.159, p < 0.01). This correlation shows that as teachers’
perceptions of administrative support increase, their intent to stay in teaching increases.
The eighth highest correlation was between teachers’ satisfaction with salary and
teachers’ intent to stay in teaching. This demonstrates that as teachers’ satisfaction with
their present annual salary increases, their intent to stay in teaching increases. The ninth
55
highest correlation existed between student behavior and teachers’ intent to stay in
teaching (r = -0.108, p < 0.01). This negative correlation suggests that as teachers’
perception that student behavior in their school was interfering with their teaching
increased, their intent to stay in teaching decreased. All other Pearson correlation
coefficients, with one exception, were significant at .01 (p < .01). They ranged from -
0.088 to -0.025. The only correlation that was not significant was between teachers’
satisfaction with their salary and teaching experience (r = 0.009) and suggests there is not
a strong relationship between the two variables.
Table 4.3 below displays the Pearson correlation coefficients (r). The first
correlation coefficient was derived using SPSS with no weights or design effect applied;
however, it does include the level of significance. The second correlation coefficient (r),
which is in parentheses, was derived through the use of AM statistical software in order
to apply the weight and design effect.
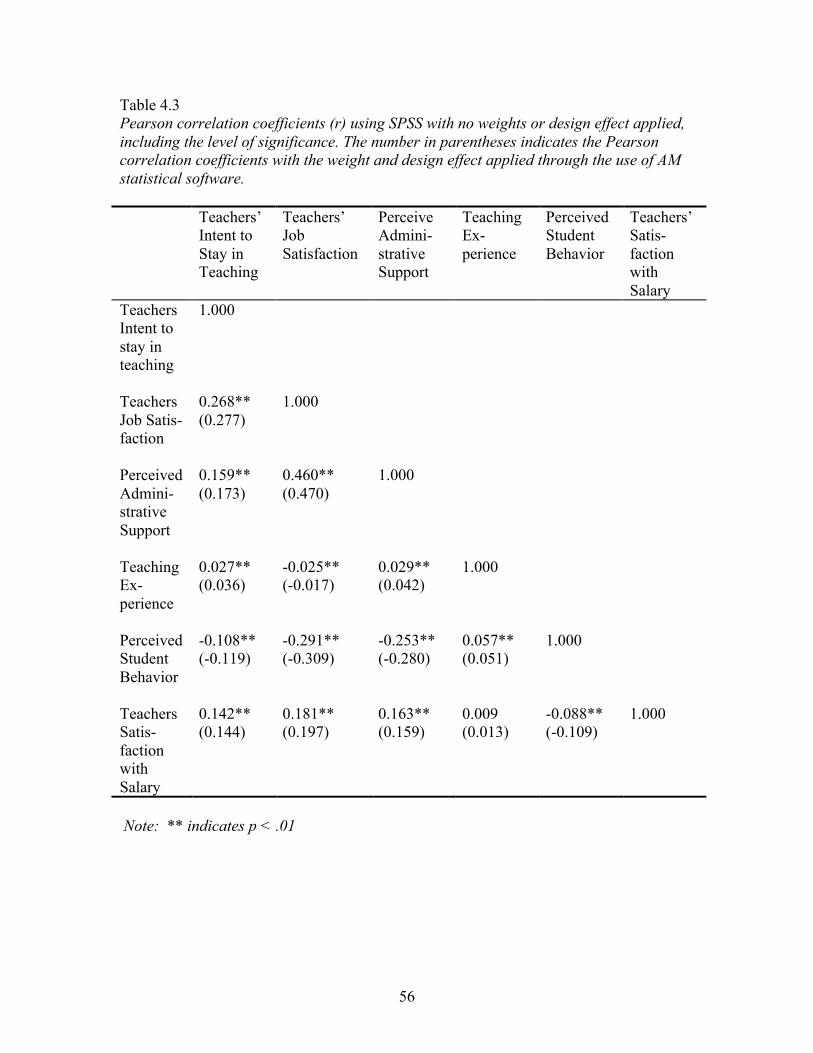
56
Table 4.3 Pearson correlation coefficients (r) using SPSS with no weights or design effect applied, including the level of significance. The number in parentheses indicates the Pearson correlation coefficients with the weight and design effect applied through the use of AM statistical software. Teachers’
Intent to Stay in Teaching
Teachers’ Job Satisfaction
Perceive Admini-strative Support
Teaching Ex-perience
Perceived Student Behavior
Teachers’ Satis-faction with Salary
Teachers Intent to stay in teaching
1.000
Teachers Job Satis-faction
0.268** (0.277)
1.000
Perceived Admini-strative Support
0.159** (0.173)
0.460** (0.470)
1.000
Teaching Ex-perience
0.027** (0.036)
-0.025** (-0.017)
0.029** (0.042)
1.000
Perceived Student Behavior
-0.108** (-0.119)
-0.291** (-0.309)
-0.253** (-0.280)
0.057** (0.051)
1.000
Teachers Satis-faction with Salary
0.142** (0.144)
0.181** (0.197)
0.163** (0.159)
0.009 (0.013)
-0.088** (-0.109)
1.000
Note: ** indicates p < .01

57
Path Model Analysis
Overall Sample
Following application of the selection criteria, only regular, full-time public
school teachers, with regular or standard state certification remained for this study. This
left an approximate sample size of 34,810. The path analysis model for the overall
sample includes all of these teachers. Figure 4.1 below shows the initial, hypothesized,
path analysis model applied to the overall sample, including the standardized coefficient
betas generated for each direct path. The standardized coefficient betas were all
significant at .01 (p < .01), so each independent variable was a significant predictor of the
dependent variable for the respective direct paths. Therefore, there was no need to
remove any of the hypothesized paths, direct or indirect.
Figure 4.1 presents the final path analysis model for the overall sample. It is
important to note that the strongest predictor of teachers’ job satisfaction was perceived
administrative support ( = .402, p < 0.01), and this path demonstrated the strongest
standardized coefficient beta in the sample. The strongest predictor of teachers’ intent to
stay in teaching was teachers’ job satisfaction ( = .233, p < 0.01). The strongest
predictor of perceived administrative support was perceived student behavior ( = -.269,
p < 0.01). The negative beta denotes that as teachers’ perceptions that student
misbehavior interferes with their teaching increases, their perception of administrative
support declines.
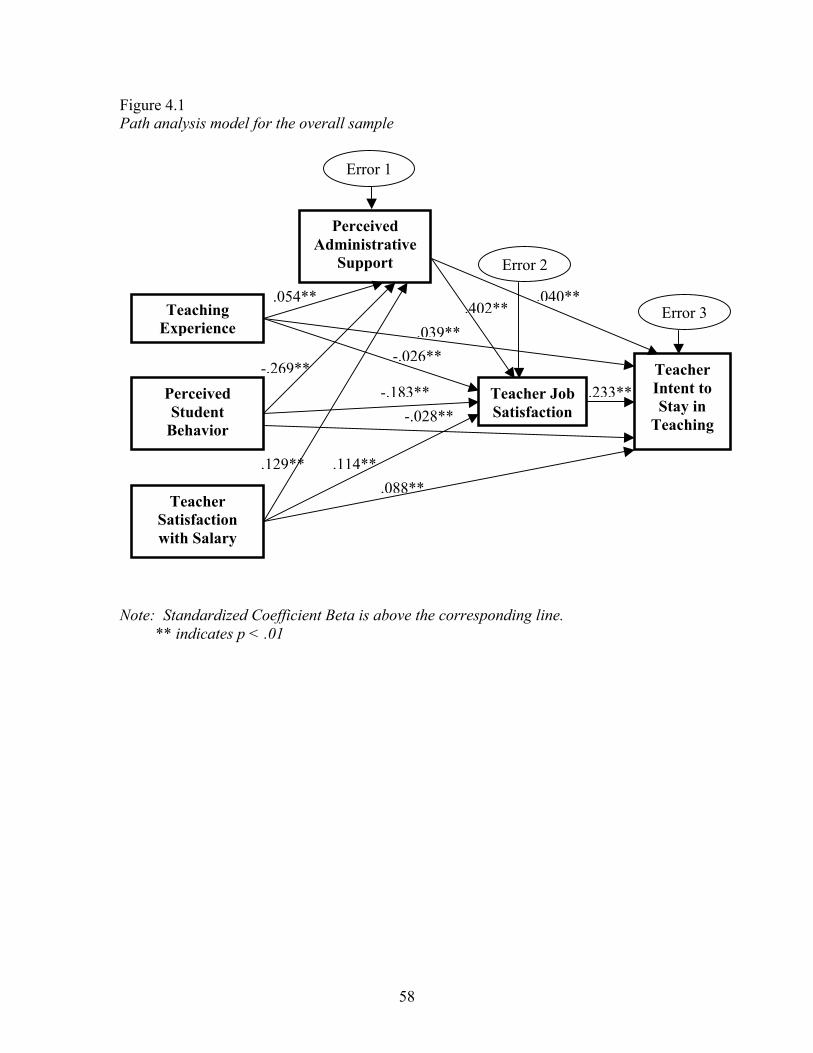
58
Figure 4.1 Path analysis model for the overall sample
Note: Standardized Coefficient Beta is above the corresponding line.
** indicates p < .01
Teaching Experience
Perceived Student
Behavior
Perceived Administrative
Support
Teacher Intent to Stay in
Teaching
Teacher Job Satisfaction
Teacher Satisfaction with Salary
Error 2
Error 3 .054**
-.269**
.129**
.402**
-.026**
-.183**
.114**
.040**
.039**
-.028**
.088**
..233***
Error 1
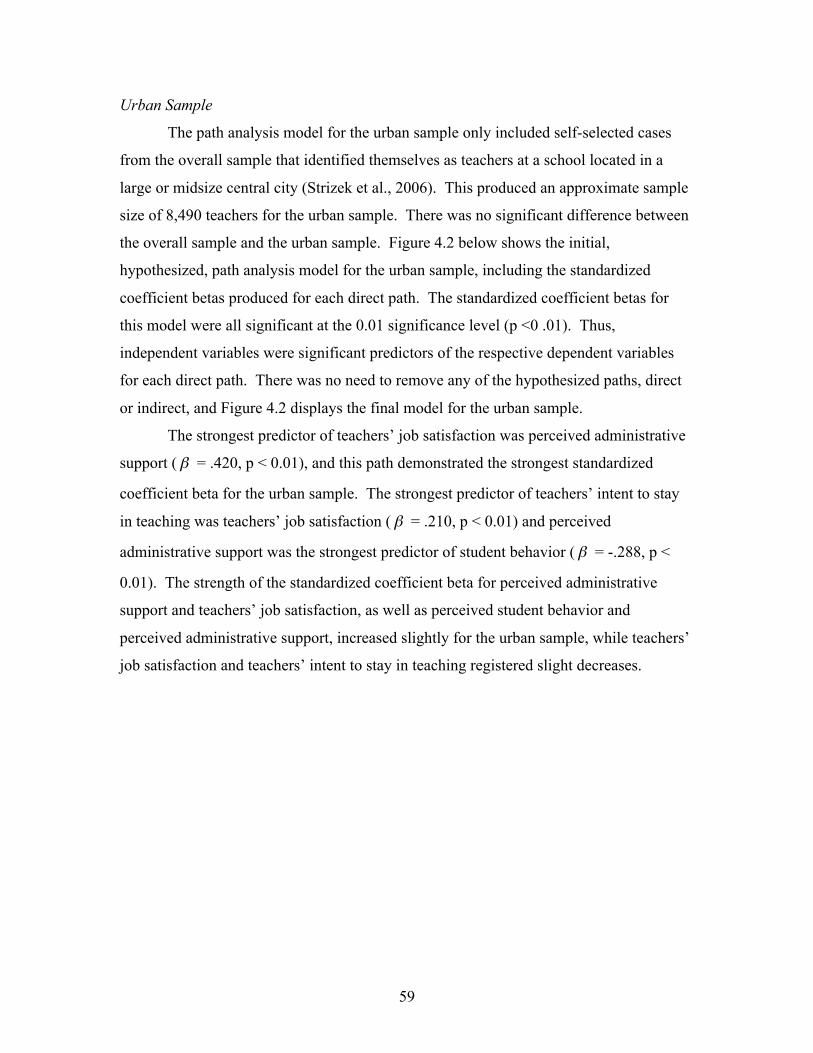
59
Urban Sample
The path analysis model for the urban sample only included self-selected cases
from the overall sample that identified themselves as teachers at a school located in a
large or midsize central city (Strizek et al., 2006). This produced an approximate sample
size of 8,490 teachers for the urban sample. There was no significant difference between
the overall sample and the urban sample. Figure 4.2 below shows the initial,
hypothesized, path analysis model for the urban sample, including the standardized
coefficient betas produced for each direct path. The standardized coefficient betas for
this model were all significant at the 0.01 significance level (p <0 .01). Thus,
independent variables were significant predictors of the respective dependent variables
for each direct path. There was no need to remove any of the hypothesized paths, direct
or indirect, and Figure 4.2 displays the final model for the urban sample.
The strongest predictor of teachers’ job satisfaction was perceived administrative
support ( = .420, p < 0.01), and this path demonstrated the strongest standardized
coefficient beta for the urban sample. The strongest predictor of teachers’ intent to stay
in teaching was teachers’ job satisfaction ( = .210, p < 0.01) and perceived
administrative support was the strongest predictor of student behavior ( = -.288, p <
0.01). The strength of the standardized coefficient beta for perceived administrative
support and teachers’ job satisfaction, as well as perceived student behavior and
perceived administrative support, increased slightly for the urban sample, while teachers’
job satisfaction and teachers’ intent to stay in teaching registered slight decreases.

60
Figure 4.2 Path analysis model for the urban sample
Note: Standardized Coefficient Beta is above the corresponding line.
** indicates p < 0.01
Teaching Experience
Perceived Student
Behavior
Perceived Administrative
Support
Teacher Intent to Stay in
Teaching
Teacher Job Satisfaction
Teacher Satisfaction with Salary
Error 2
Error 3 .043**
-.288**
.146**
.420**
-.025**
-.183**
.106**
.045** .049**
-.041**
.087**
..210***
Error 1
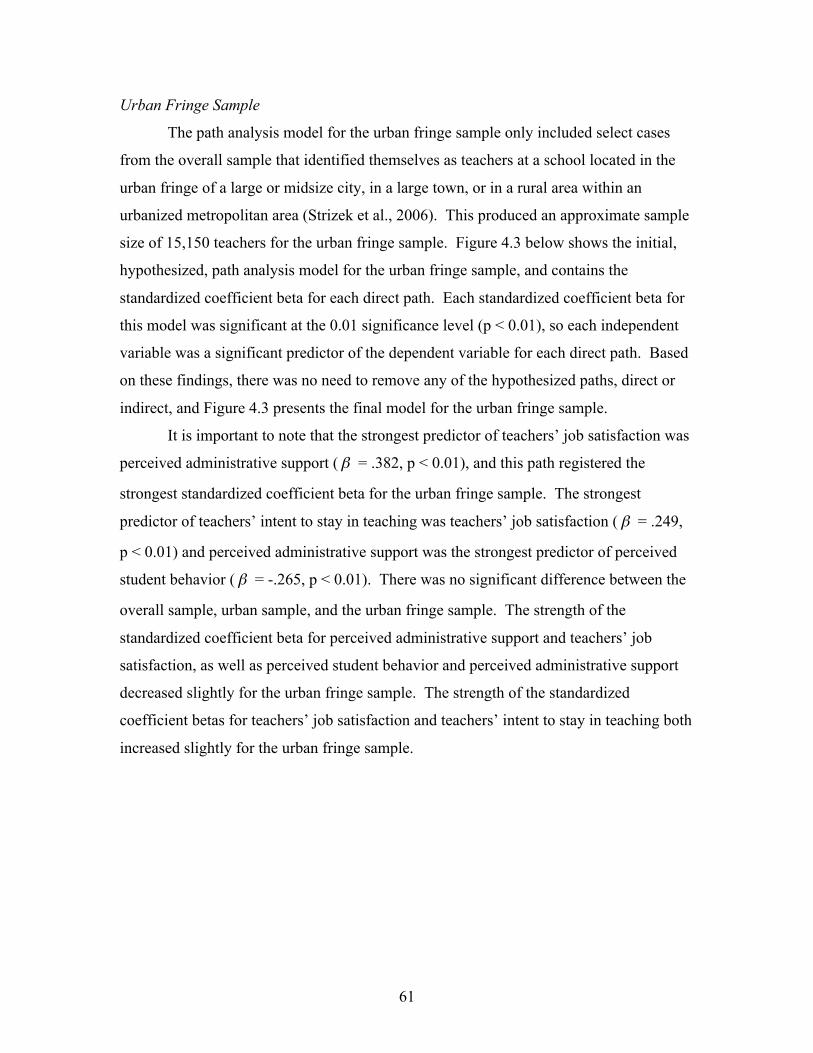
61
Urban Fringe Sample
The path analysis model for the urban fringe sample only included select cases
from the overall sample that identified themselves as teachers at a school located in the
urban fringe of a large or midsize city, in a large town, or in a rural area within an
urbanized metropolitan area (Strizek et al., 2006). This produced an approximate sample
size of 15,150 teachers for the urban fringe sample. Figure 4.3 below shows the initial,
hypothesized, path analysis model for the urban fringe sample, and contains the
standardized coefficient beta for each direct path. Each standardized coefficient beta for
this model was significant at the 0.01 significance level (p < 0.01), so each independent
variable was a significant predictor of the dependent variable for each direct path. Based
on these findings, there was no need to remove any of the hypothesized paths, direct or
indirect, and Figure 4.3 presents the final model for the urban fringe sample.
It is important to note that the strongest predictor of teachers’ job satisfaction was
perceived administrative support ( = .382, p < 0.01), and this path registered the
strongest standardized coefficient beta for the urban fringe sample. The strongest
predictor of teachers’ intent to stay in teaching was teachers’ job satisfaction ( = .249,
p < 0.01) and perceived administrative support was the strongest predictor of perceived
student behavior ( = -.265, p < 0.01). There was no significant difference between the
overall sample, urban sample, and the urban fringe sample. The strength of the
standardized coefficient beta for perceived administrative support and teachers’ job
satisfaction, as well as perceived student behavior and perceived administrative support
decreased slightly for the urban fringe sample. The strength of the standardized
coefficient betas for teachers’ job satisfaction and teachers’ intent to stay in teaching both
increased slightly for the urban fringe sample.
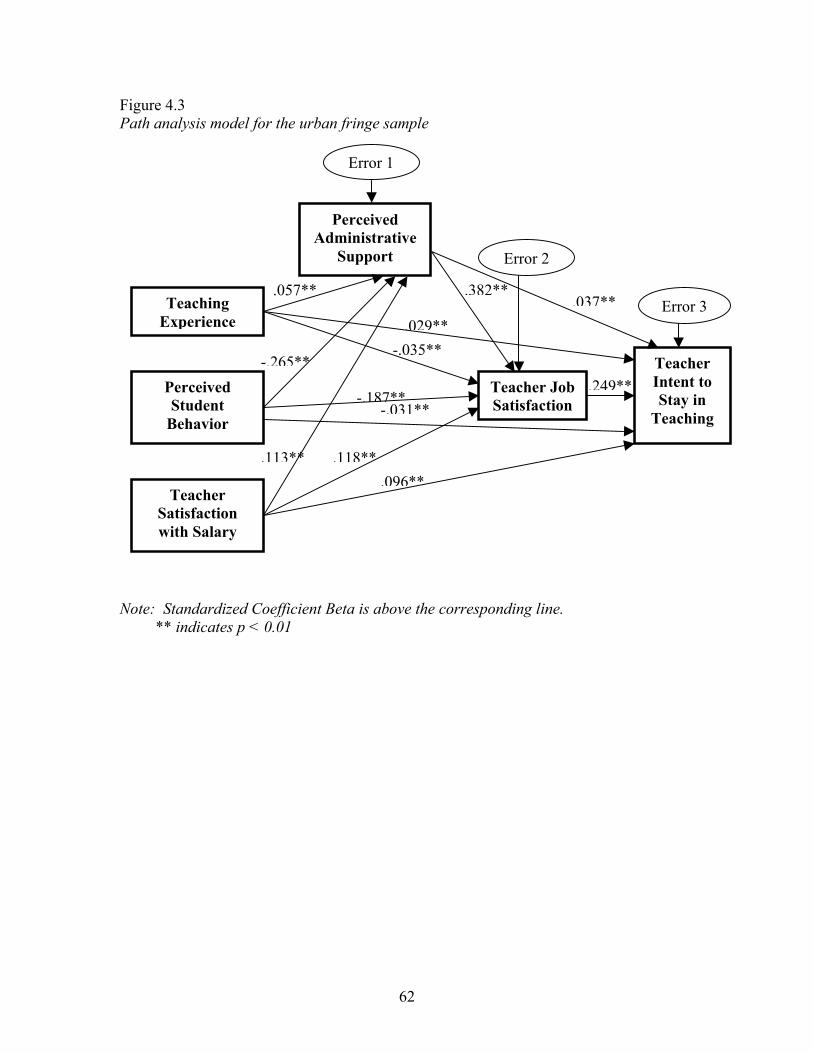
62
Figure 4.3 Path analysis model for the urban fringe sample
Note: Standardized Coefficient Beta is above the corresponding line.
** indicates p < 0.01
Teaching Experience
Perceived Student
Behavior
Perceived Administrative
Support
Teacher Intent to Stay in
Teaching
Teacher Job Satisfaction
Teacher Satisfaction with Salary
Error 2
Error 3 .057**
-.265**
.113**
.382**
-.035**
-.187**
.118**
.037** .029**
-.031**
.096**
..249**
Error 1

63
Rural Sample
Following application of the selection criteria, a sample of regular, full-time
public school teachers, with regular or standard state certification remained. This left an
approximate sample size of 34,810 (N = 34,810). The path analysis model for the rural
sample included self-selected cases from the overall sample that identified themselves as
teachers at a school located in a small town or rural setting, and were located outside an
urbanized metropolitan area (Strizek et al., 2006). An approximate sample size of 11,170
(N=11,170) teachers was formed for the rural sample and Figure 4.4 displays the initial,
hypothesized, path analysis model for the rural sample. The standardized coefficient
betas for the direct paths are shown, including their respective levels of significance (p <
.01). All independent variables were significant predictors of their respective dependent
variables for each direct path. There was no need to remove any of the hypothesized
paths, direct or indirect, and Figure 4.4 displays the final model for the rural sample.
It is important to note that the strongest predictor of teachers’ job satisfaction was
perceived administrative support ( = .432, p < 0.01), and this path registered the
strongest standardized coefficient beta for the rural sample. The strongest predictor of
teachers’ intent to stay in teaching was teachers’ job satisfaction ( = .237, p < 0.01) and
perceived administrative support was the strongest predictor of perceived student
behavior ( = -.243, p < 0.01). There was no significant difference between the overall
sample, urban sample, urban fringe sample, and the rural sample. The strength of the
standardized coefficient betas for perceived administrative support and teachers’ job
satisfaction increased slightly for the rural sample and was the strongest beta of all four
samples ( = .432, p < 0.01). The strength of the standardized coefficient betas for
perceived student behavior and perceived administrative support decreased slightly for
the rural sample. The strongest standardized coefficient beta for perceived student
behavior and teachers’ intent to stay in teaching of all four samples was from the urban
sample ( = -.288, p < 0.01). The strength of the standardized coefficient betas for
teachers’ job satisfaction and teachers’ intent to stay in teaching increased slightly for the
rural sample. The strongest standardized coefficient beta for teachers’ job satisfaction

64
and teachers’ intent to stay in teaching of all four samples was from the urban fringe
sample ( = .249, p < 0.01).
Figure 4.4 Path analysis model for the rural sample
Note: Standardized Coefficient Beta is above the corresponding line.
** indicates p < .01
Teaching Experience
Perceived Student
Behavior
Perceived Administrative
Support
Teacher Intent to Stay in
Teaching
Teacher Job Satisfaction
Teacher Satisfaction with Salary
Error 2
Error 3 .060**
-.243**
.144**
.432**
.003**
-.138**
.108**
.030**
.044**
-.019**
.066**
..237**
Error 1
65
Proportion of Variance Explained as Effect Size
To better understand the influence of the significant predictors determined in the
path, we will examine the proportion of variance explained as effect size. This will also
help us to determine differences that exist according to the environmental setting of the
school. According to Tabachnick and Fidell (2007), effect size is the proportion of
variance in the dependent variable that is associated with levels of an independent
variable. A rough estimate of the effect size is R2. When analyzing multiple correlations,
researchers are very interested in R2 because it is interpreted in terms of the percentage of
accountable variation. Unfortunately, R2 may be biased and the amount of bias depends
on the relative sizes of the sample and population. The adjusted R2 provides a relatively
unbiased estimate.
R2 and Adjusted R2 for the Dependent Variable of Perceived Administrative Support
Table 4.4 below presents the R2 and adjusted R2 when the dependent variable
perceived administrative support is regressed against the independent variables of
teaching experience, perceived student behavior, and teachers’ satisfaction with salary.
The amount of variance in teachers’ perceptions of administrative support is explained by
teaching experience, perceived student behavior, and teachers’ satisfaction with their
salary combined. Table 4.4 presents the comparison of these measures according to the
environmental setting of the school. The R2 was the largest for the urban sample and
provides the amount of variance in teachers’ perceptions of administrative support
explained by teaching experience, perceived student behavior, and teachers’ satisfaction
with salary is greatest among teachers combined in urban schools.
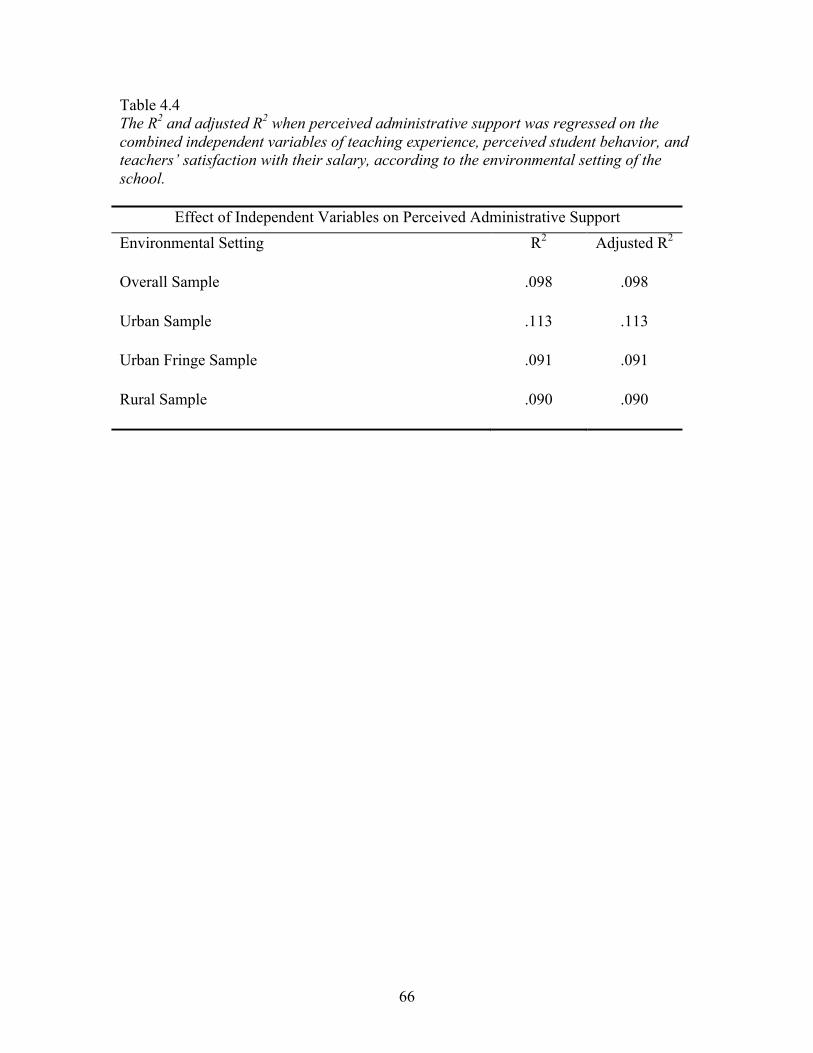
66
Table 4.4 The R2 and adjusted R2 when perceived administrative support was regressed on the combined independent variables of teaching experience, perceived student behavior, and teachers’ satisfaction with their salary, according to the environmental setting of the school.
Effect of Independent Variables on Perceived Administrative Support Environmental Setting R2 Adjusted R2
Overall Sample .098 .098
Urban Sample
.113 .113
Urban Fringe Sample
.091 .091
Rural Sample
.090 .090
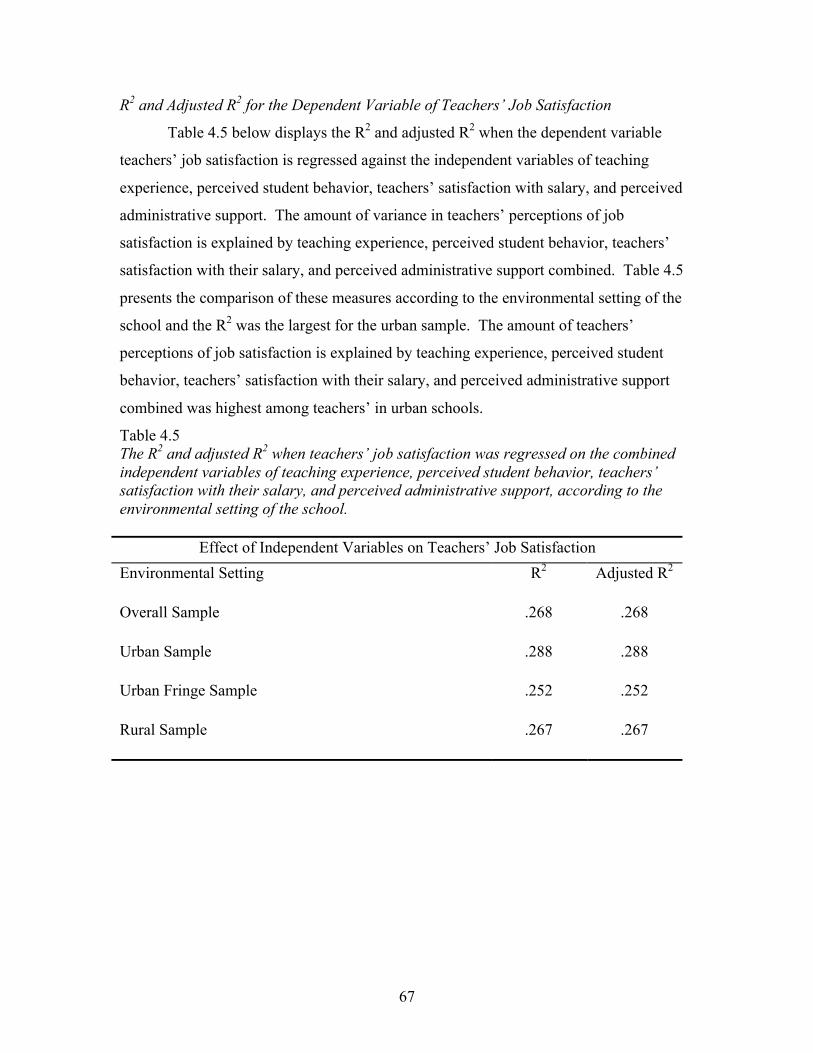
67
R2 and Adjusted R2 for the Dependent Variable of Teachers’ Job Satisfaction
Table 4.5 below displays the R2 and adjusted R2 when the dependent variable
teachers’ job satisfaction is regressed against the independent variables of teaching
experience, perceived student behavior, teachers’ satisfaction with salary, and perceived
administrative support. The amount of variance in teachers’ perceptions of job
satisfaction is explained by teaching experience, perceived student behavior, teachers’
satisfaction with their salary, and perceived administrative support combined. Table 4.5
presents the comparison of these measures according to the environmental setting of the
school and the R2 was the largest for the urban sample. The amount of teachers’
perceptions of job satisfaction is explained by teaching experience, perceived student
behavior, teachers’ satisfaction with their salary, and perceived administrative support
combined was highest among teachers’ in urban schools.
Table 4.5 The R2 and adjusted R2 when teachers’ job satisfaction was regressed on the combined independent variables of teaching experience, perceived student behavior, teachers’ satisfaction with their salary, and perceived administrative support, according to the environmental setting of the school.
Effect of Independent Variables on Teachers’ Job Satisfaction Environmental Setting R2 Adjusted R2
Overall Sample .268
.268
Urban Sample
.288 .288
Urban Fringe Sample
.252 .252
Rural Sample
.267 .267
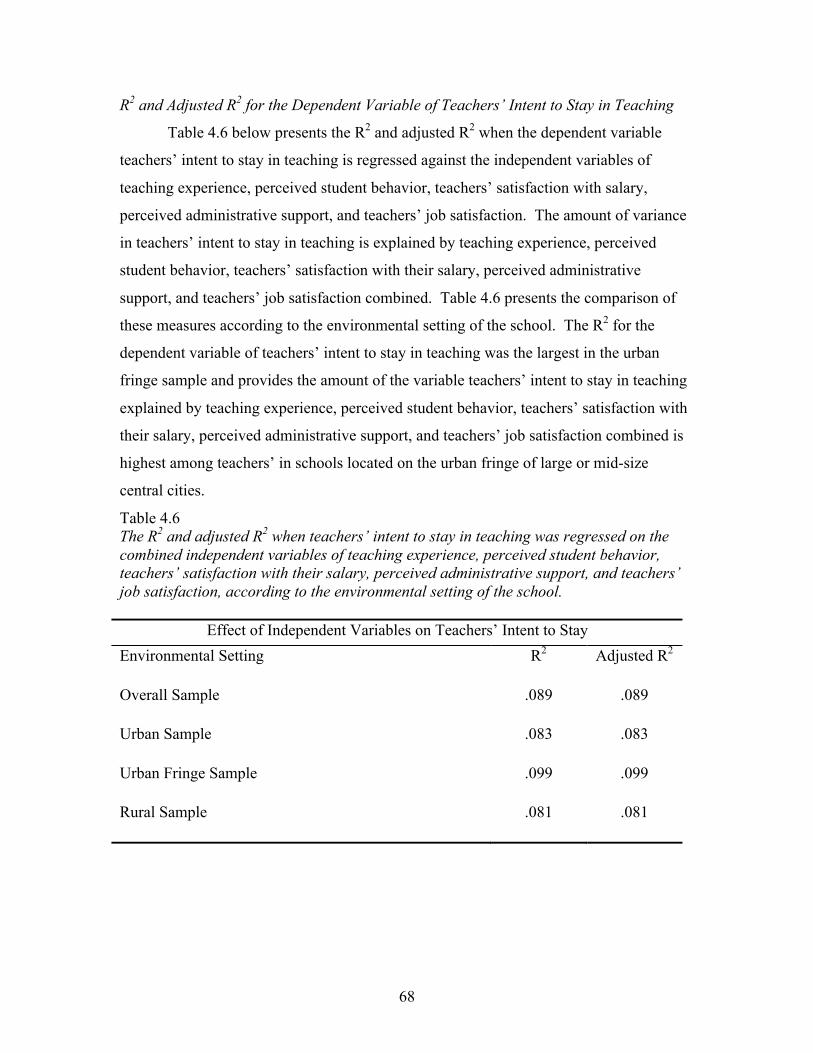
68
R2 and Adjusted R2 for the Dependent Variable of Teachers’ Intent to Stay in Teaching
Table 4.6 below presents the R2 and adjusted R2 when the dependent variable
teachers’ intent to stay in teaching is regressed against the independent variables of
teaching experience, perceived student behavior, teachers’ satisfaction with salary,
perceived administrative support, and teachers’ job satisfaction. The amount of variance
in teachers’ intent to stay in teaching is explained by teaching experience, perceived
student behavior, teachers’ satisfaction with their salary, perceived administrative
support, and teachers’ job satisfaction combined. Table 4.6 presents the comparison of
these measures according to the environmental setting of the school. The R2 for the
dependent variable of teachers’ intent to stay in teaching was the largest in the urban
fringe sample and provides the amount of the variable teachers’ intent to stay in teaching
explained by teaching experience, perceived student behavior, teachers’ satisfaction with
their salary, perceived administrative support, and teachers’ job satisfaction combined is
highest among teachers’ in schools located on the urban fringe of large or mid-size
central cities.
Table 4.6 The R2 and adjusted R2 when teachers’ intent to stay in teaching was regressed on the combined independent variables of teaching experience, perceived student behavior, teachers’ satisfaction with their salary, perceived administrative support, and teachers’ job satisfaction, according to the environmental setting of the school.
Effect of Independent Variables on Teachers’ Intent to Stay Environmental Setting R2 Adjusted R2
Overall Sample .089
.089
Urban Sample
.083 .083
Urban Fringe Sample
.099 .099
Rural Sample
.081 .081
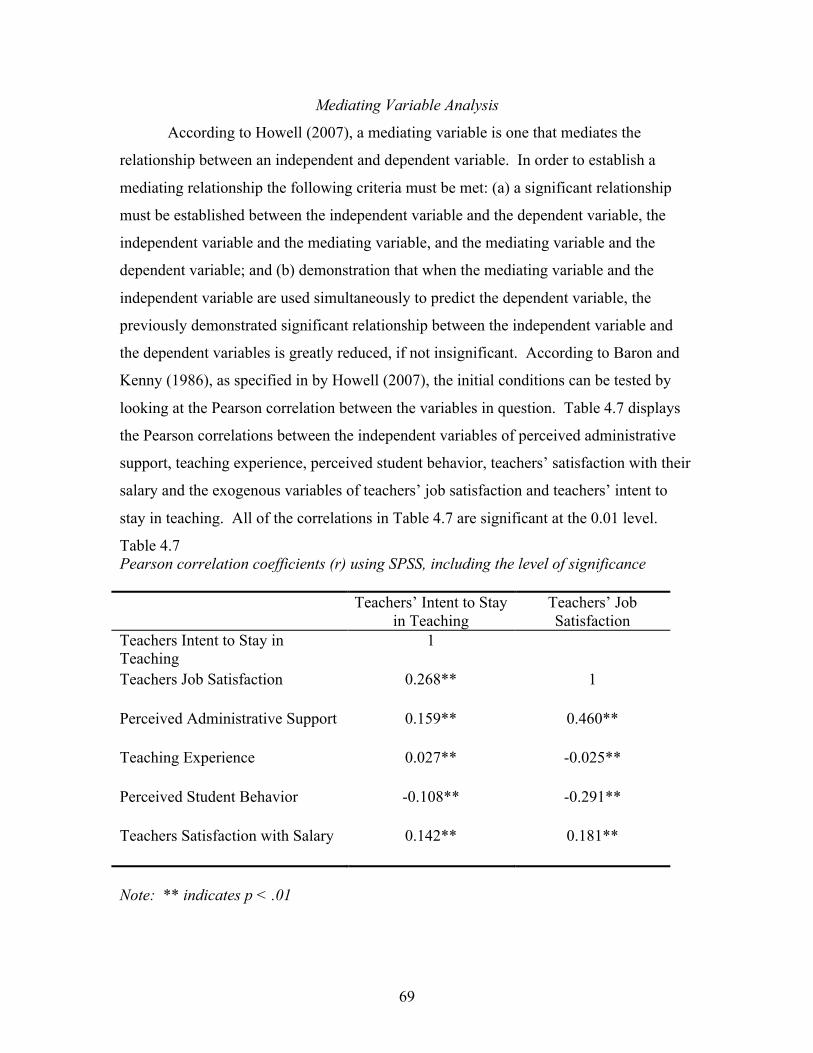
69
Mediating Variable Analysis
According to Howell (2007), a mediating variable is one that mediates the
relationship between an independent and dependent variable. In order to establish a
mediating relationship the following criteria must be met: (a) a significant relationship
must be established between the independent variable and the dependent variable, the
independent variable and the mediating variable, and the mediating variable and the
dependent variable; and (b) demonstration that when the mediating variable and the
independent variable are used simultaneously to predict the dependent variable, the
previously demonstrated significant relationship between the independent variable and
the dependent variables is greatly reduced, if not insignificant. According to Baron and
Kenny (1986), as specified in by Howell (2007), the initial conditions can be tested by
looking at the Pearson correlation between the variables in question. Table 4.7 displays
the Pearson correlations between the independent variables of perceived administrative
support, teaching experience, perceived student behavior, teachers’ satisfaction with their
salary and the exogenous variables of teachers’ job satisfaction and teachers’ intent to
stay in teaching. All of the correlations in Table 4.7 are significant at the 0.01 level.
Table 4.7 Pearson correlation coefficients (r) using SPSS, including the level of significance Teachers’ Intent to Stay
in Teaching Teachers’ Job Satisfaction
Teachers Intent to Stay in Teaching
1
Teachers Job Satisfaction 0.268**
1
Perceived Administrative Support 0.159**
0.460**
Teaching Experience 0.027**
-0.025**
Perceived Student Behavior -0.108**
-0.291**
Teachers Satisfaction with Salary 0.142**
0.181**
Note: ** indicates p < .01
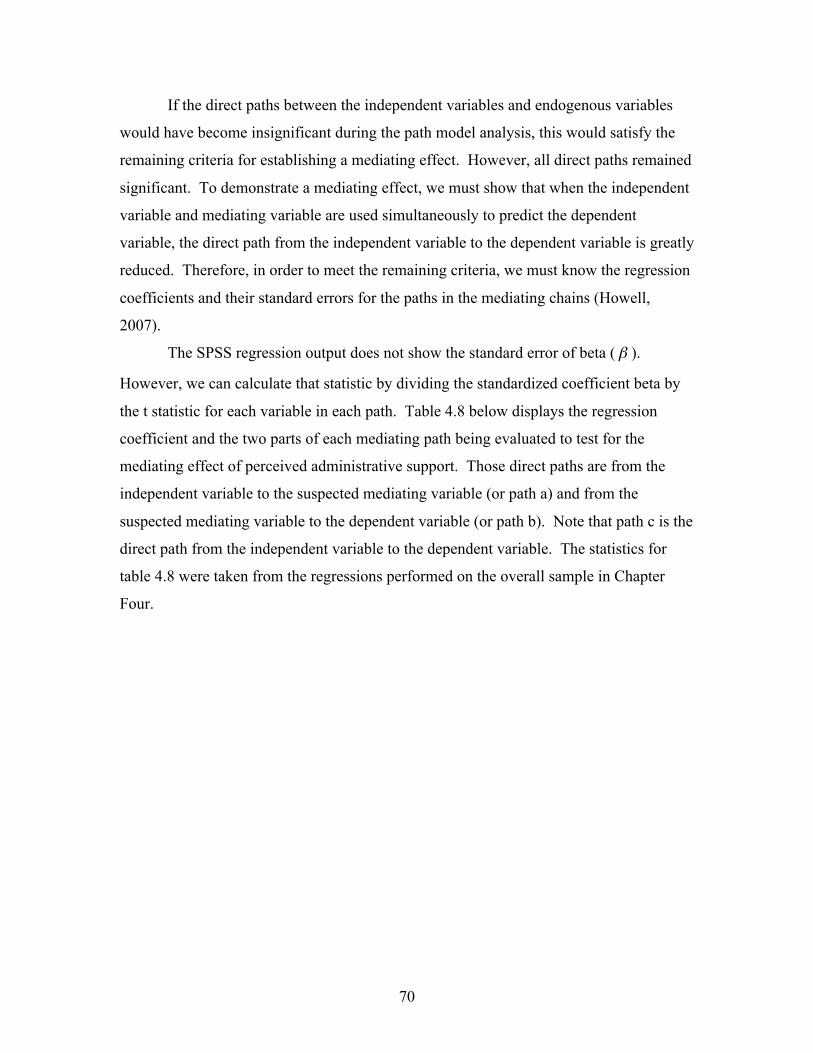
70
If the direct paths between the independent variables and endogenous variables
would have become insignificant during the path model analysis, this would satisfy the
remaining criteria for establishing a mediating effect. However, all direct paths remained
significant. To demonstrate a mediating effect, we must show that when the independent
variable and mediating variable are used simultaneously to predict the dependent
variable, the direct path from the independent variable to the dependent variable is greatly
reduced. Therefore, in order to meet the remaining criteria, we must know the regression
coefficients and their standard errors for the paths in the mediating chains (Howell,
2007).
The SPSS regression output does not show the standard error of beta ( ).
However, we can calculate that statistic by dividing the standardized coefficient beta by
the t statistic for each variable in each path. Table 4.8 below displays the regression
coefficient and the two parts of each mediating path being evaluated to test for the
mediating effect of perceived administrative support. Those direct paths are from the
independent variable to the suspected mediating variable (or path a) and from the
suspected mediating variable to the dependent variable (or path b). Note that path c is the
direct path from the independent variable to the dependent variable. The statistics for
table 4.8 were taken from the regressions performed on the overall sample in Chapter
Four.

71
Table 4.8 Regression coefficients and standard errors for the two parts of the mediating path of each mediating path being evaluated to test for the mediating effect of perceived administrative support
Path Beta ( ) Standard Error of Beta (s)
t Statistic (t)
Perceived Administrative Support to Teachers’ Job Satisfaction
.402 0.0006 672.467
Perceived Administrative Support to Teachers’ Intent to Stay in Teaching
.040 0.0007 54.883
Teaching Experience to Perceived Administrative Support
.054 0.0006 85.617
Perceived Student Behavior to Perceived Administrative Support
-.269 0.0006 -423.306
Teachers’ Satisfaction with their Salary to Perceived Administrative Support
.129 0.0006 203.494
Next, we must calculate the path coefficient and the standard error of the
combined path for each path. The path coefficient is simply calculated by the betas of the
paths being analyzed. The standard error of the combined path is calculated
as . Table 4.9 below displays the path coefficient and standard
error for the combined path being analyzed.
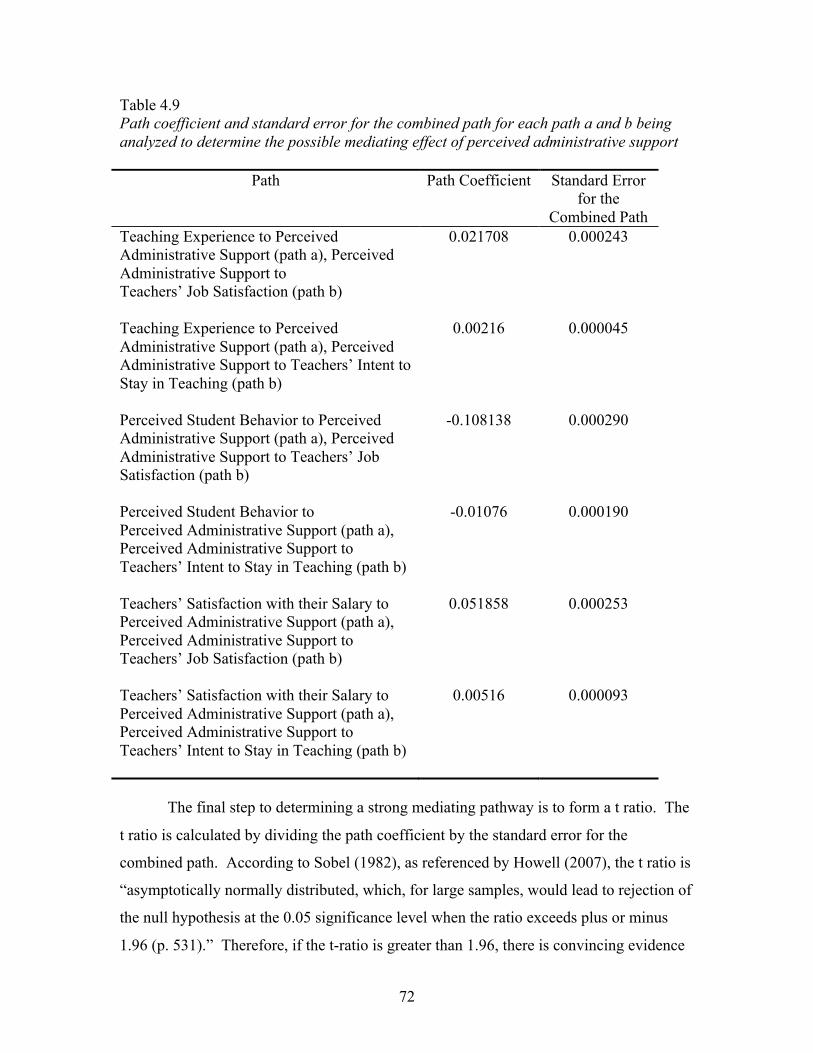
72
Table 4.9 Path coefficient and standard error for the combined path for each path a and b being analyzed to determine the possible mediating effect of perceived administrative support
Path Path Coefficient Standard Error for the
Combined Path Teaching Experience to Perceived Administrative Support (path a), Perceived Administrative Support to Teachers’ Job Satisfaction (path b)
0.021708 0.000243
Teaching Experience to Perceived Administrative Support (path a), Perceived Administrative Support to Teachers’ Intent to Stay in Teaching (path b)
0.00216 0.000045
Perceived Student Behavior to Perceived Administrative Support (path a), Perceived Administrative Support to Teachers’ Job Satisfaction (path b)
-0.108138 0.000290
Perceived Student Behavior to Perceived Administrative Support (path a), Perceived Administrative Support to Teachers’ Intent to Stay in Teaching (path b)
-0.01076 0.000190
Teachers’ Satisfaction with their Salary to Perceived Administrative Support (path a), Perceived Administrative Support to Teachers’ Job Satisfaction (path b)
0.051858 0.000253
Teachers’ Satisfaction with their Salary to Perceived Administrative Support (path a), Perceived Administrative Support to Teachers’ Intent to Stay in Teaching (path b)
0.00516 0.000093
The final step to determining a strong mediating pathway is to form a t ratio. The
t ratio is calculated by dividing the path coefficient by the standard error for the
combined path. According to Sobel (1982), as referenced by Howell (2007), the t ratio is
“asymptotically normally distributed, which, for large samples, would lead to rejection of
the null hypothesis at the 0.05 significance level when the ratio exceeds plus or minus
1.96 (p. 531).” Therefore, if the t-ratio is greater than 1.96, there is convincing evidence
73
of a strong mediating pathway (Howell, 2007). Table 4.10 below presents the t ratio and
mediating status based on the determining criteria for each suspected mediating path.
Table 4.10 The t ratio and mediating status based on the determining criteria for each suspected mediating path.
Path T Ratio Mediating Status
Teaching Experience to Perceived Administrative Support (path a), Perceived Administrative Support to Teachers’ Job Satisfaction (path b)
89.333 Perceived administrative support mediates the effect of teaching experience relative to teachers’ job satisfaction.
Teaching Experience to Perceived Administrative Support (path a), Perceived Administrative Support to Teachers’ Intent to Stay in Teaching (path b)
48.000 Perceived administrative support mediates the effect of teaching experience on teachers’ intent to stay in teaching.
Perceived Student Behavior to Perceived Administrative Support (path a), Perceived Administrative Support to Teachers’ Job Satisfaction (path b)
372.890 Perceived administrative support mediates the effect of perceived student behavior relative to teachers’ job satisfaction.
Perceived Student Behavior to Perceived Administrative Support (path a), Perceived Administrative Support to Teachers’ Intent to Stay in Teaching (path b)
53.630 Perceived administrative support mediates the effect of perceived student behavior relative to teachers’ intent to stay in teaching.
Teachers’ Satisfaction with their Salary to Perceived Administrative Support (path a), Perceived Administrative Support to Teachers’ Job Satisfaction (path b)
204.970 Perceived administrative support mediates the effect of teaching satisfaction with their salary relative to teachers’ job satisfaction.
Teachers’ Satisfaction with their Salary to Perceived Administrative Support (path a), Perceived Administrative Support to Teachers’ Intent to Stay in Teaching (path b)
55.480 Perceived administrative support mediates the effect of teaching satisfaction with their salary relative to teachers’ intent to stay in teaching.
74
There is substantial evidence for determining a strong mediating pathway for all
six paths. In other words, perceived administrative support strongly mediates the effects
of teaching experience, perceived student behavior, and teachers’ satisfaction with their
salary relative to teachers’ job satisfaction and their intent to stay in teaching.
Chapter Four has provided a detailed statistical analysis of the present study. In
Chapter Five, the researcher will discuss the findings presented by this analysis, based on
the review of the literature presented in Chapter Two.

75
Chapter Five:
Discussion
According to Liu and Meyer (2005), the teacher attrition rate in education, or
percentage of teachers’ leaving the profession, is disproportionately higher than it is in
other professions. This has made it increasingly difficult for public schools to meet the
“highly qualified” requirement of No Child Left Behind (Spradlin & Prendergast, 2006).
Additionally, it has negatively affected the quality of education in the classroom.
Research has clearly demonstrated a relationship between teachers’ job satisfaction and
teacher attrition (Colbert & Wolff, 1992; Liu & Meyer, 2005; Pearson & Moomaw, 2005;
Perie et al., 1997; Shann, 1998; Woods & Weasmer, 2004).
While earlier research on the causes of teacher attrition and job satisfaction
focused on teacher characteristics, more recent studies have focused on other sources
(Ingersoll & Smith 2003; Liu & Meyer, 2005; Marvel et al., 2007). Liu (2007) identified
the necessity to study the interaction among these strands of research relative to teacher
attrition and job satisfaction. This study examined the interactions among six variables
that, as demonstrated by previous research, are related to one another. Those six
variables are teachers’ intent to stay in teaching, teachers’ job satisfaction, perceived
administrative support, teaching experience, perceived student behavior, and teachers’
satisfaction with their salary. These variables were examined within the context of the
environmental setting of each teacher’s (respondent’s) school, demonstrated by the four
different path analysis models in Chapter Four.
Other than absence of a relationship between teachers’ satisfaction with their
salary and teaching experience, this study supports previous research that demonstrates
relationships between teachers’ intent to stay in teaching, teachers’ job satisfaction,
perceived administrative support, teaching experience, perceived student behavior, and
teachers’ satisfaction with their salary. Presented in Table 4.3 are the correlations among
these six variables which are significant at the 0.01 level (p < 0.01), with the exception of
the relationship between teachers’ satisfaction with their salary and teaching experience
(r = 0.009). According to Kelly (2004) teachers with higher salaries and more experience
are less likely to leave teaching. In contrast, in this study the Pearson correlation between
76
teachers’ satisfaction with their salary and teaching experience (r = 0.009) did not yield a
significant relationship.
The path analysis models in Chapter Four (Figures 4.1, 4.2, 4.3, and 4.4)
presented the results of an examination of the direct and indirect effects of the
relationships specified between the variables and verified: (a) teaching experience has a
direct effect on teachers’ job satisfaction and teachers’ intent to stay in teaching; (b)
teaching experience has an indirect effect on teachers’ job satisfaction and teachers’
intent to stay in teaching through perceived administrative support; (c) perceived student
behavior has a direct effect on teachers’ job satisfaction and teachers’ intent to stay in
teaching; (d) perceived student behavior has an indirect effect on teachers’ job
satisfaction and teachers’ intent to stay in teaching through perceived administrative
support; (e) teachers’ satisfaction with their salary has a direct effect on teachers’ job
satisfaction and teachers’ intent to stay in teaching; (f) teachers’ satisfaction with their
salary has an indirect effect on teachers’ job satisfaction and teachers’ intent to stay in
teaching through perceived administrative support; (g) perceived administrative support
has a direct effect on teachers’ job satisfaction and teachers’ intent to stay in teaching;
and (h) teachers’ job satisfaction has a direct effect on teachers’ intent to stay in teaching.
Moreover, these effects were confirmed on all four samples, indicating that there was no
change in the results based on the environmental setting of the school. Thus, all four
models presented were confirmed and no changes in the initial path analysis model were
necessary for any environmental setting identified.
Based on the relationships stated above, it was first hypothesized that teaching
experience, perceived student behavior, and teachers’ satisfaction with their salary are
significant predictors of perceived administrative support. The findings of the present
study support this hypothesis. Second, it was hypothesized that perceived administrative
support, teaching experience, perceived student behavior, and teachers’ satisfaction with
their salary are significant predictors of teachers’ job satisfaction and intent to stay in
teaching. Again, the findings of this study support that hypothesis. Third, it was
hypothesized that perceived administrative support mediates the effects of teaching
experience, perceived student behavior, and teachers’ satisfaction with their salary
relative to teachers’ job satisfaction and intent to stay in teaching. This hypothesis was
77
also supported by the findings of this study. Fourth and last, it was hypothesized that
teachers’ job satisfaction is a significant predictor of teachers’ intent to stay in teaching.
The findings of the present study confirmed this hypothesis. The next section contains
some comments, considerations, and discussion specific to the individual variables used
in this study and is based partially on the literature presented in Chapter Two.
Teaching Experience
Research consistently reveals that teacher attrition is higher among novice
teachers (Ingersoll & Smith, 2003; Liu, 2007; Luekens, 2004) and has demonstrated that
former novice teachers often identify job dissatisfaction as one of their main reasons for
leaving the profession (Ingersoll & Smith, 2003). Specifically, Ingersoll and Smith
(2003) recognized that former novice teachers have often identified dissatisfaction with
administrative support as their main reason for leaving. In a somewhat contradictory
study, Perie et al. (1997) found that teachers with less experience reported higher levels
of job satisfaction than more experienced teachers.
As displayed in Figure 4.1 for the overall sample, teaching experience was a
significant predictor of teachers’ intent to stay in teaching, teachers’ job satisfaction, and
perceived administrative support. Findings were nearly identical for the urban sample,
urban fringe sample, and rural sample as well and indicated that the less experienced
teachers are they are more likely to favorably perceive administrative support and have
an increased intent to stay in teaching, but their job satisfaction decreased (due to
negative beta). These findings are somewhat contradictory with the prior research
reported. Table 5.1 presents the standardized coefficient betas for the variable teaching
experience relative to perceived administrative support, teachers’ job satisfaction, and
teachers’ intent to stay in teaching, according to the environmental setting of the school.
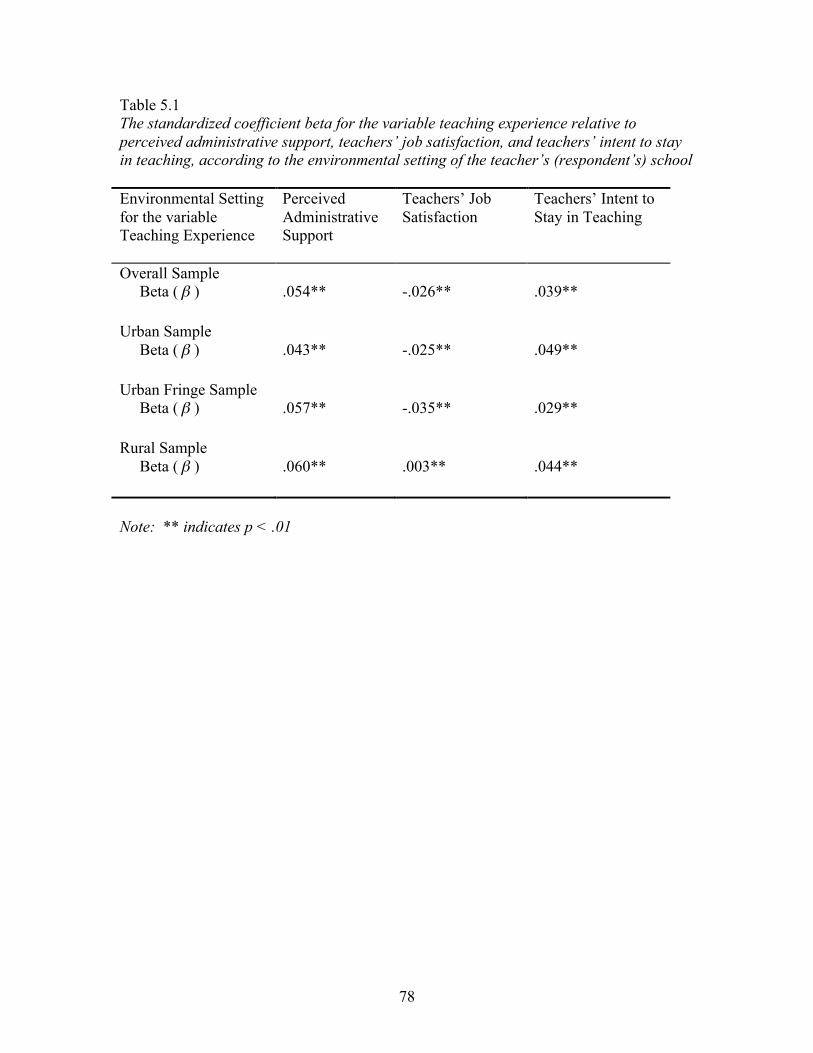
78
Table 5.1 The standardized coefficient beta for the variable teaching experience relative to perceived administrative support, teachers’ job satisfaction, and teachers’ intent to stay in teaching, according to the environmental setting of the teacher’s (respondent’s) school Environmental Setting for the variable Teaching Experience
Perceived Administrative Support
Teachers’ Job Satisfaction
Teachers’ Intent to Stay in Teaching
Overall Sample Beta ( )
.054**
-.026**
.039**
Urban Sample Beta ( )
.043**
-.025**
.049**
Urban Fringe Sample Beta ( )
.057**
-.035**
.029**
Rural Sample Beta ( )
.060**
.003**
.044**
Note: ** indicates p < .01
79
Perceived Student Behavior
Student behavior has been identified in previous studies as a significant predictor
of teacher attrition (Harrell & Jackson, 2004; Ingersoll & Smith, 2003; Kelly, 2004).
Studies also show that student misbehavior negatively affects teachers’ job satisfaction
(Ingersoll & Smith, 2003; Liu & Meyer, 2005; Perie et al., 1997; Shann, 1998). Since
administrative support has been shown to positively affect teachers’ job satisfaction, it
was hypothesized that student misbehavior would also negatively predict perceived
administrative support.
The findings of this study support the previous research studies regarding student
behavior. This study found that perceived student behavior was indeed a significant
predictor of perceived administrative support, teachers’ job satisfaction, and teachers’
intent to stay in teaching and the findings were nearly identical for the urban sample,
urban fringe sample, and rural sample. The standardized coefficient betas for all three
variables are negative. As the teachers’ perception that student behavior, or misbehavior,
increasingly interferes with teaching increases, the variable in question decreases. The
standardized beta coefficients for the variable of perceived student behavior relative to
perceived administrative support, teachers’ job satisfaction, and teachers’ intent to stay in
teaching, according to the environmental setting of the school are presented in Table 5.2.
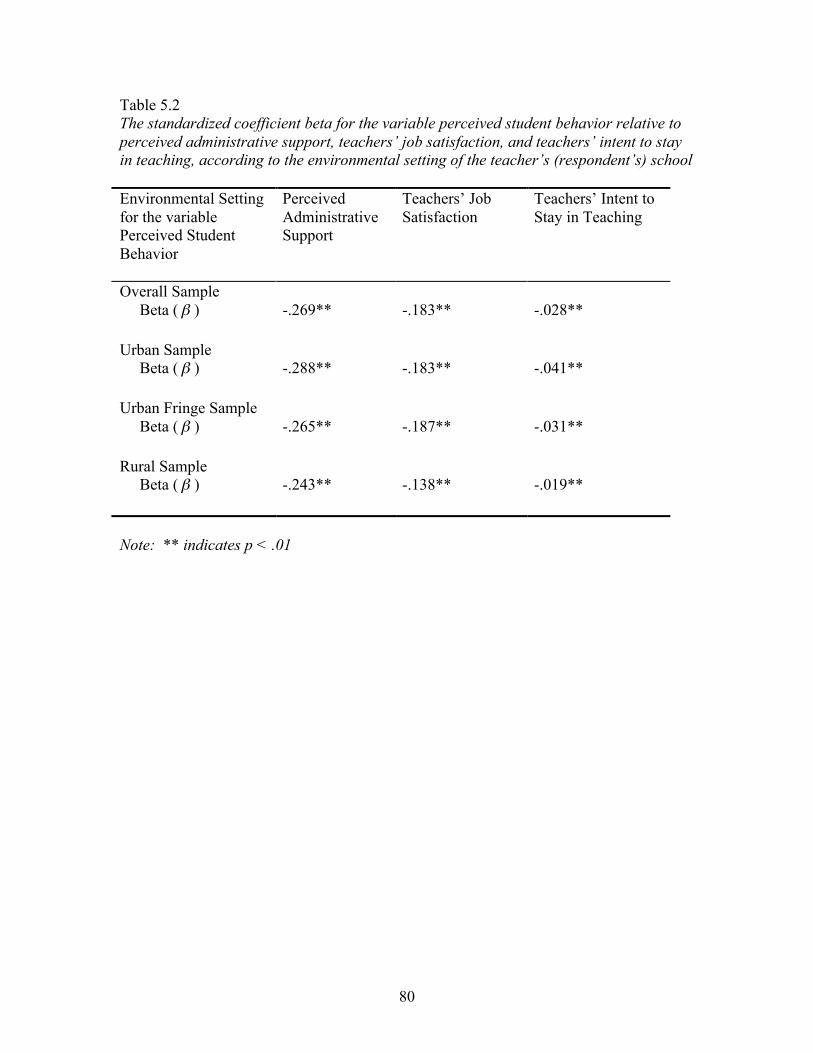
80
Table 5.2 The standardized coefficient beta for the variable perceived student behavior relative to perceived administrative support, teachers’ job satisfaction, and teachers’ intent to stay in teaching, according to the environmental setting of the teacher’s (respondent’s) school Environmental Setting for the variable Perceived Student Behavior
Perceived Administrative Support
Teachers’ Job Satisfaction
Teachers’ Intent to Stay in Teaching
Overall Sample Beta ( )
-.269**
-.183**
-.028**
Urban Sample Beta ( )
-.288**
-.183**
-.041**
Urban Fringe Sample Beta ( )
-.265**
-.187**
-.031**
Rural Sample Beta ( )
-.243**
-.138**
-.019**
Note: ** indicates p < .01
81
Teachers’ Satisfaction with their Salary
Research has demonstrated consistently that teacher compensation influences both
teacher attrition and job satisfaction. Teacher salaries have been identified as the most
influential variable affecting teachers’ decisions to leave the profession (Harrell &
Jackson, 2004; Ingersoll & Smith, 2003; Kelly, 2004; Loeb et al., 2005). Liu (2007)
found that low teaching salary was the main predictor of teacher attrition. Considerable
research has reported that teachers’ job satisfaction was related positively to teachers’
salary (Ingersoll & Smith, 2003; Liu & Meyer, 2005; Perie et al., 1997; Shann, 1998).
However, few studies have examined teachers’ salary relative to administrative support.
Although, Darling-Hammond (2003) suggested that salary, together with working
conditions, including administrative support, are stronger predictors of teacher attrition
than student demographics.
This study agreed and found that teachers’ satisfaction with their salary was a
significant predictor of perceived administrative support, teachers’ job satisfaction, and
teachers’ intent to stay in teaching. As teachers’ satisfaction with their salary increased,
their perceptions of administrative support, job satisfaction, and intent to stay in teaching
also increased. This is an important finding and could influence teacher compensation in
terms of attrition and job satisfaction. Table 5.3 below displays the standardized
coefficient betas for the variable teachers’ satisfaction with their salary relative to
perceived administrative support, teachers’ job satisfaction, and teachers’ intent to stay in
teaching, according to the environmental setting of the school.
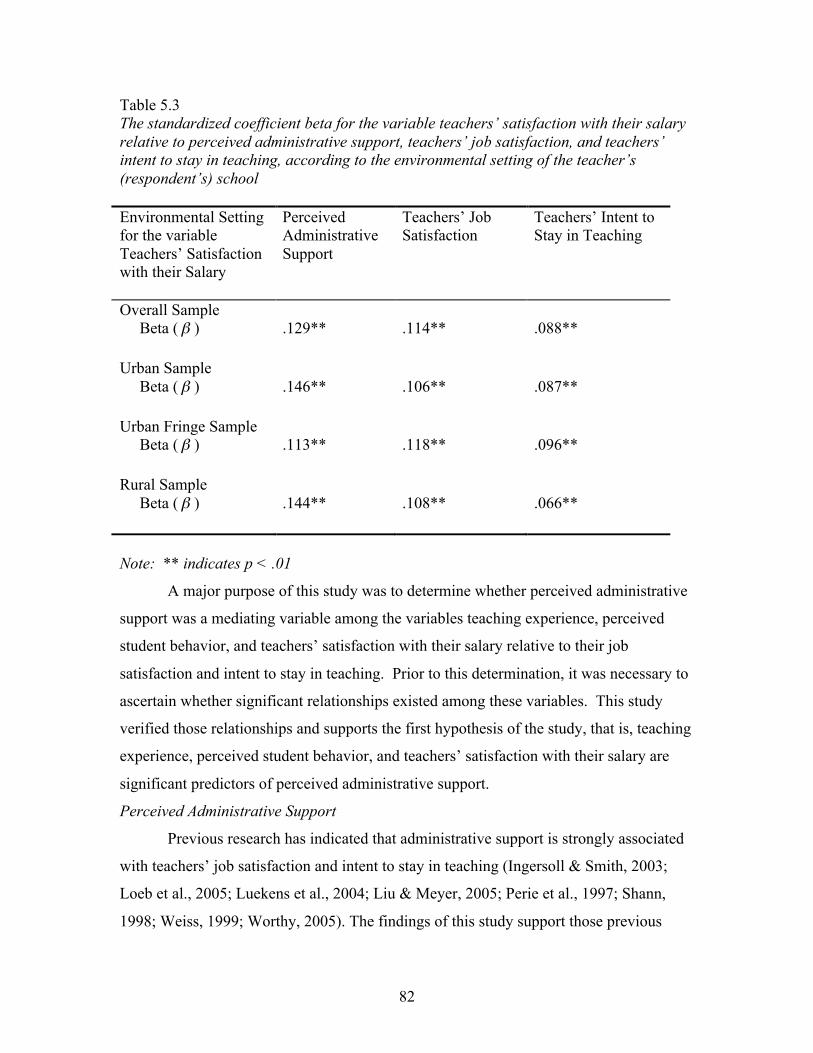
82
Table 5.3 The standardized coefficient beta for the variable teachers’ satisfaction with their salary relative to perceived administrative support, teachers’ job satisfaction, and teachers’ intent to stay in teaching, according to the environmental setting of the teacher’s (respondent’s) school Environmental Setting for the variable Teachers’ Satisfaction with their Salary
Perceived Administrative Support
Teachers’ Job Satisfaction
Teachers’ Intent to Stay in Teaching
Overall Sample Beta ( )
.129**
.114**
.088**
Urban Sample Beta ( )
.146**
.106**
.087**
Urban Fringe Sample Beta ( )
.113**
.118**
.096**
Rural Sample Beta ( )
.144**
.108**
.066**
Note: ** indicates p < .01
A major purpose of this study was to determine whether perceived administrative
support was a mediating variable among the variables teaching experience, perceived
student behavior, and teachers’ satisfaction with their salary relative to their job
satisfaction and intent to stay in teaching. Prior to this determination, it was necessary to
ascertain whether significant relationships existed among these variables. This study
verified those relationships and supports the first hypothesis of the study, that is, teaching
experience, perceived student behavior, and teachers’ satisfaction with their salary are
significant predictors of perceived administrative support.
Perceived Administrative Support
Previous research has indicated that administrative support is strongly associated
with teachers’ job satisfaction and intent to stay in teaching (Ingersoll & Smith, 2003;
Loeb et al., 2005; Luekens et al., 2004; Liu & Meyer, 2005; Perie et al., 1997; Shann,
1998; Weiss, 1999; Worthy, 2005). The findings of this study support those previous
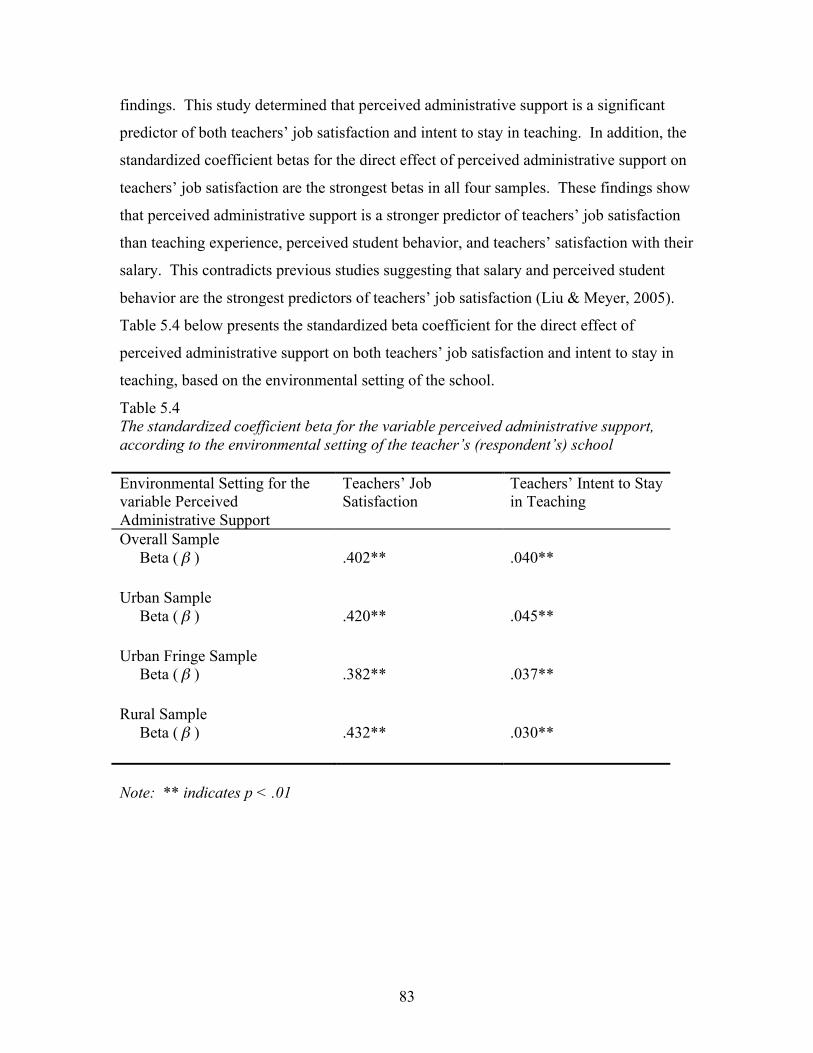
83
findings. This study determined that perceived administrative support is a significant
predictor of both teachers’ job satisfaction and intent to stay in teaching. In addition, the
standardized coefficient betas for the direct effect of perceived administrative support on
teachers’ job satisfaction are the strongest betas in all four samples. These findings show
that perceived administrative support is a stronger predictor of teachers’ job satisfaction
than teaching experience, perceived student behavior, and teachers’ satisfaction with their
salary. This contradicts previous studies suggesting that salary and perceived student
behavior are the strongest predictors of teachers’ job satisfaction (Liu & Meyer, 2005).
Table 5.4 below presents the standardized beta coefficient for the direct effect of
perceived administrative support on both teachers’ job satisfaction and intent to stay in
teaching, based on the environmental setting of the school.
Table 5.4 The standardized coefficient beta for the variable perceived administrative support, according to the environmental setting of the teacher’s (respondent’s) school Environmental Setting for the variable Perceived Administrative Support
Teachers’ Job Satisfaction
Teachers’ Intent to Stay in Teaching
Overall Sample Beta ( )
.402**
.040**
Urban Sample Beta ( )
.420**
.045**
Urban Fringe Sample Beta ( )
.382**
.037**
Rural Sample Beta ( )
.432**
.030**
Note: ** indicates p < .01
84
The Mediating Effect of Perceived Administrative Support
In addition to being a significant predictor of both teachers’ job satisfaction and
intent to stay in teaching, perceived administrative support was proven to be a mediating
variable. Based on the analysis in Chapter Four (Tables 4.7, 4.8, 4.9, and 4.10), this
study determined that perceived administrative support mediates the effect of teaching
experience, perceived student behavior, and teachers’ satisfaction with their salary
relative to teachers’ job satisfaction and intent to stay in teaching.
This finding is of great importance. Previous studies found that student behavior
and teachers salaries were the largest influences on teachers’ attrition (Liu & Meyer,
2005). The present study not only demonstrates that perceived administrative support is a
stronger predictor, but mediates the effects of those two variables relative to teachers’ job
satisfaction and intent to stay in teaching. This finding shines light on the importance and
influence of teachers’ perceptions of administrative support for the purpose of increasing
their job satisfaction and intent to remain in teaching. Because perceived administrative
support mediates the effect of teaching experience, perceived student behavior, and
teachers’ satisfaction with their salary relative to teachers’ job satisfaction and intent to
stay in teaching, this finding could help to decrease the high rate of attrition.
Additionally, these findings make the implementation of and accountability to the ISLLC
standards vital for decreasing teachers’ attrition.
Teachers’ Job Satisfaction
Previous research has identified a link between teachers’ job satisfaction and
teacher attrition (Liu & Meyer, 2005; Shann, 1998, Woods & Weasmer, 2004). This link
is supported by the present study. This study identified teachers’ job satisfaction as the
most significant predictor of teachers’ intent to stay in teaching. Once again there was no
difference according to the environmental setting of the school. Table 5.5 below displays
the standardized coefficient beta, according to the environmental setting of the school.
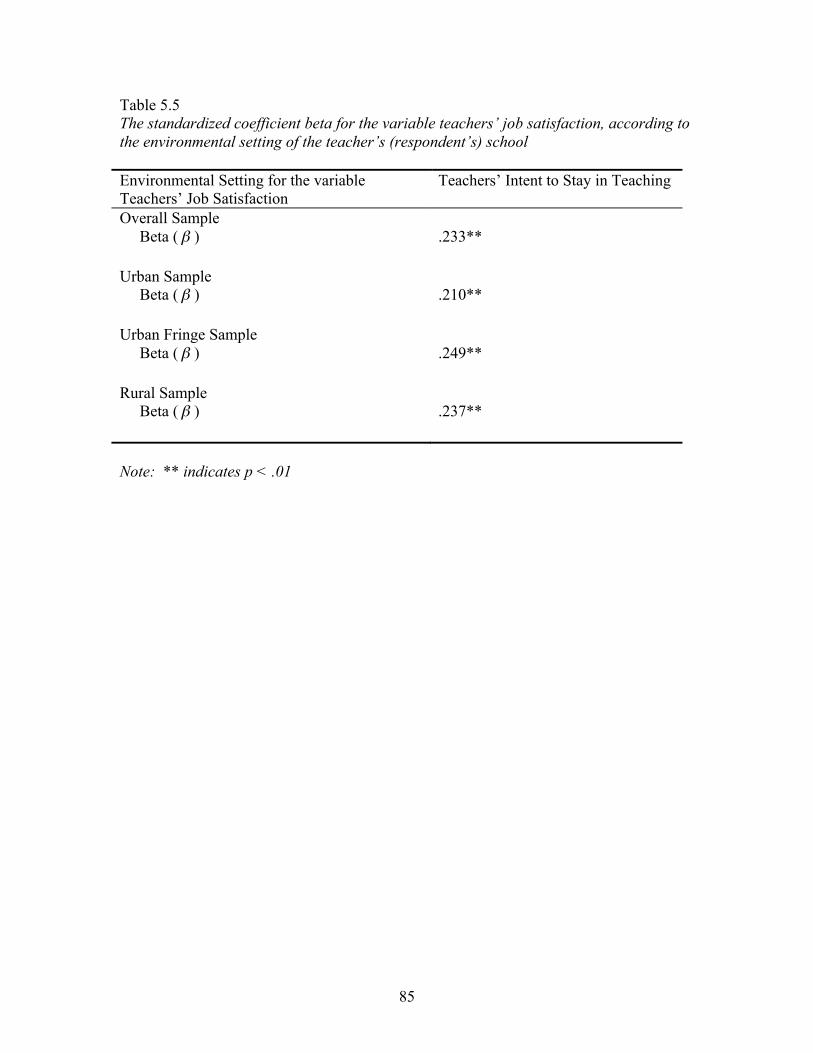
85
Table 5.5 The standardized coefficient beta for the variable teachers’ job satisfaction, according to the environmental setting of the teacher’s (respondent’s) school Environmental Setting for the variable Teachers’ Job Satisfaction
Teachers’ Intent to Stay in Teaching
Overall Sample Beta ( )
.233**
Urban Sample Beta ( )
.210**
Urban Fringe Sample Beta ( )
.249**
Rural Sample Beta ( )
.237**
Note: ** indicates p < .01
86
Environmental Setting of the School
Previous research indicates the highest attrition rates occur in urban schools (Abel
& Sewell, 1999; Adams & Dial, 1993; Ingersoll & Smith, 2003). Perie et al. (1997)
determined that urban school teachers experience lower overall job satisfaction.
Additionally, the lack of administrative support is a major contributor to teacher attrition
and dissatisfaction in urban schools (Abel & Sewell, 1999; Gonzalez & National
Association of State Directors of Special Education, 1995).
The findings of the present study demonstrated that the three variables of teaching
experience, perceived student behavior, and teachers’ satisfaction with their salary were
significant predictors of perceived administrative support, teachers’ job satisfaction, and
teachers’ intent to stay in teaching. Additionally, these findings were true regardless of
the environmental setting of the school.
The information presented in Table 4.4 indicates that when perceived
administrative support was regressed on teaching experience, perceived student behavior,
and teachers’ satisfaction with their salary, the R2 was greatest among teachers in urban
schools. When teachers’ job satisfaction was regressed on teaching experience,
perceived student behavior, teachers’ satisfaction with their salary, and perceived
administrative support, the R2 was greatest among teachers in urban schools.
Interestingly, when teachers’ intent to stay in teaching was regressed on teaching
experience, perceived student behavior, teachers’ satisfaction with their salary, perceived
administrative support, and teachers’ job satisfaction, the R2 was greatest among teachers
in the urban fringe sample.
Summary
This study identified perceived administrative support as the most significant
predictor of teachers’ job satisfaction. In addition, this analysis demonstrates that
perceived administrative support mediates the effect of teaching experience, perceived
student behavior, and teachers’ satisfaction with their salary relative to teachers’ job
satisfaction. These findings were significant across environmental settings and more
likely to occur in urban schools.
This study also identified perceived administrative support as a significant
predictor of teachers’ intent to stay in teaching. However, teachers’ job satisfaction was
87
found to be the most significant predictor of teachers’ intent to stay in teaching. This
indicates that finding ways to increase teachers’ job satisfaction, such as increasing
teachers’ perceptions of administrative support, should decrease teacher attrition. These
findings were significant across environmental settings, but they are most likely to occur
in schools located in the urban fringe of a large or mid-sized central city. Additionally,
perceived administrative support mediates the effect of teaching experience, perceived
student behavior, and teachers’ satisfaction with their salary relative to teachers’ intent to
stay in teaching.
Previous research pointed to student behavior and teachers’ salary as the two
variables that are most influential on teachers’ job satisfaction and intent to stay in
teaching. This study found that perceived administrative support is the most significant
predictor of teachers’ job satisfaction and mediates the effect of teaching experience,
perceived student behavior, and teachers’ satisfaction with their salary relative to
teachers’ job satisfaction and intent to stay in teaching. This study also identified
teachers’ job satisfaction as the most significant predictor of teachers’ intent to stay in
teaching, indicating that increased job satisfaction may decrease teachers’ intent to stay in
teaching.
Recommendations for Practice
Based on the findings, this study may have a significant impact on policy and
procedure for increasing teachers’ job satisfaction and decreasing teacher attrition. The
ISLLC standards reviewed in Chapter Two embrace and include the very characteristics
used to derive the factor of perceived administrative support in this study. Meaning,
increased knowledge and implementation of the ISLLC standards should increase
teachers’ job satisfaction and decrease attrition. This should motivate those involved in
principal and administrative preparation, as well as central office personnel, to increase
accountability for the implementation of the ISLLC standards. Additionally, these
findings should influence and motivate those professionals in a position to have an affect
on public school policy to increase implementation and accountability for the ISLLC
standards. The amount of administrative support teachers perceive in a school is a
variable that can be influenced by the powers that be. Some states have offered “high
quality professional development” institutes in an effort to improve the quality of special

88
education teachers teaching core content area classes. One suggestion, based on the
findings of the current study, might be “high quality professional development” institutes
for administrators. The purpose would be increasing administrators’ knowledge of the
ISLLC standards and improving their ability to apply the standards during specific
scenarios. By improving teachers’ perceptions of administrative support, increasing
teachers’ job satisfaction, and decreasing attrition, public school districts should save
millions of dollars yearly and redirect those funds to directly benefit the students.
Further, this study confirmed teaching experience, perceived student behavior,
and teachers’ satisfaction with their salary as significant predictors of both teachers’ job
satisfaction and teachers’ intent to stay in teaching. While policy cannot control years of
teaching experience, it may influence student behavior and teachers’ salaries. Because
these are two of the most influential and consistent predictors of teachers’ job satisfaction
and attrition, critical decisions must be made immediately in order to hinder the looming
teacher shortage.
Recommendations for Future Research
More studies are needed examining the interactions between teacher
characteristics and school characteristics, and their effect on teachers’ job satisfaction and
attrition. Additional research should also include the specific study of individual working
conditions identified by teachers in previous research. Administrative support is only one
of those working conditions; however, the findings of this study strongly suggest the need
for further research examining the effect of perceived administrative support on teachers’
job satisfaction and attrition. Only a modest amount of research exists that specifically
considers the effects of perceived administrative support. This research may include
differences among elementary and secondary teachers, and differences among different
content areas.
Because of the array of variables that have been identified as having an affect on
teachers’ job satisfaction and attrition, research should continue to examine variables that
mediate the effect of additional variables. Future studies of mediating variables may
provide some valuable, policy amendable insight. In addition, the variable teachers’
satisfaction with their salary revealed some interesting findings and should be considered
for future studies of teacher attrition. A case could be made that the teachers’ satisfaction

89
with their salary is more important than the actual amount, especially when considering
issues of equity.
90
References
Abel, M. H., & Sewell, J. (1999). Stress and Burnout in Rural and Urban Secondary
School Teachers. Journal of Educational Research, 92(5), 287.
Adams, G. J., & Dial, M. (1993). Teacher Survival: A Cox Regression Model. Education
and Urban Society, 26(1ov), 90.
Bandura, A. (1989). Regulation of Cognitive Processes through Perceived Self-Efficacy.
Developmental Psychology, 25(5), 729.
Bush, G. W., & Department of Education, W. D. C. O. o. t. S. (2001). No Child Left
Behind.
Colbert, J. A., & Wolff, D. E. (1992). Surviving in Urban Schools: A Collaborative
Model for a Beginning Teacher Support System. Journal of Teacher Education,
43(3), 193.
Darling-Hammond, L. (2003). Keeping Good Teachers: Why It Matters, What Leaders
Can Do. Educational Leadership, 60(8), 6.
Edgar, E., & Pair, A. (2005). Special Education Teacher Attrition: It All Depends on
Where You Are Standing. Teacher Education and Special Education, 28(3-4),
163.
Gonzalez, P., & National Association of State Directors of Special Education, A. V. A.
(1995). Factors That Influence Teacher Attrition: NSTEP Information Brief.
Grant, L. W. (2006). Persistence and Self-Efficacy: A Key to Understanding Teacher
Turnover. The Delta Kappa Gamma Bulletin, Winter, 50-54.
Harrell, P. E., & Jackson, J. K. (2004). Redefining Teacher Quality: Myths of No Child
Left Behind. Teacher Education and Practice, 17(2), 131.
Howell, D. C. (2007). Statistical Methods for Psychology (Sixth ed.). Belmont, CA:
Thomson Wadsworth.
Ingersoll, R. M. (2001). The Realities of Out-of-Field Teaching. Educational Leadership,
58(8), 42.
Ingersoll, R. M. (2002). Holes in the Teacher Supply Bucket. School Administrator,
59(3), 42.
Ingersoll, R. M. (2003). The Teacher Shortage: Myth or Reality? Educational Horizons,
81(3), 146.
91
Ingersoll, R. M., & Smith, T. M. (2003). The Wrong Solution to the Teacher Shortage.
Educational Leadership, 60(8), 30.
Kelly, S. (2004). An Event History Analysis of Teacher Attrition: Salary, Teacher
Tracking, and Socially Disadvantaged Schools. Journal of Experimental
Education, 72(3), 195.
Leithwood, K., & Jantzi, D. (2006). Transformational School Leadership for Large-Scale
Reform: Effects on Students, Teachers, and Their Classroom Practices. School
Effectiveness and School Improvement, 17(2), 201.
Liu, X. S. (2007). The Effect of Teacher Influence at School on First-Year Teacher
Attrition: A Multilevel Analysis of the Schools and Staffing Survey for 1999-
2000. Educational Research and Evaluation, 13(1), 1.
Liu, X. S., & Meyer, J. P. (2005). Teachers' Perceptions of Their Jobs: A Multilevel
Analysis of the Teacher Follow-Up Survey for 1994-95. Teachers College
Record, 107(5), 985.
Loeb, S., Darling-Hammond, L., & Luczak, J. (2005). How Teaching Conditions Predict
Teacher Turnover in California Schools. Peabody Journal of Education, 80(3),
44.
Marvel, J., Lyter, D. M., Peltola, P., Strizek, G. A., Morton, B. A., Rowland, R., et al.
(2007). Teacher Attrition and Mobility: Results from the 2004-05 Teacher
Follow-Up Survey. NCES 2007-307: National Center for Education Statistics.
McLeskey, J., Tyler, N. C., & Saunders-Flippin, S. (2004). The Supply of and Demand
for Special Education Teachers: A Review of Research Regarding the Chronic
Shortage of Special Education Teachers. Journal of Special Education, 38(1), 5.
Murphy, J., Yff, J., & Shipman, N. (2000). Implementation of the Interstate School
Leaders Licensure Consortium Standards. International Journal of Leadership in
Education, 3(1), 17.
Office of the Deputy Secretary, W. D. C. (2004). No Child Left Behind: A Toolkit For
Teachers: US Department of Education.
Pearson, L. C., & Moomaw, W. (2005). The Relationship between Teacher Autonomy
and Stress, Work Satisfaction, Empowerment, and Professionalism. Educational
Research Quarterly, 29(1), 38.
92
Perie, M., Baker, D. P., & American Institutes for Research, W. D. C. (1997). Job
Satisfaction among America's Teachers: Effects of Workplace Conditions,
Background Characteristics, and Teacher Compensation. Statistical Analysis
Report.
Raykov, T., & Marcoulides, G. A. (2006). A First Course in Structural Equation
Modeling (2nd ed.). Mahwah, N.J.: Lawrence Erlbaum Associates, Inc.
Schumacker, R. E., & Lomax, R. G. (2004). A beginner's guide to structural equation
modeling (2nd ed.). Mahwah, N.J.: Lawrence Erlbaum Associates.
Shann, M. H. (1998). Professional Commitment and Satisfaction Among Teachers in
Urban Middle Schools. The Journal of Educational Research, 92(2).
Smith, D. L., & Smith, B. J. (2006). Perceptions of Violence: The Views of Teachers
Who Left Urban Schools. High School Journal, 89(3), 34.
Spradlin, T. E., & Prendergast, K. A. (2006). Emerging Trends in Teacher Recruitment
and Retention in the No Child Left Behind Era. Education Policy Brief. Volume 4,
Number 12, Fall 2006: Center for Evaluation and Education Policy, Indiana
University.
Strizek, G. A., Pittsonberger, J. L., Riordan, K. E., Lyter, D. M., Orlofsky, G. F., Gruber,
K., et al. (2006). Characteristics of Schools, Districts, Teachers, Principals, and
School Libraries in the United States: 2003-04 Schools and Staffing Survey. E.D.
TAB. NCES 2006-313 Revised: US Department of Education.
Tabachnick, B. G., & Fidell, L. S. (1996). Chapter 13: Principal Components and Factor
Analysis. In C. Woods (Ed.), Using Multivariate Statistics
(Third ed., pp. 635-707). New York, NY: Harper Collins College Publishers.
Teaching, N. C. o., & America's Future, N. Y. N. Y. (1996). What Matters Most:
Teaching for America's Future. Report of the National Commission on Teaching
& America's Future.
Tourkin, S. C., Warner, T., Parmer, R., Cole, C., Jackson, B., Zukerberg, A., et al. (2007).
Documentation for the 2003-04 Schools and Staffing Survey. NCES 2007-337: US
Department of Education.

93
Tugade, M. M., & Fredrickson, B. L. (2004). Resilient Individuals Use Positive Emotions
to Bounce Back From Negative Emotional Experiences. Journal of Personality
and Social Psychology, 86(2), 320-333.
Vroom, V. H., & Jago, A. G. (2007). The Role of the Situation in Leadership. American
Psychologist, 62(1), 17.
Woods, A. M., & Weasmer, J. (2004). Maintaining Job Satisfaction: Engaging
Professionals as Active Participants. Clearing House, 77(3).
Worthy, J. (2005). "It Didn't Have to Be so Hard": The First Years of Teaching in an
Urban School. International Journal of Qualitative Studies in Education, 18(3),
379.
Yost, D. S. (2006). Reflection and Self-Efficacy: Enhancing the Retention of Qualified
Teachers from a Teacher Education Perspective. Teacher Education Quarterly,
Fall.