public sector plan : resources and allocations - of planning
TRANSCRIPT
75
Overview
3.1. The chapter 2 of the volume has indicatedthe required level of public sector investments inthe Tenth Plan to be consistent with 8 per centgrowth of gross domestic product (GDP). Theseestimates form the basis for the minimum size ofpublic sector plan resources which are required tobe mobilised to achieve the plan objectives. Thischapter projects the public sector resources for theTenth Plan at Rs.15,92,300 crore (Rupees fifteenlakh, ninety-two thousand and three hundred crore,or approximately, Rs. 16 trillion) at 2001-02 prices.At comparable prices it amounts to an increase of67.4 per cent over the Ninth Plan realisation. Giventhe twin requirements of securing a sustainable debtburden and restricting the public sector draft onprivate savings to a reasonable limit, contributionof debt resources to the projected increase accountsfor 6.6 per cent only. Consequently, non-debtresources must contribute 93.4 per cent of theprojected increase in the Tenth Plan resources overthe Ninth Plan realization.
3.2. If the poor realisation of non-debtresources vis-à-vis the projections during the NinthPlan is anything to go by, the task of raising non-debt resources to the Tenth Plan target levels isquite difficult, although definitely not impossible.However, fiscal reforms in this regard assumecritical importance and are most crucial to attainingthe Tenth Plan targets. Reforms for raising the taxto GDP ratio, increasing user charges, compressingexpenditure on administration and establishmentand adherence to commercial principles by publicsector enterprises must attract focused attentionand generate time-bound results. This chapterreviews the Ninth Plan performance of both theCentre and States and Union Territories (UTs),projects the Tenth Plan resources, measures theincremental effort required over Ninth Planrealisation levels, proposes a set of policies for
attaining the Tenth Plan targets, and indicates theallocation of the public sector plan resources.
Resources of the Centre during the Ninth Plan
3.3. The Centre’s gross budgetary support(GBS) to the Ninth Plan was projected atRs.3,74,000 crore at 1996-97 prices includingRs.1,70,018 crore of Central assistance to theStates and UTs. With the Ninth Plan resources ofCentral Public Sector Units (CPSUs) projected atRs.2,85,379 crore, resources available for theCentral Plan was arrived at Rs.4,89,361 crore. TheNinth Plan realisation places the Centre’s GBS atRs.3,16,286 crore or 84.6 per cent of the projectedlevel. Central assistance to States’ and UTs wasrealised at Rs.1,38,394 crore or 81.4 per cent ofthe projected level. With realisation of CPSUsresources at Rs.2,28,795 crore or 80.2 per cent ofthe projected level, the resources available for theCentral Plan works out to 83.1 per cent of theprojected level or Rs.4,06,687 crore at 1996-97prices. Table 3.1 indicates the projection andrealisation of the Ninth Plan resources and itsfunding of the Centre.
3.4. The realised pattern of funding the GBSreflects a significant deterioration of non-debtcontribution vis-à-vis the Ninth Plan projections. Theshare of balance from current revenues (BCR) inGBS reduced to a negative 49.6 per cent as againsta projected share of a negative 0.7 per cent only.The realised share of borrowings therefore had toincrease to 144.1 per cent as against a projectedshare of 84.7 per cent, to bridge the BCR gap.
3.5. The 5,544 percent deterioration in BCRwas caused by stagnant level of revenue receiptsand substantial growth in non-plan revenueexpenditure (NPRE) in relation to GDP. Net Centralrevenues declined by 0.43 percentage points ofGDP from 9.23 per cent in 1996-97 to 8.80 in 2001-
CHAPTER 3
PUBLIC SECTOR PLAN : RESOURCES AND ALLOCATIONS

TENTH FIVE YEAR PLAN 2002-07
76
02. Tax revenue (net) decreased by more than 1percentage point from 6.85 per cent in 1996-97 to5.80 per cent in 2001-02. The fall in tax revenue(net) could not be compensated by a 0.69percentage points increase in non-tax revenue from2.38 per cent to 3.07 per cent during the sameperiod. As against a 1.05 percentage points fall intax revenue (net), the gross tax revenue of theCentre fell by 1.21 percentage points from 9.41 percent in 1996-97 to 8.20 per cent in 2001-02. Thisimplied that the impact of the fall in gross Centraltax revenues on Central finances was somewhatshared with the States.
3.6. The deterioration of the gross Central taxrevenues in relation to GDP has given rise toconcern on the following issues.
l Shrinkage of the tax base, as implied byinadequate coverage of the service tax base.
l Growth in various types of tax concessions andexemptions.
l Increase in the coverage of Modified ValueAdded Tax (MODVAT) without upwardadjustment of tax rates.
l General slackening of the tax administrationleading to revenue leakage.
3.7. The NPRE grew rapidly by 1.30percentage points of GDP from 9.30 per cent in1996-97 to 10.60 per cent in 2001-02. Thebreakdown of this increase is summarised in Table3.2.
3.8. Almost 40 per cent of the increase inNPRE was due to the growth in pension and salarypayments brought about by the implementation ofthe Fifth Pay Commission’s recommendations.Along with the growth in subsidies and other NPRE,mainly comprising defence, the massivedeterioration of BCR was the outcome of thestagnant levels of Centre’s revenue receipts.Borrowings had to increase to bridge the gap, whichconsequently raised the interest burden and led tofurther increase in NPRE, resulting in still sharperdeterioration of BCR. Increase in interest paymentsaccounted for a quarter of the total growth of NPREduring the Ninth Plan.
3.9. The debt-servicing burden, as reflectedby the percentage of interest payments torevenue receipts, increased from 47.1 per centin 1996-97 to 50.5 per cent in 2001-02, underliningthe fragile sustainability of the Centre’s debtburden. The debt burden of the Centre increasedby almost 8 percentage points from 49.4 to 57.5
Table 3.1Ninth Plan Resources of the Centre
(Rs. crore at 1996-97 prices)
Sources of Funding Projection Realization % Realisation
1. Balance from current revenues -2,778 -1,56,790 -5,544.0(-0.7) (-49.6)
2. Borrowings including net MCR 3,16,760 4,55,624 143.8(84.7) (144.1)
3. Net inflow from abroad 60,018 17,452 29.1(16.0) (5.5)
4. Gross budgetary support to plan 3,74,000 3,16,286 84.6 (1 to 3) (100.0) (100.0)
5. Central assistance to States & UTs -1,70,018 -1,38,394 81.4(45.5) (43.8)
6. GBS for Central plan (4+5) 2,03,982 1,77,892 87.2
7. Resources of public sector enterprises 2,85,379 2,28,795 80.2
8. Resources for Central Plan (6+7) 4,89,361 4,06,687 83.1
Note : Figures in parentheses are percentage of Gross Budgetary Support .

PUBLIC SECTOR PLAN : RESOURCES AND ALLOCATIONS
77
per cent of GDP during the same period. Thegross fiscal deficit of the Centre, which causedthis, grew from 4.88 per cent of GDP in 1996-97to 5.76 per cent in 2001-02, an increase of 0.88percentage points. Consequently, borrowings forfunding the GBS was 43.8 per cent above theprojected level.
3.10. The net inflow from abroad on governmentaccount, which is deployed for funding externallyaided projects (EAP) was projected to contribute16.0 per cent of the GBS in the Ninth Plan. However,its realization is placed at 29.1 per cent of the target,which reduces its realised share in plan resourcesto 5.5 per cent. The fall in net inflow from abroadhas been attributed to international sanctions,following the Pokharan nuclear tests and inadequateprovision for counterpart funding of EAP projectsthrough domestic resources.
3.11. Following from the lower realisation of theCentre’s GBS, Central assistance to the State andUT Plans also recorded a similar level ofachievement at around 81.4 per cent. Centralassistance as a percentage of GBS, which wasprojected at 45.5 per cent, declined to a level of43.8 per cent. The proportional impact of a shrinkingGBS on the quantum of Central assistance is clearlyin evidence here.
3.12. After accounting for the Centralassistance to States and UTs, the GBS left forthe Central sector Plan was projected to accountfor 41.7 per cent of the Central Plan resources.Internal and extra-budgetary resources (IEBR)of the CPSUs provided the remaining share at58.3 per cent. The realised share of IEBR in theNinth Plan is placed at 56.3 per cent indicating,
by and large, a similar deterioration as that ofGBS. In absolute terms, IEBR was realised at80.2 percent. Operational inefficiencies of theCPSUs accounted significantly for a lowerrealization of internal resources (IR).
Projection of the Tenth Plan (2002-07)Resources of the Centre
3.13. In keeping with the requirement ofstepping up public sector investments forattaining an 8 per cent GDP growth during theTenth Plan, the GBS of the Centre has beenprojected to grow from 4.33 per cent of GDP in2001-02 to 5.39 per cent in 2006-07. Thus, theTenth Plan projected average GBS stands at 4.93per cent of GDP as against the Ninth Planrealisation of 4.02 per cent.
3.14. Fiscal sustainability considerationsdemand a reduction in debt financing for funding ofGBS for the Tenth Plan. Accordingly, the grossfiscal deficit, which stood at 5.90 per cent of GDPin 2001-02 has been projected to reduce to 4.32per cent in 2006-07, obtaining a Tenth Plan averageof 4.73 per cent. The Ninth Plan average realisationhad stood at 5.82 per cent. The gross fiscal deficitis implicit in own borrowings, inclusive of netmiscellaneous capital receipts (MCR). Ownborrowings inclusive of MCR in the Tenth Plan areprojected at 4.78 per cent of GDP, down from 5.78per cent realised during the Ninth Plan. Net inflowfrom abroad, in the form of external assistance, isprojected at 0.19 per cent of GDP, slightlydiminished from 0.22 per cent realised during theNinth Plan.
3.15. The BCR is arrived at as a small negativeof 0.04 per cent of the GDP as against anegative1.98 per cent realised in the Ninth Plan.To achieve a BCR of this order, Central revenues(net) must grow from 8.80 per cent of GDP in 2001-02 to 9.98 per cent in 2006-07, an increase of 1.18percentage points. NPRE must come down from10.60 per cent of GDP in 2001-02 to 9.06 per cent,a decrease of 1.54 percentage points. Thus, animprovement of 2.72 percentage points in BCRduring the Tenth Plan is being sought mainly froma contraction of NPRE.
Table 3.2NPRE and its components of the Centre
(As a percentage of GDP)
Items 1996-97 2001-02 Increase
1. Interest 4.35 4.69 0.34
2. Pension 0.37 0.64 0.27
3. Salary 0.48 0.76 0.28
4.Subsidies 1.13 1.33 0.20
5.Other NPRE 2.97 3.18 0.21
6.(Total) NPRE 9.30 10.60 1.30

TENTH FIVE YEAR PLAN 2002-07
78
3.16. Central assistance to States and UTsduring the Tenth Plan has been projected at 42.5per cent of the Centre’s GBS. In relation to GDP,Central assistance to States and UTs is projectedat 2.09 percent in the Tenth Plan, up from 1.76per cent realised during the Ninth Plan. Afterdeducting Central assistance to States and UTs,GBS available for the Central Plan is arrived at2.82 per cent of GDP, an increase of 0.56percentage points over the Ninth Plan realizationof 2.26 per cent.
3.17. In order to meet the public sectorinvestment and savings requirements, IR of CPSUsis placed at 2.85 per cent of the GDP in the TenthPlan, up from 2.15 per cent realised during the NinthPlan. The railways and power sector CPSUs mustraise their operational efficiency to meet this target.The extra-budgetary resources (EBR) of CPSUswas projected at 0.75 per cent of the GDP, sameas the realised level obtained in the Ninth Plan.Thus, the IEBR of CPSUs is placed at 3.60 per centof GDP in the Tenth Plan.
3.18. With a GBS net of Central assistanceto State and UT plans projected at 2.79 per cent
and IEBR of CPSUs indicated at 3.60 per cent,resources available for the Central Plan arearrived at 6.39 per cent of GDP, up from 5.16per cent realized during the Ninth Plan, anincrease of 1.23 percentage points. Table 3.3indicates the resources of the Centre and itsfunding in the Tenth Plan.
3.19. The GBS of the Centre is placed atRs.7,06,000 crore at 2001-02 prices. Centralassistance to State & UT plans works out toRs.3,00,265 crore. After deducting Centralassistance to States and UTs, the GBS availablefor the Central plan is Rs.4,05,735 crore at 2001-02 prices. With an IEBR of CPSUs indicated atRs.5,15,556 crore at 2001-02 prices, totalresources available for the Central Plan isprojected at Rs.9,21,291 crore at 2001-02 prices.The Central Ministries have indicated an IEBRof Rs.4,87,448 crore, which falls short byRs.28,108 crore vis-à-vis the required IEBR. TheIEBR currently indicated by the Central Ministries,if taken in place of the projected IEBR, reducesthe Central resources for the Tenth Plan toRs.8,93,183 crore.
Table 3.3Projection of Tenth Plan Resources of the Centre
(Rs. crore at 2001-02 prices)
Sources of Funding Projection
1. Balance from Current Revenues -6,385(-0.9)
2. Borrowings including net MCR 6,85,185(97.0)
3. Net inflow from abroad 27,200(3.9)
4. Gross Budgetary Support to Plan(1 to 3) 7,06,000(100.0)
5. Central Assistance to States & UTs -3,00,265(42.5)
6. GBS for Central Plan (4+5) 4,05,735
7. Resources of Public Sector Enterprises 5,15,556
7.1. Internal Resources 4,09,000
7.2. Extra Budgetary Resources 1,06,556
8. Resources for Central Plan (6+7) 9,21,291
Note : Figures in parentheses are percentage of GBS.

PUBLIC SECTOR PLAN : RESOURCES AND ALLOCATIONS
79
3.20. A funding pattern as envisaged in Table3.3 is a challenging task, the extent of which couldbe gauged by comparing the Tenth Plan projectedlevels to the Ninth Plan realisation. Table 3.4indicates the Ninth Plan realization and the Tenth
Plan projection of resources of the Centre in relationto GDP.
3.21. The steps detailed in Box 3.1 will benecessary for achieving these targets.
BOX 3.1
l Comprehensive computerisation of the income tax system and universal usage of tax identificationnumbers in monetary transactions must be employed for facilitating improved enforcement of theincome-tax administration.
l The policy direction for removing unnecessary exemptions under corporate tax must continue sothat corporate income, liable to taxation, comes nearer to book profits as declared by the companies.
l The current policy of moving progressively to a truly single excise rate should continue to be pursuedwhile tightening up much more on existing exemptions, particularly those under small enterprises,all for improving tax compliance.
l The coverage of the service tax must be extended continuously under the union excise system sothat much greater tax buoyancy can be achieved through increased coverage of the economy as awhole.
l The extension of VAT at the State level must be taken up at the earliest for facilitating its integrationwith the Central VAT and bringing about harmonisation of tax rates levied by different tax jurisdictions.
l Peak customs tariff must be continuously lowered for enabling greater integration with the worldeconomy and consequently raising customs revenue through larger volumes of imports as wouldarise from expansion of international trade.
Table 3.4 Ninth Plan Realisation and Tenth Plan projection of Resources of Centre
(As a percentage of GDP)
Sources of Funding Ninth Plan realization Tenth Plan projections Increases(+)/Decreases(-)
1.Balance from Current Revenues -1.98 -0.04 (+)1.94
2.Borrowings including net MCR 5.78 4.78 (-)1.00
3. Net Inflow from Abroad 0.22 0.19 (-)0.03
4.Gross Budgetary Support to Plan 4.02 4.93 (+) 0.91
5.Central Assistance to States & UTs -1.76 -2.09 (-) 0.33
6.GBS for Central Plan (4+5) 2.26 2.84 (+) 0.57
7.Resources of Public Sector Enterprises 2.90 3.60 (+) 0.70
7.1. Internal Resources 2.15 2.85 (+) 0.70
7.2. Extra Budgetary Resources 0.75 0.75 -
8. Resources for Central Plan (6+7) 5.16 6.44 (+) 1.27
TENTH FIVE YEAR PLAN 2002-07
80
Resources of States and UTs during the NinthPlan (1997-2002)
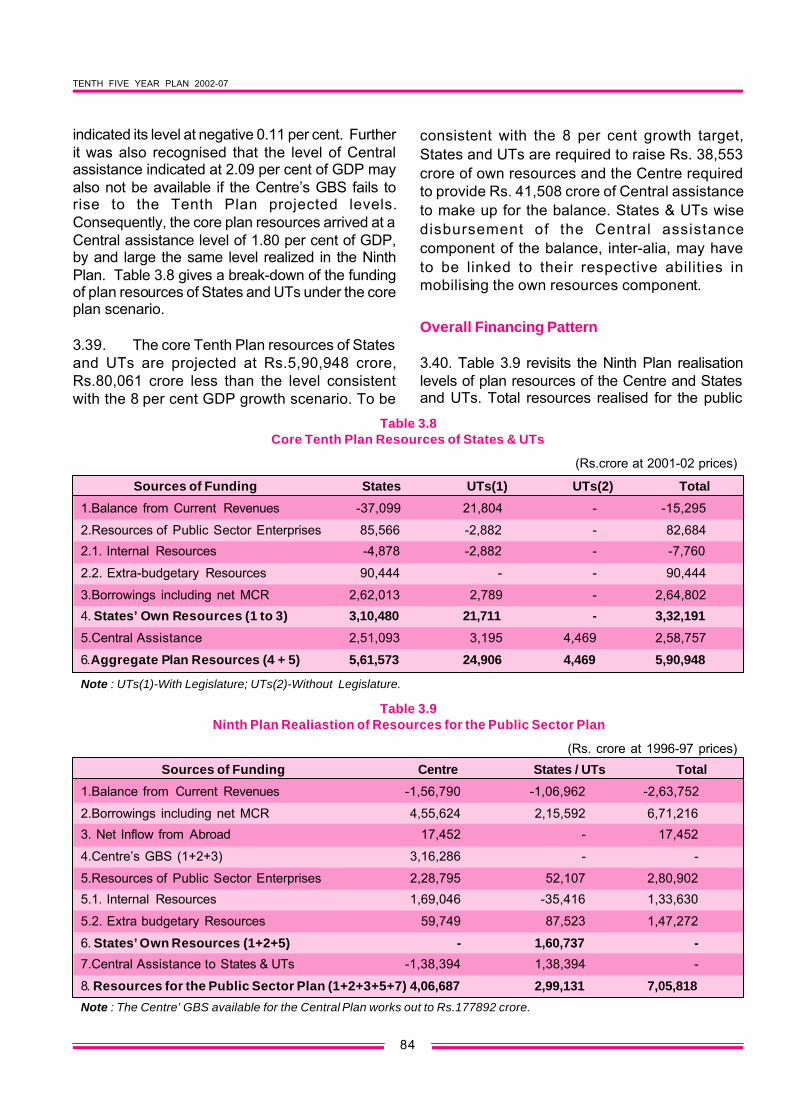
3.22. The Ninth Plan resources of States andUTs were projected at Rs.3,69,839 crore at 1996-97 prices. At comparable prices, the realisation was
placed at Rs. 2,99,131 crore or 80.9 per cent of theprojected level. The realized pattern of fundinghowever, show wide divergences from the projectedlevels. Table 3.5 summarises the projection andrealisation of the Ninth Plan resources and theirsources of funding.
l User charges must be raised to cost recovery levels and made acceptable by a communicationcampaign to convince members of the general public that such a system would be in their ownoverall interest.
l The recommendation of the Expenditure Reforms Commission, on the road map provided by it forprogressive reduction in fertilizer subsidy, as also fully eliminating petroleum subsidy for reducingNPRE must be pursued.
l A change has to be made in the design of the food subsidy programme whereby a shift from the onebased on minimum support price to Food for Work Programme is taken for reducing as well aseffectively directing food subsidy.
l Curtailment in pay and allowances of the government must be pursued on a continuous basis as, inthe wake of the implementation of the Fifth pay Commission’s recommendations, downsizing hasbecome most critical to reducing NPRE.
l The operational efficiency of Indian Railways and the power sector CPSUs must be improved with aview to eventually eliminating all budgetary support and generating adequate internal resources forexpanding the transport and power facilities in the country.
Table 3.5Ninth Plan Resources of States and UTs
(Rs. crore at 1996-97 prices)Sources of Funding Projection Realisation % Realisation
1.Balance from Current Revenues 1,372 -1,06,962 -7,896.1(0.4) (-35.8)
2.Resources of Public Sector Enterprises 55,030 52,107 94.7(15.0) (17.4)
2.1. Internal Resources 14,890 -35,416 -337.9(4.1) (-11.8)
2.2. Extra-budgetary Resources 40,140 87,523 218.0(10.9) (29.2)
3.Borrowings including net MCR 1,43,419 2,15,592 150.3(38.6) (72.1)
4. States’ Own Resources (1 to 3) 1,99,821 1,60,737 80.4(54.0) (53.7)
5.Central Assistance 1,70,018 1,38,394 81.4(46.0) (46.3)
6.Aggregate Plan Resources (4 + 5) 3,69,839 2,99,131 80.9(100.0) (100.0)
Note : Figures in parentheses are percentage of aggregate plan resources.

PUBLIC SECTOR PLAN : RESOURCES AND ALLOCATIONS
81
3.23. As indicated in the Table, the BCRdeteriorated by 7,896.1 per cent, significantlydrawing borrowings away from plan resources.Borrowings therefore had to increase to 150.3 percent of the projected level in order to provide somesupport to plan resources. The Ninth Plan saw aconsiderable shift from non-debt to debt funding.The non-debt funding reflected by BCR, which wasprojected to contribute a small surplus realised acontribution of negative 35.8 per cent.Consequently, borrowings, which were projected tocontribute 38.6 per cent, ended up contributing 72.1per cent of the Ninth Plan resources.
3.24. Available evidence suggests thatdeterioration of BCR was a result of both revenueand expenditure related slippages. The growth inNPRE was much more than the growth in currentrevenues during the Ninth Plan period. Theimplementation of the Fifth Pay Commission’srecommendations significantly contributed to therapid growth of NPRE. In one single year, salaryand pension payments rose by almost one-third ofthe pre-Pay Commission level. The effect couldhave been largely mitigated but for the inability inreducing the staff strength. Further, interestpayments in the terminal year of the Ninth Plan roseby as much as two and a half times the base yearlevel in absolute terms, due to mobilisation of largeborrowings.
3.25. Under revenue receipts, States’ share ofCentral taxes reduced by 0.14 percentage pointsof GDP across the Ninth Plan period. This was dueto industrial recession, which could not impart muchbuoyancy to the growth in union excise revenues.Revenue losses on account of expansion in thecoverage of MODVAT without commensurateupward adjustment of tax rates has also beenargued as another reason behind the falling ratio ofthe Centre’s gross tax revenue to GDP. Own taxrevenues of States and UTs also failed to exceedthe buoyancy factor of 1. Excessive tax competitionamong States resulting in lowering of tax rates aswell as various fiscal concessions provided to attractindustrial investment were instrumental in notboosting the own tax revenues. Growth in own non-tax revenues was driven down due to the Centre’sinability to raise royalty rates on minerals. Statesand UTs also could not raise user charges
adequately on irrigation and other departmentalservices.
3.26. Contribution of the resources of Statepublic sector enterprises (SPSEs) was realised at94.7 per cent of the projected level. The realizationhowever could have significantly exceeded 100 percent had it not been for the deterioration of IR. TheIR of SPSEs, which were projected to contribute4.1 per cent of plan resources, realized acontribution of negative 11.8 per cent. Thedeterioration of almost 16 percentage points in IRwas largely funded by an increase in the contributionof EBR of PSEs. The contribution of EBR to planresources, which was projected at 10.9 per centrealised a contribution of 29.2 per cent, an increaseof almost 19 percentage points.
3.27. The deterioration in IR brings into focusthe poor performance of State Electricity Boards(SEBs), whose current costs have increasinglyfailed to be covered by current revenues.Unproductive expenditure on administration andestablishment has grown rapidly withoutcommensurate increase in user charges. Suchevents accentuate the importance of power sectorreforms, which should enable SEBs to earn at leasta minimum rate of 3 per cent on their assets.
3.28. The trebling of the contribution of EBR toplan resources vis-à-vis the Ninth Plan projections,despite a massive deterioration of IR implies animprudent use of guarantees, which States issuefor SPSEs to raise borrowings. The contingentliability embodied in the issue of guarantees is mostlikely to fall on State budgets if SPSEs do notimprove the mobilisation of internal resources. Insuch an event, the fiscal balance of States’ financescan come under severe strain.
3.29. As against a projected contribution of 38.6per cent of borrowings to plan resources, Ninth Planrealisation places it at 72.1 per cent, an increase ofalmost 34.0 percentage points. Unfortunately, sucha sizeable growth in borrowings was used tobridging the BCR gap rather than augmenting planresources. Rapid increase in borrowings also ledto an increase in public sector draft on privatesavings as is implied by growth in States’outstanding debt as a percentage of GDP from 17.8

TENTH FIVE YEAR PLAN 2002-07
82
per cent in the beginning to 25.9 percent at the endof the Ninth Plan. Simultaneously, a larger debtburden increasingly became unsustainable, as theaccompanying growth of interest payments was notmatched by a commensurate growth in revenues.Interest payments as a percentage of revenuereceipts increased from 16.7 per cent in thebeginning to 22.8 per cent at the end of the NinthPlan.
3.30. Central assistance to States and UTsrealised 81.4 per cent of the projected level.However, its realised contribution to plan resourcesremained the same as the projected contributionat around 54 per cent. The significance of GBS toStates and UTs Plan remained unchanged duringthe Ninth Plan period. However, a shortfall inabsolute terms underlines the growing budgetarystrain of the Centre in meeting the targets of Centralassistance.
Projection of Tenth Plan (2002-07) Resourcesof States and UTs
3.31. In keeping with the requirement ofstepping up public sector investment for attainingan 8 per cent GDP growth during the Tenth Plan,budgetary resources for the States & UTs plan hasbeen projected to grow from 3.85 per cent of GDPin 2001-02 to 4.20 per cent in 2006-07. The TenthPlan average stands at 4.10 per cent, as againstthe Ninth Plan realization of 3.14 per cent.
3.32. The fiscal sustainability of States and UTsis considerably more vulnerable than for the Centreand requires greater fiscal correction. Accordingly,the gross fiscal deficit, which stood at 4.47 per centof GDP in 2001-02 has been projected to reduce to2.19 per cent in 2006-07, obtaining a Tenth Planaverage of 3.19 per cent. The Ninth Plan averagehad stood at 3.37 per cent. The projected target ofgross fiscal deficit is implicit in own borrowingsinclusive of MCR and the loan component of Centralassistance. Own borrowings inclusive of MCR inthe Tenth Plan are arrived at 1.82 per cent of GDP,down from 2.74 per cent realised during the NinthPlan. Central assistance in the Tenth Plan is placedat 2.09 per cent of GDP, up from 1.76 per centrealized during the Ninth Plan.
3.33. BCR is arrived at 0.19 per cent of GDP.To achieve a BCR of this order, non-plan revenuereceipts must grow from 10.27 per cent of GDP in2001-02 to 11.00 per cent in 2006-07, an increaseof 0.73 percentage points. NPRE must come downfrom 12.15 per cent of GDP in 2001-02 to 10.32per cent, a decrease of 1.83 percentage points.Thus an improvement of 2.56 percentage points inBCR during the Tenth Plan is mainly sought from acontraction of NPRE.
3.34. IR and EBR of SPSEs were determined inconsultation with State Governments. The need forimproving IR, particularly of SEBs was emphasized.Accordingly, IR was projected at –0.05 per cent ofGDP for the Tenth Plan, a much improved level from–0.45 per cent realised during the Ninth Plan. After aconsidered view, which favored a reduction in thecontingent liabilities of States and UTs, EBR wasprojected at 0.63 per cent of GDP in the Tenth Plan,down from 1.11 per cent realised during the NinthPlan. Total resources of SPSEs in the Tenth Plan aretherefore projected at 0.58 per cent of GDP, slightlydiminished from 0.66 per cent realised during the NinthPlan. Table 3.6 indicates the Tenth Plan resourcesand its funding of States and UTs in the Tenth Plan.
Table 3.6Tenth Plan Projection of Resources of States and UTs
(Rs.crore at 2001-02 prices)Sources of Funding Tenth Plan
Projections
1.Balance from Current Revenues 26,578(4.0)
2.Resources of Public Sector Enterprises 82,684(12.3)
2.1. Internal Resources -7,760(-1.2)
2.2. Extra-budgetary Resources 90,444(13.5)
3.Borrowings including net MCR 2,61,482(39.0)
4. States’ Own Resources (1 to 3) 3,70,744(55.3)
5.Central Assistance 3,00,265(44.7)
6.Aggregate Plan Resources (4 + 5) 6,71,009(100.0)
Note : Figures in parentheses are percentage of aggregateplan resources.

PUBLIC SECTOR PLAN : RESOURCES AND ALLOCATIONS
83
3.35. Aggregate plan resources of States and UTsare arrived at Rs.6,71,009 crore at 2001-02 prices,comprising Rs.3,70,744 crore of own resources andRs.3,00,265 crore of Central assistance. Of the totalaggregate plan resources, budgetary resources areplaced at Rs.5,88,325 crore.
3.36. A funding pattern, as envisaged is ademanding task, whose extent could be gaugedby comparing the Tenth Plan projected levels toNinth Plan realization. Table 3.7 indicates the NinthPlan realisation and Tenth Plan projection ofresources of the States and UTs in relation to GDP.
3.37. The steps detailed in Box 3.2 arenecessary to achieve these targets.
3.38. The Planning Commission helddiscussions with States and UTs about projectingthe core Tenth Plan resources. The projection ofthe core Tenth Plan resources was at a level lowerthan what was required to achieve 8 per cent growthof GDP. This was due to the apprehension thatimprovement in BCR, as required under the 8 percent GDP growth scenario may not be achievable.Thus, as against a BCR of 0.20 per cent in the 8per cent growth scenario, core plan resources
BOX 3.2
l Improving tax/GDP ratio of the Centre and States/UTs through inclusion of services in the tax base,removal of tax exemptions and concessions, harmonisation of tax rates, tightening of taxadministration, and adopting an integrated VAT regime.
l Reduction of budget-based subsidies by raising user charges of departmental services, reducingexpenditure by cutting administrative and establishment cost and privatization and through Centre’sinitiative switching over to ad valorem rates of royalty on minerals.
l Reducing staff strength through adoption of a policy of net attrition and constituting a pension andamortisation fund to make committed payments like terminal benefits and debt servicing, self-financing.
l Enacting a ‘Fiscal Responsibility and Budget Management’ bill under which borrowings shall berestricted to attain a non-rising debt to GDP ratio from current levels in order to reduce the burden ofinterest payments.
l Improving internal resources of States PSUs by implementing power sector reforms and reducingthe burden of contingent liabilities on State budgets through a legislative or administrative ceiling onthe issue of State guarantees.
Table 3.7Ninth Plan Realisation and Tenth Plan Projection of Resources of States and UTs
(As a percentage of GDP)
Sources of Funding Ninth Plan Realisation Tenth Plan Projections Increases(+)/Decreases(-)
1.Balance from Current Revenues -1.36 0.20 (+)1.56
2.Resources of Public Sector Enterprises 0.66 0.58 (-) 0.08
2.1. Internal Resources -0.45 -0.05 (+) 0.40
2.2. Extra-budgetary Resources 1.11 0.63 (-) 0.48
3.Borrowings including net MCR 2.74 1.82 (-) 0.92
4. States’ Own Resources (1 to 3) 2.04 2.60 (+) 0.56
5.Central Assistance 1.76 2.09 (+) 0.33
6.Aggregate Plan Resources (4 + 5) 3.80 4.69 (+) 0.89
TENTH FIVE YEAR PLAN 2002-07
84
indicated its level at negative 0.11 per cent. Furtherit was also recognised that the level of Centralassistance indicated at 2.09 per cent of GDP mayalso not be available if the Centre’s GBS fails torise to the Tenth Plan projected levels.Consequently, the core plan resources arrived at aCentral assistance level of 1.80 per cent of GDP,by and large the same level realized in the NinthPlan. Table 3.8 gives a break-down of the fundingof plan resources of States and UTs under the coreplan scenario.
3.39. The core Tenth Plan resources of Statesand UTs are projected at Rs.5,90,948 crore,Rs.80,061 crore less than the level consistentwith the 8 per cent GDP growth scenario. To be
consistent with the 8 per cent growth target,States and UTs are required to raise Rs. 38,553crore of own resources and the Centre requiredto provide Rs. 41,508 crore of Central assistanceto make up for the balance. States & UTs wisedisbursement of the Central assistancecomponent of the balance, inter-alia, may haveto be linked to their respective abilities inmobilising the own resources component.
Overall Financing Pattern
3.40. Table 3.9 revisits the Ninth Plan realisationlevels of plan resources of the Centre and Statesand UTs. Total resources realised for the public
Table 3.8Core Tenth Plan Resources of States & UTs
(Rs.crore at 2001-02 prices)
Sources of Funding States UTs(1) UTs(2) Total
1.Balance from Current Revenues -37,099 21,804 - -15,295
2.Resources of Public Sector Enterprises 85,566 -2,882 - 82,684
2.1. Internal Resources -4,878 -2,882 - -7,760
2.2. Extra-budgetary Resources 90,444 - - 90,444
3.Borrowings including net MCR 2,62,013 2,789 - 2,64,802
4. States’ Own Resources (1 to 3) 3,10,480 21,711 - 3,32,191
5.Central Assistance 2,51,093 3,195 4,469 2,58,757
6.Aggregate Plan Resources (4 + 5) 5,61,573 24,906 4,469 5,90,948
Note : UTs(1)-With Legislature; UTs(2)-Without Legislature.
Table 3.9 Ninth Plan Realiastion of Resources for the Public Sector Plan
(Rs. crore at 1996-97 prices)
Sources of Funding Centre States / UTs Total
1.Balance from Current Revenues -1,56,790 -1,06,962 -2,63,752
2.Borrowings including net MCR 4,55,624 2,15,592 6,71,216
3. Net Inflow from Abroad 17,452 - 17,452
4.Centre’s GBS (1+2+3) 3,16,286 - -
5.Resources of Public Sector Enterprises 2,28,795 52,107 2,80,902
5.1. Internal Resources 1,69,046 -35,416 1,33,630
5.2. Extra budgetary Resources 59,749 87,523 1,47,272
6. States’ Own Resources (1+2+5) - 1,60,737 -
7.Central Assistance to States & UTs -1,38,394 1,38,394 -
8. Resources for the Public Sector Plan (1+2+3+5+7) 4,06,687 2,99,131 7,05,818
Note : The Centre’ GBS available for the Central Plan works out to Rs.177892 crore.

PUBLIC SECTOR PLAN : RESOURCES AND ALLOCATIONS
85
sector’s Ninth Plan indicates the large presence ofnegative BCR, which has been bridged by asubstantially high level of borrowings. Had the BCRrealisation been in alignment with what wasprojected, the contracted borrowings would havesignificantly stepped up the resources for the publicsector plan, much higher than what was projected.In that event, the increase in overall debt burdenwould have been accompanied by a larger publicsector investment, which would have built theproductive capacities of the economy rather thanfunding the consumption expenditure of thegovernment.
3.41. Table 3.10. projects the overall resourcesfor the Tenth Plan on the presumption that thenegative BCR gap would be erased, leavingborrowings exclusively for the public sectorinvestment and not for meeting the consumptionexpenditure of the government. The projection alsorequires the public sector enterprises to substantiallyenhance their internal resources for limiting the needfor raising EBR.
Allocation of Public Sector Resource
3.42. The projected requirement of resourcesof the public sector for the Tenth Plan atRs.15,92,300 crore at 2001-02 prices comprisethe Centre’s share at Rs.9,21,291 crore and
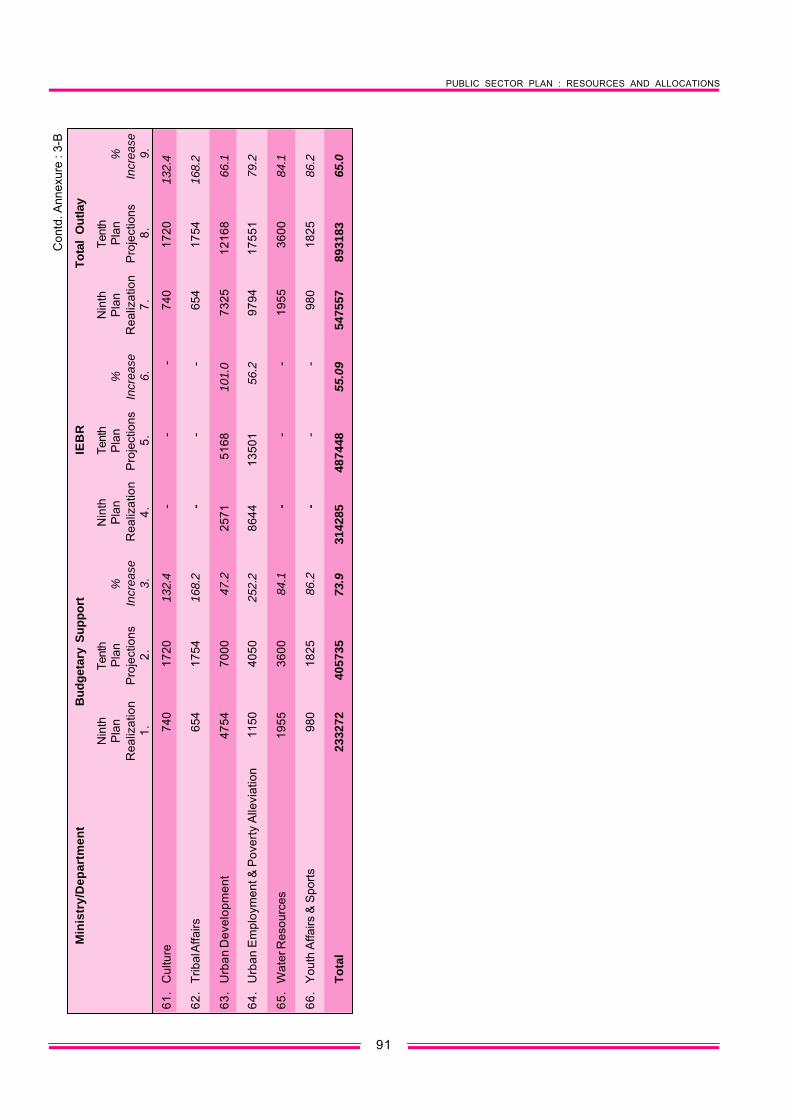
States and UTs share at Rs.6,71,009 crore. Theresources for the Central Plan includes the GBScomponent of Rs.4,05,735 crore and the IEBRcomponent of Rs.5,15,556 crore. The IEBRcomponent as currently assessed by CentralMinistries is Rs.4,87,448 crore, which isRs.28,108 crore lower than the level consistentwith the 8 percent growth of GDP in the TenthPlan.. Thus, the resource allocation in the Centralsector amounts to Rs.8,93,183 crore, which isindicated in Annexure 3-A with details ofbudgetary support and IEBR furnished inAnnexure 3-B.
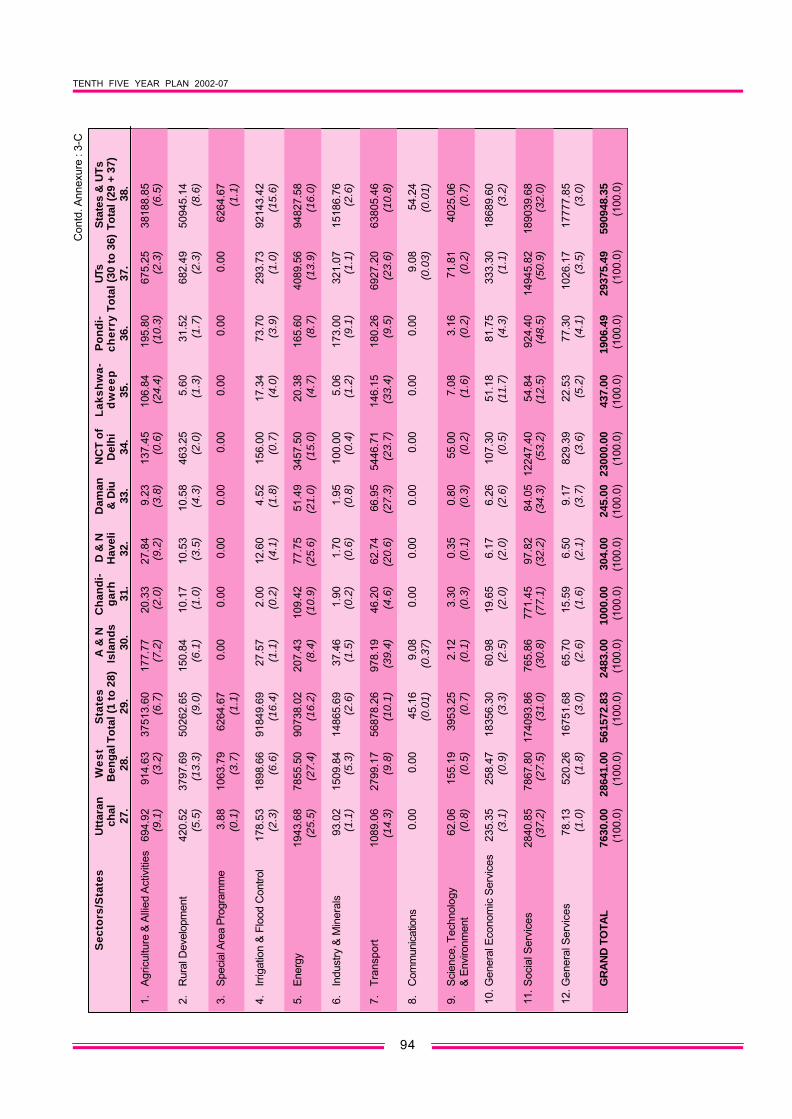
3.43. The Tenth Plan resources of the Statesand UTs are projected at Rs.6,71,009 crore at2001-02 prices. Core plan estimates, however,arrive at a resource figure of Rs.5,90,948 crore,leaving a balance of Rs.80,061 crore. Sectoralallocation in the States/UTs sector includes thecore plan resources and the Central Assistancecomponent of the balance, that is, Rs.41,508crore. This component has been allocated tocertain critical sectors identified by the PlanningCommission. The allocation of the own resourcescomponent of the balance, which is placed at Rs.38,553 crore, will have to await its actualmobilization by the States and UTs.Consequently, sectoral allocations in the States/UTs sector is arrived at Rs.6,32,456 crore. This
Table 3.10Tenth Plan Projection of Resources for the Public Sector Plan
(Rs. crore at 2001-02 prices)
Sources of Funding Centre States/UTs Total
1.Balance from Current Revenues -6,385 26,578 20,193
2.Borrowings including net MCR 6,85,185 2,61,482 9,46,667
3. Net Inflow from Abroad 27,200 - 27,200
4.Centre’s GBS (1+2+3) 7,06,000 - 7,06,000
5.Resources of Public Sector Enterprises 5,15,556 82,684 5,98,240
5.1. Internal Resources 4,09,000 -7,760 4,01,240
5.2. Extra budgetary Resources 1,06,556 90,444 1,97,000
6. States’ Own Resources (1+2+5) - 3,70,744 -
7.Central Assistance to States & UTs -3,00,265 3,00,265 -
8.Resources for the Public Sector Plan (1+2+3+5+7) 9,21,291 6,71,009 15,92,300
Note : The Centre’s GBS available for the Central Plan works out to Rs.4,05,735 crore.Allocations of Public Sector Resources.

TENTH FIVE YEAR PLAN 2002-07
86
allocation in the States/UTs sector is indicated inAnnexure 3-A with States/UTs wise core plan detailsfurnished in Annexure 3-C. Annexure 3-D indicatesthe details of Central assistance component of thebalance in the States/UTs sector.
3.44. Thus, as against the public sectorresources of Rs.15,92,300 crore for the Tenth Plan,allocations aggregate to Rs.15,25,639 crore. Table3.11 indicates the resources and allocation of thepublic sector Tenth Plan.
Table 3.11Public Sector Resources & Allocations
Tenth Plan (2002-07) (Rs. crore at 2001-02 prices)
Sources of funding Required Allocated
CENTRE1. Budgetary Support 4,05,735 4,05,7352. IEBR 5,15,556 4,87,4483. Total-Centre (1+2) 9,21,291 8,93,183
STATES & UTs4. Core Plan 5,90,948 5,90,9485. Balance (5.1+5.2) 80,061 41,5085.1 Own Resources 38,553 -5.2 Central Assistance 41,508 41,5086.Total-States & UTs (4+5) 6,71,009 6,32,456
TOTAL PUBLIC SECTOR7. Grand Total (3+6) 15,92,300 15,25,639

PUBLIC SECTOR PLAN : RESOURCES AND ALLOCATIONS
87
Ann
exur
e : 3
-A
Sec
tora
l Allo
cati
on
s o
f Pu
blic
Sec
tor'
s R
eso
urc
es: N
inth
Pla
n R
ealiz
atio
n (1
997-
2002
) an
d T
enth
Pla
n (2
002-
07) P
roje
ctio
ns
(Rs.
cro
re a
t 200
1-02
pric
es)
CE
NTR
EST
ATE
S A
ND
UTs
CE
NTR
E,
STA
TES
& U
Ts
Hea
ds
of D
evel
op
men
tB
ud
get
ary
Su
pp
ort
IEB
RT
ota
l O
utla
yT
ota
l O
utla
yT
ota
l O
utla
yN
inth
Tent
hN
inth
Tent
hN
inth
Tent
hN
inth
Tent
hN
inth
Tent
hP
lan
Pla
n%
Pla
nP
lan
%P
lan
Pla
n%
Pla
nP
lan
%P
lan
Pla
n%
Rea
li.P
roje
ctio
nIn
crea
seR
eali.
Pro
ject
ion
Incr
ease
Rea
li.P
roje
ctio
nIn
crea
seR
eali.
Pro
ject
ion
Incr
ease
Rea
li.P
roje
ctio
nIn
crea
se1
23
45
67
89
1011
1213
1415
1.A
gric
ultu
re &
Alli
ed A
ctiv
ities
1200
821
068
75.4
--
-12
008
2106
875
.425
231
3786
550
.137
239
5893
358
.3
2.R
ural
Dev
elop
men
t56
404
7972
441
.3-
--
5640
479
724
41.3
3256
142
204
29.6
8896
512
1928
37.1
3.S
peci
al A
rea
Pro
gram
mes
--
--
--
--
-54
0820
879
286.
154
0820
879
286.
1
4.Ir
rigat
ion
& F
lood
Con
trol
1955
3600
84.1
--
-19
5536
0084
.167
875
9971
546
.969
830
1033
1548
.0
5.E
nerg
y25
632
5160
010
1.3
1187
5726
6583
124.
514
4389
3181
8312
0.4
7485
485
744
14.5
2192
4340
3927
84.2
6.In
dust
ry a
nd M
iner
als
7362
1178
660
.126
102
2858
69.
533
464
4037
220
.611
231
1856
765
.344
695
5893
931
.9
7.Tr
ansp
ort
3678
465
350
77.7
6162
782
098
33.2
9841
114
7448
49.8
4483
878
529
75.1
1432
4922
5977
57.8
8.C
omm
unic
atio
ns35
5979
4412
3.2
8926
391
012
2.0
9282
298
956
6.6
1412
-14.
392
836
9896
86.
6
9.S
cien
ce, T
echn
olog
y &
Env
ironm
ent
1456
327
570
89.3
11-
-14
574
2757
089
.210
9328
5416
1.1
1566
730
424
94.2
10.
Gen
eral
Eco
nom
ic S
ervi
ces
4091
1058
715
8.8
960
500
-47.
950
5111
087
119.
586
8327
543
17.2
1373
438
630
181.
3
11.
Soc
ial S
ervi
ces
6492
712
0333
85.3
1121
518
669
66.5
7614
213
9002
82.6
1183
8720
8389
76.0
1945
2934
7391
78.6
12.
Gen
eral
Ser
vice
s59
8761
733.
1-
--
5987
6173
3.1
9659
1015
55.
115
646
1632
84.
4
To
tal
2332
7240
5735
73.9
3079
3548
7448
158
.354
1207
8931
8385
.039
9834
6324
562
58.2
9410
4115
2563
962
.1
So
urc
e :
(1) C
ore
IEB
R in
dica
ted
by th
e C
entr
al M
inis
trie
s, w
hich
is R
s. 2
8108
cro
re le
ss th
an th
e le
vel c
onsi
sten
t with
8 p
erce
nt g
row
th o
f GD
P in
the
Ten
th P
lan,
that
is R
s.51
5556
cro
re.
(2) I
nclu
des
allo
catio
n of
Rs.
590
948
cror
e of
cor
e P
lan
reso
urce
s of
Sta
tes/
UT
s an
d R
s. 4
1508
cro
re, a
dditi
onal
out
lays
pro
pose
d by
the
Pla
nnin
g C
omm
issi
on.

TENTH FIVE YEAR PLAN 2002-07
88
Ann
exur
e : 3
-B
Bud
get
Sup
port
, IE
BR
and
Out
lay
for
Cen
tral
Min
istr
ies/
Dep
artm
ent
: N
inth
Pla
n R
ealiz
atio
n &
Ten
th P
lan
Pro
ject
ions
(Rs.
cro
re a
t 200
1-02
pric
es)
Min
istr
y/D
epar
tmen
tB
ud
get
ary
Su
pp
ort
IEB
RT
ota
l O
utla
y
Nin
thT
enth
Nin
thT
enth
Nin
thT
enth
Pla
nP
lan
%P
lan
Pla
n%
Pla
nP
lan
%R
ealiz
atio
nP
roje
ctio
ns
Incr
ease
Rea
lizat
ion
Pro
ject
ion
sIn
crea
seR
ealiz
atio
nP
roje
ctio
ns
Incr
ease
1.2.
3.4.
5.6.
7.8.
9.
1.A
gric
ultu
re &
Coo
pera
tion
8308
1320
058
.9-
--
8308
1320
058
.9
2.A
gric
ultu
re R
esea
rch
& E
duca
tion
2673
5368
100.
8-
--
2673
5368
100.
8
3.A
nim
al H
usba
ndry
& D
airy
ing
1027
2500
143.
4-
--
1027
2500
143.
4
4.A
gro
& R
ural
Indu
strie
s26
7529
5010
.3-
--
2675
2950
10.3
5.A
tom
ic E
nerg
y67
7121
550
218.
316
7110
820
547.
584
4232
370
283.
4
6.C
hem
ical
s &
Pet
ro-C
hem
ical
s19
130
057
.155
1627
44-5
0.3
5707
3044
-46.
7
7.Fe
rtiliz
ers
1013
1050
3.7
4474
4850
8.4
5487
5900
7.5
8.C
ivil
Avi
atio
n20
440
096
.192
2812
528
35.8
9432
1292
837
.1
9.C
oal
2233
1050
-53.
014
823
3054
110
6.0
1705
631
591
85.2
10.
Min
es95
012
7133
.848
7381
8768
.058
2394
5862
.4
11.
Com
mer
ce18
7645
4714
2.4
169
15-9
1.1
2045
4562
123.
1
12.
Indu
stria
l Pol
icy
& P
rom
otio
n21
1320
00-5
.3-
--
2113
2000
-5.3
13.
Info
rmat
ion
Tec
hnol
ogy
1236
2714
119.
661
927
7834
8.8
1855
5492
196.
1
14.
Pos
t44
313
5020
4.7
--
-44
313
5020
4.7
15.
Tele
com
mun
icat
ions
915
1500
63.9
8643
585
484
-1.1
8735
086
984
-0.4
16.
Foo
d &
Pub
lic D
istr
ibut
ion
236
250
5.9
620
485
-21.
885
673
5-1
4.1
17.
Con
sum
er A
ffairs
5255
5.8
--
-52
555.
8
18.
Dis
inve
stm
ent
--
--
--
-0
-
19.
Dev
elop
men
t of N
orth
-Eas
tern
Reg
ion
-15
0-
--
--
150
-
PUBLIC SECTOR PLAN : RESOURCES AND ALLOCATIONS
89
Con
td. A
nnex
ure
: 3-B
Min
istr
y/D
epar
tmen
tB
ud
get
ary
Su
pp
ort
IEB
RTo
tal
Out
lay
Nin
thTe
nth
Nin
thTe
nth
Nin
thTe
nth
Pla
nP
lan
%P
lan
Pla
n%
Pla
nP
lan
%R
ealiz
atio
nP
roje
ctio
ns
Incr
ease
Rea
lizat
ion
Pro
ject
ion
sIn
crea
seR
ealiz
atio
nP
roje
ctio
ns
Incr
ease
1.2.
3.4.
5.6.
7.8.
9.
20.
Env
ironm
ent &
For
ests
3186
5945
86.5
9-
--
3186
5945
86.5
9
21.
Ext
erna
l Affa
irs18
0328
1155
.9-
--
1803
2811
55.9
22.
Eco
nom
ic A
ffairs
2931
300
-89.
8-
--
2931
300
-89.
8
23.
Exp
endi
ture
152
-86.
7-
--
152
-86.
7
24.
Rev
enue
31
-66.
7-
--
31
-66.
7
25.
Foo
d P
roce
ssin
g In
dust
ries
216
650
200.
9-
--
216
650
200.
9
26.
Hea
lth53
1492
5374
.1-
--
5314
9253
74.1
27.
Fam
ily W
elfa
re15
088
2712
579
.8-
--
1508
827
125
79.8
28.
Indi
an S
yste
ms
of M
edic
ine
& H
omeo
path
y32
277
514
0.7
--
-32
277
514
0.7
29.
Hea
vy I
ndus
try95
870
0-2
6.9
1649
1363
-17.
326
0720
63-2
0.9
30.
Pub
lic E
nter
pris
es-
50-
--
--
50-
31.
Hom
e A
ffairs
707
2000
182.
9-
--
707
2000
182.
9
32.
Ele
men
tary
Edu
catio
n &
Lite
racy
2379
230
000
26.1
--
-23
792
3000
026
.1
33.
Sec
onda
ry E
duca
tion
& H
ighe
r Edu
catio
n-
1382
5-
--
--
1382
5-
34.
Wom
en &
Chi
ld D
evel
opm
ent
6729
1378
010
4.8
--
-67
2913
780
104.
8
35.
Info
rmat
ion
& B
road
cast
ing
965
2380
146.
622
0927
5024
.531
7451
3061
.6
36.
Labo
ur51
015
0019
4.1
--
-51
015
0019
4.1
37.
Com
pany
Affa
irs1
5049
00.0
--
-1
5049
00.0
38.
Just
ice
397
700
76.3
--
-39
770
076
.3
39.
Non
-Con
vent
iona
l Ene
rgy
Sou
rces
1721
4000
132.
421
4031
6748
.038
6171
6785
.6
40.
Oce
an D
evel
opm
ent
498
1125
125.
9-
--
498
1125
125.
9

TENTH FIVE YEAR PLAN 2002-07
90
Con
td. A
nnex
ure
: 3-B
Min
istr
y/D
epar
tmen
tB
udge
tary
Sup
port
IEB
RTo
tal O
utla
y
Nin
thTe
nth
Nin
thTe
nth
Nin
thTe
nth
Pla
nP
lan
%P
lan
Pla
n%
Pla
nP
lan
%R
ealiz
atio
nP
roje
ctio
ns
Incr
ease
Rea
lizat
ion
Pro
ject
ion
sIn
crea
seR
ealiz
atio
nP
roje
ctio
ns
Incr
ease
1.2.
3.4.
5.6.
7.8.
9.
41.
Per
sonn
el, P
ublic
Grie
vanc
es &
Pen
sion
s78
250
220.
5-
--
7825
022
0.5
42.
Pet
role
um &
Nat
ural
Gas
-
-
-
7033
810
3656
47.4
7033
810
3656
47.4
43.
Pla
nnin
g C
omm
issi
on61
434
0-4
4.6
--
-61
434
0-4
4.6
44.
Pow
er14
907
2500
067
.729
785
1183
9929
7.5
4469
214
3399
220.
9
45.
Rai
lway
s16
491
2760
067
.434
120
3300
0-3
.350
611
6060
019
.7
46.
Roa
d Tr
ansp
ort &
Hig
hway
s19
393
3500
080
.518
279
2470
035
.137
672
5970
058
.5
47.
Drin
king
Wat
er S
uppl
y80
5214
200
76.4
--
-80
5214
200
76.4
48.
Land
Res
ourc
es24
0465
2617
1.5
--
-24
0465
2617
1.5
49.
Rur
al D
evel
opm
ent
4327
356
748
31.1
--
-43
273
5674
831
.1
50.
Bio
-Tec
hnol
ogy
669
1450
116.
7-
--
669
1450
116.
7
51.
Sci
ence
& T
echn
olog
y16
3534
0010
8.0
11-
-16
4634
0010
6.6
52.
Sci
entif
ic &
Indu
stria
l Res
earc
h14
7825
7574
.2-
--
1478
2575
74.2
53.
Shi
ppin
g69
623
5023
7.6
6350
1187
086
.93
7045
.87
1422
010
1.8
54.
Sm
all S
cale
Indu
strie
s-
2200
-66
638
4-4
2.3
666
2584
288.
0
55.
Soc
ial J
ustic
e &
Em
pow
erm
ent
5404
8530
57.8
--
-54
0485
3057
.8
56.
Spa
ce70
9713
250
86.7
--
-70
9713
250
86.7
57.
Sta
tistic
s &
Pro
gram
me
Impl
emen
tatio
n21
572
523
7.2
--
-21
572
523
7.2
58.
Ste
el85
65-2
3.5
8882
1097
823
.689
6711
043
23.2
59.
Text
iles
1836
3500
90.6
4280
90.5
1878
3580
90.6
60.
Tour
ism
640
2900
353.
117
1-
-81
129
0025
7.6
PUBLIC SECTOR PLAN : RESOURCES AND ALLOCATIONS
91
Con
td. A
nnex
ure
: 3-B
Min
istr
y/D
epar
tmen
tB
ud
get
ary
Su
pp
ort
IEB
RTo
tal
Out
lay
Nin
thTe
nth
Nin
thTe
nth
Nin
thTe
nth
Pla
nP
lan
%P
lan
Pla
n%
Pla
nP
lan
%R
ealiz
atio
nP
roje
ctio
nsIn
crea
seR
ealiz
atio
nP
roje
ctio
nsIn
crea
seR
ealiz
atio
nP
roje
ctio
nsIn
crea
se1.
2.3.
4.5.
6.7.
8.9.
61.
Cul
ture
740
1720
132.
4 -
--
740
1720
132.
4
62.
Trib
al A
ffairs
654
1754
168.
2
-
-
-65
417
5416
8.2
63.
Urb
an D
evel
opm
ent
4754
7000
47.2
2571
5168
101.
073
2512
168
66.1
64.
Urb
an E
mpl
oym
ent &
Pov
erty
Alle
viat
ion
1150
4050
252.
286
4413
501
56.2
9794
1755
179
.2
65.
Wat
er R
esou
rces
1955
3600
84.1
-
-
-
1955
3600
84.1
66.
You
th A
ffairs
& S
ports
980
1825
86.2
-
-
-
980
1825
86.2
To
tal
2332
7240
5735
73.9
3142
8548
7448
55.0
954
7557
8931
8365
.0

TENTH FIVE YEAR PLAN 2002-07
92
Ann
exur
e : 3
-C
Ten
th P
lan
(20
02-0
7) O
utl
ays
by
Sta
tes/
UT
s(M
ajo
r H
ead
s o
f D
evel
op
men
t)
(Rs.
Cro
re a
t 200
1-02
pric
es)
Sec
tors
/Sta
tes
An
dh
raA
run
ach
alA
ssam
Bih
arC
hat
tis-
Goa
Gu
jara
tH
arya
na
Him
ach
alJ
& K
Jhar
khan
dK
arn
atak
aK
eral
aP
rad
es
hP
rad
es
hg
arh
Pra
de
sh
1.2.
3.4.
5.6.
7.8.
9.10
.11
.12
.13
.
1.A
gric
ultu
re &
Alli
ed A
ctiv
ities
2333
.21
515.
3166
4.98
536.
1186
0.97
158.
3435
48.7
146
9.53
1201
.69
1507
.80
824.
8523
46.9
411
25.0
0(5
.0)
(13.
3)(8
.0)
(2.6
)(7
.8)
(4.9
)(8
.9)
(4.6
)(1
1.7)
(10.
4)(5
.6)
(5.4
)(4
.7)
2.R
ural
Dev
elop
men
t45
92.0
715
8.17
582.
6141
36.5
011
58.9
184
.50
1361
.94
305.
8543
8.16
374.
1032
72.3
322
27.7
256
9.75
(9.9
)(4
.1)
(7.0
)(1
9.7)
(10.
5)(2
.6)
(3.4
)(3
.0)
(4.3
)(2
.6)
(22.
4)(5
.1)
(2.4
)
3.S
peci
al A
rea
Pro
gram
me
1123
.52
65.0
056
.40
40.6
90.
0018
.00
38.3
014
7.37
20.8
077
1.87
0.00
640.
7410
0.00
(2.4
)(1
.7)
(0.7
)(0
.2)
(0.6
)(0
.1)
(1.4
)(0
.2)
(5.3
)(1
.5)
(0.4
)
4.Irr
igat
ion
& F
lood
Con
trol
1084
4.98
184.
3764
5.33
6016
.87
2506
.65
222.
9088
10.0
515
41.0
445
3.18
805.
7920
76.7
014
176.
5793
0.00
(23.
3)(4
.7)
(7.8
)(2
8.7)
(22.
8)(7
.0)
(22.
0)(1
5.0)
(4.4
)(5
.6)
(14.
2)(3
2.5)
(3.9
)
5.E
nerg
y71
41.7
249
8.12
837.
0427
35.4
413
3.25
405.
0060
18.9
314
00.4
712
35.0
028
85.7
481
4.00
2266
.95
3500
.00
(15.
3)(1
2.8)
(10.
1)(1
3.0)
(1.2
)(1
2.7)
(15.
0)(1
3.6)
(12.
0)(1
9.9)
(5.6
)(5
.2)
(14.
6)
6.In
dust
ry &
Min
eral
s16
55.1
176
.36
237.
0424
1.50
214.
1211
6.40
2068
.45
84.3
410
4.73
435.
6547
3.87
1452
.87
1328
.75
(3.6
)(2
.0)
(2.9
)(1
.2)
(1.9
)(3
.6)
(5.2
)(0
.8)
(1.0
)(3
.0)
(3.2
)(3
.3)
(5.5
)
7.Tr
ansp
ort
3994
.19
824.
4287
9.32
1303
.12
451.
6439
2.84
1851
.39
1286
.65
1635
.94
1640
.70
1287
.64
4854
.44
2660
.00
(8.6
)(2
1.2)
(10.
6)(6
.2)
(4.1
)(1
2.3)
(4.6
)(1
2.5)
(15.
9)(1
1.3)
(8.8
)(1
1.1)
(11.
1)
8.C
omm
unic
atio
ns0.
000.
000.
000.
000.
000.
0034
.05
0.00
2.11
0.00
0.00
0.00
0.00
(0.0
9)(0
.02)
9.S
cien
ce, T
echn
olog
y &
11.2
04.
628.
150.
0010
.83
4.75
326.
018.
486.
4236
.19
330.
0025
.78
120.
00E
nviro
nmen
t(0
.0)
(0.1
)(0
.1)
(0.1
)(0
.1)
(0.8
)(0
.1)
(0.1
)(0
.2)
(2.3
)(0
.1)
(0.5
)
10.
Gen
eral
Eco
nom
ic S
ervi
ces
804.
8023
1.70
217.
5935
2.89
169.
1915
9.75
838.
8751
2.35
223.
7417
34.9
118
9.52
895.
6311
68.0
5(1
.7)
(6.0
)(2
.6)
(1.7
)(1
.5)
(5.0
)(2
.1)
(5.0
)(2
.2)
(12.
0)(1
.3)
(2.1
)(4
.9)
11.
Soc
ial S
ervi
ces
1363
4.04
1239
.33
4157
.11
5076
.73
5256
.15
1526
.52
1508
9.45
4311
.08
4893
.48
4016
.43
4847
.14
1418
2.98
4360
.45
(29.
2)(3
1.9)
(50.
0)(2
4.2)
(47.
8)(4
7.7)
(37.
7)(4
1.9)
(47.
5)(2
7.7)
(33.
1)(3
2.6)
(18.
2)
12.
Gen
eral
Ser
vice
s47
9.16
90.9
229
.65
560.
1523
8.29
111.
0020
.85
217.
8484
.75
290.
8251
6.69
487.
6081
38.0
0(1
.0)
(2.3
)(0
.4)
(2.7
)(2
.2)
(3.5
)(0
.1)
(2.1
)(0
.8)
(2.0
)(3
.5)
(1.1
)(3
3.9)
GR
AN
D T
OTA
L46
614.
0038
88.3
283
15.2
421
000.
0011
000.
0032
00.0
040
007.
0010
285.
0010
300.
0014
500.
0014
632.
7443
558.
2324
000.
00(1
00.0
)(1
00.0
)(1
00.0
)(1
00.0
)(1
00.0
)(1
00.0
)(1
00.0
)(1
00.0
)(1
00.0
)(1
00.0
)(1
00.0
)(1
00.0
)(1
00.0
)

PUBLIC SECTOR PLAN : RESOURCES AND ALLOCATIONS
93
Con
td. A
nnex
ure
: 3-C
Sec
tors
/Sta
tes
Mad
hya
Mah
a-M
anip
ur
Meg
ha-
Miz
o-
Nag
a-O
riss
aP
un
jab
Raj
asth
anS
ikki
mT
amil
Tri
pu
raU
ttar
Pra
de
sh
ras
htr
ala
yara
mla
nd
Nad
uP
rad
es
h14
.15
.16
.17
.18
.19
.20
.21
.22
.23
.24
.25
.26
.
1.A
gric
ultu
re &
Alli
ed A
ctiv
ities
1581
.52
4248
.62
113.
8629
9.60
161.
9825
5.50
1165
.20
635.
4116
49.4
817
4.99
3932
.05
450.
0051
42.4
0(6
.0)
(6.4
)(4
.1)
(10.
0)(7
.0)
(11.
5)(6
.1)
(3.4
)(6
.0)
(10.
6)(9
.8)
(10.
0)(8
.6)
2.R
ural
Dev
elop
men
t28
81.1
669
19.7
212
0.91
208.
1815
6.65
180.
0589
7.91
1276
.50
2298
.84
74.0
041
00.0
054
0.00
7127
.91
(11.
0)(1
0.4)
(4.3
)(6
.9)
(6.8
)(8
.1)
(4.7
)(6
.8)
(8.4
)(4
.5)
(10.
3)(1
2.0)
(11.
9)
3.S
peci
al A
rea
Pro
gram
me
0.00
373.
2222
.88
44.7
040
.37
44.5
50
134.
3716
9.22
30.0
00.
0031
5.00
1000
.00
(0.6
)(0
.8)
(1.5
)(1
.8)
(2.0
)(0
.7)
(0.6
)(1
.8)
(7.0
)(1
.7)
4.Irr
igat
ion
& F
lood
Con
trol
4915
.89
1525
5.01
368.
5497
.40
28.2
841
.00
4099
.21
2611
.51
2767
.88
31.0
023
75.0
036
0.00
7607
.35
(18.
8)(2
2.9)
(13.
1)(3
.2)
(1.2
)(1
.8)
(21.
6)(1
4.0)
(10.
1)(1
.9)
(5.9
)(8
.0)
(12.
7)
5.E
nerg
y55
06.2
010
163.
5123
0.51
505.
7719
4.85
248.
4528
64.8
859
82.7
372
60.7
424
2.90
8029
.65
225.
0096
11.9
9(2
1.0)
(15.
3)(8
.2)
(16.
8)(8
.5)
(11.
2)(1
5.1)
(32.
1)(2
6.6)
(14.
7)(2
0.1)
(5.0
)(1
6.1)
6.In
dust
ry &
Min
eral
s20
2.38
716.
5633
2.94
144.
0060
.38
192.
0510
9.33
55.9
895
5.66
62.0
055
5.00
135.
0012
62.4
6(0
.8)
(1.1
)(1
1.9)
(4.8
)(2
.6)
(8.6
)(0
.6)
(0.3
)(3
.5)
(3.7
)(1
.4)
(3.0
)(2
.1)
7.Tr
ansp
ort
1353
.05
5217
.21
223.
4854
0.30
481.
9017
0.35
1959
.91
2711
.50
3039
.79
265.
0067
30.0
049
5.00
6740
.25
(5.2
)(7
.8)
(8.0
)(1
8.0)
(21.
0)(7
.6)
(10.
3)(1
4.5)
(11.
1)(1
6.0)
(16.
8)(1
1.0)
(11.
3)
8.C
omm
unic
atio
ns0.
000.
000.
000.
000.
000.
000.
000.
000.
000.
000.
009.
000.
00(0
.20)
9.S
cien
ce, T
echn
olog
y59
.70
55.2
517
.22
7.90
5.32
4.50
43.1
138
.75
12.1
711
.00
160.
4013
.50
2414
.75
& E
nviro
nmen
t(0
.2)
(0.1
)(0
.6)
(0.3
)(0
.2)
(0.2
)(0
.2)
(0.2
)(0
.0)
(0.7
)(0
.4)
(0.3
)(4
.0)
10.
Gen
eral
Eco
nom
ic S
ervi
ces
759.
6628
49.5
124
5.21
59.7
012
5.55
228.
0322
85.0
415
0.15
1079
.89
40.4
017
5.60
67.5
022
97.2
5(2
.9)
(4.3
)(8
.7)
(2.0
)(5
.5)
(10.
2)(1
2.0)
(0.8
)(4
.0)
(2.4
)(0
.4)
(1.5
)(3
.8)
11.
Soc
ial S
ervi
ces
7634
.97
1923
3.21
1032
.00
1034
.35
956.
8773
8.40
5075
.89
4858
.37
7996
.77
666.
2513
653.
5518
22.5
016
091.
19(2
9.2)
(28.
9)(3
6.8)
(34.
4)(4
1.6)
(33.
1)(2
6.7)
(26.
0)(2
9.3)
(40.
2)(3
4.1)
(40.
5)(2
6.9)
12.
Gen
eral
Ser
vice
s12
95.4
016
00.1
896
.45
67.1
087
.88
124.
7749
9.52
201.
8387
.56
58.2
028
8.75
67.5
041
2.45
(4.9
)(2
.4)
(3.4
)(2
.2)
(3.8
)(5
.6)
(2.6
)(1
.1)
(0.3
)(3
.5)
(0.7
)(1
.5)
(0.7
)
GR
AN
D T
OTA
L26
189.
9366
632.
0028
04.0
030
09.0
023
00.0
122
27.6
519
000.
0018
657.
0027
318.
0016
55.7
440
000.
0045
00.0
059
708.
00(1
00.0
)(1
00.0
)(1
00.0
)(1
00.0
)(1
00.0
)(1
00.0
)(1
00.0
)(1
00.0
)(1
00.0
)(1
00.0
)(1
00.0
)(1
00.0
)(1
00.0
)
TENTH FIVE YEAR PLAN 2002-07
94
Con
td. A
nnex
ure
: 3-C
Sec
tors
/Sta
tes
Utt
aran
We
st
Sta
tes
A &
NC
han
di-
D &
ND
aman
NC
T o
fL
ak
sh
wa
-P
on
di-
UTs
Sta
tes
& U
Ts
chal
Ben
gal
To
tal (
1 to
28)
Isla
nd
sg
arh
Hav
eli
& D
iuD
elh
id
we
ep
ch
err
yT
ota
l (30
to
36)
To
tal (
29 +
37)
27.
28.
29.
30.
31.
32.
33.
34.
35.
36.
37.
38.
1.A
gric
ultu
re &
Alli
ed A
ctiv
ities
694.
9291
4.63
3751
3.60
177.
7720
.33
27.8
49.
2313
7.45
106.
8419
5.80
675.
2538
188.
85(9
.1)
(3.2
)(6
.7)
(7.2
)(2
.0)
(9.2
)(3
.8)
(0.6
)(2
4.4)
(10.
3)(2
.3)
(6.5
)
2.R
ural
Dev
elop
men
t42
0.52
3797
.69
5026
2.65
150.
8410
.17
10.5
310
.58
463.
255.
6031
.52
682.
4950
945.
14(5
.5)
(13.
3)(9
.0)
(6.1
)(1
.0)
(3.5
)(4
.3)
(2.0
)(1
.3)
(1.7
)(2
.3)
(8.6
)
3.S
peci
al A
rea
Pro
gram
me
3.88
1063
.79
6264
.67
0.00
0.00
0.00
0.00
0.00
0.00
0.00
0.00
6264
.67
(0.1
)(3
.7)
(1.1
)(1
.1)
4.Irr
igat
ion
& F
lood
Con
trol
178.
5318
98.6
691
849.
6927
.57
2.00
12.6
04.
5215
6.00
17.3
473
.70
293.
7392
143.
42(2
.3)
(6.6
)(1
6.4)
(1.1
)(0
.2)
(4.1
)(1
.8)
(0.7
)(4
.0)
(3.9
)(1
.0)
(15.
6)
5.E
nerg
y19
43.6
878
55.5
090
738.
0220
7.43
109.
4277
.75
51.4
934
57.5
020
.38
165.
6040
89.5
694
827.
58(2
5.5)
(27.
4)(1
6.2)
(8.4
)(1
0.9)
(25.
6)(2
1.0)
(15.
0)(4
.7)
(8.7
)(1
3.9)
(16.
0)
6.In
dust
ry &
Min
eral
s93
.02
1509
.84
1486
5.69
37.4
61.
901.
701.
9510
0.00
5.06
173.
0032
1.07
1518
6.76
(1.1
)(5
.3)
(2.6
)(1
.5)
(0.2
)(0
.6)
(0.8
)(0
.4)
(1.2
)(9
.1)
(1.1
)(2
.6)
7.Tr
ansp
ort
1089
.06
2799
.17
5687
8.26
978.
1946
.20
62.7
466
.95
5446
.71
146.
1518
0.26
6927
.20
6380
5.46
(14.
3)(9
.8)
(10.
1)(3
9.4)
(4.6
)(2
0.6)
(27.
3)(2
3.7)
(33.
4)(9
.5)
(23.
6)(1
0.8)
8.C
omm
unic
atio
ns0.
000.
0045
.16
9.08
0.00
0.00
0.00
0.00
0.00
0.00
9.08
54.2
4(0
.01)
(0.3
7)(0
.03)
(0.0
1)
9.S
cien
ce, T
echn
olog
y62
.06
155.
1939
53.2
52.
123.
300.
350.
8055
.00
7.08
3.16
71.8
140
25.0
6&
Env
ironm
ent
(0.8
)(0
.5)
(0.7
)(0
.1)
(0.3
)(0
.1)
(0.3
)(0
.2)
(1.6
)(0
.2)
(0.2
)(0
.7)
10.G
ener
al E
cono
mic
Ser
vice
s23
5.35
258.
4718
356.
3060
.98
19.6
56.
176.
2610
7.30
51.1
881
.75
333.
3018
689.
60(3
.1)
(0.9
)(3
.3)
(2.5
)(2
.0)
(2.0
)(2
.6)
(0.5
)(1
1.7)
(4.3
)(1
.1)
(3.2
)
11.S
ocia
l Ser
vice
s28
40.8
578
67.8
017
4093
.86
765.
8677
1.45
97.8
284
.05
1224
7.40
54.8
492
4.40
1494
5.82
1890
39.6
8(3
7.2)
(27.
5)(3
1.0)
(30.
8)(7
7.1)
(32.
2)(3
4.3)
(53.
2)(1
2.5)
(48.
5)(5
0.9)
(32.
0)
12.G
ener
al S
ervi
ces
78.1
352
0.26
1675
1.68
65.7
015
.59
6.50
9.17
829.
3922
.53
77.3
010
26.1
717
777.
85(1
.0)
(1.8
)(3
.0)
(2.6
)(1
.6)
(2.1
)(3
.7)
(3.6
)(5
.2)
(4.1
)(3
.5)
(3.0
)
GR
AN
D T
OTA
L76
30.0
028
641.
0056
1572
.83
2483
.00
1000
.00
304.
0024
5.00
2300
0.00
437.
0019
06.4
929
375.
4959
0948
.35
(100
.0)
(100
.0)
(100
.0)
(100
.0)
(100
.0)
(100
.0)
(100
.0)
(100
.0)
(100
.0)
(100
.0)
(100
.0)
(100
.0)
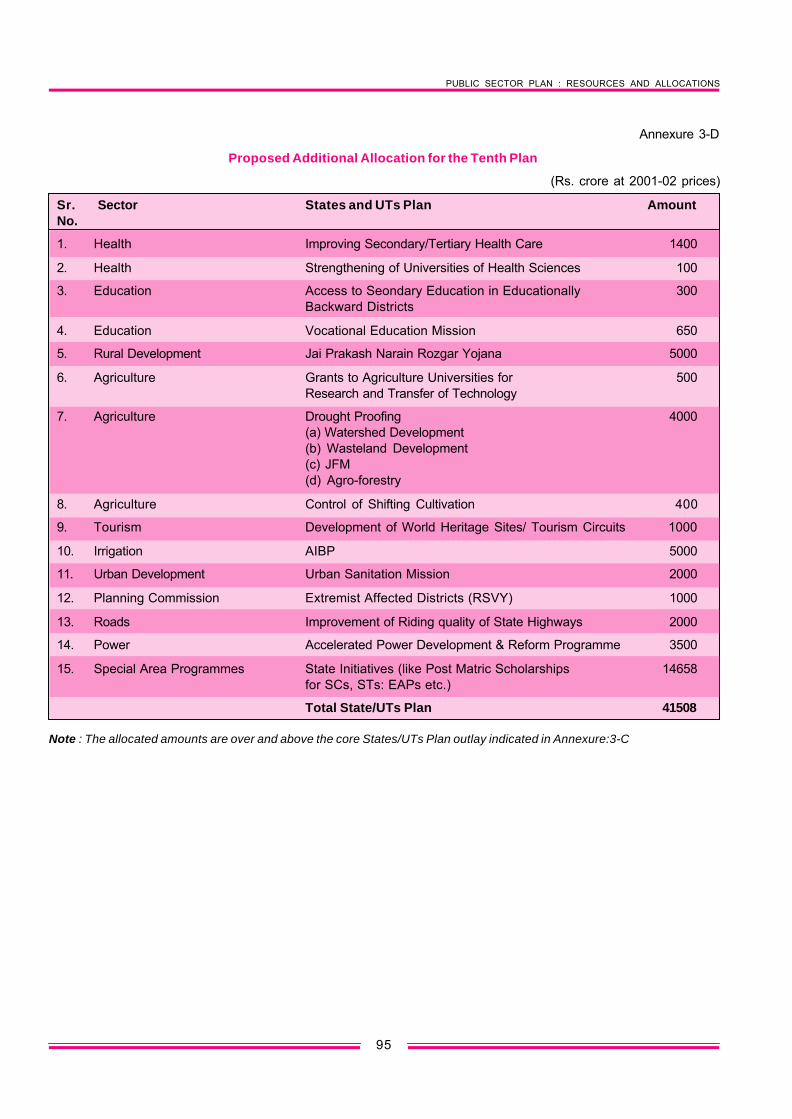
PUBLIC SECTOR PLAN : RESOURCES AND ALLOCATIONS
95
Annexure 3-D
Proposed Additional Allocation for the Tenth Plan
(Rs. crore at 2001-02 prices)
Sr. Sector States and UTs Plan AmountNo.
1. Health Improving Secondary/Tertiary Health Care 1400
2. Health Strengthening of Universities of Health Sciences 100
3. Education Access to Seondary Education in Educationally 300Backward Districts
4. Education Vocational Education Mission 650
5. Rural Development Jai Prakash Narain Rozgar Yojana 5000
6. Agriculture Grants to Agriculture Universities for 500Research and Transfer of Technology
7. Agriculture Drought Proofing 4000(a) Watershed Development(b) Wasteland Development(c) JFM(d) Agro-forestry
8. Agriculture Control of Shifting Cultivation 400
9. Tourism Development of World Heritage Sites/ Tourism Circuits 1000
10. Irrigation AIBP 5000
11. Urban Development Urban Sanitation Mission 2000
12. Planning Commission Extremist Affected Districts (RSVY) 1000
13. Roads Improvement of Riding quality of State Highways 2000
14. Power Accelerated Power Development & Reform Programme 3500
15. Special Area Programmes State Initiatives (like Post Matric Scholarships 14658for SCs, STs: EAPs etc.)
Total State/UTs Plan 41508
Note : The allocated amounts are over and above the core States/UTs Plan outlay indicated in Annexure:3-C

TENTH FIVE YEAR PLAN 2002-07
96