public sector unions and the rising costs of employee compensation · 2016-10-20 · public sector...
TRANSCRIPT

87
Public Sector Unions and the RisingCosts of Employee Compensation
Chris Edwards
Public sector compensation is becoming a high-profile policyissue. While private sector wages and benefits have stagnated duringthe recession, many governments continue to increase compensationfor public sector workers. At the same time, there are growing con-cerns about huge underfunding in public sector retirement plansacross the nation.
This article examines the compensation of state and local workers,who account for 20 million of the 23 million civilian governmentworkers in the United States.1 State and local workers include teach-ers, college instructors, police officers, health care administrators,and many other occupational groups.
Examining state and local compensation is important because itrepresents a major portion of the overall U.S. economy. In 2008, thetotal cost of wages and benefits for state and local workers was $1.1trillion, which was half of the $2.2 trillion in total spending by stateand local governments.2 Compensation costs are expected to riserapidly in coming years due to growing pension and health care costs.
This study begins with a look at trends in state and local govern-ment compensation since 1950. Then it compares compensation lev-
Cato Journal, Vol. 30, No. 1 (Winter 2010). Copyright © Cato Institute. All rightsreserved.
Chris Edwards is Director of Tax Policy Studies at the Cato Institute. He thanksVivek Rajasekhar for research assistance.
1U.S. Bureau of Economic Analysis, National Income and Product Accounts,Table 6.4D. This is based on total full- and part-time civilian employees in 2008.2Ibid., Tables 3.3 and 6.2D.
20951_CATOpages.qxd 1/20/10 1:00 PM Page 87
88
Cato Journal
els in the public and private sectors using data for 2008. Note that Iwill use the phrase “public sector” to refer to state and local govern-ments and not the federal government, which is not examined here.
Next, the growth of labor unions in the public sector workforce isdiscussed. In 2008, 39 percent of state and local workers were mem-bers of unions, but that percentage varies widely by state as a resultof differences in state legislation on collective bargaining and otheraspects of union organization.
Does the presence of labor unions in the public sector increasethe costs of public sector compensation? I use state-level data onpublic sector compensation and union shares in an OLS regressionto explore this question. I find that public sector unions push up thecosts of the public sector workforce in the United States by about 8percent, on average, but the increase would be more in states withhighly unionized public sectors such as California.
The final section discusses the coming fiscal crisis in state andlocal budgets. Many state and local governments have hugeunfunded obligations in worker retirement plans, and they will needto make major reforms to their budgets in the years ahead. However,enacting reforms will be a significant challenge given the resistanceto change in the politically active and unionized workforces of stateand local governments.
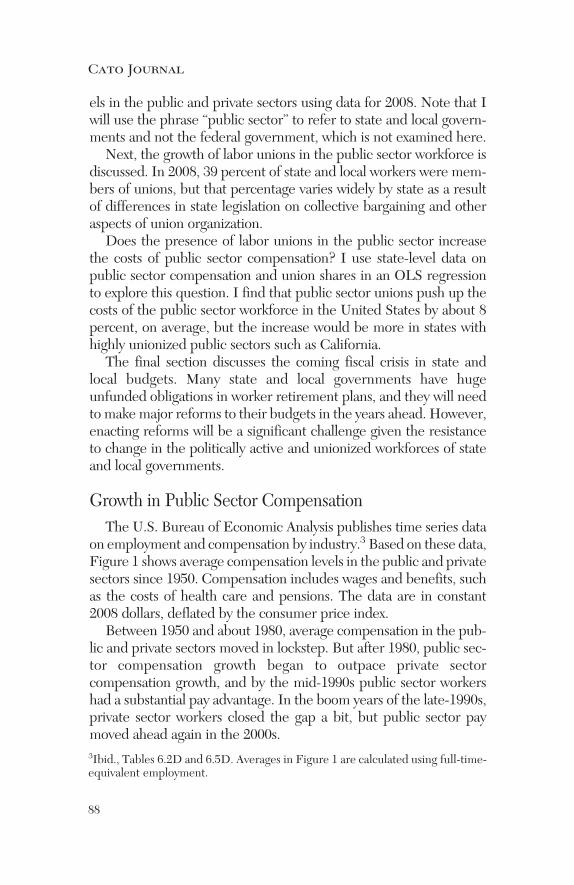
Growth in Public Sector CompensationThe U.S. Bureau of Economic Analysis publishes time series data
on employment and compensation by industry.3 Based on these data,Figure 1 shows average compensation levels in the public and privatesectors since 1950. Compensation includes wages and benefits, suchas the costs of health care and pensions. The data are in constant2008 dollars, deflated by the consumer price index.
Between 1950 and about 1980, average compensation in the pub-lic and private sectors moved in lockstep. But after 1980, public sec-tor compensation growth began to outpace private sectorcompensation growth, and by the mid-1990s public sector workershad a substantial pay advantage. In the boom years of the late-1990s,private sector workers closed the gap a bit, but public sector paymoved ahead again in the 2000s.3Ibid., Tables 6.2D and 6.5D. Averages in Figure 1 are calculated using full-time-equivalent employment.
20951_CATOpages.qxd 1/20/10 1:00 PM Page 88

89
Public Sector Unions and Compensation
The public sector pay advantage is most pronounced in benefits.Bureau of Economic Analysis data show that average compensationin the private sector was $59,909 in 2008, including $50,028 in wagesand $9,881 in benefits. Average compensation in the public sectorwas $67,812, including $52,051 in wages and $15,761 in benefits.
The BEA data break down the public sector workforce into threegroups: education, public enterprises (such as government liquorstores), and all other government functions. The long-term compen-sation trends in the three groups have been similar.
Finally, note that the BEA data on benefits include employer con-tributions to defined-benefit pension and health care plans. But stateand local pension and retiree health plans are, in aggregate, hugelyunderfunded, as discussed below. Thus, these data understate thelevel of benefits that state and local workers are currently accruing.
Compensation Levels in the Public and Private SectorsThe U.S. Bureau of Labor Statistics (BLS 2009d) provides data
allowing a detailed comparison of compensation in the public andprivate sectors. Table 1 shows employer costs per hour of work for
Source: U.S. Bureau of Economic Analysis.
$20,000
$30,000
$40,000
$50,000
$60,000
$70,000
1950 1960 1970 1980 1990 2000
U.S. Private Sector
State and Local Governments
figure 1Average Compensation in Real 2008 Dollars
20951_CATOpages.qxd 1/20/10 1:00 PM Page 89

90
Cato Journal
tabl
e 1
Th
e G
ap b
etw
een
Publ
ic a
nd P
riva
te S
ecto
r C
ompe
nsat
ion
(Jun
e 20
09D
olla
rs p
er H
our
Wor
ked)
AB
Stat
e an
d L
ocal
C
ompe
nsat
ion
Item
Priv
ate
Sect
orSt
ate
and
Loc
alA
dvan
tage
Wor
kers
Wor
kers
col.
B /
col.
A
Tot
al C
ompe
nsat
ion
$27.
42$3
9.66
1.45
Wag
es a
nd s
alar
ies
19.3
926
.01
1.34
Ben
efits
8.02
13.6
51.
70Pa
id le
ave
1.85
3.27
1.77
Supp
lem
enta
l pay
0.83
0.34
0.41
Hea
lth in
sura
nce
1.99
4.34
2.18
Oth
er in
sura
nce
0.14
0.17
1.21
Def
ined
ben
efit
retir
emen
t pla
n0.
412.
856.
95D
efin
ed c
ontr
ibut
ion
retir
emen
t pla
n0.
530.
310.
58L
egal
ly r
equi
red
2.26
2.36
1.04
Sour
ce: U
.S. B
urea
u of
Lab
or S
tatis
tics.
20951_CATOpages.qxd 1/20/10 1:00 PM Page 90

91
each component of compensation in 2008. These data show a muchlarger gap between average public and average private sector com-pensation than the BEA data.
In June 2009, total compensation per hour was $39.66 in the pub-lic sector, which was 45 percent greater than the average $27.42 perhour in the private sector. The public sector advantage in averagewages was 34 percent, while the advantage in benefits was a huge 70percent.
These BLS data allow a public-private comparison for three broadoccupational groups: “management and professional,” “sales andoffice,” and “service.” For the first occupational group, average pub-lic and private compensation was similar, but public sector workershad a large compensation advantage in the latter two occupationalgroups.
Why is the public sector compensation advantage much larger inthe BLS data than the BEA data discussed above? One importantreason is that public sector employees work substantially fewer hoursthan do private sector employees. The BLS National CompensationSurvey (BLS 2009c: Tables 4 and 5) shows that full-time private sec-tor workers averaged 2,050 hours of work in 2008, or 12 percentmore than the 1,825 hours worked by the average public sectorworker.
Let’s go back to the data in Table 1. They reveal that the largestpublic sector compensation advantages are in health insurance,defined benefit retirement plans, and paid leave. These advantagesare due to the greater generosity of public sector benefit packagesand the fact that more public employers offer those benefits.
The BLS (2009b) provides data on the share of employers whooffer various types of benefit. The advantages of public sectoremployment include:
• Health care benefits are available to 71 percent of private sectoremployees but 88 percent of public sector employees.
• Retirement plans (defined-benefit or defined-contribution) areavailable to 67 percent of private sector employees but 90 per-cent of public sector employees. Among full-time employees,the shares rise to 76 percent and 99 percent, respectively.
• Life insurance benefits are available to 59 percent of private sec-tor employees but 80 percent of public sector employees.
• Paid sick leave is available to 61 percent of private sectoremployees but 89 percent of public sector employees.
Public Sector Unions and Compensation
20951_CATOpages.qxd 1/20/10 1:00 PM Page 91

92
Cato Journal
Many state and local governments have expanded their workerretirement benefits during the last couple of decades. Because mostpublic sector workers receive defined-benefit pensions, policymakershave been able to expand promised benefits without incurring a largeshort-term budget impact. However, generous benefit packages havecreated large unfunded liabilities in employee retirement plans, asdiscussed below. As with the BEA compensation data, the BLS dataunderstate the full cost of current employee benefits to the extent ofunderfunding in state and local pension and retiree health care plans.
Public sector retirement plans are usually more generous thanthose in the private sector. The annual benefit of the median publicsector defined-benefit pension is more than twice the benefit in themedian private plan (Pew 2007: 11). One factor driving that differ-ence is that nearly all public sector defined-benefit plans calculatebenefits based on earnings during the last one to three years of work(Braden and Hyland 1993: 19). By contrast, private sector definedbenefit plans are more likely to use a lower-cost approach, such asbasing benefits on career-average earnings.
Another difference between public and private compensationregards retiree health benefits. In the public sector, employees canretire early—usually at age 55—and then enjoy years of health carecoverage at taxpayers’ expense before Medicare kicks at age 65. Suchretiree health care coverage is a very rare perk in the private sector.
Aside from all these monetary benefits of public sector employ-ment, there is one very important nonmonetary benefit of workingfor the government: very high job security. During good times andbad, BLS data show that “layoffs and discharges” in the public sectoroccur at just one-third the rate as in the private sector (BLS 2009e).4
Public sector workers rarely get fired for poor performance or laidoff because of employer cost-cutting, but those events occur fre-quently in the private sector.
Finally, there is a very good market indicator of the generosity ofcompensation in the public sector: voluntary job-quit rates. If anindustry has a low quit rate, it indicates that compensation is morethan adequate to attract qualified workers. The BLS (2009e) has dataon employee quit rates across industries, and over the years the quitrate among public sector workers has been just one-third the quitrate in the private sector. With the poor economy in 2009, quit rates4See www.bls.gov/jlt for detailed data. Between 2001 and 2009, the public sectorlayoff and discharge rate averaged just 30 percent of the private sector rate.
20951_CATOpages.qxd 1/20/10 1:00 PM Page 92
93
Public Sector Unions and Compensation
fell in both the private and public sectors, but the public sector rateremained at just one-third the rate in the private sector.
Pension ScandalsSo far I’ve focused on public sector compensation as reflected in
national statistics, but those statistics tell only part of the story. Inrecent years, many news articles have highlighted examples of pub-lic sector pay packages—particularly pensions—that often seemgrossly excessive. These excessive public pensions may not bereflected in official statistics on compensation because they reflectfuture costs, not current costs. Some of the excessive aspects of pub-lic sector pensions include:
• Early Retirement. Public sector workers generally retire earlierthan workers in the private sector and then enjoy generous pen-sion benefits for life. The great majority of public sector workerscan retire at 55 or earlier as long as they have fulfilled a years-of-service requirement, which is usually 30 years. Writing in a BLSpublication, Arlene Dohm (2000: 21) notes that “most govern-ment employees are covered under defined benefit pensionplans that provide the maximum economic benefits to thosewho retire at the earliest possible age of pension eligibility.” InCalifornia, for example, lawmakers greatly expanded the gen-erosity of public pensions in 1999. According to the San DiegoUnion-Tribune (June 16, 2009), the law lowered the retirementages for public employees to 50 for public safety workers and 55for other workers, and increased annual benefit amounts. Forexample, public safety workers can retire after only 20 years ofservice with 60 percent of income or after 30 years of servicewith 90 percent (Weintraub 2004). Today, the state’s plan,CalPERS, is massively underfunded and the 1999 pension billhas cost far more than expected.
• Double Dipping. In many states (such as New Jersey, California,and Utah), public sector workers can “retire” early and then pro-ceed to take a new public sector job, and thus receive a fullsalary and generous pension at the same time (Heath 2009). Arecent article explained this problem in Utah’s government plan:“Auditors said double dipping has created an incentive foremployees to retire early and return to work so they can collecttheir pension, salary, and a generous 401(k) payment. That costs
20951_CATOpages.qxd 1/20/10 1:00 PM Page 93

94
Cato Journal
the retirement system money for two reasons: First, because theemployee draws a pension from the retirement fund for moreyears, and second, because there is no contribution to the retire-ment system on behalf of the re-employed worker” (Gehrke2009).
• Pension Spiking. In some jurisdictions, government workers canartificially inflate their pension earnings by pulling strings to getthemselves big raises in their final year of work or putting inovertime in their final year. This is called “pension spiking.” InSacramento, for example, the recently retired police chief engi-neered a 20 percent raise for himself soon before he retired,which had the effect of pushing his annual pension to $173,000a year, or 90 percent of his final salary (Breton 2009).
• Disability Claims. Excessively generous and fraudulent claimsfor disability by public workers is a growing problem. In an arti-cle in Forbes, Stephane Fitch (2009) noted that in Nevada “heartdisease among uniformed safety workers is job-related. . . .Veteran Las Vegas firemen hobbled by heart disease can collectan inflation-protected $40,000 a year for life on top of their pen-sion. That applies even if they’re healthy enough to work inanother occupation.” Jonathan Walters (2007), in an article inGoverning magazine, noted that rising disability costs are a bigproblem: “Across the country, hundreds of local governmentsand several states are wrestling with what some view as out-of-control disability pension and health insurance systems hard-wired to allow police and fire personnel to retire early and withvery generous benefits. At the same time, they may pursue otherfull-time careers, often in fields similar to the one that they aban-doned when they left public service.”
• Excessive Pension Benfits. Many recent articles have focused onexamples of apparently excessive pensions of public sectoremployees, mayors, city council members, and governmentadministrators. In California, there are an enormous 6,144retired public employees in the CalPERS system who arereceiving annual pensions of more than $100,000 a year, andanother 3,090 retired teachers in the state’s teachers retirementplan who are in the “$100,000 pension club.”5
5A searchable database of recipients is available at http://californiapensionreform.com.
20951_CATOpages.qxd 1/20/10 1:00 PM Page 94

95
Public Sector Unions and Compensation
• Overpromising Benefits. Like California, many other statesincreased their already generous employee retirement benefitsduring the stock market boom of the 1990s, and they are nowsuffering the consequences. Pennsylvania’s troubles are typical.Taxpayers are facing large increases because at the end of theboom nine years ago, “lawmakers … awarded themselves a 50percent pension boost and then extended a 25 percent raise to340,000 state and school workers . . . at the same time, theydecided to vest employees at five years’ rather than 10 years’service” (Erdley 2005).
• Pay-to-Play Corruption. The reliance of state and local govern-ments on defined-benefit pension plans has resulted in govern-ments holding huge financial portfolios. That has encouraged“pay-to-play” influence-peddling schemes whereby Wall Streetfirms bribe public officials in order to get a slice of the govern-ment’s financial business. New York’s public pension fund, forexample, is currently engulfed in scandal, as reported by theWall Street Journal: “Money manager Elliott Broidy onThursday admitted to making nearly $1 million in gifts to bene-fit four former top officials in the office that oversees New Yorkstate’s pension fund, including onetime state comptroller AlanHevesi” (Karmin and Lattman 2009). A good way to tackle suchcorruption would be to drain the swamp—transition govern-ment workers from defined-benefit pension plans to defined-contribution plans, which would avoid the problem of publicofficials having to actively manage vast pools of pension cash.
A recent Forbes article (Fitch 2009) on a Florida policeman is rep-resentative of today’s public sector compensation excesses:
Glenn Goss … retired four years ago, at 42, from a $90,000job as a police commander in Delray Beach, Fla. He imme-diately began drawing a $65,000 annual pension that is guar-anteed for life, is indexed to keep up with inflation and comeswith full health benefits. Goss promptly took a new job aspolice chief in nearby Highland Beach. One big lure: thebenefits. Given that the average man his age will live to 78,Goss is already worth nearly $2 million, based on the presentvalue of his vested retirement benefits. Looked at anotherway, he is a $2 million liability to Florida taxpayers.
20951_CATOpages.qxd 1/20/10 1:00 PM Page 95
96
Cato Journal
Unfortunately, the type of absurd benefits provided to workerssuch as Glenn Goss is pushing many governments to fiscal ruin. Arecent Cato Institute paper chronicled how Vallejo, California,declared bankruptcy in 2008 because of the crushing costs of com-pensation increases (Bellante, Denholm, and Osorio 2009). Othertowns and cities are also on the brink of bankruptcy (Siedle 2009).The website www.pensiontsunami.com has collected hundreds ofnews articles on excesses in public sector compensation and pensionsthat indicate the widespread nature of the problem.
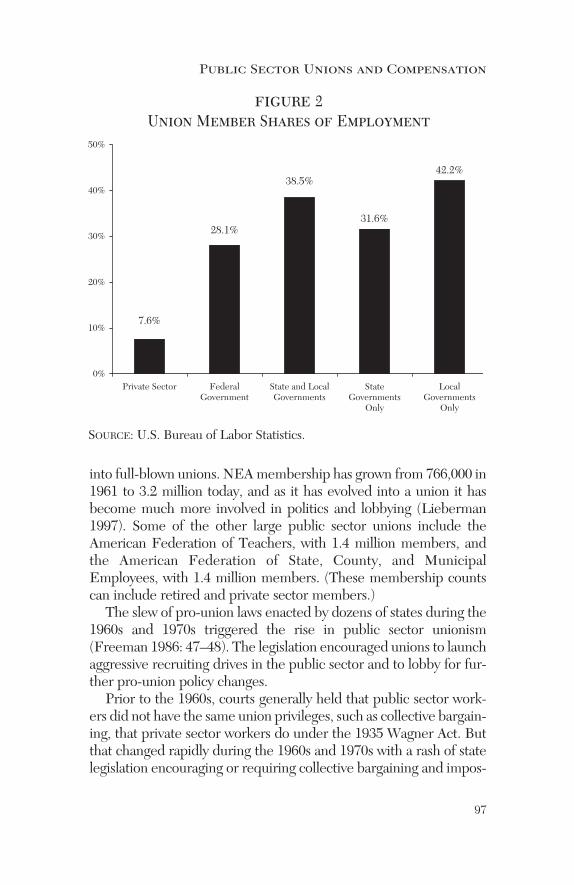
Growth in Public Sector UnionsFigure 2 shows BLS data on the shares of public and private
employees that are members of unions (BLS 2009a). In 2008, 38.5percent of all state and local workers were members of unions, whichis five times the union share in the U.S. private sector of 7.6 percent.The share of state and local government workers who are repre-sented by unions was slightly higher at 42.3 (Some workers who arerepresented by unions are not union members).
With the inclusion of federal workers, public sector union mem-bers totaled 7.8 million in 2008, which was almost half of the 16.1million total union members in the nation. Local governments havethe largest group of public sector union members. About one-thirdof all local government workers are in education, and about two-thirds of those workers are members of unions. Police and firedepartments are also heavily unionized with union member shares ofalmost 60 percent (see Farber 2005).
Figure 3 shows the union member shares in the public and privatesectors in recent decades.6 While the private sector share has plum-meted, the state and local shares have remained high at just over 30percent and 40 percent, respectively. Data on public sector unionmembership before the 1980s are sketchy, but it appears that theshare rose from less than 15 percent of the state and local govern-ment workforce in the 1950s to the current high levels by the late-1970s (Freeman 1986: 45).
Part of that increase was accounted for by the conversion of “pro-fessional associations,” such at the National Education Association,
6Data are from www.unionstats.org, which is based on information from the U.S.Bureau of Labor Statistics.
20951_CATOpages.qxd 1/20/10 1:00 PM Page 96
97
into full-blown unions. NEA membership has grown from 766,000 in1961 to 3.2 million today, and as it has evolved into a union it hasbecome much more involved in politics and lobbying (Lieberman1997). Some of the other large public sector unions include theAmerican Federation of Teachers, with 1.4 million members, andthe American Federation of State, County, and MunicipalEmployees, with 1.4 million members. (These membership countscan include retired and private sector members.)
The slew of pro-union laws enacted by dozens of states during the1960s and 1970s triggered the rise in public sector unionism(Freeman 1986: 47–48). The legislation encouraged unions to launchaggressive recruiting drives in the public sector and to lobby for fur-ther pro-union policy changes.
Prior to the 1960s, courts generally held that public sector work-ers did not have the same union privileges, such as collective bargain-ing, that private sector workers do under the 1935 Wagner Act. Butthat changed rapidly during the 1960s and 1970s with a rash of statelegislation encouraging or requiring collective bargaining and impos-
Public Sector Unions and Compensation
31.6%
42.2%
7.6%
38.5%
28.1%
0%
10%
20%
30%
40%
50%
Private Sector StateGovernments
Only
State and LocalGovernments
FederalGovernment
LocalGovernments
Only
SOURCE: U.S. Bureau of Labor Statistics.
figure 2Union Member Shares of Employment
20951_CATOpages.qxd 1/20/10 1:00 PM Page 97

98
Cato Journal
ing various “union security” provisions, such as mandatory uniondues (Farber 2005: 15).
Princeton University’s Henry Farber (2005) has documented therise in public sector union legislation passed since the 1950s in greatdetail. He finds that the number of states allowing collective bargain-ing for public sector workers jumped from 1 in 1955 to 10 in 1965.Trendsetter New York City granted collective bargaining privileges tonearly all city workers in 1958 (O’Neal and McMahon 2007: 4).
By 1970, about half of state government workers in the nation hadcollective bargaining privileges and more than half the states allowedcollective bargaining for local government workers. Pro-union legis-lation advanced further during the 1970s, but then around 1980 theadvance slowed and union rules have remained fairly stable sincethen. Today, 26 states have collective bargaining for essentially allstate and local employees, and a further 12 states have collective bar-gaining for a portion of their public sector workers. The remaining12 states do not have collective bargaining in the public sector (GAO2002: 8).
0%
10%
20%
30%
40%
50%
1962 20071967 1972 1977 19871982 19971992 2002
U.S. Private Sector
State Governments
Local Governments
SOURCE: U.S. Bureau of Labor Statistics.
figure 3Union Member Shares of Employment
20951_CATOpages.qxd 1/20/10 1:00 PM Page 98

99
Official histories of unions describe the dramatic changes of the1960s and 1970s. From the AFT website:
Another challenge of the sixties was the battle for collectivebargaining rights. The age of teacher militancy began inNovember 1960 with a one-day walkout of the UnitedFederation of Teachers of New York City; two years later theUFT won the first comprehensive teacher contract in thecountry. The events in New York City spawned more than300 teacher strikes throughout the country in that decade,and the national AFT grew from under 60,000 members in1960 to more than 200,000 by 1970. The sixties also saw thefirst major strike by university professors in the UnitedStates…. In 1969, the UFT led the way for other AFT localswhen it successfully won the right to represent 10,000 para-professionals in New York City. In the years that followed,the AFT organized thousands of paraprofessionals andschool-related personnel in the nation’s schools.7
AFSCME’s official history describes similar growth and similaraggressive tactics:
In 1958, a series of strikes and demonstrations forced themayor of New York City to grant collective bargaining rightsto unions representing city employees. A turning point hadbeen reached. The desire for collective bargaining becameAFSCME’s driving force. . . . By the end of 1969, severalstates had enacted collective bargaining laws and the union’smembership grew to more than 250,000…. In the 1970s and80s, AFSCME members increased their efforts politically inorder to win collective bargaining laws, organize new mem-bers, and wield clout on behalf of existing members. Allacross the country, at every level of government, candidatesfor public office learned they had to pay attention toAFSCME’s political muscle.8
These are some of the reasons for the initial growth in public sec-tor unionism, but what has sustained it at a high level while private
Public Sector Unions and Compensation
7American Federation of Teachers, “History,” www.aft.org/about/history/index.htm.8American Federation of State, County, and Municipal Employees, “AFSCME:75 Years of History,” www.afscme.org/about/1028.cfm.
20951_CATOpages.qxd 1/20/10 1:00 PM Page 99

100
Cato Journal
sector unionism has declined? First, public sector agencies tend tobe static so that once a union has organized a group of workers theytend to stay organized. By contrast, the private sector is dynamic withbusinesses going bankrupt frequently and new businesses arising.Since all new businesses start out nonunion, constant organizingefforts are needed to sustain the union rate in the private sector.“Unions in the public sector can maintain membership levels withless new organizing than is required in the private sector” (Farber2005: 11).
Second, many services provided by the government are legalmonopolies, such as police and fire services. The result is that con-sumers generally don’t have the option of abandoning unionizedpublic services if they become too high-cost and inefficient, as theycan with private services.
Third, there are few downsides to aggressive union tactics in thepublic sector. Public sector unions lobby for higher pay and highergovernment spending on activities that benefit them. When that lob-bying leads to higher costs for the government, the burden is borneby someone else—the taxpayers. By contrast, private sector unionsneed to keep in mind that higher business costs may result in lostsales and fewer jobs. Private sector union members are constrainedby concerns about their job security, but there is no such constraintin the public sector.
Variations in Public Sector CompensationTable 1, above, presented BLS data showing compensation differ-
ences between public and private sector workers. To shed furtherlight on public sector compensation, the BLS provided me with anunpublished tabulation that breaks out the public sector workforcebetween union and nonunion. Table 2 presents the results.
Unionized public sector workers have far higher wages and bene-fits, on average, than nonunionized public sector workers. Theirwages are 31 percent higher, on average, and their benefits are 68percent higher. Overall, the union compensation advantage in thepublic sector is 42 percent.
Of course, a substantial part of this union-nonunion differencerelates to variations in compensation levels across the country. High-wage states in the northeast, for example, tend to be more unionized.The BLS provided me another unpublished set of tables that show
20951_CATOpages.qxd 1/20/10 1:00 PM Page 100

101
Public Sector Unions and Compensation
tabl
e 2
Publ
ic S
ecto
r C
ompe
nsat
ion:
Uni
on v
s. N
onun
ion
(Jun
e 20
09D
olla
rs p
er H
our
Wor
ked)
AB
Uni
on
Com
pens
atio
n It
emSt
ate
and
Loc
alSt
ate
and
Loc
alA
dvan
tage
Non
unio
nU
nion
col.
B /
col.
A
Tot
al C
ompe
nsat
ion
$33.
33$4
7.46
1.42
Wag
es a
nd s
alar
ies
22.8
629
.90
1.31
Ben
efits
10.4
717
.57
1.68
Paid
leav
e2.
634.
061.
54Su
pple
men
tal p
ay0.
260.
451.
73H
ealth
insu
ranc
e3.
075.
911.
93O
ther
insu
ranc
e0.
120.
221.
83D
efin
ed b
enef
it re
tirem
ent p
lan
1.94
3.98
2.05
Def
ined
con
trib
utio
n re
tirem
ent p
lan
0.36
0.25
0.69
Leg
ally
req
uire
d2.
092.
701.
29
Sour
ce: U
.S. B
urea
u of
Lab
or S
tatis
tics.
Unp
ublis
hed
data
.
20951_CATOpages.qxd 1/20/10 1:00 PM Page 101

102
Cato Journal
regional variations in public sector compensation. I summarized thedata in Table 3, which is rank-ordered by state and local worker com-pensation in 2009 (the second column).
The first thing to note is the dramatic variation in public sectorcompensation across the Census regions. In the Pacific region, publicsector workers are paid an average $49.02 per hour, which is 60 per-cent greater than the $30.73 paid in the West South Central region.
The third column in Table 3 shows the public sector compensa-tion advantage over the private sector within each region. Public sec-tor workers earned substantially more, on average, than privatesector workers in all regions of the country. But the public sectoradvantage was particularly high in the Pacific, Middle Atlantic, EastNorth Central, and East South Central regions.
The BEA publishes state and local government compensation databy state.9 Table 4 shows the average compensation (wages and bene-fits) by state, ranked from highest to lowest.10 California tops theranking with average public sector compensation of $86,417, whichwas 64 percent higher than average compensation in the bottom-ranked state of Kentucky.
Union Members by StateLet’s take a look at public sector union membership by state.
Table 5 shows the estimated share of state and local governmentworkers who were union members in 2008. To derive these data, Ifirst took data on total federal, state, and local government unionmembers from the website www.unionstats.org, which is tabulatedfrom the BLS Current Population Survey. I then subtracted esti-mated federal union members from the total.
The states with the highest estimated shares of state and localunion members are New York, Rhode Island, Hawaii, New Jersey,and Connecticut. The states with the lowest union member shares areNorth Carolina, South Carolina, Mississippi, Virginia, and Georgia.
The union share of public sector employment across the states isstrongly correlated with the presence of favorable union legislation,including collective bargaining rules and “union shop” and “agency
9Data are from the U.S. Bureau of Economic Analysis, Regional EconomicAccounts (www.bea.gov/regional/spi).10The average is based on employment measured by full-time equivalents, whichis available from the Bureau of the Census.
20951_CATOpages.qxd 1/20/10 1:00 PM Page 102

103
Public Sector Unions and Compensation
tabl
e 3
Reg
iona
l V
aria
tion
s in
Pri
vate
vs.
Pub
lic
Sect
or C
ompe
nsat
ion
(Tot
al C
ompe
nsat
ion
per
Hou
r W
orke
d, J
une
2009
Dol
lars
)
AB
Stat
e an
d L
ocal
R
egio
ns
Priv
ate
Sect
orSt
ate
and
Loc
alA
dvan
tage
Stat
es in
Reg
ion
Wor
kers
Wor
kers
col.
B /
col.
A
Paci
fic$3
0.78
$49.
021.
59A
lask
a, C
alifo
rnia
, Haw
aii,
Ore
gon,
Was
hing
ton
Mid
dle
Atla
ntic
31.6
948
.53
1.53
New
Jer
sey,
New
Yor
k,Pe
nnsy
lvan
iaN
ew E
ngla
nd33
.29
43.2
21.
30C
onne
ctic
ut, M
aine
,M
assa
chus
etts
, New
Ham
pshi
re,
Rho
de I
sland
, Ver
mon
tE
ast N
orth
Cen
tral
26.7
243
.00
1.61
Illin
ois,
Indi
ana,
Mic
higa
n, O
hio,
Wisc
onsin
Mou
ntai
n26
.18
36.1
41.
38A
rizon
a, C
olor
ado,
Ida
ho,
Mon
tana
, Nev
ada,
New
Mex
ico,
Uta
h, W
yom
ing
Sout
h A
tlant
ic25
.33
34.9
01.
38D
elaw
are,
D.C
., F
lorid
a, G
eorg
ia,
Mar
ylan
d, N
orth
Car
olin
a, S
outh
Car
olin
a, V
irgin
ia, W
est V
irgin
ia(c
ontin
ued)
20951_CATOpages.qxd 1/20/10 1:00 PM Page 103

104
Cato Journal
tabl
e 3
(con
t.)R
egio
nal
Var
iati
ons
in P
riva
te v
s. P
ubli
c Se
ctor
Com
pens
atio
n(T
otal
Com
pens
atio
n pe
r H
our
Wor
ked,
Jun
e 20
09D
olla
rs)
AB
Stat
e an
d L
ocal
R
egio
ns
Priv
ate
Sect
orSt
ate
and
Loc
alA
dvan
tage
Stat
es in
Reg
ion
Wor
kers
Wor
kers
col.
B /
col.
A
Eas
t Sou
th C
entr
al$2
0.76
$32.
141.
55A
laba
ma,
Ken
tuck
y, M
ississ
ippi
,T
enne
ssee
Wes
t Nor
th C
entr
al25
.35
32.0
01.
26Io
wa,
Kan
sas,
Min
neso
ta,
Miss
ouri,
Neb
rask
a, N
orth
Dak
ota,
Sou
th D
akot
aW
est S
outh
Cen
tral
24.3
530
.73
1.26
Ark
ansa
s, L
ouisi
ana,
Okl
ahom
a,T
exas
Sour
ce: U
.S. B
urea
u of
Lab
or S
tatis
tics.
Unp
ublis
hed
data
.
20951_CATOpages.qxd 1/20/10 1:00 PM Page 104

105
Public Sector Unions and Compensation
tabl
e 4
Ave
rage
Ann
ual
Com
pens
atio
n fo
r St
ate
and
Loc
al G
over
nmen
t E
mpl
oyee
s, 2
008
Cal
iforn
ia$8
6,41
7 D
elaw
are
$66,
982
Neb
rask
a$5
7,94
9 C
onne
ctic
ut82
,457
C
olor
ado
66,5
76
Idah
o57
,278
N
evad
a80
,094
N
ew M
exic
o64
,432
N
ew H
amps
hire
57,0
35
New
Jers
ey78
,674
Vi
rgin
ia64
,182
N
orth
Car
olin
a57
,010
W
ashi
ngto
n76
,544
U
tah
63,4
06
Sout
h D
akot
a56
,985
N
ew Y
ork
74,6
15
Ariz
ona
62,3
15
Miss
ouri
56,4
63
Mar
ylan
d74
,054
Io
wa
62,0
90
Texa
s56
,309
R
hode
Isla
nd73
,827
Fl
orid
a61
,367
Al
abam
a55
,503
H
awai
i71
,883
O
hio
61,3
46
Mai
ne55
,034
O
rego
n70
,909
W
yom
ing
61,0
80
Geo
rgia
54,7
22
Min
neso
ta69
,901
So
uth
Car
olin
a60
,870
Te
nnes
see
54,6
99
Mic
higa
n69
,577
O
klah
oma
60,5
55
Arka
nsas
53,7
25
Wisc
onsin
69,4
49
Mon
tana
60,4
35
Indi
ana
53,4
01
Alas
ka69
,257
Lo
uisia
na60
,227
K
ansa
s52
,958
Ill
inoi
s68
,625
Ve
rmon
t59
,782
M
ississ
ippi
52,7
79
Mas
sach
uset
ts68
,544
Pe
nnsy
lvan
ia59
,657
K
entu
cky
52,5
65
Wes
t Virg
inia
67,3
54N
orth
Dak
ota
59,2
44
Sour
ces:
BE
A c
ompe
nsat
ion
data
; Cen
sus
empl
oym
ent d
ata,
whi
ch a
re in
full-
time
equi
vale
nts.
20951_CATOpages.qxd 1/20/10 1:00 PM Page 105

106
Cato JournalCato Journal
tabl
e 5
Est
imat
ed U
nion
Mem
ber
Shar
es o
f St
ate
and
Loc
al G
over
nmen
t E
mpl
oym
ent,
200
8
New
Yor
k 75
.5%
V
erm
ont
42.5
%
Idah
o 14
.3%
R
hode
Isla
nd
68.8
Mon
tana
42
.3
Ken
tuck
y 14
.2
Haw
aii
68.1
O
hio
42.2
A
rkan
sas
14.1
N
ew J
erse
y 67
.3
Del
awar
e 40
.2
Nor
th D
akot
a 13
.9
Con
nect
icut
66
.7
Nev
ada
37.9
T
enne
ssee
13
.4
Ala
ska
66.4
M
aryl
and
33.0
So
uth
Dak
ota
13.4
M
assa
chus
etts
65
.9
Iow
a 31
.6
Tex
as
12.6
O
rego
n 65
.1
Ala
bam
a 30
.2
New
Mex
ico
12.5
C
alifo
rnia
61
.9
Flo
rida
27.9
U
tah
12.3
M
ichi
gan
61.4
In
dian
a 27
.3
Wyo
min
g 10
.8
Penn
sylv
ania
58
.5
Neb
rask
a 27
.2
Lou
isian
a 10
.8
Min
neso
ta
58.2
W
est V
irgin
ia
24.8
N
orth
Car
olin
a 8.
2 W
ashi
ngto
n 55
.9
Miss
ouri
22.1
So
uth
Car
olin
a 8.
2 Il
linoi
s 53
.8
Col
orad
o 20
.7
Miss
issip
pi
6.0
New
Ham
pshi
re
51.4
A
rizon
a 17
.3
Virg
inia
5.
2 W
iscon
sin
49.8
O
klah
oma
15.5
G
eorg
ia
4.2
Mai
ne
48.2
K
ansa
s 14
.6
Sour
ce: A
utho
r’s e
stim
ates
bas
ed o
n B
LS
data
com
pile
d by
ww
w.u
nion
stat
s.org
.
20951_CATOpages.qxd 1/20/10 1:00 PM Page 106

107
shop” provisions (see Farber 2005). Union shop provisions requireemployees to become dues-paying members of unions, while agencyshop provisions require workers to either join the union or pay a feeto the union. Today, 22 states have “right-to-work” laws, which out-law union and agency shop provisions in union contracts (Farber2005: 14).11 In right-to-work states, workers cannot be forced to joina union or pay union dues. These states generally have substantiallylower union shares than do other states (Farber 2005: 20).
Across the states, public sector collective bargaining laws rangefrom an outright ban on the activity to actively requiring it. Some ofthe most pro-union states also allow public sector strikes and somehave mandatory arbitration, which usually works in favor of theunions. Note that union rules can vary within states for differenttypes of public sector worker. For example, teachers are more likelyto be allowed to strike than police or fire service employees.
Collective bargaining laws also affect the level of union member-ship. In states where collective bargaining is prohibited, such asVirginia, just 17 percent of state and local workers are unionized, onaverage (Farber 2005: 20). In states where there is a duty for stateand local employers to bargain with a union, half or more of the pub-lic sector is unionized.
Do Public Sector Unions Increase Compensation?This article has looked at data suggesting that public sector work-
ers generally do very well with regard to their level of compensation.But does the presence of unions in the public sector workforce raisecompensation levels above what they would otherwise be?
Statistical studies have consistently found that union members inthe private sector receive a wage premium as a result of their unionmembership of about 15 percent or more (Hirsch and Macpherson2007). Some studies have found that the union wage premium issomewhat lower in the public sector than in the private sector.12
Some of these studies have looked just at wages and not benefits,which is a crucial part of the public sector advantage.
I estimated a simple OLS regression model to explore the effectof unionism on public sector compensation. The model is cross-sec-tional, using data for the 50 states in 2008. The model is as follows:
Public Sector Unions and Compensation
11See also www.nrtw.org/rtws.htm.12For a discussion of the literature, see Freeman (1986: 47–48).
20951_CATOpages.qxd 1/20/10 1:00 PM Page 107

108
Cato Journal
(1) GovComp � � � �1 PrivComp � �2 UnionShare � �
where:
GovComp is the average compensation (wages and benefits) forstate and local employees in a state.PrivComp is the average compensation for private sector employ-ees in a state.13
UnionShare is the share of state and local government employeeswho are union members.
The coefficient of PrivComp is expected to be positive becausehigher private sector compensation in a state would likely promptofficials to offer higher compensation to public workers.
The coefficient of UnionShare is expected to be positive becausethe higher the union share, the more leverage public sector workershave over the political process of setting compensation.
The BEA publishes state-by-state data on total compensation andnumber of employees in the private sector and state and local gov-ernments.14 The public sector unionization rate is estimated fromdata on www.unionstats.org, which is based on the BLS CurrentPopulation Survey. I removed the estimated number of federalunion members from the public sector union member count.15
The estimated model is as follows:
(2) GovComp � 19,992 � 0.57 PrivComp(4.6) (6.0)� 11,672 UnionShare
(3.5)
F-statistic � 55R-Square � 0.70
The results are highly statistically significant. The t-statistics (inparentheses) and F-statistic indicate significance above the 99 percentlevel. The R-square indicates that the two variables explained 70 per-cent of the variation across the states in public sector compensation.
13The private sector workforce excludes self-employed persons in order to pro-vide an apples-to-apples comparison with the public sector workforce.14Data are from the U.S. Bureau of Economic Analysis, Regional EconomicAccounts (www.bea.gov/regional/spi). 15To remove federal union members, I assumed that the share of union memberswas a fixed 28 percent across the states, which is the national share in the federalworkforce per CPS data.
20951_CATOpages.qxd 1/20/10 1:00 PM Page 108

109
The coefficients on the explanatory variables had the expectedsigns. The coefficient on the union share variable indicates, for exam-ple, that if the public sector unionization share in a state increased by10 percentage points, it would lead to higher annual average publicsector compensation of about $1,167.
What would be the difference in compensation between twostates that had unionization rates of 0 percent and 39 percent? Basedon the UnionShare coefficient, the difference in annual averagecompensation between the two states would be $4,552. Given thataverage public sector compensation in 2008 was $56,040 in this BEAdataset, that union difference would amount to an 8.1 percent aver-age compensation difference.
The U.S. average state and local unionization rate is 39 percent,thus the results suggest that public sector unionism pushes up thecost of the U.S. state and local workforce about the same 8.1 percent.Given that annual state and local compensation is $1.1 trillion in2008, that union compensation premium costs taxpayers about $89billion a year.
In sum, the results indicate that the union compensation premiumfor public sector workers may be less than the union premium in theprivate sector, as other studies have indicated. However, the dataindicate that public sector employees are well compensated in gen-eral, and so an 8 percent premium represents a substantial andunneeded additional cost to taxpayers.
Furthermore, note that the costs of public sector unionization forstates with high unionization rates are larger. California’s 62 percentunionization rate, for example, translates into a statewide boost inpublic sector compensation costs of more than 10 percent, accordingto these regression results.
Finally, these estimates do not take into account the rising levelsof unfunded costs in state and local retirement plans. The regressionestimates reflect current compensation costs of government workers,but we know that the costs of benefit plans are scheduled to rise rap-idly in many states in coming years.
States Face Large Fiscal Challenges The recent recession has created fiscal challenges for state and
local governments across the nation, but these troubles are just a prel-ude to larger problems ahead. State spending on Medicaid and other
Public Sector Unions and Compensation
20951_CATOpages.qxd 1/20/10 1:00 PM Page 109

110
Cato Journal
programs is soaring, state debt is rising rapidly, and many govern-ments face huge underfunding in their pension and health care plans.
To solve these problems, governments will need to make majorbudget reforms and cuts. As noted, employee compensation repre-sents half of all state and local spending. As such, compensation willbe a major policy battleground in the years ahead involving taxpay-ers, workers, unions, and elected officials.
Consider the problem of rising government debt. State and localdebt outstanding soared from $1.2 trillion in 2000 to $2.3 trillion in2009—a 92 percent increase (Federal Reserve Board 2009: TableD.3). Governments are increasingly using debt to fund investmentsthat used to be funded on a pay-as-you-go basis, and some govern-ments are using debt to cover routine operating costs. Rising debt lev-els will make future state and local budgeting that much moredifficult.
In addition to this explicit debt, governments have built up largeliabilities in employee pension plans. Officially, state pension plansare currently underfunded by about $1 trillion and many have fund-ing levels far below the lowest level considered adequate of 80 per-cent (The Economist 2009). The pension system for 365,000 Illinoisteachers, for example, has only a 35 percent funding level, accordingto a recent actuarial report (McNichol 2009). The down stock mar-ket in recent years has hit pension funds hard. ButPricewaterhouseCoopers calculated that even with strong marketgrowth in coming years, public pension systems will continue to behugely underfunded (Cho 2009). Note that the pension problem isnot really “underfunding,” but the “overpromising” of benefits thatthe states cannot afford.
One problem is that public pension plans have used very opti-mistic assumptions to value future liabilities, a practice financierWarren Buffett has called “accounting nonsense” (Cho 2008).Buffett argues that public pension plans are “ticking time bombs”that are ready to explode in many states as baby boomers begin toretire (Cho 2009). To pick one small example, annual taxpayer con-tributions to the teacher pension fund in Vermont jumped from $24million to $64 million in the last six years, and “the cost of retirementbenefits for public workers is threatening to swallow up the statebudget” (Burlington Free Press 2009).
A recent study by Robert Novy-Marx and Joshua Rauh (forthcom-ing) found that state and local governments are “severely underesti-
20951_CATOpages.qxd 1/20/10 1:00 PM Page 110

111
Public Sector Unions and Compensation
mating” their future pension liabilities by using high discount rates.Using more realistic assumptions, the authors found that at the endof 2008, state and local pension plans were underfunded by $3.2 tril-lion, or three times more than the officially reported amount. Thatrepresents a shortfall of $21,500 for every U.S. household accordingto the authors, indicating the possible exposure to taxpayers if theseplans are not cut.
Governments have also built up large unfunded obligations intheir employee health plans. Most state and local governments pro-vide health care coverage to retired employees, but these plans aretypically completely unfunded. In other words, they have not put anyassets aside to cover future benefits. My colleague JagadeeshGokhale and I have estimated that these unfunded health care obli-gations total at least $1.4 trillion nationwide (Edwards and Gokhale2006). In California, the annual cost of public employee retirementhealth care is expected to skyrocket from $3.4 billion in 2005 to anestimated $31.4 billion by 2020 (Boyken 2007).
The upshot of all this is that policymakers will need to make largebudget reforms in the years ahead. They will to need to deliver pub-lic services more efficiently, to privatize services when feasible, to cutstaffing levels, and to terminate low-value programs. Policymakersoften hesitate in making such reforms, but the high level of unioniza-tion in many state workforces will make reforms even harder toachieve. During labor negotiations, for example, public officials oftensuccumb to pressure to make short-term concessions that end updamaging public finances in the long run.
Unions reduce the ability of government managers to cut costs andincrease efficiency in many ways. They protect poorly performingworkers, they push for minimum staffing levels, they resist the intro-duction of new technologies that threaten their jobs, and they create arule-laden and bureaucratic workplace. In New York State, for exam-ple, “Virtually any idea for saving money through outsourcing and con-solidation of services must first be negotiated and agreed to by theunion representing the employees who currently provide the service”(O’Neal and McMahon 2007: 17). A recent Cato paper describes someof the structural problems with unions in the public sector (Bellante,Denholm, and Osorio 2009; see also Denholm 1994).
When they need to, governments are able to cut costs in thenonunion portions of their workforces. Consider this excerpt from anOctober 2009 press release by the Chicago Transit Authority:
20951_CATOpages.qxd 1/20/10 1:00 PM Page 111

112
Cato Journal
In 2010, the CTA will again be deferring merit pay increasesand will be instituting more furlough days and unpaid holi-days for nonunion employees. In addition, it will eliminate 70nonunion jobs…in 2009, the CTA required up to six unpaiddays off for management and deferred raises for nonunionemployees. In 2010, pay increases for nonunion employeeswill be deferred once again [CTA 2009].
The CTA is taking steps to balance its budget, but it might havebeen more efficient if the pain had be shared throughout CTAsworkforce. As state fiscal pressures build, public managers will needthe flexibility to find savings across their entire organizations, not justthe nonunion parts.
ConclusionIn the private sector, businesses can mitigate the inefficiencies
created by unions. Businesses can substitute capital for labor to com-pensate for excessive union labor costs, and they can increase thequality of their workforces in response to rising union wages.Unfortunately, public sector managers have fewer incentives and lessflexibility to make such changes.
Unions have a broader effect on state finances than just pushing toincrease employee compensation because they also lobby to increasegovernment spending in general. Public sector unions are some of themost powerful special interest groups in the nation. The advent ofpublic sector collective bargaining in the 1960s and 1970s essentiallyinvited millions of public sector workers to become politically active.Government workers are more likely to vote than other Americans,which magnifies their political power (Bellante, Denholm, and Osorio2009: 7). States that have mandatory union dues allow unions to buildup large war chests to fund their public policy efforts.
The teachers unions are particularly powerful. The teachers unionin California, for example, has aggressively entered the fray on a widerange of state ballot questions. Teachers unions in Maine andWashington helped defeat budget reform measures on the ballot inthe 2009 elections. Teachers unions have helped to kill school vouch-ers in the District of Columbia and other places (see Carney 2009).
In a book on the teachers unions, Lieberman (1997) notes that theNEA’s and AFT’s “influence on noneducation issues at the federaland state levels is arguably more important than their influence on
20951_CATOpages.qxd 1/20/10 1:00 PM Page 112

113
Public Sector Unions and Compensation
educational issues.” So the problem with public sector unions is notjust that they block compensation reforms, but that use their privi-leged status to control broader policy debates.16
The NEA has 3.2 million members, a staff of 555, and a 2009budget of more than $350 million (NEA 2009). Over the last twodecades, it has been the seventh largest contributor to political cam-paigns in the United States. AFSCME, with 1.4 million members, isanother powerful public sector union. Over the last two decades, ithas been the second largest contributor to political campaigns in thenation. AFSCME uses its clout on a wide range of policy issues, suchas opposing privatization of government services.17
Americans need higher-quality government services at lower costto avert a fiscal crisis in state and local governments. Public sectorcompensation—and benefit plans in particular—need to be over-hauled to ensure financial sustainability. And the whole area of pub-lic sector unionism needs to be reexamined given the need forgreater flexibility and more restraint in public finances.
ReferencesBellante, D.; Denholm, D.; and Osorio, I. (2009) “Vallejo con Dios:
Why Public Sector Unionism Is a Bad Deal for Taxpayers andRepresentative Government.” Cato Institute Policy Analysis No.645 (September).
Boyken, G. (2007) “Funding the Golden Years in the Golden State.”Governor’s Public Employee Post-Employment BenefitsCommission, California (April). Available at www.pebc.ca.gov/images/files/golden%20years.pdf.
Braden, B., and Hyland, S. (1993) “Cost of Employee Compensationin Public and Private Sectors.” Monthly Labor Review 116 (5):14–21.
Breton, M. (2009) “Outraged over Top Cop’s Pension: Blame theSystem.” Sacramento Bee (12 November).
Burlington Free Press (2009) “Lawmakers Must Tackle PensionCosts.” Editorial ( 8 November).
16For background, see www.unionfacts.com/unions.17Center for Responsive Politics: “Heavy Hitters List” (www.opensecrets.org/orgs/list.php?order=A) and “American Federation of State, County, andMunicipal Employees” (www.opensecrets.org/orgs/summary.php?id=D000000061).
20951_CATOpages.qxd 1/20/10 1:00 PM Page 113

114
Cato Journal
Carney, T. P. (2009) “Class Dismissed: How Teachers Unions KilledD.C. Vouchers.” Media Research Center (July).
Chicago Transit Authority (2009) “Chicago Transit Authority Plans$120 Million in Cuts and Efficiencies.” Press release (7 October).
Cho, D. (2008) “Growing Deficits Threaten Pensions.” WashingtonPost (11May).
_________ (2009) “Steep Losses Pose Crisis for Pensions.”Washington Post (11 October).
Denholm, D. (1994) “Beyond Public Sector Unionism.” PublicService Research Foundation (October).
Dohm, A. (2000) “Gauging the Labor Force Effects of Retiring BabyBoomers.” Monthly Labor Review 123 (7): 17–25.
Edwards, C., and Gokhale, J. (2006) “Unfunded State and LocalHealth Costs: $1.4 Trillion.” Cato Institute Tax and BudgetBulletin No. 40 (October).
Erdley, D. (2009) “School Taxes in Pennsylvania May Soar to Pay forPension Promises.” Pittsburgh Tribune-Review (1 November).
Farber, H. S. (2005) “Union Membership in the United States: TheDivergence between the Public and Private Sectors.” WorkingPaper 503, Industrial Relations Section, Princeton University(September).
Federal Reserve Board (2009) “Flow of Funds Accounts of theUnited States” (17 September).
Fitch, S. (2009) “Gilt-Edged Pensions.” Forbes (22 January).Freeman, R. (1986) “Unionism Comes to the Public Sector.” Journal
of Economic Literature 24 (March): 41–86.Government Accountability Office (2002) “Collective Bargaining
Rights.” GAO-02-835 (September).Gehrke, R. (2009) “Double Dippers May Cost Retirement System
$900 Million in Coming Decade.” Salt Lake Tribune (12November).
Heath, B. (2009) “States Act to Curb Double Dipping.” USA Today(3 December).
Hirsch, B. T., and Macpherson, D. A. (2007) Union Membership andEarnings Data Book: Compilations from the Current PopulationSurvey. Washington: Bureau of National Affairs.
Karmin, C., and Lattman, P. (2009) “Hevesi Tied to Pay-to-Play AsFinancier Enters Plea.” Wall Street Journal (4 December).
20951_CATOpages.qxd 1/20/10 1:00 PM Page 114

115
Public Sector Unions and Compensation
Lieberman, L. (1997) The Teachers’ Unions. New York: FreePress.
McNichol, D. (2009) “Illinois Teacher Fund Confronts $35 BillionUnfunded Liability.” Bloomberg (30 October).
Miller, G. (2009) “California Pensions’ $65 Million Middle-Man.”Governing (5 November).
National Education Association (2009) “Proposed 2008–2010Modified Strategic Plan and Budget” (1 May).
Novy-Marx, R., and Rauh, J. D. (forthcoming) “The Liabilities andRisks of State-Sponsored Pension Plans.” Journal of EconomicPerspectives. Available at http://faculty.chicagobooth.edu/robert.novy-marx/research.
O’Neal, T., and McMahon, E. J. (2007) “Taylor Made: The Costand Consequences of New York’s Public-Sector Labor Laws.”Empire Center for New York State Policy (October).
Pew Center on the States (2007) “Promises with a Price: PublicSector Retirement Benefits.” Available at www.pewtrusts.org/uploadedFiles/wwwpewtrustsorg/Reports/State_policy/pension_report.pdf.
San Diego Union-Tribune (2009) “A Disastrous Decade,” editorial(16 June).
Siedle, E. (2009) “Public Pensions Face Ugly Choices.” Forbes (6November).
The Economist (2009) “Public Sector Pensions: UnsatisfactoryState” (9 July).
U.S. Bureau of Labor Statistics (2009a) “Union Members in 2008”(28 January).
______________ (2009b) “Employee Benefits in the UnitedStates, March 2009” (28 July).
______________ (2009c) “National Compensation Survey, 2008”(August)
______________ (2009d) “Employer Costs for EmployeeCompensation—June 2009” (10 September).
______________ (2009e) “Job Openings and Labor TurnoverSurvey: September 2009” (10 November).
Walters, J. (2007) “The Disability Dilemma.” Governing (1 May).Weintraub, D. (2004) “Overhauling the State’s Pension Plan.” San
Diego Union-Tribune (2 March).
20951_CATOpages.qxd 1/20/10 1:00 PM Page 115