public water system annual report - img1.wsimg.com
TRANSCRIPT

Public Water System Annual Report Southwest Regional Water Treatment Plant & Southwest Regional Water Co-op
2020
Contact persons: Brock Bolton, Co-op Manager, and Chief Operator
Phone Numbers:
Water Plant: 204-522-3463
Emergencies: 204-522-6553
Office Numbers:
Town of Melita Office: 204-522-3413
RM of Two Borders
Melita Office: 204-522-3263
RM of Brenda-Waskada
Office: 204-673-2401
Email: [email protected] Water Treatment Plant
Website: swrwc.ca
Date Prepared: 3/28/2021
Prepared by: Brock Bolton

2
Table of Contents Introduction: .................................................................................................................................................................. 3
1. Description of the Water System ......................................................................................................................... 3
1.1. Water Supply Source ................................................................................................................................... 4
1.2. Water Treatment Process ........................................................................................................................... 5
1.3. Distribution System ..................................................................................................................................... 6
1.4. Storage Reservoir ........................................................................................................................................ 8
1.5. Number of Connections, Population Served and types of Water Users .................................................... 8
1.6. Classification and Certification ................................................................................................................... 8
1.7. Hydrological Investigations ......................................................................................................................... 8
1.8. Artificial Recharge ....................................................................................................................................... 9
1.9. Groundwater Levels and Monitoring ........................................................................................................ 11
2. Water Testing ..................................................................................................................................................... 12
2.1. Bacterial Testing ........................................................................................................................................ 13
2.2. Disinfection ................................................................................................................................................ 13
2.3. Type of Disinfection Used ......................................................................................................................... 14
2.4. Equipment Redundancy and Monitoring Requirements ......................................................................... 14
2.5. Turbidity Testing ........................................................................................................................................ 15
2.6. Other Testing Performed at the WTP ....................................................................................................... 16
2.7. Plant Operation ......................................................................................................................................... 17
2.8. Chemicals Added to our Water and Why ................................................................................................. 18
3. Disinfectant Residual, Turbidity, Bacteria, and Overall Performance Results ................................................. 18
3.1. List of Water Quality Standards ................................................................................................................ 18
4. Water System Incidents and Corrective Actions ............................................................................................... 18
5. Additional Records Required ............................................................................................................................. 19
6. Drinking Water Safety Orders and Actions Taken in Response ........................................................................ 19
7. Boil Water Advisories Issued and Actions Taken in Response.......................................................................... 19
8. Warnings Issued/Charges Laid in Accordance with the Drinking Water Safety Act ........................................ 19
9. Major Expenses Incurred ................................................................................................................................... 19
10. Future System Expansion and/or Increased Production .............................................................................. 19
11. Water Production/Usage for 2020 ................................................................................................................ 19
Appendix “A” – Usage Charts .................................................................................................................................. 20
Appendix “B” – Annual Audit 2020 ......................................................................................................................... 23
Table 1: Water Quality/Treatment Standards ........................................................................................................ 25
Appendix “c” – General Chemistry Results 2020 .................................................................................................... 26

3
Introduction: The 2020 Annual Report for the Melita Water Treatment Plant summarizes the water utility’s ability to
produce safe potable water and meet or exceed provincial regulations. We hope that the following
report answers any and all questions regarding the water system. It is our belief that the public has a
right to access information related to the drinking water they consume. To that end the following
report has been prepared for the residents who are users of the system.
1. Description of the Water System
The Southwest Regional Water Co-op Public Water System (PWS) provides safe potable drinking water
to the residents of Melita, Two Borders, Brenda, Napinka, Medora and Waskada through the
distribution systems and to other rural residents by means of the Truck Fill System at the Water
Treatment Plant (WTP). Treated water produced from the WTP meets or exceeds all health and
aesthetic objectives as stated in the Guidelines for Canadian Drinking Water Quality.
The Melita Water Treatment Plant

4
1.1. Water Supply Source
The WTP receives groundwater from four wells located at 16 km North East of Melita @
NW23-5-27W. The wells draw groundwater from the Oak Lake Aquifer. The wells were drilled
to a depth of 33 feet. Raw water pumped from the wells into a 200 mm (8 inch) pipeline where
it flows directly into the WTP for processing and treatment.
Well Site 1
During 2007-2008, the Town of Melita developed a new Public Water System (PWS) which
includes two groundwater wells, a Water Treatment Plant (WTP) in NW6-4-26W, and a raw
water pipeline between the wells and the WTP. During the initial 6 months of operation it was
determined the water supply wells have insufficient capacity due to the presence of impervious
clay ridges which were not detected during the initial groundwater sourcing study. As a result,
a new well field was developed on municipal right-of-way between SE24-5-27W and
SW19-5-26W which is located 3.2kms east of the existing wells. This well field consists of two
760 mm (30 inch) wells, however, only the north well was mechanised and connected to the
raw water supply line. This site will not be operational until spring 2010.
As water flows through the ground it dissolves metals and minerals. In the case of the Melita
water supply, the water has come into contact with primarily iron and manganese. These items
do not pose health concerns, rather they are known as aesthetic water quality parameters.

5
On September 23, 2010, the new well field was brought online. On December 16, 2010, it was
decided to test the water coming from the new well field for Iron Bacteria due to production
issues at the WTP. The tests came back positive and the decision was made to stop pumping
and bring the original well field back online. The original well site was brought back online in
early 2011 after it was swabbed and flushed to remove any iron bacteria from the raw water
supply line to prevent contamination of the original well site. A plan is in place to treat the new
well site and hopefully clear it of iron bacteria. At no time did iron bacteria enter the reservoir
or any part of the distribution system. In the fall of 2017 two new wells were drilled at the East
site replacing the one’s that didn’t work before, and a booster station was built halfway
between the east well field and the WTP so that both RO units can be operated together.
1.2. Water Treatment Process
Raw water is pumped to the WTP where approximately 90% of the flow is directed through
reverse osmosis membranes. The remaining 10% by-passes through a sand-filter with 3 new
UV (ultraviolet) units prior to blending with membrane permeate. Blended flow is chlorinated
with sodium hypochlorite and then stored in a 1,000,000-litre concrete reservoir for
distribution. Since membranes remove most dissolved minerals, blending permeate with filter
water allows the operation to produce treated water with a more desirable hardness and PH.
Approximately 13% of membrane flow (11% of the raw water) is discharged as membrane
concentrate to the Souris River. Treated water is distributed to the Co-op and a bulk water
(truck) fill is available for rural usage. In the spring of 2014 the second RO unit and filter came
online doubling the production capacity of the plant.
Truck Fill

6
The South RO (original unit) The North RO (new)
The Original Sand Filter with UV upgrade The New Sand Filter with UV
1.3. Distribution System
Treated water from the reservoir, located underneath the WTP, is pumped throughout the
Melita distribution system via two 7.5 horsepower duty pumps, with one 30 horsepower
emergency standby pump for firefighting purposes. The SWRWC has one 7.5 horsepower duty
pump and a new 2 horsepower jockey pump which was installed in the spring of 2017. The
SWRWC distribution system consists primarily of High Density Polyethylene Pipe. In 2017 the
rural system was expanded to take in another 71 homes and another 150 km of pipe was
installed, the raw, 10” and 8” didn’t increase but the rest did. 12 miles of 8” raw water supply
line, the distribution consists of the following 11 miles of 10”, 5 miles of 8”, 19 miles of 6”, 30
miles of 4”, 68 miles of 3”, 49 miles of 2”, for a total of 182 miles of pipe in the ground. A map
of the distribution system pre-expansion is on the next page, a current map is not yet available.
The Waskada Rural Water Co-op already had several miles of pipe in place but is now part of
the overall distribution system. The WTP also has a natural gas powered generator located in
the building that powers the distribution pumps during times of a power failure.

7
The Distribution Pumps
The Generator

8
1.4. Storage Reservoir
The storage reservoir for the Co-op’s drinking water has a capacity of 1,000,000 litres or
220,000 Imperial Gallons, which gives us an available storage time of 2 days without plant
operation. Currently the plant runs daily keeping the reservoir full, the main reason for this is
to have enough water on hand for firefighting and domestic use. It also helps to keep the
water fresh and well circulated. Since the addition of the second RO and Filter the plant runs
one RO and Filter on an alternating basis.
1.5. Number of Connections, Population Served and types of Water Users
The Melita distribution system is comprised of 592 service connections, with a population of
1056 (2006 Statistics Canada Census) approximately. The distribution system also services a
few rural connections located directly around town in the RM of Two Borders.
In June of 2010 Phase 1 of the Rural Pipeline began construction and the South West Regional
Water Co-op was formed which includes to date the Town of Melita, R.M. of Two Borders, R.M.
of Brenda, Village of Waskada and the Waskada Rural Water Co-op.
In phase 1; Two Borders has 14 rural service connections, Brenda has 74 service connections 12
are rural connections 38 in Napinka and 24 in Medora. Connections to the Southeast of Melita
were completed and came online in June, serving Brenda, Napinka, Medora and additional
connections in Two Borders, completing phase 1 of the co-op pipeline. Waskada, the existing
Waskada Rural Water Co-op and additional connections in Two Borders and Brenda came
online in January 2012, when phase 2 was completed. Phase 3 was completed in the late fall of
2017 adding another 71 connections to the system, 38 in Two Borders and 33 in Brenda-
Waskada.
1.6. Classification and Certification
• The Melita WTP is classified as a Class 2 Water Treatment Facility. Classification and
certification is done through the Water and Wastewater Facility Operators Regulation
under the Environment Act.
• Certification Level of Operators;
➢ Brock Bolton, Level 2
➢ Rob McCutcheon, Level 1.
1.7. Hydrological Investigations
In 2005, KGS Group conducted a groundwater sourcing study near the Broomhill truck loader
station approximately 16 km north of Melita. The objective of the study was to carry out
exploratory drilling and installation of a production well with sufficient capacity for the Town’s
water supply. KGS Group conducted an EM34 survey and drilled approximately 20 test-holes
and installed 15 monitoring wells. A 96.5-hour pump test at a constant 15 L/s pump rate was
completed and drawdown was monitored. In October 2005, a 200 mm (8 inch) production well
was installed on the NW23-5-27W on the Broomhill Wildlife Management Area (WMA). The

9
water level was recorded to be 1.8 meters below ground at the time of drilling. A second
production well was installed 15 meters south of the first in 2007 so that one well could act as a
backup supply.
After commissioning the WTP in 2009, a monitoring well system was installed which showed a
significant water table drop over the first 6 months of operation. Subsequent test drilling by
KGS Group showed that the aquifer was not continuous as originally determined from the 2005
investigations. Newer test drilling at close intervals showed the presence of clay ridges that
separated the larger aquifer into smaller basins. It was determined that these clay ridges result
in an “egg carton” or “ice cube tray” effect such that once the water table dropped below the
top of the ridges, the production wells, which are located into a much smaller basin, are unable
to sustain withdrawals necessary to sustain Melita.
1.8. Artificial Recharge
Test drilling activities in 2009 revealed at least three separate basins in close proximity to the
well field. The basins are referred to as the south, middle, and north basins whereby the
production wells are located in the south basin. In addition, the Broomhill truck loader station
is also located in the south basin. Due to the water table drop, the pump in the truck fill had to
be lowered to maintain its operation. Recharge infrastructure include a 760 mm (30 inch) well
was installed in both the middle and north basin. A 75-mm pipe line was installed from the
middle basin well to the south production well. This would allow groundwater from the middle
basin to be pumped to the production well site and artificially recharge the south basin.
However, due to Manitoba Hydro power restrictions, this well can only be pumped while the
production well is not in operation. The WTP generally requires water for about 13 hours a day
on average for 2012, such that the middle basin is pumping only when needed. When
recharging is required the pump is turned on and runs continually until water levels are back up
to an acceptable level and then turned off until needed. Pumping groundwater from the
middle basin to the south basin commenced on August 26th, 2009 on an as needed basis and
wasn’t used in 2010 and since then only as needed.
Since the middle basin could only be pumped intermittently, the north basin well was
temporarily equipped with a pump, generator, and overland pipeline to speed up the water
table recovery. Pumping from this basin occurred from September 3rd to September 21st until
water levels significantly recovered and the north basin water table prevented further
pumping. The water table in the north basin has since recovered. In 2012 the north basin was
converted to a supplemental well to improve operating pressures and flows to the plant when
it is in operation.
Currently, the middle basin well is intermittently pumped to the production well site in an
attempt to maintain water levels until the new well field located on the SE24-5-27W can be put
into operation. KGS Group determined that pumping from all three basins will not be
sustainable to meet Melita demands and recommended developing the new well site. At this
point the new east well field is still not in operation as all attempts to remove the iron bacteria

10
from it have failed. More testing and engineering have come up with a plan to drill two new
smaller diameter wells in the same location, that will meet future demands and allow the
operation of both RO units at the same time. At the end of 2017 both new wells were drilled
and they should be operational February 2018.
The updated graph on page 11 shows ground water levels at various points at and around the
new wells.
Recharge Wells
Since fall of 2017 we have not had to recharge the east site because we stopped pulling water from
these wells and now only pull from the new ones at the East site.

11
1.9. Groundwater Levels and Monitoring
Groundwater monitoring commenced in July 2009. As many as four pressure transducers were
initially set-up and currently three pressure transducers are continuous and manual readings.
This graph uses a benchmark of 100.00 m in order to compare levels in each the three basins.
The locations of all monitoring wells are shown in the appendices. 5” MW represents the water
table depth near the production well, while MWa and MWb represent the water table depth in
the middle and north basins.
In 2007, the Manitoba Water Services Board (MWSB) developed a groundwater monitoring
plan for the existing well field (site 1) as required in Environment Act License No. 2745 issued to
the Town of Melita. On October 5, 2009, MWSB requested a minor alteration to this license to
include the new well field (site 2) located on the SE24-5-27W. As a result, Manitoba
Conservation requires a revised water level monitoring plan.
Once operational, site 2 will become the main supply for the SWRWC. Site 1 will remain as a
backup supply. Therefore, the groundwater monitoring plan will include monitoring of both
sites. The following groundwater monitoring plan is proposed for a period of two years
commencing site 2 operation. After two years, the location and frequency of groundwater
monitoring is proposed to be re-evaluated.

12
Site 1 – NW23-5-27W
In 2009, three new monitoring wells were installed at site 1. A 125-mm monitoring well (MW-
21) was installed 15 m east of the production wells in the south basin, a 50-mm monitoring well
(MW-22) located 110 m north of the north production well in the middle basin, and a 50 mm
monitoring well (MW-23) located 245 m north of the north production well in the north basin.
All three monitoring wells were equipped with pressure transducers. However, it is proposed
to maintain two pressure transducers at MW-21 and MW-22 for continuous monitoring. A
manual water level reading with an electronic tape is proposed semi-annually at MW-10, MW-
23 and MW-14. The monitoring of these wells will provide water level data on each of the
three basins as well as MW-14 located outside of the basins.
Site 2 – SE24-5-27W
The proposed monitoring system for site 2 will include pressure transducers installed in MW-
103 near the proposed production well and in MW-104 located adjacent to the Harmon
farmstead. Manual level readings are proposed semi-annually at MW-100, MW-101 and MW-
102. MW-100 is located near the Miner and Carr properties. Each monitoring well is protected
with a locked steel cover. However, at each monitoring well location, a second 50 mm
monitoring well (without steel cover and lock) was provided for public observations.
2. Water Testing
Water tests are taken daily on a routine basis to ensure that the water is safe and to monitor how
well the treatment process is performing. We test the water at the WTP and in the distribution
system. We perform daily tests at the WTP on 6 different aspects of the treatment process.
• Distribution Tests (water taken from a point in the distribution system) on average 6 tests
per day.
• Treated Tap (water taken from a point in the WTP before it leaves the plant) on average 6
tests per day.
• Raw (untreated well water as it enters the WTP) on average 4 tests per day.
• Permeate (water from the R.O. Unit before chemical addition) on average 3 tests per day.
• Sand-filter (treated water from the sand-filter, before it blends with R.O. water) 7 tests per
day, 5 when chlorine isn’t used as a pre-treatment.
• MTU or Main Treatment Unit (water from all 12 vessels and 4 stages on MTU#2 and 11
vessels and 3 stages on MTU#1) 30 tests per day for conductivity.
• Chlorine we test chlorine daily at 3 locations in the plant (post treatment) before it enters
the distribution system. We also test 1 location in Melita and 3 more rurally on a daily basis.
There are on average 56 tests performed a day at the WTP and another 6 rurally, or 1,860 tests
a month, 22,630 tests a year.

13
2.1. Bacterial Testing
We sample the raw water (untreated well water), the treated water (water leaving the
treatment plant) and the water in 4 locations in the distribution system one from a location in
the RM of Two Borders, another from a location in the RM of Brenda-Waskada and one each
from the outgoing waters at the Napinka and Waskada reservoirs every two weeks (bi-weekly)
for the presence of Total Coli forms (TC) and E. Coli (EC) bacteria. If these bacteria are present
in the water it is an indication that disease causing organisms may also be present. Since the
completion of phase 2 WTP staff now collects 6 samples instead of the 10 samples previously.
New licences were issued in 2012 and now Melita, Brenda (Napinka and Medora) and Waskada
have to do their own sampling for their distribution systems. These 6 samples are then sent via
courier to a provincially sanctioned lab in Winnipeg for testing. For 2020 all samples sent for
testing passed.
2020 Results Total Coliform Bi-weekly Sampling
Sample Samples Submitted Sample Results
Raw 26/26, 100% compliant All samples tested passed
Treated 26/26, 100% compliant All samples tested passed
Two Borders @ 26/26, 100% compliant All samples tested passed
Outgoing Napinka 26/26, 100% compliant All samples tested passed
Outgoing Waskada 26/26, 100% compliant All samples tested passed
Brenda-Waskada@ 26/26, 100% compliant All samples tested passed
2020 Results E.Coli Bi-weekly Sampling
Sample Samples Submitted Sample Results
Raw 26/26, 100% compliant All samples tested passed
Treated 26/26, 100% compliant All samples tested passed
Two Borders @ 26/26, 100% compliant All samples tested passed
Outgoing Napinka 26/26, 100% compliant All samples tested passed
Outgoing Waskada 26/26, 100% compliant All samples tested passed
Brenda-Waskada@ 26/26, 100% compliant All samples tested passed
2.2. Disinfection
The final step in the treatment of safe water is disinfection. Disinfection is the selective
destruction or inactivation of potential disease causing organisms in water. Per the Drinking
Water Safety Act the Melita PWS must ensure that a disinfection residual of at least:
• 0.5 mg/L of free chlorine per litre of water is detectable at the point where water enters
the distribution system, after a minimum contact time of 20 minutes. Chlorine analyzer
recorded 3,153,600 for 2020 and all were above the standard.
• 0.1 mg/L of free chlorine per litre of water is detectable at all times at any point in the
distribution network. 1 sample taken daily at 3 different locations in the distribution
system all were above the standard.

14
• 95% of water produced through the filters per month is disinfected within validated UV
conditions. Which is monitored by the SCADA and verified daily by us which is a crucial part
of the 3-log removal for the filter system.
For 2020 all samples tested met the above standards.
2.3. Type of Disinfection Used
The Melita WTP disinfects by adding a 12% sodium hypochlorite solution to the water via 4 chlorinator pumps. One for the raw water before it enters each sand-filter (pre-treatment) and two for the blended water before it enters the reservoir. In 2012 three UV units were added after the filter. In 2014 three more UV units were added after the second filter. Log reduction relates to the percentage of microorganisms physically removed or inactivated by a given process.
1-log reduction = 90% 2-log reduction = 99% 3-log reduction = 99.9% 4-log reduction = 99.99%
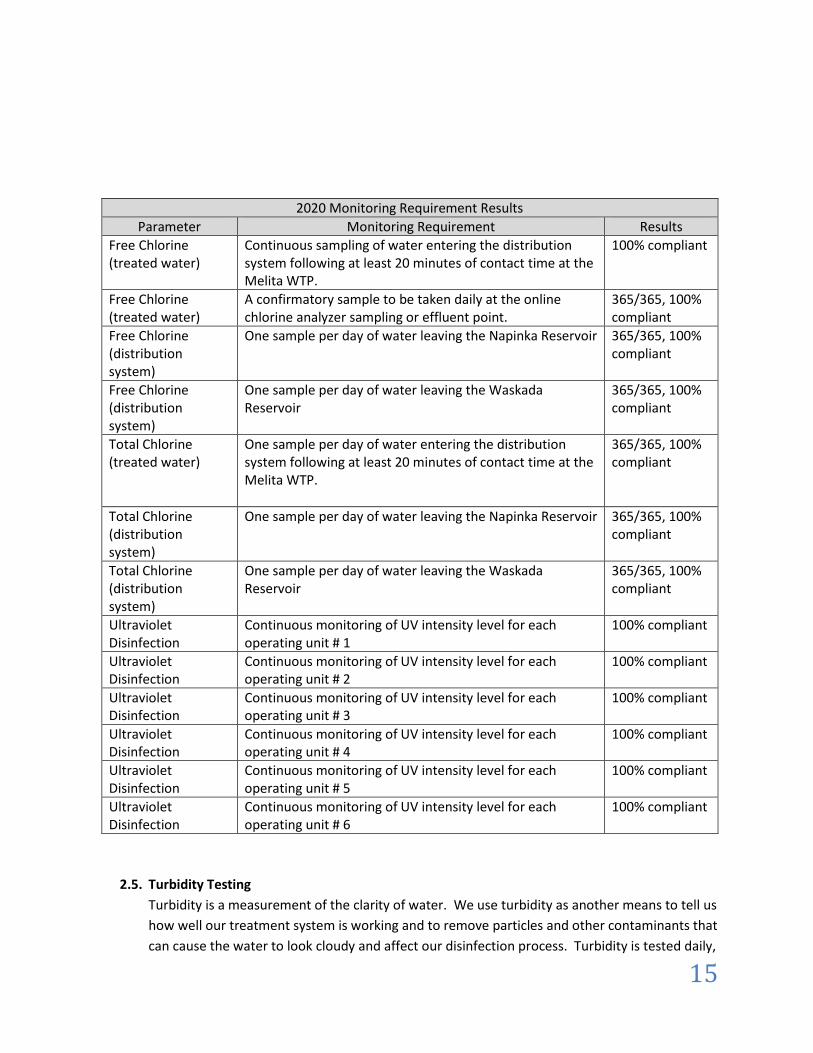
2.4. Equipment Redundancy and Monitoring Requirements
As required by the Drinking Water
Safety Act the Melita PWS ensures
continuous disinfection is
maintained at the WTP by keeping
in stock all spare parts required for
the chlorinators, as well there are
two spare chlorinator pumps kept at
the plant. Disinfection residuals are
monitored continuously by an
online monitor that monitors the
water continuously as it leaves the
WTP. We also monitor the residuals
daily at the WTP and in the
distribution system; these tests are
performed at the WTP after the
samples are collected. The results of all tests are recorded on our records at the WTP as well as
Monthly Chlorination and UV Report forms which are sent to the regional Drinking Water
Officer at the end of each month, to check for standard compliance.
Online Turbidity Monitoring Equipment
15
2020 Monitoring Requirement Results
Parameter Monitoring Requirement Results
Free Chlorine (treated water)
Continuous sampling of water entering the distribution system following at least 20 minutes of contact time at the Melita WTP.
100% compliant
Free Chlorine (treated water)
A confirmatory sample to be taken daily at the online chlorine analyzer sampling or effluent point.
365/365, 100% compliant
Free Chlorine (distribution system)
One sample per day of water leaving the Napinka Reservoir
365/365, 100% compliant
Free Chlorine (distribution system)
One sample per day of water leaving the Waskada Reservoir
365/365, 100% compliant
Total Chlorine (treated water)
One sample per day of water entering the distribution system following at least 20 minutes of contact time at the Melita WTP.
365/365, 100% compliant
Total Chlorine (distribution system)
One sample per day of water leaving the Napinka Reservoir
365/365, 100% compliant
Total Chlorine (distribution system)
One sample per day of water leaving the Waskada Reservoir
365/365, 100% compliant
Ultraviolet Disinfection
Continuous monitoring of UV intensity level for each operating unit # 1
100% compliant
Ultraviolet Disinfection
Continuous monitoring of UV intensity level for each operating unit # 2
100% compliant
Ultraviolet Disinfection
Continuous monitoring of UV intensity level for each operating unit # 3
100% compliant
Ultraviolet Disinfection
Continuous monitoring of UV intensity level for each operating unit # 4
100% compliant
Ultraviolet Disinfection
Continuous monitoring of UV intensity level for each operating unit # 5
100% compliant
Ultraviolet Disinfection
Continuous monitoring of UV intensity level for each operating unit # 6
100% compliant
2.5. Turbidity Testing
Turbidity is a measurement of the clarity of water. We use turbidity as another means to tell us
how well our treatment system is working and to remove particles and other contaminants that
can cause the water to look cloudy and affect our disinfection process. Turbidity is tested daily,

16
the raw, treated, sand-filters and distribution by a portable testing meter. The water from the
sand-filters and from the MTUs is monitored continuously while the plant is in operation, by
two separate online turbidity monitors. The results of all turbidity tests are recorded on our
records at the WTP as well as Monthly Turbidity Report forms which are sent to the regional
Drinking Water Officer at the end of each month to check for standard compliance.
For 2020 all samples met the turbidity standards.
2020 Turbidity Monitoring Results
Parameter Monitoring Requirement Results
Turbidity One raw water sample per day 365/365, 100% compliant
Turbidity Continuous sampling of the effluent from each operating membrane filtration unit # 1
100% compliant
Turbidity Continuous sampling of the effluent from each operating membrane filtration unit # 2
100% compliant
Turbidity A confirmatory sample to be taken daily at the online turbidity analyzer sampling or effluent point unit # 1
365/365, 100% compliant
Turbidity A confirmatory sample to be taken daily at the online turbidity analyzer sampling or effluent point unit # 2
365/365, 100% compliant
Turbidity (distribution system)
At he same time and locations as bacteriological distribution system sampling
Sample Samples Submitted Sample Results
Raw 26/26, 100% compliant All samples tested passed
Treated 26/26, 100% compliant All samples tested passed
Two Borders @ 26/26, 100% compliant All samples tested passed
Outgoing Napinka 26/26, 100% compliant All samples tested passed
Outgoing Waskada 26/26, 100% compliant All samples tested passed
Brenda-Waskada@ 26/26, 100% compliant All samples tested passed
2.6. Other Testing Performed at the WTP
• Iron Testing: Is performed daily on the following samples, distribution, treated tap,
sand-filter. Every 11 days on the raw and every 11 days on permeate.
• Manganese Testing: Is performed daily on the following sample, sand-filter and every
11 days on the distribution, treated tap, raw and permeate.
• PH Testing: Is performed daily on the following samples, treated tap, raw, permeate
and concentrate.

17
• Hardness Testing: Is performed every 11 days on the following samples, raw and
treated tap.
• Chlorine Testing: Is performed daily on the following samples, distribution, and treated
tap and sand-filter. As previously described in sections 2.2 and 2.3.
• Conductivity Testing: Is performed daily on the following samples, permeate,
distribution, treated tap, raw, sand-filter and all 23 vessels on both RO units.
2.7. Plant Operation
The WTP is monitored continuously by the computer system; it is continuously taking readings
from 85 different locations by sensors, probes, and meters. This information is displayed in
real-time on a different number of screens (see Figure A, B, C which show three different
computer screens) and is also recorded and compiled in the form of a trend. These trends can
be accessed at any time and show a history of plant operation in various areas (see Figure D for
an example of a trend screen).
Figure A
Figure B

18
Figure C
Figure D
2.8. Chemicals Added to our Water and Why
• Sodium Hypochlorite 12%: (Chlorine) Disinfectant, source of available chlorine.
• Avista Vitec 4000: (Antiscalant) Injected in the raw water before the membranes to
protect them and aid in the treatment process.
• Sodium Hydroxide 50%: (Caustic Soda) Acid neutralization raises PH.
3. Disinfectant Residual, Turbidity, Bacteria, and Overall Performance Results
For 2020, the SWRWC PWS has met all regulatory requirements in regard to monitoring and
reporting in the WTP, and in the distribution system. (see Table 1 and Appendix “B” – Annual Audit
– 2020).
3.1. List of Water Quality Standards
The province of Manitoba has adopted several water quality standards from the Guidelines for
Canadian Drinking Water Quality developed by Health Canada and two regulations under the
Drinking Water Safety Act (see Table 1). A copy of the Annual Audit – 2020 from the Office of
Drinking Water is in Appendix “B”.
4. Water System Incidents and Corrective Actions

19
In 2020 the SWRWC PWS still has two residents with taste and odour issues due to line size and
length and the SWRWC has a plan in place to permanently solve the problem for one and a
maintenance plan for the other.
5. Additional Records Required
As of August 2012, fluoride is no longer added to the water.
Daily Log Sheets are also kept to check plant performance, copies of these forms are sent into the
Water Services Board for review.
Distribution Flows and Pressures Data Sheets are also kept to keep an eye on flows and pressures
of the water leaving the reservoir.
Conductivity Sheets are also kept to check plant performance, copies are also sent into the Water
Services Board for review.
Pressures and Flows are also recorded at 4 locations on the rural pipeline (Napinka Reservoir, the
Napinka Booster Station, Medora, Medora Booster Station and Waskada Reservoir).
6. Drinking Water Safety Orders and Actions Taken in Response
In 2020, no drinking water safety orders were issued for the SWRWC PWS.
7. Boil Water Advisories Issued and Actions Taken in Response
In 2020, no boil water advisories were issued for the SWRWC.
8. Warnings Issued/Charges Laid in Accordance with the Drinking Water Safety Act
In 2020, no warnings were issued or charges laid for the SWRWC PWS.
9. Major Expenses Incurred
None for 2020.
10. Future System Expansion and/or Increased Production
Proposals have been made but as of the time this report was completed no funding has been
awarded.
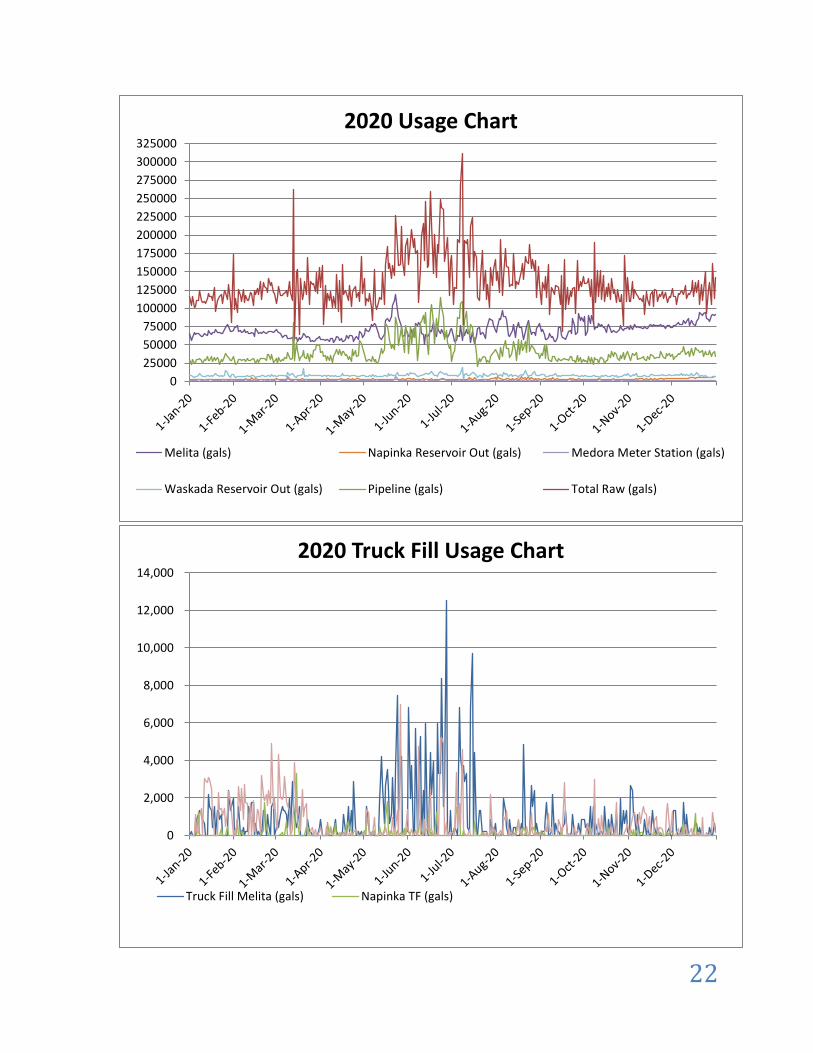
11. Water Production/Usage for 2020
The treatment system capacity was designed to meet a 20-year future demand for Melita as well as
additional capacity for the rural water system. The water system production and usage are
summarized in the following charts in Appendix “A” – Usage Charts.

20
Appendix “A” – Usage Charts
Raw
Total Gals Highest Day Lowest Day Daily Average
49,209,482 311,894 59,912 134,452
Melita
Total Gals Highest Day Lowest Day Daily Average
24,383,928 116,079 40,308 66,623
Melita Truck Fill
Total Gals Highest Day Lowest Day Daily Average
329,075 12,555 0 899
Napinka
Total Gals Highest Day Lowest Day Daily Average
1,256,153 7,048 1,982 3,432
Napinka Truck Fill
Total Gals Highest Day Lowest Day Daily Average
46,550 3,282 0 127
Medora
Total Gals Highest Day Lowest Day Daily Average
591,429 7,269 0 1,616
Waskada
Total Gals Highest Day Lowest Day Daily Average
3,027,537 19,604 2,863 8,272
Waskada Truck Fill
Total Gals Highest Day Lowest Day Daily Average
233,738 6,961 0 639
Rural
Total Gals Highest Day Lowest Day Daily Average
9,999,333 81,277 16,300 27,321

21
24,383,928 61.16%
1,256,153 3.15%
591,429 1.48%
3,027,537 7.59%
9,999,333 25.08%
329,075 0.83%
46,550 0.12%
233,738 0.59%
609,363 1.53%
2020 Usage Chart in Imperial Gallons
Melita Napinka Medora Waskada
Rural Melita Truck Fill Napinka Truck Fill Waskada Truck Fill
22
0
25000
50000
75000
100000
125000
150000
175000
200000
225000
250000
275000
300000
325000
2020 Usage Chart
Melita (gals) Napinka Reservoir Out (gals) Medora Meter Station (gals)
Waskada Reservoir Out (gals) Pipeline (gals) Total Raw (gals)
0
2,000
4,000
6,000
8,000
10,000
12,000
14,000
2020 Truck Fill Usage Chart
Truck Fill Melita (gals) Napinka TF (gals)

23
Appendix “B” – Annual Audit 2020

24
25
Table 1: Water Quality/Treatment Standards
Parameter Quality Standard SWRWC Result
Total Coliform Less than one total coliform bacteria detectable per 100 mL in all treated and distributed water
100%
E. Coli Less than one E. Coli bacteria detectable per 100 mL in all treated and distributed water
100%
Chlorine Residual
A free chlorine residual of at least 0.5 mg/L in water entering the distribution system following a minimum contact time of 20 minutes
100%
A free chlorine residual of at least .01 mg/L at all times at any point in the water distribution system.
100%
Ultraviolet Disinfection 95% of water produced per month is disinfected within validated conditions
100%
Turbidity
Less than or equal to 0.1 NTU in 99% of the measurements in a month of the effluent from each membrane filtration unit
100%
Not exceeded 0.3 NTU for any continuous measurement 100%
Total Trihalomethanes (THMs)
Less than or equal to 0.10 mg/L of February quarterly sample Next Year
Total Trihalomethanes (THMs)
Less than or equal to 0.10 mg/L of May quarterly sample Next Year
Total Trihalomethanes (THMs)
Less than or equal to 0.10 mg/L of August quarterly sample Next Year
Total Trihalomethanes (THMs)
Less than or equal to 0.10 mg/L of November quarterly sample
Next Year
Total Trihalomethanes (THMs)
Less than or equal to 0.10 mg/L as locational annual average of quarterly samples
Next Year
Haloacetic Acids (HAAs) Less than or equal to 0.08 mg/L of February quarterly sample Next Year
Haloacetic Acids (HAAs) Less than or equal to 0.08 mg/L of May quarterly sample Next Year
Haloacetic Acids (HAAs) Less than or equal to 0.08 mg/L of August quarterly sample Next Year
Haloacetic Acids (HAAs) Less than or equal to 0.08 mg/L of November quarterly sample
Next Year
Haloacetic Acids (HAAs) Less than or equal to 0.08 mg/L as locational annual average of quarterly samples
Next Year
Arsenic Less than or equal to 0.01 mg/L 0.00018
Benzene Less than or equal to 0.005 mg/L <000050
Fluoride Less than or equal to 1.5 mg/L <0.020
Lead Less than or equal to 0.01 mg/L in the water distribution system
0.000108
Nitrate Less than or equal to 45 mg/L measured as nitrate (10 mg/L measured as nitrogen)
0.0671
Trichloroethylene Less than or equal to 0.005 mg/L <0.00050
Tetrachloroethylene Less than or equal to 0.01 mg/L <0.00050
Uranium Less than or equal to 0.02 mg/L 0.00114

26
Appendix “c” – General Chemistry Results 2020

27

28

29