public works technical bulletin 200-1-97 25 … works technical bulletin 200-1-97 25 may 2011...
TRANSCRIPT

PUBLIC WORKS TECHNICAL BULLETIN 200-1-97 25 MAY 2011
EVALUATION OF CHECK DAM SYSTEMS FOR EROSION AND SEDIMENT CONTROL AT
MILITARY FACILITIES
Public Works Technical Bulletins are published by the U.S. Army Corps of Engineers, Washington, DC. They are intended to provide information on specific topics in areas of Facilities Engineering and Public Works. They are not intended to establish new Department of the Army (DA) policy.
DEPARTMENT OF THE ARMY 1
U.S. Army Corps of Engineers 2
441 G Street NW 3
Washington, DC 20314-1000 4
CECW-CE 5
Public Works Technical Bulletin 25 May 2011 6
No. 200-1-97 7
FACILITIES ENGINEERING 8
ENVIRONMENTAL 9
EVALUATION OF CHECK DAM SYSTEMS FOR 10
EROSION AND SEDIMENT CONTROL 11
AT MILITARY FACILITIES 12
1. Purpose. 13
a. The purpose of this Public Works Technical Bulletin 14
(PWTB) is to transmit information and provide guidance for the 15
selection and use of check dam structures for erosion control. 16
The information is based on data collected from field and 17
laboratory evaluations done by the Engineer Research and 18
Development Center – Construction Engineering Research 19
Laboratory (ERDC-CERL) and the University of Illinois. Since 20
many land managers commonly use a variety of check dam systems 21
in conjunction with other best management practices (BMP) for 22
comprehensive erosion control programs, there is a need for 23
independent evaluation. Current data on check dam system 24
performance is lacking. This PWTB will help land managers select 25
suitable check dam structures for certain conditions. This 26
information will help reduce product failure due to 27
misapplication and provide results based on side-by-side 28
comparisons of commonly used check dam systems found on military 29
lands. 30
b. All PWTBs are available electronically (in Adobe® 31
Acrobat® portable document format [PDF]) through the World Wide 32
Web (WWW) at the National Institute of Building Sciences Whole 33
Building Design Guide (WBDG) webpage, which is accessible 34
through the following link: 35
PWTB 200-1-97 25 May 2011
2
1
http://www.wbdg.org/ccb/browse_cat.php?o=31&c=215 2
2. Applicability. This PWTB applies to all U.S. Army facilities 3
and associated training lands in both Continental United States 4
(CONUS) and Outside Continental United States (OCONUS) locations 5
that want to use check dam systems for erosion and sediment 6
control. 7
3. References. 8
a. Army Regulation (AR) 200-1, “Environmental Protection and 9
Enhancement,” 13 December 2007. 10
b. Other references used in the Appendixes are listed in 11
Appendix D. 12
4. Discussion. 13
a. AR 200-1, implemented in 2007, contains policy for 14
environmental protection and enhancement, implementation of 15
pollution prevention, conservation of natural resources, 16
sustainable practices, compliance with environmental laws, and 17
restoration of previously damaged or contaminated sites. AR 200-18
1 requires that installations be good stewards of land resources 19
by controlling sources of erosion to prevent damage from 20
facilities to the land, water resources, and equipment. 21
Additionally, hydrologic erosion is associated with multiple 22
laws and regulations (Clean Air Act, Clean Water Act, etc.), 23
which all affect how Army training lands are managed. 24
b. This PWTB reports the results of laboratory studies 25
investigating the effectiveness of five types of check dams 26
(rip-rap berm, compost filter berm, plastic grid dam, triangular 27
foam berm, and compost sock) under three different slope 28
conditions (6:1, 9:1, and 12:1). Additionally, results from a 29
24:1 slope field evaluation are documented. Quantitative 30
analysis was conducted by comparing the runoff volume and 31
sediment load from the check dams in both laboratory and field 32
conditions. Overall, check dam treatments resulted in lower 33
runoff volumes and sediment loads when compared to no check dam 34
treatment “control.” There was little difference between check 35
dam treatments with the exception of the compost filter sock. It 36
was found later that the compost filter sock material did not 37
meet manufacture specification which may have contributed to the 38
lack of performance compared with the other check dam 39
structures. 40
PWTB 200-1-97 25 May 2011
A-1
Appendix A: 1
2
EROSION PROCESSES AND CHECK DAMS 3
Sediment in surface waters that comes from erosion of soils is 4
one of the leading causes of water pollution. Land used for 5
military training is particularly prone to erosion due to its 6
associated high level of human activities, including foot and 7
off-road vehicle traffic, which disturb the soil and its 8
vegetative cover (Whitecotton et al. 2000; Wang et al. 2006). 9
The Department of Defense (DoD) controls more than 25 million 10
acres of federally owned land in the United States with 15 11
million acres of that land available for a variety of military 12
training activities (Ayers et al. 2000). Installations are 13
required to maintain a healthy, no net loss environment by 14
several legal sources: the Sikes Act, Army Regulation (AR) 200-15
3, Executive Order (EO) 13112, the Clean Air Act, and the Clean 16
Water Act. Thus, it is vital to determine when and where 17
negative impacts on soil, water, plant, and animal communities 18
are occurring and to develop practices to eliminate them. 19
Due to the nature and intensity of military training activities, 20
many Army training lands and trail shoulders are severely 21
degraded and need repair. Degraded landscapes jeopardize 22
effective training as well as troop safety. As a result of these 23
concerns, it is imperative to mitigate and rehabilitate critical 24
areas of Army training lands. Exposed soils that result from 25
training and construction activities can contribute to 26
environmental and compliance issues for Army installations. 27
Training and construction without BMPs for erosion control will 28
form rills and gullies in the soil, leading to a loss of 29
training area, lower troop safety, and a negative environmental 30
impact. 31
One common BMP is the installation of check dams on training 32
lands to help mitigate erosion from exposed soil. Check dams 33
systems are structures that can be placed directly in the path 34
of water flow. Check dams alleviate the potential for erosion by 35
reducing the shear stress and energy in the flowing water. Check 36
dams also reduce sediment load by trapping and containing 37
sediment in the structure and by allowing sediment deposition in 38
ponded water behind the structure. 39
These structures can be either temporary or permanent. Each 40
check dam will require varying levels of management and 41
maintenance depending upon the type of structure. There are 42
PWTB 200-1-97 25 May 2011
A-2
three general categories of check dams: rock, natural, and 1
engineered products. Traditional check dams are often made out 2
of rock or rip-rap. These structures are hard to work with due 3
to their weight, but they are very durable. Other check dam 4
systems being deployed are more temporary in nature than rip-5
rap/rock check dams. Materials used in these new check dam 6
structures range from foam triangles to ridged plastic to fiber-7
filled logs to compost-filled filter socks. These structures 8
offer the benefit of being lighter, increasing their ease of 9
installation. They also commonly allow the establishment of 10
vegetation which improves the environmental benefit. Other 11
common check dam systems often use straw bales and silt fencing. 12
While this type is easy to install, they often lack the 13
durability and performance of other check dams. 14
The objectives of this study were to: 15
1. Identify the types of commonly used and available check dam 16
systems. 17
2. Evaluate each structure in two places: a field setting and 18
a controlled rainfall simulator. 19
3. Investigate the performance, durability, and installation 20
ease of the dams to increase land managers’ understanding 21
of the types of check dams available and the 22
characteristics of each. 23
4. Provide costs associated with the check dam structures 24
evaluated, and the pros and cons of those structures.25
PWTB 200-1-97 25 May 2011
B-1
Appendix B: 1
2
STUDY METHODS 3
Methods 4
Laboratory Experiments 5
Two horizontal tilting soil chambers (measuring 3.6 m long, 1.5 6
m wide, and 0.3 m deep) were used to investigate soil erosion 7
from soil beds with check dams installed. Each soil chamber was 8
divided into two separate compartments with a steel plate 9
divider placed at the center of the 1.5-m-wide chamber across 10
its 3.6-m length and then sealed. Similarly, the bottom and 11
edges of each compartment were sealed completely. The chambers 12
were filled with Dana silt loam series soil which is 13
predominantly found on slopes (from 2–5%) in Central Illinois. 14
The clay content of this soil series ranges from 11%–22%. The 15
soil bulk density ranges from 1.40–1.55 g/cc, soil permeability 16
ranges from 0.6–2.0 in/hr, and the soils contain 4% organic 17
matter. 18
The top 0.3 m of soil were collected in two separate layers (0–19
0.15 m and 0.15–0.3 m) then packed in the chamber. The beds were 20
then saturated, re-saturated, and allowed to sit for a few weeks 21
which allowed natural compaction to occur. The edges of each 22
compartment were compacted tightly to eliminate preferential 23
flow of water along the edges of the bed. The check dam 24
treatments were installed on each compartment of the soil 25
chambers, allowing for side-by-side comparison of the different 26
treatments. 27
Five different check dams were tested (rip-rap berm, compost 28
filter berm, plastic grid dam, triangular foam berm, and compost 29
sock) under three different slopes for the study. Slopes of 6:1, 30
9:1, and 12:1 were used to measure the performance of the check 31
dam systems. Rip-rap was used as a traditional permanent dam. 32
Compost is less widely used, but possibly more environmentally 33
friendly than other structures. The three industrial products 34
were chosen due to their popularity and variety, but they were 35
evaluated to determine if they could hold up to the conditions 36
despite their small size and lightweight build. Each check dam 37
system has very specific installation standards and 38
specifications. These specifications were met as closely as 39
possible during installation and maintenance. 40
PWTB 200-1-97 25 May 2011
B-2
Rainfall was applied to the soil chamber using a computer-1
controlled laboratory rainfall simulator. The simulator was 2
situated 10 m from the floor to ensure the rainfall attained the 3
terminal velocity required for erosion studies (Hirschi et al. 4
1990). A rainfall intensity of 43.4 mm/hr (1.71 in/hr) for 30 5
min was chosen, representing a 10-yr, 30-min rainfall event in 6
Central Illinois. The entire runoff volume was collected. A 7
sample volume was dried and the sediment load was calculated 8
(ASTM D 3977). 9
Field Experiments 10
The site selected for this study is located south of Urbana, IL. 11
The soil is classified as Dana Silt Loam (NRCS 2008) with a 12
slope of approximately 24:1 or 4.2%, as determined by a field 13
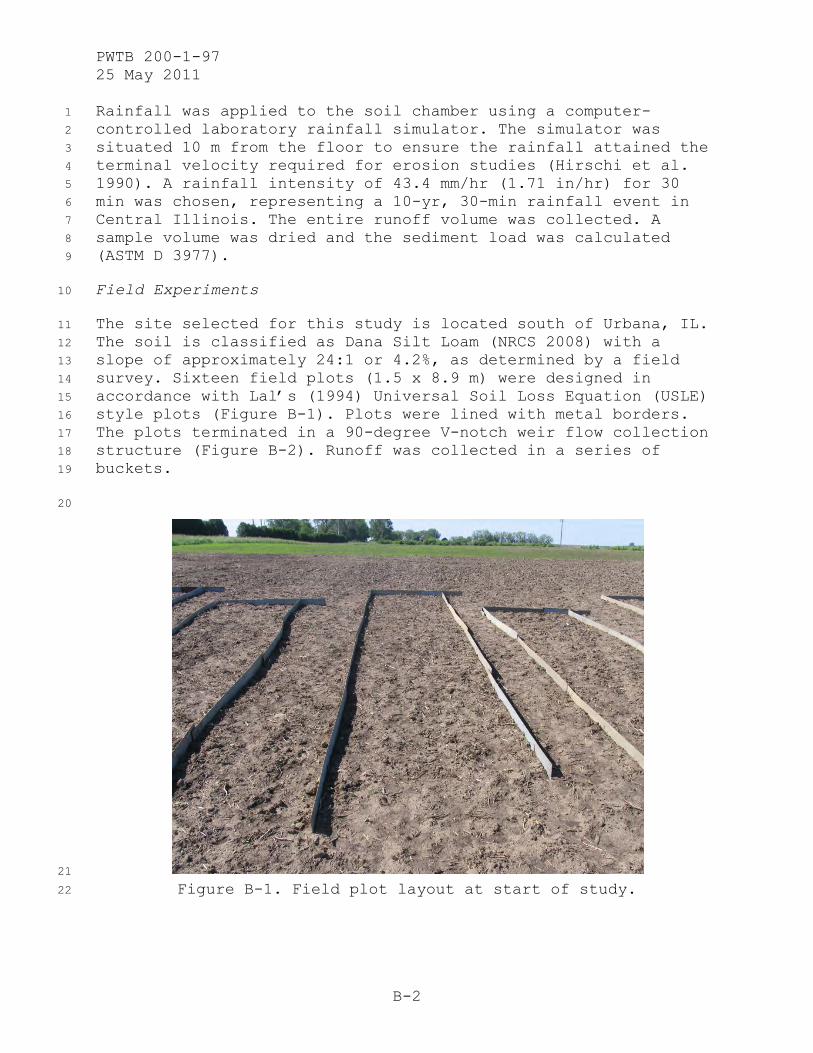
survey. Sixteen field plots (1.5 x 8.9 m) were designed in 14
accordance with Lal’s (1994) Universal Soil Loss Equation (USLE) 15
style plots (Figure B-1). Plots were lined with metal borders. 16
The plots terminated in a 90-degree V-notch weir flow collection 17
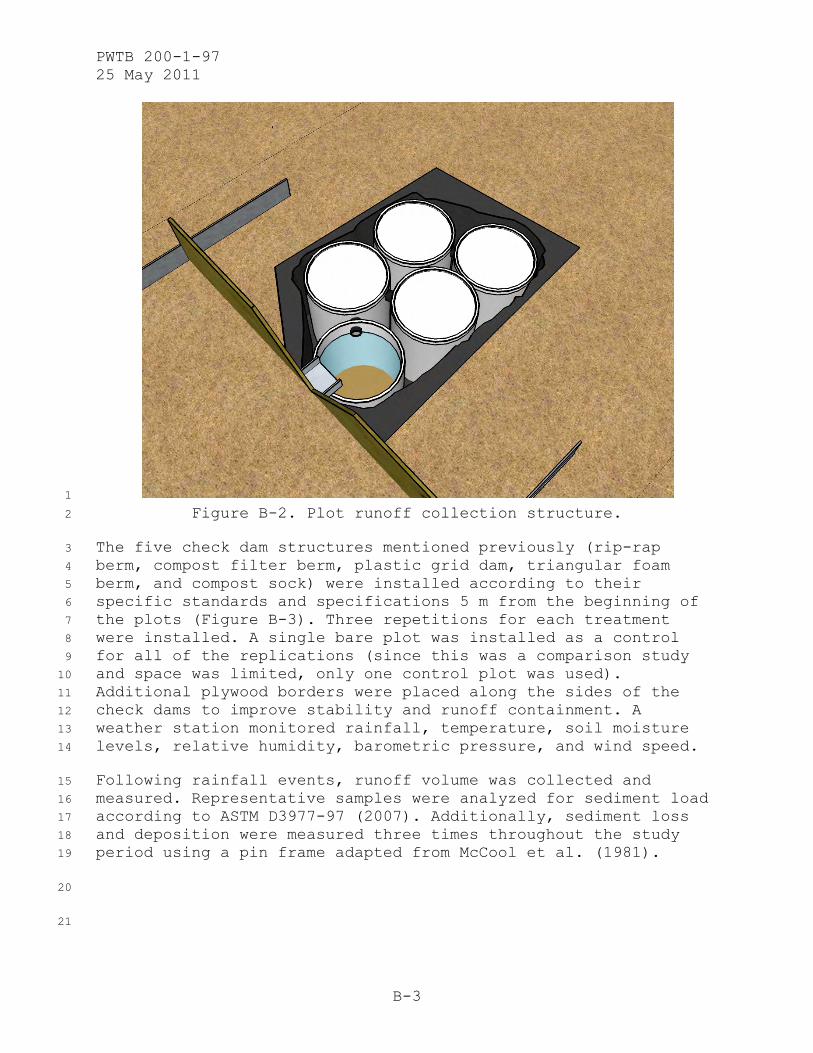
structure (Figure B-2). Runoff was collected in a series of 18
buckets. 19
20
21
Figure B-1. Field plot layout at start of study. 22
PWTB 200-1-97 25 May 2011
B-3
1
Figure B-2. Plot runoff collection structure. 2
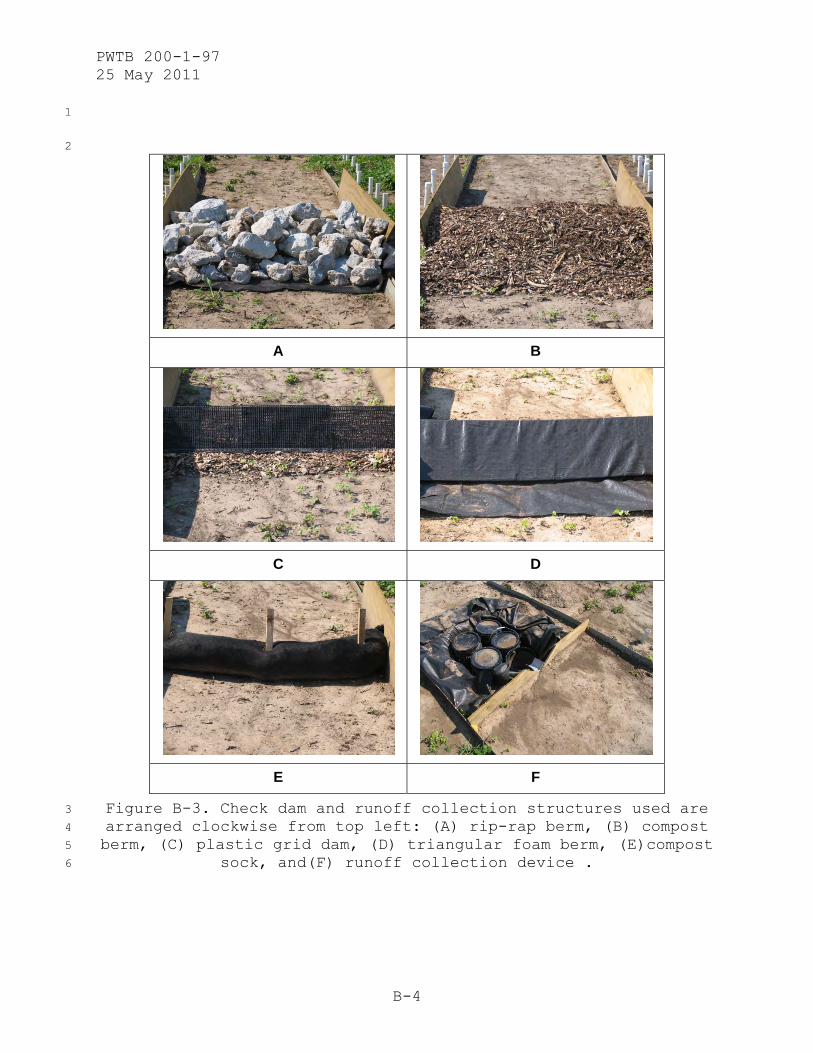
The five check dam structures mentioned previously (rip-rap 3
berm, compost filter berm, plastic grid dam, triangular foam 4
berm, and compost sock) were installed according to their 5
specific standards and specifications 5 m from the beginning of 6
the plots (Figure B-3). Three repetitions for each treatment 7
were installed. A single bare plot was installed as a control 8
for all of the replications (since this was a comparison study 9
and space was limited, only one control plot was used). 10
Additional plywood borders were placed along the sides of the 11
check dams to improve stability and runoff containment. A 12
weather station monitored rainfall, temperature, soil moisture 13
levels, relative humidity, barometric pressure, and wind speed. 14
Following rainfall events, runoff volume was collected and 15
measured. Representative samples were analyzed for sediment load 16
according to ASTM D3977-97 (2007). Additionally, sediment loss 17
and deposition were measured three times throughout the study 18
period using a pin frame adapted from McCool et al. (1981). 19
20
21
PWTB 200-1-97 25 May 2011
B-4
1
2
A B
C D
E F
Figure B-3. Check dam and runoff collection structures used are 3
arranged clockwise from top left: (A) rip-rap berm, (B) compost 4
berm, (C) plastic grid dam, (D) triangular foam berm, (E)compost 5
sock, and(F) runoff collection device . 6
PWTB 200-1-97 25 May 2011
C-1
Appendix C: 1
2
STUDY RESULTS AND LESSONS LEARNED 3
Laboratory Experiments 4
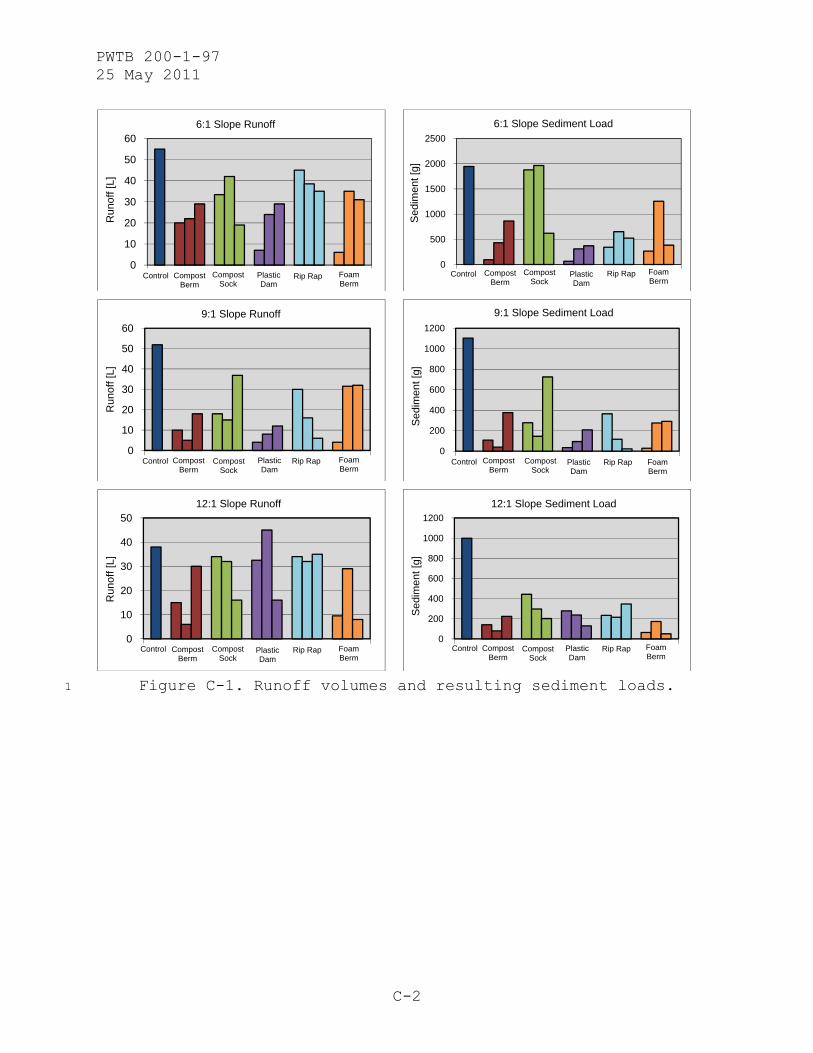
The measured runoff volumes and resulting sediment load for each 5
check dam and slope condition are given in the graphs reproduced 6
in Figure C-1. In every case, the control yielded higher runoff 7
and sediment loads than the treatments. Despite the high 8
variability between experiments, some trends become apparent. 9
With the exception of the runoff volumes observed in the 12:1 10
slope condition, as slope increased, runoff volumes and sediment 11
loads also increased. Compared to the other dams tested, the 12
compost sock yielded higher runoff and sediment values. 13
PWTB 200-1-97 25 May 2011
C-2
Figure C-1. Runoff volumes and resulting sediment loads. 1
Control Compost Berm
Compost Sock
Plastic Dam
Rip Rap Foam Berm
0
10
20
30
40
50
60
Run
off [
L]6:1 Slope Runoff
Control Compost Berm
Compost Sock
Plastic Dam
Rip Rap Foam Berm
0
500
1000
1500
2000
2500
Sed
imen
t [g]
6:1 Slope Sediment Load
Control Compost Berm
Compost Sock
Plastic Dam
Rip Rap Foam Berm
0
10
20
30
40
50
60
Run
off [
L]
9:1 Slope Runoff
Control Compost Berm
Compost Sock
Plastic Dam
Rip Rap Foam Berm
0
200
400
600
800
1000
1200
Sed
imen
t [g]
9:1 Slope Sediment Load
Control Compost Berm
Compost Sock
Plastic Dam
Rip Rap Foam Berm
0
10
20
30
40
50
Run
off [
L]
12:1 Slope Runoff
Control Compost Berm
Compost Sock
Plastic Dam
Rip Rap Foam Berm
0
200
400
600
800
1000
1200
Sed
imen
t [g]
12:1 Slope Sediment Load
PWTB 200-1-97 25 May 2011
C-3
1
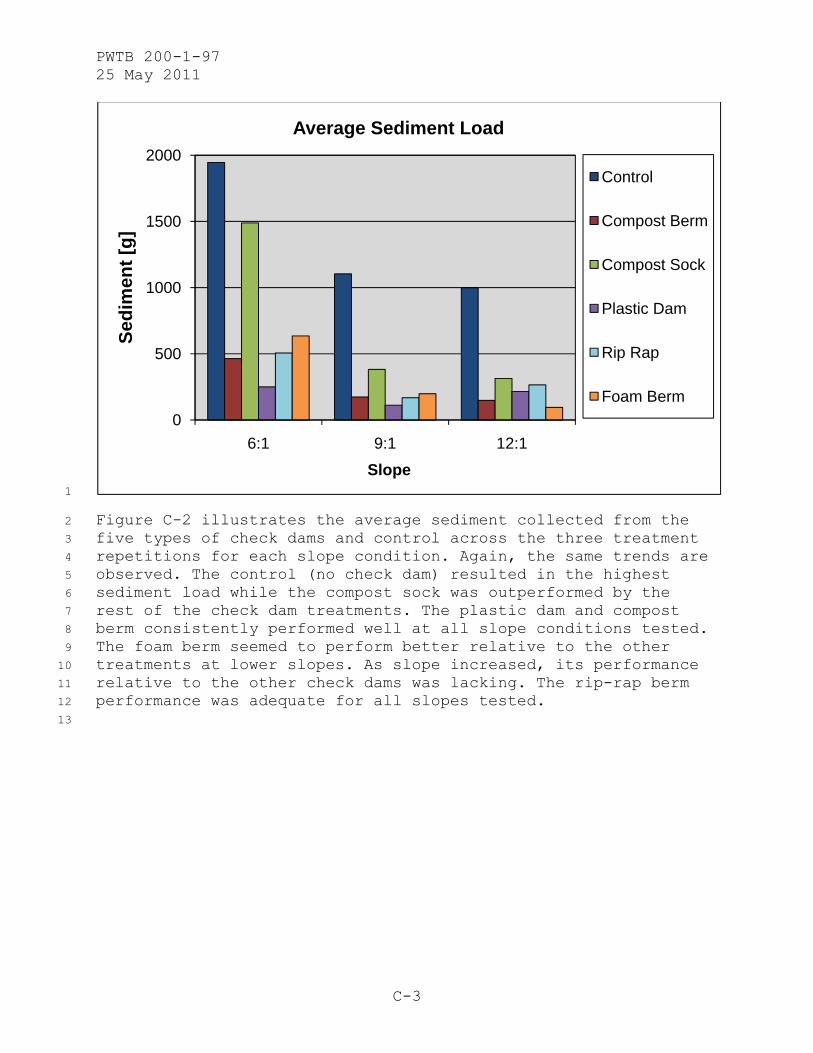
Figure C-2 illustrates the average sediment collected from the 2
five types of check dams and control across the three treatment 3
repetitions for each slope condition. Again, the same trends are 4
observed. The control (no check dam) resulted in the highest 5
sediment load while the compost sock was outperformed by the 6
rest of the check dam treatments. The plastic dam and compost 7
berm consistently performed well at all slope conditions tested. 8
The foam berm seemed to perform better relative to the other 9
treatments at lower slopes. As slope increased, its performance 10
relative to the other check dams was lacking. The rip-rap berm 11
performance was adequate for all slopes tested. 12
13
0
500
1000
1500
2000
6:1 9:1 12:1
Sed
imen
t [g
]
Slope
Average Sediment Load
Control
Compost Berm
Compost Sock
Plastic Dam
Rip Rap
Foam Berm
PWTB 200-1-97 25 May 2011
C-4
1
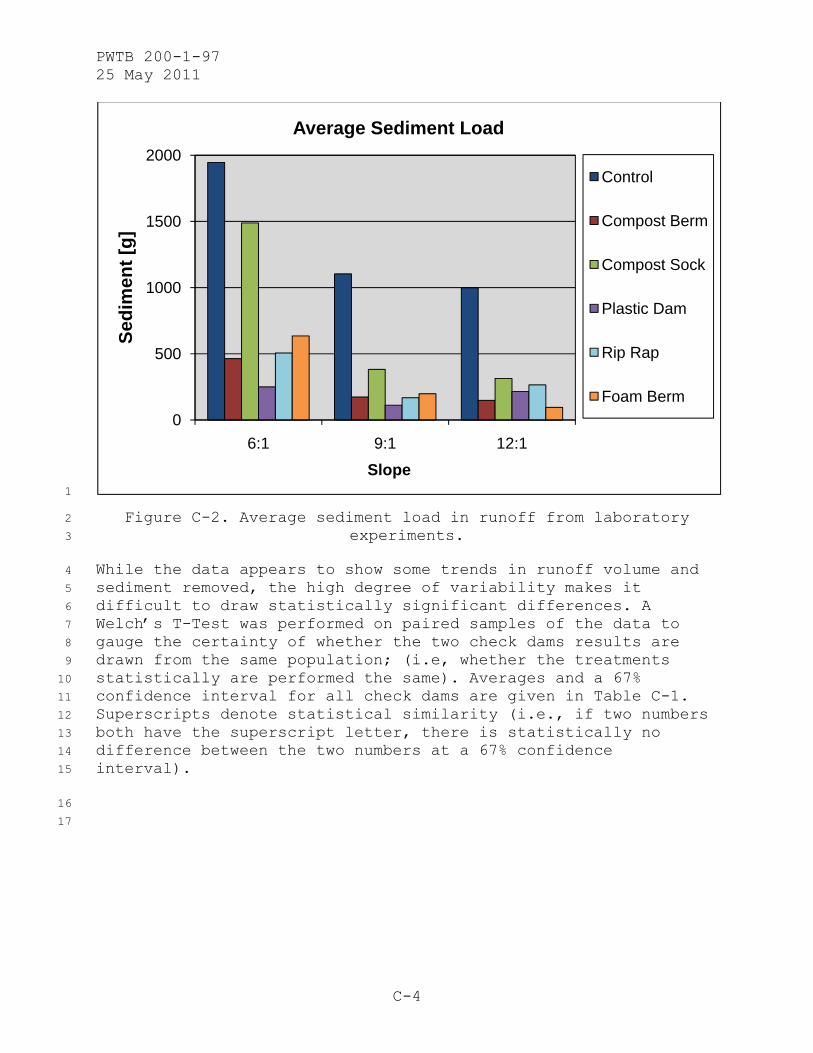
Figure C-2. Average sediment load in runoff from laboratory 2
experiments. 3
While the data appears to show some trends in runoff volume and 4
sediment removed, the high degree of variability makes it 5
difficult to draw statistically significant differences. A 6
Welch’s T-Test was performed on paired samples of the data to 7
gauge the certainty of whether the two check dams results are 8
drawn from the same population; (i.e, whether the treatments 9
statistically are performed the same). Averages and a 67% 10
confidence interval for all check dams are given in Table C-1. 11
Superscripts denote statistical similarity (i.e., if two numbers 12
both have the superscript letter, there is statistically no 13
difference between the two numbers at a 67% confidence 14
interval). 15
16
17
0
500
1000
1500
2000
6:1 9:1 12:1
Sed
imen
t [g
]
Slope
Average Sediment Load
Control
Compost Berm
Compost Sock
Plastic Dam
Rip Rap
Foam Berm
PWTB 200-1-97 25 May 2011
C-5
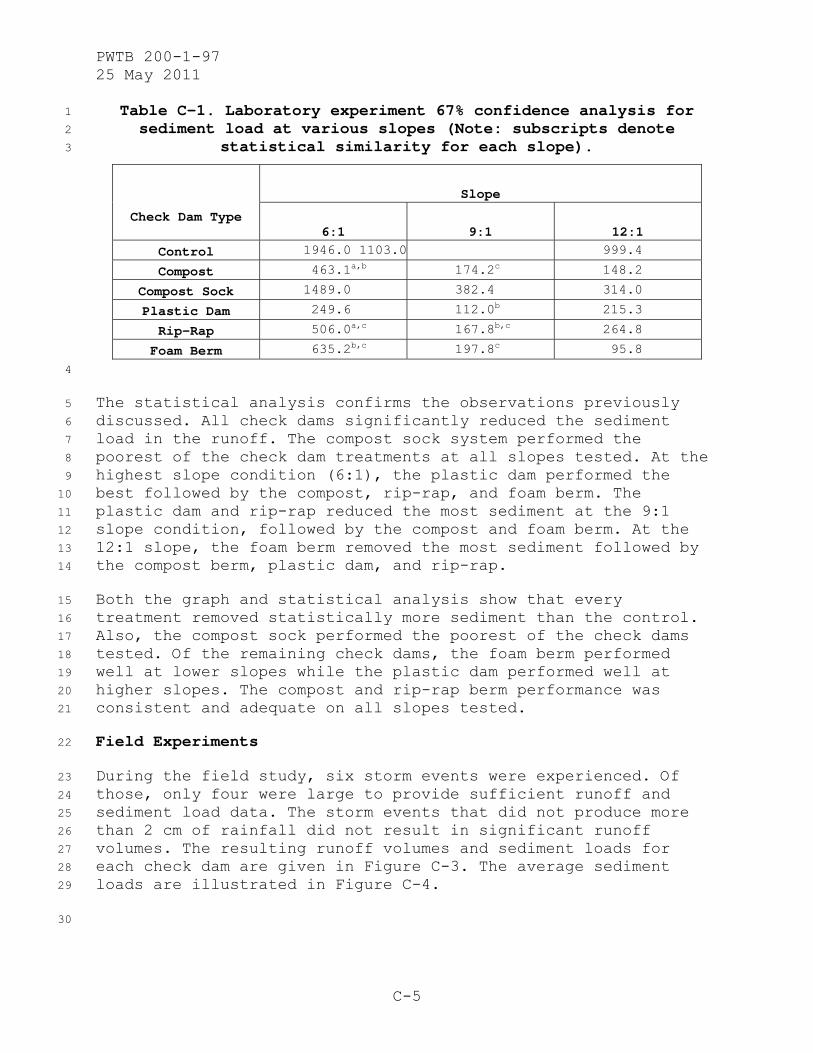
Table C-1. Laboratory experiment 67% confidence analysis for 1
sediment load at various slopes (Note: subscripts denote 2
statistical similarity for each slope). 3
Check Dam Type
Slope
6:1 9:1 12:1
Control 1946.0 1103.0 999.4
Compost 463.1a,b 174.2c 148.2
Compost Sock 1489.0 382.4 314.0
Plastic Dam 249.6 112.0b 215.3
Rip-Rap 506.0a,c 167.8b,c 264.8
Foam Berm 635.2b,c 197.8c 95.8
4
The statistical analysis confirms the observations previously 5
discussed. All check dams significantly reduced the sediment 6
load in the runoff. The compost sock system performed the 7
poorest of the check dam treatments at all slopes tested. At the 8
highest slope condition (6:1), the plastic dam performed the 9
best followed by the compost, rip-rap, and foam berm. The 10
plastic dam and rip-rap reduced the most sediment at the 9:1 11
slope condition, followed by the compost and foam berm. At the 12
12:1 slope, the foam berm removed the most sediment followed by 13
the compost berm, plastic dam, and rip-rap. 14
Both the graph and statistical analysis show that every 15
treatment removed statistically more sediment than the control. 16
Also, the compost sock performed the poorest of the check dams 17
tested. Of the remaining check dams, the foam berm performed 18
well at lower slopes while the plastic dam performed well at 19
higher slopes. The compost and rip-rap berm performance was 20
consistent and adequate on all slopes tested. 21
Field Experiments 22
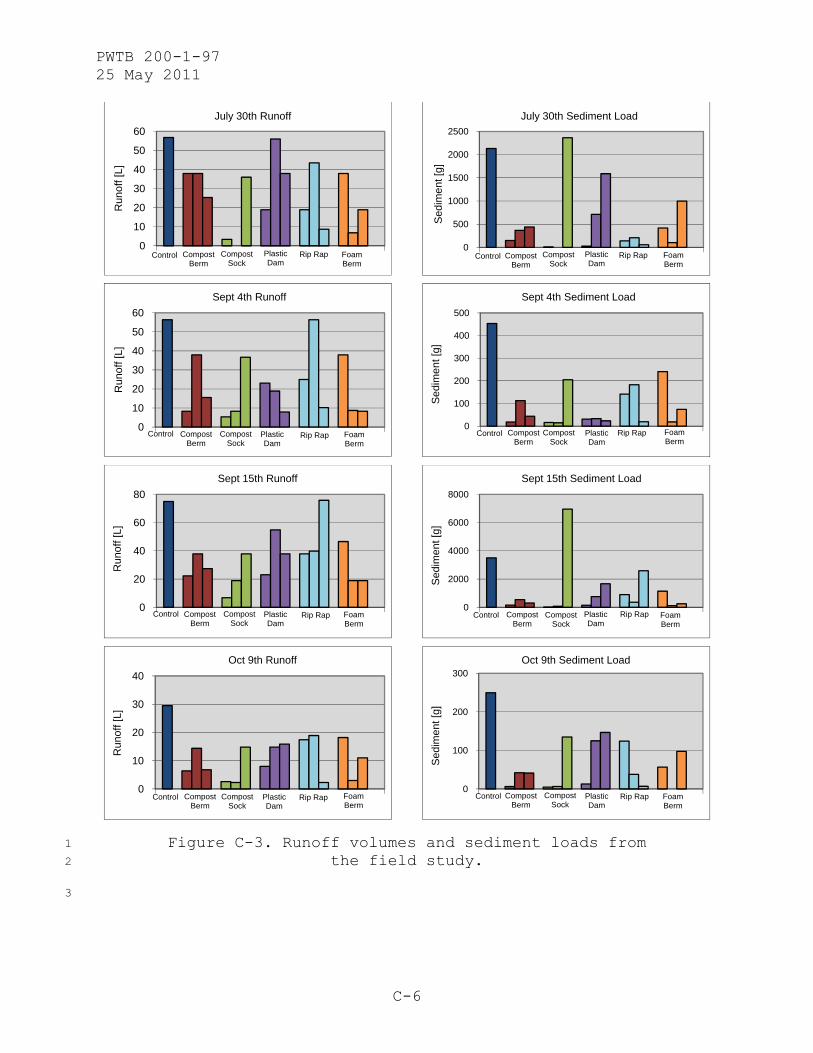
During the field study, six storm events were experienced. Of 23
those, only four were large to provide sufficient runoff and 24
sediment load data. The storm events that did not produce more 25
than 2 cm of rainfall did not result in significant runoff 26
volumes. The resulting runoff volumes and sediment loads for 27
each check dam are given in Figure C-3. The average sediment 28
loads are illustrated in Figure C-4. 29
30
PWTB 200-1-97 25 May 2011
C-6
Figure C-3. Runoff volumes and sediment loads from 1
the field study. 2
3
Control Compost Berm
Compost Sock
Plastic Dam
Rip Rap Foam Berm
0
10
20
30
40
50
60R
unof
f [L]
July 30th Runoff
Control Compost Berm
Compost Sock
Plastic Dam
Rip Rap Foam Berm
0
500
1000
1500
2000
2500
Sed
imen
t [g]
July 30th Sediment Load
Control Compost Berm
Compost Sock
Plastic Dam
Rip Rap Foam Berm
0
10
20
30
40
50
60
Run
off [
L]
Sept 4th Runoff
Control Compost Berm
Compost Sock
Plastic Dam
Rip Rap Foam Berm
0
100
200
300
400
500
Sed
imen
t [g]
Sept 4th Sediment Load
Control Compost Berm
Compost Sock
Plastic Dam
Rip Rap Foam Berm
0
20
40
60
80
Run
off [
L]
Sept 15th Runoff
Control Compost Berm
Compost Sock
Plastic Dam
Rip Rap Foam Berm
0
2000
4000
6000
8000
Sed
imen
t [g]
Sept 15th Sediment Load
Control Compost Berm
Compost Sock
Plastic Dam
Rip Rap Foam Berm
0
10
20
30
40
Run
off [
L]
Oct 9th Runoff
Control Compost Berm
Compost Sock
Plastic Dam
Rip Rap Foam Berm
0
100
200
300
Sed
imen
t [g]
Oct 9th Sediment Load
PWTB 200-1-97 25 May 2011
C-7
1
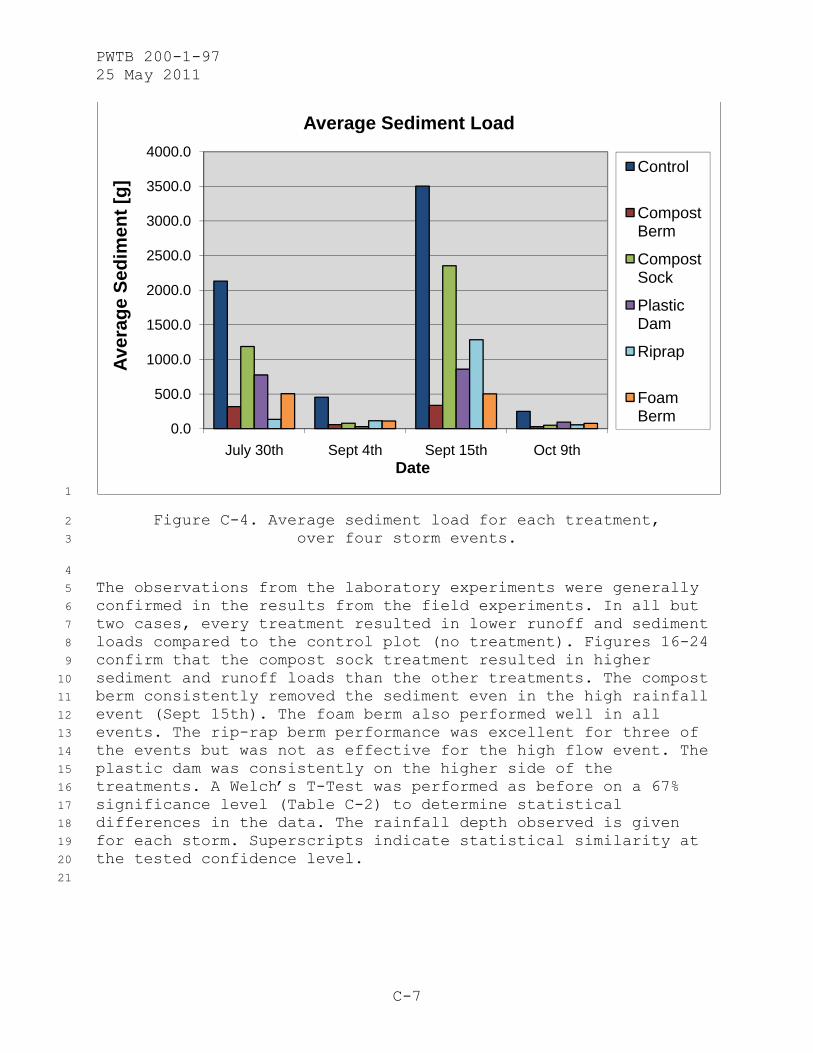
Figure C-4. Average sediment load for each treatment, 2
over four storm events. 3
4
The observations from the laboratory experiments were generally 5
confirmed in the results from the field experiments. In all but 6
two cases, every treatment resulted in lower runoff and sediment 7
loads compared to the control plot (no treatment). Figures 16-24 8
confirm that the compost sock treatment resulted in higher 9
sediment and runoff loads than the other treatments. The compost 10
berm consistently removed the sediment even in the high rainfall 11
event (Sept 15th). The foam berm also performed well in all 12
events. The rip-rap berm performance was excellent for three of 13
the events but was not as effective for the high flow event. The 14
plastic dam was consistently on the higher side of the 15
treatments. A Welch’s T-Test was performed as before on a 67% 16
significance level (Table C-2) to determine statistical 17
differences in the data. The rainfall depth observed is given 18
for each storm. Superscripts indicate statistical similarity at 19
the tested confidence level. 20
21
0.0
500.0
1000.0
1500.0
2000.0
2500.0
3000.0
3500.0
4000.0
July 30th Sept 4th Sept 15th Oct 9th
Ave
rag
e S
edim
ent
[g]
Date
Average Sediment Load
Control
Compost Berm
Compost Sock
Plastic Dam
Riprap
Foam Berm
PWTB 200-1-97 25 May 2011
C-8
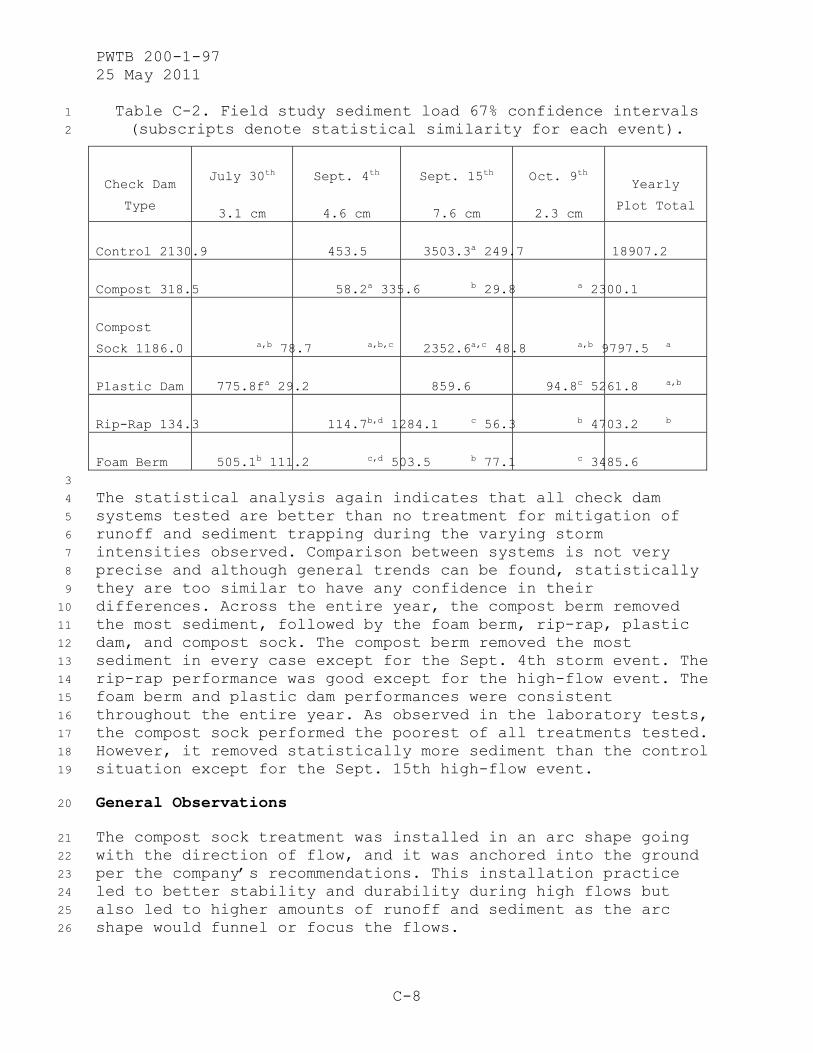
Table C-2. Field study sediment load 67% confidence intervals 1
(subscripts denote statistical similarity for each event). 2
Check Dam
Type
July 30th
3.1 cm
Sept. 4th
4.6 cm
Sept. 15th
7.6 cm
Oct. 9th
2.3 cm
Yearly
Plot Total
Control 2130.9 453.5 3503.3a 249.7 18907.2
Compost 318.5 58.2a 335.6 b 29.8 a 2300.1
Compost
Sock 1186.0 a,b 78.7 a,b,c 2352.6a,c 48.8 a,b 9797.5 a
Plastic Dam 775.8fa 29.2 859.6 94.8c 5261.8 a,b
Rip-Rap 134.3 114.7b,d 1284.1 c 56.3 b 4703.2 b
Foam Berm 505.1b 111.2 c,d 503.5 b 77.1 c 3485.6 3
The statistical analysis again indicates that all check dam 4
systems tested are better than no treatment for mitigation of 5
runoff and sediment trapping during the varying storm 6
intensities observed. Comparison between systems is not very 7
precise and although general trends can be found, statistically 8
they are too similar to have any confidence in their 9
differences. Across the entire year, the compost berm removed 10
the most sediment, followed by the foam berm, rip-rap, plastic 11
dam, and compost sock. The compost berm removed the most 12
sediment in every case except for the Sept. 4th storm event. The 13
rip-rap performance was good except for the high-flow event. The 14
foam berm and plastic dam performances were consistent 15
throughout the entire year. As observed in the laboratory tests, 16
the compost sock performed the poorest of all treatments tested. 17
However, it removed statistically more sediment than the control 18
situation except for the Sept. 15th high-flow event. 19
General Observations 20
The compost sock treatment was installed in an arc shape going 21
with the direction of flow, and it was anchored into the ground 22
per the company’s recommendations. This installation practice 23
led to better stability and durability during high flows but 24
also led to higher amounts of runoff and sediment as the arc 25
shape would funnel or focus the flows. 26
PWTB 200-1-97 25 May 2011
C-9
Rip-Rap berms also had the issue of taking a sheet flow and 1
turning it into several streams of water and thus concentrating 2
the energy and volume of the original flow. It is likely that 3
the rock size used in the berm is a major factor in this aspect. 4
The triangular foam berm was highly unstable due to its light 5
weight. Flow would routinely undercut and scour around the geo-6
textile base and, on certain occasions, flow went completely 7
under the structure. This outcome led to some of the variability 8
observed in the data. 9
The plastic grid dam was hard to qualify because it sat on a 10
compost blanket. The rainfall events and subsequent runoff did 11
not obtain significant depth of flow, so the majority of the 12
overland flow was filtered by this compost blanket. Higher flow 13
rates and intensities should be used to better assess this 14
structure. 15
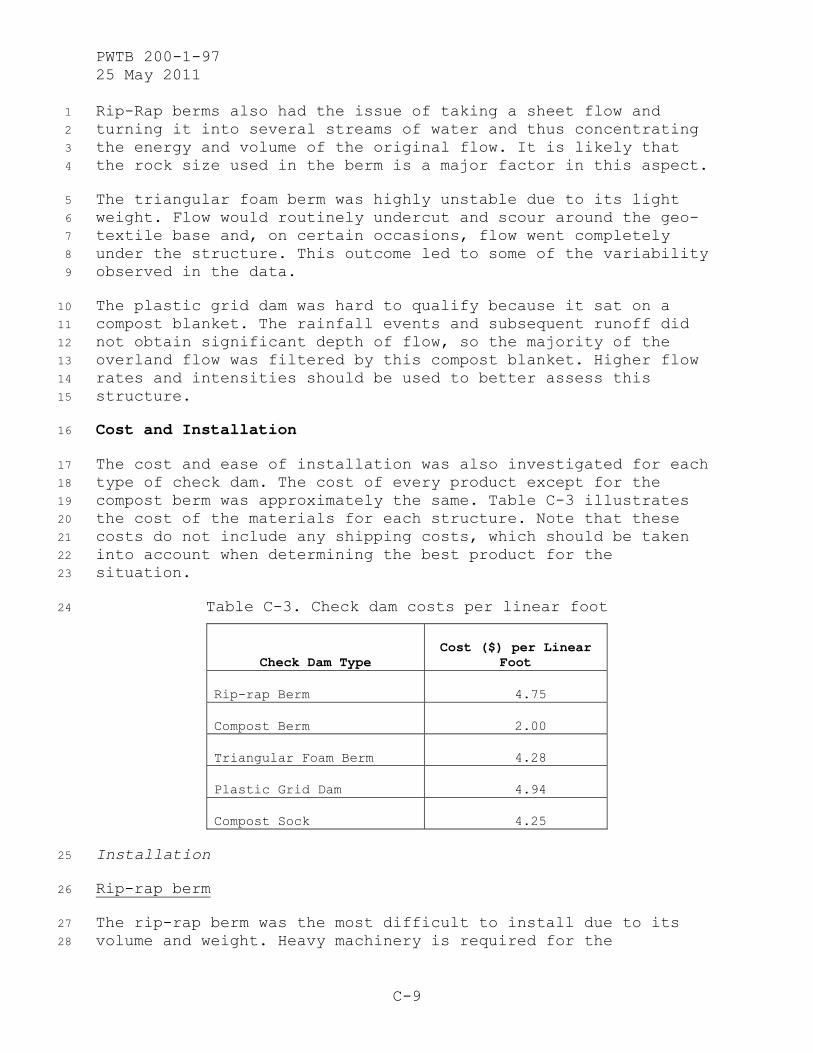
Cost and Installation 16
The cost and ease of installation was also investigated for each 17
type of check dam. The cost of every product except for the 18
compost berm was approximately the same. Table C-3 illustrates 19
the cost of the materials for each structure. Note that these 20
costs do not include any shipping costs, which should be taken 21
into account when determining the best product for the 22
situation. 23
Table C-3. Check dam costs per linear foot 24
Check Dam Type Cost ($) per Linear
Foot
Rip-rap Berm 4.75
Compost Berm 2.00
Triangular Foam Berm 4.28
Plastic Grid Dam 4.94
Compost Sock 4.25
Installation 25
Rip-rap berm 26
The rip-rap berm was the most difficult to install due to its 27
volume and weight. Heavy machinery is required for the 28
PWTB 200-1-97 25 May 2011
C-10
installation of rip-rap check dams. A woven geo-textile is 1
required as an underlayment and should be installed on the soil 2
surface to prevent erosion from preferential flow through the 3
check dam. The rip-rap size specifications vary by the local 4
NRCS should be consulted for further recommendations. Rip-rap 5
berms should not exceed 3 ft in height and the center of the dam 6
should at least 9 in. lower than the sides to prevent flow from 7
eroding the edges. 8
Compost Berm 9
Compost berms can be created using locally available materials. 10
In this study, compost was used to create a trapezoidal berm 11
roughly 1 ft tall and 5 ft wide at the base. This large volume 12
of material makes installation difficult without the necessary 13
equipment. However, installation was easier than for the rip-rap 14
berm. For long-term success, it is recommended that the compost 15
berm be seeded and vegetated. 16
Triangular Foam Berm 17
The triangular foam berms were installed according to 18
manufacturer specifications. The berms are pre-wrapped with geo-19
textile and have a front and back geo-textile “apron.” The berms 20
were placed perpendicular to the flow of water with geo-textile 21
aprons extending 2-3 ft on both sides of the berm. Staples of 22
No. 11 gauge wire 6-8 in. long were used to secure the berm and 23
geo-textile aprons. The installation was fairly easy due to its 24
light weight and the pre-wrapped geo-textile. 25
Plastic Grid Dam 26
The manufacturer recommends that plastic grid dams be installed 27
on an erosion control blanket that is properly installed in the 28
ditch. A number of commercially available products are adequate. 29
For the purpose of this demonstration, locally available compost 30
was used to create a erosion control cover. At least a 4 ft 31
width blanket is recommended. The plastic grid dam is installed 32
in the middle of the blanket (perpendicular to flow) and secured 33
with 10 in. spiral stakes. At least 3 stakes must be used on the 34
upstream side of the dam and 2 stakes on the downstream side. 35
Once the erosion cover was installed, the installation of the 36
grid dam was extremely easy. 37
Compost Sock 38
The compost sock is installed forming a U-shaped figure towards 39
the incoming water to create a ponding effect. The berm must be 40
PWTB 200-1-97 25 May 2011
C-11
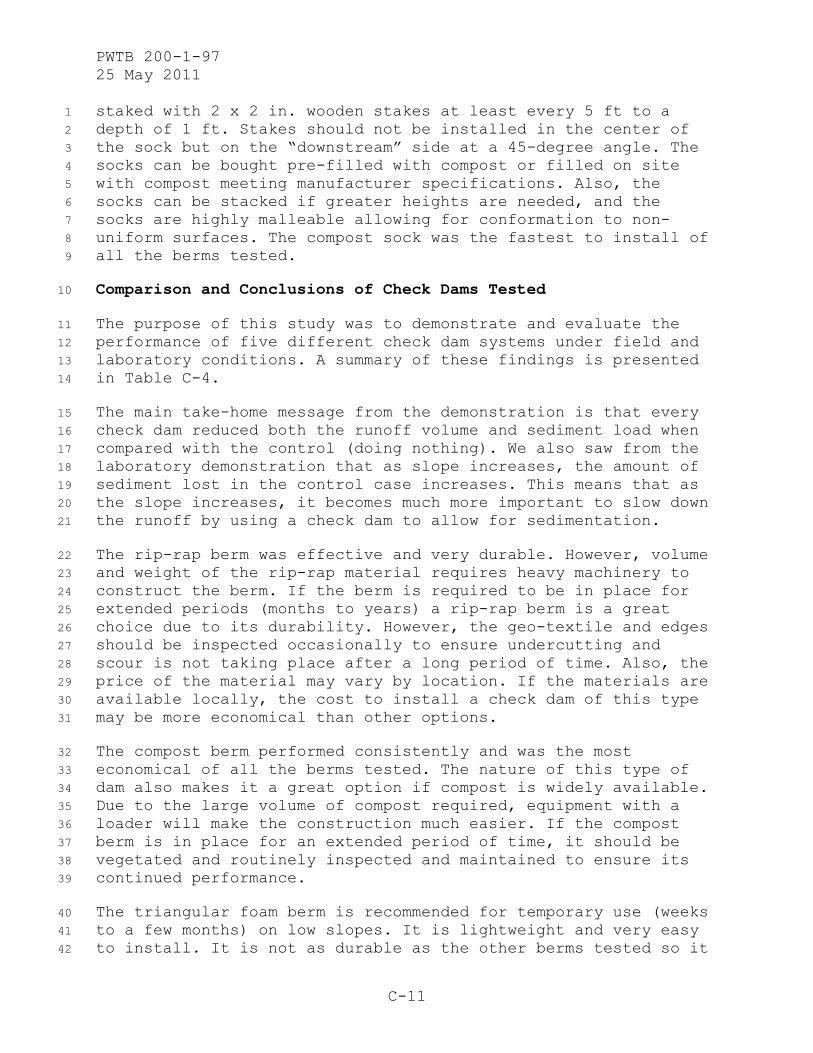
staked with 2 x 2 in. wooden stakes at least every 5 ft to a 1
depth of 1 ft. Stakes should not be installed in the center of 2
the sock but on the “downstream” side at a 45-degree angle. The 3
socks can be bought pre-filled with compost or filled on site 4
with compost meeting manufacturer specifications. Also, the 5
socks can be stacked if greater heights are needed, and the 6
socks are highly malleable allowing for conformation to non-7
uniform surfaces. The compost sock was the fastest to install of 8
all the berms tested. 9
Comparison and Conclusions of Check Dams Tested 10
The purpose of this study was to demonstrate and evaluate the 11
performance of five different check dam systems under field and 12
laboratory conditions. A summary of these findings is presented 13
in Table C-4. 14
The main take-home message from the demonstration is that every 15
check dam reduced both the runoff volume and sediment load when 16
compared with the control (doing nothing). We also saw from the 17
laboratory demonstration that as slope increases, the amount of 18
sediment lost in the control case increases. This means that as 19
the slope increases, it becomes much more important to slow down 20
the runoff by using a check dam to allow for sedimentation. 21
The rip-rap berm was effective and very durable. However, volume 22
and weight of the rip-rap material requires heavy machinery to 23
construct the berm. If the berm is required to be in place for 24
extended periods (months to years) a rip-rap berm is a great 25
choice due to its durability. However, the geo-textile and edges 26
should be inspected occasionally to ensure undercutting and 27
scour is not taking place after a long period of time. Also, the 28
price of the material may vary by location. If the materials are 29
available locally, the cost to install a check dam of this type 30
may be more economical than other options. 31
The compost berm performed consistently and was the most 32
economical of all the berms tested. The nature of this type of 33
dam also makes it a great option if compost is widely available. 34
Due to the large volume of compost required, equipment with a 35
loader will make the construction much easier. If the compost 36
berm is in place for an extended period of time, it should be 37
vegetated and routinely inspected and maintained to ensure its 38
continued performance. 39
The triangular foam berm is recommended for temporary use (weeks 40
to a few months) on low slopes. It is lightweight and very easy 41
to install. It is not as durable as the other berms tested so it 42
PWTB 200-1-97 25 May 2011
C-12
should be considered only for temporary use. It performed well 1
at lower slopes but was one of the poorer performers at higher 2
slopes so this finding should be kept in mind when determining 3
which berm to use. 4
The plastic grid dam was the most expensive product tested. 5
However, it is lightweight and easy to install. If a check dam 6
needs to be installed quickly, it would be simple to spread out 7
a compost blanket or geo-textile and stake the dam in place. Due 8
to its construction, the dam could likely be re-used. The dam 9
performed much better for lower flows. Higher flow rates, in 10
which the dam was overtopped, were not tested and may not be 11
recommended. This means it should not be used where a large area 12
is contributing to a small outlet without further research. 13
The compost sock was economical, very easy to install, and has 14
the potential for reuse. However, its ability to remove sediment 15
and reduce runoff volumes was lower than the rest of the check 16
dams evaluated in this study. Although the socks were prefilled 17
with compost by the manufacturer, a particle-size analysis of 18
the compost material found that the contained compost did not 19
meet the manufacturer’s guidelines. This possibly contributed to 20
the limited success of this product. Additionally, product 21
success may be improved if a very small trench was dug (1-2 in. 22
deep), with the check dam installed in the trench, and then 23
backfilled and packed around the sock. While this would increase 24
the installation time overall, it would reduce the effect of 25
undercutting and scouring under the check dam. If compost is 26
readily available, this check dam also is attractive due to 27
lower costs. 28
29
30
PWTB 200-1-97 25 May 2011
C-13
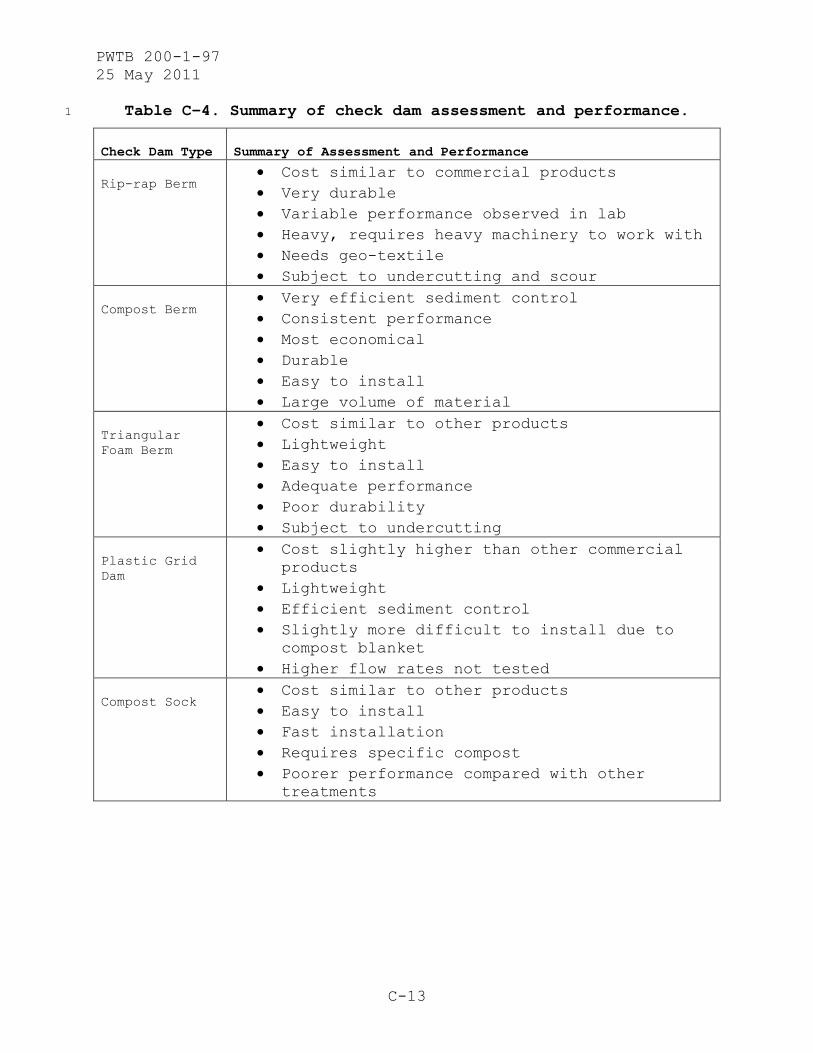
Table C-4. Summary of check dam assessment and performance. 1
Check Dam Type Summary of Assessment and Performance
Rip-rap Berm Cost similar to commercial products Very durable Variable performance observed in lab Heavy, requires heavy machinery to work with Needs geo-textile Subject to undercutting and scour
Compost Berm Very efficient sediment control Consistent performance Most economical Durable Easy to install Large volume of material
Triangular Foam Berm
Cost similar to other products Lightweight Easy to install Adequate performance Poor durability Subject to undercutting
Plastic Grid Dam
Cost slightly higher than other commercial products
Lightweight Efficient sediment control Slightly more difficult to install due to
compost blanket Higher flow rates not tested
Compost Sock Cost similar to other products Easy to install Fast installation Requires specific compost Poorer performance compared with other
treatments
PWTB 200-1-97 25 May 2011
D-1
Appendix D:
REFERENCES
ASTM International. 2007. ASTM Standard D3977-97, Standard test method for determining sediment concentration in water samples. Book of Standards Vol. 11.02. Available at: http://www.astm.org/Standards/D3977.htm (accessed 8 June 2010).
Ayers, P.D., M. Vance, L. Haugen, and A.B. Anderson. 2000. An evaluation of DGPS-based continuously operating vehicle monitoring systems to determine site-specific event severity factors. Technical Report 00-43.Champaign, IL: United States Army Construction Engineering Research Laboratory.
Hirschi, M.C., J.K. Mitchell, D.R. Feezor, and B.J. Lesikar. 1990. Microcomputer-controlled laboratory rainfall simulator. Transactions of the ASAE 33:1950–1953.
Lal, R. 1994. Soil erosion research methods, 2nd Ed. Delray Beach, FL: St. Lucie Press.
McCool, D.K., Dossett, M.G. and Yecha, S.J. 1981. A portable rill meter for field measurement of soil loss. In: Erosion and Sediment Transport Measurement, Proceedings of the Florence Symposium, IAHS Publ. no. 133.
Natural Resources and Conservation Service (NRCS). 2008. Soil survey of Champaign County, IL. United States Department of Agriculture.
Wang, G., G. Gertner, H. Howard, and A. Anderson. 2007. Optimal spatial resolution for collection of ground data and multi-sensor image mapping of a soil erosion cover factor. Journal of Environmental Management 88 (4): 1088-98.
Whitecotton, C.A., M.B. David, R.G. Darmody, and D.L. Price. 2000. Impact of foot traffic from military training on soil and vegetation properties. Journal of Environmental Management 26(6): 697-706.
PWTB 200-1-97 25 May 2011
E-1
Appendix E
ACRONYMS AND ABBREVIATIONS
Term Spellout
AR Army RegulationBMP best management practicesCECW Directorate of Civil Works, U. S. Army Corps of
Engineers CEMP Directorate of Military Programs, U. S. Army Corps
of EngineersCERL Construction Engineering Research Laboratory CFR Code of the Federal RegulationsCONUS Continental United StatesDA Department of the ArmyDPW Directorate of Public WorksDoD Department of DefenseEO Executive OrderEPA Environmental Protection Agency; also USEPA ERDC Engineer Research and Development Center HQUSACE Headquarters, U.S. Army Corps of Engineers OCONUS outside Continental United StatesPDF portable document filePOC point of contactPWTB Public Works Technical BulletinURL universal resource locatorUSACE U.S. Army Corps of EngineersWBDG Whole Building Design GuideWWW World Wide Web

(This publication may be reproduced.)