publication title microplanning for immunization service ... · 35 6 15 apr 12 10 cum total 29 25 4...
TRANSCRIPT

resource from :
implementing hpv vaccination programs: practical experience from path
This document is available online at: www.rho.org/HPV-vaccine-implementation.htm
publication title
Microplanning for Immunization Service Delivery Using the Reaching Every District (RED) Strategy
publisher
World Health Organization
publication date
2009

ÃÃ
ÃÃ
CumTotalDecCum
TotalNovCumTotalOctCum
TotalSepCumTotal
91
76
15
16
Aug
7
7
CumTotal
84
70
14
17
Jul
14
12
CumTotal
70
58
12
17
Jun
15
12
CumTotal
55
46
9
16
May
14
11
CumTotal
41
35
6
15
Apr
12
10
CumTotal
29
25
4
14
Mar
7
8
CumTotal
22
17
5
23
Feb
12
9
CumTotal
10
8
2
20
Jan
10
8
156
104
52
13*12=
13*11= 143
13*10= 130
13*9= 117
13*8=
13*7= 91
13*6= 78
13*5= 65
13*4=
13*3= 39
13*2= 26
13*1= 13
13*0= 0
Fill in at the endof each month
Total immunized Penta1
Total immunized Pentra3
Drop out number (DO)(Penta1-Penta3)
Drop out %(DO/Penta1) *100
Penta1 coverage
Penta3 coverage
Table 1: Data analysis
Area name
Compile population, immunization coverage data in the previous 12 months Analyse problem Prioritize area
Target population figures
Doses of vaccine administered Immunization coverage (%) Un-immunized Drop out rates (%) Identify problems Categorize the problem
<1 year Penta1 Penta3 Msl TT2+/Td Penta1 Penta3 Msl TT2+/Td Penta3 Msl Penta1 to Penta3
Penta1 to Msl
Access Utilisa-tion
Category 1, 2, 3, 4
Priority 1, 2, 3, 4, 5……
a b c d e f g h i j k l m n o p q r
1 Refer to Table 2
Table 7: Sample health facility workplan for one quarter (i.e. three months)
JAN
UA
RY
Health
Centre Mon Tues
1
Wed
2
Thur
3
Fri
4
Sat
5
Sun
6
Mon7
Tues
8
Wed
9
Thur
10
Fri
11
Sat
12
Sun
13
Mon
14
Tues
15
Wed
16
Thur
17
Fri
18
Sat
19
Sun
20
Mon
21
Tues
22
Wed
23
Thu
24
Fri
25
Sat
26
Sun
27
Mon
M
E
C
B
A
New activities for January based on data analysis: Supply - Review stock recording system in all health centres | Staff - Organize training on AD syringes | Service - Meeting with community leader
FE
BR
UA
RY
Health
Centre
3
Mon
4
Tues
5
Wed
6
Thur
7
Fri
8
Sat
9
Sun
10
Mon11
Tues
12
Wed
13
Thur
14
Fri
15
Sat
16
Sun
17
Mon
18
Tues
19
Wed
20
Thur
21
Fri
22
Sat
23
Sun
24
Mon
25
Tues
26
Wed
27
Thu
28
Fri Sat Sun
M
E
C
B
A
New activities for February based on data analysis: Supply - Review cold chain management system | Staff - | Service -
MA
RC
H
Health
Centre
3
Mon
4
Tues
5
Wed
6
Thur
7
Fri
8
Sat
9
Sun
10
Mon11
Tues
12
Wed
13
Thur
14
Fri
15
Sat
16
Sun
17
Mon
18
Tues
19
Wed
20
Thur
21
Fri
22
Sat
23
Sun
24
Mon
25
Tues
26
Wed
27
Thu
28
Fri
29
Sat
30
Sun
31
Mon
M
E
C
B
A
New activities for March based on data analysis: Supply - Review stock recording system in all health centres | Staff - Organize training on AD syringes | Service - Meeting with community leader
1. Area map
4. Stock records
2. Session plan 6. Monitoring chart
3. Workplan5. Drop-outs tracking system
Go for100% coverage
Microplanning for immunization service delivery using the Reaching Every District (RED) strategy
WHO/IVB/09.11
ORIGINAL: ENGLISH

ii
The Department of Immunization, Vaccines and Biologicalsthanks the donors whose unspecified financial supporthas made the production of this publication possible.
This publication was produced by theExpanded Programme on Immunization
of the Department of Immunization, Vaccines and Biologicals
Ordering code: WHO/IVB/09.11Printed: October 2009
This publication is available on the Internet at:www.who.int/vaccines-documents/
Copies may be requested from:World Health Organization
Department of Immunization, Vaccines and BiologicalsCH-1211 Geneva 27, Switzerland
+ 41 22 791 4227 [email protected]
© World Health Organization 2009
All rights reserved. Publications of the World Health Organization can be obtained from WHO Press, World Health Organization, 20 Avenue Appia, 1211 Geneva 27, 41 22 791 3264 41 22 791 [email protected]). Requests for permission to reproduce or translate WHO publications – whether for sale or for non-commercial distribution – should be
41 22 791 [email protected]).
The designations employed and the presentation of the material in this publication do not imply the expression of any opinion whatsoever on the part of the World Health Organization concerning the legal status of any country, territory, city or area or of its authorities, or concerning the delimitation of its frontiers or boundaries. Dotted lines on maps represent approximate border lines for which there may not yet be full agreement.
The mention of specific companies or of certain manufacturers’ products does not imply that they are endorsed or recommended by the World Health Organization in preference to others of a similar nature that are not mentioned. Errors and omissions excepted, the names of proprietary products are distinguished by initial capital letters.
All reasonable precautions have been taken by the World Health Organization to verify the information contained in this publication. However, the published material is being distributed without warranty of any kind, either expressed or implied. The responsibility for the interpretation and use of the material lies with the reader. In no event shall the World Health Organization be liable for damages arising from its use.

iii
Table of contents
Abbreviations and acronyms iv
Introduction 1
Purpose of this guide 1
Introduction to the Reaching Every District (RED) strategy 4
Part 1: Health facility microplanning 7
Step 1: Quantitative analysis of local immunization data 9
Step 2: Preparing and reviewing an operational map 14
Step 3: Identifying special activities for the hard-to-reach and problem areas 16
Step 4: Preparing a health facility session plan 19
Step 5: Problem solving using the RED strategy 23
Step 6: Making a workplan for one quarter 26
Step 7: Using a monitoring chart 29
Step 8: Working with the community and tracking defaulters 32
Step 9: Managing supplies 34
Step 10: Making use of the monthly report 37
Annex 1: Simple questionnaire to investigate reasons for low coverage and dropouts 39
Annex 2: Worked examples 42
Annex 3: Special considerations for health facilities serving the hard-to-reach 45
Annex 4: Planning to reach high-risk urban areas 47
Preparing a map for urban immunization 47
Special planning issues for reaching the urban poor 49
Part 2: District microplanning 51
Step 1: Analyses of district level data to identify priority areas 53
Step 2: Making a map to show all health facilities and outreach sites 54
Step 3: Making a district workplan 56
Step 4: Making an estimate of resource requirements 60
Step 5: Conducting regular monitoring and review of progress 63
Step 6: Taking action based on a review of progress 65
Part 3: Microplanning FAQs 67
FAQs: Conducting a data analysis 69
FAQs: Preparing a map 70
FAQs: Preparing a session plan 71
FAQs: Using the RED strategy 73
FAQs: Preparing a workplan. 74

iv
Abbreviations and acronyms
AD auto-disable (syringe)
AEFI adverse events following immunization
AFP acute flaccid paralysis
BCG bacille Calmette-Guérin (vaccine)
DO drop-out number
DTP diphtheria-tetanus-pertussis (vaccine)
DTP-HepB A combination vaccine containing DTP and hepatitis B vaccines
DTP-HepB+HibA combination vaccine containing DTP, HepB and Haemophilus influenzae type b vaccines
FAQs frequently asked questions
HepB hepatitis B (vaccine)
Hib Haemophilus influenzae type b (vaccine)
HF health facility
MNT maternal and neonatal tetanus
NGO Non-Governmental Organization
NIDs national immunization days
OPV oral polio vaccine
Penta pentavalent vaccine (DTP-HepB+Hib)
RED Reaching Every District
SIA supplementary immunization activity/activities
Td tetanus-diphtheria toxoids
TT tetanus toxoid
UNICEF United Nations Children’s Fund
VPD vaccine-preventable disease
VVM vaccine vial monitor
WHO World Health Organization
YF yellow fever
Microplanning for immunization service delivery using the Reaching Every District (RED) strategy

1
Microplanning for immunization service delivery using the Reaching Every District (RED) strategy
IntroductionPurpose of this guide
The purpose of this guide is to strengthen district and health facility
capacity to:
produce high quality microplans;
increase immunization coverage and reduce drop-outs
for infants and pregnant women;
identify and target the unreached;
regularly use data to monitor and follow up at all levels.
The guide is based on successful country experiences in microplanning, using the
it starts with health facility (service delivery) microplans which will then be put together to make the district microplan.

2
Microplanning for immunization service delivery using the Reaching Every District (RED) strategy
There are three parts to this guide.
Part 1: Health facility microplanning
Part 2: District level microplanning
Part 3: Microplanning FAQs
Summary of contents
Part 1: Health facility microplanning
Part 1 describes how to make a microplan at the health facility level. The guide is interactive and describes how health facility staff can analyse their own data and identify problems, and find solutions, using the RED strategy as a framework. We recommend that the guide be used during workshops, facilitated by staff from the district and other levels. Various tables and worked examples are provided.
the map, session plan, workplan, stock record, drop-out tracking system, and monitoring chart.
There are 10 steps to making a health facility microplan:
STEP 1: Quantitative analysis of local immunization data
STEP 2: Preparing and reviewing an operational map
STEP 3: Identifying special activities for the hard-to-reach and problem areas
STEP 4: Preparing a health facility session plan
STEP 5: Problem solving using the RED strategy
STEP 6: Making a workplan for one quarter
STEP 7: Using a monitoring chart
STEP 8: Working with the community and tracking defaulters
STEP 9: Managing supplies
STEP 10: Making use of the monthly report
ANNEX 1, 2, 3 and 4

3
Microplanning for immunization service delivery using the Reaching Every District (RED) strategy
Part 2: District level microplanning
Part 2 uses the ‘bottom-up’ approach by describing how a district can put together all the health facility microplans to make a district microplan. It also
solve service delivery problemsmake a budgetadd a system to monitor and follow up on progress.
This guide is interactive and requires district staff to analyse and use their own current immunization data to set priorities.
and events, an activity plan, and budget.
There are six steps to making a district microplan by putting together all the health facility microplans:
STEP 1: Analyses of district level data to identify priority areas
STEP 2: Making a map to show all health facilities and outreach sites
STEP 3: Making a district workplan
STEP 4: Making an estimate of resource requirements
STEP 5: Conducting regular monitoring and review of progress
STEP 6: Taking action based on a review of progress
Part 3: Microplanning FAQs

4
Microplanning for immunization service delivery using the Reaching Every District (RED) strategy
Introduction to the Reaching Every
District (RED) strategy
History of the RED strategy
and other partners to help improve immunization systems. The RED strategy encourages districts and health facilities1 to make microplans to identify local problems and find corrective solutions, using their own data. Since 2002, several countries worldwide have started implementing RED strategies to varying degrees, and country evaluations in 2005 and 2007 have shown that implementation of the RED strategy results in significantly more infants being reached. An important finding of these evaluations was that service delivery works best when health facilities make their own microplans. In some countries, the RED strategy has been used as the basis for delivering other interventions beyond immunization, to strengthen the health system.
References related to the RED strategy:
Report. World Health Organization Regional Office for Africa, June 2005. http://www.who.int/immunization_delivery/systems_policy/AFRO-
REDevaluationreport_2005.pdf
In-Depth Evaluation of the Reaching Every District Approach in the African Region.World Health Organization Regional Office for Africa, 2007. http://www.afro.who.int/ddc/vpd/routine/red-2007.pdf
http://www.who.int/immunization_delivery/systems_policy/AFRO-RED_Aug2008.pdf
1 Definitions: 1st level – national level, 2nd level – province/state, 3rd level – district/county/township/municipality, 4th level – health
facility level
5
Microplanning for immunization service delivery using the Reaching Every District (RED) strategy
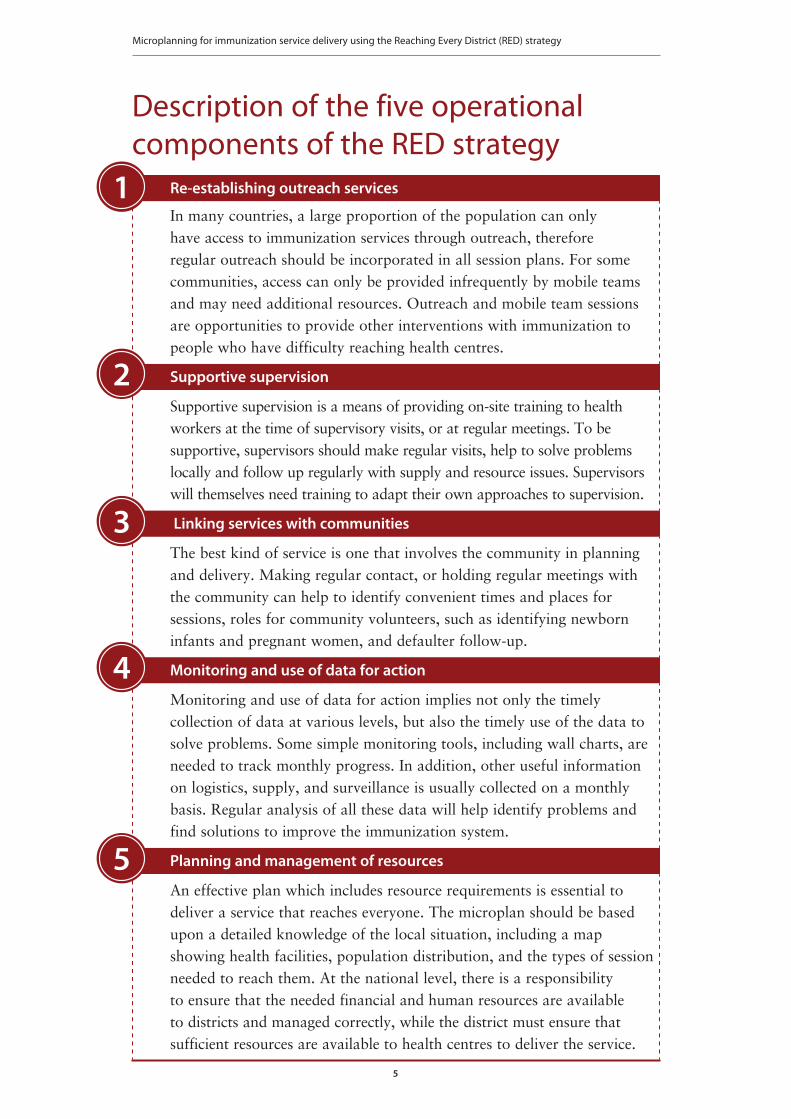
Description of the five operational components of the RED strategy Re-establishing outreach services
In many countries, a large proportion of the population can only have access to immunization services through outreach, therefore regular outreach communities, access can only be provided infrequently by mobile teams and may need additional resources. Outreach and mobile team sessions are opportunities to provide other interventions with immunization to people who have difficulty reaching health centres.
Supportive supervision
Supportive supervision is a means of providing on-site training to health workers at the time of supervisory visits, or at regular meetings. To be supportive, supervisors should make regular visits, help to solve problems locally and follow up regularly with supply and resource issues. Supervisors will themselves need training to adapt their own approaches to supervision.
Linking services with communities
The best kind of service is one that involves the community in planning
the community can help to identify convenient times and places for sessions, roles for community volunteers, such as identifying newborn infants and pregnant women, and defaulter follow-up.
Monitoring and use of data for action
collection of data at various levels, but also the timely use of the data to solve problems. Some simple monitoring tools, including wall charts, are needed to track monthly progress. In addition, other useful information on logistics, supply, and surveillance is usually collected on a monthly basis. Regular analysis of all these data will help identify problems and find solutions to improve the immunization system.
Planning and management of resources
An effective plan which includes resource requirements is essential to deliver a service that reaches everyone. The microplan should be based upon a detailed knowledge of the local situation, including a map showing health facilities, population distribution, and the types of session needed to reach them. At the national level, there is a responsibility to ensure that the needed financial and human resources are available to districts and managed correctly, while the district must ensure that sufficient resources are available to health centres to deliver the service.
1
2
3
4
5

6
Microplanning for immunization service delivery using the Reaching Every District (RED) strategy
NOTES:

Part 1: Health facility microplanning
STEP 1Quantitative analysis of local immunization data
STEP 2: Preparing and reviewing an operational map
STEP 3: Identifying special activities for the hard-to-reach and problem areas
STEP 4: Preparing a health facility session plan
STEP 5: Problem solving using the RED strategy
STEP 6: Making a workplan for one quarter
STEP 7: Using a monitoring chart
STEP 8: Working with the community and tracking defaulters
STEP 9: Managing supplies
STEP 10: Making use of the monthly report
Part 1: Health facility m
icroplanningP
art 2
: District m
icrop
lan
nin
gP
art 3
: Micro
pla
nn
ing
FA
Qs


Part 1 | Health facility microplanning
9
STEP 1Quantitative analysis of local immunization data
Use your own local data and prioritize the unimmunized.
The first step for all health facilities is to analyse your own data. Table 1 should be
a calculator. Use Table 2 to help you categorize problems of access and utilization.
In this guide we have made certain assumptions which you can change according to the national situation. For example we use Pentavalent vaccine (DTP-HepB+Hib), calculate drop-outs from Penta1 to Penta32 and measles vaccine. We also use 80% coverage and 10% drop-out rates as cut-off levels, which may be too high or too low. All of these assumptions can be changed if needed.
Table 1 is divided into 18 columns (a to r)
Column a: Area name Write a list of names of all the villages and/or urban areas that you serve in your catchment area.
Column b: Target population <1 year
Write the number of infants less than one year of age in each of the areas listed in column a. Note that for this guide the number of pregnant women is the same as the number of infants.
Column c: Doses of Penta1 administered
Write the number of doses of Penta1 administered to infants in each area.
Column d: Doses of Penta3 administered
Write the number of doses of Penta3 administered to infants in each area.
Column e: Doses of measles vaccine administered
Write the number of doses of measles vaccine administered to infants in each area.
Column f: administered administered to pregnant women in each area.
2 There are many variations of combination vaccine in use, for example DTP-HepB-Hib, DTP-HepB etc. Use the formulation currently
available in your country
Part 1: Health facility m
icroplanningP
art 2
: District m
icrop
lan
nin
gP
art 3
: Micro
pla
nn
ing
FA
Qs

Microplanning for immunization service delivery using the Reaching Every District (RED) strategy
10
Column g: Immunization coverage Penta1 (%)
Divide the doses of Penta1 administered (c) by the target population <1 year (b)
and multiply by 100.
g = c x 100
Column h: Immunization coverage Penta3 (%)
Divide the doses of Penta3 administered (d) by the target population <1 year (b)
and multiply by 100.
h = d x 100
Column i: Immunization coverage measles vaccine (%)
Divide the doses of measles vaccine administered (e) by the target population <1 year (b) and multiply by 100.
i = e x 100
Column j: Immunization coverage (f) by the target population <1 year (b)
and multiply by 100.
j = f x 100
Column k: Unimmunized with Penta3
Subtract the doses of Penta3 administered (d) from the target population <1 year (b)
k = b − d
Column l: Unimmunized with measles vaccine
Subtract the doses of measles vaccine administered (e) from the target population <1 year (b).
l = b − e
b
b
b
b

Part 1 | Health facility microplanning
11
Column m: Drop-out rates Penta1 to Penta3 (%)
Subtract the doses of Penta3 (d) from the doses of Penta1 (c), divide by the doses of penta1 (c) and multiply by 100.
m = c-d x 100
Column n: Drop-out rates Penta1 to measles vaccine (%)
Subtract the doses of measles vaccine (e) from the doses of Penta1 (c), divide by the doses of Penta1 (c) and multiply by 100.
n = c-e x 100
Column o: Identify problems of access
Refer to Table 2 (analysis of problems of access and utilization). Write 'good' or 'poor' according to whether Penta1 is at least 80% or less than 80%.
Column p: Identify problems of utilization
Refer to Table 2 (analysis of problems of access and utilization). Write 'good' or 'poor' according to whether the drop-out rate is 10% or less, or more than 10%*.
Column q: Category of problem Refer to Table 2 (analysis of problems of access and utilization). In this table problems are categorized 1, 2, 3, 4 according to the level of problems of access and utilization. Use the information in columns (o) and (p) to write the number 1, 2, 3 or 4 in column (q).
Column r: Prioritize the area. Refer to column (m) and (n) which show the unimmunized population for Penta3 or measles vaccine. Now give a priority number to each area starting at priority number 1 for the highest number of unimmunized, and continue according to the number of unimmunized infants for either of these vaccines. Each area should have an individual priority number assigned; no two areas should have the same number.
* Remember you can vary the ‘80%’ and ‘10%’ cut off points according to the local situation.
c
c
Part 1: Health facility m
icroplanningP
art 2
: District m
icrop
lan
nin
gP
art 3
: Micro
pla
nn
ing
FA
Qs

Microplanning for immunization service delivery using the Reaching Every District (RED) strategy
12
Ta
ble
1:
Dat
a an
alys
is
Area
na
me
Com
pile
pop
ulat
ion,
imm
uniz
atio
n co
vera
ge d
ata
in th
e pr
evio
us 1
2 m
onth
sAn
alys
e pr
oble
mPr
iorit
ize
area
Targ
et
popu
latio
n fig
ures
Dos
es o
f vac
cine
adm
inist
ered
Imm
uniz
atio
n co
vera
ge (%
) U
n-im
mun
ized
D
rop
out r
ates
(%)
Iden
tify
prob
lem
sCa
tego
rize
the
prob
lem
<1 y
ear
Pent
a1Pe
nta3
Msl
TT2+
/Td
Pent
a1Pe
nta3
Msl
TT
2+/T
dPe
nta3
Msl
Pent
a1 to
Pe
nta3
Pent
a1 t
o M
slAc
cess
3U
tilisa
-tio
n3Ca
tego
ry
1, 2
, 3, 4
Prio
rity
1, 2
, 3, 4
, 5…
…
ab
cd
ef
gh
ij
kl
mn
op
qr
3Re
fer t
o Ta
ble
2

Part 1 | Health facility microplanning
13
Ta
ble
2:
Ana
lyse
pro
blem
s of
acc
ess
and
utili
zatio
n
Wh
at
pro
po
rtio
n o
f th
e c
hil
dre
n h
av
e A
CC
ES
S t
o i
mm
un
iza
tio
n s
erv
ice
s?
(Wh
at
is t
he
DT
P1
co
ve
rag
e?)
HIG
H c
ov
era
ge
wit
h D
TP
1 (
>8
0%
)LO
W c
ov
era
ge
wit
h D
TP
1 (
<8
0%
)
Wh
at
pro
po
rtio
n o
f ch
ild
ren
CO
MP
LE
TE
th
e i
mm
un
iza
tio
n s
che
du
le?
(Wh
at
are
th
e d
rop
-ou
t ra
tes?
)
Dro
p-o
ut
rate
< 1
0%
Dro
p-o
ut
rate
>1
0%
Dro
p-o
ut
rate
< 1
0%
Dro
p-o
ut
rate
> 1
0%
Ca
teg
ori
ze t
he
pro
ble
ms
Dro
p-o
ut
rate
s a
re
low
= g
oo
d u
tiliz
atio
n
Co
vera
ge
is h
igh
=g
oo
d a
cce
ss
Cat
eg
ory
1
(no
pro
ble
m)
Dro
p-o
ut
rate
s a
re
hig
h =
po
or
uti
lizat
ion
Co
vera
ge
is h
igh
=g
oo
d a
cce
ss
Pro
ble
m
Cat
eg
ory
2
Dro
p-o
ut
rate
s a
re
low
= g
oo
d u
tiliz
atio
n
Co
vera
ge
is l
ow
=p
oo
r ac
cess
Pro
ble
m
Cat
eg
ory
3
Dro
p-o
ut
rate
s a
re
hig
h =
po
or
uti
lizat
ion
Co
vera
ge
is l
ow
=p
oo
r ac
cess
Pro
ble
m
Cat
eg
ory
4
Part 1: Health facility m
icroplanningP
art 2
: District m
icrop
lan
nin
gP
art 3
: Micro
pla
nn
ing
FA
Qs

Microplanning for immunization service delivery using the Reaching Every District (RED) strategy
14
STEP 2Preparing and reviewing an operational map
Don't miss anyone! Make sure all groups of population are included
on the map.
Making an operational map of your catchment area
may be able to use a map already prepared for polio eradication. The map will show you how the population is situated so that you can decide which populations will be served by fixed sessions and which ones require outreach and/or other strategies such as mobile teams from the district level.
Draw a simple map of the HF catchment area. It does not have to be to scale, but it should contain all the important features of the area. Mark the following information on the map:
each village/area and all other settlements of population;
the total population and target population of each village/ward;
the hard-to-reach areas;
roads and geographical landmarks (rivers, streams, mountains);
distance between each village and the health facility (if known);
transport frequently used by the health facility to reach each village and the time taken (if known);
location of the nomadic populations and their travel/movement plans (if applicable);
identify the areas that have seasonal accessibility (if applicable).
Refer to Annex 4 for special planning for urban areas.
Using the HF catchment area map, decide the type of session suitable for each village/ward in your HF area (fixed, outreach, mobile teams).
On the map, mark what kind of session will be used to reach each village or area using the letters F (fixed), O (outreach), M (mobile teams).
and mobile, use arrows to show how they will be reached. If possible, for each outreach session identify where it will be held.

Part 1 | Health facility microplanning
15
If you are not sure which kind of session to use, the following table may help.
Fixed session Delivery of services in Serves the community within
Outreach session
Delivery of services in an 'outreach site' staff can visit in one day
Mobile teams Delivery of services beyond the 'outreach area'
Areas not possible to cover in one day, requires overnight stay
Review the operational map of the HF catchment area.
Figure 1: Sample health facility map
Part 1: Health facility m
icroplanningP
art 2
: District m
icrop
lan
nin
gP
art 3
: Micro
pla
nn
ing
FA
Qs

Microplanning for immunization service delivery using the Reaching Every District (RED) strategy
16
STEP 3Identifying special activities for the hard-to-reach and problem areas
In Step 3 you will review the data in Table 1, and decide whether there are hard-to-reach areas and other kinds of problem areas that need some special activities
areas in Table 1 in descending order of the number of unimmunized infants. To complete Table 3 you will need local knowledge of the areas concerned, because you will have to decide what special activities are needed to reach them. To help the analysis, areas can be classified as 'hard-to-reach' and 'problem areas'. However, the activities needed to reach them may be the same. When you have identified these activities you will include them in the workplan in Step 6.
Who are the hard-to-reach?
Rural hard-to-reach: These are the rural populations who have little
i) people living in areas too far4 from the health service
ii) seasonally mobile populations (e.g. nomadic populations).
Urban hard-to-reach: These are urban populations living in areas not far from services but who do not make contact with the services for a varietyof reasons. This group includes slum dwellers and squatter settlements.
Socio-economic hard-to-reach: These are the segments of society that includeminority groups who do not use government health services due to social,
i) Social reasons: Reluctance to access health services due to religious and traditional beliefs.
ii) Economic reasons: Daily wage earners lose a day's pay whenever they stand in queues at a health facility.
iii) Areas with conflict: Contact between health staff and the community can be limited due to poor security.
4 The term ‘too far’ will depend not only on physical distance but also on logistic and human resource capacity.
For example, people may live only a few kilometres away but are separated by a river or mountain.
The hard-to-reach and problem areas can be either urban or rural
populations. Wherever they are, they will need special activities to
reach them.

Part 1 | Health facility microplanning
17
What are problem areas?
In this module we can say that any area that is listed as category 3 or 4 in Table 1, column "q" can be considered as a problem area. However, there may be other problem areas that do not fall into these categories. In Table 3 you
will have a chance to decide whether these areas also need special activities.
How to complete Table 3: Planning special activities for hard-to-reach and problem areas.
Column a: List all areas according to priority.
Refer to Table 1 column (r). List the names of the areas in descending order of priority beginning with the area that has the most unimmunized infants and is therefore priority number 1.
Column b: Write the category of problem (1 to 4) for each area.
Column c: Write ‘yes’ if the area is hard to reach, or has some hard-to-reach populations living in it.
Column d: Write how many times that area was reached in the last calendar year (or 12-month period).
Column e: Decide what activities you can do from your health facility that will help to improve access and utilization in the hard-to-reach and category 3 and 4 problem areas you have listed (see Annex 3 of Part 1 for some suggestions).
Column f: Decide what activities to improve access and utilization in hard-to-reach and problem areas will need support by the district or higher levels.
Column g: Decide what other interventions can be delivered at the same time as immunization in hard-to-reach and problem areas.
Part 1: Health facility m
icroplanningP
art 2
: District m
icrop
lan
nin
gP
art 3
: Micro
pla
nn
ing
FA
Qs

Microplanning for immunization service delivery using the Reaching Every District (RED) strategy
18
Ta
ble
3:
Plan
ning
spe
cial
act
iviti
es fo
r har
d-to
-rea
ch a
nd p
robl
em a
reas
List
of a
reas
(acc
ordi
ng
to p
riorit
y)Ca
tego
ry o
f pro
blem
:1,
2, 3
, 4
(refe
r to
Tabl
e 1)
Har
d to
reac
h (Y
/N)
How
man
y tim
es w
ere
they
reac
hed
last
yea
r?A
ctiv
ities
that
can
be
cond
ucte
d by
the
heal
th
faci
lity
leve
l to
impr
ove
acce
ss a
nd u
tiliz
atio
n
Act
iviti
es th
at n
eed
supp
ort b
y di
stric
t and
/or
high
er le
vels
Wha
t oth
er in
terv
entio
ns
can
be d
eliv
ered
at
the
sam
e tim
e as
im
mun
izat
ion?
ab
cd
ef
g

Part 1 | Health facility microplanning
19
STEP 4Preparing a health facility session plan
In this guide, we base the session plan on the workload that you can do realistically from the health facility. The session plan will show the type of session, and how frequently the session will be done.
We use an estimate of the number of injections needed in a session as the basis
workload at a fixed site (80 injections) than an outreach site (40 injections). We use the estimated workload because the estimated number of infants and pregnant women attending any session is unpredictable. By making a session plan based on realistic workload you will always know in advance how much vaccine, supplies, staff and transport to have available for a session. In this way
adjust the frequency and type of session and the quantity of supplies, as needed.
Using Table 4, complete columns I, II, III, IV
Take Table 1, the map and Table 3. Using Table 4, list each area, its population and target population (columns I, II, III). Against each village/ward, note down the type of session needed according to the map you have made in Step 2 (column IV).
Calculate the workload (number of injections needed) per year (column V)
In this guide, we use number of injections as a measure of the workload during an immunization session. Referring to the national immunization schedule, count how many injections are needed to fully immunize an infant in your health facility catchment area. At a minimum, an infant will need five injections (BCG x1, pentavalent5 x3, measles x1) (plus four doses of oral OPV). In addition, two tetanus toxoid (TT or Td) doses are needed to immunize pregnant women.
This makes a total of five infant injections, plus two injections of TT or Td for pregnant women6, which makes up seven injections in all for full immunization of an infant and pregnant woman. However, some countries may use up to 10 injections (e.g. adding three doses of monodose hepatitis B).
5 If you are using DTP-HepB or DTP vaccine, the number of injections will still be the same (5) to fully immunize an infant.
6 In most countries pregnant women are targeted for routine TT immunization. While not every pregnant woman will require two
doses of TT, this module assumes that all planning will have to include two doses of TT for each pregnant woman.
Every community on the map must be included in the session plan,
showing what type of session they need.
Part 1: Health facility m
icroplanningP
art 2
: District m
icrop
lan
nin
gP
art 3
: Micro
pla
nn
ing
FA
Qs

Microplanning for immunization service delivery using the Reaching Every District (RED) strategy
20
Note that this calculation does not include booster doses for older children.
woman by the infant population to calculate the workload per year (column V).
Calculate the workload (number of injections needed) per month (column VI)
To calculate the monthly total workload, divide the yearly total workload (column V) by 12.
Calculate the estimated number of sessions needed per month7 at each fixed and outreach site (column VII)
health staff (the reasonable workload) during one fixed session and one
facility can reasonably deliver approximately 80 injections per session, and an outreach session approximately 40 injections per session. However, this number may vary depending on your local conditions, i.e. the number and availability of staff, vaccines and other supplies, distance between the health facility and the outreach post, and the need to provide other health services at the same time.
Divide the number of injections needed per month by 80 for a fixed site.
Divide the number of injections needed per month by 40 for an outreach site.
Make a realistic judgement and write down the actual number of sessions per month at each fixed and outreach site (column VIII)
availability of vaccination staff, availability of community volunteers, and distance from outreach.
The calculation you have made for Step 4 may give you an unrealistic number of sessions, for example less than one session per month or three sessions per month. Now you must make realistic judgement of the number of sessions per month at each fixed and outreach site, based on local knowledge. Decide whether an area needs larger less frequent sessions or smaller more frequent sessions.
Include other child survival interventions to be delivered with immunization (column IX)
List other child survival interventions that can be delivered with immunization (e.g. insecticide treated bednets, deworming tablets, etc.). Refer to Table 3, column (g) and add these to column IX.
7 Some areas may not need a session every month; however, a minimum four sessions per year should be ensured.

Part 1 | Health facility microplanning
21
Identify if the area is hard to reach (column X)
Use your judgment and knowledge of the area to plan the number
- number of health workers and other staff available;
- time taken to reach the outreach site;
- availability of community volunteers at the session site;
Avoid very small or very large sessions.
Decide an appropriate session frequency to make best use of resources.
In deciding the session frequency, try to ensure the most efficient use of time, especially for outreach. Less frequent but better attended outreach sessions can improve the use of resources.
The actual number of sessions planned for any area will depend on many factors. Use your local knowledge and judgement to make efficient use of your local resources.
Make your session plan efficient!
Part 1: Health facility m
icroplanningP
art 2
: District m
icrop
lan
nin
gP
art 3
: Micro
pla
nn
ing
FA
Qs

Microplanning for immunization service delivery using the Reaching Every District (RED) strategy
22
Ta
ble
4: S
essi
on p
lan
tem
plat
e
Nam
e of
hea
lth
faci
lity
catc
hmen
t are
a:D
ate:
Are
a na
me
Tota
l po
pula
tion
Targ
et
popu
latio
nSe
ssio
n ty
pe
(Fix
ed, O
utre
ach,
M
obile
)
Inje
ctio
ns p
er
year
(ta
rget
po
pula
tion
x 7a )
No.
of i
njec
tions
pe
r mon
th(in
ject
ions
per
ye
ar/1
2)
Estim
ated
se
ssio
ns p
er
mon
th (d
ivid
e by
80 fo
r Fixe
d an
d 40
fo
r Out
reac
h)
Actu
al se
ssio
ns
plan
ned
per
mon
th(re
alist
ic
judg
emen
t)
Oth
er c
hild
su
rviv
al
inte
rven
tions
plan
ned?
Har
d-to
-rea
char
ea/p
opul
atio
n (r
efer
to T
able
3)
III
III
IVV
VI
VII
VII
IIX
X
aSe
e St
ep 4
, poi
nt 2
to u
nder
stan
d th
e ra
tiona
le fo
r cal
cula
ting
the
num
ber o
f in
ject
ions
per
yea
r

Part 1 | Health facility microplanning
23
STEP 5Problem solving using the RED strategy
In Steps 1 and 3 you identified problems of access and utilization specific to certain areas. In Step 5 you will have the opportunity to consider general or qualitative problems and solutions that may affect the whole or part of your catchment area. The five operational components of the RED strategy can be used to help structure the problems and solutions. Table 5 is organized according to the five operational components of the RED strategy. Some examples of questions are provided in the box below. Use the questions to help you think of real problems and solutions for your area.
How to use Table 5:
- Write a full list of problems against each of the RED components.
- Write a list of activities that will solve the problems:
(with limited resources) such as re-arranging the session plan, working with community volunteers etc.;
Secondly, activities that need resources and assistance from the next
providing supplies, equipment, access to vehicles needed for certain sessions;technical support and information on new aspects of the programme.
- If the activity is specific to a certain area covered by your health facility, name the area, otherwise, indicate that the activity concerns the whole of your catchment area.
- As far as possible write the name of the person responsible for each problem-solving activity and the date when the activity will be done.
When you provide a monthly report, refer to this list to report on activities that you have done, and those that are still outstanding.
Can you list the important problems concerning immunization
services in your area? Can you suggest solutions to these problems?
The RED strategy will help you to identify problems and solutions.
Part 1: Health facility m
icroplanningP
art 2
: District m
icrop
lan
nin
gP
art 3
: Micro
pla
nn
ing
FA
Qs

Microplanning for immunization service delivery using the Reaching Every District (RED) strategy
24
Here are some examples of questions to help think about your
own problems and solutions.
Re-establishment of outreach services
Does your workplan state the time and place of every outreach session that you plan?
Do you monitor outreach sessions planned and completed?
Do some communities receive less than four outreach sessions per year?
Supportive supervision
the last six months?
Do the supervisors take time to provide some needed information and help solve problems?
Is there follow-up on findings from previous supervisory visits?
Community links with service delivery
Are the communities you serve involved in planning the place and time of sessions?
Are communities always informed in advance of sessions?
Are community volunteers available at immunization sessions?
Do you receive information on newborns from the community?
Are pregnant women aware of the need for TT/Td immunization and how to receive it?
Are there rumours and concerns about the safety of vaccines?
Monitoring and use of data for action
Do you have a defaulter tracking system in place?
Does the district hold quarterly meetings to review performance?
Are you able to provide complete and timely monthly reports?
Do you receive feedback on monthly reports?
Is there a big difference between official denominator and immunization denominator?
Planning and management of resources
Do you have a session plan and workplan?
Do you receive the resources needed to conduct outreach?
Are there vacant staff posts in your health facility?
Have you had recent stock-outs of vaccine, safe-injection equipment, fuel and other supplies?

Part 1 | Health facility microplanning
25
Ta
ble
5:
Usi
ng th
e RE
D s
trat
egy
for p
robl
em s
olvi
ng
RED
com
pone
ntPr
oble
ms
Act
iviti
es w
ith li
mite
d re
sour
ces
Act
iviti
es n
eedi
ng re
sour
ces
and
assi
stan
ce fr
om d
istr
ict
Whe
n an
d ar
ea n
ame
Who
(per
son)
Re-e
stab
lishm
ent
of o
utre
ach
serv
ices
Supp
ortiv
e su
perv
isio
n
Com
mun
ity li
nks
with
ser
vice
de
liver
y
Mon
itorin
g an
d us
e of
dat
a fo
r act
ion
Plan
ning
and
man
agem
ent
of re
sour
ces
Part 1: Health facility m
icroplanningP
art 2
: District m
icrop
lan
nin
gP
art 3
: Micro
pla
nn
ing
FA
Qs

Microplanning for immunization service delivery using the Reaching Every District (RED) strategy
26
STEP 6Making a workplan for one quarter
Table 6 shows a workplan for one quarter (three months). To complete the
Table 3, to list all hard-to-reach activities
Table 5, to list other activities that you will carry out at the health facility.
To complete the workplan you will:
Put a timeframe to the session plan.
- fixed sessions on the same day(s) every week;
- outreach sessions on the same day or date every month to make it easier for the community to remember.
Identify sessions to be conducted by the district.
Include other activities from Steps 3 and 5 at the bottom of the workplan.
- activities identified in the problem-solving exercise;
- other regular activities like training, monitoring etc.;
- ensure there is no conflict in dates.
Make a dynamic workplan! Show all the sessions and other activities,
monitor and adapt the plan regularly.

Part 1 | Health facility microplanning
27
List the names of all areas in the health facility catchment area in the same order as in the session plan.
In the next column write the number of sessions and type of session per month, for example 'village A: 4 outreach', as written in the session plan.
In each month column (January, February, March) write the following:
- the date each session is scheduled;
- the date the session was actually held;
- the type of transport needed if outreach or mobile session;
- the person responsible for doing the session;
- whether the district needs to provide support to do the session.
vehicle needed? Should district staff conduct the session?
Under each month write extra activities and other regular activities.
- Add activities for hard-to-reach and problem areas (see Table 3);
- Add other activities that need to be carried out on a regular basis, such as monthly meetings at the district level, special campaigns etc.;
- Include periodic interventions to be delivered with immunization (e.g. bednet distribution).
Monitor session implementation.
Under each month note the number of sessions held and the number of sessions planned. If it was not possible to carry out a session as planned, state the reason why in the monthly report to the district (Step 10).
additional needs.
Part 1: Health facility m
icroplanningP
art 2
: District m
icrop
lan
nin
gP
art 3
: Micro
pla
nn
ing
FA
Qs

Microplanning for immunization service delivery using the Reaching Every District (RED) strategy
28
Ta
ble
6:
Sam
ple
heal
th fa
cilit
y w
orkp
lan
for o
ne q
uart
er (i
.e. t
hree
mon
ths)
Are
a n
am
eN
o.
of
sess
ion
s
pe
r m
on
th
Jan
ua
ryF
eb
rua
ryM
arc
h
Dat
e(s)
sch
edul
ed
Dat
e(s)
hel
d
Tran
spor
t
Pers
on re
spon
sibl
e
Dis
tric
t sup
port
(Y/N
)
Dat
e(s)
sch
edul
ed
Dat
e(s)
hel
d
Tran
spor
t
Pers
on re
spon
sibl
e
Dis
tric
t sup
port
(Y/N
)
Dat
e(s)
sch
edul
ed
Dat
e(s)
hel
d
Tran
spor
t
Pers
on re
spon
sibl
e
Dis
tric
t sup
port
(Y/N
)
Dat
e(s)
sch
edul
ed
Dat
e(s)
hel
d
Tran
spor
t
Pers
on re
spon
sibl
e
Dis
tric
t sup
port
(Y/N
)
Dat
e(s)
sch
edul
ed
Dat
e(s)
hel
d
Tran
spor
t
Pers
on re
spon
sibl
e
Dis
tric
t sup
port
(Y/N
)
Dat
e(s)
sch
edul
ed
Dat
e(s)
hel
d
Tran
spor
t
Pers
on re
spon
sibl
e
Dis
tric
t sup
port
(Y/N
)
Dat
e(s)
sch
edul
ed
Dat
e(s)
hel
d
Tran
spor
t
Pers
on re
spon
sibl
e
Dis
tric
t sup
port
(Y/N
)
Dat
e(s)
sch
edul
ed
Dat
e(s)
hel
d
Tran
spor
t
Pers
on re
spon
sibl
e
Dis
tric
t sup
port
(Y/N
)
Dat
e(s)
sch
edul
ed
Dat
e(s)
hel
d
Tran
spor
t
Pers
on re
spon
sibl
e
Dis
tric
t sup
port
(Y/N
)
Act
iviti
es fo
r har
d-to
-rea
ch
& p
robl
em a
reas
Activ
ities
Pers
on re
spon
sibl
e
Activ
ities
Pers
on re
spon
sibl
e
Activ
ities
Pers
on re
spon
sibl
e
Regu
lar a
ctiv
ities
Ac
tiviti
es
Pers
on re
spon
sibl
e
Activ
ities
Pers
on re
spon
sibl
e
Activ
ities
Pers
on re
spon
sibl
e
Mon
itorin
g of
ses
sion
impl
emen
tatio
nN
umbe
r of s
essio
ns h
eld
in Ja
n:N
umbe
r of s
essio
ns h
eld
in F
eb:
Num
ber o
f ses
sions
hel
d in
Mar
.
Num
ber o
f ses
sions
pla
nned
in Ja
n:N
umbe
r of s
essio
ns p
lann
ed in
Feb
:N
umbe
r of s
essio
ns p
lann
ed in
Mar
.

Part 1 | Health facility microplanning
29
STEP 7Using a monitoring chart
for example Penta1-Penta3, BCG-measles, etc.
Using the monitoring chart
The monitoring chart has been developed to track the monthly, and annual, progress towards immunizing infants under one year of age. It also helps you to determine if the target population is completing the series of vaccines (e.g. Penta3), or dropping out.
Calculate the annual and monthly target population to receive immunization services
catchment area, especially those who are hard to reach. Use existing population figures for infants under one year of age obtained from official census data or your own community census;
of infants under one year of age by 12. (If, for example, the annual target under one year is 156, the monthly target will be 156/12 = 13.)
Label the chart
Complete the information on the top of the chart, i.e. area and year. Label the left and right side of the chart with the monthly target figures. Label the boxes at the bottom with the name of the vaccine and dose, e.g. Penta1 and measles, or Penta1 and Penta3;
Draw a diagonal line from zero to the top right-hand corner to show the ideal rate of progress if every infant is immunized on time.
Plot immunization data on the chart
The chart can be used to monitor doses given and dropout rates.
a Locate the row of boxes underneath the graph. Locate the spaces for the month you are recording. Enter the monthly total of Penta1 immunization given.
b Add the current month’s total to the previous cumulative total to calculate the current cumulative total and enter it on the right side of the monthly column you are recording.
c 8 total recorded on the right side of the monthly column you are recording.
8 Cumulative means the total number of doses of vaccines given in the current month, plus the monthly totals for all the previous
months. Use the same time period for each dose and vaccine. For example, the cumulative number of Penta1 doses given by the end
of March is the total number of doses given in January plus the total number given in February plus the total number given in March.
The monitoring chart is the best tool for showing progress. It should
always be displayed on the wall of the health facility next to the workplan.
Part 1: Health facility m
icroplanningP
art 2
: District m
icrop
lan
nin
gP
art 3
: Micro
pla
nn
ing
FA
Qs

Microplanning for immunization service delivery using the Reaching Every District (RED) strategy
30
d Connect the new dot to the previous month’s dot with a straight line.
e Repeat the above steps (a to d) every month until the end of the year.
f Plot Penta3 immunizations given in the same way as Penta1 (follow steps a to e).
Calculate the total number of drop-outs between Penta1 and Penta3 (DO#).
Subtract the cumulative total for Penta3 from the cumulative total for Penta1.
DO% = Penta1 cumulative total minus Penta3 cumulative total x 100 Penta1 cumulative total
Use the information on the monitoring chart
try to understand why and, if there is a problem, try to take corrective action.
and vaccinate defaulters, which will put your programme back on track.
CumTotalDecCum
TotalNovCumTotalOctCum
TotalSepCumTotal
91
77
15
16
Aug
7
7
CumTotal
84
70
14
17
Jul
14
12
CumTotal
70
58
12
17
Jun
15
12
CumTotal
55
46
9
16
May
14
11
CumTotal
41
35
6
15
Apr
12
10
CumTotal
29
25
4
14
Mar
7
8
CumTotal
22
17
5
23
Feb
12
9
CumTotal
10
8
2
20
Jan
10
8
156
104
52
13*12=
13*11= 143
13*10= 130
13*9= 117
13*8=
13*7= 91
13*6= 78
13*5= 65
13*4=
13*3= 39
13*2= 26
13*1= 13
13*0= 0
Fill in at the endof each month
Total immunized Penta1
Total immunized Penta3
Drop out number (DO)(Penta1-Penta3)
Drop out %(DO/Penta1) *100
Penta1 coverage
Penta3 coverage
Part 1 | Health facility microplanning
31
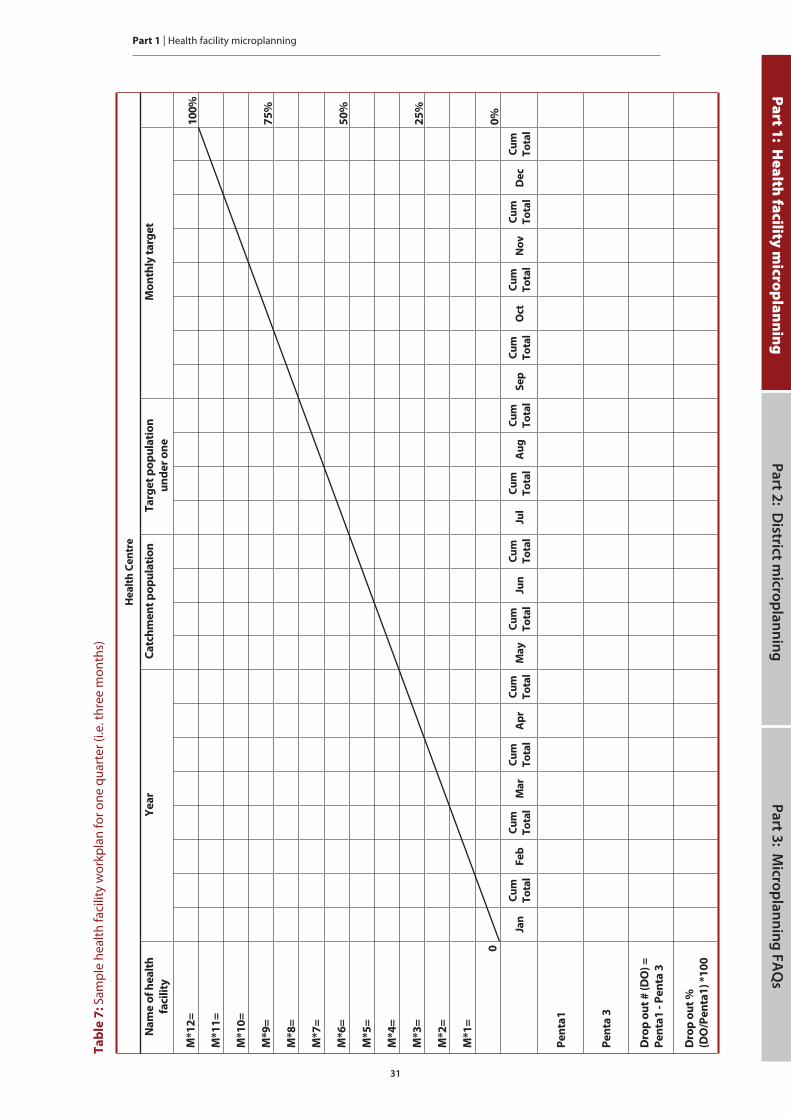
Ta
ble
7:
Sam
ple
heal
th fa
cilit
y w
orkp
lan
for o
ne q
uart
er (i
.e. t
hree
mon
ths)
He
alt
h C
en
tre
Na
me
of
he
alt
h
faci
lity
Ye
ar
Ca
tch
me
nt
po
pu
lati
on
Ta
rge
t p
op
ula
tio
n
un
de
r o
ne
Mo
nth
ly t
arg
et
M*1
2=
10
0%
M*1
1=
M*1
0=
M*9
=7
5%
M*8
=
M*7
=
M*6
=5
0%
M*5
=
M*4
=
M*3
=2
5%
M*2
=
M*1
=
00
%
Jan
Cu
m
To
tal
Fe
bC
um
To
tal
Ma
rC
um
To
tal
Ap
rC
um
To
tal
Ma
yC
um
To
tal
Jun
Cu
m
To
tal
Jul
Cu
m
To
tal
Au
gC
um
To
tal
Se
pC
um
To
tal
Oct
Cu
m
To
tal
No
vC
um
To
tal
De
cC
um
To
tal
Pe
nta
1
Pe
nta
3
Dro
p o
ut
# (
DO
) =
Pe
nta
1 -
Pe
nta
3
Dro
p o
ut
%
(DO
/Pe
nta
1)
*10
0
Part 1: Health facility m
icroplanningP
art 2
: District m
icrop
lan
nin
gP
art 3
: Micro
pla
nn
ing
FA
Qs

Microplanning for immunization service delivery using the Reaching Every District (RED) strategy
32
STEP 8Working with the community and tracking defaulters
Access and utilization depend very much on the relationship with the local community. In Step 5 you identified problems and solutions for making links with the local community. In Step 8 you will visit the local communities regularly to ensure they are involved, to find out how well they are able to use the services, and to follow up on defaulters who need to complete the immunization series. Here is a brief list of actions to be made with the community (for a full list see Immunization in Practice,9 module 8).
Meet regularly with community leaders to:
- provide information on immunization and the time and place of sessions;
- record new births or pregnant women needing antenatal care;
- motivate parents to attend sessions;
- request the support of volunteers during sessions;
- request help in finding defaulters or unimmunized infants and pregnant women.
Gather feedback from the community on the quality of the services
A simple questionnaire can be used to investigate reasons for low coverage and drop-outs (See Part 1, Annex 1).
Use a system to track defaulters
There are many ways to monitor and follow up on defaulters. Here are two tracking systems that can easily be used.
Using the immunization register
At the end of each month, review immunization to identify infants who may
women who are TT/Td defaulters.
9 Immunization in Practice: A practical guide for health staff. Geneva, World Health Organization, 2004.
Are you meeting the needs of the community? Working closely with
the community is one of the best ways to improve the service.

Part 1 | Health facility microplanning
33
Part 1: Health facility m
icroplanningP
art 2
: District m
icrop
lan
nin
gP
art 3
: Micro
pla
nn
ing
FA
Qs
“Reminder” cards
Another way to identify defaulters is to make “reminder” cards, which are copies of each infant’s immunization
immunization card in a box behind the divider for the month when the infant’s next vaccination is due.When an infant receives Penta1 in January, place the reminder card in the
when Penta3 is due. Every month, review the reminder cards and follow up those who did not attend when due. Ensure that the TT/Td immunization status of pregnant women is included in the antenatal clinic tracking system. When TT immunizations are given to pregnant women outside of antenatal clinics, reminder cards can be used to ensure that each pregnant woman gets their second dose (assuming it is the first pregnancy).
Following up defaulters
Whichever system you use, it will only be effective if you then make sure that every infant receives the vaccinations that are overdue. If you track defaulters regularly every month, it will make the task of follow-up easier. To follow up defaulters, you may be able to contact the mothers directly or ask members of the community to help you.

Microplanning for immunization service delivery using the Reaching Every District (RED) strategy
34
STEP 9Managing supplies
The method for managing supplies can be very simple. Stock cards can be used, or just an exercise book. You should include all vaccines and safe-injection equipment in the stock record. Always check the status of the vaccine: VVM and expiry date.
The balance recorded should be physically checked and verified at periodic intervals.
Method 1: Using a simple exercise book for stock management each year.
Divide the book into separate sections of several pages for each type of vaccine (or other supplies/equipment) used.
exercise book are used to record the details of each vaccine, AD syringes or diluents, or other supplies/equipment.
same way.
After each receipt or issue, the balance in stock should be calculated and recorded. The balance recorded should be physically checked and verified at periodic intervals (e.g. once every quarter).
Simple exercise book to keep records of stock received and issued
After each receipt or issue, the balance in stock should be recalculated
and recorded.

Part 1 | Health facility microplanning
35
Method 2: Using stock cards.
Take a box (this should preferably be of a durable material like aluminium sheet or plastic, but a shoebox can work) and divide it into separate sections that can take several stock cards for each type of vaccine (or other supplies/equipment) used.
Prepare a card for each vaccine and label the columns. A separate card is used to record the details of each type of vaccine or AD syringes (including a different card for different vial sizes), diluents or other supplies/equipment.
Between each set of stock cards (for each type of vaccine or other equipment) insert a separator that is slightly bigger than the stock cards. On each separator, indicate the vaccine or other material corresponding to the stock
status, quantity, etc.
After each receipt or issue, the balance in stock should be recalculated and recorded. The balance recorded should be physically checked and verified at periodic intervals (e.g. once every quarter).
Part 1: Health facility m
icroplanningP
art 2
: District m
icrop
lan
nin
gP
art 3
: Micro
pla
nn
ing
FA
Qs

Microplanning for immunization service delivery using the Reaching Every District (RED) strategy
36
Sa
mp
le f
orm
use
d f
or
sto
ck
ma
na
ge
me
nt
Va
cc
ine
or
safe
in
jec
tio
n
eq
uip
me
nt
na
me
Min
imu
m s
toc
kQ
ua
rte
rly
su
pp
lyM
ax
imu
m s
toc
k
(Min
imu
m +
qu
art
erl
y s
up
ply
)
Dat
eRe
ceiv
ed fr
om
or Is
sued
toN
umbe
r of v
ials
/uni
tsPr
esen
tatio
n(d
oses
/via
lor
uni
ts/b
ox)
Tota
l # d
oses
or
uni
tsBa
tch
#Ex
piry
dat
eSt
atus
of V
VMTo
tal b
alan
ce
(dos
es)/
(uni
ts)
Com
men
ts
Rece
ived
Issu
ed

Part 1 | Health facility microplanning
37
STEP 10Making use of the monthly report
Every health facility is required to provide a report to the next level every month. In this step we will suggest some ways of making the monthly report more effective by adding some important pieces of information.
a Complete the monthly report form including all coverage data, disease surveillance, supply and stock levels, and other information that is requested routinely.
b
c Record session completeness. Refer to the session plan and note whether
state the reasons why it was not carried out as planned and any new plan to repeat the session.
d
i) Refer to your recent list of problems and solutions (Table 5)
1) List any problems that have been solved since the last report. 2) List any outstanding problems to be solved by either the health
facility or the district level.
The monthly report should be useful both for the sender of the report (Health Facility) and the receiver of the report (District).
The HF should use the monthly report to remind the district about
unsolved problems and supervisory visits.
Missed sessions are a serious problem and deserve attention and
corrective action by the HF and district.
Part 1: Health facility m
icroplanningP
art 2
: District m
icrop
lan
nin
gP
art 3
: Micro
pla
nn
ing
FA
Qs

Microplanning for immunization service delivery using the Reaching Every District (RED) strategy
38
1.
Synt
hesi
s of
mon
thy
vacc
inat
ions
giv
en
VA
CC
INA
TIO
N
ST
RA
TE
GIE
S
TT
VA
CC
INA
TIO
NS
TO
PR
EG
NA
NT
WO
ME
NB
CG
OP
VP
en
tav
ale
nt
DT
P-H
ep
B+
Hib
ME
AS
LE
SY
FV
ITA
MIN
A
SU
PP
LE
ME
NT
AT
ION
< 1
ye
ar
>
1 y
ea
r<
1 y
ea
r>
1 y
ea
r
No
. o
f
sess
ion
s
1st
do
se
2n
d
do
se
3rd
do
se
4th
do
se
5th
do
se
0-1
1
mo
nth
s
≥ 1
ye
ar
at
bir
th
1st
do
se
2n
d
do
se
3rd
do
se
1st
do
se
2n
d
do
se
3rd
do
se
1st
do
se
2n
d
do
se
3rd
do
se
1st
do
se
2n
d
do
se
3rd
do
se
9-1
1
mo
nth
s
≥ 1
ye
ar
9-1
1
mo
nth
s
≥ 1
ye
ar
mo
the
rs
0-1
1
mo
nth
s
≥ 1
ye
ar
Fix
ed
Ou
tre
ac
h
To
tal
mo
nth
To
tal
do
ses
op
en
ed
2.
Faci
lity/
dist
rict s
tock
man
agem
ent d
ata
3
.Sy
nthe
sis
of d
isea
se s
urve
illan
ce &
AEF
IV
ac
cin
es
&
inje
cti
on
eq
uip
me
nt
Qu
an
tity
rec
eiv
ed
ea
ch
mo
nth
Sto
ck
ba
lan
ce
at
the
en
d o
f
the
mo
nth
Va
cc
ine
do
ses
dis
ca
rde
d
du
e t
o V
VM
ch
an
ge
Te
mp
era
ture
at
wh
ich
va
cc
ine
s h
av
e b
ee
n e
xp
ose
dT
arg
ete
d
dis
ea
ses
0-1
1 m
on
ths
1 -
4 y
ea
rs5
- 1
4 y
ea
rs1
5 y
ea
rs &
+T
ota
lV
ac
cin
ati
on
sta
tus
(do
ses
rec
eiv
ed
)
Min
(oC
)M
ax
(oC
)c
ase
sd
ea
ths
ca
ses
de
ath
sc
ase
sd
ea
ths
ca
ses
de
ath
sc
ase
sd
ea
ths
01
23
un
kn
ow
n
Va
cc
ine
s &
Vit
am
in A
AF
P
BC
GM
ea
sle
s
DT
P-
He
pB
+H
ibM
NT
OP
VD
iph
the
ria
Me
asl
es
Pe
rtu
ssis
TT
Ye
llo
wF
ev
er
YF
Me
nin
git
is
He
pB
Ma
lari
a
Vit
am
in A
Oth
ers
Inje
cti
on
eq
uip
me
nt
Ty
pe
of
AE
FI
(Ev
en
ts)
To
tal
No
. o
f c
ase
sV
ac
cin
es-
rela
ted
ev
en
tsA
dd
itio
na
l c
om
me
nts
(if
an
y)
BC
GP
oli
oP
en
taM
SL
TT
YF
He
pB
AD
Sy
rin
ge
s 0
.05
ml
Ab
sce
sse
s
AD
Sy
rin
ge
s 0
.5m
lA
na
ph
yla
xis
Sy
rin
ge
s re
con
stit
uti
on
, 2m
lO
the
r a
lle
rgic
re
ac
tio
ns
Sy
rin
ge
s re
con
stit
uti
on
, 5m
lB
CG
Ly
mp
ha
de
nit
is
Sa
fety
bo
xe
sD
ea
ths
Dat
e of
last
supe
rvis
ory
visi
t
Num
ber o
f ses
sion
s can
celle
d
Reas
ons f
or c
ance
lling
pla
nned
sess
ions
Prob
lem
s sol
ved
sinc
e la
st re
port
Out
stan
ding
Pro
blem
s
PRO
VIN
CE:
D
ISTR
ICT
Hea
lth fa
cilit
y:
Nam
e of
the
man
ager
:
Mon
thly
targ
et in
fant
s:
Fixe
d se
ssio
ns p
lann
ed:
No.
of o
utre
ach
plan
ned:
Mon
th:
Ye
ar:
MO
NT
HY
VA
CC
INA
TIO
NR
EP
OR
T

Part 1 | Health facility microplanning
39
ANNEX 1Simple questionnaire to investigate reasons for low coverage and dropouts
This questionnaire will assist you to gather feedback about the status of immunization services in areas served on a health facility. It investigates the number of children under two years (0-23 months) and their mothers (for TT/Td immunization) who did not complete their immunization schedule, the number of people who are never reached, why infants and women do not go or return for immunization, and how women think services can be improved.
in a few hours. It is an opportunity to discuss these subjects directly with child caretakers and find out how services could be improved and why they are not used.
The results of this survey are not representative of any population other than the households you interview. This survey is intended to supplement, not replace, routine reporting.
The purpose is to investigate at least five children under two years of age and their mothers of childbearing age who are not vaccinated or who did not complete their immunization schedule.
Follow the steps below:
Use the tally sheet and the questionnaire presented on the following page for the interviews and to compile data. If needed you can modify this questionnaire to fit your needs.
Collect and compile data from immunization cards
a Visit the households that can be reached from the health facility without difficulty until you identify at least five children under two years of age, and their mothers, who are not vaccinated or who are overdue for the next vaccine dose (“partially immunized”). The households do not have to be randomly selected and they may be visited in any order. In each household having any children under two years of age and their mothers, ask for the child’s and mother’s immunization card(s). If the child or mother is not completely immunized, each mother should be asked to give one reason why. Enter this information in Item C of the tally sheet. Each woman should also be asked for her suggestions on how to improve the health
If the mother does not have a card for either the child or herself, do not try to obtain a history, go to the next house.
Part 1: Health facility m
icroplanningP
art 2
: District m
icrop
lan
nin
gP
art 3
: Micro
pla
nn
ing
FA
Qs

Microplanning for immunization service delivery using the Reaching Every District (RED) strategy
40
b Add up the number of households visited from Item A and the immunization status of children and mothers interviewed in the survey from Item B. Record the totals in the appropriate space on the form.
Analyse the data
c Investigate why the children and mothers were not, or were only partially, immunized.
d
improvement (Item D).
e Discuss possible solutions with your team given current resources as well as with extra resources (see Steps 3 and 5).
Interpreting the data
There will be some bias in the data because the households visited will not be far from the health facility. Nevertheless, it is often the situation that not all childrenand mothers who live nearby are fully immunized, so the results will still be valid.
Who should conduct the questionnaire?
The questionnaire can be conducted by anyone interested in the immunization system; it requires little time and no extra resources. It is recommended that the health facility staff should be present during the household visits so that the successes and problems encountered can be further discussed in the health facility.
Using the data
The various issues raised by the results of the questionnaire should be discussed
can serve as a simple means of verifying data quality. If a health facility reports very high coverage, yet several unimmunized children are found, the data quality should be questioned.

Part 1 | Health facility microplanning
41
Investigating reasons for low coverage and drop-outs:
Tally sheet and questionnaire for the convenient household survey
Children under two years of age (0 – 23 months) and their mothers for TT /Td
Area Visited: Team Name:
Response Place tally marks here Total
A. Tally the number of households visited
B. Immunization status: Tally children (c) Tally mothers (m) (c) (m)
Not immunized
Partially immunized
Adequately or fullyimmunized
No Card availableWhy?
Lost
Never vaccinated
C. Child name Reasons given for being partially or not immunized
1.
2.
3.
4.
5.
C. Mother's name Reasons given for being partially or not immunized with TT/Td
1.
2.
3.
4.
5.
D. Suggestions for improvement
1.
2.
3.
Part 1: Health facility m
icroplanningP
art 2
: District m
icrop
lan
nin
gP
art 3
: Micro
pla
nn
ing
FA
Qs

Microplanning for immunization service delivery using the Reaching Every District (RED) strategy
42
ANNEX 2Worked examples
Wor
ked
exam
ple
of T
able
1:
Dat
a an
alys
is (S
tep
1)
Area
na
me
Com
pile
pop
ulat
ion,
imm
uniz
atio
n co
vera
ge d
ata
in th
e pr
evio
us 1
2 m
onth
sAn
alys
e pr
oble
mPr
iorit
ize
area
Targ
etpo
pula
tion
figur
es
Dos
es o
f vac
cine
adm
inist
ered
Imm
uniz
atio
n co
vera
ge (%
) U
nim
mun
ized
D
rop
out r
ates
(%)
Iden
tify
prob
lem
sCa
tego
rize
the
prob
lem
<1 y
ear
Pent
a1Pe
nta3
Msl
TT2+
/Td
Pent
a1Pe
nta3
Msl
TT
2+/T
dPe
nta3
Msl
Pent
a1 to
Pe
nta3
Pent
a1
to M
slAc
cess
Util
izat
ion
Cate
gory
1,
2, 3
, 4Pr
iorit
y 1,
2, 3
, 4,
5……
ab
cd
ef
gh
ij
kl
mn
op
qr
Ma
wa
50
36
32
30
27
72
%6
7%
60
%5
4%
18
20
11
%1
7%
Go
od
Po
or
42
Th
an
a4
32
92
72
82
96
7%
63
%6
5%
67
%1
61
57
%3
%P
oo
rG
oo
d3
3
Mit
ha
80
60
56
55
43
75
%7
0%
69
%5
4%
24
25
7%
8%
Po
or
Go
od
31

Part 1 | Health facility microplanning
43
Wor
ked
exam
ple
of T
able
4:
Sess
ion
plan
Villa
ge/w
ard
Tota
l pop
ulat
ion
Targ
et
popu
latio
n Se
ssio
n ty
pe
Inje
ctio
ns p
er
year
In
ject
ions
per
m
onth
Es
timat
ed
sess
ions
per
m
onth
Actu
al p
lann
ed
sess
ions
per
m
onth
Oth
er c
hild
su
rviv
al
inte
rven
tions
pl
anne
d?
Har
d-to
-rea
ch
area
/pop
ulat
ion
(2.3
3% o
f tot
al
popu
latio
n fo
r th
is e
xerc
ise)
(Fix
ed/ O
utre
ach/
M
obile
)(T
arge
t po
pula
tion
x 10
) (In
ject
ions
per
ye
ar d
ivid
ed b
y 12
)
Fixe
d>=8
0 in
ject
ions
per
se
ssio
n, o
r O
utre
ach
>=40
in
ject
ions
per
se
ssio
n
Base
d on
ju
dgem
ent
III
III
IVV
VI
VII
VII
IIX
X
Sgur
r1,
840
43O
utre
ach
430
360.
9(1
) onc
e ev
ery
mon
th
Mon
adh
2,15
650
Out
reac
h50
042
1.0
(1) o
nce
ever
y m
onth
Borr
owda
le3,
590
84O
utre
ach
840
701.
8(2
) onc
e ev
ery
two
wee
ks
Gai
rloch
3,41
180
Out
reac
h80
067
1.7
(1) o
nce
a m
onth
Dis
trib
utio
n of
be
dnet
s w
hen
avai
labl
eYe
s
Fort
Will
iam
H
ealth
cen
tre
10,2
3423
9Fi
xed
at h
ealth
fa
cilit
y2,
390
199
2.5
(4) o
nce
ever
y w
eek
Part 1: Health facility m
icroplanningP
art 2
: District m
icrop
lan
nin
gP
art 3
: Micro
pla
nn
ing
FA
Qs

Microplanning for immunization service delivery using the Reaching Every District (RED) strategy
44
Wor
ked
exam
ple
of T
able
5:
Prob
lem
solv
ing
usin
g th
e RE
D st
rate
gy
RE
D c
om
po
ne
nt
Ex
am
ple
s o
f p
rob
lem
sE
xa
mp
les
of
solu
tio
ns
wit
h l
imit
ed
re
sou
rce
sE
xa
mp
les
of
solu
tio
ns
ne
ed
ing
re
sou
rce
s a
nd
ass
ista
nc
e f
rom
dis
tric
t
Re
-est
ab
lish
me
nt
of
ou
tre
ach
serv
ice
s
Som
e pl
anne
d ou
trea
ch s
essi
ons
are
not
held
.
Poor
att
enda
nce
at o
utre
ach
sess
ions
.
any
sess
ion
is n
ot h
eld,
rec
ord
the
reas
on a
nd t
ry
to r
epea
t la
ter.
Invo
lve
the
com
mun
ity
in p
lann
ing
the
type
an
d da
tes
of s
essi
ons.
Inf
orm
in a
dvan
ce o
f th
e se
ssio
ns.
Add
itio
nal t
rans
port
(m
otor
cycl
e re
quir
ed).
Su
pp
ort
ive
sup
erv
isio
nSu
perv
isio
n of
hea
lth
faci
lity
not
cond
ucte
d re
gula
rly.
In t
he n
ext
mon
thly
rep
ort
requ
est
regu
lar
supe
rvis
ory
visi
ts a
nd a
cop
y of
the
dis
tric
t su
perv
isor
y sc
hedu
le.
Dis
tric
t to
upd
ate
dist
rict
sup
ervi
sory
pl
an a
nd s
end
out
sche
dule
of
visi
ts.
Co
mm
un
ity
lin
ks
wit
h s
erv
ice
de
liv
ery
The
loca
l com
mun
ity
is n
ot
invo
lved
in id
enti
fica
tion
and
tr
acki
ng o
f ne
wbo
rns
and
defa
ulte
rs.
Iden
tify
peo
ple
in t
he c
omm
unit
y w
ho c
an a
ssis
t at
imm
uniz
atio
n se
ssio
ns a
nd h
elp
wit
h de
faul
ter
trac
king
and
rep
orti
ng b
irth
s.
Dis
tric
t st
aff
to m
ake
join
t vi
sit
wit
h he
alth
fac
ility
sta
ff t
o en
cour
age
the
com
mun
ity.
Mo
nit
ori
ng
an
d
use
of
da
ta f
or
act
ion
Hea
lth
faci
lity
not
usin
g m
onit
orin
g ch
art.
the
heal
th f
acili
ty.
Req
uest
pri
nted
mon
itor
ing
char
ts t
o be
di
stri
bute
d to
eve
ry h
ealt
h fa
cilit
y.
Pla
nn
ing
an
d
ma
na
ge
me
nt
of
reso
urc
es
Vac
cine
and
AD
syr
inge
sto
ck-o
uts
last
qua
rter
.K
eep
a ca
refu
l sto
ck r
ecor
d sy
stem
in t
he h
ealt
h fa
cilit
y. R
epor
t st
ock
leve
ls in
mon
thly
rep
ort
and
requ
est
supp
lies
whe
n le
vels
are
low
.m
onth
ly r
epor
ts a
nd s
uper
viso
ry v
isits
, ta
ke a
ctio
n on
hea
lth fa
cilit
y re
port
s.

Part 1 | Health facility microplanning
45
ANNEX 3Special considerations for health facilities serving the hard-to-reach
Common problems
The population data are inaccurate (especially for urban slums).
urban areas.
Some communities are reluctant to use health facilities.
Proposed solutions to reach the hard-to-reach
Map the hard-to-reach areas
catchment area of the health centre by colouring them red.
Estimate the population of the hard-to-reach areas
- Review results of previous polio or measles campaigns in the area to get a better idea of the population under 5 years of age.
number of families in the area to determine the population size.
- If the populations are highly mobile, meet with the residents regularly to revise the population estimates.
Plan to improve access to immunization
-Are more fixed sessions needed?Are more outreach sessions needed?
of services and the location of outreach sites.If available, invite local NGOs to participate.
- Ensure a regular service to gain the trust of the community.
Part 1: Health facility m
icroplanningP
art 2
: District m
icrop
lan
nin
gP
art 3
: Micro
pla
nn
ing
FA
Qs

Microplanning for immunization service delivery using the Reaching Every District (RED) strategy
46
Decide what other interventions can be added to sessions
- If available, consider whether other needed interventions, such as malaria bednets, anthelminthic medicines, nutritional supplements, etc. can be added to the sessions for hard-to-reach populations.
Monitor and follow up
- Review monthly results to determine whether all communities are being reached.
- Communicate regularly with communities to discuss results and encourage defaulters to attend.
Report
- Include a report of achievements in reaching the urban hard-to-reach in monthly reports to district level and request extra resources if needed.

Part 1 | Health facility microplanning
47
ANNEX 4Planning to reach high-risk urban areasPreparing a map for urban immunization
In densely populated cities, many children are not immunized for a variety of reasons, and are therefore at high risk. Often the areas where missed children live are depressed areas of the urban poor that do not appear on a map, the areas may not even have street names, and the size of the population may be unknown. The map that you will prepare will identify these areas and provide an approximate population estimate that can be used to deliver services to the areas.
How to develop a detailed urban map
a Find a suitable map as a starting point.
A city street map will do if the scale is large enough.
If a detailed map is not available, you can draw a map of the area by hand. Google Earth has useful maps that can be used as a starting point for making urban maps.
School teachers often have much local knowledge and can help with maps and planning too.
Use maps that are available for polio and measles campaign planning.
Whatever the source of the map, you must show the location of houses, and type of housing (formal housing, squatter areas, etc.) street by street.
b Mark the following on the map:
health facilities and sites used for health purposes;
boundaries of the catchment area of the health facility (this will clarify who is responsible for which area);
roads with their names;
other landmarks, such as schools, government buildings, mosques, churches etc.;
time it would take to reach the health facility from various points on the map (walking/public transport).
c Using your local knowledge colour the high-risk areas on the map:
Name the high-risk areas and colour them in red, including densely urbanized or depressed areas, areas with families living in makeshift houses, in places without street names, or unpaved streets, homeless,
The purpose of urban immunization mapping is to identify and
quantify populations in high-risk urban areas.
Part 1: Health facility m
icroplanningP
art 2
: District m
icrop
lan
nin
gP
art 3
: Micro
pla
nn
ing
FA
Qs

Microplanning for immunization service delivery using the Reaching Every District (RED) strategy
48
mobile, transients, others you believe are high risk.
Use a different colour or no shading for other areas that are not at high risk. This will include middle class, formal housing.
d Estimate the eligible infant population in the high-risk areas.
The objective is to make an operational estimate of infants in the high-risk areas, which you can use for planning service delivery, bearing in mind that official population figures may not include these areas at all.
- existing immunization denominator estimates- results of recent immunization campaigns in the area- results of recent household surveys- information from NGOs working in the area.
e Visit the high-risk areas.
on the number of households and number of families.
ake an estimate of the number of households, and the average number of eligible children per household in each area.
Adjust the map according to details you find with regard to the extent of the area and its estimated population.
Example of an urban map with population marked on it.
The red coloured areas show urban ‘slums’ of makeshift housing inhabited by urban poor populations.
Urban slums
Class A
Class B
Class C
Church
School

Part 1 | Health facility microplanning
49
Special planning issues for reaching the urban poor
Identify the many barriers to high coverage among the urban poor, and develop
poor primary health care infrastructure in some urban areas;
high mobility of the resident population in and out of the city;
high cost of transport to health facilities for fixed site services;
the existence of “illegal” settlements that are not officially recognized by the government;
the existence of marginalized populations (religious or ethnic minorities, refugees);
absence of information on the size of the population living in “slum” areas;
inadequate government planning and budget to provide primary health care services to these areas.
Strategies for reaching the urban poor
Step 1: Session planningUse the urban map with population marked on it to make an immunization session plan and workplan as described in steps 4 and 6.
with resources.
Plan location of sites, frequency, and timing of service, to suit the local population.
- Discuss alternatives for times and dates of sessions with the community.
- Ensure a regular uninterrupted service to gain the trust and cooperation of the community. Keep to the agreed schedule of sessions.
- Negotiate local support from the community to help run sessions, set up a temporary site etc.
Urban areas, like rural areas, need regular, reliable, high quality services
at accessible delivery points. Fixed sites may not be adequate and
urban outreach through temporary sites must be considered.
Part 1: Health facility m
icroplanningP
art 2
: District m
icrop
lan
nin
gP
art 3
: Micro
pla
nn
ing
FA
Qs

Microplanning for immunization service delivery using the Reaching Every District (RED) strategy
50
- follow up of defaulters
- advocacy for immunization
- increase of vaccine, and other supplies
- adding other interventions.
- dispensaries, clinics and hospitals in the public sector
- NGOs engaged in providing health care in urban areas
- any private practitioner willing and able to be part of this network.
Communicate through health workers, NGOs active in the area, print
- the timing of local immunization services
- local service delivery points
- the vaccines and schedule of immunization
- the benefits of immunization.
Step 2: Monitoring the services Once you have planned to improve the service to an urban slum you should monitor the service carefully by collating tally sheets from each session conducted for that area.
- Use the data you have collected to report back to the slum residents on progress or otherwise.
- Use the feedback as an advocacy tool to promote immunization.
- Report the results to higher levels to request extra resources, or better deployment of staff etc.
Step 3: Adapting to changing circumstances Urban slum populations are very unstable, populations may suddenly increase or decrease according to economic and social circumstances in the area.
- The session plan and workplans for these areas will need to be flexible to adapt readily to the changes.
- Always involve the local slum leaders. Remember slums may appear chaotic because the populations are poor; nevertheless, they are likely to have a well organized social structure which can be very supportive for its own population.

51
Pa
rt 1: H
ea
lth fa
cility m
icrop
lan
nin
gPart 2: D
istrict microplanning
Pa
rt 3: M
icrop
lan
nin
g F
AQ
s
Part 2: District microplanning
STEP 1Analyses of district level data to identify priority areas
STEP 2: Making a map to show all health facilities and outreach sites
STEP 3: Making a district workplan
STEP 4: Making an estimate of resource requirements
STEP 5: Conducting regular monitoring and review of progress
STEP 6: Taking action based on a review of progress

Part 2 | District microplanning
53
STEP 1Analyses of district level data to identify priority areas
As a first step in preparing the workplan, the district staff should analyse the reported data for a 12-month period provided by the health facilities in the district. In the same way described in the health facility guide, but using data received at the district level, the district should identify access and utilization problems according to each health facility, and calculate the number of immunized listing the order of priority according to the number of unimmunized infants as described in Table 1, Part 1.
is using. The final column will show a list of health facilities in order of priority of unimmunized infants. It is also useful to add data on reported measles and
Do you know your district priority areas? District data analysis will help
you identify the priorities.
Pa
rt 1: H
ea
lth fa
cility m
icrop
lan
nin
gPart 2: D
istrict microplanning
Pa
rt 3: M
icrop
lan
nin
g F
AQ
s

Microplanning for immunization service delivery using the Reaching Every District (RED) strategy
54
STEP 2Making a map to show all health facilities and outreach sites
the entire catchment area of the district
roads, towns, villages and other features and landmarks
if possible, use the data from Table 1 to show priority areas.
Step 1: Draw a simple map of your district. It does not have to be to scale, but it should contain all the important features of the district. Mark the following information on the map:
each village, town and health facility
the total population and target population of each village and town
all known high risk or priority areas
roads
geographical landmarks (rivers, streams, mountains).
Step 2: Using the map and session plans of individual health facilities, include the type of session suitable for each village/town in your district (fixed, outreach, mobile).
On the map, mark what kind of session will be used to reach each village or
example of a district map drawn in two stages for the purpose of this module. In real situations you will need one map that shows all the information together
distribution and location of health facilities (an example is given in Part 1).
Are the HF and district maps consistent? Make sure the district map
covers all areas and communities.

55
Part 2 | District microplanning
Figure 2: Sample district map with all health facilities, villages/towns, their total population, target
population, and session type
This example has been drawn in two stages, the first showing population and major features, the second showing session types needed to reach the population. In a real situation all the information should be displayed on one map.
Pa
rt 1: H
ea
lth fa
cility m
icrop
lan
nin
gPart 2: D
istrict microplanning
Pa
rt 3: M
icrop
lan
nin
g F
AQ
s

Microplanning for immunization service delivery using the Reaching Every District (RED) strategy
56
a calendar of events that includes all sessions carried out by health facilities in the district, which will help to schedule supervision and supplies throughout the district;
a district activity plan that contains a list of activities for which the district is responsible.
3.1 Make a district calendar of events (Table 7)
3.1.1 Consolidate all the health facility workplans into a calendar type format.
Table 7 for an example).
3.1.2 Indicate which sessions will need support from districts. Review each health facility workplan and identify sessions for which district support is needed. These sessions can be marked or shaded in a different colour on the calendar of events. Provide as much detail and clarity as possible, including the name of the health facility requesting support, type of support, etc.
3.1.3 Add supervisory visits according to priority.Add a schedule of supervisory visits to the calendar of events. Where possible, ensure that a supervisory visit is planned on a day when the health facility is holding a session. Ensure that priority districts receive sufficient supervisory visits. Table 7 shows supervisory visits marked with the letter 'S'.
3.1.4 Mark the day on which vaccine, safe-injection equipment and other supplies will be delivered each month to each health facility.Using the calendar of events, mark the day of the month on which vaccine, safe-injection equipment and other supplies will be delivered to each health facility.
STEP 3Making a district workplan
The district workplan should show all HF and district sessions and
other district activities.

Part 2 | District microplanning
57
3.2 Make a district activity plan
3.2.1 List all the activities that the district is planning to do in the next quarter.Activities that are the responsibility of the district.
List by health facility all problem-solving activities for hard-to-reach areas and problem areas for which district support is needed showing dates and persons responsible.
List all district-wide activities, SIAs, meetings, trainings etc. showing dates and persons responsible.
Complete Table 8: District activity plan for one quarter.
In the first column list all health facilities.
In the next column write the activities for which district support is needed as identified by each HF:
- Problem-solving activities for hard-to-reach and problem areas for which district support is needed (Table 3 of Part 1);
- RED problem-solving activities for which additional district resources are needed (Table 5 of Part 1).
In the relevant month column write the date on which these activities will be carried out.
Under 'persons responsible' indicate who would be responsible at district level for doing this activity.
In the separate section below marked 'district level activities', list the district-wide activities (monthly meetings, training sessions, SIAs, campaigns etc.) which will be carried out, according to the date.
Indicate who is responsible for the district-wide activities.
Pa
rt 1: H
ea
lth fa
cility m
icrop
lan
nin
gPart 2: D
istrict microplanning
Pa
rt 3: M
icrop
lan
nin
g F
AQ
s

Microplanning for immunization service delivery using the Reaching Every District (RED) strategy
58
Ta
ble
7:
Sam
ple
heal
th fa
cilit
y w
orkp
lan
for o
ne q
uart
er (i
.e. t
hree
mon
ths)
JANUARY
He
alt
h
Ce
ntr
eM
on
Tu
es
1
We
d
2
Th
ur
3 Fri
4 Sa
t
5
Su
n
6
Mo
n7
Tu
es
8
We
d
9
Th
ur
10
Fri
11
Sa
t
12
Su
n
13
Mo
n
14
Tu
es
15
We
d
16
Th
ur
17
Fri
18
Sa
t
19
Su
n
20
Mo
n
21
Tu
es
22
We
d
23
Th
u
24
Fri
25
Sa
t
26
Su
n
27
Mo
n
MF
ixe
d M
S
Ou
tre
ach
at
K
Ou
tre
ach
at
K
EF
ixe
d E
Ou
tre
ach
at
D
CF
ixe
d C
Ou
tre
ach
at
J
Fix
ed
C
BF
ixe
d B
Ou
tre
ach
at
J
Fix
ed
B
AF
ixe
d A
Fix
ed
A
Mo
bil
e t
o
S &
W S
Mo
bil
e t
o
T &
X
S
Fix
ed
A
Fix
ed
A
Ne
w a
cti
vit
ies
for
Jan
ua
ry b
ase
d o
n d
ata
an
aly
sis:
Sup
ply
- R
ev
iew
sto
ck r
eco
rdin
g s
yste
m in
all
he
alt
h c
en
tre
s | S
taff
- O
rga
niz
e t
rain
ing
on
AD
syr
ing
es
| Ser
vice
- M
ee
tin
g w
ith
co
mm
un
ity
lea
de
r
FEBRUARY
He
alt
h
Ce
ntr
e
3
Mo
n
4
Tu
es
5
We
d
6
Th
ur
7 Fri
8 Sa
t
9
Su
n
10
Mo
n1
1
Tu
es
12
We
d
13
Th
ur
14
Fri
15
Sa
t
16
Su
n
17
Mo
n
18
Tu
es
19
We
d
20
Th
ur
21
Fri
22
Sa
t
23
Su
n
24
Mo
n
25
Tu
es
26
We
d
27
Th
u
28
Fri
Sa
tS
un
MF
ixe
d M
Ou
tre
ach
at
K
S
Ou
tre
ach
at
L
Ou
tre
ach
at
P
EF
ixe
d E
S
Ou
tre
ach
at
D
CF
ixe
d C
Ou
tre
ach
at
J
Fix
ed
C
S
BO
utr
ea
ch
at
JF
ixe
d B
Fix
ed
B
AF
ixe
d A
Fix
ed
AF
ixe
d A
Fix
ed
A
S
Ne
w a
cti
vit
ies
for
Fe
bru
ary
ba
sed
on
da
ta a
na
lysi
s: S
uppl
y -
Re
vie
w c
old
ch
ain
ma
na
ge
me
nt
syst
em
| St
aff -
| S
ervi
ce -
MARCH
He
alt
h
Ce
ntr
e
3
Mo
n
4
Tu
es
5
We
d
6
Th
ur
7 Fri
8 Sa
t
9
Su
n
10
Mo
n1
1
Tu
es
12
We
d
13
Th
ur
14
Fri
15
Sa
t
16
Su
n
17
Mo
n
18
Tu
es
19
We
d
20
Th
ur
21
Fri
22
Sa
t
23
Su
n
24
Mo
n
25
Tu
es
26
We
d
27
Th
u
28
Fri
29
Sa
t
30
Su
n
31
Mo
n
MF
ixe
d M
Ou
tre
ach
at
K
Ou
tre
ach
at
L
Ou
tre
ach
at
P
S
EF
ixe
d E
Ou
tre
ach
at
D
CF
ixe
d C
Ou
tre
ach
at
J
S
Fix
ed
C
S
BO
utr
ea
ch
at
JF
ixe
d B
Fix
ed
B
AF
ixe
d A
Fix
ed
A
Fix
ed
A
Fix
ed
A
Ne
w a
cti
vit
ies
for
Ma
rch
ba
sed
on
da
ta a
na
lysi
s: S
uppl
y -
Re
vie
w s
tock
re
cord
ing
sys
tem
in a
ll h
ea
lth
ce
ntr
es
| Sta
ff -
Org
an
ize
tra
inin
g o
n A
D s
yrin
ge
s | S
ervi
ce -
Me
eti
ng
wit
h c
om
mu
nit
y le
ad
er

Part 2 | District microplanning
59
Ta
ble
8:
Dis
tric
t act
ivity
pla
n fo
r one
qua
rter
He
alt
h f
aci
lity
na
me
Act
ivit
y r
eq
uir
ing
dis
tric
t su
pp
ort
Jan
Fe
bM
ar
Pe
rso
n r
esp
on
sib
leR
em
ark
s
Dis
tric
t L
ev
el
Act
ivit
ies
Pa
rt 1: H
ea
lth fa
cility m
icrop
lan
nin
gPart 2: D
istrict microplanning
Pa
rt 3: M
icrop
lan
nin
g F
AQ
s
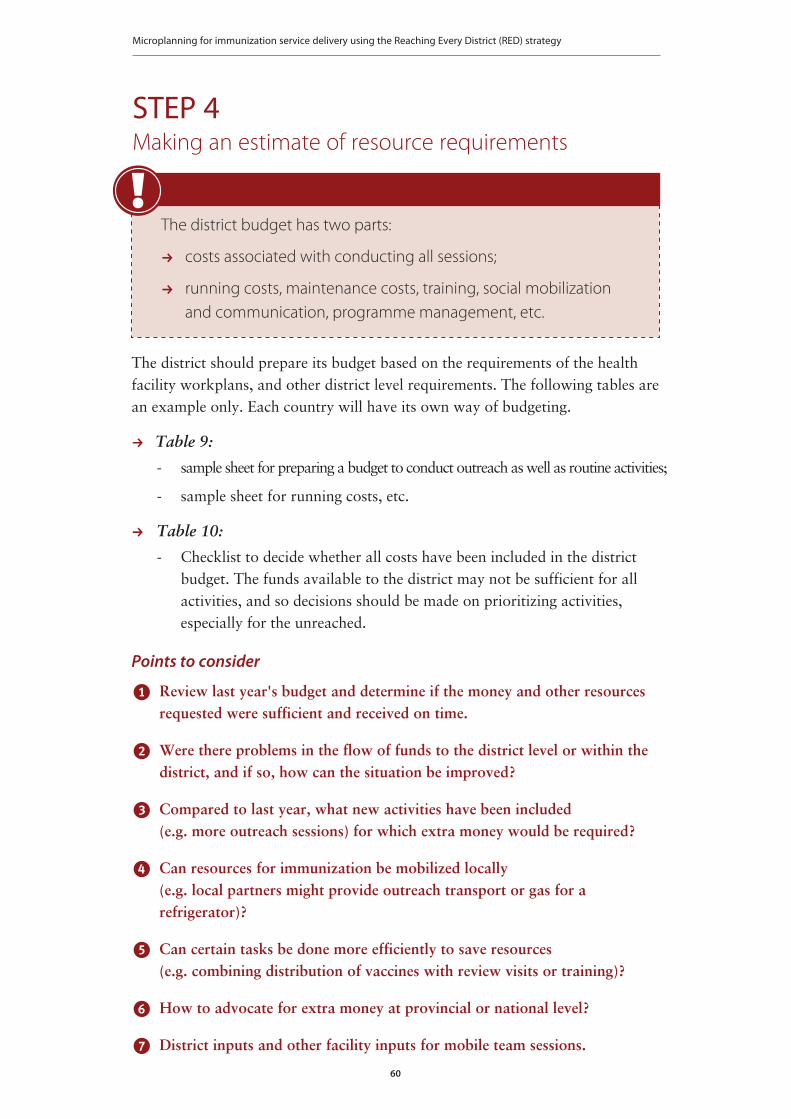
Microplanning for immunization service delivery using the Reaching Every District (RED) strategy
60
STEP 4Making an estimate of resource requirements
The district should prepare its budget based on the requirements of the health facility workplans, and other district level requirements. The following tables are an example only. Each country will have its own way of budgeting.
Table 9:
- sample sheet for preparing a budget to conduct outreach as well as routine activities;
- sample sheet for running costs, etc.
Table 10:
- Checklist to decide whether all costs have been included in the district budget. The funds available to the district may not be sufficient for all activities, and so decisions should be made on prioritizing activities, especially for the unreached.
Points to consider
Review last year's budget and determine if the money and other resources requested were sufficient and received on time.
Were there problems in the flow of funds to the district level or within the district, and if so, how can the situation be improved?
Compared to last year, what new activities have been included (e.g. more outreach sessions) for which extra money would be required?
Can resources for immunization be mobilized locally (e.g. local partners might provide outreach transport or gas for a refrigerator)?
Can certain tasks be done more efficiently to save resources (e.g. combining distribution of vaccines with review visits or training)?
How to advocate for extra money at provincial or national level?
District inputs and other facility inputs for mobile team sessions.
The district budget has two parts:
costs associated with conducting all sessions;
running costs, maintenance costs, training, social mobilization
and communication, programme management, etc.

Part 2 | District microplanning
61
Ta
ble
9:
Sam
ple
shee
t for
pre
parin
g a
dist
rict b
udge
t for
a q
uart
er (t
hree
mon
ths) Dis
tric
t B
ud
ge
t
He
alt
h c
en
tre
/vil
lag
es
Ta
rge
t n
um
be
r o
f se
ssio
ns
pe
r y
ea
rM
an
po
we
rT
ran
spo
rt
Sta
ff o
utr
ea
ch p
er
die
m
(1 s
taff
pe
r se
ssio
n x
nu
mb
er
of
sess
ion
s x
pe
r d
iem
)
Ca
r fu
el
Mo
torc
ycl
e f
ue
lB
us
all
ow
an
ce (
nu
mb
er
of
sess
ion
s x
1 s
taff
x
av
era
ge
bu
s fa
re)
Ou
tre
ach
TO
TA
L
Mo
bil
e
GR
AN
D T
OT
AL
He
alt
h c
en
tre
Ma
inte
na
nce
Tra
inin
gS
oci
al
mo
bil
iza
tio
n a
nd
co
mm
un
ica
tio
nP
rog
ram
me
ma
na
ge
me
nt
Co
ld-c
ha
in
run
nin
g c
ost
s
Bu
ild
ing
sC
ars
an
d
mo
torc
ycl
es,
cycl
es
Fo
r ro
uti
ne
serv
ice
s
Fo
r ca
mp
aig
ns
Me
eti
ng
s w
ith
the
co
mm
un
ity
Pu
rch
ase
of
pu
bli
c a
dd
ress
syst
em
s
Pri
nti
ng
of
po
ste
rs,
bo
ok
lets
Re
vie
w
me
eti
ng
s e
ve
ry
mo
nth
Co
mp
ute
rs a
nd
sta
tio
ne
ry
Fe
ed
ba
ck
(mo
nth
ly
ne
wsl
ett
ers
)
TO
TA
L
It is
ass
umed
that
vac
cine
s, sy
ringe
s and
safe
ty b
oxes
, as w
ell a
s car
s and
mot
orcy
cles
, are
pro
cure
d an
d bu
dget
ed fo
r at p
rovi
ncia
l or n
atio
nal l
evel
.
Pa
rt 1: H
ea
lth fa
cility m
icrop
lan
nin
gPart 2: D
istrict microplanning
Pa
rt 3: M
icrop
lan
nin
g F
AQ
s

Microplanning for immunization service delivery using the Reaching Every District (RED) strategy
62
Table 10: Budgeting checklist for a quarter (three months)
Budgeting Checklist
Cost category
Routine recurrent cost
Personnel
Per diems for outreach and mobile team vaccinators and volunteers
Per diems for supervision and monitoring
Transportation
Fixed site and vaccine delivery
Outreach activities
Supervision
Maintenance and overheads
Cold-chain maintenance and running costs
Maintenance of other capital equipment
Buildings’ overheads (electricity, water, etc.)
Training
Social mobilization and communication
Programme management
Other routine recurrent costs
Routine capital cost
Cold-chain equipment (e.g. refrigerator, cold box or vaccine carrier)
Other capital equipment (e.g. computers)
Campaigns operational costs
Polio
Measles
Yellow fever
MNT campaigns
Other campaigns

Part 2 | District microplanning
63
STEP 5Conducting regular monitoring and review of progress
a Monthly reports (See Part 1, Step 10). facilities and compiled at the district level. These reports provide much information that can be used by the district to take programmatic action (e.g. response to outbreaks, scheduling sessions in villages where sessions were missed, etc.). District monthly meetings can be used to review the data provided by each health facility. Reporting completeness and timeliness can be monitored as shown in Table 11.
b Quarterly review of workplan. A quarterly review is a meeting between district
what went right and what went wrong, and how to take action to solve problems. Its outcome should be an update and revision of the district activity plan.
Process of quarterly review.
Schedule quarterly meetings in advance.
Health facility staff should bring their session plans, workplans, monitoring charts, and a list of the sessions that could not be held as planned with reasons for not holding these sessions.
a) discuss access, dropouts and session completeness;b) discuss additional problems faced (e.g. vaccine shortages, cold-chain issues, or mobility constraints).
Review session plans and workplans. Check if the current sessions are adequate in number and sufficiently utilized by the community, and revise these if necessary toimprove efficiency.
Discuss other corrective action needed, according to the type of problem and knowledge of the service delivery area. The responsibilities for carrying out each activity should be clear, and added to the health facility and district workplans for the next three months.
Discuss how the quality of the sessions can be improved, together with bettercommunication, improved safety, waste disposal, etc.
Agree on a revised set of priorities for the district.
Revise the schedule of supportive supervisory visits according to the new priorities.
Conduct regular monitoring and review of progress by using:
monthly charts
monitoring charts
quarterly reviews
supportive supervisory visits.
Pa
rt 1: H
ea
lth fa
cility m
icrop
lan
nin
gPart 2: D
istrict microplanning
Pa
rt 3: M
icrop
lan
nin
g F
AQ
s

Microplanning for immunization service delivery using the Reaching Every District (RED) strategy
64
c Supportive supervisory visits. These are a means of monitoring the work in the field, providing on-the-job training, and taking notes for future discussion at review meetings.
d Ensuring data quality. Some of the following simple methods help to ensure good data quality. This review can be conducted during the quarterly review meeting mentioned above.
Is the numerator correct? Are all doses of vaccine administered and all vaccine-preventable disease (VPD) cases being reported? A good place to start checking is for completeness of reporting from the health facilities, for instance have full reports been received from all health facilities? A simple tool with the list of health facilities in the left-hand column and the months in the top row will help to keep track of this.
Table 11: Table to track completeness and timeliness of reporting
Month
Health facility1 2 3 4 5 6 7 8 9 10 11 12 13 Total
A √
B √
C √ √
D √ √
E √
Note: This table shows that the January report from HF 'B' and February reports from HFs 'A' and 'E' have not yet been received.
Is the denominator correct? Are all children and mothers residing in the catchment area included in the health facility register? Do you have an accurate estimate of the total population living in your area? In the absence of accurate population estimates, the coverage and other 'rates' are likely to be exaggerated (estimate too high) or underestimated (estimate too low).
Are the data consistent? Check and see if the data at the health facility and district levels are the same for a given village/area. If the data are consistent, it should be the same at all levels.
Are the calculations correct? Always double-check the additions, divisions and other arithmetical functions to eliminate any errors. Have the number of 'tally marks' been correctly transferred to the summary form?
Check the tally sheets randomly. Have all tally marks been counted and correctly noted in the summary?
Check the infant and maternal TT/Td registers. Are they updated? Are the numbers on record consistent with the population estimate?
Conduct a simple household questionnaire in a village or urban area to validate coverage rates (See Part 1, Annex 1).

Part 2 | District microplanning
65
STEP 6Taking action based on a review of progress
All the monitoring and review activities listed above can lead to short- or long-term corrective action. Here are some examples of data that can lead to
Example 1: High reported measles vaccination coverage and high numbers of reported measles cases.
overall high coverage with vaccines but the existence of pockets of unreached children where disease continues to occur;
lack of accuracy of reported coverage data which could be due to errors in counting the number of doses given or inaccurate population estimates;
lack of training of health facility staff to recognize cases of VPDs or over-reporting of VPDs due to inaccurate diagnosis.
Example 2: Low reported measles vaccination coverage and low numbers of measles cases.
lack of training of health facility staff to recognize cases of VPDs and under-reporting of VPDs due to missing the diagnosis;
the existence of large areas of unreached children with no services and no data on VPDs;
lack of accuracy of reported coverage data which could be due to inaccurate population estimates.
Based on the conclusions drawn from analysis of the data, long- and short-term activities may need to be planned and implemented.
Use the review of progress to take action and solve problems.
Pa
rt 1: H
ea
lth fa
cility m
icrop
lan
nin
gPart 2: D
istrict microplanning
Pa
rt 3: M
icrop
lan
nin
g F
AQ
s

Microplanning for immunization service delivery using the Reaching Every District (RED) strategy
66
Short term:
visit and support poor performing areas;
assist with reporting problems;
train health workers in identified weak areas.
Long term:
expand outreach services and budget accordingly;
changes in vaccine distribution plans and schedule;
cold-chain rehabilitation;
carry out census in the catchment area to quantify the denominator;
increase social mobilization to improve community acceptance of immunization programmes, etc.;
establish community-based newborn and defaulter tracking systems;
organize mobile teams and delivery of other interventions with immunization.
Any change in the session plan (frequency, change of date or location) should be done in consultation with the community, and mothers should be informed well in advance about the changes.

Part 3: Microplanning FAQs
Conducting a data analysis
Preparing a map
Preparing a session plan
Using the RED strategy
Preparing a workplan
Pa
rt 1: H
ea
lth fa
cility m
icrop
lan
nin
gP
art 2
: District m
icrop
lan
nin
gPart 3: M
icroplanning FAQ
s


Part 3 | Microplanning FAQs
69
FAQs:Conducting a data analysis
What target population data should I use?
The infant target population may range from 2% to 4% of the total population, but this will vary from country to country and from district to district. Compare population figures from different sources, such as national census, head count, NGO estimates, polio, measles, and supplemental immunization activities (SIA) results, and discuss which one is most accurate. Always look at the records from past national immunization days (NIDs) and other SIAs. The tally sheets and reports from SIAs often list the total number of children under five reached by village for each round. Dividing this total by five will give an approximate number for the infant population, i.e. your target population.
What drop-out calculation should I use?
calculations such as BCG minus measles coverage can be useful. Penta3 to measles can also be useful as a drop-out measure in some countries, and it suggests special efforts to remind parents to return for measles vaccine.
What criteria should be used to prioritize villages?
The areas with the highest number of unimmunized infants must be given high priority. This is the simplest way to make a priority list and that is why it is used for Table 1. However, certain other factors should also be considered, such as areas that are never reached, areas with high disease incidence, or factors such as feasibility, all of which require local knowledge to decide on priority. In Table 3 these other factors can be incorporated.
Pa
rt 1: H
ea
lth fa
cility m
icrop
lan
nin
gP
art 2
: District m
icrop
lan
nin
gPart 3: M
icroplanning FAQ
s

Microplanning for immunization service delivery using the Reaching Every District (RED) strategy
70
FAQs:Preparing a map
What is the purpose of preparing a map?
A map helps to visually represent the area served by the health facility.
decide the appropriate delivery strategy (fixed, outreach or mobile) to reach every infant and pregnant woman in the catchment area.
I am not an expert in drawing, so how can I draw a map of my catchment area?
However, there may already be good maps in use for polio eradication or other programmes. Look for these first, and decide how they can be modified for the purpose of routine immunization microplanning.
How do I decide the immunization strategy relevant for each area?
Distance and time are often the main criteria for deciding the immunization delivery strategy. Other factors such as population size of communities, number of available staff, available budget, road conditions, and social and economic condition of the target population play an important role in
not be very far from the health facility, but outreach may be required as parents may be too busy to bring their infants to the health facility.

Part 3 | Microplanning FAQs
71
FAQs:Preparing a session plan
What is the purpose of a session plan?
A session plan determines the appropriate number and type of immunization sessions needed to cover every area of the target population. In this guide, session delivery strategies are classified as fixed, outreach or mobile team. Individual health facility session plans can be combined into a district session plan, this will enable the district to plan for the resources needed, and to make a supervision plan.
What is the difference between a session plan and a workplan?
A session plan is based upon an estimate of the workload and details the number of sessions, and therefore days or visits, needed to serve the entire target population. A workplan states when, where and by whom the planned sessions will be held, and also contains other immunization-related activities planned by the health facility (e.g. community visits, training, etc.). Using the session plan as a basis, a workplan details how the session plan will be implemented.
Our health facilities offer immunization sessions every day, so why do we need to prepare a session plan?
A session plan will help you decide whether having immunization sessions every day is the most efficient use of time and resources. It will also help you decide whether there needs to be a different balance of fixed and outreach sessions. By going through the calculations needed for the session plan, you
it may be more efficient to perform other activities (such as outreach, following up defaulters, etc.) rather than holding a session everyday.
I conduct sessions based on a session plan, but some sessions have poor attendance. What should I do?
A session plan is based on the target population and expected workload. So, if there is poor attendance the first thing to do is understand why.
community. It may be possible to adjust the session times and locations, or there may be other reasons that need to be addressed.
Pa
rt 1: H
ea
lth fa
cility m
icrop
lan
nin
gP
art 2
: District m
icrop
lan
nin
gPart 3: M
icroplanning FAQ
s

Microplanning for immunization service delivery using the Reaching Every District (RED) strategy
72
Even though I hold sessions according to my plan, parents complain that they have to wait for a very long time.
If parents have to wait for a long time to get their children immunized,
occurs. Do staff arrive late? Are there enough staff for the session? Are there unexpectedly large numbers of infants and pregnant women? Then think of possible solutions that can be included in the session plan and workplan.
help on immunization days? Can waiting be made comfortable for the parents? Is the outreach setting and immunization table set so as to make it easy for the health workers to give immunization easily and quickly?
How can I plan to integrate with other interventions?
Normally the decision on which interventions will be integrated with immunization is taken at national or sub-national level. However, the district and health facility staff can plan how other interventions will be delivered. Logistics and supply planning will depend on the type of
is needed, for example malaria bednets, deworming tablets, nutritional supplements, all of which are usually available at district level. Then you should make sure the supplies are available at the health facility level, and who will be responsible for their delivery.

Part 3 | Microplanning FAQs
73
FAQs:Using the RED strategy
What is the RED strategy? (see also the Introduction).
and other partners to help improve immunization systems. The RED strategy provides five operational components to be included in district and health
- re-establishment of outreach services
- supportive supervision
- community links with service delivery
- monitoring and use of data for action
- planning and management of resources.
The RED strategy is a strategy to guide immunization programmes, not a separate initiative or programme.
The RED strategy is a useful list, but how should it be used?
In this guide we present the RED strategy as a framework to guide problem-solving, which a health facility and district can use to decide for themselves
use the RED problem-solving framework as a kind of checklist, to make
microplans often overlook activities to involve the local community. By using the RED strategy as a framework, you will be reminded to consider existing community links, and think how the situation can be improved.
How can we monitor the use of the RED strategy?
It is not essential to monitor the use of the RED strategy itself, but it is essential to monitor the various activities in the microplan.you intend to re-establish and improve outreach services, then you should be able to measure progress by reporting on the frequency of fixed and outreach sessions in the monthly report. The same applies for all five components of the RED strategy. The information you provide in your monthly report, for example, community meetings held, supervisory visits made, follow up of defaulters, will show how the RED strategy is being implemented.
Pa
rt 1: H
ea
lth fa
cility m
icrop
lan
nin
gP
art 2
: District m
icrop
lan
nin
gPart 3: M
icroplanning FAQ
s
Microplanning for immunization service delivery using the Reaching Every District (RED) strategy
74
FAQs:Preparing a workplan.
What should I do if I have a heavy workload and not enough time to perform activities planned on the workplan?
Always start by deciding on priorities. If a specific area or activity is high priority, try to make sure the activity takes place on time. If a heavy workload makes it difficult to implement an activity, request assistance from
include comments in the monthly report.
What should I do if there are any small villages in my catchment area that I think I will not be able to cover?
When discussing your workplan with the district, consider if you can visit smaller villages in the vicinity of larger ones in one trip, and on the same day. Alternatively, try to cover several smaller villages on the same day. Discuss also with district staff the possibility of district support to cover these.

Part 3 | Microplanning FAQs
75
NOTES: Pa
rt 1: H
ea
lth fa
cility m
icrop
lan
nin
gP
art 2
: District m
icrop
lan
nin
gPart 3: M
icroplanning FAQ
s

The World Health Organization has provided technical support to its Member States in the field of vaccine-preventable diseases since 1975. The office carrying out this function at WHO headquarters is the Department of Immunization, Vaccines and Biologicals (IVB).
IVB's mission is the achievement of a world in which all people at risk are protected against vaccine-preventable diseases. The Department covers a range of activities including research and development, standard-setting, vaccine regulation and quality, vaccine supply and immunization financing, and immunization system strengthening.
These activities are carried out by three technical units: the Initiative for Vaccine Research; the Quality, Safety and Standards team; and the Expanded Programme on Immunization.
The Initiative for Vaccine Research guides, facilitates and provides a vision for worldwide vaccine and immunization technology research and development efforts. It focuses on current and emerging diseases of global public health importance, including pandemic influenza. Its main activities cover: i) research and development of key candidate vaccines; ii) implementation research to promote evidence-based decision-making on the early introduction of new vaccines; and iii) promotion of the development, evaluation and future availability of HIV, tuberculosis and malaria vaccines.
The Quality, Safety and Standards team focuses on supporting the use of vaccines, other biological products and immunization-related equipment that meet current international norms and standards of quality and safety. Activities cover: i) setting norms and standards and establishing reference preparation materials; ii) ensuring the use of quality vaccines and immunization equipment through prequalification activities and strengthening national regulatory authorities; and iii) monitoring, assessing and responding to immunization safety issues of global concern.
The Expanded Programme on Immunization focuses on maximizing access to high quality immunization services, accelerating disease control and linking to other health interventions that can be delivered during immunization contacts. Activities cover: i) immunization systems strengthening, including expansion of immunization services beyond the infant age group; ii) accelerated control of measles and maternal and neonatal tetanus; iii) introduction of new and underutilized vaccines; iv) vaccine supply and immunization financing; and v) disease surveillance and immunization coverage monitoring for tracking global progress.
The Director's Office directs the work of these units through oversight of immunization programme policy, planning, coordination and management. It also mobilizes resources and carries out communication, advocacy and media-related work.
Department of Immunization,
Vaccines and BiologicalsFamily and Community Health World Health Organization20, Avenue AppiaCH-1211 Geneva 27SwitzerlandE-mail: [email protected] site: http://www.who.int/immunization/en/