published in applied catalysis a: general, vol. 349 ... - core · the influence of ethanol on the...
TRANSCRIPT

PHOTOCATALYTIC OXIDATION OF AROMATIC ALCOHOLS TO ALDEHYDES
IN AQUEOUS SUSPENSION OF HOME PREPARED TITANIUM DIOXIDE
2 INTRINSIC AND SURFACE FEATURES OF CATALYSTS
Vincenzo Augugliaroa Horst Kischb Vittorio Loddoa Mariacutea Joseacute Loacutepez-Muntildeozc
Carlos Maacuterquez-Aacutelvarezd Giovanni Palmisanoa Leonardo Palmisanoa
Francesco Parrinob Sedat Yurdakalae
a ldquoSchiavello-Grillonerdquo Photocatalysis Group Dipartimento di Ingegneria Chimica dei Processi e
dei Materiali Universitagrave degli Studi di Palermo Viale delle Scienze 90128 Palermo Italy b Institute of Inorganic Chemistry University of Erlangen-Nuumlrnberg Egerlandstrasse 1 D-91058
Erlangen Germany c Department of Chemical and Environmental Technology ESCET Rey Juan Carlos University
CTulipaacuten sn 28933 Moacutestoles Madrid Spain d Instituto de Cataacutelisis y Petroleoquiacutemica CSIC CMarie Curie 2 28049 Cantoblanco Madrid
Spain e Kimya Boumlluumlmuuml Fen Fakuumlltesi Anadolu Uumlniversitesi Yunus Emre Kampuumlsuuml 26470 Eskişehir
Turkey
Dedicated to the friendship between Pablo Neruda and Nazım Hikmet
Corresponding authors
E-mail augugliarodicpmunipait palmisanodicpmunipait
KEYWORDS photocatalysis TiO2 in situ ATR-FTIR analysis aromatic alcohols selective
oxidation aliphatic alcohol
Published in Applied Catalysis A General vol 349 pp 189-197 (2008)
httpdxdoiorg101016japcata200807038
2
ABSTRACT
As reported in an accompanying contribution [1] home-prepared (HP) TiO2 powders were used
for carrying out the photocatalytic oxidation of benzyl alcohol (BA) in water The addition of
small amounts of ethanol decreases the oxidation rate of BA but it enhances the selectivity for
aldehyde formation The catalysts textural characterization carried out with XRD SEM
observations BET surface area and porosity measurements has been elsewhere reported [1] In
this paper some intrinsic electronic properties were investigated by Diffuse Reflectance
Spectroscopy and quasi-Fermi Level measurements The values of band gap valence band and
conduction band edges are almost identical for all the HP samples in which anatase phase is
predominant whereas appreciable differences can be noticed for an HP sample containing high
amount of rutile phase A comparative ATR-FTIR study of the HP catalyst showing the highest
selectivity and the commercial titania showing the highest activity towards BA oxidation
(Degussa P25 TiO2) was carried out The ATR-FTIR results indicate that HP and Degussa P25
surfaces show a very dissimilar hydrophilicity and different ability for adsorbing the organic
compounds deriving from benzyl alcohol photocatalytic oxidation Results show moreover that
the improved selectivity to aldehyde by adding ethanol is due to a competition between the
substrate and the ethanol for adsorption on reactive sites
3
1 INTRODUCTION
The accompanying contribution [1] of this paper has been devoted to study the selective
oxidation of benzyl alcohol (BA) to benzaldehyde (BAD) in water by using irradiated TiO2
catalysts The photoreactivity runs were carried out with aqueous suspensions of different home
prepared (HP) TiO2 specimens and of a commercial TiO2 catalyst (Degussa P25) The
performances of catalysts were compared in terms of BA oxidation rate and selectivity towards
BAD production The HP catalysts exhibited reaction rates always lower than that of the
commercial one but selectivity values about four times higher The addition to the HP catalyst
suspension of ethanol decreases the overall oxidation rate of BA but it determines a significant
improvement of the photoprocess selectivity towards aldehyde The selectivity enhancement by
ethanol seems to be specific of HP catalysts this effect being negligible with Degussa P25
The results of HP catalysts textural characterization carried out with XRD SEM
observations BET surface area and porosity measurements are elsewhere reported [1] The main
aim of this investigation was that of finding likely explanations for the different photoactivity
shown by HP and commercial catalysts In order to reach this goal bulk and surface properties
have been investigated For the first ones some intrinsic electronic features of catalysts were
investigated by Diffuse Reflectance Spectroscopy and quasi-Fermi Level measurements for the
second ones in situ attenuated total reflection Fourier transform infrared (ATR-FTIR)
spectroscopy has been used The ATR-FTIR study has been focused on the comparison of the HP
catalyst showing the highest selectivity and the Degussa P25 TiO2 sample which exhibits the
highest activity for the BA photocatalytic oxidation The features of the interaction of BA with
the catalyst surface the identification of the species adsorbed on catalyst upon photooxidation of
BA and the effect of water and ethanol on the overall process were investigated The water
adsorption capability of both catalysts was also investigated by thermogravimetric analysis
4
2 EXPERIMENTAL
21 Catalysts preparation and characterization
The preparation method has been reported elsewhere [2] The precursor solution was
obtained by adding 5 mL of TiCl4 drop by drop into a 200 mL beaker containing 50 mL of water
During the addition that lasted 5 min the solution was magnetically stirred by a cylindrical bar
(length 3 cm diameter 05 cm) at 600 rpm After that the beaker was closed and mixing was
prolonged for 12 h at room temperature eventually obtaining a clear solution This solution was
transferred to a round-bottom flask fitted with a Graham condenser The flask was heated in
boiling water for 05 2 4 6 and 8 h obtaining a white suspension at the end of each treatment
The suspension was then dried at 323 K by means of a rotovapor machine (model Buchi
Rotovapor M) working at 50 rpm in order to obtain the final powdered catalysts The HP
powders were washed with distilled water and centrifuged several times until the chloride ion
concentration in the washing water reached a negligible value as checked by AgNO3 test
Hereafter the home prepared catalysts are referred to as ldquoHPxrdquo in which the x figure indicates the
boiling time of the precursor expressed in hours
Diffuse reflectance spectra of the solids were obtained using a UV-Vis spectrophotometer
(Shimadzu UV-2401PC) Samples were spread onto BaSO4 plates the background reflectance of
BaSO4 was measured before Reflectance was converted by the instrument software to F(Rinfin)
values according to the Kubelka-Munk theory [3]
Thermogravimetric analyses were performed by using a Netzch equipment (model STA
409) The heating rate was 10 degCmin in static air and the powder amount put in open Pt
crucible was 190 mg for all the samples
All the chemicals used for preparation and characterization studies were purchased from
Sigma Aldrich with purity gt 99
22 Photoelectrochemical measurements
According to the literature [4] 50 mg of catalyst and 10 mg of methyl viologen dichloride
were suspended in a 100 mL two-necked flask in 50 mL of 01 M KNO3 A platinum flag and
AgAgCl served as working and reference electrodes respectively A pH-meter allowed to follow
the proton concentration HNO3 (01M) and NaOH were used to adjust the pH value The
5
suspension was magnetically stirred and flushed with dinitrogen throughout the experiment
carried out at room temperature In general the starting suspension had pH 25 In order to check
the influence of ethanol on the flat band potential 5 ml of ethanol (Merck 999) were added
into the suspension and the same procedure was carried out Irradiation was performed with a 150
W xenon arc lamp (OSRAM XBO I0 (300-400 nm) = 1410ndash6 Einsteinsndash1cmndash2) installed in a
light-condensing lamp housing (PTI A1010S) on an optical train The flask was mounted at a
distance of 30 cm from the lamp
23 In situ ATR-FTIR measurements
Infrared spectra of thin films of the photocatalysts were recorded using a Thermo Nicolet
Nexus FTIR spectrometer equipped with a liquid nitrogen-cooled MCT detector and a SensIR
Technologies DurasamplIR 9-reflection horizontal ATR accessory (4 mm diameter diamond-
faced ZnSe prism) Titania samples grounded in an agate mortar were suspended in Milli-Q
deionized water (25 mg solid in 25 mL water) and sonicated for 20 min (Elma Transsonic
T470H ultrasonic cleaning unit) Thin films were prepared by dropping 50 μL of the suspension
onto the ATR crystal and then allowing the solvent to evaporate The procedure was repeated
twice to obtain thin films containing ca 100 μg TiO2 A 100 mL volume glass flow cell was
attached to the ATR plate through an o-ring sealed connection and the thin film was dried at
room temperature for several minutes in a stream of synthetic air (Air Liquide Alphagaz Air 1)
Adsorption of water ethanol (Panreac 995) and benzyl alcohol (Sigma-Aldrich purity gt 99)
vapours on the dried TiO2 thin films was carried out at room temperature under static conditions
by introducing 02 mL of each liquid adsorbate inside the closed glass cell previously purged
with synthetic air After adsorption in the dark for around 1 h UV irradiation of the photocatalyst
films in contact with the wateralcohol-saturated air atmosphere was performed using an 80 W
mercury vapour lamp (OSRAM HQL de luxe MBF-U) The light was filtered by passing through
a Pyrex vessel containing a 01 M CuSO4 aqueous solution Time-resolved FTIR spectra in the
4000-900 cm-1 wavenumber range with a resolution of 4 cm-1 were recorded along with the
adsorption and irradiation steps at room temperature Each spectrum was obtained by averaging
10 scans accumulated in 4 seconds Happ-Genzel apodization function was applied The spectra
were referenced against the spectrum of the dried TiO2 thin film
6
3 RESULTS AND DISCUSSION
31 Catalysts characterization
Figure 1 exhibits the transformed diffuse reflectance spectra of two HP catalysts ie
HP05 and HP8 the plots report the values of [F(Rinfin)E]05 the modified Kubelka-Munk function
versus E the energy of exciting light The weak low-energy shoulder may correspond to the
presence of rutile phase its intensity proportional to the rutile amount increases by increasing
the boiling time The corresponding band gap energies of all the used HP and commercial
catalysts were obtained from plots like those reported in Fig 1 assuming that the solids are
indirect crystalline semiconductors [5] The band gap values are reported in Table 1 these values
are quite similar for predominantly anatase phase catalysts
Thermogravimetric and time derivative curves of Degussa P25 and HP05 samples are
shown and compared in Fig 2 Degussa P25 is stable up to 800 ordmC and it shows only 1 weight
change due to the occurrence of a release of adsorbed moisture below 100 ordmC For HP05 sample
the TG curve shows that it contains a significant amount of physically adsorbed water about 10
weight in fact the evaporation of bound water becomes significant at about 80 ordmC and the
highest rate of mass losses is reached at around 140 ordmC It is remarkable that the loss of water
continues up to 350 ordmC thus indicating that the energy of interaction between water molecules and
HP05 surface covers a wide range
The quasi-Fermi level of electrons Efb was determined according to literature [4] by
measuring the photovoltage in the presence of methylviologen MV as a function of pH value
Figure 3 reports the measurements obtained with all HP catalysts Upon increasing the pH value
a blue color is developed when approaching the inflection point pH0 due to formation of the
methylviologen radical cation A lower pH0 value corresponds to a more negative quasi-Fermi
level From pH0 value of the corresponding titration curve (see Fig 3) the quasi-Fermi level at
pH 7 can be calculated via eqn 1
Efb = E0MV
2+MV
+ + k (pH0 ndash pH) (1)
7
where E0MV
2+MV
+ is the redox potential of the MV2+MV+ couple and k is assumed equal to
0059 V The Efb values of all catalysts are reported in Table 1 it may be noted that the position
of the quasi Fermi level for Degussa P25 and HP05 to HP6 samples is about the same (-055 and
-052 V respectively) indicating that interfacial electron transfer to methylviologen proceeds
from the anatase conduction band However in the case of HP8 this value is ndash037 V which is
characteristic for rutile type TiO2 and indicates that reduction of methylviologen occurs via
electrons trapped at the rutile conduction band By assuming that the difference between the
quasi-Fermi level potential and conduction band edge is negligible the valence band edge values
can be obtained by addition of the band gap energy HP05 HP2 and HP4 band edge is located at
284 V whereas it is shifted to 274 V for HP6 which contains a significant amount of rutile and
for HP8 nearly pure rutile
These results indicate that the photoelectrochemical features of anatase and anatase-rutile
catalysts are very similar On this basis it is likely that these properties play a minor role in
determining the differences of reactivity and selectivity shown by these samples [1]
In the presence of 10 vol of ethanol the flatband potential of HP05 was shifted
cathodically by about 006 V (see Fig 4) while the shift was about 009 V in the case of P25
Similar shifts had been reported in the literature [6] when the flatband potential of titania was
measured in non-diluted methanol From these results one can conclude that in aqueous ethanol
solution the reductive power of the reactive electron in anatase powders is much higher than in
pure water
32 ATR-FTIR analysis
321 Adsorption of water and benzyl alcohol on HP05
Figure 5 displays the in situ ATR-FTIR spectra acquired when exposing HP05 in an
atmosphere of synthetic air saturated with BA and water The great enhancement over time in the
intensity of the absorption band centred at 1640 cm-1 due to the bending vibration mode of
adsorbed molecular water indicates a remarkable hydrophilicity of the HP05 surface The clear
tailing of the δ(HOH) vibration band towards low frequencies may be indicative of different
adsorption sites for molecular water
8
Bands growing in at 1497 1455 1369 1208 1079 1035 1018 and 1006 cm-1 are mainly
the same as those in pure BA (see Fig 5) At high frequencies a broad and strong absorption
showing two maxima at ca 3400 cm-1 and 3240 cm-1 is detected indicating the presence of
hydrogen-bonded perturbed OH groups and water Two weak bands superimposed to this broad
absorption appear at 3066 and 3033 cm-1 which are ascribed to the C-H stretching vibrations of
the aromatic ring of the alcohol The bands at 1497 and 1455 cm-1 can be readily assigned to
skeletal vibrations of the aromatic ring and the band centred at 1208 cm-1 to the C-C stretching
vibration The band centred at 1369 cm-1 can be attributed to the O-H in-plane deformation mode
of the alcohol [7] The presence of this band is indicative of non-dissociative adsorption of BA on
the HP05 surface According to these FTIR spectra molecularly adsorbed BA appears to be the
predominant surface organic species formed
It is usually reported that adsorption of alcohols on metal oxide surfaces leads to the
formation of alcoholate species However in the present study the identification of adsorbed
benzolate on HP05 sample is not straightforward To the best of our knowledge infrared spectra
of benzolate species on hydroxylated titania have not been reported up-to-date Moreover the
close wavenumber values usually observed for the different vibration bands of alcohols and their
corresponding alcoholate species hinders an unequivocal assignment In the present case a clear
indication of benzolate formation could be obtained from the analysis of the evolution of the C-C
and C-O stretching modes region (bands at 1035 1018 and 1006 cm-1) as formation of
alcoholate species should be accompanied by a significant blue shift of the alcohol C-O
stretching band As adsorption of BA progresses a band centred at 1041 cm-1 grows
superimposed to the band located at 1035 cm-1 This shift does not seem to be large enough to
definitively justify the formation of benzyl alcoholate species but in any case it is indicative of
the existence of different adsorption sites on the HP05 surface or different ways of interaction
between BA and the sample surface
Figure 6 displays the time evolution of the amounts of water and BA adsorbed on HP05
those amounts are plotted as the integrated absorbance of selected IR bands It can be observed
that in the first 10 minutes the amounts of both adsorbed water and BA continuously increase
However the quantity of adsorbed alcohol reaches a maximum and then it monotonously
decreases with time while the amount of adsorbed water continuously increases thus indicating
9
that water favourably competes with BA for adsorption determining a partial displacement of BA
from the TiO2 surface
322 Adsorption of water and benzyl alcohol on commercial TiO2
The adsorption of BA and water on Degussa P25 following a similar experimental
procedure gives rise to spectra that show remarkable differences with respect to HP05 sample
(see Fig 7) It is worth to note that the intensity of the absorption band centred at 1645 cm-1 due
to the δ(HOH) vibration of molecularly adsorbed water appears for Degussa P25 with much
lesser intensity than for HP05 sample (note that the integrated absorbance scale for water in Fig
6 is 10 times larger for this sample) thus indicating the substantially lower hydrophilicity of the
Degussa P25 surface This finding is also in accord with TG measurements (see Fig 2)
Adsorption of BA molecules with scarce modifications is demonstrated by the presence of
absorption bands at 1498 1454 1372 1208 1078 and 1037 cm-1 The time evolution of the
integrated absorbance of IR bands at 1208 and 1640 cm-1 (see Fig 6) shows that the amounts of
BA adsorbed on HP05 and Degussa P25 are comparable however the BA amount per unit
surface area is ca 5 times higher in Degussa P25 than in HP05 Figure 6 also shows that water is
able to displace part of adsorbed BA but owing to the much lesser amount of water adsorbed on
Degussa P25 the displacement of the alcohol is slower than in HP05 sample
Besides the above mentioned bands ascribable to the adsorbed alcohol a group of
absorptions (not observed with HP05 sample) at 1413 1340 and 1156 cm-1 are also detected in
the spectra displayed in Fig 7 The band centred at 1156 cm-1 might be ascribed to a C-O
stretching vibration its blue shift with respect to the molecular alcohol is in contrast with that
previously discussed for HP05 large enough to indicate the formation of adsorbed benzolate
species On this basis it may be hypothesized the presence of two distinct adsorption sites for BA
on the Degussa P25 surface Additionally weak features are initially formed at 1705 1602 and
1584 cm-1 although as adsorption progresses they are obscured by the strong water absorption at
1645 cm-1 The frequency value of 1705 cm-1 points out to the presence of carbonyl group In the
high-frequency region besides the broad features centred at ca 3400 cm-1 and 3240 cm-1 due to
hydrogen-bonded hydroxyl groups bands at 3092 3069 3037 2963 2941 2885 and 2801 cm-1
appear upon contact of BA and water with the catalyst As shown in Fig 7 the bands in the
3100-2880 cm-1 range match the C-H stretching bands of BA However the band at 2801 cm-1
10
cannot be ascribed to this species A plausible assignment for this low frequency band would be
the C-H stretching mode of an aldehyde group what would be in agreement with an assignment
to the C=O stretching of an aldehyde group for the band centred at 1705 cm-1 Moreover the
bands at 1602 and 1584 cm-1 would agree with the presence of benzaldehyde [7] As
benzaldehyde is not expected to be formed upon adsorption at room temperature of BA on a
hydroxylated titania surface analysis of the benzyl alcohol purity was performed by HPLC It
was confirmed the presence of traces of benzaldehyde which explains the origin of the
corresponding signals in the infrared spectra It is worthy to note that even though the amount of
adsorbed BA is similar on both titania infrared bands due to adsorbed benzaldehyde are detected
only in Degussa P25 This reveals a quite dissimilar ability of both titania samples to adsorb
benzaldehyde which is strongly retained on the Degussa P25 surface but hardly hold by HP05
This feature should be taken into account to explain the higher selectivity to partial oxidation of
HP05 with respect to Degussa P25
323 Influence of irradiation on HP05
After exposure to the water and BA-saturated air atmosphere for around 1 h in the dark
HP05 sample was irradiated which led to the decrease in intensity of the bands derived from the
alcohol adsorption together with the further enhancement of the band at 1640 cm-1 and the
appearance of new overlapped bands in the 1500-1400 cm-1 range and at ca 1275 cm-1 (see Fig
8) It should be stressed that the intensity of the δ(HOH) vibration band of adsorbed water
continuously increased during irradiation but this growth stopped as soon as the lamp was
switched off This result indicates either that irradiation promotes an effective photoadsorption of
water on the HP05 surface or that water is formed as a product of the photocatalytic degradation
of the aromatic alcohol Nevertheless the steep increase of the band suggests that the
photoadsorption phenomenon is the predominant one as the increase of water vapour pressure
from the photoreaction cannot be so fast
The intensity and broadness of the band centred at 1640 cm-1 hinders the detection of
other oxidation products that might be formed during irradiation such as benzaldehyde or benzoic
acid as it overlaps the carbonyl stretching region On the other side bands in the 1400 to 1500
cm-1 range and the band at 1275 cm-1 cannot be unequivocally assigned to specific species but
according to their wavenumber values they might be indicative of the formation of dicarboxylic
11
acids following the breakage of the aromatic structure For instance values of 1271 1424 1686
and 1711 cm-1 have been previously reported for oxalate adsorbed on TiO2 [8] In the same study
absorption maxima centred at 1275 1352 1430 and 1597 cm-1 were found in the infrared spectra
of malonic acid adsorbed on TiO2
324 Influence of irradiation on commercial TiO2
In the case of Degussa P25 sample irradiation also produces a remarkable decrease in
intensity of the bands associated to adsorbed BA (see Fig 9) However in contrast with HP05
sample the resulting spectra show a complexity of features whose intensity increases with the
irradiation time Besides the water bending band at 1645 cm-1 the most prominent bands are
peaked at 1711 1686 1603 1530 1496 1451 1415 1403 (sh) 1274 and 1246 cm-1 The
assignment given to the bands in accordance to previous studies points out to the formation of
benzaldehyde and benzoic acid as main oxidation products adsorbed on the Degussa P25 surface
The band centred at 1711 cm-1 can be ascribed to the C=O stretching vibration of the carbonyl
group of benzaldehyde [9] whereas the bands at 1603 1530 1496 1451 1415 and 1403 cm-1
would be indicative of the adsorption of benzoic acid as benzoate [10 11] Johnson et al [10]
observed in the IR spectrum of a dried TiO2-benzoic acid aqueous dispersion features centred at
1602 and 1451 cm-1 assigned to the aromatic ring C=C vibrations a strong band at 1415 cm-1
assigned to the COOndash symmetric stretching vibration and a broad band centred at 1538 cm-1
attributed to the COOndash asymmetric vibration Upon adsorption of benzoic acid on TiO2 Finnie et
al [11] observed bands at 1535 and 1505 cm-1 that were assigned to the νas(COO) mode and
bands at 1418 and 1405 cm-1 ascribed to the νs(COO) vibration Splitting of the bands was
ascribed to the presence of two different coordination sites on the titania surface In both studies
the difference between the frequencies of asymmetric and symmetric COOndash group vibrations (Δν
= νas - νs) was observed to be higher than that of the benzoate anion which led to the conclusion
that benzoic acid was adsorbed on TiO2 as a bidentate complex either chelating or bridging On
this basis in the present study the bands centred at 1603 and 1451 cm-1 are assigned to skeletal
vibrations of the aromatic ring in adsorbed benzoic acid whereas bands centred at 1530 and 1496
cm-1 are ascribed to COO asymmetric stretching vibration and the bands at 1415 and 1403 cm-1 to
symmetric stretching Accordingly the largest value for the difference between the frequencies of
asymmetric and symmetric COOndash group stretching vibrations would be Δν = 1530-1415 = 127
12
cmndash1 value which is in agreement with a bidentate chelate or bridging coordination of benzoate
on the titania surface [10 12] As for the band centred at 1686 cm-1 it might be ascribed to the
C=O stretching vibration of undissociated benzoic acid [13] which could be attached to the TiO2
surface through either unidentate coordination or hydrogen bonding Finally the bands centred at
1274 and 1246 cm-1 must be indicative of further oxidized compounds most likely oxalate
according to the wavenumber values reported for these species [8] In fact it has been previously
shown that oxalate hardly desorbs from the Degussa P25 surface [14] so it might be expected on
the titania surface if formed during the mineralization of the aromatic alcohol
325 Influence of ethanol co-adsorption on concentration of adsorbed species
Aiming at giving likely explanations on the influence of aliphatic alcohols on selectivity
of BA oxidation [1] experiments were performed exposing samples to an atmosphere of
synthetic air saturated with BA ethanol and water to obtain further information on the effect of
ethanol co-adsorption on the interaction of BA with titania surfaces The experiments were
carried out by exposing the catalyst for 10 min to BA and water and then ethanol was introduced
in the cell Figure 10 shows ATR-FTIR spectra recorded during the adsorption experiment For
HP05 and Degussa P25 catalysts upon ethanol admission in the cell bands centred at 1480
1450 1380 1326 1275 1088 and 1046 cm-1 appear in the spectra These features are identical to
the absorptions observed in the spectrum of neat ethanol (spectra not shown) thus indicating that
ethanol is adsorbed on the catalyst surface mostly as molecular species It is worth to note that for
HP05 the adsorption of ethanol decreased the amount of adsorbed molecular water as indicated
by the much lower intensity of the δ(HOH) vibration band compared to the spectra shown in Fig
5 Moreover this band shifted toward higher wavenumber values (1654 cm-1) in both titania
surfaces thus indicating an interaction between adsorbed water and ethanol species most likely
through hydrogen bonding Similar effect was observed upon ethanol adsorption in the absence
of BA
From the concentration profiles reported in Fig 6 it may be noted that the presence of
ethanol has different effects on HP05 and Degussa P25 For both catalysts the amount of BA
adsorbed on titania surfaces diminishes to a great extent as ethanol is introduced in the cell
Nevertheless after 30 min of contact with ethanol vapour weak bands corresponding to adsorbed
benzyl alcohol at 1497 and 1208 cm-1 could still be clearly observed in the spectra of both
13
samples (see Fig 10) Exposure to ethanol vapour also produced a significant decrease of the
amount of adsorbed water in both samples However after the initial sharp decrease the amount
of water adsorbed on Degussa P25 slowly increased with time while on HP05 sample it reached
a nearly constant level which indicates that ethanol competes more strongly with water for
adsorption on HP05 sample than on the commercial titania
326 Influence of ethanol co-adsorption on photo-oxidation products
Subsequent irradiation of HP05 sample results in the appearance of broad overlapping
bands at ca 1565 and 1522 cm-1 that can be assigned to carboxylate species derived from ethanol
photo-oxidation [15] and the growing in of bands centred at 1407 and 1350 cm-1 (see Fig 11)
Note particularly that in contrast with results obtained in the absence of ethanol the carbonyl
stretching region is not hidden by the δ(HOH) band due to the lower adsorbed water content that
induces the co-adsorption of ethanol Therefore it can be now clearly observed that no
characteristic bands of benzaldehyde are formed
In the case of Degussa P25 UV irradiation gives rise to a large increase of the spectra
baseline at wavenumbers below 2000 cm-1 that peak at ca 900 cm-1 This phenomenon was
reproducible and was observed only when ethanol was adsorbed on Degussa P25 either in the
presence or absence of co-adsorbed BA This UV-induced infrared absorption has been already
reported for dry Degussa P25 and it has been attributed to excitation of shallow trap electrons to
the conduction band [16] UV light also produces the development of bands centred at 1710
1685 1650 1602 1540 1450 1414 and 1270 cm-1 indicative of the presence on the Degussa P25
surface of products derived from the oxidation of both alcohols The finding that the bands of BA
oxidation products appear also in the presence of ethanol seems to indicate that ethanol does not
affect the BA oxidation pathways but it only decreases BA concentration on catalyst surface
4 CONCLUSIONS
The photoelectrochemical characterization of HP catalysts clearly indicates that the
semiconducting properties of HP05 HP2 HP4 and HP6 did not appreciably vary with the
preparation procedure contrarily to sample HP8 The different photoactivities and selectivities
14
exhibited by the photocatalysts could arise hence more from different properties of their surfaces
rather than from semiconducting ones
From the ATR-FTIR analysis it can be concluded that two main differences between
HP05 and Degussa P25 surfaces exist On one hand their dissimilar hydrophilicity is relevant A
much higher amount of molecular water is indeed present on the former sample in comparison to
the latter On the other hand the ability in adsorbing the organic compounds deriving from BA
photocatalytic oxidation is quite lower for the home prepared catalyst as compared to the
commercial one
On this basis the highest selectivity of HP05 sample towards BA partial oxidation can be
ascribed to its low affinity for benzaldehyde adsorption on one hand and to the lowest
mineralization promoted on the other hand It can be postulated that the higher hydrophilicity of
HP05 sample compared to Degussa P25 plays an important role in connection with the latter
effect as the high coverage of the HP05 surface by water molecules might result in a
competition for adsorption sites
Bearing in mind the difficulty of stating clear correlations between photoreactivity and
catalysts features the following considerations may be drawn The photoactivity results [1]
obtained with HP05 catalyst show a low oxidation rate of benzyl alcohol but a high selectivity to
benzaldehyde The present study shows that the surface of HP05 catalyst is rich in molecularly
adsorbed water which is able to displace BA molecules in the dark Under irradiation water
displaces benzyl alcohol more effectively and determines a very low coverage of alcohol
molecules on HP surface It is likely that this low coverage is responsible for the low oxidation
rate of benzyl alcohol On the other hand the high water content might account for the high
selectivity to benzaldehyde assuming that water compete with BA molecules for the adsorption
on mineralization sites The presence of ethanol lowers the BA amount on HP surface thus
determining a strong decrease of the overall alcohol oxidation rate Molecularly adsorbed water is
also partly displaced by ethanol but the selectivity to benzaldehyde is increased One plausible
explanation is that ethanol is predominantly adsorbed on mineralization sites
For Degussa P25 the reactivity results indicate that the mineralization pathway
predominates over the partial oxidizing one As compared to HP05 this catalyst shows a higher
coverage of benzyl alcohol and smaller water content so that the ratio between water and benzyl
alcohol is low and therefore it is likely that mineralization sites are not preferentially occupied
15
by water molecules The addition of ethanol determines a strong decrease of benzyl alcohol
coverage while the water content is poorly modified For this catalyst neither the benzyl alcohol
oxidation rate nor the selectivity to benzaldehyde is affected by ethanol so that it may be
hypothesised that under irradiation the benzyl alcohol and water coverages on P25 surface remain
unaltered and therefore also the partial oxidation and mineralization pathways
ACKNOWLEDGEMENTS
Eng Dr Fabio DrsquoAgostino is gratefully acknowledged for the execution of TG measurements
16
REFERENCES 1 V Augugliaro H Kisch V Loddo M J Loacutepez-Muntildeoz C Maacuterquez-Aacutelvarez G
Palmisano L Palmisano F Parrino S Yurdakal Appl Catal A Gen (2008)
(submitted) 2 G Palmisano S Yurdakal V Augugliaro V Loddo L Palmisano Adv Synth Catal
349 (2007) 964
3 G Kortuumlm Reflectance Spectroscopy Principles Methods Applications Springer-
Verlag New York 1969
4 A M Roy G C De N Sasmal S S Bhattacharyya Int J Hydrogen Energy 20 (1995)
627
5 J Tauc R Grigorovici A Vanuc Phys Stat Sol 15 (1996) 627
6 G Redmond D Fitzmaurice J Phys Chem 97 (1993) 1426
7 C Keresszegi D Ferri T Mallat A J Baiker J Phys Chem B 109 (2005) 958
8 K D Dobson A J McQillan Spectrochim Acta Part A 55 (1999) 1395
9 H Lampert W Mikenda A Karpfen J Phys Chem A 101 (1997) 2254
10 A M Johnson S Trakhtenberg A S Cannon J C Warner J Phys Chem A 111
(2007) 8139
11 K S Finnie J R Bartlett J L Woolfrey Langmuir 14 (1998) 2744
12 S Tunesi M Anderson Langmuir 8 (1992) 487
13 M Boczar K Szczeponek M J Woacutejcik C Paluszkiewicz J Mol Structure 700 (2004)
39
14 I Dolamic T Buumlrgi J Phys Chem B 110 (2006) 14898
15 D V Kozlov E A Paukshtis E N Savinov Appl Catal B Environ 24 (2000) L7
16 D S Warren A J McQuillan J Phys Chem B 108 (2004) 19373
17
CAPTIONS
Figure 1 Transformed diffuse reflectance spectra of (a) HP05 and (b) HP8
Figure 2 Thermogravimetric (dotted lines) and time derivative (continuous lines) curves in air of
HP05 ( ) and Degussa P25 ( )
Figure 3 Variation of photovoltage with pH value 50 mg of catalyst with 10 mg of methyl
viologen dichloride are suspended in 50 mL of 01 M KNO3 aqueous solution at room
temperature Pt working electrode and AgAgCl reference electrodes
Figure 4 Variation of photovoltage with pH value for HP05 catalyst in the presence (a) and in
the absence (b) of ethanol 50 mg of catalyst with 10 mg of methyl viologen dichloride are
suspended in 50 mL of 01 M KNO3 aqueous solution at room temperature Pt working electrode
and AgAgCl reference electrodes For (b) case 5 ml of ethanol have been added to suspension
Figure 5 Time-resolved ATR-FTIR spectra of HP05 thin film recorded during adsorption of
water and benzyl alcohol (BA) vapours at room temperature The arrows indicate the time when
each adsorbate was introduced in the cell The spectrum of neat benzyl alcohol () multiplied by
a factor 001 has been included for comparison
Figure 6 Time evolution of the integrated absorbance of IR bands at 1640 cm-1 (water) 1208
cm-1 (benzyl alcohol BA) and 2975 cm-1 (ethanol EA) determined from ATR-FTIR spectra
recorded during adsorption of water and benzyl alcohol (top) and water benzyl alcohol and
ethanol (bottom) on HP05 (left) and Degussa P25 (right) samples Zero time corresponds to
introduction of BA into the cell EA was introduced in the cell 10 min after BA
Figure 7 Time-resolved ATR-FTIR spectra of Degussa P25 thin film recorded during adsorption
of water and benzyl alcohol (BA) vapours at room temperature The arrows indicate the time
18
when each adsorbate was introduced in the cell The spectrum of neat benzyl alcohol ()
multiplied by a factor 001 has been included for comparison
Figure 8 Time-resolved ATR-FTIR spectra recorded during irradiation of HP05 thin film in an
atmosphere of synthetic air saturated with water and benzyl alcohol The arrows indicate the time
when UV lamp was switched on (it took around 2 min to reach full power) and off
Figure 9 Time-resolved ATR-FTIR spectra recorded during irradiation of Degussa P25 thin film
in an atmosphere of synthetic air saturated with water and benzyl alcohol The arrows indicate the
time when UV lamp was switched on (it took around 2 min to reach full power)
Figure 10 Time-resolved ATR-FTIR spectra of Degussa P25 (left) and HP05 (right) thin films
recorded during adsorption of water benzyl alcohol (BA) and ethanol (EA) vapours at room
temperature The arrows indicate the time when each adsorbate was introduced in the cell
Figure 11 Time-resolved ATR-FTIR spectra recorded during irradiation of Degussa P25 (left)
and HP05 (right) thin film in an atmosphere of synthetic air saturated with water benzyl alcohol
and ethanol The arrows indicate the time when UV lamp was switched on (it took around 2 min
to reach full power) and off Spectra of Degussa P25 sample recorded after switching off the
lamp have been shifted upwards by 012 absorbance units for clarity
Table 1 Photoelectrochemical properties of catalysts
19
1 2 3 4 5 6 700
02
04
06
08
10
12
14
16
(F(R
infin )
E)1
2
E eV
b)
Figure 1
1 2 3 4 5 6 700
02
04
06
08
10
12
14
16
(F(R
infin )
E)1
2
E eV
a)
20
0
5
10
15
20
25
0
002
004
006
008
01
012
014
0 200 400 600 800
Temperature [degC]
Wei
ght d
eriv
ativ
e [m
gdegC
]
Mas
s lo
ss [m
g]
0
5
10
15
20
25
0
002
004
006
008
01
012
014
0 200 400 600 800
Temperature [degC]
Wei
ght d
eriv
ativ
e [m
gdegC
]
0
5
10
15
20
25
0
002
004
006
008
01
012
014
0 200 400 600 800
Temperature [degC]
Wei
ght d
eriv
ativ
e [m
gdegC
]
Mas
s lo
ss [m
g]
Figure 2
21
1 2 3 4 5 6 7 8 9 10
-04
-02
00
02
04
06 HP05 HP2 HP4 HP6 HP8
E V
pH
pH0=58 pH0=82
Figure 3
22
1 2 3 4 5 6 7 8 9
-02
00
02
04
06 a) b)
E V
pH
pH0=47 pH0=59
Figure 4
23
1600 1400 1200 10003600 3400 3200 3000 2800
10411455
1006
1018
1035
1079
1208
40
20 tim
e (m
in)
Wavenumber (cm-1)
Abs
orba
nce
0
60
005 au
1497
H2OBA
1369
01 au
Figure 5
24
000
005
010
015
H2O (x001)
BABA
H2O (x01)
0 10 20 30 40000
005
010
015
EA (x01)
H2O (x001)Inte
grat
ed a
bsor
banc
e (c
m-1)
Time (min)
BA
0 10 20 30 40
EA (x01)
BA
H2O (x01)
Figure 6
25
1600 1400 1200 10003600 3400 3200 3000 2800
1037
1454
1208
40
20 tim
e (m
in)
Wavenumber (cm-1)
Abs
orba
nce
0
60
0005 au
1498
H2OBA
1372
1602
1584 14
13
1340
1156
3092
001 au
3069
3037
2963
2941
2885
2801
Figure 7
26
1800 1600 1400 1200 1000
1412
1450
1275
20
10
tim
e (m
in)
Wavenumber (cm-1)Ab
sorb
ance
0
30
01 au
UV lamp ON
UV lamp OFF
Figure 8
27
1600 1400 1200 1000
1496
1530
1451
20
10
tim
e (m
in)
Wavenumber (cm-1)Ab
sorb
ance
0
001 au
UV lamp ON
1711 16
86
1603
1415
1403
1274
1246
1645
Figure 9
28
1600 1400 1200 10001600 1400 1200 1000
40
20 tim
e (m
in)
Wavenumber (cm-1)
Abso
rban
ce
0
005 au
H2O
BA
EA
002 au
Figure 10
29
1600 1400 1200 10001600 1400 1200 1000
20
30
10 tim
e (m
in)
Wavenumber (cm-1)
Abso
rban
ce
0
005 au
UV lamp ON
UV lamp OFF
1565
1522 14
0713
50
1540 14
5014
14
1685 1602
1650
1710
1270
005 au
Figure 11
30
Table 1
Catalyst Band gap
[eV]
Efb (pH=7)
[V]
VB edge[V]
Degussa P25
326 ndash 055 ndash 064a
271
Merck 322 ndash 043 279 HP05
336 ndash 052
ndash 058a 284
HP2 336 ndash 052 284 HP4 336 ndash 052 284 HP6 326 ndash 052 274 HP8 311 ndash 037 274
a values obtained in the presence of ethanol

2
ABSTRACT
As reported in an accompanying contribution [1] home-prepared (HP) TiO2 powders were used
for carrying out the photocatalytic oxidation of benzyl alcohol (BA) in water The addition of
small amounts of ethanol decreases the oxidation rate of BA but it enhances the selectivity for
aldehyde formation The catalysts textural characterization carried out with XRD SEM
observations BET surface area and porosity measurements has been elsewhere reported [1] In
this paper some intrinsic electronic properties were investigated by Diffuse Reflectance
Spectroscopy and quasi-Fermi Level measurements The values of band gap valence band and
conduction band edges are almost identical for all the HP samples in which anatase phase is
predominant whereas appreciable differences can be noticed for an HP sample containing high
amount of rutile phase A comparative ATR-FTIR study of the HP catalyst showing the highest
selectivity and the commercial titania showing the highest activity towards BA oxidation
(Degussa P25 TiO2) was carried out The ATR-FTIR results indicate that HP and Degussa P25
surfaces show a very dissimilar hydrophilicity and different ability for adsorbing the organic
compounds deriving from benzyl alcohol photocatalytic oxidation Results show moreover that
the improved selectivity to aldehyde by adding ethanol is due to a competition between the
substrate and the ethanol for adsorption on reactive sites
3
1 INTRODUCTION
The accompanying contribution [1] of this paper has been devoted to study the selective
oxidation of benzyl alcohol (BA) to benzaldehyde (BAD) in water by using irradiated TiO2
catalysts The photoreactivity runs were carried out with aqueous suspensions of different home
prepared (HP) TiO2 specimens and of a commercial TiO2 catalyst (Degussa P25) The
performances of catalysts were compared in terms of BA oxidation rate and selectivity towards
BAD production The HP catalysts exhibited reaction rates always lower than that of the
commercial one but selectivity values about four times higher The addition to the HP catalyst
suspension of ethanol decreases the overall oxidation rate of BA but it determines a significant
improvement of the photoprocess selectivity towards aldehyde The selectivity enhancement by
ethanol seems to be specific of HP catalysts this effect being negligible with Degussa P25
The results of HP catalysts textural characterization carried out with XRD SEM
observations BET surface area and porosity measurements are elsewhere reported [1] The main
aim of this investigation was that of finding likely explanations for the different photoactivity
shown by HP and commercial catalysts In order to reach this goal bulk and surface properties
have been investigated For the first ones some intrinsic electronic features of catalysts were
investigated by Diffuse Reflectance Spectroscopy and quasi-Fermi Level measurements for the
second ones in situ attenuated total reflection Fourier transform infrared (ATR-FTIR)
spectroscopy has been used The ATR-FTIR study has been focused on the comparison of the HP
catalyst showing the highest selectivity and the Degussa P25 TiO2 sample which exhibits the
highest activity for the BA photocatalytic oxidation The features of the interaction of BA with
the catalyst surface the identification of the species adsorbed on catalyst upon photooxidation of
BA and the effect of water and ethanol on the overall process were investigated The water
adsorption capability of both catalysts was also investigated by thermogravimetric analysis
4
2 EXPERIMENTAL
21 Catalysts preparation and characterization
The preparation method has been reported elsewhere [2] The precursor solution was
obtained by adding 5 mL of TiCl4 drop by drop into a 200 mL beaker containing 50 mL of water
During the addition that lasted 5 min the solution was magnetically stirred by a cylindrical bar
(length 3 cm diameter 05 cm) at 600 rpm After that the beaker was closed and mixing was
prolonged for 12 h at room temperature eventually obtaining a clear solution This solution was
transferred to a round-bottom flask fitted with a Graham condenser The flask was heated in
boiling water for 05 2 4 6 and 8 h obtaining a white suspension at the end of each treatment
The suspension was then dried at 323 K by means of a rotovapor machine (model Buchi
Rotovapor M) working at 50 rpm in order to obtain the final powdered catalysts The HP
powders were washed with distilled water and centrifuged several times until the chloride ion
concentration in the washing water reached a negligible value as checked by AgNO3 test
Hereafter the home prepared catalysts are referred to as ldquoHPxrdquo in which the x figure indicates the
boiling time of the precursor expressed in hours
Diffuse reflectance spectra of the solids were obtained using a UV-Vis spectrophotometer
(Shimadzu UV-2401PC) Samples were spread onto BaSO4 plates the background reflectance of
BaSO4 was measured before Reflectance was converted by the instrument software to F(Rinfin)
values according to the Kubelka-Munk theory [3]
Thermogravimetric analyses were performed by using a Netzch equipment (model STA
409) The heating rate was 10 degCmin in static air and the powder amount put in open Pt
crucible was 190 mg for all the samples
All the chemicals used for preparation and characterization studies were purchased from
Sigma Aldrich with purity gt 99
22 Photoelectrochemical measurements
According to the literature [4] 50 mg of catalyst and 10 mg of methyl viologen dichloride
were suspended in a 100 mL two-necked flask in 50 mL of 01 M KNO3 A platinum flag and
AgAgCl served as working and reference electrodes respectively A pH-meter allowed to follow
the proton concentration HNO3 (01M) and NaOH were used to adjust the pH value The
5
suspension was magnetically stirred and flushed with dinitrogen throughout the experiment
carried out at room temperature In general the starting suspension had pH 25 In order to check
the influence of ethanol on the flat band potential 5 ml of ethanol (Merck 999) were added
into the suspension and the same procedure was carried out Irradiation was performed with a 150
W xenon arc lamp (OSRAM XBO I0 (300-400 nm) = 1410ndash6 Einsteinsndash1cmndash2) installed in a
light-condensing lamp housing (PTI A1010S) on an optical train The flask was mounted at a
distance of 30 cm from the lamp
23 In situ ATR-FTIR measurements
Infrared spectra of thin films of the photocatalysts were recorded using a Thermo Nicolet
Nexus FTIR spectrometer equipped with a liquid nitrogen-cooled MCT detector and a SensIR
Technologies DurasamplIR 9-reflection horizontal ATR accessory (4 mm diameter diamond-
faced ZnSe prism) Titania samples grounded in an agate mortar were suspended in Milli-Q
deionized water (25 mg solid in 25 mL water) and sonicated for 20 min (Elma Transsonic
T470H ultrasonic cleaning unit) Thin films were prepared by dropping 50 μL of the suspension
onto the ATR crystal and then allowing the solvent to evaporate The procedure was repeated
twice to obtain thin films containing ca 100 μg TiO2 A 100 mL volume glass flow cell was
attached to the ATR plate through an o-ring sealed connection and the thin film was dried at
room temperature for several minutes in a stream of synthetic air (Air Liquide Alphagaz Air 1)
Adsorption of water ethanol (Panreac 995) and benzyl alcohol (Sigma-Aldrich purity gt 99)
vapours on the dried TiO2 thin films was carried out at room temperature under static conditions
by introducing 02 mL of each liquid adsorbate inside the closed glass cell previously purged
with synthetic air After adsorption in the dark for around 1 h UV irradiation of the photocatalyst
films in contact with the wateralcohol-saturated air atmosphere was performed using an 80 W
mercury vapour lamp (OSRAM HQL de luxe MBF-U) The light was filtered by passing through
a Pyrex vessel containing a 01 M CuSO4 aqueous solution Time-resolved FTIR spectra in the
4000-900 cm-1 wavenumber range with a resolution of 4 cm-1 were recorded along with the
adsorption and irradiation steps at room temperature Each spectrum was obtained by averaging
10 scans accumulated in 4 seconds Happ-Genzel apodization function was applied The spectra
were referenced against the spectrum of the dried TiO2 thin film
6
3 RESULTS AND DISCUSSION
31 Catalysts characterization
Figure 1 exhibits the transformed diffuse reflectance spectra of two HP catalysts ie
HP05 and HP8 the plots report the values of [F(Rinfin)E]05 the modified Kubelka-Munk function
versus E the energy of exciting light The weak low-energy shoulder may correspond to the
presence of rutile phase its intensity proportional to the rutile amount increases by increasing
the boiling time The corresponding band gap energies of all the used HP and commercial
catalysts were obtained from plots like those reported in Fig 1 assuming that the solids are
indirect crystalline semiconductors [5] The band gap values are reported in Table 1 these values
are quite similar for predominantly anatase phase catalysts
Thermogravimetric and time derivative curves of Degussa P25 and HP05 samples are
shown and compared in Fig 2 Degussa P25 is stable up to 800 ordmC and it shows only 1 weight
change due to the occurrence of a release of adsorbed moisture below 100 ordmC For HP05 sample
the TG curve shows that it contains a significant amount of physically adsorbed water about 10
weight in fact the evaporation of bound water becomes significant at about 80 ordmC and the
highest rate of mass losses is reached at around 140 ordmC It is remarkable that the loss of water
continues up to 350 ordmC thus indicating that the energy of interaction between water molecules and
HP05 surface covers a wide range
The quasi-Fermi level of electrons Efb was determined according to literature [4] by
measuring the photovoltage in the presence of methylviologen MV as a function of pH value
Figure 3 reports the measurements obtained with all HP catalysts Upon increasing the pH value
a blue color is developed when approaching the inflection point pH0 due to formation of the
methylviologen radical cation A lower pH0 value corresponds to a more negative quasi-Fermi
level From pH0 value of the corresponding titration curve (see Fig 3) the quasi-Fermi level at
pH 7 can be calculated via eqn 1
Efb = E0MV
2+MV
+ + k (pH0 ndash pH) (1)
7
where E0MV
2+MV
+ is the redox potential of the MV2+MV+ couple and k is assumed equal to
0059 V The Efb values of all catalysts are reported in Table 1 it may be noted that the position
of the quasi Fermi level for Degussa P25 and HP05 to HP6 samples is about the same (-055 and
-052 V respectively) indicating that interfacial electron transfer to methylviologen proceeds
from the anatase conduction band However in the case of HP8 this value is ndash037 V which is
characteristic for rutile type TiO2 and indicates that reduction of methylviologen occurs via
electrons trapped at the rutile conduction band By assuming that the difference between the
quasi-Fermi level potential and conduction band edge is negligible the valence band edge values
can be obtained by addition of the band gap energy HP05 HP2 and HP4 band edge is located at
284 V whereas it is shifted to 274 V for HP6 which contains a significant amount of rutile and
for HP8 nearly pure rutile
These results indicate that the photoelectrochemical features of anatase and anatase-rutile
catalysts are very similar On this basis it is likely that these properties play a minor role in
determining the differences of reactivity and selectivity shown by these samples [1]
In the presence of 10 vol of ethanol the flatband potential of HP05 was shifted
cathodically by about 006 V (see Fig 4) while the shift was about 009 V in the case of P25
Similar shifts had been reported in the literature [6] when the flatband potential of titania was
measured in non-diluted methanol From these results one can conclude that in aqueous ethanol
solution the reductive power of the reactive electron in anatase powders is much higher than in
pure water
32 ATR-FTIR analysis
321 Adsorption of water and benzyl alcohol on HP05
Figure 5 displays the in situ ATR-FTIR spectra acquired when exposing HP05 in an
atmosphere of synthetic air saturated with BA and water The great enhancement over time in the
intensity of the absorption band centred at 1640 cm-1 due to the bending vibration mode of
adsorbed molecular water indicates a remarkable hydrophilicity of the HP05 surface The clear
tailing of the δ(HOH) vibration band towards low frequencies may be indicative of different
adsorption sites for molecular water
8
Bands growing in at 1497 1455 1369 1208 1079 1035 1018 and 1006 cm-1 are mainly
the same as those in pure BA (see Fig 5) At high frequencies a broad and strong absorption
showing two maxima at ca 3400 cm-1 and 3240 cm-1 is detected indicating the presence of
hydrogen-bonded perturbed OH groups and water Two weak bands superimposed to this broad
absorption appear at 3066 and 3033 cm-1 which are ascribed to the C-H stretching vibrations of
the aromatic ring of the alcohol The bands at 1497 and 1455 cm-1 can be readily assigned to
skeletal vibrations of the aromatic ring and the band centred at 1208 cm-1 to the C-C stretching
vibration The band centred at 1369 cm-1 can be attributed to the O-H in-plane deformation mode
of the alcohol [7] The presence of this band is indicative of non-dissociative adsorption of BA on
the HP05 surface According to these FTIR spectra molecularly adsorbed BA appears to be the
predominant surface organic species formed
It is usually reported that adsorption of alcohols on metal oxide surfaces leads to the
formation of alcoholate species However in the present study the identification of adsorbed
benzolate on HP05 sample is not straightforward To the best of our knowledge infrared spectra
of benzolate species on hydroxylated titania have not been reported up-to-date Moreover the
close wavenumber values usually observed for the different vibration bands of alcohols and their
corresponding alcoholate species hinders an unequivocal assignment In the present case a clear
indication of benzolate formation could be obtained from the analysis of the evolution of the C-C
and C-O stretching modes region (bands at 1035 1018 and 1006 cm-1) as formation of
alcoholate species should be accompanied by a significant blue shift of the alcohol C-O
stretching band As adsorption of BA progresses a band centred at 1041 cm-1 grows
superimposed to the band located at 1035 cm-1 This shift does not seem to be large enough to
definitively justify the formation of benzyl alcoholate species but in any case it is indicative of
the existence of different adsorption sites on the HP05 surface or different ways of interaction
between BA and the sample surface
Figure 6 displays the time evolution of the amounts of water and BA adsorbed on HP05
those amounts are plotted as the integrated absorbance of selected IR bands It can be observed
that in the first 10 minutes the amounts of both adsorbed water and BA continuously increase
However the quantity of adsorbed alcohol reaches a maximum and then it monotonously
decreases with time while the amount of adsorbed water continuously increases thus indicating
9
that water favourably competes with BA for adsorption determining a partial displacement of BA
from the TiO2 surface
322 Adsorption of water and benzyl alcohol on commercial TiO2
The adsorption of BA and water on Degussa P25 following a similar experimental
procedure gives rise to spectra that show remarkable differences with respect to HP05 sample
(see Fig 7) It is worth to note that the intensity of the absorption band centred at 1645 cm-1 due
to the δ(HOH) vibration of molecularly adsorbed water appears for Degussa P25 with much
lesser intensity than for HP05 sample (note that the integrated absorbance scale for water in Fig
6 is 10 times larger for this sample) thus indicating the substantially lower hydrophilicity of the
Degussa P25 surface This finding is also in accord with TG measurements (see Fig 2)
Adsorption of BA molecules with scarce modifications is demonstrated by the presence of
absorption bands at 1498 1454 1372 1208 1078 and 1037 cm-1 The time evolution of the
integrated absorbance of IR bands at 1208 and 1640 cm-1 (see Fig 6) shows that the amounts of
BA adsorbed on HP05 and Degussa P25 are comparable however the BA amount per unit
surface area is ca 5 times higher in Degussa P25 than in HP05 Figure 6 also shows that water is
able to displace part of adsorbed BA but owing to the much lesser amount of water adsorbed on
Degussa P25 the displacement of the alcohol is slower than in HP05 sample
Besides the above mentioned bands ascribable to the adsorbed alcohol a group of
absorptions (not observed with HP05 sample) at 1413 1340 and 1156 cm-1 are also detected in
the spectra displayed in Fig 7 The band centred at 1156 cm-1 might be ascribed to a C-O
stretching vibration its blue shift with respect to the molecular alcohol is in contrast with that
previously discussed for HP05 large enough to indicate the formation of adsorbed benzolate
species On this basis it may be hypothesized the presence of two distinct adsorption sites for BA
on the Degussa P25 surface Additionally weak features are initially formed at 1705 1602 and
1584 cm-1 although as adsorption progresses they are obscured by the strong water absorption at
1645 cm-1 The frequency value of 1705 cm-1 points out to the presence of carbonyl group In the
high-frequency region besides the broad features centred at ca 3400 cm-1 and 3240 cm-1 due to
hydrogen-bonded hydroxyl groups bands at 3092 3069 3037 2963 2941 2885 and 2801 cm-1
appear upon contact of BA and water with the catalyst As shown in Fig 7 the bands in the
3100-2880 cm-1 range match the C-H stretching bands of BA However the band at 2801 cm-1
10
cannot be ascribed to this species A plausible assignment for this low frequency band would be
the C-H stretching mode of an aldehyde group what would be in agreement with an assignment
to the C=O stretching of an aldehyde group for the band centred at 1705 cm-1 Moreover the
bands at 1602 and 1584 cm-1 would agree with the presence of benzaldehyde [7] As
benzaldehyde is not expected to be formed upon adsorption at room temperature of BA on a
hydroxylated titania surface analysis of the benzyl alcohol purity was performed by HPLC It
was confirmed the presence of traces of benzaldehyde which explains the origin of the
corresponding signals in the infrared spectra It is worthy to note that even though the amount of
adsorbed BA is similar on both titania infrared bands due to adsorbed benzaldehyde are detected
only in Degussa P25 This reveals a quite dissimilar ability of both titania samples to adsorb
benzaldehyde which is strongly retained on the Degussa P25 surface but hardly hold by HP05
This feature should be taken into account to explain the higher selectivity to partial oxidation of
HP05 with respect to Degussa P25
323 Influence of irradiation on HP05
After exposure to the water and BA-saturated air atmosphere for around 1 h in the dark
HP05 sample was irradiated which led to the decrease in intensity of the bands derived from the
alcohol adsorption together with the further enhancement of the band at 1640 cm-1 and the
appearance of new overlapped bands in the 1500-1400 cm-1 range and at ca 1275 cm-1 (see Fig
8) It should be stressed that the intensity of the δ(HOH) vibration band of adsorbed water
continuously increased during irradiation but this growth stopped as soon as the lamp was
switched off This result indicates either that irradiation promotes an effective photoadsorption of
water on the HP05 surface or that water is formed as a product of the photocatalytic degradation
of the aromatic alcohol Nevertheless the steep increase of the band suggests that the
photoadsorption phenomenon is the predominant one as the increase of water vapour pressure
from the photoreaction cannot be so fast
The intensity and broadness of the band centred at 1640 cm-1 hinders the detection of
other oxidation products that might be formed during irradiation such as benzaldehyde or benzoic
acid as it overlaps the carbonyl stretching region On the other side bands in the 1400 to 1500
cm-1 range and the band at 1275 cm-1 cannot be unequivocally assigned to specific species but
according to their wavenumber values they might be indicative of the formation of dicarboxylic
11
acids following the breakage of the aromatic structure For instance values of 1271 1424 1686
and 1711 cm-1 have been previously reported for oxalate adsorbed on TiO2 [8] In the same study
absorption maxima centred at 1275 1352 1430 and 1597 cm-1 were found in the infrared spectra
of malonic acid adsorbed on TiO2
324 Influence of irradiation on commercial TiO2
In the case of Degussa P25 sample irradiation also produces a remarkable decrease in
intensity of the bands associated to adsorbed BA (see Fig 9) However in contrast with HP05
sample the resulting spectra show a complexity of features whose intensity increases with the
irradiation time Besides the water bending band at 1645 cm-1 the most prominent bands are
peaked at 1711 1686 1603 1530 1496 1451 1415 1403 (sh) 1274 and 1246 cm-1 The
assignment given to the bands in accordance to previous studies points out to the formation of
benzaldehyde and benzoic acid as main oxidation products adsorbed on the Degussa P25 surface
The band centred at 1711 cm-1 can be ascribed to the C=O stretching vibration of the carbonyl
group of benzaldehyde [9] whereas the bands at 1603 1530 1496 1451 1415 and 1403 cm-1
would be indicative of the adsorption of benzoic acid as benzoate [10 11] Johnson et al [10]
observed in the IR spectrum of a dried TiO2-benzoic acid aqueous dispersion features centred at
1602 and 1451 cm-1 assigned to the aromatic ring C=C vibrations a strong band at 1415 cm-1
assigned to the COOndash symmetric stretching vibration and a broad band centred at 1538 cm-1
attributed to the COOndash asymmetric vibration Upon adsorption of benzoic acid on TiO2 Finnie et
al [11] observed bands at 1535 and 1505 cm-1 that were assigned to the νas(COO) mode and
bands at 1418 and 1405 cm-1 ascribed to the νs(COO) vibration Splitting of the bands was
ascribed to the presence of two different coordination sites on the titania surface In both studies
the difference between the frequencies of asymmetric and symmetric COOndash group vibrations (Δν
= νas - νs) was observed to be higher than that of the benzoate anion which led to the conclusion
that benzoic acid was adsorbed on TiO2 as a bidentate complex either chelating or bridging On
this basis in the present study the bands centred at 1603 and 1451 cm-1 are assigned to skeletal
vibrations of the aromatic ring in adsorbed benzoic acid whereas bands centred at 1530 and 1496
cm-1 are ascribed to COO asymmetric stretching vibration and the bands at 1415 and 1403 cm-1 to
symmetric stretching Accordingly the largest value for the difference between the frequencies of
asymmetric and symmetric COOndash group stretching vibrations would be Δν = 1530-1415 = 127
12
cmndash1 value which is in agreement with a bidentate chelate or bridging coordination of benzoate
on the titania surface [10 12] As for the band centred at 1686 cm-1 it might be ascribed to the
C=O stretching vibration of undissociated benzoic acid [13] which could be attached to the TiO2
surface through either unidentate coordination or hydrogen bonding Finally the bands centred at
1274 and 1246 cm-1 must be indicative of further oxidized compounds most likely oxalate
according to the wavenumber values reported for these species [8] In fact it has been previously
shown that oxalate hardly desorbs from the Degussa P25 surface [14] so it might be expected on
the titania surface if formed during the mineralization of the aromatic alcohol
325 Influence of ethanol co-adsorption on concentration of adsorbed species
Aiming at giving likely explanations on the influence of aliphatic alcohols on selectivity
of BA oxidation [1] experiments were performed exposing samples to an atmosphere of
synthetic air saturated with BA ethanol and water to obtain further information on the effect of
ethanol co-adsorption on the interaction of BA with titania surfaces The experiments were
carried out by exposing the catalyst for 10 min to BA and water and then ethanol was introduced
in the cell Figure 10 shows ATR-FTIR spectra recorded during the adsorption experiment For
HP05 and Degussa P25 catalysts upon ethanol admission in the cell bands centred at 1480
1450 1380 1326 1275 1088 and 1046 cm-1 appear in the spectra These features are identical to
the absorptions observed in the spectrum of neat ethanol (spectra not shown) thus indicating that
ethanol is adsorbed on the catalyst surface mostly as molecular species It is worth to note that for
HP05 the adsorption of ethanol decreased the amount of adsorbed molecular water as indicated
by the much lower intensity of the δ(HOH) vibration band compared to the spectra shown in Fig
5 Moreover this band shifted toward higher wavenumber values (1654 cm-1) in both titania
surfaces thus indicating an interaction between adsorbed water and ethanol species most likely
through hydrogen bonding Similar effect was observed upon ethanol adsorption in the absence
of BA
From the concentration profiles reported in Fig 6 it may be noted that the presence of
ethanol has different effects on HP05 and Degussa P25 For both catalysts the amount of BA
adsorbed on titania surfaces diminishes to a great extent as ethanol is introduced in the cell
Nevertheless after 30 min of contact with ethanol vapour weak bands corresponding to adsorbed
benzyl alcohol at 1497 and 1208 cm-1 could still be clearly observed in the spectra of both
13
samples (see Fig 10) Exposure to ethanol vapour also produced a significant decrease of the
amount of adsorbed water in both samples However after the initial sharp decrease the amount
of water adsorbed on Degussa P25 slowly increased with time while on HP05 sample it reached
a nearly constant level which indicates that ethanol competes more strongly with water for
adsorption on HP05 sample than on the commercial titania
326 Influence of ethanol co-adsorption on photo-oxidation products
Subsequent irradiation of HP05 sample results in the appearance of broad overlapping
bands at ca 1565 and 1522 cm-1 that can be assigned to carboxylate species derived from ethanol
photo-oxidation [15] and the growing in of bands centred at 1407 and 1350 cm-1 (see Fig 11)
Note particularly that in contrast with results obtained in the absence of ethanol the carbonyl
stretching region is not hidden by the δ(HOH) band due to the lower adsorbed water content that
induces the co-adsorption of ethanol Therefore it can be now clearly observed that no
characteristic bands of benzaldehyde are formed
In the case of Degussa P25 UV irradiation gives rise to a large increase of the spectra
baseline at wavenumbers below 2000 cm-1 that peak at ca 900 cm-1 This phenomenon was
reproducible and was observed only when ethanol was adsorbed on Degussa P25 either in the
presence or absence of co-adsorbed BA This UV-induced infrared absorption has been already
reported for dry Degussa P25 and it has been attributed to excitation of shallow trap electrons to
the conduction band [16] UV light also produces the development of bands centred at 1710
1685 1650 1602 1540 1450 1414 and 1270 cm-1 indicative of the presence on the Degussa P25
surface of products derived from the oxidation of both alcohols The finding that the bands of BA
oxidation products appear also in the presence of ethanol seems to indicate that ethanol does not
affect the BA oxidation pathways but it only decreases BA concentration on catalyst surface
4 CONCLUSIONS
The photoelectrochemical characterization of HP catalysts clearly indicates that the
semiconducting properties of HP05 HP2 HP4 and HP6 did not appreciably vary with the
preparation procedure contrarily to sample HP8 The different photoactivities and selectivities
14
exhibited by the photocatalysts could arise hence more from different properties of their surfaces
rather than from semiconducting ones
From the ATR-FTIR analysis it can be concluded that two main differences between
HP05 and Degussa P25 surfaces exist On one hand their dissimilar hydrophilicity is relevant A
much higher amount of molecular water is indeed present on the former sample in comparison to
the latter On the other hand the ability in adsorbing the organic compounds deriving from BA
photocatalytic oxidation is quite lower for the home prepared catalyst as compared to the
commercial one
On this basis the highest selectivity of HP05 sample towards BA partial oxidation can be
ascribed to its low affinity for benzaldehyde adsorption on one hand and to the lowest
mineralization promoted on the other hand It can be postulated that the higher hydrophilicity of
HP05 sample compared to Degussa P25 plays an important role in connection with the latter
effect as the high coverage of the HP05 surface by water molecules might result in a
competition for adsorption sites
Bearing in mind the difficulty of stating clear correlations between photoreactivity and
catalysts features the following considerations may be drawn The photoactivity results [1]
obtained with HP05 catalyst show a low oxidation rate of benzyl alcohol but a high selectivity to
benzaldehyde The present study shows that the surface of HP05 catalyst is rich in molecularly
adsorbed water which is able to displace BA molecules in the dark Under irradiation water
displaces benzyl alcohol more effectively and determines a very low coverage of alcohol
molecules on HP surface It is likely that this low coverage is responsible for the low oxidation
rate of benzyl alcohol On the other hand the high water content might account for the high
selectivity to benzaldehyde assuming that water compete with BA molecules for the adsorption
on mineralization sites The presence of ethanol lowers the BA amount on HP surface thus
determining a strong decrease of the overall alcohol oxidation rate Molecularly adsorbed water is
also partly displaced by ethanol but the selectivity to benzaldehyde is increased One plausible
explanation is that ethanol is predominantly adsorbed on mineralization sites
For Degussa P25 the reactivity results indicate that the mineralization pathway
predominates over the partial oxidizing one As compared to HP05 this catalyst shows a higher
coverage of benzyl alcohol and smaller water content so that the ratio between water and benzyl
alcohol is low and therefore it is likely that mineralization sites are not preferentially occupied
15
by water molecules The addition of ethanol determines a strong decrease of benzyl alcohol
coverage while the water content is poorly modified For this catalyst neither the benzyl alcohol
oxidation rate nor the selectivity to benzaldehyde is affected by ethanol so that it may be
hypothesised that under irradiation the benzyl alcohol and water coverages on P25 surface remain
unaltered and therefore also the partial oxidation and mineralization pathways
ACKNOWLEDGEMENTS
Eng Dr Fabio DrsquoAgostino is gratefully acknowledged for the execution of TG measurements
16
REFERENCES 1 V Augugliaro H Kisch V Loddo M J Loacutepez-Muntildeoz C Maacuterquez-Aacutelvarez G
Palmisano L Palmisano F Parrino S Yurdakal Appl Catal A Gen (2008)
(submitted) 2 G Palmisano S Yurdakal V Augugliaro V Loddo L Palmisano Adv Synth Catal
349 (2007) 964
3 G Kortuumlm Reflectance Spectroscopy Principles Methods Applications Springer-
Verlag New York 1969
4 A M Roy G C De N Sasmal S S Bhattacharyya Int J Hydrogen Energy 20 (1995)
627
5 J Tauc R Grigorovici A Vanuc Phys Stat Sol 15 (1996) 627
6 G Redmond D Fitzmaurice J Phys Chem 97 (1993) 1426
7 C Keresszegi D Ferri T Mallat A J Baiker J Phys Chem B 109 (2005) 958
8 K D Dobson A J McQillan Spectrochim Acta Part A 55 (1999) 1395
9 H Lampert W Mikenda A Karpfen J Phys Chem A 101 (1997) 2254
10 A M Johnson S Trakhtenberg A S Cannon J C Warner J Phys Chem A 111
(2007) 8139
11 K S Finnie J R Bartlett J L Woolfrey Langmuir 14 (1998) 2744
12 S Tunesi M Anderson Langmuir 8 (1992) 487
13 M Boczar K Szczeponek M J Woacutejcik C Paluszkiewicz J Mol Structure 700 (2004)
39
14 I Dolamic T Buumlrgi J Phys Chem B 110 (2006) 14898
15 D V Kozlov E A Paukshtis E N Savinov Appl Catal B Environ 24 (2000) L7
16 D S Warren A J McQuillan J Phys Chem B 108 (2004) 19373
17
CAPTIONS
Figure 1 Transformed diffuse reflectance spectra of (a) HP05 and (b) HP8
Figure 2 Thermogravimetric (dotted lines) and time derivative (continuous lines) curves in air of
HP05 ( ) and Degussa P25 ( )
Figure 3 Variation of photovoltage with pH value 50 mg of catalyst with 10 mg of methyl
viologen dichloride are suspended in 50 mL of 01 M KNO3 aqueous solution at room
temperature Pt working electrode and AgAgCl reference electrodes
Figure 4 Variation of photovoltage with pH value for HP05 catalyst in the presence (a) and in
the absence (b) of ethanol 50 mg of catalyst with 10 mg of methyl viologen dichloride are
suspended in 50 mL of 01 M KNO3 aqueous solution at room temperature Pt working electrode
and AgAgCl reference electrodes For (b) case 5 ml of ethanol have been added to suspension
Figure 5 Time-resolved ATR-FTIR spectra of HP05 thin film recorded during adsorption of
water and benzyl alcohol (BA) vapours at room temperature The arrows indicate the time when
each adsorbate was introduced in the cell The spectrum of neat benzyl alcohol () multiplied by
a factor 001 has been included for comparison
Figure 6 Time evolution of the integrated absorbance of IR bands at 1640 cm-1 (water) 1208
cm-1 (benzyl alcohol BA) and 2975 cm-1 (ethanol EA) determined from ATR-FTIR spectra
recorded during adsorption of water and benzyl alcohol (top) and water benzyl alcohol and
ethanol (bottom) on HP05 (left) and Degussa P25 (right) samples Zero time corresponds to
introduction of BA into the cell EA was introduced in the cell 10 min after BA
Figure 7 Time-resolved ATR-FTIR spectra of Degussa P25 thin film recorded during adsorption
of water and benzyl alcohol (BA) vapours at room temperature The arrows indicate the time
18
when each adsorbate was introduced in the cell The spectrum of neat benzyl alcohol ()
multiplied by a factor 001 has been included for comparison
Figure 8 Time-resolved ATR-FTIR spectra recorded during irradiation of HP05 thin film in an
atmosphere of synthetic air saturated with water and benzyl alcohol The arrows indicate the time
when UV lamp was switched on (it took around 2 min to reach full power) and off
Figure 9 Time-resolved ATR-FTIR spectra recorded during irradiation of Degussa P25 thin film
in an atmosphere of synthetic air saturated with water and benzyl alcohol The arrows indicate the
time when UV lamp was switched on (it took around 2 min to reach full power)
Figure 10 Time-resolved ATR-FTIR spectra of Degussa P25 (left) and HP05 (right) thin films
recorded during adsorption of water benzyl alcohol (BA) and ethanol (EA) vapours at room
temperature The arrows indicate the time when each adsorbate was introduced in the cell
Figure 11 Time-resolved ATR-FTIR spectra recorded during irradiation of Degussa P25 (left)
and HP05 (right) thin film in an atmosphere of synthetic air saturated with water benzyl alcohol
and ethanol The arrows indicate the time when UV lamp was switched on (it took around 2 min
to reach full power) and off Spectra of Degussa P25 sample recorded after switching off the
lamp have been shifted upwards by 012 absorbance units for clarity
Table 1 Photoelectrochemical properties of catalysts
19
1 2 3 4 5 6 700
02
04
06
08
10
12
14
16
(F(R
infin )
E)1
2
E eV
b)
Figure 1
1 2 3 4 5 6 700
02
04
06
08
10
12
14
16
(F(R
infin )
E)1
2
E eV
a)
20
0
5
10
15
20
25
0
002
004
006
008
01
012
014
0 200 400 600 800
Temperature [degC]
Wei
ght d
eriv
ativ
e [m
gdegC
]
Mas
s lo
ss [m
g]
0
5
10
15
20
25
0
002
004
006
008
01
012
014
0 200 400 600 800
Temperature [degC]
Wei
ght d
eriv
ativ
e [m
gdegC
]
0
5
10
15
20
25
0
002
004
006
008
01
012
014
0 200 400 600 800
Temperature [degC]
Wei
ght d
eriv
ativ
e [m
gdegC
]
Mas
s lo
ss [m
g]
Figure 2
21
1 2 3 4 5 6 7 8 9 10
-04
-02
00
02
04
06 HP05 HP2 HP4 HP6 HP8
E V
pH
pH0=58 pH0=82
Figure 3
22
1 2 3 4 5 6 7 8 9
-02
00
02
04
06 a) b)
E V
pH
pH0=47 pH0=59
Figure 4
23
1600 1400 1200 10003600 3400 3200 3000 2800
10411455
1006
1018
1035
1079
1208
40
20 tim
e (m
in)
Wavenumber (cm-1)
Abs
orba
nce
0
60
005 au
1497
H2OBA
1369
01 au
Figure 5
24
000
005
010
015
H2O (x001)
BABA
H2O (x01)
0 10 20 30 40000
005
010
015
EA (x01)
H2O (x001)Inte
grat
ed a
bsor
banc
e (c
m-1)
Time (min)
BA
0 10 20 30 40
EA (x01)
BA
H2O (x01)
Figure 6
25
1600 1400 1200 10003600 3400 3200 3000 2800
1037
1454
1208
40
20 tim
e (m
in)
Wavenumber (cm-1)
Abs
orba
nce
0
60
0005 au
1498
H2OBA
1372
1602
1584 14
13
1340
1156
3092
001 au
3069
3037
2963
2941
2885
2801
Figure 7
26
1800 1600 1400 1200 1000
1412
1450
1275
20
10
tim
e (m
in)
Wavenumber (cm-1)Ab
sorb
ance
0
30
01 au
UV lamp ON
UV lamp OFF
Figure 8
27
1600 1400 1200 1000
1496
1530
1451
20
10
tim
e (m
in)
Wavenumber (cm-1)Ab
sorb
ance
0
001 au
UV lamp ON
1711 16
86
1603
1415
1403
1274
1246
1645
Figure 9
28
1600 1400 1200 10001600 1400 1200 1000
40
20 tim
e (m
in)
Wavenumber (cm-1)
Abso
rban
ce
0
005 au
H2O
BA
EA
002 au
Figure 10
29
1600 1400 1200 10001600 1400 1200 1000
20
30
10 tim
e (m
in)
Wavenumber (cm-1)
Abso
rban
ce
0
005 au
UV lamp ON
UV lamp OFF
1565
1522 14
0713
50
1540 14
5014
14
1685 1602
1650
1710
1270
005 au
Figure 11
30
Table 1
Catalyst Band gap
[eV]
Efb (pH=7)
[V]
VB edge[V]
Degussa P25
326 ndash 055 ndash 064a
271
Merck 322 ndash 043 279 HP05
336 ndash 052
ndash 058a 284
HP2 336 ndash 052 284 HP4 336 ndash 052 284 HP6 326 ndash 052 274 HP8 311 ndash 037 274
a values obtained in the presence of ethanol

5
suspension was magnetically stirred and flushed with dinitrogen throughout the experiment
carried out at room temperature In general the starting suspension had pH 25 In order to check
the influence of ethanol on the flat band potential 5 ml of ethanol (Merck 999) were added
into the suspension and the same procedure was carried out Irradiation was performed with a 150
W xenon arc lamp (OSRAM XBO I0 (300-400 nm) = 1410ndash6 Einsteinsndash1cmndash2) installed in a
light-condensing lamp housing (PTI A1010S) on an optical train The flask was mounted at a
distance of 30 cm from the lamp
23 In situ ATR-FTIR measurements
Infrared spectra of thin films of the photocatalysts were recorded using a Thermo Nicolet
Nexus FTIR spectrometer equipped with a liquid nitrogen-cooled MCT detector and a SensIR
Technologies DurasamplIR 9-reflection horizontal ATR accessory (4 mm diameter diamond-
faced ZnSe prism) Titania samples grounded in an agate mortar were suspended in Milli-Q
deionized water (25 mg solid in 25 mL water) and sonicated for 20 min (Elma Transsonic
T470H ultrasonic cleaning unit) Thin films were prepared by dropping 50 μL of the suspension
onto the ATR crystal and then allowing the solvent to evaporate The procedure was repeated
twice to obtain thin films containing ca 100 μg TiO2 A 100 mL volume glass flow cell was
attached to the ATR plate through an o-ring sealed connection and the thin film was dried at
room temperature for several minutes in a stream of synthetic air (Air Liquide Alphagaz Air 1)
Adsorption of water ethanol (Panreac 995) and benzyl alcohol (Sigma-Aldrich purity gt 99)
vapours on the dried TiO2 thin films was carried out at room temperature under static conditions
by introducing 02 mL of each liquid adsorbate inside the closed glass cell previously purged
with synthetic air After adsorption in the dark for around 1 h UV irradiation of the photocatalyst
films in contact with the wateralcohol-saturated air atmosphere was performed using an 80 W
mercury vapour lamp (OSRAM HQL de luxe MBF-U) The light was filtered by passing through
a Pyrex vessel containing a 01 M CuSO4 aqueous solution Time-resolved FTIR spectra in the
4000-900 cm-1 wavenumber range with a resolution of 4 cm-1 were recorded along with the
adsorption and irradiation steps at room temperature Each spectrum was obtained by averaging
10 scans accumulated in 4 seconds Happ-Genzel apodization function was applied The spectra
were referenced against the spectrum of the dried TiO2 thin film
6
3 RESULTS AND DISCUSSION
31 Catalysts characterization
Figure 1 exhibits the transformed diffuse reflectance spectra of two HP catalysts ie
HP05 and HP8 the plots report the values of [F(Rinfin)E]05 the modified Kubelka-Munk function
versus E the energy of exciting light The weak low-energy shoulder may correspond to the
presence of rutile phase its intensity proportional to the rutile amount increases by increasing
the boiling time The corresponding band gap energies of all the used HP and commercial
catalysts were obtained from plots like those reported in Fig 1 assuming that the solids are
indirect crystalline semiconductors [5] The band gap values are reported in Table 1 these values
are quite similar for predominantly anatase phase catalysts
Thermogravimetric and time derivative curves of Degussa P25 and HP05 samples are
shown and compared in Fig 2 Degussa P25 is stable up to 800 ordmC and it shows only 1 weight
change due to the occurrence of a release of adsorbed moisture below 100 ordmC For HP05 sample
the TG curve shows that it contains a significant amount of physically adsorbed water about 10
weight in fact the evaporation of bound water becomes significant at about 80 ordmC and the
highest rate of mass losses is reached at around 140 ordmC It is remarkable that the loss of water
continues up to 350 ordmC thus indicating that the energy of interaction between water molecules and
HP05 surface covers a wide range
The quasi-Fermi level of electrons Efb was determined according to literature [4] by
measuring the photovoltage in the presence of methylviologen MV as a function of pH value
Figure 3 reports the measurements obtained with all HP catalysts Upon increasing the pH value
a blue color is developed when approaching the inflection point pH0 due to formation of the
methylviologen radical cation A lower pH0 value corresponds to a more negative quasi-Fermi
level From pH0 value of the corresponding titration curve (see Fig 3) the quasi-Fermi level at
pH 7 can be calculated via eqn 1
Efb = E0MV
2+MV
+ + k (pH0 ndash pH) (1)
7
where E0MV
2+MV
+ is the redox potential of the MV2+MV+ couple and k is assumed equal to
0059 V The Efb values of all catalysts are reported in Table 1 it may be noted that the position
of the quasi Fermi level for Degussa P25 and HP05 to HP6 samples is about the same (-055 and
-052 V respectively) indicating that interfacial electron transfer to methylviologen proceeds
from the anatase conduction band However in the case of HP8 this value is ndash037 V which is
characteristic for rutile type TiO2 and indicates that reduction of methylviologen occurs via
electrons trapped at the rutile conduction band By assuming that the difference between the
quasi-Fermi level potential and conduction band edge is negligible the valence band edge values
can be obtained by addition of the band gap energy HP05 HP2 and HP4 band edge is located at
284 V whereas it is shifted to 274 V for HP6 which contains a significant amount of rutile and
for HP8 nearly pure rutile
These results indicate that the photoelectrochemical features of anatase and anatase-rutile
catalysts are very similar On this basis it is likely that these properties play a minor role in
determining the differences of reactivity and selectivity shown by these samples [1]
In the presence of 10 vol of ethanol the flatband potential of HP05 was shifted
cathodically by about 006 V (see Fig 4) while the shift was about 009 V in the case of P25
Similar shifts had been reported in the literature [6] when the flatband potential of titania was
measured in non-diluted methanol From these results one can conclude that in aqueous ethanol
solution the reductive power of the reactive electron in anatase powders is much higher than in
pure water
32 ATR-FTIR analysis
321 Adsorption of water and benzyl alcohol on HP05
Figure 5 displays the in situ ATR-FTIR spectra acquired when exposing HP05 in an
atmosphere of synthetic air saturated with BA and water The great enhancement over time in the
intensity of the absorption band centred at 1640 cm-1 due to the bending vibration mode of
adsorbed molecular water indicates a remarkable hydrophilicity of the HP05 surface The clear
tailing of the δ(HOH) vibration band towards low frequencies may be indicative of different
adsorption sites for molecular water
8
Bands growing in at 1497 1455 1369 1208 1079 1035 1018 and 1006 cm-1 are mainly
the same as those in pure BA (see Fig 5) At high frequencies a broad and strong absorption
showing two maxima at ca 3400 cm-1 and 3240 cm-1 is detected indicating the presence of
hydrogen-bonded perturbed OH groups and water Two weak bands superimposed to this broad
absorption appear at 3066 and 3033 cm-1 which are ascribed to the C-H stretching vibrations of
the aromatic ring of the alcohol The bands at 1497 and 1455 cm-1 can be readily assigned to
skeletal vibrations of the aromatic ring and the band centred at 1208 cm-1 to the C-C stretching
vibration The band centred at 1369 cm-1 can be attributed to the O-H in-plane deformation mode
of the alcohol [7] The presence of this band is indicative of non-dissociative adsorption of BA on
the HP05 surface According to these FTIR spectra molecularly adsorbed BA appears to be the
predominant surface organic species formed
It is usually reported that adsorption of alcohols on metal oxide surfaces leads to the
formation of alcoholate species However in the present study the identification of adsorbed
benzolate on HP05 sample is not straightforward To the best of our knowledge infrared spectra
of benzolate species on hydroxylated titania have not been reported up-to-date Moreover the
close wavenumber values usually observed for the different vibration bands of alcohols and their
corresponding alcoholate species hinders an unequivocal assignment In the present case a clear
indication of benzolate formation could be obtained from the analysis of the evolution of the C-C
and C-O stretching modes region (bands at 1035 1018 and 1006 cm-1) as formation of
alcoholate species should be accompanied by a significant blue shift of the alcohol C-O
stretching band As adsorption of BA progresses a band centred at 1041 cm-1 grows
superimposed to the band located at 1035 cm-1 This shift does not seem to be large enough to
definitively justify the formation of benzyl alcoholate species but in any case it is indicative of
the existence of different adsorption sites on the HP05 surface or different ways of interaction
between BA and the sample surface
Figure 6 displays the time evolution of the amounts of water and BA adsorbed on HP05
those amounts are plotted as the integrated absorbance of selected IR bands It can be observed
that in the first 10 minutes the amounts of both adsorbed water and BA continuously increase
However the quantity of adsorbed alcohol reaches a maximum and then it monotonously
decreases with time while the amount of adsorbed water continuously increases thus indicating
9
that water favourably competes with BA for adsorption determining a partial displacement of BA
from the TiO2 surface
322 Adsorption of water and benzyl alcohol on commercial TiO2
The adsorption of BA and water on Degussa P25 following a similar experimental
procedure gives rise to spectra that show remarkable differences with respect to HP05 sample
(see Fig 7) It is worth to note that the intensity of the absorption band centred at 1645 cm-1 due
to the δ(HOH) vibration of molecularly adsorbed water appears for Degussa P25 with much
lesser intensity than for HP05 sample (note that the integrated absorbance scale for water in Fig
6 is 10 times larger for this sample) thus indicating the substantially lower hydrophilicity of the
Degussa P25 surface This finding is also in accord with TG measurements (see Fig 2)
Adsorption of BA molecules with scarce modifications is demonstrated by the presence of
absorption bands at 1498 1454 1372 1208 1078 and 1037 cm-1 The time evolution of the
integrated absorbance of IR bands at 1208 and 1640 cm-1 (see Fig 6) shows that the amounts of
BA adsorbed on HP05 and Degussa P25 are comparable however the BA amount per unit
surface area is ca 5 times higher in Degussa P25 than in HP05 Figure 6 also shows that water is
able to displace part of adsorbed BA but owing to the much lesser amount of water adsorbed on
Degussa P25 the displacement of the alcohol is slower than in HP05 sample
Besides the above mentioned bands ascribable to the adsorbed alcohol a group of
absorptions (not observed with HP05 sample) at 1413 1340 and 1156 cm-1 are also detected in
the spectra displayed in Fig 7 The band centred at 1156 cm-1 might be ascribed to a C-O
stretching vibration its blue shift with respect to the molecular alcohol is in contrast with that
previously discussed for HP05 large enough to indicate the formation of adsorbed benzolate
species On this basis it may be hypothesized the presence of two distinct adsorption sites for BA
on the Degussa P25 surface Additionally weak features are initially formed at 1705 1602 and
1584 cm-1 although as adsorption progresses they are obscured by the strong water absorption at
1645 cm-1 The frequency value of 1705 cm-1 points out to the presence of carbonyl group In the
high-frequency region besides the broad features centred at ca 3400 cm-1 and 3240 cm-1 due to
hydrogen-bonded hydroxyl groups bands at 3092 3069 3037 2963 2941 2885 and 2801 cm-1
appear upon contact of BA and water with the catalyst As shown in Fig 7 the bands in the
3100-2880 cm-1 range match the C-H stretching bands of BA However the band at 2801 cm-1
10
cannot be ascribed to this species A plausible assignment for this low frequency band would be
the C-H stretching mode of an aldehyde group what would be in agreement with an assignment
to the C=O stretching of an aldehyde group for the band centred at 1705 cm-1 Moreover the
bands at 1602 and 1584 cm-1 would agree with the presence of benzaldehyde [7] As
benzaldehyde is not expected to be formed upon adsorption at room temperature of BA on a
hydroxylated titania surface analysis of the benzyl alcohol purity was performed by HPLC It
was confirmed the presence of traces of benzaldehyde which explains the origin of the
corresponding signals in the infrared spectra It is worthy to note that even though the amount of
adsorbed BA is similar on both titania infrared bands due to adsorbed benzaldehyde are detected
only in Degussa P25 This reveals a quite dissimilar ability of both titania samples to adsorb
benzaldehyde which is strongly retained on the Degussa P25 surface but hardly hold by HP05
This feature should be taken into account to explain the higher selectivity to partial oxidation of
HP05 with respect to Degussa P25
323 Influence of irradiation on HP05
After exposure to the water and BA-saturated air atmosphere for around 1 h in the dark
HP05 sample was irradiated which led to the decrease in intensity of the bands derived from the
alcohol adsorption together with the further enhancement of the band at 1640 cm-1 and the
appearance of new overlapped bands in the 1500-1400 cm-1 range and at ca 1275 cm-1 (see Fig
8) It should be stressed that the intensity of the δ(HOH) vibration band of adsorbed water
continuously increased during irradiation but this growth stopped as soon as the lamp was
switched off This result indicates either that irradiation promotes an effective photoadsorption of
water on the HP05 surface or that water is formed as a product of the photocatalytic degradation
of the aromatic alcohol Nevertheless the steep increase of the band suggests that the
photoadsorption phenomenon is the predominant one as the increase of water vapour pressure
from the photoreaction cannot be so fast
The intensity and broadness of the band centred at 1640 cm-1 hinders the detection of
other oxidation products that might be formed during irradiation such as benzaldehyde or benzoic
acid as it overlaps the carbonyl stretching region On the other side bands in the 1400 to 1500
cm-1 range and the band at 1275 cm-1 cannot be unequivocally assigned to specific species but
according to their wavenumber values they might be indicative of the formation of dicarboxylic
11
acids following the breakage of the aromatic structure For instance values of 1271 1424 1686
and 1711 cm-1 have been previously reported for oxalate adsorbed on TiO2 [8] In the same study
absorption maxima centred at 1275 1352 1430 and 1597 cm-1 were found in the infrared spectra
of malonic acid adsorbed on TiO2
324 Influence of irradiation on commercial TiO2
In the case of Degussa P25 sample irradiation also produces a remarkable decrease in
intensity of the bands associated to adsorbed BA (see Fig 9) However in contrast with HP05
sample the resulting spectra show a complexity of features whose intensity increases with the
irradiation time Besides the water bending band at 1645 cm-1 the most prominent bands are
peaked at 1711 1686 1603 1530 1496 1451 1415 1403 (sh) 1274 and 1246 cm-1 The
assignment given to the bands in accordance to previous studies points out to the formation of
benzaldehyde and benzoic acid as main oxidation products adsorbed on the Degussa P25 surface
The band centred at 1711 cm-1 can be ascribed to the C=O stretching vibration of the carbonyl
group of benzaldehyde [9] whereas the bands at 1603 1530 1496 1451 1415 and 1403 cm-1
would be indicative of the adsorption of benzoic acid as benzoate [10 11] Johnson et al [10]
observed in the IR spectrum of a dried TiO2-benzoic acid aqueous dispersion features centred at
1602 and 1451 cm-1 assigned to the aromatic ring C=C vibrations a strong band at 1415 cm-1
assigned to the COOndash symmetric stretching vibration and a broad band centred at 1538 cm-1
attributed to the COOndash asymmetric vibration Upon adsorption of benzoic acid on TiO2 Finnie et
al [11] observed bands at 1535 and 1505 cm-1 that were assigned to the νas(COO) mode and
bands at 1418 and 1405 cm-1 ascribed to the νs(COO) vibration Splitting of the bands was
ascribed to the presence of two different coordination sites on the titania surface In both studies
the difference between the frequencies of asymmetric and symmetric COOndash group vibrations (Δν
= νas - νs) was observed to be higher than that of the benzoate anion which led to the conclusion
that benzoic acid was adsorbed on TiO2 as a bidentate complex either chelating or bridging On
this basis in the present study the bands centred at 1603 and 1451 cm-1 are assigned to skeletal
vibrations of the aromatic ring in adsorbed benzoic acid whereas bands centred at 1530 and 1496
cm-1 are ascribed to COO asymmetric stretching vibration and the bands at 1415 and 1403 cm-1 to
symmetric stretching Accordingly the largest value for the difference between the frequencies of
asymmetric and symmetric COOndash group stretching vibrations would be Δν = 1530-1415 = 127
12
cmndash1 value which is in agreement with a bidentate chelate or bridging coordination of benzoate
on the titania surface [10 12] As for the band centred at 1686 cm-1 it might be ascribed to the
C=O stretching vibration of undissociated benzoic acid [13] which could be attached to the TiO2
surface through either unidentate coordination or hydrogen bonding Finally the bands centred at
1274 and 1246 cm-1 must be indicative of further oxidized compounds most likely oxalate
according to the wavenumber values reported for these species [8] In fact it has been previously
shown that oxalate hardly desorbs from the Degussa P25 surface [14] so it might be expected on
the titania surface if formed during the mineralization of the aromatic alcohol
325 Influence of ethanol co-adsorption on concentration of adsorbed species
Aiming at giving likely explanations on the influence of aliphatic alcohols on selectivity
of BA oxidation [1] experiments were performed exposing samples to an atmosphere of
synthetic air saturated with BA ethanol and water to obtain further information on the effect of
ethanol co-adsorption on the interaction of BA with titania surfaces The experiments were
carried out by exposing the catalyst for 10 min to BA and water and then ethanol was introduced
in the cell Figure 10 shows ATR-FTIR spectra recorded during the adsorption experiment For
HP05 and Degussa P25 catalysts upon ethanol admission in the cell bands centred at 1480
1450 1380 1326 1275 1088 and 1046 cm-1 appear in the spectra These features are identical to
the absorptions observed in the spectrum of neat ethanol (spectra not shown) thus indicating that
ethanol is adsorbed on the catalyst surface mostly as molecular species It is worth to note that for
HP05 the adsorption of ethanol decreased the amount of adsorbed molecular water as indicated
by the much lower intensity of the δ(HOH) vibration band compared to the spectra shown in Fig
5 Moreover this band shifted toward higher wavenumber values (1654 cm-1) in both titania
surfaces thus indicating an interaction between adsorbed water and ethanol species most likely
through hydrogen bonding Similar effect was observed upon ethanol adsorption in the absence
of BA
From the concentration profiles reported in Fig 6 it may be noted that the presence of
ethanol has different effects on HP05 and Degussa P25 For both catalysts the amount of BA
adsorbed on titania surfaces diminishes to a great extent as ethanol is introduced in the cell
Nevertheless after 30 min of contact with ethanol vapour weak bands corresponding to adsorbed
benzyl alcohol at 1497 and 1208 cm-1 could still be clearly observed in the spectra of both
13
samples (see Fig 10) Exposure to ethanol vapour also produced a significant decrease of the
amount of adsorbed water in both samples However after the initial sharp decrease the amount
of water adsorbed on Degussa P25 slowly increased with time while on HP05 sample it reached
a nearly constant level which indicates that ethanol competes more strongly with water for
adsorption on HP05 sample than on the commercial titania
326 Influence of ethanol co-adsorption on photo-oxidation products
Subsequent irradiation of HP05 sample results in the appearance of broad overlapping
bands at ca 1565 and 1522 cm-1 that can be assigned to carboxylate species derived from ethanol
photo-oxidation [15] and the growing in of bands centred at 1407 and 1350 cm-1 (see Fig 11)
Note particularly that in contrast with results obtained in the absence of ethanol the carbonyl
stretching region is not hidden by the δ(HOH) band due to the lower adsorbed water content that
induces the co-adsorption of ethanol Therefore it can be now clearly observed that no
characteristic bands of benzaldehyde are formed
In the case of Degussa P25 UV irradiation gives rise to a large increase of the spectra
baseline at wavenumbers below 2000 cm-1 that peak at ca 900 cm-1 This phenomenon was
reproducible and was observed only when ethanol was adsorbed on Degussa P25 either in the
presence or absence of co-adsorbed BA This UV-induced infrared absorption has been already
reported for dry Degussa P25 and it has been attributed to excitation of shallow trap electrons to
the conduction band [16] UV light also produces the development of bands centred at 1710
1685 1650 1602 1540 1450 1414 and 1270 cm-1 indicative of the presence on the Degussa P25
surface of products derived from the oxidation of both alcohols The finding that the bands of BA
oxidation products appear also in the presence of ethanol seems to indicate that ethanol does not
affect the BA oxidation pathways but it only decreases BA concentration on catalyst surface
4 CONCLUSIONS
The photoelectrochemical characterization of HP catalysts clearly indicates that the
semiconducting properties of HP05 HP2 HP4 and HP6 did not appreciably vary with the
preparation procedure contrarily to sample HP8 The different photoactivities and selectivities
14
exhibited by the photocatalysts could arise hence more from different properties of their surfaces
rather than from semiconducting ones
From the ATR-FTIR analysis it can be concluded that two main differences between
HP05 and Degussa P25 surfaces exist On one hand their dissimilar hydrophilicity is relevant A
much higher amount of molecular water is indeed present on the former sample in comparison to
the latter On the other hand the ability in adsorbing the organic compounds deriving from BA
photocatalytic oxidation is quite lower for the home prepared catalyst as compared to the
commercial one
On this basis the highest selectivity of HP05 sample towards BA partial oxidation can be
ascribed to its low affinity for benzaldehyde adsorption on one hand and to the lowest
mineralization promoted on the other hand It can be postulated that the higher hydrophilicity of
HP05 sample compared to Degussa P25 plays an important role in connection with the latter
effect as the high coverage of the HP05 surface by water molecules might result in a
competition for adsorption sites
Bearing in mind the difficulty of stating clear correlations between photoreactivity and
catalysts features the following considerations may be drawn The photoactivity results [1]
obtained with HP05 catalyst show a low oxidation rate of benzyl alcohol but a high selectivity to
benzaldehyde The present study shows that the surface of HP05 catalyst is rich in molecularly
adsorbed water which is able to displace BA molecules in the dark Under irradiation water
displaces benzyl alcohol more effectively and determines a very low coverage of alcohol
molecules on HP surface It is likely that this low coverage is responsible for the low oxidation
rate of benzyl alcohol On the other hand the high water content might account for the high
selectivity to benzaldehyde assuming that water compete with BA molecules for the adsorption
on mineralization sites The presence of ethanol lowers the BA amount on HP surface thus
determining a strong decrease of the overall alcohol oxidation rate Molecularly adsorbed water is
also partly displaced by ethanol but the selectivity to benzaldehyde is increased One plausible
explanation is that ethanol is predominantly adsorbed on mineralization sites
For Degussa P25 the reactivity results indicate that the mineralization pathway
predominates over the partial oxidizing one As compared to HP05 this catalyst shows a higher
coverage of benzyl alcohol and smaller water content so that the ratio between water and benzyl
alcohol is low and therefore it is likely that mineralization sites are not preferentially occupied
15
by water molecules The addition of ethanol determines a strong decrease of benzyl alcohol
coverage while the water content is poorly modified For this catalyst neither the benzyl alcohol
oxidation rate nor the selectivity to benzaldehyde is affected by ethanol so that it may be
hypothesised that under irradiation the benzyl alcohol and water coverages on P25 surface remain
unaltered and therefore also the partial oxidation and mineralization pathways
ACKNOWLEDGEMENTS
Eng Dr Fabio DrsquoAgostino is gratefully acknowledged for the execution of TG measurements
16
REFERENCES 1 V Augugliaro H Kisch V Loddo M J Loacutepez-Muntildeoz C Maacuterquez-Aacutelvarez G
Palmisano L Palmisano F Parrino S Yurdakal Appl Catal A Gen (2008)
(submitted) 2 G Palmisano S Yurdakal V Augugliaro V Loddo L Palmisano Adv Synth Catal
349 (2007) 964
3 G Kortuumlm Reflectance Spectroscopy Principles Methods Applications Springer-
Verlag New York 1969
4 A M Roy G C De N Sasmal S S Bhattacharyya Int J Hydrogen Energy 20 (1995)
627
5 J Tauc R Grigorovici A Vanuc Phys Stat Sol 15 (1996) 627
6 G Redmond D Fitzmaurice J Phys Chem 97 (1993) 1426
7 C Keresszegi D Ferri T Mallat A J Baiker J Phys Chem B 109 (2005) 958
8 K D Dobson A J McQillan Spectrochim Acta Part A 55 (1999) 1395
9 H Lampert W Mikenda A Karpfen J Phys Chem A 101 (1997) 2254
10 A M Johnson S Trakhtenberg A S Cannon J C Warner J Phys Chem A 111
(2007) 8139
11 K S Finnie J R Bartlett J L Woolfrey Langmuir 14 (1998) 2744
12 S Tunesi M Anderson Langmuir 8 (1992) 487
13 M Boczar K Szczeponek M J Woacutejcik C Paluszkiewicz J Mol Structure 700 (2004)
39
14 I Dolamic T Buumlrgi J Phys Chem B 110 (2006) 14898
15 D V Kozlov E A Paukshtis E N Savinov Appl Catal B Environ 24 (2000) L7
16 D S Warren A J McQuillan J Phys Chem B 108 (2004) 19373
17
CAPTIONS
Figure 1 Transformed diffuse reflectance spectra of (a) HP05 and (b) HP8
Figure 2 Thermogravimetric (dotted lines) and time derivative (continuous lines) curves in air of
HP05 ( ) and Degussa P25 ( )
Figure 3 Variation of photovoltage with pH value 50 mg of catalyst with 10 mg of methyl
viologen dichloride are suspended in 50 mL of 01 M KNO3 aqueous solution at room
temperature Pt working electrode and AgAgCl reference electrodes
Figure 4 Variation of photovoltage with pH value for HP05 catalyst in the presence (a) and in
the absence (b) of ethanol 50 mg of catalyst with 10 mg of methyl viologen dichloride are
suspended in 50 mL of 01 M KNO3 aqueous solution at room temperature Pt working electrode
and AgAgCl reference electrodes For (b) case 5 ml of ethanol have been added to suspension
Figure 5 Time-resolved ATR-FTIR spectra of HP05 thin film recorded during adsorption of
water and benzyl alcohol (BA) vapours at room temperature The arrows indicate the time when
each adsorbate was introduced in the cell The spectrum of neat benzyl alcohol () multiplied by
a factor 001 has been included for comparison
Figure 6 Time evolution of the integrated absorbance of IR bands at 1640 cm-1 (water) 1208
cm-1 (benzyl alcohol BA) and 2975 cm-1 (ethanol EA) determined from ATR-FTIR spectra
recorded during adsorption of water and benzyl alcohol (top) and water benzyl alcohol and
ethanol (bottom) on HP05 (left) and Degussa P25 (right) samples Zero time corresponds to
introduction of BA into the cell EA was introduced in the cell 10 min after BA
Figure 7 Time-resolved ATR-FTIR spectra of Degussa P25 thin film recorded during adsorption
of water and benzyl alcohol (BA) vapours at room temperature The arrows indicate the time
18
when each adsorbate was introduced in the cell The spectrum of neat benzyl alcohol ()
multiplied by a factor 001 has been included for comparison
Figure 8 Time-resolved ATR-FTIR spectra recorded during irradiation of HP05 thin film in an
atmosphere of synthetic air saturated with water and benzyl alcohol The arrows indicate the time
when UV lamp was switched on (it took around 2 min to reach full power) and off
Figure 9 Time-resolved ATR-FTIR spectra recorded during irradiation of Degussa P25 thin film
in an atmosphere of synthetic air saturated with water and benzyl alcohol The arrows indicate the
time when UV lamp was switched on (it took around 2 min to reach full power)
Figure 10 Time-resolved ATR-FTIR spectra of Degussa P25 (left) and HP05 (right) thin films
recorded during adsorption of water benzyl alcohol (BA) and ethanol (EA) vapours at room
temperature The arrows indicate the time when each adsorbate was introduced in the cell
Figure 11 Time-resolved ATR-FTIR spectra recorded during irradiation of Degussa P25 (left)
and HP05 (right) thin film in an atmosphere of synthetic air saturated with water benzyl alcohol
and ethanol The arrows indicate the time when UV lamp was switched on (it took around 2 min
to reach full power) and off Spectra of Degussa P25 sample recorded after switching off the
lamp have been shifted upwards by 012 absorbance units for clarity
Table 1 Photoelectrochemical properties of catalysts
19
1 2 3 4 5 6 700
02
04
06
08
10
12
14
16
(F(R
infin )
E)1
2
E eV
b)
Figure 1
1 2 3 4 5 6 700
02
04
06
08
10
12
14
16
(F(R
infin )
E)1
2
E eV
a)
20
0
5
10
15
20
25
0
002
004
006
008
01
012
014
0 200 400 600 800
Temperature [degC]
Wei
ght d
eriv
ativ
e [m
gdegC
]
Mas
s lo
ss [m
g]
0
5
10
15
20
25
0
002
004
006
008
01
012
014
0 200 400 600 800
Temperature [degC]
Wei
ght d
eriv
ativ
e [m
gdegC
]
0
5
10
15
20
25
0
002
004
006
008
01
012
014
0 200 400 600 800
Temperature [degC]
Wei
ght d
eriv
ativ
e [m
gdegC
]
Mas
s lo
ss [m
g]
Figure 2
21
1 2 3 4 5 6 7 8 9 10
-04
-02
00
02
04
06 HP05 HP2 HP4 HP6 HP8
E V
pH
pH0=58 pH0=82
Figure 3
22
1 2 3 4 5 6 7 8 9
-02
00
02
04
06 a) b)
E V
pH
pH0=47 pH0=59
Figure 4
23
1600 1400 1200 10003600 3400 3200 3000 2800
10411455
1006
1018
1035
1079
1208
40
20 tim
e (m
in)
Wavenumber (cm-1)
Abs
orba
nce
0
60
005 au
1497
H2OBA
1369
01 au
Figure 5
24
000
005
010
015
H2O (x001)
BABA
H2O (x01)
0 10 20 30 40000
005
010
015
EA (x01)
H2O (x001)Inte
grat
ed a
bsor
banc
e (c
m-1)
Time (min)
BA
0 10 20 30 40
EA (x01)
BA
H2O (x01)
Figure 6
25
1600 1400 1200 10003600 3400 3200 3000 2800
1037
1454
1208
40
20 tim
e (m
in)
Wavenumber (cm-1)
Abs
orba
nce
0
60
0005 au
1498
H2OBA
1372
1602
1584 14
13
1340
1156
3092
001 au
3069
3037
2963
2941
2885
2801
Figure 7
26
1800 1600 1400 1200 1000
1412
1450
1275
20
10
tim
e (m
in)
Wavenumber (cm-1)Ab
sorb
ance
0
30
01 au
UV lamp ON
UV lamp OFF
Figure 8
27
1600 1400 1200 1000
1496
1530
1451
20
10
tim
e (m
in)
Wavenumber (cm-1)Ab
sorb
ance
0
001 au
UV lamp ON
1711 16
86
1603
1415
1403
1274
1246
1645
Figure 9
28
1600 1400 1200 10001600 1400 1200 1000
40
20 tim
e (m
in)
Wavenumber (cm-1)
Abso
rban
ce
0
005 au
H2O
BA
EA
002 au
Figure 10
29
1600 1400 1200 10001600 1400 1200 1000
20
30
10 tim
e (m
in)
Wavenumber (cm-1)
Abso
rban
ce
0
005 au
UV lamp ON
UV lamp OFF
1565
1522 14
0713
50
1540 14
5014
14
1685 1602
1650
1710
1270
005 au
Figure 11
30
Table 1
Catalyst Band gap
[eV]
Efb (pH=7)
[V]
VB edge[V]
Degussa P25
326 ndash 055 ndash 064a
271
Merck 322 ndash 043 279 HP05
336 ndash 052
ndash 058a 284
HP2 336 ndash 052 284 HP4 336 ndash 052 284 HP6 326 ndash 052 274 HP8 311 ndash 037 274
a values obtained in the presence of ethanol
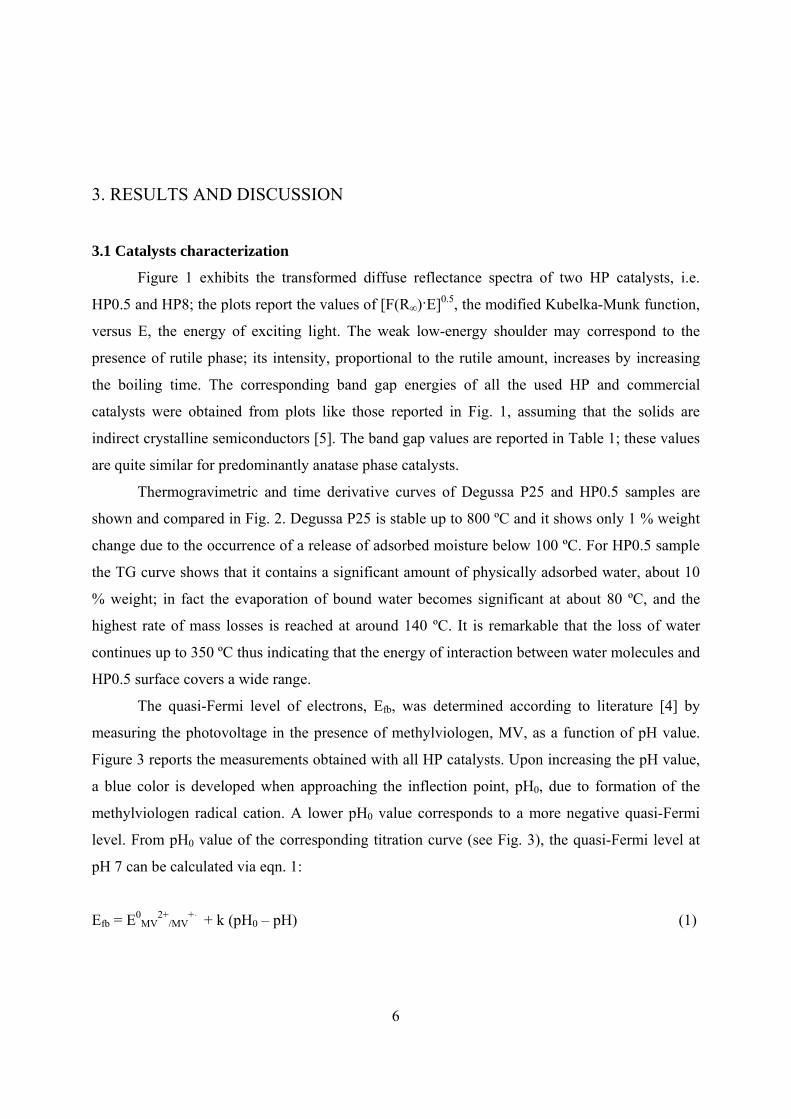

10
cannot be ascribed to this species A plausible assignment for this low frequency band would be
the C-H stretching mode of an aldehyde group what would be in agreement with an assignment
to the C=O stretching of an aldehyde group for the band centred at 1705 cm-1 Moreover the
bands at 1602 and 1584 cm-1 would agree with the presence of benzaldehyde [7] As
benzaldehyde is not expected to be formed upon adsorption at room temperature of BA on a
hydroxylated titania surface analysis of the benzyl alcohol purity was performed by HPLC It
was confirmed the presence of traces of benzaldehyde which explains the origin of the
corresponding signals in the infrared spectra It is worthy to note that even though the amount of
adsorbed BA is similar on both titania infrared bands due to adsorbed benzaldehyde are detected
only in Degussa P25 This reveals a quite dissimilar ability of both titania samples to adsorb
benzaldehyde which is strongly retained on the Degussa P25 surface but hardly hold by HP05
This feature should be taken into account to explain the higher selectivity to partial oxidation of
HP05 with respect to Degussa P25
323 Influence of irradiation on HP05
After exposure to the water and BA-saturated air atmosphere for around 1 h in the dark
HP05 sample was irradiated which led to the decrease in intensity of the bands derived from the
alcohol adsorption together with the further enhancement of the band at 1640 cm-1 and the
appearance of new overlapped bands in the 1500-1400 cm-1 range and at ca 1275 cm-1 (see Fig
8) It should be stressed that the intensity of the δ(HOH) vibration band of adsorbed water
continuously increased during irradiation but this growth stopped as soon as the lamp was
switched off This result indicates either that irradiation promotes an effective photoadsorption of
water on the HP05 surface or that water is formed as a product of the photocatalytic degradation
of the aromatic alcohol Nevertheless the steep increase of the band suggests that the
photoadsorption phenomenon is the predominant one as the increase of water vapour pressure
from the photoreaction cannot be so fast
The intensity and broadness of the band centred at 1640 cm-1 hinders the detection of
other oxidation products that might be formed during irradiation such as benzaldehyde or benzoic
acid as it overlaps the carbonyl stretching region On the other side bands in the 1400 to 1500
cm-1 range and the band at 1275 cm-1 cannot be unequivocally assigned to specific species but
according to their wavenumber values they might be indicative of the formation of dicarboxylic
11
acids following the breakage of the aromatic structure For instance values of 1271 1424 1686
and 1711 cm-1 have been previously reported for oxalate adsorbed on TiO2 [8] In the same study
absorption maxima centred at 1275 1352 1430 and 1597 cm-1 were found in the infrared spectra
of malonic acid adsorbed on TiO2
324 Influence of irradiation on commercial TiO2
In the case of Degussa P25 sample irradiation also produces a remarkable decrease in
intensity of the bands associated to adsorbed BA (see Fig 9) However in contrast with HP05
sample the resulting spectra show a complexity of features whose intensity increases with the
irradiation time Besides the water bending band at 1645 cm-1 the most prominent bands are
peaked at 1711 1686 1603 1530 1496 1451 1415 1403 (sh) 1274 and 1246 cm-1 The
assignment given to the bands in accordance to previous studies points out to the formation of
benzaldehyde and benzoic acid as main oxidation products adsorbed on the Degussa P25 surface
The band centred at 1711 cm-1 can be ascribed to the C=O stretching vibration of the carbonyl
group of benzaldehyde [9] whereas the bands at 1603 1530 1496 1451 1415 and 1403 cm-1
would be indicative of the adsorption of benzoic acid as benzoate [10 11] Johnson et al [10]
observed in the IR spectrum of a dried TiO2-benzoic acid aqueous dispersion features centred at
1602 and 1451 cm-1 assigned to the aromatic ring C=C vibrations a strong band at 1415 cm-1
assigned to the COOndash symmetric stretching vibration and a broad band centred at 1538 cm-1
attributed to the COOndash asymmetric vibration Upon adsorption of benzoic acid on TiO2 Finnie et
al [11] observed bands at 1535 and 1505 cm-1 that were assigned to the νas(COO) mode and
bands at 1418 and 1405 cm-1 ascribed to the νs(COO) vibration Splitting of the bands was
ascribed to the presence of two different coordination sites on the titania surface In both studies
the difference between the frequencies of asymmetric and symmetric COOndash group vibrations (Δν
= νas - νs) was observed to be higher than that of the benzoate anion which led to the conclusion
that benzoic acid was adsorbed on TiO2 as a bidentate complex either chelating or bridging On
this basis in the present study the bands centred at 1603 and 1451 cm-1 are assigned to skeletal
vibrations of the aromatic ring in adsorbed benzoic acid whereas bands centred at 1530 and 1496
cm-1 are ascribed to COO asymmetric stretching vibration and the bands at 1415 and 1403 cm-1 to
symmetric stretching Accordingly the largest value for the difference between the frequencies of
asymmetric and symmetric COOndash group stretching vibrations would be Δν = 1530-1415 = 127
12
cmndash1 value which is in agreement with a bidentate chelate or bridging coordination of benzoate
on the titania surface [10 12] As for the band centred at 1686 cm-1 it might be ascribed to the
C=O stretching vibration of undissociated benzoic acid [13] which could be attached to the TiO2
surface through either unidentate coordination or hydrogen bonding Finally the bands centred at
1274 and 1246 cm-1 must be indicative of further oxidized compounds most likely oxalate
according to the wavenumber values reported for these species [8] In fact it has been previously
shown that oxalate hardly desorbs from the Degussa P25 surface [14] so it might be expected on
the titania surface if formed during the mineralization of the aromatic alcohol
325 Influence of ethanol co-adsorption on concentration of adsorbed species
Aiming at giving likely explanations on the influence of aliphatic alcohols on selectivity
of BA oxidation [1] experiments were performed exposing samples to an atmosphere of
synthetic air saturated with BA ethanol and water to obtain further information on the effect of
ethanol co-adsorption on the interaction of BA with titania surfaces The experiments were
carried out by exposing the catalyst for 10 min to BA and water and then ethanol was introduced
in the cell Figure 10 shows ATR-FTIR spectra recorded during the adsorption experiment For
HP05 and Degussa P25 catalysts upon ethanol admission in the cell bands centred at 1480
1450 1380 1326 1275 1088 and 1046 cm-1 appear in the spectra These features are identical to
the absorptions observed in the spectrum of neat ethanol (spectra not shown) thus indicating that
ethanol is adsorbed on the catalyst surface mostly as molecular species It is worth to note that for
HP05 the adsorption of ethanol decreased the amount of adsorbed molecular water as indicated
by the much lower intensity of the δ(HOH) vibration band compared to the spectra shown in Fig
5 Moreover this band shifted toward higher wavenumber values (1654 cm-1) in both titania
surfaces thus indicating an interaction between adsorbed water and ethanol species most likely
through hydrogen bonding Similar effect was observed upon ethanol adsorption in the absence
of BA
From the concentration profiles reported in Fig 6 it may be noted that the presence of
ethanol has different effects on HP05 and Degussa P25 For both catalysts the amount of BA
adsorbed on titania surfaces diminishes to a great extent as ethanol is introduced in the cell
Nevertheless after 30 min of contact with ethanol vapour weak bands corresponding to adsorbed
benzyl alcohol at 1497 and 1208 cm-1 could still be clearly observed in the spectra of both
13
samples (see Fig 10) Exposure to ethanol vapour also produced a significant decrease of the
amount of adsorbed water in both samples However after the initial sharp decrease the amount
of water adsorbed on Degussa P25 slowly increased with time while on HP05 sample it reached
a nearly constant level which indicates that ethanol competes more strongly with water for
adsorption on HP05 sample than on the commercial titania
326 Influence of ethanol co-adsorption on photo-oxidation products
Subsequent irradiation of HP05 sample results in the appearance of broad overlapping
bands at ca 1565 and 1522 cm-1 that can be assigned to carboxylate species derived from ethanol
photo-oxidation [15] and the growing in of bands centred at 1407 and 1350 cm-1 (see Fig 11)
Note particularly that in contrast with results obtained in the absence of ethanol the carbonyl
stretching region is not hidden by the δ(HOH) band due to the lower adsorbed water content that
induces the co-adsorption of ethanol Therefore it can be now clearly observed that no
characteristic bands of benzaldehyde are formed
In the case of Degussa P25 UV irradiation gives rise to a large increase of the spectra
baseline at wavenumbers below 2000 cm-1 that peak at ca 900 cm-1 This phenomenon was
reproducible and was observed only when ethanol was adsorbed on Degussa P25 either in the
presence or absence of co-adsorbed BA This UV-induced infrared absorption has been already
reported for dry Degussa P25 and it has been attributed to excitation of shallow trap electrons to
the conduction band [16] UV light also produces the development of bands centred at 1710
1685 1650 1602 1540 1450 1414 and 1270 cm-1 indicative of the presence on the Degussa P25
surface of products derived from the oxidation of both alcohols The finding that the bands of BA
oxidation products appear also in the presence of ethanol seems to indicate that ethanol does not
affect the BA oxidation pathways but it only decreases BA concentration on catalyst surface
4 CONCLUSIONS
The photoelectrochemical characterization of HP catalysts clearly indicates that the
semiconducting properties of HP05 HP2 HP4 and HP6 did not appreciably vary with the
preparation procedure contrarily to sample HP8 The different photoactivities and selectivities
14
exhibited by the photocatalysts could arise hence more from different properties of their surfaces
rather than from semiconducting ones
From the ATR-FTIR analysis it can be concluded that two main differences between
HP05 and Degussa P25 surfaces exist On one hand their dissimilar hydrophilicity is relevant A
much higher amount of molecular water is indeed present on the former sample in comparison to
the latter On the other hand the ability in adsorbing the organic compounds deriving from BA
photocatalytic oxidation is quite lower for the home prepared catalyst as compared to the
commercial one
On this basis the highest selectivity of HP05 sample towards BA partial oxidation can be
ascribed to its low affinity for benzaldehyde adsorption on one hand and to the lowest
mineralization promoted on the other hand It can be postulated that the higher hydrophilicity of
HP05 sample compared to Degussa P25 plays an important role in connection with the latter
effect as the high coverage of the HP05 surface by water molecules might result in a
competition for adsorption sites
Bearing in mind the difficulty of stating clear correlations between photoreactivity and
catalysts features the following considerations may be drawn The photoactivity results [1]
obtained with HP05 catalyst show a low oxidation rate of benzyl alcohol but a high selectivity to
benzaldehyde The present study shows that the surface of HP05 catalyst is rich in molecularly
adsorbed water which is able to displace BA molecules in the dark Under irradiation water
displaces benzyl alcohol more effectively and determines a very low coverage of alcohol
molecules on HP surface It is likely that this low coverage is responsible for the low oxidation
rate of benzyl alcohol On the other hand the high water content might account for the high
selectivity to benzaldehyde assuming that water compete with BA molecules for the adsorption
on mineralization sites The presence of ethanol lowers the BA amount on HP surface thus
determining a strong decrease of the overall alcohol oxidation rate Molecularly adsorbed water is
also partly displaced by ethanol but the selectivity to benzaldehyde is increased One plausible
explanation is that ethanol is predominantly adsorbed on mineralization sites
For Degussa P25 the reactivity results indicate that the mineralization pathway
predominates over the partial oxidizing one As compared to HP05 this catalyst shows a higher
coverage of benzyl alcohol and smaller water content so that the ratio between water and benzyl
alcohol is low and therefore it is likely that mineralization sites are not preferentially occupied
15
by water molecules The addition of ethanol determines a strong decrease of benzyl alcohol
coverage while the water content is poorly modified For this catalyst neither the benzyl alcohol
oxidation rate nor the selectivity to benzaldehyde is affected by ethanol so that it may be
hypothesised that under irradiation the benzyl alcohol and water coverages on P25 surface remain
unaltered and therefore also the partial oxidation and mineralization pathways
ACKNOWLEDGEMENTS
Eng Dr Fabio DrsquoAgostino is gratefully acknowledged for the execution of TG measurements
16
REFERENCES 1 V Augugliaro H Kisch V Loddo M J Loacutepez-Muntildeoz C Maacuterquez-Aacutelvarez G
Palmisano L Palmisano F Parrino S Yurdakal Appl Catal A Gen (2008)
(submitted) 2 G Palmisano S Yurdakal V Augugliaro V Loddo L Palmisano Adv Synth Catal
349 (2007) 964
3 G Kortuumlm Reflectance Spectroscopy Principles Methods Applications Springer-
Verlag New York 1969
4 A M Roy G C De N Sasmal S S Bhattacharyya Int J Hydrogen Energy 20 (1995)
627
5 J Tauc R Grigorovici A Vanuc Phys Stat Sol 15 (1996) 627
6 G Redmond D Fitzmaurice J Phys Chem 97 (1993) 1426
7 C Keresszegi D Ferri T Mallat A J Baiker J Phys Chem B 109 (2005) 958
8 K D Dobson A J McQillan Spectrochim Acta Part A 55 (1999) 1395
9 H Lampert W Mikenda A Karpfen J Phys Chem A 101 (1997) 2254
10 A M Johnson S Trakhtenberg A S Cannon J C Warner J Phys Chem A 111
(2007) 8139
11 K S Finnie J R Bartlett J L Woolfrey Langmuir 14 (1998) 2744
12 S Tunesi M Anderson Langmuir 8 (1992) 487
13 M Boczar K Szczeponek M J Woacutejcik C Paluszkiewicz J Mol Structure 700 (2004)
39
14 I Dolamic T Buumlrgi J Phys Chem B 110 (2006) 14898
15 D V Kozlov E A Paukshtis E N Savinov Appl Catal B Environ 24 (2000) L7
16 D S Warren A J McQuillan J Phys Chem B 108 (2004) 19373
17
CAPTIONS
Figure 1 Transformed diffuse reflectance spectra of (a) HP05 and (b) HP8
Figure 2 Thermogravimetric (dotted lines) and time derivative (continuous lines) curves in air of
HP05 ( ) and Degussa P25 ( )
Figure 3 Variation of photovoltage with pH value 50 mg of catalyst with 10 mg of methyl
viologen dichloride are suspended in 50 mL of 01 M KNO3 aqueous solution at room
temperature Pt working electrode and AgAgCl reference electrodes
Figure 4 Variation of photovoltage with pH value for HP05 catalyst in the presence (a) and in
the absence (b) of ethanol 50 mg of catalyst with 10 mg of methyl viologen dichloride are
suspended in 50 mL of 01 M KNO3 aqueous solution at room temperature Pt working electrode
and AgAgCl reference electrodes For (b) case 5 ml of ethanol have been added to suspension
Figure 5 Time-resolved ATR-FTIR spectra of HP05 thin film recorded during adsorption of
water and benzyl alcohol (BA) vapours at room temperature The arrows indicate the time when
each adsorbate was introduced in the cell The spectrum of neat benzyl alcohol () multiplied by
a factor 001 has been included for comparison
Figure 6 Time evolution of the integrated absorbance of IR bands at 1640 cm-1 (water) 1208
cm-1 (benzyl alcohol BA) and 2975 cm-1 (ethanol EA) determined from ATR-FTIR spectra
recorded during adsorption of water and benzyl alcohol (top) and water benzyl alcohol and
ethanol (bottom) on HP05 (left) and Degussa P25 (right) samples Zero time corresponds to
introduction of BA into the cell EA was introduced in the cell 10 min after BA
Figure 7 Time-resolved ATR-FTIR spectra of Degussa P25 thin film recorded during adsorption
of water and benzyl alcohol (BA) vapours at room temperature The arrows indicate the time
18
when each adsorbate was introduced in the cell The spectrum of neat benzyl alcohol ()
multiplied by a factor 001 has been included for comparison
Figure 8 Time-resolved ATR-FTIR spectra recorded during irradiation of HP05 thin film in an
atmosphere of synthetic air saturated with water and benzyl alcohol The arrows indicate the time
when UV lamp was switched on (it took around 2 min to reach full power) and off
Figure 9 Time-resolved ATR-FTIR spectra recorded during irradiation of Degussa P25 thin film
in an atmosphere of synthetic air saturated with water and benzyl alcohol The arrows indicate the
time when UV lamp was switched on (it took around 2 min to reach full power)
Figure 10 Time-resolved ATR-FTIR spectra of Degussa P25 (left) and HP05 (right) thin films
recorded during adsorption of water benzyl alcohol (BA) and ethanol (EA) vapours at room
temperature The arrows indicate the time when each adsorbate was introduced in the cell
Figure 11 Time-resolved ATR-FTIR spectra recorded during irradiation of Degussa P25 (left)
and HP05 (right) thin film in an atmosphere of synthetic air saturated with water benzyl alcohol
and ethanol The arrows indicate the time when UV lamp was switched on (it took around 2 min
to reach full power) and off Spectra of Degussa P25 sample recorded after switching off the
lamp have been shifted upwards by 012 absorbance units for clarity
Table 1 Photoelectrochemical properties of catalysts
19
1 2 3 4 5 6 700
02
04
06
08
10
12
14
16
(F(R
infin )
E)1
2
E eV
b)
Figure 1
1 2 3 4 5 6 700
02
04
06
08
10
12
14
16
(F(R
infin )
E)1
2
E eV
a)
20
0
5
10
15
20
25
0
002
004
006
008
01
012
014
0 200 400 600 800
Temperature [degC]
Wei
ght d
eriv
ativ
e [m
gdegC
]
Mas
s lo
ss [m
g]
0
5
10
15
20
25
0
002
004
006
008
01
012
014
0 200 400 600 800
Temperature [degC]
Wei
ght d
eriv
ativ
e [m
gdegC
]
0
5
10
15
20
25
0
002
004
006
008
01
012
014
0 200 400 600 800
Temperature [degC]
Wei
ght d
eriv
ativ
e [m
gdegC
]
Mas
s lo
ss [m
g]
Figure 2
21
1 2 3 4 5 6 7 8 9 10
-04
-02
00
02
04
06 HP05 HP2 HP4 HP6 HP8
E V
pH
pH0=58 pH0=82
Figure 3
22
1 2 3 4 5 6 7 8 9
-02
00
02
04
06 a) b)
E V
pH
pH0=47 pH0=59
Figure 4
23
1600 1400 1200 10003600 3400 3200 3000 2800
10411455
1006
1018
1035
1079
1208
40
20 tim
e (m
in)
Wavenumber (cm-1)
Abs
orba
nce
0
60
005 au
1497
H2OBA
1369
01 au
Figure 5
24
000
005
010
015
H2O (x001)
BABA
H2O (x01)
0 10 20 30 40000
005
010
015
EA (x01)
H2O (x001)Inte
grat
ed a
bsor
banc
e (c
m-1)
Time (min)
BA
0 10 20 30 40
EA (x01)
BA
H2O (x01)
Figure 6
25
1600 1400 1200 10003600 3400 3200 3000 2800
1037
1454
1208
40
20 tim
e (m
in)
Wavenumber (cm-1)
Abs
orba
nce
0
60
0005 au
1498
H2OBA
1372
1602
1584 14
13
1340
1156
3092
001 au
3069
3037
2963
2941
2885
2801
Figure 7
26
1800 1600 1400 1200 1000
1412
1450
1275
20
10
tim
e (m
in)
Wavenumber (cm-1)Ab
sorb
ance
0
30
01 au
UV lamp ON
UV lamp OFF
Figure 8
27
1600 1400 1200 1000
1496
1530
1451
20
10
tim
e (m
in)
Wavenumber (cm-1)Ab
sorb
ance
0
001 au
UV lamp ON
1711 16
86
1603
1415
1403
1274
1246
1645
Figure 9
28
1600 1400 1200 10001600 1400 1200 1000
40
20 tim
e (m
in)
Wavenumber (cm-1)
Abso
rban
ce
0
005 au
H2O
BA
EA
002 au
Figure 10
29
1600 1400 1200 10001600 1400 1200 1000
20
30
10 tim
e (m
in)
Wavenumber (cm-1)
Abso
rban
ce
0
005 au
UV lamp ON
UV lamp OFF
1565
1522 14
0713
50
1540 14
5014
14
1685 1602
1650
1710
1270
005 au
Figure 11
30
Table 1
Catalyst Band gap
[eV]
Efb (pH=7)
[V]
VB edge[V]
Degussa P25
326 ndash 055 ndash 064a
271
Merck 322 ndash 043 279 HP05
336 ndash 052
ndash 058a 284
HP2 336 ndash 052 284 HP4 336 ndash 052 284 HP6 326 ndash 052 274 HP8 311 ndash 037 274
a values obtained in the presence of ethanol

12
cmndash1 value which is in agreement with a bidentate chelate or bridging coordination of benzoate
on the titania surface [10 12] As for the band centred at 1686 cm-1 it might be ascribed to the
C=O stretching vibration of undissociated benzoic acid [13] which could be attached to the TiO2
surface through either unidentate coordination or hydrogen bonding Finally the bands centred at
1274 and 1246 cm-1 must be indicative of further oxidized compounds most likely oxalate
according to the wavenumber values reported for these species [8] In fact it has been previously
shown that oxalate hardly desorbs from the Degussa P25 surface [14] so it might be expected on
the titania surface if formed during the mineralization of the aromatic alcohol
325 Influence of ethanol co-adsorption on concentration of adsorbed species
Aiming at giving likely explanations on the influence of aliphatic alcohols on selectivity
of BA oxidation [1] experiments were performed exposing samples to an atmosphere of
synthetic air saturated with BA ethanol and water to obtain further information on the effect of
ethanol co-adsorption on the interaction of BA with titania surfaces The experiments were
carried out by exposing the catalyst for 10 min to BA and water and then ethanol was introduced
in the cell Figure 10 shows ATR-FTIR spectra recorded during the adsorption experiment For
HP05 and Degussa P25 catalysts upon ethanol admission in the cell bands centred at 1480
1450 1380 1326 1275 1088 and 1046 cm-1 appear in the spectra These features are identical to
the absorptions observed in the spectrum of neat ethanol (spectra not shown) thus indicating that
ethanol is adsorbed on the catalyst surface mostly as molecular species It is worth to note that for
HP05 the adsorption of ethanol decreased the amount of adsorbed molecular water as indicated
by the much lower intensity of the δ(HOH) vibration band compared to the spectra shown in Fig
5 Moreover this band shifted toward higher wavenumber values (1654 cm-1) in both titania
surfaces thus indicating an interaction between adsorbed water and ethanol species most likely
through hydrogen bonding Similar effect was observed upon ethanol adsorption in the absence
of BA
From the concentration profiles reported in Fig 6 it may be noted that the presence of
ethanol has different effects on HP05 and Degussa P25 For both catalysts the amount of BA
adsorbed on titania surfaces diminishes to a great extent as ethanol is introduced in the cell
Nevertheless after 30 min of contact with ethanol vapour weak bands corresponding to adsorbed
benzyl alcohol at 1497 and 1208 cm-1 could still be clearly observed in the spectra of both
13
samples (see Fig 10) Exposure to ethanol vapour also produced a significant decrease of the
amount of adsorbed water in both samples However after the initial sharp decrease the amount
of water adsorbed on Degussa P25 slowly increased with time while on HP05 sample it reached
a nearly constant level which indicates that ethanol competes more strongly with water for
adsorption on HP05 sample than on the commercial titania
326 Influence of ethanol co-adsorption on photo-oxidation products
Subsequent irradiation of HP05 sample results in the appearance of broad overlapping
bands at ca 1565 and 1522 cm-1 that can be assigned to carboxylate species derived from ethanol
photo-oxidation [15] and the growing in of bands centred at 1407 and 1350 cm-1 (see Fig 11)
Note particularly that in contrast with results obtained in the absence of ethanol the carbonyl
stretching region is not hidden by the δ(HOH) band due to the lower adsorbed water content that
induces the co-adsorption of ethanol Therefore it can be now clearly observed that no
characteristic bands of benzaldehyde are formed
In the case of Degussa P25 UV irradiation gives rise to a large increase of the spectra
baseline at wavenumbers below 2000 cm-1 that peak at ca 900 cm-1 This phenomenon was
reproducible and was observed only when ethanol was adsorbed on Degussa P25 either in the
presence or absence of co-adsorbed BA This UV-induced infrared absorption has been already
reported for dry Degussa P25 and it has been attributed to excitation of shallow trap electrons to
the conduction band [16] UV light also produces the development of bands centred at 1710
1685 1650 1602 1540 1450 1414 and 1270 cm-1 indicative of the presence on the Degussa P25
surface of products derived from the oxidation of both alcohols The finding that the bands of BA
oxidation products appear also in the presence of ethanol seems to indicate that ethanol does not
affect the BA oxidation pathways but it only decreases BA concentration on catalyst surface
4 CONCLUSIONS
The photoelectrochemical characterization of HP catalysts clearly indicates that the
semiconducting properties of HP05 HP2 HP4 and HP6 did not appreciably vary with the
preparation procedure contrarily to sample HP8 The different photoactivities and selectivities
14
exhibited by the photocatalysts could arise hence more from different properties of their surfaces
rather than from semiconducting ones
From the ATR-FTIR analysis it can be concluded that two main differences between
HP05 and Degussa P25 surfaces exist On one hand their dissimilar hydrophilicity is relevant A
much higher amount of molecular water is indeed present on the former sample in comparison to
the latter On the other hand the ability in adsorbing the organic compounds deriving from BA
photocatalytic oxidation is quite lower for the home prepared catalyst as compared to the
commercial one
On this basis the highest selectivity of HP05 sample towards BA partial oxidation can be
ascribed to its low affinity for benzaldehyde adsorption on one hand and to the lowest
mineralization promoted on the other hand It can be postulated that the higher hydrophilicity of
HP05 sample compared to Degussa P25 plays an important role in connection with the latter
effect as the high coverage of the HP05 surface by water molecules might result in a
competition for adsorption sites
Bearing in mind the difficulty of stating clear correlations between photoreactivity and
catalysts features the following considerations may be drawn The photoactivity results [1]
obtained with HP05 catalyst show a low oxidation rate of benzyl alcohol but a high selectivity to
benzaldehyde The present study shows that the surface of HP05 catalyst is rich in molecularly
adsorbed water which is able to displace BA molecules in the dark Under irradiation water
displaces benzyl alcohol more effectively and determines a very low coverage of alcohol
molecules on HP surface It is likely that this low coverage is responsible for the low oxidation
rate of benzyl alcohol On the other hand the high water content might account for the high
selectivity to benzaldehyde assuming that water compete with BA molecules for the adsorption
on mineralization sites The presence of ethanol lowers the BA amount on HP surface thus
determining a strong decrease of the overall alcohol oxidation rate Molecularly adsorbed water is
also partly displaced by ethanol but the selectivity to benzaldehyde is increased One plausible
explanation is that ethanol is predominantly adsorbed on mineralization sites
For Degussa P25 the reactivity results indicate that the mineralization pathway
predominates over the partial oxidizing one As compared to HP05 this catalyst shows a higher
coverage of benzyl alcohol and smaller water content so that the ratio between water and benzyl
alcohol is low and therefore it is likely that mineralization sites are not preferentially occupied
15
by water molecules The addition of ethanol determines a strong decrease of benzyl alcohol
coverage while the water content is poorly modified For this catalyst neither the benzyl alcohol
oxidation rate nor the selectivity to benzaldehyde is affected by ethanol so that it may be
hypothesised that under irradiation the benzyl alcohol and water coverages on P25 surface remain
unaltered and therefore also the partial oxidation and mineralization pathways
ACKNOWLEDGEMENTS
Eng Dr Fabio DrsquoAgostino is gratefully acknowledged for the execution of TG measurements
16
REFERENCES 1 V Augugliaro H Kisch V Loddo M J Loacutepez-Muntildeoz C Maacuterquez-Aacutelvarez G
Palmisano L Palmisano F Parrino S Yurdakal Appl Catal A Gen (2008)
(submitted) 2 G Palmisano S Yurdakal V Augugliaro V Loddo L Palmisano Adv Synth Catal
349 (2007) 964
3 G Kortuumlm Reflectance Spectroscopy Principles Methods Applications Springer-
Verlag New York 1969
4 A M Roy G C De N Sasmal S S Bhattacharyya Int J Hydrogen Energy 20 (1995)
627
5 J Tauc R Grigorovici A Vanuc Phys Stat Sol 15 (1996) 627
6 G Redmond D Fitzmaurice J Phys Chem 97 (1993) 1426
7 C Keresszegi D Ferri T Mallat A J Baiker J Phys Chem B 109 (2005) 958
8 K D Dobson A J McQillan Spectrochim Acta Part A 55 (1999) 1395
9 H Lampert W Mikenda A Karpfen J Phys Chem A 101 (1997) 2254
10 A M Johnson S Trakhtenberg A S Cannon J C Warner J Phys Chem A 111
(2007) 8139
11 K S Finnie J R Bartlett J L Woolfrey Langmuir 14 (1998) 2744
12 S Tunesi M Anderson Langmuir 8 (1992) 487
13 M Boczar K Szczeponek M J Woacutejcik C Paluszkiewicz J Mol Structure 700 (2004)
39
14 I Dolamic T Buumlrgi J Phys Chem B 110 (2006) 14898
15 D V Kozlov E A Paukshtis E N Savinov Appl Catal B Environ 24 (2000) L7
16 D S Warren A J McQuillan J Phys Chem B 108 (2004) 19373
17
CAPTIONS
Figure 1 Transformed diffuse reflectance spectra of (a) HP05 and (b) HP8
Figure 2 Thermogravimetric (dotted lines) and time derivative (continuous lines) curves in air of
HP05 ( ) and Degussa P25 ( )
Figure 3 Variation of photovoltage with pH value 50 mg of catalyst with 10 mg of methyl
viologen dichloride are suspended in 50 mL of 01 M KNO3 aqueous solution at room
temperature Pt working electrode and AgAgCl reference electrodes
Figure 4 Variation of photovoltage with pH value for HP05 catalyst in the presence (a) and in
the absence (b) of ethanol 50 mg of catalyst with 10 mg of methyl viologen dichloride are
suspended in 50 mL of 01 M KNO3 aqueous solution at room temperature Pt working electrode
and AgAgCl reference electrodes For (b) case 5 ml of ethanol have been added to suspension
Figure 5 Time-resolved ATR-FTIR spectra of HP05 thin film recorded during adsorption of
water and benzyl alcohol (BA) vapours at room temperature The arrows indicate the time when
each adsorbate was introduced in the cell The spectrum of neat benzyl alcohol () multiplied by
a factor 001 has been included for comparison
Figure 6 Time evolution of the integrated absorbance of IR bands at 1640 cm-1 (water) 1208
cm-1 (benzyl alcohol BA) and 2975 cm-1 (ethanol EA) determined from ATR-FTIR spectra
recorded during adsorption of water and benzyl alcohol (top) and water benzyl alcohol and
ethanol (bottom) on HP05 (left) and Degussa P25 (right) samples Zero time corresponds to
introduction of BA into the cell EA was introduced in the cell 10 min after BA
Figure 7 Time-resolved ATR-FTIR spectra of Degussa P25 thin film recorded during adsorption
of water and benzyl alcohol (BA) vapours at room temperature The arrows indicate the time
18
when each adsorbate was introduced in the cell The spectrum of neat benzyl alcohol ()
multiplied by a factor 001 has been included for comparison
Figure 8 Time-resolved ATR-FTIR spectra recorded during irradiation of HP05 thin film in an
atmosphere of synthetic air saturated with water and benzyl alcohol The arrows indicate the time
when UV lamp was switched on (it took around 2 min to reach full power) and off
Figure 9 Time-resolved ATR-FTIR spectra recorded during irradiation of Degussa P25 thin film
in an atmosphere of synthetic air saturated with water and benzyl alcohol The arrows indicate the
time when UV lamp was switched on (it took around 2 min to reach full power)
Figure 10 Time-resolved ATR-FTIR spectra of Degussa P25 (left) and HP05 (right) thin films
recorded during adsorption of water benzyl alcohol (BA) and ethanol (EA) vapours at room
temperature The arrows indicate the time when each adsorbate was introduced in the cell
Figure 11 Time-resolved ATR-FTIR spectra recorded during irradiation of Degussa P25 (left)
and HP05 (right) thin film in an atmosphere of synthetic air saturated with water benzyl alcohol
and ethanol The arrows indicate the time when UV lamp was switched on (it took around 2 min
to reach full power) and off Spectra of Degussa P25 sample recorded after switching off the
lamp have been shifted upwards by 012 absorbance units for clarity
Table 1 Photoelectrochemical properties of catalysts
19
1 2 3 4 5 6 700
02
04
06
08
10
12
14
16
(F(R
infin )
E)1
2
E eV
b)
Figure 1
1 2 3 4 5 6 700
02
04
06
08
10
12
14
16
(F(R
infin )
E)1
2
E eV
a)
20
0
5
10
15
20
25
0
002
004
006
008
01
012
014
0 200 400 600 800
Temperature [degC]
Wei
ght d
eriv
ativ
e [m
gdegC
]
Mas
s lo
ss [m
g]
0
5
10
15
20
25
0
002
004
006
008
01
012
014
0 200 400 600 800
Temperature [degC]
Wei
ght d
eriv
ativ
e [m
gdegC
]
0
5
10
15
20
25
0
002
004
006
008
01
012
014
0 200 400 600 800
Temperature [degC]
Wei
ght d
eriv
ativ
e [m
gdegC
]
Mas
s lo
ss [m
g]
Figure 2
21
1 2 3 4 5 6 7 8 9 10
-04
-02
00
02
04
06 HP05 HP2 HP4 HP6 HP8
E V
pH
pH0=58 pH0=82
Figure 3
22
1 2 3 4 5 6 7 8 9
-02
00
02
04
06 a) b)
E V
pH
pH0=47 pH0=59
Figure 4
23
1600 1400 1200 10003600 3400 3200 3000 2800
10411455
1006
1018
1035
1079
1208
40
20 tim
e (m
in)
Wavenumber (cm-1)
Abs
orba
nce
0
60
005 au
1497
H2OBA
1369
01 au
Figure 5
24
000
005
010
015
H2O (x001)
BABA
H2O (x01)
0 10 20 30 40000
005
010
015
EA (x01)
H2O (x001)Inte
grat
ed a
bsor
banc
e (c
m-1)
Time (min)
BA
0 10 20 30 40
EA (x01)
BA
H2O (x01)
Figure 6
25
1600 1400 1200 10003600 3400 3200 3000 2800
1037
1454
1208
40
20 tim
e (m
in)
Wavenumber (cm-1)
Abs
orba
nce
0
60
0005 au
1498
H2OBA
1372
1602
1584 14
13
1340
1156
3092
001 au
3069
3037
2963
2941
2885
2801
Figure 7
26
1800 1600 1400 1200 1000
1412
1450
1275
20
10
tim
e (m
in)
Wavenumber (cm-1)Ab
sorb
ance
0
30
01 au
UV lamp ON
UV lamp OFF
Figure 8
27
1600 1400 1200 1000
1496
1530
1451
20
10
tim
e (m
in)
Wavenumber (cm-1)Ab
sorb
ance
0
001 au
UV lamp ON
1711 16
86
1603
1415
1403
1274
1246
1645
Figure 9
28
1600 1400 1200 10001600 1400 1200 1000
40
20 tim
e (m
in)
Wavenumber (cm-1)
Abso
rban
ce
0
005 au
H2O
BA
EA
002 au
Figure 10
29
1600 1400 1200 10001600 1400 1200 1000
20
30
10 tim
e (m
in)
Wavenumber (cm-1)
Abso
rban
ce
0
005 au
UV lamp ON
UV lamp OFF
1565
1522 14
0713
50
1540 14
5014
14
1685 1602
1650
1710
1270
005 au
Figure 11
30
Table 1
Catalyst Band gap
[eV]
Efb (pH=7)
[V]
VB edge[V]
Degussa P25
326 ndash 055 ndash 064a
271
Merck 322 ndash 043 279 HP05
336 ndash 052
ndash 058a 284
HP2 336 ndash 052 284 HP4 336 ndash 052 284 HP6 326 ndash 052 274 HP8 311 ndash 037 274
a values obtained in the presence of ethanol

13
samples (see Fig 10) Exposure to ethanol vapour also produced a significant decrease of the
amount of adsorbed water in both samples However after the initial sharp decrease the amount
of water adsorbed on Degussa P25 slowly increased with time while on HP05 sample it reached
a nearly constant level which indicates that ethanol competes more strongly with water for
adsorption on HP05 sample than on the commercial titania
326 Influence of ethanol co-adsorption on photo-oxidation products
Subsequent irradiation of HP05 sample results in the appearance of broad overlapping
bands at ca 1565 and 1522 cm-1 that can be assigned to carboxylate species derived from ethanol
photo-oxidation [15] and the growing in of bands centred at 1407 and 1350 cm-1 (see Fig 11)
Note particularly that in contrast with results obtained in the absence of ethanol the carbonyl
stretching region is not hidden by the δ(HOH) band due to the lower adsorbed water content that
induces the co-adsorption of ethanol Therefore it can be now clearly observed that no
characteristic bands of benzaldehyde are formed
In the case of Degussa P25 UV irradiation gives rise to a large increase of the spectra
baseline at wavenumbers below 2000 cm-1 that peak at ca 900 cm-1 This phenomenon was
reproducible and was observed only when ethanol was adsorbed on Degussa P25 either in the
presence or absence of co-adsorbed BA This UV-induced infrared absorption has been already
reported for dry Degussa P25 and it has been attributed to excitation of shallow trap electrons to
the conduction band [16] UV light also produces the development of bands centred at 1710
1685 1650 1602 1540 1450 1414 and 1270 cm-1 indicative of the presence on the Degussa P25
surface of products derived from the oxidation of both alcohols The finding that the bands of BA
oxidation products appear also in the presence of ethanol seems to indicate that ethanol does not
affect the BA oxidation pathways but it only decreases BA concentration on catalyst surface
4 CONCLUSIONS
The photoelectrochemical characterization of HP catalysts clearly indicates that the
semiconducting properties of HP05 HP2 HP4 and HP6 did not appreciably vary with the
preparation procedure contrarily to sample HP8 The different photoactivities and selectivities
14
exhibited by the photocatalysts could arise hence more from different properties of their surfaces
rather than from semiconducting ones
From the ATR-FTIR analysis it can be concluded that two main differences between
HP05 and Degussa P25 surfaces exist On one hand their dissimilar hydrophilicity is relevant A
much higher amount of molecular water is indeed present on the former sample in comparison to
the latter On the other hand the ability in adsorbing the organic compounds deriving from BA
photocatalytic oxidation is quite lower for the home prepared catalyst as compared to the
commercial one
On this basis the highest selectivity of HP05 sample towards BA partial oxidation can be
ascribed to its low affinity for benzaldehyde adsorption on one hand and to the lowest
mineralization promoted on the other hand It can be postulated that the higher hydrophilicity of
HP05 sample compared to Degussa P25 plays an important role in connection with the latter
effect as the high coverage of the HP05 surface by water molecules might result in a
competition for adsorption sites
Bearing in mind the difficulty of stating clear correlations between photoreactivity and
catalysts features the following considerations may be drawn The photoactivity results [1]
obtained with HP05 catalyst show a low oxidation rate of benzyl alcohol but a high selectivity to
benzaldehyde The present study shows that the surface of HP05 catalyst is rich in molecularly
adsorbed water which is able to displace BA molecules in the dark Under irradiation water
displaces benzyl alcohol more effectively and determines a very low coverage of alcohol
molecules on HP surface It is likely that this low coverage is responsible for the low oxidation
rate of benzyl alcohol On the other hand the high water content might account for the high
selectivity to benzaldehyde assuming that water compete with BA molecules for the adsorption
on mineralization sites The presence of ethanol lowers the BA amount on HP surface thus
determining a strong decrease of the overall alcohol oxidation rate Molecularly adsorbed water is
also partly displaced by ethanol but the selectivity to benzaldehyde is increased One plausible
explanation is that ethanol is predominantly adsorbed on mineralization sites
For Degussa P25 the reactivity results indicate that the mineralization pathway
predominates over the partial oxidizing one As compared to HP05 this catalyst shows a higher
coverage of benzyl alcohol and smaller water content so that the ratio between water and benzyl
alcohol is low and therefore it is likely that mineralization sites are not preferentially occupied
15
by water molecules The addition of ethanol determines a strong decrease of benzyl alcohol
coverage while the water content is poorly modified For this catalyst neither the benzyl alcohol
oxidation rate nor the selectivity to benzaldehyde is affected by ethanol so that it may be
hypothesised that under irradiation the benzyl alcohol and water coverages on P25 surface remain
unaltered and therefore also the partial oxidation and mineralization pathways
ACKNOWLEDGEMENTS
Eng Dr Fabio DrsquoAgostino is gratefully acknowledged for the execution of TG measurements
16
REFERENCES 1 V Augugliaro H Kisch V Loddo M J Loacutepez-Muntildeoz C Maacuterquez-Aacutelvarez G
Palmisano L Palmisano F Parrino S Yurdakal Appl Catal A Gen (2008)
(submitted) 2 G Palmisano S Yurdakal V Augugliaro V Loddo L Palmisano Adv Synth Catal
349 (2007) 964
3 G Kortuumlm Reflectance Spectroscopy Principles Methods Applications Springer-
Verlag New York 1969
4 A M Roy G C De N Sasmal S S Bhattacharyya Int J Hydrogen Energy 20 (1995)
627
5 J Tauc R Grigorovici A Vanuc Phys Stat Sol 15 (1996) 627
6 G Redmond D Fitzmaurice J Phys Chem 97 (1993) 1426
7 C Keresszegi D Ferri T Mallat A J Baiker J Phys Chem B 109 (2005) 958
8 K D Dobson A J McQillan Spectrochim Acta Part A 55 (1999) 1395
9 H Lampert W Mikenda A Karpfen J Phys Chem A 101 (1997) 2254
10 A M Johnson S Trakhtenberg A S Cannon J C Warner J Phys Chem A 111
(2007) 8139
11 K S Finnie J R Bartlett J L Woolfrey Langmuir 14 (1998) 2744
12 S Tunesi M Anderson Langmuir 8 (1992) 487
13 M Boczar K Szczeponek M J Woacutejcik C Paluszkiewicz J Mol Structure 700 (2004)
39
14 I Dolamic T Buumlrgi J Phys Chem B 110 (2006) 14898
15 D V Kozlov E A Paukshtis E N Savinov Appl Catal B Environ 24 (2000) L7
16 D S Warren A J McQuillan J Phys Chem B 108 (2004) 19373
17
CAPTIONS
Figure 1 Transformed diffuse reflectance spectra of (a) HP05 and (b) HP8
Figure 2 Thermogravimetric (dotted lines) and time derivative (continuous lines) curves in air of
HP05 ( ) and Degussa P25 ( )
Figure 3 Variation of photovoltage with pH value 50 mg of catalyst with 10 mg of methyl
viologen dichloride are suspended in 50 mL of 01 M KNO3 aqueous solution at room
temperature Pt working electrode and AgAgCl reference electrodes
Figure 4 Variation of photovoltage with pH value for HP05 catalyst in the presence (a) and in
the absence (b) of ethanol 50 mg of catalyst with 10 mg of methyl viologen dichloride are
suspended in 50 mL of 01 M KNO3 aqueous solution at room temperature Pt working electrode
and AgAgCl reference electrodes For (b) case 5 ml of ethanol have been added to suspension
Figure 5 Time-resolved ATR-FTIR spectra of HP05 thin film recorded during adsorption of
water and benzyl alcohol (BA) vapours at room temperature The arrows indicate the time when
each adsorbate was introduced in the cell The spectrum of neat benzyl alcohol () multiplied by
a factor 001 has been included for comparison
Figure 6 Time evolution of the integrated absorbance of IR bands at 1640 cm-1 (water) 1208
cm-1 (benzyl alcohol BA) and 2975 cm-1 (ethanol EA) determined from ATR-FTIR spectra
recorded during adsorption of water and benzyl alcohol (top) and water benzyl alcohol and
ethanol (bottom) on HP05 (left) and Degussa P25 (right) samples Zero time corresponds to
introduction of BA into the cell EA was introduced in the cell 10 min after BA
Figure 7 Time-resolved ATR-FTIR spectra of Degussa P25 thin film recorded during adsorption
of water and benzyl alcohol (BA) vapours at room temperature The arrows indicate the time
18
when each adsorbate was introduced in the cell The spectrum of neat benzyl alcohol ()
multiplied by a factor 001 has been included for comparison
Figure 8 Time-resolved ATR-FTIR spectra recorded during irradiation of HP05 thin film in an
atmosphere of synthetic air saturated with water and benzyl alcohol The arrows indicate the time
when UV lamp was switched on (it took around 2 min to reach full power) and off
Figure 9 Time-resolved ATR-FTIR spectra recorded during irradiation of Degussa P25 thin film
in an atmosphere of synthetic air saturated with water and benzyl alcohol The arrows indicate the
time when UV lamp was switched on (it took around 2 min to reach full power)
Figure 10 Time-resolved ATR-FTIR spectra of Degussa P25 (left) and HP05 (right) thin films
recorded during adsorption of water benzyl alcohol (BA) and ethanol (EA) vapours at room
temperature The arrows indicate the time when each adsorbate was introduced in the cell
Figure 11 Time-resolved ATR-FTIR spectra recorded during irradiation of Degussa P25 (left)
and HP05 (right) thin film in an atmosphere of synthetic air saturated with water benzyl alcohol
and ethanol The arrows indicate the time when UV lamp was switched on (it took around 2 min
to reach full power) and off Spectra of Degussa P25 sample recorded after switching off the
lamp have been shifted upwards by 012 absorbance units for clarity
Table 1 Photoelectrochemical properties of catalysts
19
1 2 3 4 5 6 700
02
04
06
08
10
12
14
16
(F(R
infin )
E)1
2
E eV
b)
Figure 1
1 2 3 4 5 6 700
02
04
06
08
10
12
14
16
(F(R
infin )
E)1
2
E eV
a)
20
0
5
10
15
20
25
0
002
004
006
008
01
012
014
0 200 400 600 800
Temperature [degC]
Wei
ght d
eriv
ativ
e [m
gdegC
]
Mas
s lo
ss [m
g]
0
5
10
15
20
25
0
002
004
006
008
01
012
014
0 200 400 600 800
Temperature [degC]
Wei
ght d
eriv
ativ
e [m
gdegC
]
0
5
10
15
20
25
0
002
004
006
008
01
012
014
0 200 400 600 800
Temperature [degC]
Wei
ght d
eriv
ativ
e [m
gdegC
]
Mas
s lo
ss [m
g]
Figure 2
21
1 2 3 4 5 6 7 8 9 10
-04
-02
00
02
04
06 HP05 HP2 HP4 HP6 HP8
E V
pH
pH0=58 pH0=82
Figure 3
22
1 2 3 4 5 6 7 8 9
-02
00
02
04
06 a) b)
E V
pH
pH0=47 pH0=59
Figure 4
23
1600 1400 1200 10003600 3400 3200 3000 2800
10411455
1006
1018
1035
1079
1208
40
20 tim
e (m
in)
Wavenumber (cm-1)
Abs
orba
nce
0
60
005 au
1497
H2OBA
1369
01 au
Figure 5
24
000
005
010
015
H2O (x001)
BABA
H2O (x01)
0 10 20 30 40000
005
010
015
EA (x01)
H2O (x001)Inte
grat
ed a
bsor
banc
e (c
m-1)
Time (min)
BA
0 10 20 30 40
EA (x01)
BA
H2O (x01)
Figure 6
25
1600 1400 1200 10003600 3400 3200 3000 2800
1037
1454
1208
40
20 tim
e (m
in)
Wavenumber (cm-1)
Abs
orba
nce
0
60
0005 au
1498
H2OBA
1372
1602
1584 14
13
1340
1156
3092
001 au
3069
3037
2963
2941
2885
2801
Figure 7
26
1800 1600 1400 1200 1000
1412
1450
1275
20
10
tim
e (m
in)
Wavenumber (cm-1)Ab
sorb
ance
0
30
01 au
UV lamp ON
UV lamp OFF
Figure 8
27
1600 1400 1200 1000
1496
1530
1451
20
10
tim
e (m
in)
Wavenumber (cm-1)Ab
sorb
ance
0
001 au
UV lamp ON
1711 16
86
1603
1415
1403
1274
1246
1645
Figure 9
28
1600 1400 1200 10001600 1400 1200 1000
40
20 tim
e (m
in)
Wavenumber (cm-1)
Abso
rban
ce
0
005 au
H2O
BA
EA
002 au
Figure 10
29
1600 1400 1200 10001600 1400 1200 1000
20
30
10 tim
e (m
in)
Wavenumber (cm-1)
Abso
rban
ce
0
005 au
UV lamp ON
UV lamp OFF
1565
1522 14
0713
50
1540 14
5014
14
1685 1602
1650
1710
1270
005 au
Figure 11
30
Table 1
Catalyst Band gap
[eV]
Efb (pH=7)
[V]
VB edge[V]
Degussa P25
326 ndash 055 ndash 064a
271
Merck 322 ndash 043 279 HP05
336 ndash 052
ndash 058a 284
HP2 336 ndash 052 284 HP4 336 ndash 052 284 HP6 326 ndash 052 274 HP8 311 ndash 037 274
a values obtained in the presence of ethanol

14
exhibited by the photocatalysts could arise hence more from different properties of their surfaces
rather than from semiconducting ones
From the ATR-FTIR analysis it can be concluded that two main differences between
HP05 and Degussa P25 surfaces exist On one hand their dissimilar hydrophilicity is relevant A
much higher amount of molecular water is indeed present on the former sample in comparison to
the latter On the other hand the ability in adsorbing the organic compounds deriving from BA
photocatalytic oxidation is quite lower for the home prepared catalyst as compared to the
commercial one
On this basis the highest selectivity of HP05 sample towards BA partial oxidation can be
ascribed to its low affinity for benzaldehyde adsorption on one hand and to the lowest
mineralization promoted on the other hand It can be postulated that the higher hydrophilicity of
HP05 sample compared to Degussa P25 plays an important role in connection with the latter
effect as the high coverage of the HP05 surface by water molecules might result in a
competition for adsorption sites
Bearing in mind the difficulty of stating clear correlations between photoreactivity and
catalysts features the following considerations may be drawn The photoactivity results [1]
obtained with HP05 catalyst show a low oxidation rate of benzyl alcohol but a high selectivity to
benzaldehyde The present study shows that the surface of HP05 catalyst is rich in molecularly
adsorbed water which is able to displace BA molecules in the dark Under irradiation water
displaces benzyl alcohol more effectively and determines a very low coverage of alcohol
molecules on HP surface It is likely that this low coverage is responsible for the low oxidation
rate of benzyl alcohol On the other hand the high water content might account for the high
selectivity to benzaldehyde assuming that water compete with BA molecules for the adsorption
on mineralization sites The presence of ethanol lowers the BA amount on HP surface thus
determining a strong decrease of the overall alcohol oxidation rate Molecularly adsorbed water is
also partly displaced by ethanol but the selectivity to benzaldehyde is increased One plausible
explanation is that ethanol is predominantly adsorbed on mineralization sites
For Degussa P25 the reactivity results indicate that the mineralization pathway
predominates over the partial oxidizing one As compared to HP05 this catalyst shows a higher
coverage of benzyl alcohol and smaller water content so that the ratio between water and benzyl
alcohol is low and therefore it is likely that mineralization sites are not preferentially occupied
15
by water molecules The addition of ethanol determines a strong decrease of benzyl alcohol
coverage while the water content is poorly modified For this catalyst neither the benzyl alcohol
oxidation rate nor the selectivity to benzaldehyde is affected by ethanol so that it may be
hypothesised that under irradiation the benzyl alcohol and water coverages on P25 surface remain
unaltered and therefore also the partial oxidation and mineralization pathways
ACKNOWLEDGEMENTS
Eng Dr Fabio DrsquoAgostino is gratefully acknowledged for the execution of TG measurements
16
REFERENCES 1 V Augugliaro H Kisch V Loddo M J Loacutepez-Muntildeoz C Maacuterquez-Aacutelvarez G
Palmisano L Palmisano F Parrino S Yurdakal Appl Catal A Gen (2008)
(submitted) 2 G Palmisano S Yurdakal V Augugliaro V Loddo L Palmisano Adv Synth Catal
349 (2007) 964
3 G Kortuumlm Reflectance Spectroscopy Principles Methods Applications Springer-
Verlag New York 1969
4 A M Roy G C De N Sasmal S S Bhattacharyya Int J Hydrogen Energy 20 (1995)
627
5 J Tauc R Grigorovici A Vanuc Phys Stat Sol 15 (1996) 627
6 G Redmond D Fitzmaurice J Phys Chem 97 (1993) 1426
7 C Keresszegi D Ferri T Mallat A J Baiker J Phys Chem B 109 (2005) 958
8 K D Dobson A J McQillan Spectrochim Acta Part A 55 (1999) 1395
9 H Lampert W Mikenda A Karpfen J Phys Chem A 101 (1997) 2254
10 A M Johnson S Trakhtenberg A S Cannon J C Warner J Phys Chem A 111
(2007) 8139
11 K S Finnie J R Bartlett J L Woolfrey Langmuir 14 (1998) 2744
12 S Tunesi M Anderson Langmuir 8 (1992) 487
13 M Boczar K Szczeponek M J Woacutejcik C Paluszkiewicz J Mol Structure 700 (2004)
39
14 I Dolamic T Buumlrgi J Phys Chem B 110 (2006) 14898
15 D V Kozlov E A Paukshtis E N Savinov Appl Catal B Environ 24 (2000) L7
16 D S Warren A J McQuillan J Phys Chem B 108 (2004) 19373
17
CAPTIONS
Figure 1 Transformed diffuse reflectance spectra of (a) HP05 and (b) HP8
Figure 2 Thermogravimetric (dotted lines) and time derivative (continuous lines) curves in air of
HP05 ( ) and Degussa P25 ( )
Figure 3 Variation of photovoltage with pH value 50 mg of catalyst with 10 mg of methyl
viologen dichloride are suspended in 50 mL of 01 M KNO3 aqueous solution at room
temperature Pt working electrode and AgAgCl reference electrodes
Figure 4 Variation of photovoltage with pH value for HP05 catalyst in the presence (a) and in
the absence (b) of ethanol 50 mg of catalyst with 10 mg of methyl viologen dichloride are
suspended in 50 mL of 01 M KNO3 aqueous solution at room temperature Pt working electrode
and AgAgCl reference electrodes For (b) case 5 ml of ethanol have been added to suspension
Figure 5 Time-resolved ATR-FTIR spectra of HP05 thin film recorded during adsorption of
water and benzyl alcohol (BA) vapours at room temperature The arrows indicate the time when
each adsorbate was introduced in the cell The spectrum of neat benzyl alcohol () multiplied by
a factor 001 has been included for comparison
Figure 6 Time evolution of the integrated absorbance of IR bands at 1640 cm-1 (water) 1208
cm-1 (benzyl alcohol BA) and 2975 cm-1 (ethanol EA) determined from ATR-FTIR spectra
recorded during adsorption of water and benzyl alcohol (top) and water benzyl alcohol and
ethanol (bottom) on HP05 (left) and Degussa P25 (right) samples Zero time corresponds to
introduction of BA into the cell EA was introduced in the cell 10 min after BA
Figure 7 Time-resolved ATR-FTIR spectra of Degussa P25 thin film recorded during adsorption
of water and benzyl alcohol (BA) vapours at room temperature The arrows indicate the time
18
when each adsorbate was introduced in the cell The spectrum of neat benzyl alcohol ()
multiplied by a factor 001 has been included for comparison
Figure 8 Time-resolved ATR-FTIR spectra recorded during irradiation of HP05 thin film in an
atmosphere of synthetic air saturated with water and benzyl alcohol The arrows indicate the time
when UV lamp was switched on (it took around 2 min to reach full power) and off
Figure 9 Time-resolved ATR-FTIR spectra recorded during irradiation of Degussa P25 thin film
in an atmosphere of synthetic air saturated with water and benzyl alcohol The arrows indicate the
time when UV lamp was switched on (it took around 2 min to reach full power)
Figure 10 Time-resolved ATR-FTIR spectra of Degussa P25 (left) and HP05 (right) thin films
recorded during adsorption of water benzyl alcohol (BA) and ethanol (EA) vapours at room
temperature The arrows indicate the time when each adsorbate was introduced in the cell
Figure 11 Time-resolved ATR-FTIR spectra recorded during irradiation of Degussa P25 (left)
and HP05 (right) thin film in an atmosphere of synthetic air saturated with water benzyl alcohol
and ethanol The arrows indicate the time when UV lamp was switched on (it took around 2 min
to reach full power) and off Spectra of Degussa P25 sample recorded after switching off the
lamp have been shifted upwards by 012 absorbance units for clarity
Table 1 Photoelectrochemical properties of catalysts
19
1 2 3 4 5 6 700
02
04
06
08
10
12
14
16
(F(R
infin )
E)1
2
E eV
b)
Figure 1
1 2 3 4 5 6 700
02
04
06
08
10
12
14
16
(F(R
infin )
E)1
2
E eV
a)
20
0
5
10
15
20
25
0
002
004
006
008
01
012
014
0 200 400 600 800
Temperature [degC]
Wei
ght d
eriv
ativ
e [m
gdegC
]
Mas
s lo
ss [m
g]
0
5
10
15
20
25
0
002
004
006
008
01
012
014
0 200 400 600 800
Temperature [degC]
Wei
ght d
eriv
ativ
e [m
gdegC
]
0
5
10
15
20
25
0
002
004
006
008
01
012
014
0 200 400 600 800
Temperature [degC]
Wei
ght d
eriv
ativ
e [m
gdegC
]
Mas
s lo
ss [m
g]
Figure 2
21
1 2 3 4 5 6 7 8 9 10
-04
-02
00
02
04
06 HP05 HP2 HP4 HP6 HP8
E V
pH
pH0=58 pH0=82
Figure 3
22
1 2 3 4 5 6 7 8 9
-02
00
02
04
06 a) b)
E V
pH
pH0=47 pH0=59
Figure 4
23
1600 1400 1200 10003600 3400 3200 3000 2800
10411455
1006
1018
1035
1079
1208
40
20 tim
e (m
in)
Wavenumber (cm-1)
Abs
orba
nce
0
60
005 au
1497
H2OBA
1369
01 au
Figure 5
24
000
005
010
015
H2O (x001)
BABA
H2O (x01)
0 10 20 30 40000
005
010
015
EA (x01)
H2O (x001)Inte
grat
ed a
bsor
banc
e (c
m-1)
Time (min)
BA
0 10 20 30 40
EA (x01)
BA
H2O (x01)
Figure 6
25
1600 1400 1200 10003600 3400 3200 3000 2800
1037
1454
1208
40
20 tim
e (m
in)
Wavenumber (cm-1)
Abs
orba
nce
0
60
0005 au
1498
H2OBA
1372
1602
1584 14
13
1340
1156
3092
001 au
3069
3037
2963
2941
2885
2801
Figure 7
26
1800 1600 1400 1200 1000
1412
1450
1275
20
10
tim
e (m
in)
Wavenumber (cm-1)Ab
sorb
ance
0
30
01 au
UV lamp ON
UV lamp OFF
Figure 8
27
1600 1400 1200 1000
1496
1530
1451
20
10
tim
e (m
in)
Wavenumber (cm-1)Ab
sorb
ance
0
001 au
UV lamp ON
1711 16
86
1603
1415
1403
1274
1246
1645
Figure 9
28
1600 1400 1200 10001600 1400 1200 1000
40
20 tim
e (m
in)
Wavenumber (cm-1)
Abso
rban
ce
0
005 au
H2O
BA
EA
002 au
Figure 10
29
1600 1400 1200 10001600 1400 1200 1000
20
30
10 tim
e (m
in)
Wavenumber (cm-1)
Abso
rban
ce
0
005 au
UV lamp ON
UV lamp OFF
1565
1522 14
0713
50
1540 14
5014
14
1685 1602
1650
1710
1270
005 au
Figure 11
30
Table 1
Catalyst Band gap
[eV]
Efb (pH=7)
[V]
VB edge[V]
Degussa P25
326 ndash 055 ndash 064a
271
Merck 322 ndash 043 279 HP05
336 ndash 052
ndash 058a 284
HP2 336 ndash 052 284 HP4 336 ndash 052 284 HP6 326 ndash 052 274 HP8 311 ndash 037 274
a values obtained in the presence of ethanol

15
by water molecules The addition of ethanol determines a strong decrease of benzyl alcohol
coverage while the water content is poorly modified For this catalyst neither the benzyl alcohol
oxidation rate nor the selectivity to benzaldehyde is affected by ethanol so that it may be
hypothesised that under irradiation the benzyl alcohol and water coverages on P25 surface remain
unaltered and therefore also the partial oxidation and mineralization pathways
ACKNOWLEDGEMENTS
Eng Dr Fabio DrsquoAgostino is gratefully acknowledged for the execution of TG measurements
16
REFERENCES 1 V Augugliaro H Kisch V Loddo M J Loacutepez-Muntildeoz C Maacuterquez-Aacutelvarez G
Palmisano L Palmisano F Parrino S Yurdakal Appl Catal A Gen (2008)
(submitted) 2 G Palmisano S Yurdakal V Augugliaro V Loddo L Palmisano Adv Synth Catal
349 (2007) 964
3 G Kortuumlm Reflectance Spectroscopy Principles Methods Applications Springer-
Verlag New York 1969
4 A M Roy G C De N Sasmal S S Bhattacharyya Int J Hydrogen Energy 20 (1995)
627
5 J Tauc R Grigorovici A Vanuc Phys Stat Sol 15 (1996) 627
6 G Redmond D Fitzmaurice J Phys Chem 97 (1993) 1426
7 C Keresszegi D Ferri T Mallat A J Baiker J Phys Chem B 109 (2005) 958
8 K D Dobson A J McQillan Spectrochim Acta Part A 55 (1999) 1395
9 H Lampert W Mikenda A Karpfen J Phys Chem A 101 (1997) 2254
10 A M Johnson S Trakhtenberg A S Cannon J C Warner J Phys Chem A 111
(2007) 8139
11 K S Finnie J R Bartlett J L Woolfrey Langmuir 14 (1998) 2744
12 S Tunesi M Anderson Langmuir 8 (1992) 487
13 M Boczar K Szczeponek M J Woacutejcik C Paluszkiewicz J Mol Structure 700 (2004)
39
14 I Dolamic T Buumlrgi J Phys Chem B 110 (2006) 14898
15 D V Kozlov E A Paukshtis E N Savinov Appl Catal B Environ 24 (2000) L7
16 D S Warren A J McQuillan J Phys Chem B 108 (2004) 19373
17
CAPTIONS
Figure 1 Transformed diffuse reflectance spectra of (a) HP05 and (b) HP8
Figure 2 Thermogravimetric (dotted lines) and time derivative (continuous lines) curves in air of
HP05 ( ) and Degussa P25 ( )
Figure 3 Variation of photovoltage with pH value 50 mg of catalyst with 10 mg of methyl
viologen dichloride are suspended in 50 mL of 01 M KNO3 aqueous solution at room
temperature Pt working electrode and AgAgCl reference electrodes
Figure 4 Variation of photovoltage with pH value for HP05 catalyst in the presence (a) and in
the absence (b) of ethanol 50 mg of catalyst with 10 mg of methyl viologen dichloride are
suspended in 50 mL of 01 M KNO3 aqueous solution at room temperature Pt working electrode
and AgAgCl reference electrodes For (b) case 5 ml of ethanol have been added to suspension
Figure 5 Time-resolved ATR-FTIR spectra of HP05 thin film recorded during adsorption of
water and benzyl alcohol (BA) vapours at room temperature The arrows indicate the time when
each adsorbate was introduced in the cell The spectrum of neat benzyl alcohol () multiplied by
a factor 001 has been included for comparison
Figure 6 Time evolution of the integrated absorbance of IR bands at 1640 cm-1 (water) 1208
cm-1 (benzyl alcohol BA) and 2975 cm-1 (ethanol EA) determined from ATR-FTIR spectra
recorded during adsorption of water and benzyl alcohol (top) and water benzyl alcohol and
ethanol (bottom) on HP05 (left) and Degussa P25 (right) samples Zero time corresponds to
introduction of BA into the cell EA was introduced in the cell 10 min after BA
Figure 7 Time-resolved ATR-FTIR spectra of Degussa P25 thin film recorded during adsorption
of water and benzyl alcohol (BA) vapours at room temperature The arrows indicate the time
18
when each adsorbate was introduced in the cell The spectrum of neat benzyl alcohol ()
multiplied by a factor 001 has been included for comparison
Figure 8 Time-resolved ATR-FTIR spectra recorded during irradiation of HP05 thin film in an
atmosphere of synthetic air saturated with water and benzyl alcohol The arrows indicate the time
when UV lamp was switched on (it took around 2 min to reach full power) and off
Figure 9 Time-resolved ATR-FTIR spectra recorded during irradiation of Degussa P25 thin film
in an atmosphere of synthetic air saturated with water and benzyl alcohol The arrows indicate the
time when UV lamp was switched on (it took around 2 min to reach full power)
Figure 10 Time-resolved ATR-FTIR spectra of Degussa P25 (left) and HP05 (right) thin films
recorded during adsorption of water benzyl alcohol (BA) and ethanol (EA) vapours at room
temperature The arrows indicate the time when each adsorbate was introduced in the cell
Figure 11 Time-resolved ATR-FTIR spectra recorded during irradiation of Degussa P25 (left)
and HP05 (right) thin film in an atmosphere of synthetic air saturated with water benzyl alcohol
and ethanol The arrows indicate the time when UV lamp was switched on (it took around 2 min
to reach full power) and off Spectra of Degussa P25 sample recorded after switching off the
lamp have been shifted upwards by 012 absorbance units for clarity
Table 1 Photoelectrochemical properties of catalysts
19
1 2 3 4 5 6 700
02
04
06
08
10
12
14
16
(F(R
infin )
E)1
2
E eV
b)
Figure 1
1 2 3 4 5 6 700
02
04
06
08
10
12
14
16
(F(R
infin )
E)1
2
E eV
a)
20
0
5
10
15
20
25
0
002
004
006
008
01
012
014
0 200 400 600 800
Temperature [degC]
Wei
ght d
eriv
ativ
e [m
gdegC
]
Mas
s lo
ss [m
g]
0
5
10
15
20
25
0
002
004
006
008
01
012
014
0 200 400 600 800
Temperature [degC]
Wei
ght d
eriv
ativ
e [m
gdegC
]
0
5
10
15
20
25
0
002
004
006
008
01
012
014
0 200 400 600 800
Temperature [degC]
Wei
ght d
eriv
ativ
e [m
gdegC
]
Mas
s lo
ss [m
g]
Figure 2
21
1 2 3 4 5 6 7 8 9 10
-04
-02
00
02
04
06 HP05 HP2 HP4 HP6 HP8
E V
pH
pH0=58 pH0=82
Figure 3
22
1 2 3 4 5 6 7 8 9
-02
00
02
04
06 a) b)
E V
pH
pH0=47 pH0=59
Figure 4
23
1600 1400 1200 10003600 3400 3200 3000 2800
10411455
1006
1018
1035
1079
1208
40
20 tim
e (m
in)
Wavenumber (cm-1)
Abs
orba
nce
0
60
005 au
1497
H2OBA
1369
01 au
Figure 5
24
000
005
010
015
H2O (x001)
BABA
H2O (x01)
0 10 20 30 40000
005
010
015
EA (x01)
H2O (x001)Inte
grat
ed a
bsor
banc
e (c
m-1)
Time (min)
BA
0 10 20 30 40
EA (x01)
BA
H2O (x01)
Figure 6
25
1600 1400 1200 10003600 3400 3200 3000 2800
1037
1454
1208
40
20 tim
e (m
in)
Wavenumber (cm-1)
Abs
orba
nce
0
60
0005 au
1498
H2OBA
1372
1602
1584 14
13
1340
1156
3092
001 au
3069
3037
2963
2941
2885
2801
Figure 7
26
1800 1600 1400 1200 1000
1412
1450
1275
20
10
tim
e (m
in)
Wavenumber (cm-1)Ab
sorb
ance
0
30
01 au
UV lamp ON
UV lamp OFF
Figure 8
27
1600 1400 1200 1000
1496
1530
1451
20
10
tim
e (m
in)
Wavenumber (cm-1)Ab
sorb
ance
0
001 au
UV lamp ON
1711 16
86
1603
1415
1403
1274
1246
1645
Figure 9
28
1600 1400 1200 10001600 1400 1200 1000
40
20 tim
e (m
in)
Wavenumber (cm-1)
Abso
rban
ce
0
005 au
H2O
BA
EA
002 au
Figure 10
29
1600 1400 1200 10001600 1400 1200 1000
20
30
10 tim
e (m
in)
Wavenumber (cm-1)
Abso
rban
ce
0
005 au
UV lamp ON
UV lamp OFF
1565
1522 14
0713
50
1540 14
5014
14
1685 1602
1650
1710
1270
005 au
Figure 11
30
Table 1
Catalyst Band gap
[eV]
Efb (pH=7)
[V]
VB edge[V]
Degussa P25
326 ndash 055 ndash 064a
271
Merck 322 ndash 043 279 HP05
336 ndash 052
ndash 058a 284
HP2 336 ndash 052 284 HP4 336 ndash 052 284 HP6 326 ndash 052 274 HP8 311 ndash 037 274
a values obtained in the presence of ethanol

16
REFERENCES 1 V Augugliaro H Kisch V Loddo M J Loacutepez-Muntildeoz C Maacuterquez-Aacutelvarez G
Palmisano L Palmisano F Parrino S Yurdakal Appl Catal A Gen (2008)
(submitted) 2 G Palmisano S Yurdakal V Augugliaro V Loddo L Palmisano Adv Synth Catal
349 (2007) 964
3 G Kortuumlm Reflectance Spectroscopy Principles Methods Applications Springer-
Verlag New York 1969
4 A M Roy G C De N Sasmal S S Bhattacharyya Int J Hydrogen Energy 20 (1995)
627
5 J Tauc R Grigorovici A Vanuc Phys Stat Sol 15 (1996) 627
6 G Redmond D Fitzmaurice J Phys Chem 97 (1993) 1426
7 C Keresszegi D Ferri T Mallat A J Baiker J Phys Chem B 109 (2005) 958
8 K D Dobson A J McQillan Spectrochim Acta Part A 55 (1999) 1395
9 H Lampert W Mikenda A Karpfen J Phys Chem A 101 (1997) 2254
10 A M Johnson S Trakhtenberg A S Cannon J C Warner J Phys Chem A 111
(2007) 8139
11 K S Finnie J R Bartlett J L Woolfrey Langmuir 14 (1998) 2744
12 S Tunesi M Anderson Langmuir 8 (1992) 487
13 M Boczar K Szczeponek M J Woacutejcik C Paluszkiewicz J Mol Structure 700 (2004)
39
14 I Dolamic T Buumlrgi J Phys Chem B 110 (2006) 14898
15 D V Kozlov E A Paukshtis E N Savinov Appl Catal B Environ 24 (2000) L7
16 D S Warren A J McQuillan J Phys Chem B 108 (2004) 19373
17
CAPTIONS
Figure 1 Transformed diffuse reflectance spectra of (a) HP05 and (b) HP8
Figure 2 Thermogravimetric (dotted lines) and time derivative (continuous lines) curves in air of
HP05 ( ) and Degussa P25 ( )
Figure 3 Variation of photovoltage with pH value 50 mg of catalyst with 10 mg of methyl
viologen dichloride are suspended in 50 mL of 01 M KNO3 aqueous solution at room
temperature Pt working electrode and AgAgCl reference electrodes
Figure 4 Variation of photovoltage with pH value for HP05 catalyst in the presence (a) and in
the absence (b) of ethanol 50 mg of catalyst with 10 mg of methyl viologen dichloride are
suspended in 50 mL of 01 M KNO3 aqueous solution at room temperature Pt working electrode
and AgAgCl reference electrodes For (b) case 5 ml of ethanol have been added to suspension
Figure 5 Time-resolved ATR-FTIR spectra of HP05 thin film recorded during adsorption of
water and benzyl alcohol (BA) vapours at room temperature The arrows indicate the time when
each adsorbate was introduced in the cell The spectrum of neat benzyl alcohol () multiplied by
a factor 001 has been included for comparison
Figure 6 Time evolution of the integrated absorbance of IR bands at 1640 cm-1 (water) 1208
cm-1 (benzyl alcohol BA) and 2975 cm-1 (ethanol EA) determined from ATR-FTIR spectra
recorded during adsorption of water and benzyl alcohol (top) and water benzyl alcohol and
ethanol (bottom) on HP05 (left) and Degussa P25 (right) samples Zero time corresponds to
introduction of BA into the cell EA was introduced in the cell 10 min after BA
Figure 7 Time-resolved ATR-FTIR spectra of Degussa P25 thin film recorded during adsorption
of water and benzyl alcohol (BA) vapours at room temperature The arrows indicate the time
18
when each adsorbate was introduced in the cell The spectrum of neat benzyl alcohol ()
multiplied by a factor 001 has been included for comparison
Figure 8 Time-resolved ATR-FTIR spectra recorded during irradiation of HP05 thin film in an
atmosphere of synthetic air saturated with water and benzyl alcohol The arrows indicate the time
when UV lamp was switched on (it took around 2 min to reach full power) and off
Figure 9 Time-resolved ATR-FTIR spectra recorded during irradiation of Degussa P25 thin film
in an atmosphere of synthetic air saturated with water and benzyl alcohol The arrows indicate the
time when UV lamp was switched on (it took around 2 min to reach full power)
Figure 10 Time-resolved ATR-FTIR spectra of Degussa P25 (left) and HP05 (right) thin films
recorded during adsorption of water benzyl alcohol (BA) and ethanol (EA) vapours at room
temperature The arrows indicate the time when each adsorbate was introduced in the cell
Figure 11 Time-resolved ATR-FTIR spectra recorded during irradiation of Degussa P25 (left)
and HP05 (right) thin film in an atmosphere of synthetic air saturated with water benzyl alcohol
and ethanol The arrows indicate the time when UV lamp was switched on (it took around 2 min
to reach full power) and off Spectra of Degussa P25 sample recorded after switching off the
lamp have been shifted upwards by 012 absorbance units for clarity
Table 1 Photoelectrochemical properties of catalysts
19
1 2 3 4 5 6 700
02
04
06
08
10
12
14
16
(F(R
infin )
E)1
2
E eV
b)
Figure 1
1 2 3 4 5 6 700
02
04
06
08
10
12
14
16
(F(R
infin )
E)1
2
E eV
a)
20
0
5
10
15
20
25
0
002
004
006
008
01
012
014
0 200 400 600 800
Temperature [degC]
Wei
ght d
eriv
ativ
e [m
gdegC
]
Mas
s lo
ss [m
g]
0
5
10
15
20
25
0
002
004
006
008
01
012
014
0 200 400 600 800
Temperature [degC]
Wei
ght d
eriv
ativ
e [m
gdegC
]
0
5
10
15
20
25
0
002
004
006
008
01
012
014
0 200 400 600 800
Temperature [degC]
Wei
ght d
eriv
ativ
e [m
gdegC
]
Mas
s lo
ss [m
g]
Figure 2
21
1 2 3 4 5 6 7 8 9 10
-04
-02
00
02
04
06 HP05 HP2 HP4 HP6 HP8
E V
pH
pH0=58 pH0=82
Figure 3
22
1 2 3 4 5 6 7 8 9
-02
00
02
04
06 a) b)
E V
pH
pH0=47 pH0=59
Figure 4
23
1600 1400 1200 10003600 3400 3200 3000 2800
10411455
1006
1018
1035
1079
1208
40
20 tim
e (m
in)
Wavenumber (cm-1)
Abs
orba
nce
0
60
005 au
1497
H2OBA
1369
01 au
Figure 5
24
000
005
010
015
H2O (x001)
BABA
H2O (x01)
0 10 20 30 40000
005
010
015
EA (x01)
H2O (x001)Inte
grat
ed a
bsor
banc
e (c
m-1)
Time (min)
BA
0 10 20 30 40
EA (x01)
BA
H2O (x01)
Figure 6
25
1600 1400 1200 10003600 3400 3200 3000 2800
1037
1454
1208
40
20 tim
e (m
in)
Wavenumber (cm-1)
Abs
orba
nce
0
60
0005 au
1498
H2OBA
1372
1602
1584 14
13
1340
1156
3092
001 au
3069
3037
2963
2941
2885
2801
Figure 7
26
1800 1600 1400 1200 1000
1412
1450
1275
20
10
tim
e (m
in)
Wavenumber (cm-1)Ab
sorb
ance
0
30
01 au
UV lamp ON
UV lamp OFF
Figure 8
27
1600 1400 1200 1000
1496
1530
1451
20
10
tim
e (m
in)
Wavenumber (cm-1)Ab
sorb
ance
0
001 au
UV lamp ON
1711 16
86
1603
1415
1403
1274
1246
1645
Figure 9
28
1600 1400 1200 10001600 1400 1200 1000
40
20 tim
e (m
in)
Wavenumber (cm-1)
Abso
rban
ce
0
005 au
H2O
BA
EA
002 au
Figure 10
29
1600 1400 1200 10001600 1400 1200 1000
20
30
10 tim
e (m
in)
Wavenumber (cm-1)
Abso
rban
ce
0
005 au
UV lamp ON
UV lamp OFF
1565
1522 14
0713
50
1540 14
5014
14
1685 1602
1650
1710
1270
005 au
Figure 11
30
Table 1
Catalyst Band gap
[eV]
Efb (pH=7)
[V]
VB edge[V]
Degussa P25
326 ndash 055 ndash 064a
271
Merck 322 ndash 043 279 HP05
336 ndash 052
ndash 058a 284
HP2 336 ndash 052 284 HP4 336 ndash 052 284 HP6 326 ndash 052 274 HP8 311 ndash 037 274
a values obtained in the presence of ethanol
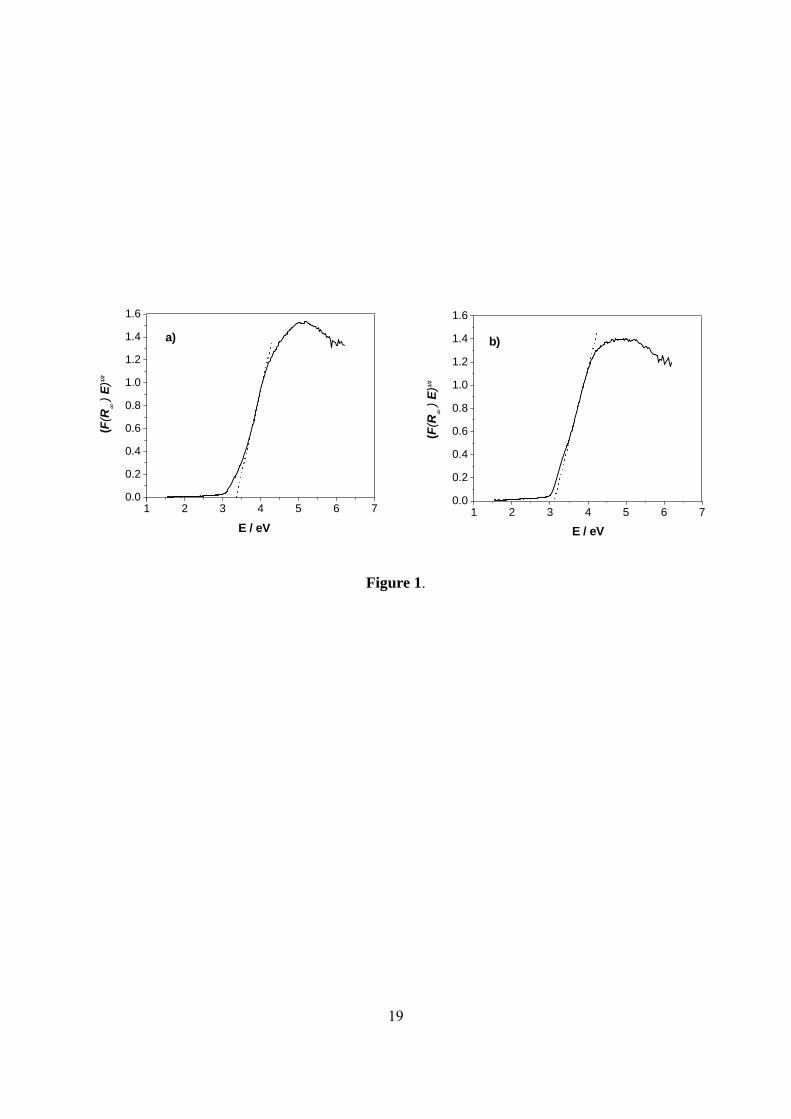

20
0
5
10
15
20
25
0
002
004
006
008
01
012
014
0 200 400 600 800
Temperature [degC]
Wei
ght d
eriv
ativ
e [m
gdegC
]
Mas
s lo
ss [m
g]
0
5
10
15
20
25
0
002
004
006
008
01
012
014
0 200 400 600 800
Temperature [degC]
Wei
ght d
eriv
ativ
e [m
gdegC
]
0
5
10
15
20
25
0
002
004
006
008
01
012
014
0 200 400 600 800
Temperature [degC]
Wei
ght d
eriv
ativ
e [m
gdegC
]
Mas
s lo
ss [m
g]
Figure 2
21
1 2 3 4 5 6 7 8 9 10
-04
-02
00
02
04
06 HP05 HP2 HP4 HP6 HP8
E V
pH
pH0=58 pH0=82
Figure 3
22
1 2 3 4 5 6 7 8 9
-02
00
02
04
06 a) b)
E V
pH
pH0=47 pH0=59
Figure 4
23
1600 1400 1200 10003600 3400 3200 3000 2800
10411455
1006
1018
1035
1079
1208
40
20 tim
e (m
in)
Wavenumber (cm-1)
Abs
orba
nce
0
60
005 au
1497
H2OBA
1369
01 au
Figure 5
24
000
005
010
015
H2O (x001)
BABA
H2O (x01)
0 10 20 30 40000
005
010
015
EA (x01)
H2O (x001)Inte
grat
ed a
bsor
banc
e (c
m-1)
Time (min)
BA
0 10 20 30 40
EA (x01)
BA
H2O (x01)
Figure 6
25
1600 1400 1200 10003600 3400 3200 3000 2800
1037
1454
1208
40
20 tim
e (m
in)
Wavenumber (cm-1)
Abs
orba
nce
0
60
0005 au
1498
H2OBA
1372
1602
1584 14
13
1340
1156
3092
001 au
3069
3037
2963
2941
2885
2801
Figure 7
26
1800 1600 1400 1200 1000
1412
1450
1275
20
10
tim
e (m
in)
Wavenumber (cm-1)Ab
sorb
ance
0
30
01 au
UV lamp ON
UV lamp OFF
Figure 8
27
1600 1400 1200 1000
1496
1530
1451
20
10
tim
e (m
in)
Wavenumber (cm-1)Ab
sorb
ance
0
001 au
UV lamp ON
1711 16
86
1603
1415
1403
1274
1246
1645
Figure 9
28
1600 1400 1200 10001600 1400 1200 1000
40
20 tim
e (m
in)
Wavenumber (cm-1)
Abso
rban
ce
0
005 au
H2O
BA
EA
002 au
Figure 10
29
1600 1400 1200 10001600 1400 1200 1000
20
30
10 tim
e (m
in)
Wavenumber (cm-1)
Abso
rban
ce
0
005 au
UV lamp ON
UV lamp OFF
1565
1522 14
0713
50
1540 14
5014
14
1685 1602
1650
1710
1270
005 au
Figure 11
30
Table 1
Catalyst Band gap
[eV]
Efb (pH=7)
[V]
VB edge[V]
Degussa P25
326 ndash 055 ndash 064a
271
Merck 322 ndash 043 279 HP05
336 ndash 052
ndash 058a 284
HP2 336 ndash 052 284 HP4 336 ndash 052 284 HP6 326 ndash 052 274 HP8 311 ndash 037 274
a values obtained in the presence of ethanol
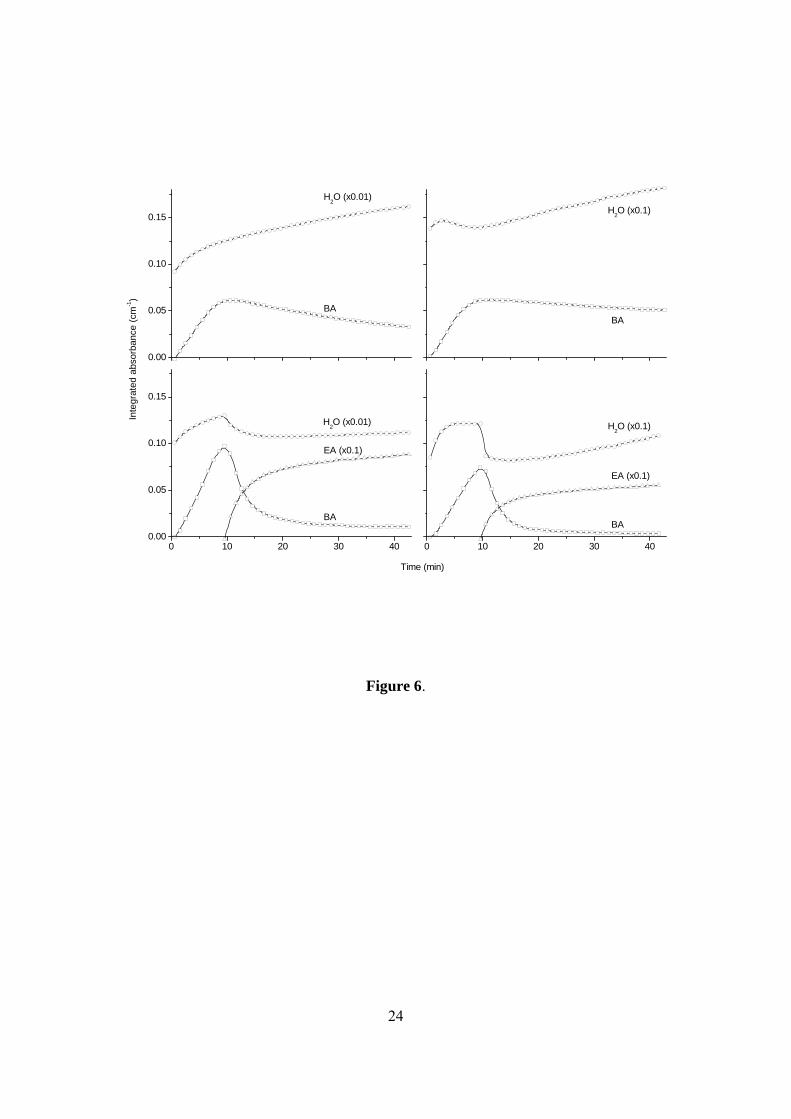

30
Table 1
Catalyst Band gap
[eV]
Efb (pH=7)
[V]
VB edge[V]
Degussa P25
326 ndash 055 ndash 064a
271
Merck 322 ndash 043 279 HP05
336 ndash 052
ndash 058a 284
HP2 336 ndash 052 284 HP4 336 ndash 052 284 HP6 326 ndash 052 274 HP8 311 ndash 037 274
a values obtained in the presence of ethanol