puffers pond figs
TRANSCRIPT

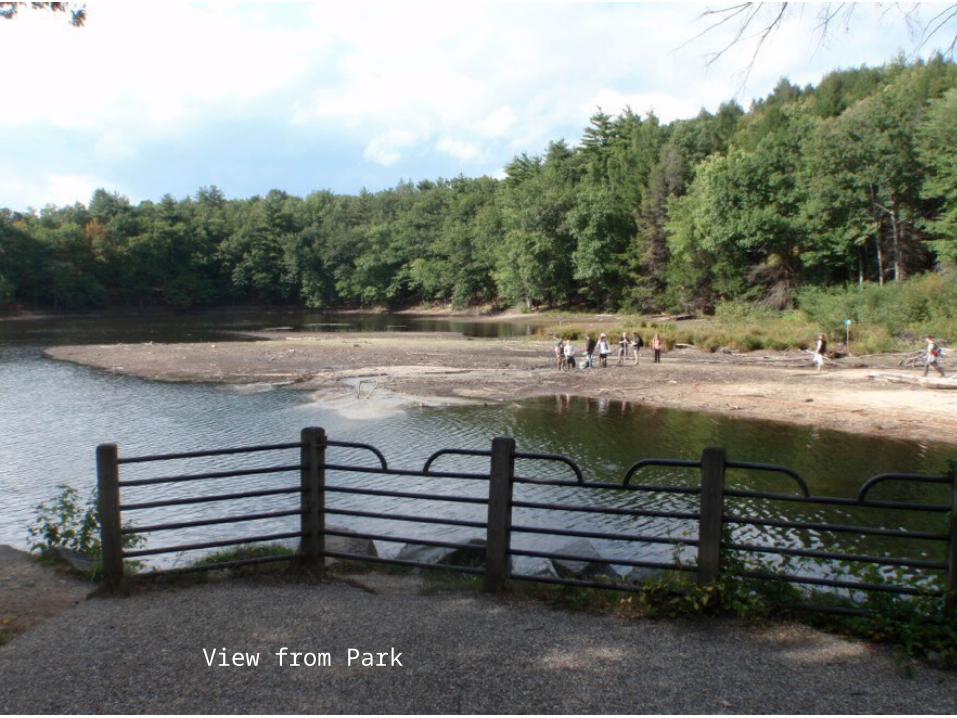
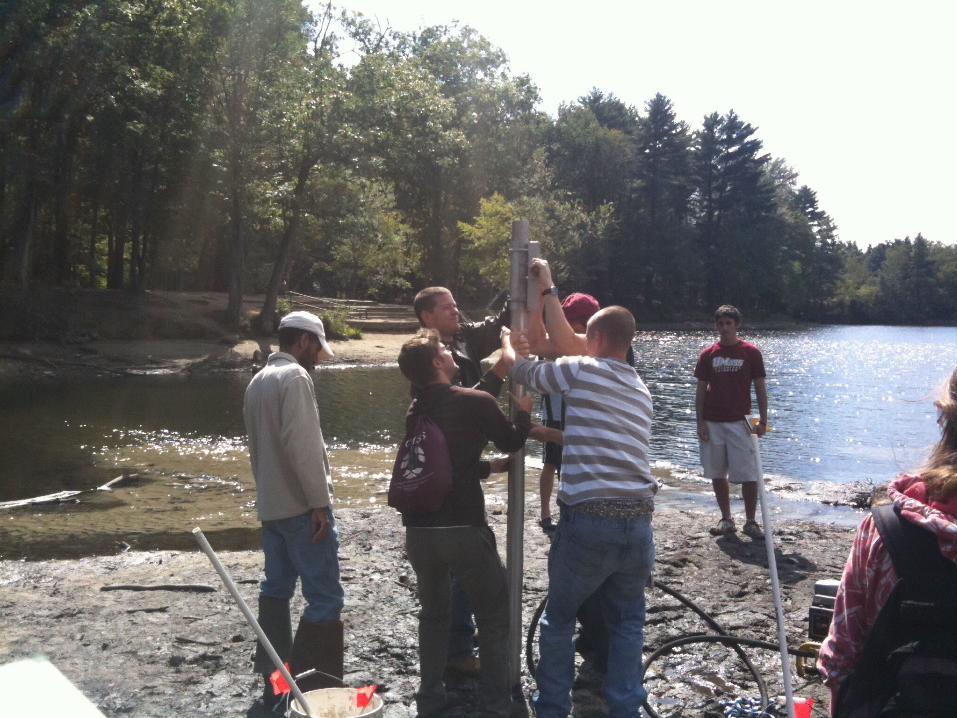
View from Park
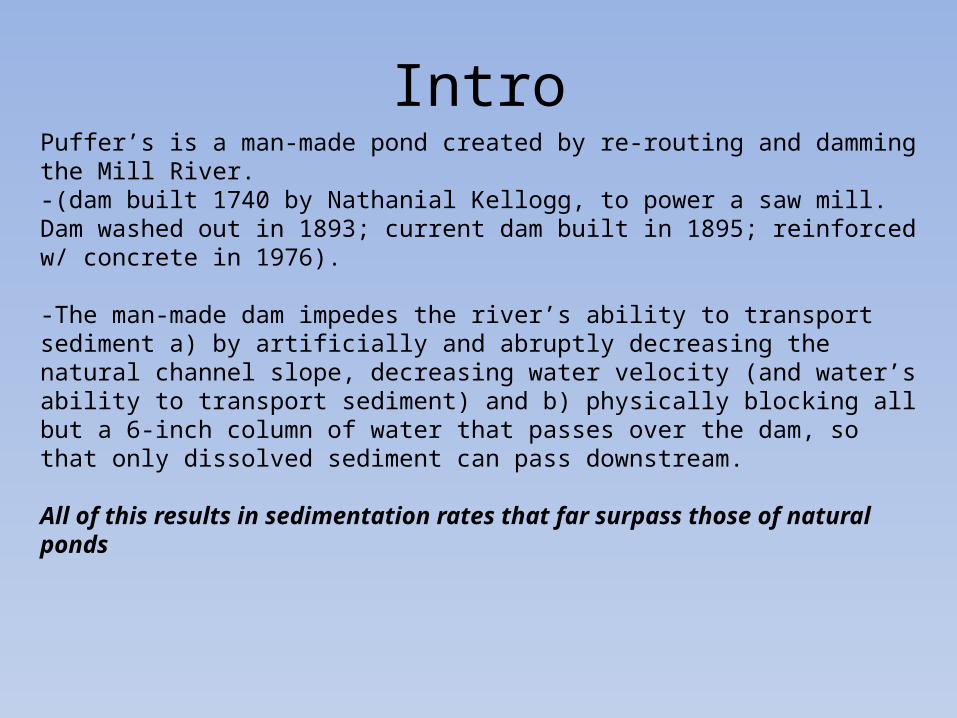
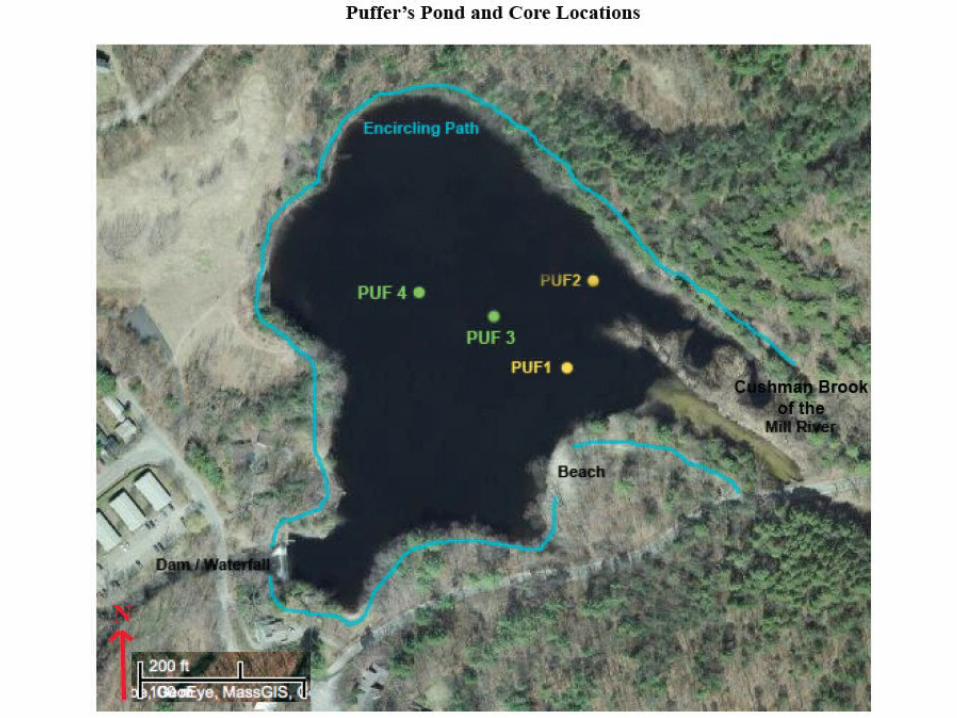
IntroPuffer’s is a man-made pond created by re-routing and damming the Mill River.-(dam built 1740 by Nathanial Kellogg, to power a saw mill. Dam washed out in 1893; current dam built in 1895; reinforced w/ concrete in 1976).
-The man-made dam impedes the river’s ability to transport sediment a) by artificially and abruptly decreasing the natural channel slope, decreasing water velocity (and water’s ability to transport sediment) and b) physically blocking all but a 6-inch column of water that passes over the dam, so that only dissolved sediment can pass downstream.
All of this results in sedimentation rates that far surpass those of natural ponds
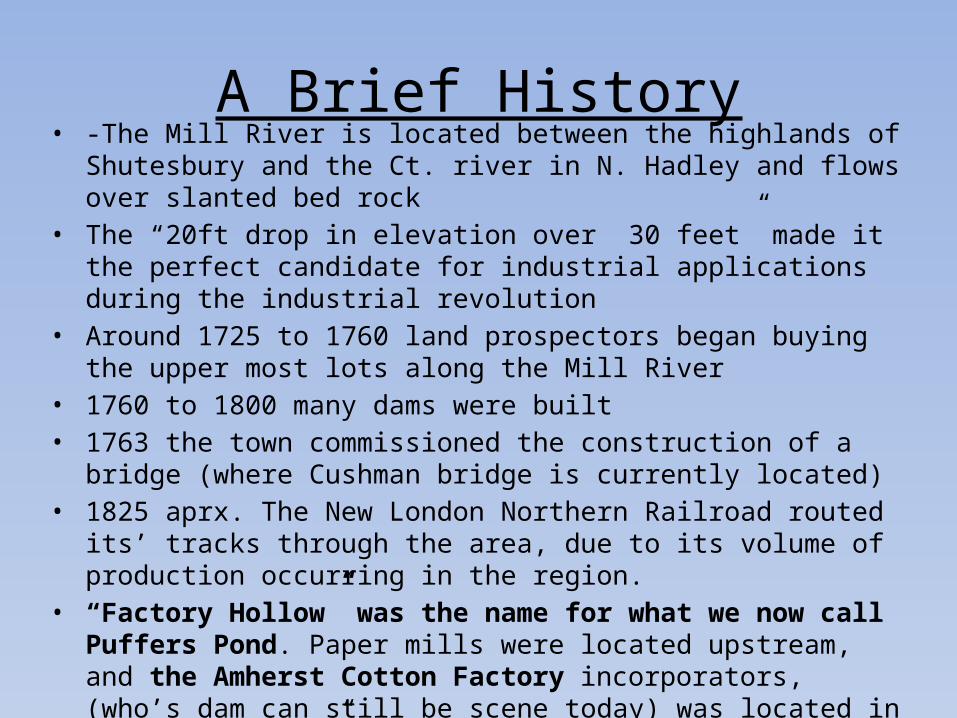
A Brief History• -The Mill River is located between the highlands of Shutesbury and the Ct.
river in N. Hadley and flows over slanted bed rock• The “20ft drop in elevation over 30 feet” made it the perfect candidate for
industrial applications during the industrial revolution • Around 1725 to 1760 land prospectors began buying the upper most lots
along the Mill River • 1760 to 1800 many dams were built• 1763 the town commissioned the construction of a bridge (where
Cushman bridge is currently located)• 1825 aprx. The New London Northern Railroad routed its’ tracks through
the area, due to its volume of production occurring in the region.• “Factory Hollow” was the name for what we now call Puffers Pond. Paper
mills were located upstream, and the Amherst Cotton Factory incorporators, (who’s dam can still be scene today) was located in “Factory Hollow”. West, (further down stream) grist and saw mills could be found along the Mill river, in North Amherst.
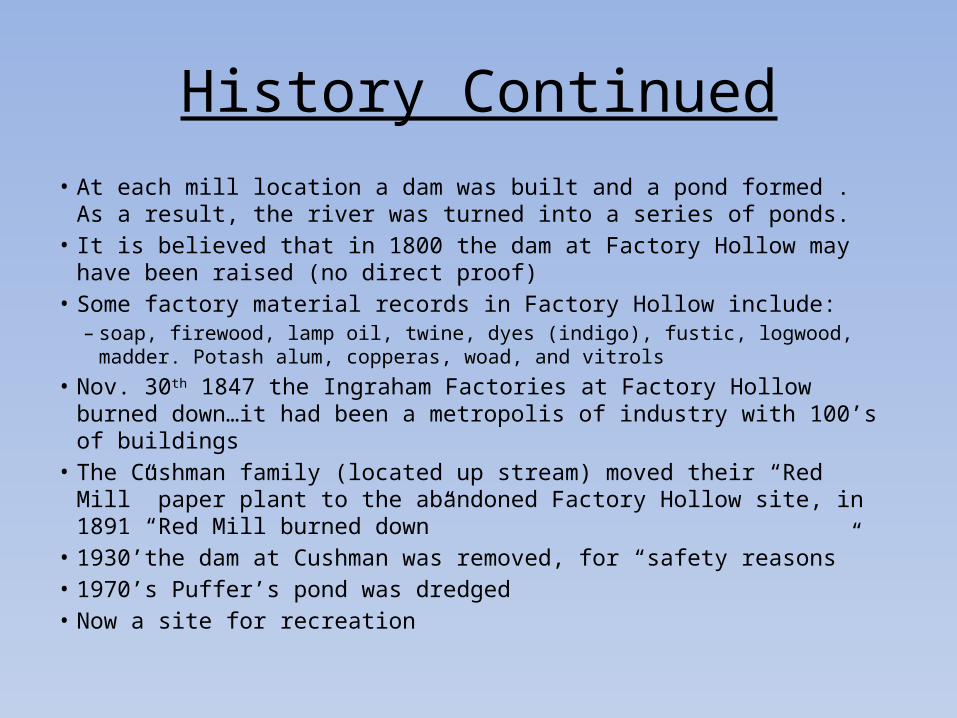
History Continued• At each mill location a dam was built and a pond formed . As a result, the
river was turned into a series of ponds.• It is believed that in 1800 the dam at Factory Hollow may have been raised
(no direct proof)• Some factory material records in Factory Hollow include:
– soap, firewood, lamp oil, twine, dyes (indigo), fustic, logwood, madder. Potash alum, copperas, woad, and vitrols
• Nov. 30th 1847 the Ingraham Factories at Factory Hollow burned down…it had been a metropolis of industry with 100’s of buildings
• The Cushman family (located up stream) moved their “Red Mill” paper plant to the abandoned Factory Hollow site, in 1891 “Red Mill burned down”
• 1930’the dam at Cushman was removed, for “safety reasons” • 1970’s Puffer’s pond was dredged• Now a site for recreation
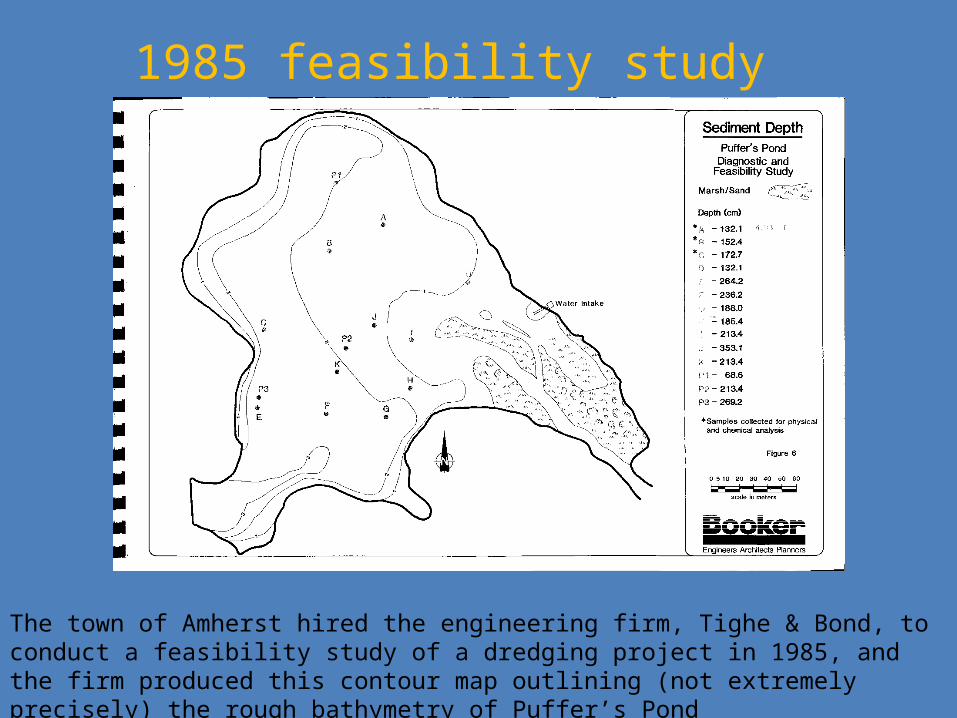
1985 feasibility study
The town of Amherst hired the engineering firm, Tighe & Bond, to conduct a feasibility study of a dredging project in 1985, and the firm produced this contour map outlining (not extremely precisely) the rough bathymetry of Puffer’s Pond
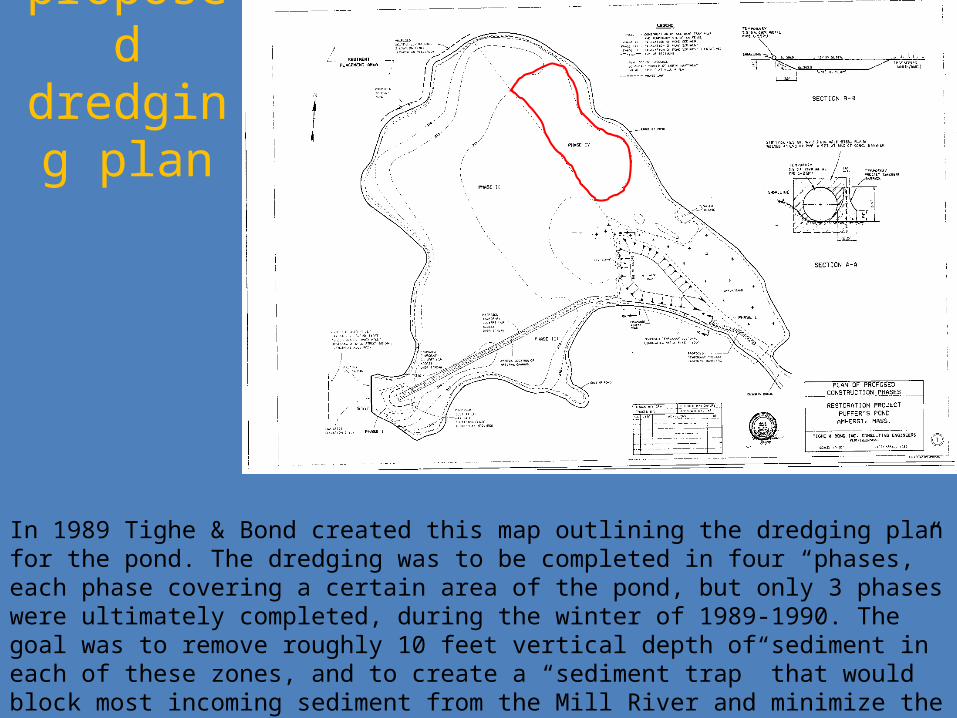
the proposed dredging
plan
In 1989 Tighe & Bond created this map outlining the dredging plan for the pond. The dredging was to be completed in four “phases,” each phase covering a certain area of the pond, but only 3 phases were ultimately completed, during the winter of 1989-1990. The goal was to remove roughly 10 feet vertical depth of sediment in each of these zones, and to create a “sediment trap” that would block most incoming sediment from the Mill River and minimize the future accumulation of sediment in the main body of the pond. (describe sediment trap – basically a large hole in the ground)
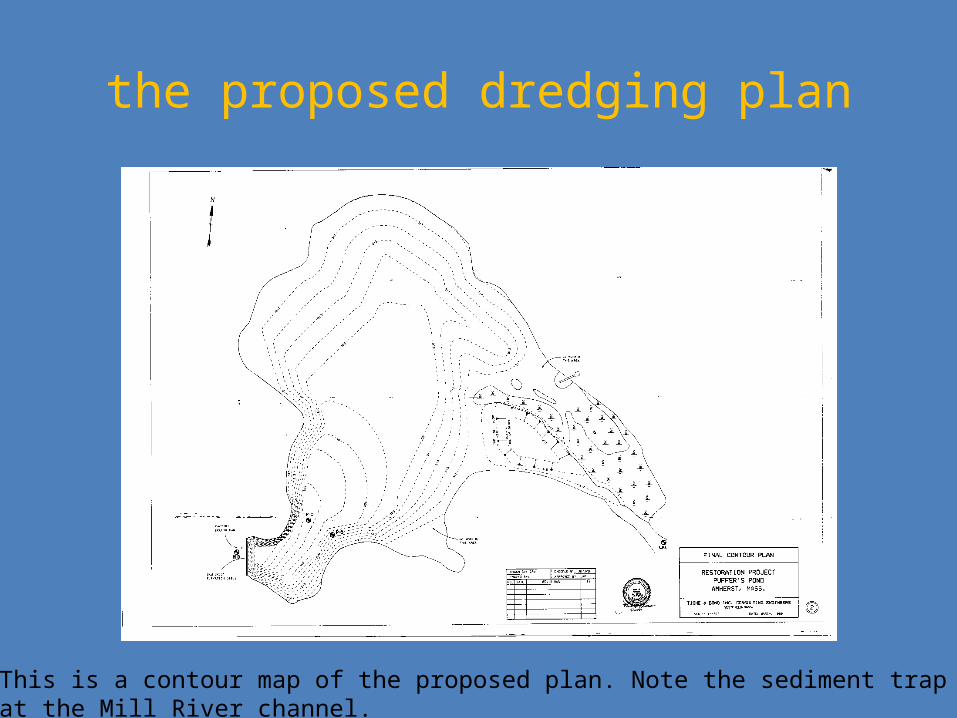
the proposed dredging plan
This is a contour map of the proposed plan. Note the sediment trap at the Mill River channel.
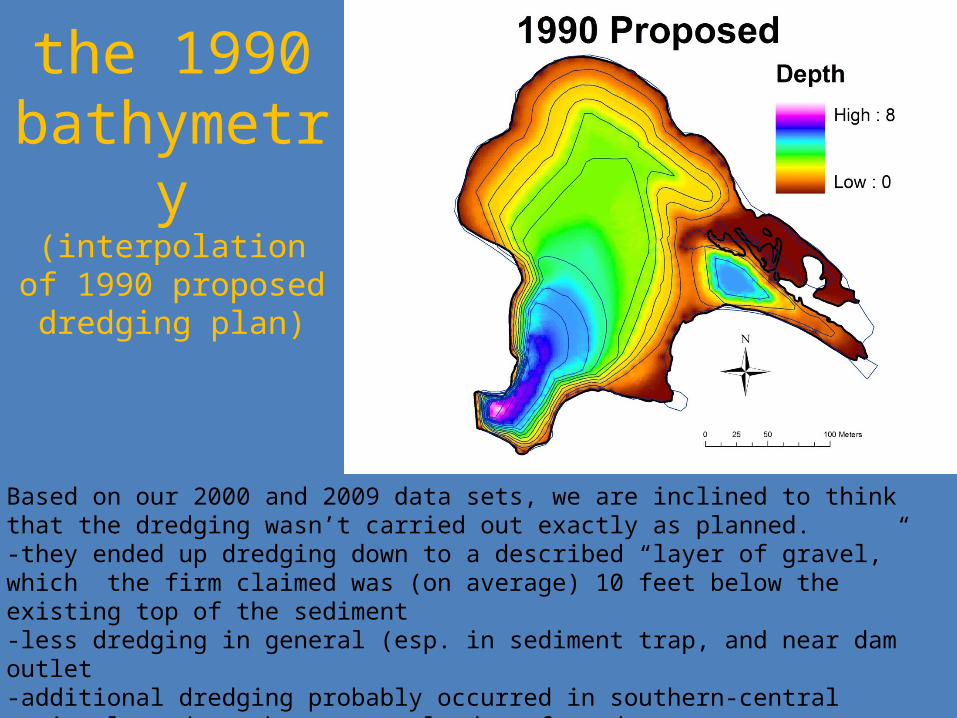
the 1990 bathymetry(interpolation of 1990
proposed dredging plan)
Based on our 2000 and 2009 data sets, we are inclined to think that the dredging wasn’t carried out exactly as planned.-they ended up dredging down to a described “layer of gravel,” which the firm claimed was (on average) 10 feet below the existing top of the sediment-less dredging in general (esp. in sediment trap, and near dam outlet -additional dredging probably occurred in southern-central peninsula and northern-central edge of pond; -phase 4 wasn’t completed i.e. northeast portion is too deep
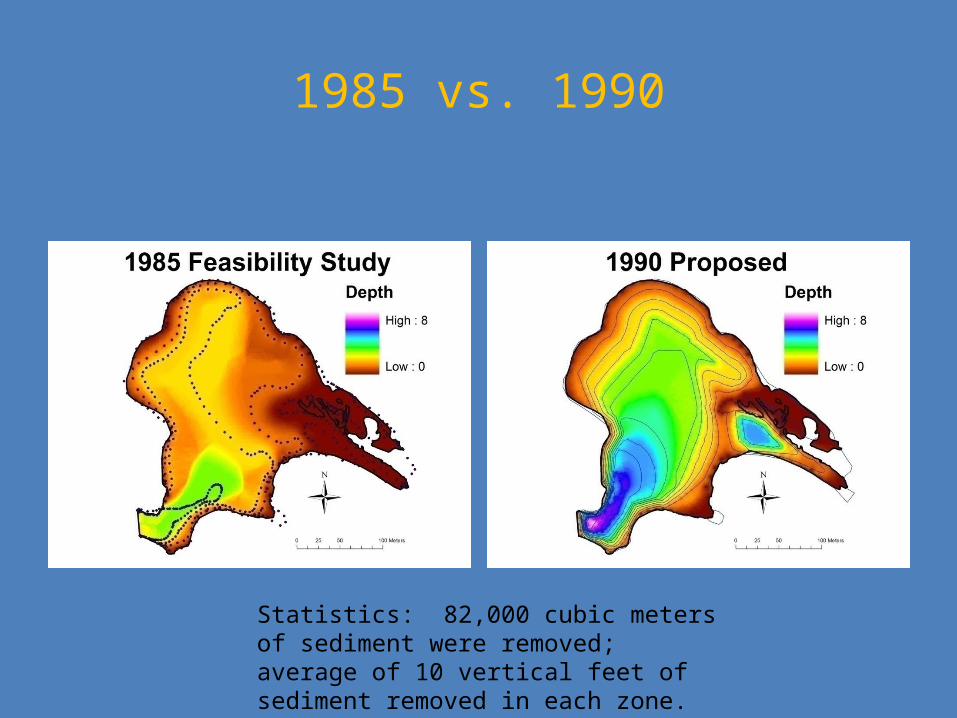
1985 vs. 1990
Statistics: 82,000 cubic meters of sediment were removed; average of 10 vertical feet of sediment removed in each zone.
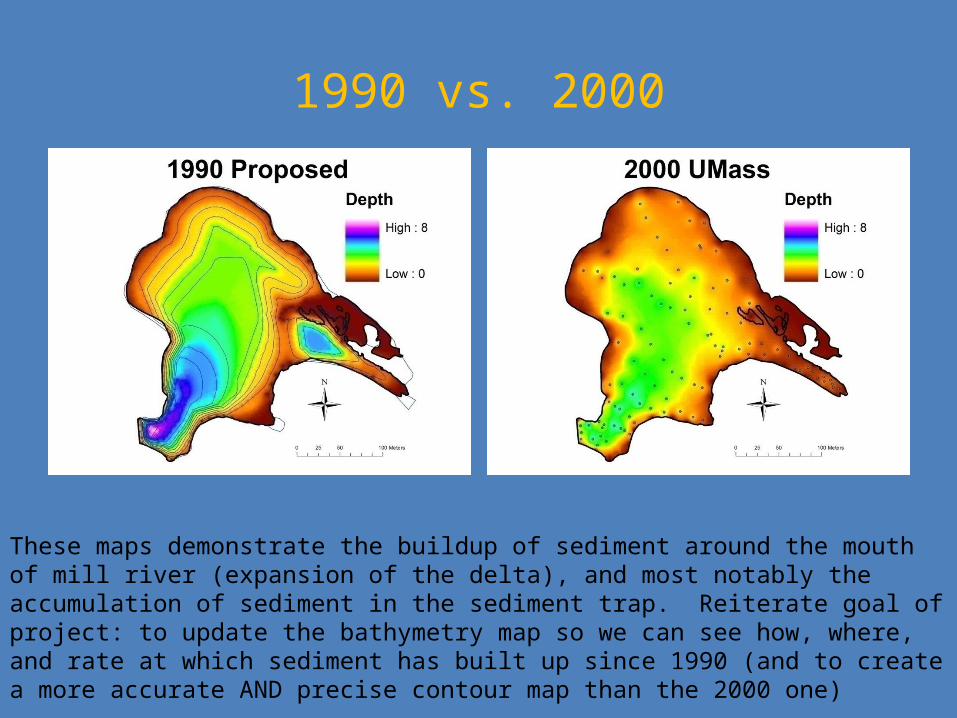
1990 vs. 2000
These maps demonstrate the buildup of sediment around the mouth of mill river (expansion of the delta), and most notably the accumulation of sediment in the sediment trap. Reiterate goal of project: to update the bathymetry map so we can see how, where, and rate at which sediment has built up since 1990 (and to create a more accurate AND precise contour map than the 2000 one)
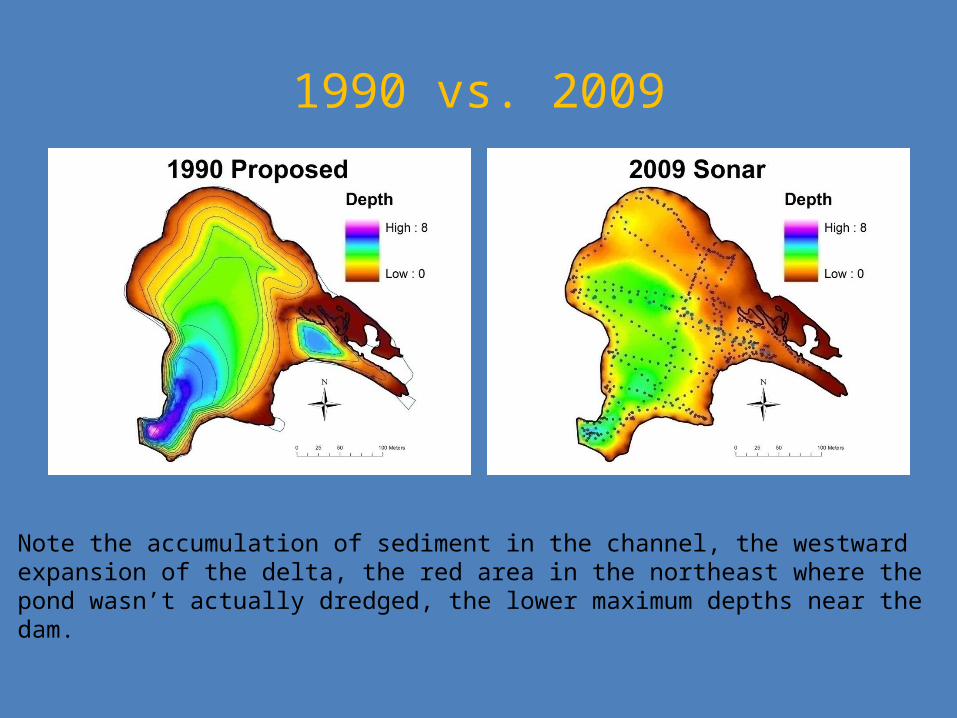
1990 vs. 2009
Note the accumulation of sediment in the channel, the westward expansion of the delta, the red area in the northeast where the pond wasn’t actually dredged, the lower maximum depths near the dam.
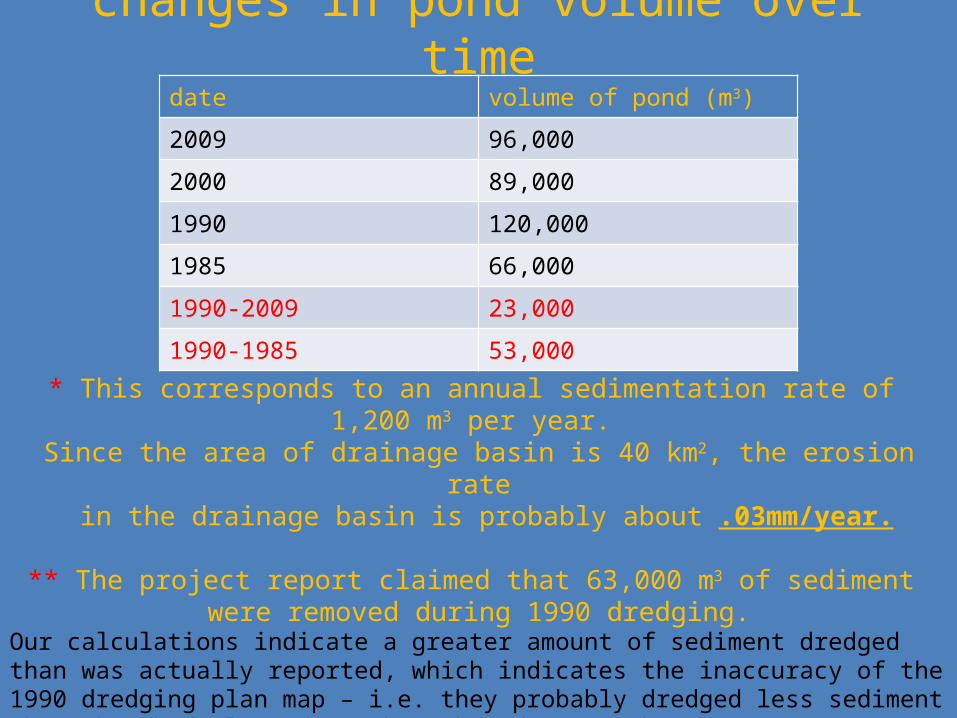
changes in pond volume over timedate volume of pond (m3)2009 96,000
2000 89,000
1990 120,000
1985 66,000
1990-2009 23,000
1990-1985 53,000
* This corresponds to an annual sedimentation rate of 1,200 m3 per year. Since the area of drainage basin is 40 km2, the erosion rate
in the drainage basin is probably about .03mm/year.
** The project report claimed that 63,000 m3 of sediment were removed during 1990 dredging.
Our calculations indicate a greater amount of sediment dredged than was actually reported, which indicates the inaccuracy of the 1990 dredging plan map – i.e. they probably dredged less sediment than they had planned to when they drew up the map.

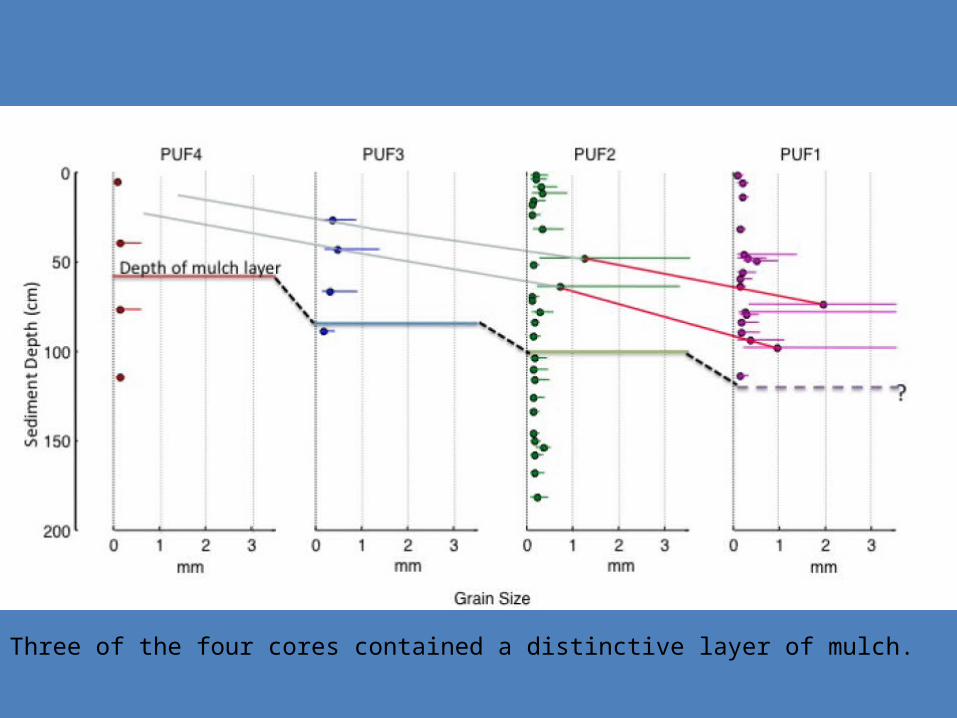
Three of the four cores contained a distinctive layer of mulch.
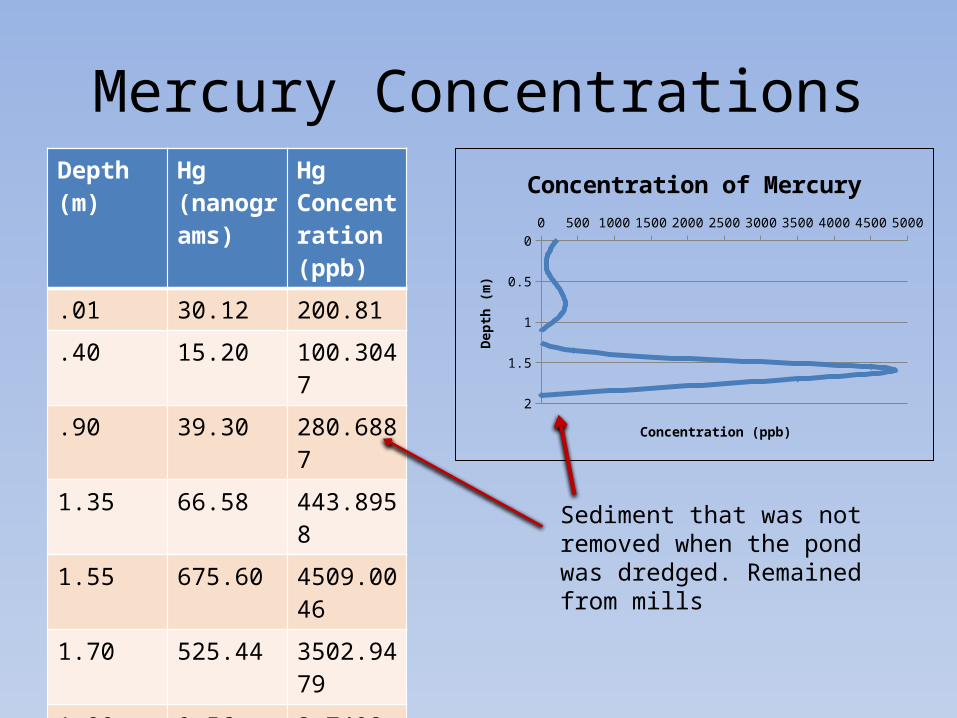
Mercury ConcentrationsDepth (m)
Hg (nanograms)
Hg Concentration (ppb)
.01 30.12 200.81
.40 15.20 100.3047
.90 39.30 280.6887
1.35 66.58 443.8958
1.55 675.60 4509.0046
1.70 525.44 3502.9479
1.90 0.56 3.7408
0 500 1000 1500 2000 2500 3000 3500 4000 4500 50000
0.20.40.60.8
11.21.41.61.8
2
Concentration of Mercury
Concentration (ppb)
Dept
h (m
)
Sediment that was not removed when the pond was dredged. Remained from mills