pulling back the curtain - american council on … · american council on education 1 pulling back...
TRANSCRIPT

AMERICAN COUNCIL ON EDUCATION 1
PULLING BACK THE CURTAINEnrollment and Outcomes at Minority Serving Institutions
Lorelle L. Espinosa
Jonathan M. Turk
Morgan Taylor

Cover photos (from top to bottom) courtesy of ACE member institutions Virginia Union University; Atlanta Technical College; University of California, Irvine; and American Samoa Community College; and of the College of Muscogee Nation (OK) (USDA photo by David Kosling CC BY 2.0).

Pulling Back the Curtain: Enrollment and Outcomes at Minority Serving Institutions
Lorelle L. Espinosa
Jonathan M. Turk
Morgan Taylor

CENTER FOR POLICY RESEARCH AND STRATEGYACE’s Center for Policy Research and Strategy (CPRS) pursues thought leadership at the intersection of public policy and institutional strategy. CPRS provides senior postsecondary leaders and public policy-makers with an evidence base to responsibly promote emergent practices in higher education with an emphasis on long-term and systemic solutions for an evolving higher education landscape and changing American demographic.
AMERICAN COUNCIL ON EDUCATIONThe American Council on Education (ACE), the major coordinating body and convener for all of the nation’s higher education institutions, provides leadership and a unifying voice on key higher education issues and influences public policy through advocacy, research, and program initiatives.
ACE and the American Council on Education are registered marks of the American Council on Education and may not be used or reproduced without the express written permission of ACE.
American Council on EducationOne Dupont Circle NWWashington, DC 20036
© 2017. All rights reserved. No part of this publication may be reproduced or transmitted in any form or by any means electronic or mechanical, including photocopying, recording, or by any information storage and retrieval system, with-out permission in writing from the publisher.
100 Years of Leadership and Advocacy
CONTENTSAcknowledgments .............................................................................................................................................................ivExecutive Summary ........................................................................................................................................................... vIntroduction .............................................................................................................................................................................1What Are Minority Serving Institutions? ............................................................................................................ 2Types of Minority Serving Institutions ................................................................................................................. 2Revenues at Minority Serving Institutions ......................................................................................................... 3U.S. Department of Education Investment in Minority Serving Institutions ................................ 4Metrics and Methods ........................................................................................................................................................ 5
Quantifying Completion and the Federal Graduation Rate ...............................................................5Methods ...............................................................................................................................................................................6A Deeper Look at Certificate and Degree Completion at MSIs ....................................................... 7
Historically Black Colleges and Universities .................................................................................................... 9Enrollment ..........................................................................................................................................................................9Outcomes ............................................................................................................................................................................9
Predominantly Black Institutions ........................................................................................................................... 15Enrollment ........................................................................................................................................................................15Outcomes ..........................................................................................................................................................................15
Hispanic-Serving Institutions ...................................................................................................................................23Enrollment ....................................................................................................................................................................... 23Outcomes ......................................................................................................................................................................... 23
Asian American and Native American Pacific Islander-Serving Institutions ............................ 31Enrollment ........................................................................................................................................................................31Outcomes ..........................................................................................................................................................................31
Tribal Colleges and Universities .............................................................................................................................39Conclusion ............................................................................................................................................................................45References ..............................................................................................................................................................................46Appendix A. Count of MSIs in Study ...................................................................................................................47Appendix B. Four-, Six-, and Eight-Year Outcomes at MSIs, by Enrollment
Intensity and MSI Type ..........................................................................................................................................48Appendix C. National Student Clearinghouse Data Glossary of Terms ........................................57
iv PULLING BACK THE CURTAIN: ENROLLMENT AND OUTCOMES AT MINORITY SERVING INSTITUTIONS
ACKNOWLEDGMENTS
The authors would like to thank the many individuals who helped shape this report through conversation and written review. We especially thank Deborah A. Santiago and Leonard L. Haynes III for their insight and expertise as former U.S. Department of Education staff and current roles as champions for minority serving institutions and the students they enroll. We are incredibly grateful for the guidance of the National Student Clearinghouse Research Center staff, especially Afet Dundar and Jason DeWitt. We thank the next generation of minority serving institution (MSI) scholars represented in this report through their thoughtful essays. With-out the work of talented young scholars, MSIs would be much less understood and appropriately celebrated. Thanks to colleagues Jonathan Gagliardi, Elizabeth Howard, and Jennifer Crandall for editorial support. Finally, we salute the hundreds of MSIs enrolling and serving our nation’s communities of color. While dis-tinct from one another, their collective impact in American society is great, and what is more, needed for our nation to reach its educational and workforce goals in a manner that is equitable and ultimately effective and wide-reaching.
AMERICAN COUNCIL ON EDUCATION v
EXECUTIVE SUMMARY Minority serving institutions (MSIs) play an integral role in American society, allowing a pathway to and through higher education for the nation’s rural and urban communities, and providing access to college for millions of students of color from disadvantaged backgrounds.
The analysis presented in this report utilizes data from the National Student Clearinghouse (NSC)—the largest and most comprehensive source of postsecondary enrollment nationwide—to examine how students who started college in 2007 at an MSI move through higher education. The first study to utilize NSC data to examine enrollment and outcome trends at MSIs, this report aims to paint a more complete picture of the con-tributions of MSIs to the communities they serve. NSC data capture student enrollment profiles and outcomes beyond that which is available through U.S. Department of Education data and the federal graduation rate, a measure often used for accountability purposes.
As the NSC data show, the majority of students at MSIs do not attend college exclusively full time, which is significant since higher education policy is still largely rooted in the notion of a “traditional” student body that among other attributes attends college full time. Students at MSIs, especially public institutions, enroll primarily through mixed enrollment, meaning they move between attending college both full time and part time, and not solely through one or the other. In addition to capturing more students, NSC data follow stu-dents throughout their educational journeys, including when they change institutions.
For these reasons, we find that completion rates for MSIs are higher than the federal graduation rate suggests, and in some cases substantially so. This is especially true for exclusively full-time students, the most compara-ble student population when looking side by side at NSC completion data and the federal graduation rate. For example, when it concerns students who complete within 150 percent of normal time at four-year institutions and 200 percent of normal time at two-year institutions:
• NSC data reveal a 43 percent total completion rate for public four-year Historically Black Colleges and Universities (HBCUs), which increased to nearly 62 percent for students who enrolled exclusively full time. This compared to a federal graduation rate of 34.1 percent.
• When looking at exclusively full-time students at private four-year HBCUs, NSC data show a comple-tion rate of 66.7 percent, compared to a federal graduation rate of 43.9 percent.
• The NSC completion rate for exclusively full-time students at public four-year Predominantly Black Institutions was nearly 52 percent compared to a federal graduation rate of 16.6 percent. The total com-pletion rate for all students was 34.1 percent.
• The completion rate for exclusively full-time students at public two-year Hispanic-Serving Institutions (HSIs) was 40.3 percent using NSC data, compared to the federal graduation rate of 25.5 percent. The NSC total completion rate for public four-year HSIs was approximately 50 percent and 74.1 percent for exclusively full-time students, compared to a federal graduation rate of 42.7 percent.
• The completion rate for exclusively full-time students at public four-year Asian American and Native American Pacific Islander-Serving Institutions was nearly 88 percent according to NSC data, and 66.2 percent according to the federal graduation rate.
These differences speak to the ongoing need not only to improve data on student outcomes, but also to be transparent and inform decision makers about the assumptions made in generating institutional data for accountability purposes. Moving beyond the data presented here, embedded throughout the report are essays written by scholars who study MSIs, providing insight into what sets MSIs apart and how they serve students in ways that are unique and exemplary.


AMERICAN COUNCIL ON EDUCATION 1
Minority serving institutions (MSIs) play a critical role in the higher education landscape, providing access to postsecondary education for millions of students of color who come from disadvantaged backgrounds, including those who are first in their family to attend college. In 2014–15,1 there were roughly 700 federally designated MSIs, representing approximately 14 percent of all degree-granting, Title IV-eligible institutions of higher education. Collectively, MSIs enroll 4.8 million students, or 28 percent of all undergraduates enrolled in U.S. postsecondary education.2 MSIs can be found in nearly every state and are located in all regions of the U.S., including seven territories.
As our nation strives to reach its college completion goals, like those set in motion by the federal government, philanthropic sector, and individual states,3 and as the workforce moves to one that increasingly requires a postsecondary credential,4 MSIs will continue to play an important role in ensuring America’s economic competitiveness. What is more, given a growing number of students of color nationally—and with a projected 45 percent of public K–12 students coming from underrepresented minority groups in 2024 (Hussar and Bailey 2016)—we expect to see many more MSIs emerge in the coming years. Understanding how these institutions serve their diverse student population is thus crucial in meeting regional, state, and national educa-tional attainment and workforce goals.
This report’s analysis, the first of its kind, utilizes data from the National Student Clearinghouse to examine MSI student enrollment and outcomes, including completion rates for students who start higher education at an MSI. Our aim is to paint a picture of the contributions these institutions make to postsecondary access and completion nationally. Interspersed throughout are essays written by scholars who study MSIs, providing
1 This academic year reflects the most current publicly available data found in the Department of Education’s College Scorecard. College Scorecard data were used to determine the number of institutions that have participated in federal MSI funding programs under Title III and Title V of the Higher Education Opportunity Act. It should be noted that the number of MSIs presented here does not include all institutions that may meet the enrollment threshold needed to qualify as an MSI but have not applied for these federal programs. There-fore, this is a conservative estimate of the number of MSIs.
2 Data reflect fall 2015 enrollment for Title IV participating, degree-granting institutions of higher education. 3 Within the philanthropic sector, Lumina Foundation’s Goal 2025 states that 60 percent of Americans will have earned a high-quality cre-
dential by 2025 and the Bill & Melinda Gates Foundation’s educational attainment goal aims to double the number of low-income students who earn a credential of value in the workforce by age 26. Several individual states have also set their own attainment goals. For example, Colorado has set a goal in which 66 percent of adults 25–34 years old will hold a postsecondary credential by 2025.
4 Credential includes postsecondary certificates and degrees.
INTRODUCTION
This report’s analysis, the first of its kind, utilizes data from the National Student Clearinghouse to examine MSI student enrollment and outcomes, including completion rates for stu-dents who start higher education at an MSI.

2 PULLING BACK THE CURTAIN: ENROLLMENT AND OUTCOMES AT MINORITY SERVING INSTITUTIONS
insight into what makes MSIs unique and how they serve the students they enroll. These examples of institu-tional histories and practice offer a snapshot of what sets MSIs apart and how they serve students in ways that are unique and exemplary.
Before presenting enrollment and completion data, we first provide an overview of how MSIs were established and how each MSI type is defined through federal legislation. We also provide a brief overview into the reve-nue structures of MSIs and how the U.S. Department of Education invests in the capacity building efforts of these institutions.
WHAT ARE MINORITY SERVING INSTITUTIONS?Minority serving institutions were established by the federal government as part of the first Higher Education Act, signed into law by President Lyndon B. Johnson in 1965. Through this groundbreaking piece of legisla-tion, President Johnson recognized and authorized support for Historically Black Colleges and Universities (HBCUs) as institutions whose mission was the education of black5 students, making HBCUs the first MSIs established to serve a specific racial group (Gasman, Nguyen, and Conrad 2015). In the same decade, Ameri-can Indian6 leaders restructured higher education for Native students following the success of the “self-deter-mination” movement in the 1960s (AIHEC 1999), under which American Indian tribes practice self-govern-ment and operate under their own constitutions (Cornell and Kalt 2010). The Navajo Nation created the first tribally controlled college in 1968 (AIHEC 1999). A decade later, tribal colleges received federal support via the Tribally Controlled College or University Assistance Act of 1978 (Nelson and Frye 2016).
As the nation’s citizenry grew more diverse, and more institutions were enrolling large numbers of students of color, subsequent iterations of the Higher Education Act (HEA) and other pieces of legislation established additional MSI types. Unlike HBCUs and Tribal Colleges and Universities (TCUs), the next five types of MSIs were established based on enrollment thresholds, and not for the purpose of educating a specific minority group (Gasman, Nguyen, and Conrad 2015). While MSIs are often referred to as a collective entity, their insti-tutional missions, characteristics, and student demographics vary widely. A review of how the federal govern-ment defines each MSI, and when they came into being, better sets the stage for understanding their respec-tive roles in the higher education landscape.
TYPES OF MINORITY SERVING INSTITUTIONSInstitutions receive recognition as an MSI in two ways. HBCUs and TCUs were established with the purpose of providing access to higher education for a specific racial minority group. Other MSI recognition is predi-cated on the institution reaching a certain enrollment threshold, as defined by legislation for each MSI type. It is worth noting that, as a result, institutions can meet the required enrollment eligibility threshold for multiple MSIs. In fact, in 2014–15, 85 institutions participating in the federal MSI programs met the eligibility require-ments to apply for recognition as more than one MSI type.
All MSIs must be accredited, degree-granting public or private nonprofit institutions of higher education. For MSIs that are predicated on enrollment, eligibility further requires these institutions to have low educational and general expenditures and enroll a defined percentage of low-income students. The federal institutional eli-gibility criteria from the Department of Education for each MSI type is outlined in the chart on the next page.
5 The terms African American and black are used interchangeably.6 The terms American Indian and Native American are used interchangeably.

AMERICAN COUNCIL ON EDUCATION 3
REVENUES AT MINORITY SERVING INSTITUTIONSFederal MSI recognition requires that institutions have low educational and general expenditures, meaning that these institutions have fewer resources with which to serve their students. Furthermore, the financial circumstances of the students MSIs serve limit their ability to raise tuition and endowment revenue in the pursuit of institutional mission. Therefore, many MSIs are reliant upon federal, state, and local appropriations and contracts and grants as sources of revenue (Nellum and Valle 2015; Nelson and Frye 2016). While there are many factors that can affect completion rates, among other desirable outcomes, research shows a positive link between the amount of institutional resources and degree completion (Carnevale and Strohl 2013; Flores and Park 2013).
DEPARTMENT OF EDUCATION FEDERAL INSTITUTIONAL ELIGIBILITY CRITERIA BY MSI TYPE
MSI Type Acronym Federal Recognition Definition
Historically Black Colleges and Universities
HBCU Higher Education Act of 19651
Any historically black college or university established prior to 1964, whose principal mission was, and is, the education of black Americans.
Tribal Colleges and Universities
TCU Tribally Controlled College or University Assistance Act of 19782,3
Institutions chartered by their respective Indian tribes through the sovereign authority of the tribes or by the federal govern-ment with the specific purpose to provide higher education opportunities to American Indians through programs that are locally and culturally based, holistic, and supportive.
Hispanic-Serving Institutions
HSI Higher Education Act of 19924
Institutions with 25 percent or more total undergraduate His-panic full-time equivalent student enrollment.
Alaska Native- and Native Hawaiian-Serving Institutions
ANNH Higher Education Act of 19985
Alaska Native-Serving Institutions are institutions that have at least 20 percent Alaska Native students. Native Hawaiian-Serv-ing Institutions are institutions that have at least 10 percent Native Hawaiian students. These institutions are collectively referred to as ANNH institutions.
Asian American and Native American Pacific Islander-Serving Institutions
AANAPISI College Cost Reduction and Access Act of 20076,7
Institutions that have at least 10 percent enrollment of Asian American Pacific Islander students.
Predominantly Black Institutions
PBI Higher Education Opportunity Act of 20088
Institutions that serve at least 1,000 undergraduate students; have at least 50 percent low-income or first-generation to college degree-seeking undergraduate enrollment; have low per-full-time undergraduate expenditure in comparison with other institutions offering similar instruction; and enroll at least 40 percent African American students.9
Native American-Serving, Nontribal Institutions
NASNTI Higher Education Opportunity Act of 2008
Institutions that have at least 10 percent enrollment of Native American students.10
1 Higher Education Act of 1965, Pub. L. No. 89–329 (1965).2 Tribally Controlled College or University Assistance Act of 1978, Pub. L. No. 95–471
(1978).3 TCUs were not established by this piece of legislation, as they are founded by indi-
vidual Native tribes. Rather, this piece of legislation provides federal support for these institutions.
4 Higher Education Act of 1992, Pub. L. No. 102–325 (1992).5 Higher Education Act of 1998, Pub. L. No. 105–244 (1998).6 College Cost Reduction and Access Act of 2007, Pub. L. No. 110–84 (2007).
7 AANAPISIs were first designated under the College Cost Reduction and Access Act of 2007. The AANAPISI program was further expanded under the Higher Education Opportunity Act of 2008 (AANAPISI 2016).
8 Higher Education Opportunity Act of 2008, Pub. L. No. 110–315 (2008).9 It is important to note that these institutions are not the same as HBCUs in that PBIs
are predicated on the institution meeting an enrollment threshold and HBCUs were established for the primary purpose of educating black students.
10 It is important to note that these institutions are not the same as TCUs in that NASNTIs are predicated on the institution meeting an enrollment threshold, and TCUs were established for the purpose of educating Native American students.
Federal MSI recognition requires that institutions have low edu-cational and general expenditures, meaning that these institu-tions have fewer resources with which to serve their students.

4 PULLING BACK THE CURTAIN: ENROLLMENT AND OUTCOMES AT MINORITY SERVING INSTITUTIONS
Examining average revenues at public HSIs provides an example of how public MSIs rely on state and local appropriations, grants, and contracts to operate. Almost two-thirds (64 percent) of all revenue at public two-year HSIs comes from state and local appropriations, grants, and contracts, compared to 51 percent for two-year non-HSIs. Forty-two percent of revenue at public four-year HSIs come from state and local fund-ing streams, compared to 34 percent for public four-year non-HSIs (Nellum and Valle 2015). Given the high concentration of revenues that come from state and local sources, HSIs are vulnerable to continual declines in state investment in higher education. Further, the growth in federal appropriations for HSIs has not kept pace with the growth in the number of HSIs (Nellum and Valle 2015).
A next illustration is that of TCUs as institutions disproportionately dependent on federal investment com-pared to other MSIs due to the special legal relationship between American Indian tribes and the federal gov-ernment. Federal appropriations, grants, and contracts comprise over 70 percent of all revenue, on average, at TCUs, making these institutions highly dependent upon federal funding. Comparatively, only a quarter of all revenue at non-TCU two-year institutions and one fifth of all revenue at four-year non-TCU institutions comes from federal funding streams (Nelson and Frye 2016). While other institutions heavily rely on state and local funding, because of the relationship between American Indian tribes and the federal government, states have no obligation to provide funding to TCUs, and many do not (Nelson and Frye 2016). These two examples call attention to the role and necessity of public investment in MSIs to secure their required capacity to serve an increasingly diverse college student population.
U.S. DEPARTMENT OF EDUCATION INVESTMENT IN MINORITY SERVING INSTITUTIONSThe Department of Education invests in the development of minority serving institutions through capacity building grants under Title III and Title V of the Higher Education Opportunity Act. The purpose of these grants is to improve and strengthen institutions’ academic quality and provide expanded educational oppor-tunities for low-income students through a specified list of allowable activities. A description of the funding streams is below:7
Title III, Part A—Strengthening Institutions Program: Title III, Part A helps eligible institutions to expand their capacity to serve low-income students by “providing funds to improve and strengthen the academic quality, institutional management, and fiscal stability of eligible institutions” (U.S. Department of Education 2017b). MSIs that receive funding through Title III, Part A include TCUs, PBIs, AANAPISIs, ANNHs, and NASNTIs.
Title III, Part B—Strengthening Historically Black Colleges and Universities Program: Title III, Part B “provides financial assistance to Historically Black Colleges and Universities to establish or strengthen their physical plants, financial management, academic resources, and endowment-building capacity” (U.S. Department of Education 2017c).
Title V, Part A—Developing Hispanic-Serving Institutions Program: Title V, Part A provides funding to HSIs “to expand educational opportunities for, and improve the attainment of, Hispanic students. These grants also enable HSIs to expand and enhance their academic offerings, program quality, and institu-tional stability” (U.S. Department of Education 2017a).
7 The program descriptions included here constitute the primary funding to MSIs through the Department of Education. MSIs can also apply for additional funding under Title III and Title V, which have fewer and more detailed allowable activities. In addition to the Depart-ment of Education, other federal agencies provide funding to MSIs through competitive grant programs.

AMERICAN COUNCIL ON EDUCATION 5
METRICS AND METHODSThe growing accountability movement in higher education has led to an increased focus on student outcomes as an indicator of institutional effectiveness. Chief among these outcome measures is an institution’s gradu-ation rate. This report examines the contribution of MSIs through a thorough exploration of enrollment and completion at these institutions. In this section, we discuss the calculation of completion rates, provide an overview of the data used for this study, and discuss strategies for how completion rate information can be best used by policymakers and others to understand institutions of higher education, including MSIs.
QUANTIFYING COMPLETION AND THE FEDERAL GRADUATION RATEOn its face, a completion rate is a simple metric: of the total number of students who begin a program of study at a given postsecondary institution, what percentage finished? However, operationalizing this deceptively simple concept reveals a number of decisions that must be made in order for a completion rate to be a useful metric. These decisions largely relate to which students should be included or excluded from the entering student body or cohort, how long students should be tracked, and what constitutes a completion. In calculating completion rates, several questions must be answered:
• How should completion be defined?
• Should full-time and part-time students be included in the same or separate cohorts?
• How should students who change their enrollment intensity (e.g., from full time to part time) be han-dled?
• Should students who transferred from other postsecondary institutions be included alongside students who are enrolled for the first time?
• Are there any justifiable reasons why students should be excluded from the calculation after meeting the initial inclusion criteria?
• How long after a student starts a program should he or she be tracked?
In 1990, Congress passed the Student Right-to-Know and Campus Security Act. This law requires colleges and universities to report graduation rate information for first-time, full-time degree or certificate seeking under-graduate students within 150 percent of normal program completion time as a condition of receiving Title IV federal financial aid dollars. Referred to as the Student Right-to-Know (SRK) or federal graduation rate, insti-tutions report this information through the Graduation Rate Survey as a part of their annual data submission to the U.S. Department of Education’s Integrated Postsecondary Education Data System (IPEDS). In codifying the SRK graduation rate, Congress addressed each of the questions above in order to create a completion rate.
Under the SRK graduation rate, a completion is defined as having occurred when a student finishes all require-ments for a degree or certificate at his or her starting institution. Therefore, students who transfer and com-plete a degree or certificate at another institution are considered non-completers. To be included in the grad-uation rate cohort, a student must begin his or her enrollment as a first-time, full-time degree or certificate seeking student. This excludes students who were previously enrolled in another postsecondary institution, as well as students who at the formation of the cohort were enrolled part time. Students must also be taking courses as part of a defined associate, bachelor’s, or sub-bachelor’s degree certificate program. This excludes students who are enrolled in non-credit bearing, adult, or continuing education courses. However, should a stu-dent’s status on any of these criteria change (e.g., change to part-time enrollment, change degree program, or transfer to another institution) he or she remains a part of the cohort and factors in the graduation rate calcu-

6 PULLING BACK THE CURTAIN: ENROLLMENT AND OUTCOMES AT MINORITY SERVING INSTITUTIONS
lation. However, institutions are permitted to remove students initially included in the cohort for reasons such as active duty military service, total and permanent disability, or death. Finally, the SRK graduation rate limits the amount of time a student is tracked to within 150 percent of “normal time.” For example, students pursuing bachelor’s degrees—which are expected to be completed in four years—are tracked for six years, while students
pursuing two-year associate degrees are tracked for three years.
Congress established the SRK graduation rate in an attempt to provide students and families with a clear metric of institutional performance to consider when selecting a college or university. While each decision made in formulating the
SRK graduation rate is defensible, this one metric alone does not provide a full picture of completion for many or arguably most institutions. It is vitally important that policymakers consider not only different tracking periods and cohorts, but also alternative ways to define completion in order to align more closely with multi-ple definitions of postsecondary student success.
METHODSIn order to more comprehensively explore the critical role MSIs play in providing educational opportunity for historically underserved students, we analyzed completion rate data collected by the National Student Clearinghouse (NSC) and prepared by the National Student Clearinghouse Research Center (NSCRC). The National Student Clearinghouse, a nonprofit organization, is the largest source of U.S. college degree and enrollment information. More than 3,600 institutions, enrolling 97 percent of students in public and private institutions, voluntarily participate in the Clearinghouse for the purposes of educational research and cre-dential verification across institutions and across state lines. The robustness of the data collected by the NSC allows for the tracking of students across institutions and therefore the calculation of a variety of completion rates that when used together, provide a much fuller understanding of enrollment, persistence, and comple-tion at MSIs.
Using IPEDS data along with the MSI eligibility criteria published by the Department of Education, four lists of MSI-eligible institutions were generated and submitted to the NSCRC for inclusion in our study (see Appendix A for aggregate counts of institutions we identified and that were included by NSCRC in this study). Data from TCUs and NASNTIs were not included in this report, as the low rate of participation in the NSC among these institutions would not ensure adequate privacy protections. Finally, due to the inability to disaggregate IPEDS data on Alaska Native and Native Hawaiian student enrollment from Native American student enrollment, an accurate list of ANNH-eligible institutions could not be generated. For a discussion of the persistent gaps prevalent in national data on TCUs and Native communities, in particular, see this report’s essay by Christine A. Nelson.
The data presented in this report were calculated for the fall 2007 national cohort of students first enrolled at an HBCU, PBI, HSI, or AANAPISI. Students enrolled in a two-year public MSI were tracked through May 31, 2011 in order to generate four-year or within 200 percent of normal time completion rates. We chose to explore 200 percent completion rates, rather than the 150 percent rates for two reasons. First, given that students in the two-year sector often have multiple goals (completing an associate degree, transferring, etc.) increasing the amount of time the students are tracked more accurately accounts for the time these students typically take to graduate or transfer. Second, while organizations such as American Association for Community
While each decision made in formulating the SRK graduation rate is defensible, this one metric alone does not provide a full picture of completion for many or arguably most institutions.

AMERICAN COUNCIL ON EDUCATION 7
The robustness of the data collected by the NSC allows for the tracking of students across institutions and therefore the calculation of a variety of completion rates that when used together, provide a much fuller understanding of enrollment, persistence, and completion at MSIs.
Colleges (2016) advocate for the collection of a 300 percent completion rate, only 200 percent and 150 per-cent graduation rate information is currently available through IPEDS. Therefore, by presenting 200 percent completion rate information, we are able to both extend the period in which students were tracked and pro-vide information that is most comparable to federally reported rates. Students enrolled in a four-year public or private MSI were tracked through May 31, 2013 in order to determine six-year or within 150 percent of normal time completion rates.
The fall 2007 cohort of students at four-year and two-year MSIs were each made up of first-time degree or certificate seeking students.8 The outcomes calculated and presented in this analysis include completions at students’ starting institution, completions at transfer institutions, total completions (at start-ing or at transfer institution), and persistence through the end of the study period for those who had yet to earn a degree. Finally, results were disaggregated by enrollment intensity: exclusively full time, exclusively part time, and mixed enrollment (terms of full-time and part-time enrollment during a given student’s course of study excluding summer terms). For our anal-ysis, we present the overall cohort results and results of the exclusively full-time subcohort. The results of the exclusively full-time subcohort most closely mirror the federal graduation rate cohorts. For comparison pur-poses, we present an aggregate federal graduation rate (150 percent for four-year institutions and 200 percent for two-year institutions) for the MSIs included in our NSC analysis. Finally, results for exclusively part-time and mixed enrollment subcohorts are presented in Appendix B, as well as the full results of the four-, six-, and eight-year outcomes for both two-year and four-year institutions.
A DEEPER LOOK AT CERTIFICATE AND DEGREE COMPLETION AT MSIsData from the NSC allow for a more robust and comprehensive exploration of student completion and per-sistence than what would be possible through the SRK graduation rate alone. Like the SRK graduation rate, the NSC completion rates are based on a cohort of first-time degree or certificate seeking students. However, the NSC data allow us to explore the completion rates of students who begin their enrollment as part-time students, as well as to disaggregate exclusively full-time students from students who may have started as full-time students, but enrolled part time at some point after their first term.
Furthermore, while the SRK graduation rate measures only degree/certificate completion at students’ starting institutions, NSC data allow us to capture not only completion at students’ starting institutions but also com-pletion or continued enrollment at transfer institutions. This is particularly useful when exploring transfer—a key outcome in the two-year sector—and continued persistence for students who had yet to receive a degree at the end of the tracking period.
Finally, while the SRK graduation rate tracks students for a period defined as 150 percent of normal time, we utilized NSC data to explore alternative time frames. We measured all students’ outcomes—those who began at two-year and four-year institutions—four years, six years, and eight years after their initial enrollment. This
8 As defined by the National Student Clearinghouse, for students enrolled at four-year institutions, intent to earn a degree or certificate was based on having enrolled in at least one term at an intensity of half time or higher during the six-year tracking period. Intent to earn a degree or certificate for students who began at a two-year institution was determined if the student either enrolled full time for at least one term prior to August 15, 2008 or enrolled at least half time for any two terms before December 31, 2008.

8 PULLING BACK THE CURTAIN: ENROLLMENT AND OUTCOMES AT MINORITY SERVING INSTITUTIONS
equates to 100 percent, 150 percent, and 200 percent of normal time for four-year institutions and 200 percent, 300 percent, and 400 percent of normal time for two-year institutions (see Appendix B). These extended track-ing periods allow for a better understanding of students’ persistence, particularly among transfer students.
Graduation or completion rates can be useful metrics when exploring how well institutions are serving their students. However, it is important to realize that no single rate can ever fully encompass student persistence and completion at an MSI, or any other institution for that matter. The great diversity in American higher education means that students enroll in college with a set of unique characteristics, experiences, and back-grounds, as well as changing educational needs and goals. When striving to better understand colleges’ and universities’ contributions to postsecondary educational attainment, policymakers should 1) consider a variety of different successful outcomes including graduation, transfer out, course completion, and skills enhance-ment; 2) disaggregate success rates by enrollment intensity (i.e., exclusively full time, part time, and mixed enrollment); and 3) expand the time frame in which students are tracked, particularly among students who begin in the two-year sector.
Finally, it is important to note that the results of our analysis cannot directly speak to the quality of education offered by these institutions. Understanding the rate at which students complete a given program is not in and of itself an indicator of quality. Rather, this assessment is best left to other measurements including those used by national and regional accrediting bodies and institution-level assessments. While the analysis of NSC data allows for a clearer picture of student persistence at MSIs, future analyses should examine and compare completion rates over multiple cohorts.

AMERICAN COUNCIL ON EDUCATION 9
ENROLLMENT
Enrollment patterns at HBCUs differ between public and private institutions (see Table 1). The majority of students at public HBCUs had mixed enrollment. And almost two-thirds of students at public two-year HBCUs enrolled through mixed enrollment (65 percent), compared to about one in five who enrolled exclusively full time (21 percent). Although students at public four-year HBCUs were more likely to enroll exclusively full time than students at public two-year institutions, the majority still enrolled through mixed enrollment. Students at private four-year HBCUs, however, were more likely to enroll exclusively full time (56 percent).
TABLE 1. Percent of Total Enrolled at HBCUs by Enrollment Intensity: Fall 2007 Cohort
Enrollment Intensity Public Two-Year HBCU Public Four-Year HBCU Private Four-Year HBCU
Overall Cohort Size 2,610 28,206 10,648
% Enrolled Exclusively Full Time 21 45 56
% Enrolled Exclusively Part Time 14 3 1
% Enrolled with Mixed Enrollment 65 52 43
OUTCOMES
Outcomes for students who started at a four-year HBCU are presented in Table 2. Table 3 reflects outcomes for students who started at a public two-year HBCU. Each table also includes the aggregated federal graduation rate for the institutions included in the data provided by NSC. As previously mentioned, the federal gradua-tion rate cohort is most comparable to the exclusively full-time subcohort in the NSC data.
Public four-year HBCUsCompletion at Starting Institution: Data from NSC reveal a 43 percent total completion rate for the 2007 cohort of public four-year HBCU students. The total completion rate increased to nearly 62 percent for stu-dents who enrolled exclusively full time. Yet, the federal graduation rate for public four-year HBCUs was nearly 28 percentage points lower (34.1 percent). Furthermore, 54 percent of exclusively full-time students completed their certificate/degree at their starting institution.
HISTORICALLY BLACK COLLEGES AND UNIVERSITIES

10 PULLING BACK THE CURTAIN: ENROLLMENT AND OUTCOMES AT MINORITY SERVING INSTITUTIONS
Transfer and Completion: More than 9 percent of the total cohort completed their first certificate/degree at another institution: 2.9 percent did so at a two-year institution and 6.5 percent transferred to and completed at a different four-year institution. Close to 8 percent of students in the exclusively full-time subcohort completed their first certificate/degree at a different institution, with 1.7 percent transferring to a two-year institution and 6.2 percent transferring to another four-year institution.
Persistence: Slightly less than a quarter of the total cohort (22.1 percent) and 8.6 percent of the exclusively full-time subcohort were still enrolled pursuing their first credential in the sixth year. More than a third of the total cohort had yet to complete a certificate/degree and were no longer enrolled at any institution in the sixth year (34.9 percent). This rate dropped to 29.6 percent among students who had enrolled exclusively full time.
Private four-year HBCUsCompletion at Starting Institution: The total NSC completion rate for the 2007 cohort of private four-year HBCU students was 49.3 percent. The total completion rate increased to nearly 67 percent for students in the exclusively full-time subcohort, with nearly 58 percent of the subcohort completing their certificate/degree at their starting institution. However, the federal graduation rate for private four-year HBCUs was only 43.9 percent.
Transfer and Completion: Approximately 10 percent of the total cohort completed their first credential at another institution: around 2 percent did so at a two-year institution and more than 7 percent transferred to and completed at a different four-year institution. About 2 percent of exclusively full-time students transferred to a two-year institution, while nearly 8 percent transferred to a different four-year institution.
Persistence: Nearly one in five students of the total cohort (19.7 percent) and 8 percent of the exclusively full-time subcohort at private four-year HBCUs were still enrolled pursuing their first certificate/degree in the sixth year. Thirty-one percent of the cohort had yet to complete a credential and were no longer enrolled at any institution in the sixth year. This rate dropped to 25.3 percent among students who had enrolled exclu-sively full time.
TABLE 2. Six-Year Outcomes (150% Normal Time) at Four-Year HBCUs: Fall 2007 Cohort
Public Four-Year Private Four-Year
NSC Total Completion Rate: Exclusively Full-Time Students 61.8 66.7
Federal Graduation Rate* 34.1 43.9
Public Four-Year Private Four-Year
Overall (Cohort Size = 28,206)
Exclusively Full Time (Cohort Size = 12,613)
Overall (Cohort Size = 10,648)
Exclusively Full Time (Cohort Size =5,968)
Total Completion Rate 43.0 61.8 49.3 66.7
Completed at Starting Institution 33.6 54.0 39.7 57.7
Completed at Different Institution: Two-Year 2.9 1.7 2.4 1.5
Completed at Different Institution: Four-Year 6.5 6.2 7.3 7.5
Still Enrolled (at Any Institution) 22.1 8.6 19.7 8.0
Not Enrolled (at Any Institution) 34.9 29.6 31.0 25.3
* The federal graduation rate is most comparable to the total completion rate for exclusively full-time students in NSC data.

AMERICAN COUNCIL ON EDUCATION 11
Public two-year HBCUsCompletion at Starting Institution: The total completion rate for the 2007 cohort of public two-year HBCU students was approximately 20 percent. The rate increased to 32.1 percent when the cohort was restricted to exclusively full-time students, an increase of 18.2 percentage points above their federal graduation rate (13.9 percent). Around 27 percent of exclusively full-time students completed their certificate/degree at their start-ing institution.
Transfer and Completion: Approximately 4 percent of the total cohort transferred and completed their first credential at another two-year institution. Less than 2 percent transferred and completed their first certificate/degree at a four-year institution. A very small percentage of all students completed a certificate/degree at their starting institution and a subsequent credential at a four-year institution (less than 1 percent). Students who enrolled exclusively full time were only slightly more likely to complete a credential at both their starting two-year and subsequent four-year institution within four years. In total, 1.8 percent of all students who started at a two-year public HBCU went on to complete a credential at a four-year institution within four years. However, this number increased to nearly 16 percent when the tracking period was extended to eight years (see Appen-dix B).
Persistence: Nearly 40 percent of the total cohort and 15.7 percent of the exclusively full-time subcohort were still enrolled pursuing their first credential in the fourth year. About 41 percent of the total cohort had yet to complete a certificate/degree and were no longer enrolled at any institution in the fourth year. This rate increased to around 52 percent among students who had enrolled exclusively full time.
TABLE 3. Four-Year Outcomes (200% Normal Time) at Public Two-Year HBCUs: Fall 2007 Cohort
NSC Total Completion Rate: Exclusively Full-Time Students 32.1
Federal Graduation Rate* 13.9
Overall (Cohort Size = 2,610)
Exclusively Full Time (Cohort Size = 546)
Total Completion Rate 19.6 32.1
First Completion at Starting Institution 14.6 27.1
First Completion at Different Institution: Two-Year 3.5 2.5
First Completed at Different Institution: Four-Year 1.4 2.5
Subsequent Completion at a Four-Year 0.4 0.7
Still Enrolled (at Any Institution) 39.6 15.7
Not Enrolled (at Any Institution) 40.8 52.2
* The federal graduation rate is most comparable to the total completion rate for exclusively full-time students in NSC data.
12 BE
YO
ND
TH
E N
UM
BE
RS
Historically Black Colleges and Universities: Fostering Familial Learning Environments for Student Success
Marybeth Gasman, Judy and Howard Berkowitz Professor of Education and Director of Penn Center for Minority Serving Institutions, University of Pennsylvania
andAndrés Castro Samayoa, Assistant Professor of Higher Education, Boston College
Lynch School of Education
Historically Black Colleges and Universities (HBCUs) play a critical role in the nation’s postsecondary education system: they offer African Americans1 and other students of color safe and empowering envi-ronments where faculty and administrators cultivate student success and provide students a space to embrace their racial identities. HBCUs offer a uniquely familial learning environment; moreover, these institutions cultivate and measure student success in myriad ways. Recent news headlines have pointed to rising enrollment rates at HBCUs, with some commentators suggesting that this uptick can be par-tially attributed to the increased attention to racially hostile climates at Predominantly White Institu-tions (PWIs) as well as the culturally relevant environments offered by HBCUs (Pratt 2016; Washington and Gasman 2016).
In this essay, we share some of the work that the Penn Center for Minority Serving Institutions has been doing for the past three years around the contributions of HBCUs. As we know, HBCUs not only have a long history of providing access to African Americans seeking postsecondary education, but they also contribute to the educational success of a large number of students of color (Joo and Reeves 2017). While representing less than 3 percent of higher education institutions nationally, HBCUs edu-cate one in 10 black students (Gasman and Conrad 2013). HBCUs also have robust histories of provid-ing access and support for disadvantaged students who come from under-resourced K–12 backgrounds. Currently, 74 percent of HBCU students are Pell Grant-eligible, exemplifying their commitment to serv-ing low-income students (Gasman and Conrad 2013). The contributions of HBCUs to STEM education are particularly noteworthy, with eight HBCUs among the top 20 institutions that award science and engineering bachelor’s degrees nationwide (Gasman and Nguyen 2016). Further, HBCUs are leaders in producing black graduates who go on to earn STEM doctoral degrees (Gasman and Nguyen, forthcom-ing; Upton and Tanenbaum 2014).
Student success at HBCUs can be attributed to multiple factors, including how HBCUs cultivate an ethos of familial success, and their intentionality in providing robust services for students hailing from low-income and other under-resourced backgrounds. Research shows that HBCUs purposefully foster an ethos of belief in the success of students, and faculty and staff members regularly and consistently communicate this vision to their students (Conrad and Gasman 2015).
HBCUs’ ethos of success is steeped in the idea of family. Many of these institutions emphasize collab-oration over competition through cohort models in which students understand that their success is deeply tied to others and not merely a product of their own doing. For example, one strategy of success used at Morehouse College (GA) is a focus on effective peer-to-peer learning within a cohort model, where students are charged with supporting one another in completing their degrees. Notably, the
1 The terms African American and black are used interchangeably.

BE
YO
ND
THE
NU
MB
ER
S
13
students who are encouraged to participate as leaders in these cohort groups are those who may have initially struggled in their own coursework. This allows peer leaders to see themselves in those seeking guidance, and also allows struggling students to recognize and aspire to the success of those who came before them.
The success of Morehouse’s initiatives—inviting students to share in their collective achievement—is evident in the college’s production of future STEM graduate students. The college stands out as an exemplary institution within STEM education for black men, an important contribution given that across the nation, only 34 percent of black recipients of STEM bachelor’s degrees are men (Gasman et al. 2016). Additionally, Morehouse is one of the nation’s top producers of black STEM graduates purs-ing master’s and doctoral degrees (Conrad and Gasman 2015).
Likewise, at Xavier University of Louisiana students are encouraged to work together in weekly “drills” as part of their chemistry courses. Faculty members demonstrate to students that, rather than being encouraged to work on their own and compete with one another, working in groups and caring about each other’s performance will lead to greater student success overall. Like Morehouse, Xavier has an impressive track record in producing future STEM doctorate-holders, as well as medical doctors, regu-larly sending over 100 students to medical school in a given year (Gasman and Nguyen, forthcoming).
HBCUs pride themselves on offering students ample time for face-to-face interactions with faculty and staff, who support students not just academically, but also socially. Consider Paul Quinn College, a private HBCU in Dallas, Texas, which anchors its academic and community work through its “We Over Me” philosophy. Michael Sorrell, Paul Quinn’s president since 2007, has instilled this motto as a moral compass on the campus: a sense of success that spans beyond individual accolades and fosters a shared ownership over everyone’s triumphs. Sorrell not only serves as the institution’s leader, but also teaches first-year students and personally recruits students to Paul Quinn during nationwide visits to high schools. Throughout all of these forms of engagement with students, Sorrell instills in students a commitment to intentionally serve beyond themselves. Since Sorrell came to Paul Quinn with his emphasis on service, the college has been producing activist leaders who give back to their broader community through servant leadership (Conrad and Gasman 2015).
HBCUs place emphasis on ensuring that students’ academic and social needs are met in order to fur-ther develop students’ competencies and readiness for college-level coursework (Conrad and Gasman 2015). A summer bridge program at Norfolk State University (VA), for example, pairs incoming and current students whereby the latter group provides mentoring, academic, and social support, and helps keep new students accountable throughout the transition to college. Summer bridge students also have the option of joining a program called “The Breakfast Club” in their first year. The “Breakfast Club” program nurtures new students’ social skills and prepares them as professionals, complementing and building upon their academic preparation (Conrad and Gasman 2015).
HBCUs are also attuned to the specific needs of students whose trajectories do not follow the tradi-tional, first-time, full-time residential collegian. Many students enrolled at HBCUs have to depart their education for periods of time in order to tend to other needs, such as work and family. HBCUs embrace approaches that capitalize on the assets that students returning to college after an extended absence possess (Conrad and Gasman 2015). Such progress is not captured by traditional graduation rates. Without taking into account students’ specific educational backgrounds prior to beginning their trajec-tories at HBCUs, policymakers can often forget how HBCUs successfully continue to serve groups of students that might otherwise not pursue postsecondary education at all.

14 BE
YO
ND
TH
E N
UM
BE
RS
By embracing expansive ideas of success, HBCU leaders inspire their students to strive beyond degree completion and understand how cultivating a mindset for collaboration, civic engagement, and entre-preneurship are essential attributes in a new knowledge economy and global citizenry. These are diffi-cult attributes to capture through traditional metrics of student success but important when evaluating HBCUs. Not doing so risks ignoring HBCUs’ unique mission, storied history, and role in our country’s educational future.
In conclusion, HBCUs play a significant role in the success of their students and the communities they serve. They create welcoming environments in which students can excel academically and grow personally, offering a space in which students can develop and embrace their racial identities. HBCUs also recognize that the students they serve do not fit a traditional college student profile and offer pro-gramming to meet students where they are, providing examples to other institutions on how to serve a diverse student body. As the demographic composition and life experiences of college students in the United States changes, having a more expansive definition of success will become essential to even more colleges and universities in telling the entire story of college access, success, and learning.
REFERENCES
Conrad, Clifton, and Marybeth Gasman. 2015. Educating a Diverse Nation: Lessons from Minority Serv-ing Institutions. Cambridge, MA: Harvard University Press.
Gasman, Marybeth. 2013. The Changing Face of Historically Black Colleges and Universities. Phila-delphia, PA: Penn Center for Minority Serving Institutions. http://www.gse.upenn.edu/pdf/cmsi/Changing_Face_HBCUs.pdf.
Gasman, Marybeth, and Thai-Huy Nguyen. Forthcoming. Making Black Scientists. Cambridge, MA: Harvard University Press.
Gasman, Marybeth, Thai-Huy Nguyen, Clifton F. Conrad, Todd Lundberg, and Felecia Commodore. 2016. “Black Male Success in STEM: A Case Study of Morehouse College.” Journal of Diversity in Higher Education, February 22.
Joo, Nathan, and Richard V. Reeves. 2017. “The Contributions of Historically Black Colleges and Universities to Upward Mobility.” Brookings Social Mobility Memos. https://www.brookings.edu/blog/social-mobility-memos/2017/01/19/the-contribution-of-historically-black-colleges-and- universities-to-upward-mobility.
Pratt, Timothy. 2016. “Why More Black Students Are Enrolling in Historically Black Colleges.” The Hechinger Report, September 28. http://hechingerreport.org/why-more-black-students-are- enrolling-in-historically-black-colleges.
Washington, Amanda, and Marybeth Gasman. 2016. “Why Enrollment Is Increasing at HBCUs.” The Hill, August 22. http://thehill.com/blogs/pundits-blog/education/292245-why-enrollment-is- increasing-at-hbcus.

AMERICAN COUNCIL ON EDUCATION 15
ENROLLMENT
Enrollment patterns at PBIs are more similar across sectors than at HBCUs. Overall, the majority of students at all PBIs enrolled through mixed enrollment (see Table 4). Over 60 percent of students at public PBIs and half of all students at private four-year PBIs had mixed enrollment. Students at private four-year PBIs were more likely to enroll exclusively full time (42 percent) than their peers at public two-year (26 percent) and pub-lic four-year institutions (25 percent).
TABLE 4. Percent of Total Enrolled at PBIs by Enrollment Intensity: Fall 2007 Cohort
Enrollment Intensity Public Two-Year PBI Public Four-Year PBI Private Four-Year PBI
Overall Cohort Size 20,986 4,486 2,650
% Enrolled Exclusively Full Time 26 25 42
% Enrolled Exclusively Part Time 13 8 8
% Enrolled with Mixed Enrollment 62 68 50
OUTCOMES
Outcomes for students who started at a four-year PBI are presented in Table 5. Table 6 reflects outcomes for students who started at a public two-year PBI. Each table also includes the aggregated federal graduation rate for the institutions included in the data provided by NSC. As previously mentioned, the federal graduation rate cohort is most comparable to the exclusively full-time subcohort in the NSC data.
Public four-year PBIsCompletion at Starting Institution: Data from NSC reveal a 34.1 percent total completion rate for the 2007 cohort of public four-year PBI students. The total completion rate increased by more than 17 percentage points when the cohort was restricted to students who enrolled exclusively full time (51.5 percent). However, the fed-eral graduation rate for public four-year PBIs in our sample was only 16.6 percent, nearly 35 percentage points lower than the comparable NSC rate. Furthermore, 35.1 percent of the exclusively full-time students completed their certificate/degree at their starting institution.
PREDOMINANTLY BLACK INSTITUTIONS

16 PULLING BACK THE CURTAIN: ENROLLMENT AND OUTCOMES AT MINORITY SERVING INSTITUTIONS
Transfer and Completion: Approximately 16 percent of the total cohort completed their first certificate/degree at another institution: nearly 5 percent did so at a two-year institution and approximately 11 percent trans-ferred to and completed at a different four-year institution. Around 16 percent of students in the exclusively full-time subcohort completed their first certificate/degree at a different institution, with 3.6 percent transfer-ring to a two-year institution and nearly 13 percent transferring to another four-year institution.
Persistence: Around 26 percent of the total cohort and 8.9 percent of the exclusively full-time cohort were still enrolled pursuing their first credential in the sixth year. Close to 40 percent of the total cohort had yet to complete a certificate/degree and were no longer enrolled at any institution in the sixth year. This rate held constant even for students in the exclusively full-time subcohort.
Private four-year PBIsCompletion at Starting Institution: The total NSC completion rate for the 2007 cohort of private four-year PBIs students was 47 percent. The total completion rate increased to nearly 63 percent for students in the exclusively full-time subcohort, with 52.2 percent of the cohort completing their certificate/degree at their starting institution. However, the federal graduation rate for private four-year PBIs in our sample was only 30.5 percent.
Transfer and Completion: Approximately 11 percent of the total cohort completed their first credential at another institution: around 3 percent did so at a two-year institution and close to 9 percent transferred to and completed at a different four-year institution. About 2 percent of exclusively full-time students transferred to a two-year institution, while nearly 9 percent transferred to a different four-year institution.
Persistence: Fourteen percent of the total cohort and nearly 4 percent of the exclusively full-time cohort at private four-year PBIs were still enrolled pursuing their first certificate/degree in the sixth year. Around 40 per-cent of the cohort had yet to complete a credential and were no longer enrolled at any institution in the sixth year. This rate dropped to 33.5 percent among students who had enrolled exclusively full time.
TABLE 5. Six-Year Outcomes (150% Normal Time) at Four-Year PBIs: Fall 2007 Cohort
Public Four-Year Private Four-Year
NSC Total Completion Rate: Exclusively Full-Time Students 51.5 62.7
Federal Graduation Rate* 16.6 30.5
Public Four-Year Private Four-Year
Overall (Cohort Size = 4,486)
Exclusively Full Time (Cohort Size = 1,101)
Overall (Cohort Size = 2,650)
Exclusively Full Time (Cohort Size =1,102)
Total Completion Rate 34.1 51.5 47.0 62.7
Completed at Starting Institution 18.4 35.1 35.8 52.2
Completed at Different Institution: Two-Year 4.6 3.6 2.5 1.8
Completed at Different Institution: Four-Year 11.1 12.8 8.7 8.7
Still Enrolled (at Any Institution) 26.2 8.9 14.0 3.9
Not Enrolled (at Any Institution) 39.8 39.5 39.1 33.5
* The federal graduation rate is most comparable to the total completion rate for exclusively full-time students in NSC data.

AMERICAN COUNCIL ON EDUCATION 17
Public two-year PBIsCompletion at Starting Institution: The total completion rate for the 2007 cohort of public two-year PBI stu-dents was 22 percent. The rate increased to 37.4 percent when the cohort was restricted to exclusively full-time students, an increase of almost 21 percentage points above their federal graduation rate (16.7 percent). Around 33 percent of exclusively full-time students completed their certificate/degree at their starting institution.
Transfer and Completion: Approximately 2 percent of the total cohort transferred and completed their first credential at another two-year institution. Another 1.5 percent transferred and completed their first certificate/degree at a four-year institution. Less than 1 percent of all students completed a certificate/degree at their starting institution and a subsequent credential at a four-year institution within four years. Around 2 percent of exclusively full-time students completed a credential at both their starting two-year and subsequent four-year institution within four years. In total, approximately 2 percent of all students who started at a two-year public PBI went on to complete a credential at a four-year institution within four years. However, this number increased to nearly 16 percent when the tracking period was extended to eight years (see Appendix B).
Persistence: Around 37 percent of the total cohort and 17.2 percent of the exclusively full-time subcohort were still enrolled pursuing their first credential in the fourth year. More than 41 percent of the total cohort had yet to complete a certificate/degree and were no longer enrolled at any institution in the fourth year. This rate increased to around 45 percent among students who had enrolled exclusively full time.
TABLE 6. Four-Year Outcomes (200% Normal Time) at Public Two-Year PBIs: Fall 2007 Cohort
NSC Total Completion Rate: Exclusively Full-Time Students 37.4
Federal Graduation Rate* 16.7
Overall (Cohort Size = 20,986)
Exclusively Full Time (Cohort Size = 5,372)
Total Completion Rate 22.0 37.4
First Completion at Starting Institution 18.7 32.8
First Completion at Different Institution: Two-Year 1.8 1.8
First Completed at Different Institution: Four-Year 1.5 2.8
Subsequent Completion at a Four-Year 0.7 2.1
Still Enrolled (at Any Institution) 36.9 17.2
Not Enrolled (at Any Institution) 41.2 45.4
* The federal graduation rate is most comparable to the total completion rate for exclusively full-time students in NSC data.

18 BE
YO
ND
TH
E N
UM
BE
RS
A Portrait of Predominantly Black Institutions in Facilitating Success Among Low-Income, First-Generation Black Collegians
Robert T. Palmer, Interim Chair and Associate Professor, Department of Educational Leadership and Policy Studies, Howard University (DC)
and Jared Avery, Senior Research Associate, HUSEM Education Research Center,
Howard University
Predominantly Black Institutions (PBIs) are not well understood in the higher education lexicon, despite serving a large number of students of color: namely, a large number of black1 or African Amer-ican2 students. One reason for this has to do with the relative newness of PBIs as a federally designated classification and a corresponding dearth of research on this unique institution type. As such, in look-ing beyond the numbers presented in this report we share a more complete profile of PBIs and discuss some of the efforts these institutions have proposed to support the success of their students.
When people think about colleges and universities that enroll large percentages of black students, they often think of HBCUs, a group of institutions that initially came into being in 1837 (Gasman, Nguyen, and Conrad 2015). The emergence of PBIs is in fact very recent, having first been recognized by Con-gress via the Predominantly Black Institution Act of 2007. As stated therein, PBIs play an essential and often mission-driven role in providing postsecondary access and training to low- and middle-income black and other minority students.3 Just one year later, the institutional category of PBIs officially emerged from the reauthorization of the Higher Education Act in 2008.4
Unlike HBCUs, which are largely four-year institutions, the vast majority of the 156 PBIs are public two-year colleges (Cunningham, Park, and Engle 2014). PBIs tend to be concentrated in the South, Midwest, and East, and predominantly located in urban areas (U.S. Department of Education 2016b). While most PBIs enroll a student body that is more than 50 percent black, some have a student body that is 75 per-cent black (Postsecondary National Policy Institute 2015). Generally, after black students, whites, and in some cases, Latinos, are the second-largest racial groups enrolled in PBIs. And like other minority serving institutions (MSIs), PBIs serve a population of students who are largely low-income and the first in their families to attend college (Postsecondary National Policy Institute 2015). Given the chang-ing demographics of the United States and the role of higher education in promoting upward mobility, PBIs play a critical role in their communities by providing access and credentials to an increasingly diverse student body.
1 The term black refers to a person having origins in any of the black racial groups of Africa.2 The terms black and African American are used interchangeably.3 Predominantly Black Institution Act of 2007, S. 1513, 110th Cong. (2007).4 Higher Education Opportunity Act, Pub. L. No. 110–315 (2008).

BE
YO
ND
THE
NU
MB
ER
S
19
Using Resources and Opportunities to Support Their Mission of Student SuccessDesignation as an MSI under Title III of the Higher Education Opportunity Act confers upon PBIs their eligibility for formula grants provided by the U.S. Department of Education. Within the federal PBI Program, these formula grants aim to strengthen institutional capacity to serve low- and middle-in-come black students (U.S. Department of Education 2016a). The PBI formula grant draws comparisons to other federal funding programs accessible to MSIs such as the Developing Hispanic-Serving Institu-tions (DHSI) Program.
PREDOMINANTLY BLACK INSTITUTIONS (PBIs)—HIGHLIGHTED EFFORTS AND FORMULA GRANT AWARDS
Predominantly Black Institutions (PBI) Program —Efforts and Formula Grant Awardees FY 2016
Location Institution Highlighted Efforts* FY 2016 Award
DC Trinity Washington University Laboratory equipment and STEM teaching, learn-ing, and research tools
$422,819
GA Albany Technical College Online learning and student support services $962,184
GA Clayton State University Creation of a matching endowment fund for student scholarships, faculty development, and expansion of bridge program for at-risk students
$938,184
GA Oconee Fall Line Technical College Campus security and information technology infra-structure, new program equipment, and outreach and enrollment materials
$296,003
LA Baton Rouge Community College Bridge-type academic boot camps and creation of student tracking system and intrusive advising
$1,269,639
LA South Louisiana Community College Professional development and training opportuni-ties for SLCC personnel and student matriculation assistance
$549,028
MS Hinds Community College Teacher preparation, development, instructional program enhancement using hybrid and online forms of delivery, and wrap-around student support services
$1,652,118
NC Edgecombe Community College Community outreach, intrusive advising, and devel-opmental math and English course redesign
$409,549
NY York College of the City of New York Articulation agreements and dual joint degree programs with community colleges
$999,136
NY Marygrove College Comprehensive Individualized Retention Plans $509,703
NY Metropolitan College of New York Early alert system for at-risk students and new student support facilities
$885,857
TOTAL ALLOCATION $8,894,220
* Includes only a few selected efforts for each institution. Full descriptions of how the FY 2016 grantees intend to use their formula grant funding can be found through the Department of Education PBI Program Formula Grant award page.

20 BE
YO
ND
TH
E N
UM
BE
RS
Institutions who receive formula grant funding can use the funds to defray the cost of federally desig-nated allowable activities that support expanding educational opportunities for their students. Exam-ples of these activities include opportunities for faculty development, student support services, and the development of academic programs (U.S. Department of Education 2016a). Through the PBI Program, institutions can foster access and success among underrepresented college students by implementing activities that seek to strengthen academic program quality and facilitate students’ success in higher education.
A review of campus-generated abstracts—from the institutions that have received formula grant awards totaling close to $9 million in FY 2016 (U.S. Department of Education 2016a)—establish a portrait of how PBIs function as drivers of educational excellence in the primary areas of retention and comple-tion. While there is wide programmatic variation among these efforts, they share a common purpose: to enhance and strengthen the college experience for low-income, first-generation black collegians. Such work in turn can strengthen the ability of PBIs to serve all students and to transform institutional programs and practices, leading to increased student persistence and completion.
The federal awards utilized by PBIs support a multitude of infrastructure and programmatic efforts, many of which have a sound evidence base showing their effectiveness in supporting at-risk students. Some of the noted efforts focus on the construction of cutting-edge research facilities, the adoption of technology-centered teaching and learning tools in classrooms, and the procurement of equipment and technologies for STEM laboratories. Other efforts allow for the formation of matching endowment funds for student scholarships, the implementation of bridge programs, and the coordination of pro-fessional development workshops for student affairs administrators and university faculty. A portion of the awarded funds are also intended to support black male academic and leadership development pro-grams, initiatives designed to enhance the academic and social experiences of black male collegians.
Federal grant awards utilized by PBIs expand the ability of these institutions to cultivate high quality and engaging learning environments, which are critically important to student persistence and degree completion (Kuh, Kinzie, Schuh, Whitt, and Associates 2010). Similar to their HBCU counterparts, PBIs invest their federal funding to strengthen institutional capacities and bring forth this type of delivery. The variability with which PBI awardees have been able to identify and respond to the needs of college- goers uniquely tie to each institutional mission and its particular locality. A few highlights of how PBI awardees indicated they planned to use their funding consist of the following:
• Clayton State University, through its formula grant, will integrate institution-wide collabora-tions to improve student success under the Laker Bridge to Completion Program. The program seeks to expand its support for at-risk students through expanded financial counseling services and online course completion options. The program also seeks to establish a tutoring service for underperforming students in writing; target career readiness to prepare students for intern-ships and careers upon graduation; establish a black student mentor program, partnering stu-dents with community mentors; and create a match endowment fund for student scholarships (U.S. Department of Education 2016a).
• At Edgecombe Community College, the PBI grant will fund two Student Success Centers, one on each of the college’s two campuses. Edgecombe will conduct community outreach and sup-port its students through intrusive advising and structured scheduling. These funds will also be used to redesign developmental math and English courses. Finally, these funds will be used to

BE
YO
ND
THE
NU
MB
ER
S
21
create a black male initiative through which the college aims to improve retention and comple-tion for black males on campus (U.S. Department of Education 2016a).
• Trinity Washington University plans to utilize its PBI grant funding to procure the laboratory instrumentation and technologies essential to the learning experiences of its students. Access to and utilization of new microscopes, imaging technologies, manikins, and medical dosage simulators will improve students’ knowledge and skills, giving them a competitive advantage in the job market. Through these efforts, Trinity expects to see improved student outcomes includ-ing persistence, completion, job placement, and entry into advanced degree programs for black science and nursing students (U.S. Department of Education 2016a).
The work of PBIs spans beyond their local communities, preparing students who may not otherwise access or complete higher education contributes to national economic and workforce goals. PBIs, as a subset of American higher education institutions, have a role in helping to fulfill such goals and are uniquely positioned to do so. Much of the grant program funding assists PBIs in preparing incoming students for college-level coursework, alerting them to when students fall behind, and assisting stu-dents in matriculation to four-year institutions (U.S. Department of Education 2016a).
In addition to formula grants, PBIs are also eligible to apply for federal competitive grants, which are also given through the Department of Education. The competitive grants are designed to support the establishment or strengthening of programs in the following areas: (1) science, technology, engineer-ing, and mathematics (STEM) education; (2) health education; (3) internationalization or globalization; (4) teacher preparation; and (5) improving educational outcomes among black males (U.S. Department of Education 2016a).
ConclusionWhile there is a dearth of empirical research on PBIs, this report adds to a growing body of work on these important institutions and their role in facilitating access and success to higher education for low-income, first-generation black collegians and other students of color. The data from the National Student Clearinghouse shared in this report provide a more robust picture of student enrollment and completion at PBIs than what is otherwise publicly available. While these data fill a gap in the research, more research is needed to fully understand how the programs, services, and institutional qualities of PBIs influence academic and nonacademic outcomes for the students they serve.
REFERENCES
Cunningham, Alisa, Eunkyoung Park, and Jennifer Engle. 2014. Minority-Serving Institutions: Doing More with Less. Washington, DC: Institute for Higher Education Policy.
Gasman, Marybeth, Thai-Huy Nguyen, and Clifton F. Conrad. 2015. “Lives Intertwined: A Primer on the History and Emergence of Minority Serving Institutions.” Journal of Diversity in Higher Education 8 (2): 120–138.
Kuh, George D., Jillian Kinzie, John H. Schuh, Elizabeth J. Whitt, and Associates. 2010. Student Success in College: Creating Conditions That Matter. San Francisco: Jossey-Bass.
Postsecondary National Policy Institute. 2015. “Predominantly Black Institutions: A Background Primer.” https://www.newamerica.org/post-secondary-national-policy-institute/our-blog/ predominantly-black-institutions-pbis/.

22 BE
YO
ND
TH
E N
UM
BE
RS
Sáenz, Victor B., and Luis Ponjuán. 2016. The Texas Education Consortium for Male Students of Color: Cross-Sector Collaboration as a Model for Improving Educational Outcomes. Viewpoints: Voices from the Field. Washington, DC: American Council on Education.
U.S. Department of Education. 2016a. Predominantly Black Institutions Program – Formula Grants: FY 2016 Awards. Washington, DC: U.S. Department of Education.
U.S. Department of Education. 2016b. Predominantly Black Institutions Program – Formula Grants: Pro-gram Map of Participating Institutions. Washington, DC: U.S. Department of Education.

AMERICAN COUNCIL ON EDUCATION 23
ENROLLMENT
As seen with HBCUs, enrollment patterns at HSIs vary between public and private institutions. The major-ity of students at public HSIs enrolled through mixed enrollment (see Table 7). At public two-year HSIs, 72 percent of students enrolled through mixed enrollment and 16 percent enrolled exclusively full time. At public four-year HSIs, 66 percent of students enrolled through mixed enrollment and 28 percent enrolled exclusively full time. Students at four-year private HSIs were more likely to enroll exclusively full time (49 percent) than through mixed enrollment (45 percent).
TABLE 7. Percent of Total Enrolled at HSIs by Enrollment Intensity: Fall 2007 Cohort
Enrollment Intensity Public Two-Year HSI Public Four-Year HSI Private Four-Year HSI
Overall Cohort Size 158,007 73,437 8,362
% Enrolled Exclusively Full Time 16 28 49
% Enrolled Exclusively Part Time 12 6 6
% Enrolled with Mixed Enrollment 72 66 45
OUTCOMES
Outcomes for students who started at a four-year HSI are presented in Table 8. Table 9 reflects outcomes for students who started at a public two-year HSI. Each table also includes the aggregated federal graduation rate for the institutions included in the data provided by NSC. As previously mentioned, the federal graduation rate cohort is most comparable to the exclusively full-time subcohort in the NSC data.
Public four-year HSIsCompletion at Starting Institution: Data from NSC reveal a close to 50 percent total completion rate for the 2007 cohort of public four-year HSI students. The total completion rate increased to over 74 percent for students who enrolled exclusively full time. However, the federal graduation rate for public four-year HSIs was over 31 percentage points lower (42.7 percent). Furthermore, approximately 64 percent of exclusively full-time students completed their certificate/degree at their starting institution.
HISPANIC-SERVING INSTITUTIONS

24 PULLING BACK THE CURTAIN: ENROLLMENT AND OUTCOMES AT MINORITY SERVING INSTITUTIONS
Transfer and Completion: Approximately 13 percent of the total cohort completed their first certificate/degree at another institution: 4 percent did so at a two-year institution and approximately 9 percent transferred to and completed at a different four-year institution. Approximately 10 percent of students in the exclusively full-time subcohort completed their first certificate/degree at a different institution, with nearly 3 percent transferring to a two-year institution and 7.6 percent transferring to another four-year institution.
Persistence: Almost a quarter of the total cohort (24.1 percent) and 6.9 percent of the exclusively full-time subcohort were still pursuing their first credential in the sixth year. Around 26 percent of the total cohort had yet to complete a certificate/degree and were no longer enrolled at any institution in the sixth year. This rate dropped to 19 percent among students who had enrolled exclusively full time.
Private four-year HSIsCompletion at Starting Institution: The total NSC completion rate for the 2007 cohort of private four-year HSI students was 60.5 percent. The total completion rate increased to nearly 78 percent for students in the exclusively full-time subcohort, with 68 percent of the subcohort completing their certificate/degree at their starting institution. However, the federal graduation rate for private four-year HSIs was only 49.1 percent, or almost 29 percentage points lower than the comparable NSC rate.
Transfer and Completion: Thirteen percent of the total cohort completed their first credential at another insti-tution: around 3 percent did so at a two-year institution and close to 10 percent transferred to and completed at a different four-year institution. About 2 percent of exclusively full-time students transferred to a two-year institution, while 8.1 percent transferred to another four-year institution.
Persistence: Nearly 15 percent of the total cohort and 3.9 percent of the exclusively full-time subcohort at private four-year HSIs were still enrolled pursuing their first certificate/degree in the sixth year. Around 25 percent of the cohort had yet to complete a credential and were no longer enrolled at any institution in the sixth year. This rate dropped to 18.3 percent among students who had enrolled exclusively full time.
TABLE 8. Six-Year Outcomes (150% Normal Time) at Four-Year HSIs: Fall 2007 Cohort
Public Four-Year Private Four-Year
NSC Total Completion Rate: Exclusively Full-Time Students 74.1 77.9
Federal Graduation Rate* 42.7 49.1
Public Four-Year Private Four-Year
Overall (Cohort Size = 73,437)
Exclusively Full Time (Cohort Size = 20,310)
Overall (Cohort Size = 8,362)
Exclusively Full Time (Cohort Size = 4,107)
Total Completion Rate 49.5 74.1 60.5 77.9
Completed at Starting Institution 36.6 63.8 47.5 68.0
Completed at Different Institution: Two-Year 4.0 2.7 3.4 1.7
Completed at Different Institution: Four-Year 8.8 7.6 9.6 8.1
Still Enrolled (at Any Institution) 24.1 6.9 14.9 3.9
Not Enrolled (at Any Institution) 26.4 19.0 24.6 18.3
* The federal graduation rate is most comparable to the total completion rate for exclusively full-time students in NSC data.

AMERICAN COUNCIL ON EDUCATION 25
Public two-year HSIs
Completion at Starting Institution: The total completion rate for the 2007 cohort of public two-year HSI stu-dents was approximately 21 percent. The rate increased to over 40 percent when the cohort was restricted to exclusively full-time students, an increase of close to 15 percentage points above their federal graduation rate (25.5 percent). Around 34 percent of exclusively full-time students completed their certificate/degree at their starting institution.
Transfer and Completion: Approximately 4 percent of the total cohort transferred and completed their first credential at another institution within four years. Half transferred and completed their first certificate/degree at another two-year institution, while the other half completed at a four-year institution. Only 1.3 percent com-pleted a certificate/degree at their starting institution and a subsequent credential at a four-year institution. Students who enrolled exclusively full time were more likely to complete a degree at a transfer institution, either as a first or subsequent credential. In total, around 3 percent of all students who started at a public two-year HSI went on to complete a credential at a four-year institution within four years. However, this number increased to nearly 23 percent when the tracking period was extended to eight years (see Appendix B).
Persistence: Around 45 percent of the total cohort and 16.8 percent of the exclusively full-time subcohort were still enrolled pursuing their first credential in the fourth year. Approximately 34 percent of the total cohort had yet to complete a certificate/degree and were no longer enrolled at any institution in the fourth year. This rate increased to around 42.8 percent among students who had enrolled exclusively full time.
TABLE 9. Four-Year Outcomes (200% Normal Time) at Public Two-Year HSIs: Fall 2007 Cohort
NSC Total Completion Rate: Exclusively Full-Time Students 40.3
Federal Graduation Rate* 25.5
Overall (Cohort Size = 158,007)
Exclusively Full Time (Cohort Size = 25,157)
Total Completion Rate 21.3 40.3
First Completion at Starting Institution 17.5 34.2
First Completion at Different Institution: Two-Year 1.9 2.0
First Completed at Different Institution: Four-Year 1.9 4.0
Subsequent Completion at a Four-Year 1.3 5.2
Still Enrolled (at Any Institution) 44.6 16.8
Not Enrolled (at Any Institution) 34.2 42.8
* The federal graduation rate is most comparable to the total completion rate for exclusively full-time students in NSC data.
26 BE
YO
ND
TH
E N
UM
BE
RS
A Closer Look at Hispanic-Serving Institutions
Gina A. Garcia, Assistant Professor, University of Pittsburgh and
Morgan Taylor, Policy Research Analyst, American Council on Education
Hispanic-Serving Institutions (HSIs) have a rich and storied history. Beginning as a grassroots effort in the 1980s, HSIs were first recognized by educators and policymakers as institutions that enroll a large concentration of Latinx1 students (Santiago 2006). Created in 1986, the Hispanic Association of Col-leges and Universities (HACU), the membership association for HSIs, served as a leader in the effort to persuade Congress to formally recognize HSIs in 1992 and target federal appropriations to these institutions (HACU 2017).
Because an institution’s eligibility to become an HSI is predicated on enrollment, the number of HSIs changes on an annual basis. Currently, over 470 two- and four-year institutions meet the enrollment threshold to apply for eligibility to participate in the U.S. Department of Education’s Developing His-panic-Serving Institutions Program (found in Title V of the Higher Education Opportunity Act), and more than 300 are inching toward that threshold, a group also known as “Emerging HSIs” (Excelencia in Education 2017a, 2017c). As Latinx student enrollment in higher education and the number of insti-tutions eligible to become HSIs grow each year, HSIs’ significance to national college completion and workforce goals also grows (Garcia 2017).
Despite falling under one umbrella, it is important to recognize that HSIs are not a monolithic group, but are diverse by type, size, Carnegie Classification, regional location, institutional resources and expenditures, and purpose (Núñez and Elizondo 2012). In 2015–16,2 HSIs were almost evenly split between two-year (49 percent) and four-year (51 percent) institutions. Two-thirds of HSIs were public institutions, compared to one-third private institutions. Geographically, HSIs were located in 19 states across the U.S.; however, the vast majority of HSIs (81 percent) were heavily concentrated in just five states3 and Puerto Rico. Emerging HSIs were more spread out across the U.S., located in 35 states and DC (Excelencia in Education 2017c). In many ways, HSIs are as diverse as the higher education enter-prise itself.
This essay provides a brief overview of the students enrolled at HSIs, followed by an examination of what it means to be a Latinx-serving institution illustrated through institutional examples of how HSIs work to ensure the success of their students. The essay concludes with a discussion on the role of fed-eral funding in enhancing institutional capacity to serve Latinx students.
Students Enrolled at HSIsHSIs play a critical role in postsecondary education for Latinx students. Nearly half (46 percent) of all students enrolled at HSIs are Latinx. Further, HSIs collectively enroll nearly two-thirds of all Latinx stu-dents in postsecondary education (Excelencia in Education 2017c). They also confer over 40 percent of all bachelor’s degrees and 60 percent of all associate degrees earned by Latinx students (Cunningham, Park, and Engle 2014; Harmon 2012).
1 We use the term, “Latinx” rather than “Latino,” as Latinx is a gender inclusive term for people who self-identify as having roots in Latin America, including Central America, South America, Mexico, and the Caribbean.
2 This 2015–16 academic year reflects the most recent publicly available data. 3 States with the largest number of HSIs include California, Florida, New Mexico, New York, and Texas.
BE
YO
ND
THE
NU
MB
ER
S
27
In addition, HSIs enroll a largely nontraditional student body. This includes adult learners, low-income students, first-generation college goers, non-native English speakers, immigrant students, transfer stu-dents, and those balancing work and family (Malcom-Piqueux and Lee 2011; Núñez and Bowers 2011; Santiago, Taylor, and Calderón Galdeano 2016). While these characteristics make for a diverse profile of students, research suggests that nontraditional students may not persist at the same rate as their more traditional peers (Rodríguez and Kelly 2014; Titus 2006) because they face additional barriers that may be outside of their control—job loss, food insecurity, inadequate child care, and various forms of dis-crimination, to name a few. HSIs increase postsecondary access for an underserved population while simultaneously embracing the opportunity and challenge of educating a group of students who have faced numerous barriers throughout their educational journeys. This enrollment alone is an important endeavor for HSIs.
What Does It Mean to Serve Latinx Students?
While HSIs enroll a high concentration of Latinx students, many have raised the important distinction between enrollment and service. Higher education has reached the moment when collectively, HSI leaders, advocates, scholars, and legislators must decide what students can and should garner and experience as a result of attending an HSI. Put more simply: what does it mean to serve Latinx students beyond enrollment?
Previously, colleges and universities focused primarily on providing access to a higher education, and students were often considered solely responsible for their own success. However, as student demo-graphics have changed, so too have students’ needs. As such, the idea of “serving” students has evolved to include providing supports and facilitating completion. This requires a level of intentionality on the part of institutions, and must go beyond enrollment. As HSIs look to the future, beyond their com-mitment to enrolling a diverse student body, they are right to deliberate and construct organizational identities that exemplify what it means to be Latinx-serving (see Garcia 2017). Given the high concen-tration of Latinx students at HSIs, and as the Latinx population enrolling in postsecondary education continues to grow (U.S. Department of Education 2016), it is critical to understand what HSIs are doing to ensure their success.
Excelencia in Education, a national nonprofit, recognizes programs at institutions, including HSIs, that have shown effectiveness in accelerating the success of Latinx students. Excelencia’s Growing What Works database serves as a resource of programs that have been recognized by the organization as leading examples of institutional policies and practices that promote Latinx student success. Grounded in evidence, these programs demonstrate the strides they have made in providing access, increasing retention, and graduating Latinx students (Excelencia in Education 2017b). Examples of programs at HSIs that have been recognized by the organization for their work include:
• City Colleges of Chicago-Harry S. Truman College’s Transitional Bilingual Learning Community (TBLC) works to increase enrollment of Latinx English language learners in the institution’s credit program. This two-semester, full-time credit initiative was designed to help Latinx English language learners transition into college-level courses taught in English upon completing the program. TBLC utilizes learning communities to provide students with academic support, bilingual, and financial services. The program provides a space in which students can learn the culture of higher education while also supporting their identities and experiences. As a result of the program, TBLC students earn their associate degree at four times the rate of nonparticipants and also transfer after earning their degree at seven times the rate of

28 BE
YO
ND
TH
E N
UM
BE
RS
nonparticipants (Excelencia in Education 2017b).
• California State University, Fullerton’s Enhancing Postbaccalaureate Opportunities at CSUF for Hispanic Students (EPOCHS) program seeks to close the achievement gap between Latinx and non-Latinx graduate students through bilingual workshops for students and families, as well as tutoring and mentoring services. EPOCHS addresses campus climate through cultural competency workshops for faculty and provides outreach activities with local high schools, community colleges, and nonprofit organizations. As a result of the program, the three-year graduation rate for master’s students increased from 51 percent in 2010 to 63 percent in 2015. Of faculty who attended cultural competency workshops, 100 percent stated it helped increase their understanding of challenges faced by Latinx students (Excelencia in Education 2017b).
• South Texas College’s Early College High Schools Program aims to close achievement gaps through partnerships with 30 high schools, preparing ninth and 10th graders for college-level courses and offering eligible 11th and 12th graders the opportunity to enroll in and complete dual credit courses in high school. The program focuses on low-income students who are likely to be the first in their families to attend college. It provides them a nurturing environment in which they can receive the additional support needed to succeed. As a result of the program, over the last five years, more than 1,400 students have graduated with an associate degree at no cost to the student or their family (Excelencia in Education 2017b).
Although there are differences among these programs, they share similar elements that work to increase the success of Latinx students. These include community outreach with local high schools to inform their Latinx community about the institution, student support services, offering opportunities for financial aid, and providing cultural competency for faculty so that they can better understand the backgrounds and needs of their Latinx students. While these practices work to increase the success of Latinx students, HSIs need the funding and institutional capacity in which to provide these efforts.
Federal Investment in HSIsHSIs serve a profile of students who often require embedded support to persist and graduate, necessi-tating the resources or capacity to provide such support; which is why federal, state, and other funding is so important to the sustainability of HSIs. An examination of 20 years of Title V funding shows that 70 percent of grant recipients invested their funding into three activities: faculty and curriculum devel-opment, student support services, and funds and administrative management. There exists evidence that investing in these activities improves students’ academic achievement and institutional capacity to facilitate such achievement (Santiago et al. 2016).
However, to continue serving Latinx students, HSIs need more adequate funding. According to HACU, HSIs receive just 69 cents per student for every federal dollar going to all other colleges and univer-sities (HACU 2016). Furthermore, ACE’s 2015 brief on government investment in public HSIs shows that federal funding has decreased in recent years as the number of institutions competing for these funds has increased. Due to the financial backgrounds of the student population they serve, HSIs have limited ability to raise tuition as a revenue source. This in turn increases their dependence on federal funding and vulnerability to declines in federal appropriations (Nellum and Valle 2015). It is well docu-mented that greater institutional resources lead to greater outcomes (Gansemer-Topf and Schuh 2006; Zhang 2009). Providing further support to these institutions, therefore, is critical given the important role they play, and will continue to play, in the education of Latinx students nationally.

BE
YO
ND
THE
NU
MB
ER
S
29
Conclusion Serving Latinx students requires intentionality. The institutions highlighted here offer a small taste of what HSIs are doing to help their students succeed. If we are to invest in this growing group of insti-tutions and the students that they serve, adequate funding is necessary. The intentionality at these institutions to serve their Latinx students stands as examples for the field at large, including other institutions that are experiencing an increase in student body diversity. As depicted in this essay, HSIs serve as role models whose successes provide opportunities for other institutions to learn effective practices to serve Latinx students. HSIs offer a glimpse into the future of what it means to serve and should be given the appropriate attention and support for the role they play in the higher education of Latinx students.
REFERENCES
Cunningham, Alisa, Eunkyoung Park, and Jennifer Engle. 2014. Minority-Serving Institutions: Doing More with Less. Washington, DC: Institute for Higher Education Policy.
Excelencia in Education. 2017a. Emerging Hispanic-Serving Institutions (HSIs): 2015-2016. Washington, DC: Excelencia in Education. http://www.edexcelencia.org/hsi-cp2/research/hsis-2015-16.
Excelencia in Education. 2017b. Growing What Works Database. Accessed April 4. http://edexcelencia.org/growing-what-works.
Excelencia in Education. 2017c. Hispanic-Serving Institutions (HSIs): 2015-2016. Washington, DC: Excel-encia in Education. http://www.edexcelencia.org/hsi-cp2/research/emerging-hsis-2015-16.
Gansemer-Topf, Ann M., and John H. Schuh. 2006. “Institutional Selectivity and Institutional Expendi-tures: Examining Organizational Factors That Contribute to Retention and Graduation.” Research in Higher Education 47 (6): 613–642.
Garcia, Gina A. 2017. “Defined by Outcomes or Culture? Constructing an Organizational Identity for Hispanic Serving Institutions.” American Education Research Journal.
Harmon, Noel. 2012. The Role of Minority-Serving Institutions in National College Completion Goals. Washington, DC: Institute for Higher Education Policy.
Hispanic Association of Colleges and Universities (HACU). 2017. “About HACU: HACU 101.” http://www.hacu.net/hacu/HACU_101.asp.
Santiago, Deborah A. 2006. Inventing Hispanic-Serving Institutions (HSIs): The Basics. Washington, DC: Excelencia in Education
Hispanic Association of Colleges and Universities. 2016. “Appropriations.” http://hacuadvocates.net/appropriations.
Malcom-Piqueux, Lindsey E., and John Michael Lee Jr. 2011. Hispanic-Serving Institutions: Contribu-tions and Challenges. New York: College Board. https://research.collegeboard.org/publications/hispanic-serving-institutions-contributions-and-challenges.
Nellum, Christopher J., and Katherine Valle. 2015. Government Investment in Public Hispanic-Serving Institutions. Washington, DC: American Council on Education.
Núñez, Anne-Marie, and Diane Elizondo. 2012. Hispanic-Serving Institutions in the U.S. Mainland and Puerto Rico: Organizational Characteristics, Institutional Financial Context, and Graduation Out-comes. White paper. San Antonio, TX: Hispanic Association of Colleges and Universities.

30 BE
YO
ND
TH
E N
UM
BE
RS
Rodríguez, Awilda, and Andrew P. Kelly. 2014. Access, Affordability, and Success: How Do America’s Colleges Fare and What Could It Mean for the President’s Rating Plan? Washington, DC: American Enterprise Institute.
Santiago, Deborah A., Morgan Taylor, and Emily Calderón Galdeano. 2016. From Capacity to Success: HSIs, Title V, and Latino Students. Excelencia in Education. http://www.edexcelencia.org/research/capacity.
Titus, Marvin A. 2006. “Understanding College Degree Completion of Students with Low Socioeco-nomic Status: The Influence of the Institutional Financial Context.” Research in Higher Education 47 (4): 371–398. doi:10.1007/s11162-005-9000-5.
U.S. Department of Education. 2016. U.S. Digest of Education Statistics 2015. Washington, DC: U.S. Department of Education, National Center for Education Statistics.
Zhang, Liang. 2009. “Does State Funding Affect Graduation Rates at Public Four-Year Colleges and Universities?” Educational Policy 23 (5): 714–731.

AMERICAN COUNCIL ON EDUCATION 31
ENROLLMENT
Enrollment intensity at AANAPISIs differs greatly between public and private institutions, but also between public two-year and public four-year institutions. Almost three-quarters of students at public two-year AANAPISIs and half of students at public four-year AANAPISIs enrolled through mixed enrollment. Compar-atively, almost three-quarters of students at four-year private AANAPISIs enrolled exclusively full time (see Table 10).
TABLE 10. Percent of Total Enrolled at AANAPISIs by Enrollment Intensity: Fall 2007 Cohort
Enrollment Intensity Public Two-Year AANAPISI Public Four-Year AANAPISI Private Four-Year AANAPISI
Overall Cohort Size 157,294 204,940 83,178
% Enrolled Exclusively Full Time 16 45 71
% Enrolled Exclusively Part Time 11 4 3
% Enrolled with Mixed Enrollment 73 50 26
OUTCOMES
Outcomes for students who started at a four-year AANAPISI are presented in Table 11. Table 12 reflects outcomes for students who started at a public two-year AANAPISI. Each table also includes the aggregated federal graduation rate for the institutions included in the data provided by NSC. As previously mentioned, the federal graduation rate cohort is most comparable to the exclusively full-time subcohort in the NSC data.
Public four-year AANAPISIsCompletion at Starting Institution: Data from NSC reveal a 68.6 percent total completion rate for the 2007 cohort of public four-year AANAPISI students. The total completion rate increased to nearly 88 percent when the cohort was restricted to students who enrolled exclusively full time. However, the federal graduation rate for public four-year AANAPISIs in our sample was 66.2 percent, nearly 22 percentage points lower than the comparable NSC rate. Furthermore, nearly 80 percent of the exclusively full-time students completed their certificate/degree at their starting institution.
ASIAN AMERICAN AND NATIVE AMERICAN PACIFIC ISLANDER-SERVING INSTITUTIONS
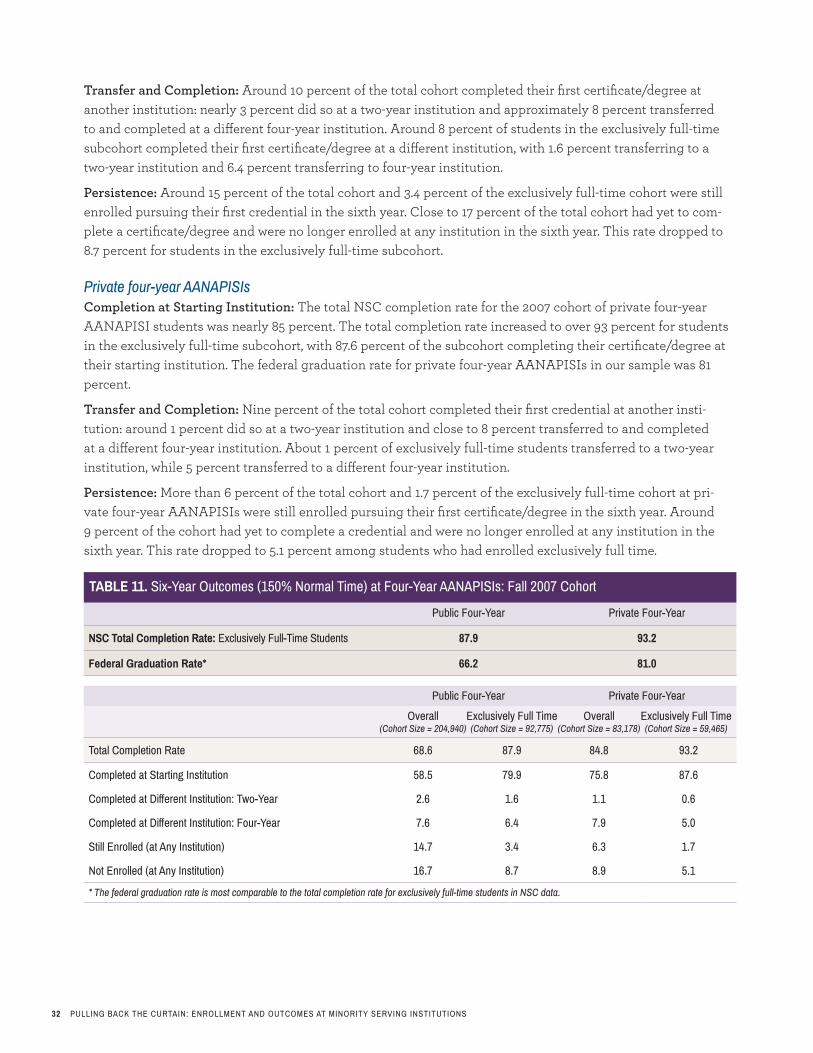
32 PULLING BACK THE CURTAIN: ENROLLMENT AND OUTCOMES AT MINORITY SERVING INSTITUTIONS
Transfer and Completion: Around 10 percent of the total cohort completed their first certificate/degree at another institution: nearly 3 percent did so at a two-year institution and approximately 8 percent transferred to and completed at a different four-year institution. Around 8 percent of students in the exclusively full-time subcohort completed their first certificate/degree at a different institution, with 1.6 percent transferring to a two-year institution and 6.4 percent transferring to four-year institution.
Persistence: Around 15 percent of the total cohort and 3.4 percent of the exclusively full-time cohort were still enrolled pursuing their first credential in the sixth year. Close to 17 percent of the total cohort had yet to com-plete a certificate/degree and were no longer enrolled at any institution in the sixth year. This rate dropped to 8.7 percent for students in the exclusively full-time subcohort.
Private four-year AANAPISIsCompletion at Starting Institution: The total NSC completion rate for the 2007 cohort of private four-year AANAPISI students was nearly 85 percent. The total completion rate increased to over 93 percent for students in the exclusively full-time subcohort, with 87.6 percent of the subcohort completing their certificate/degree at their starting institution. The federal graduation rate for private four-year AANAPISIs in our sample was 81 percent.
Transfer and Completion: Nine percent of the total cohort completed their first credential at another insti-tution: around 1 percent did so at a two-year institution and close to 8 percent transferred to and completed at a different four-year institution. About 1 percent of exclusively full-time students transferred to a two-year institution, while 5 percent transferred to a different four-year institution.
Persistence: More than 6 percent of the total cohort and 1.7 percent of the exclusively full-time cohort at pri-vate four-year AANAPISIs were still enrolled pursuing their first certificate/degree in the sixth year. Around 9 percent of the cohort had yet to complete a credential and were no longer enrolled at any institution in the sixth year. This rate dropped to 5.1 percent among students who had enrolled exclusively full time.
TABLE 11. Six-Year Outcomes (150% Normal Time) at Four-Year AANAPISIs: Fall 2007 Cohort
Public Four-Year Private Four-Year
NSC Total Completion Rate: Exclusively Full-Time Students 87.9 93.2
Federal Graduation Rate* 66.2 81.0
Public Four-Year Private Four-Year
Overall (Cohort Size = 204,940)
Exclusively Full Time (Cohort Size = 92,775)
Overall (Cohort Size = 83,178)
Exclusively Full Time (Cohort Size = 59,465)
Total Completion Rate 68.6 87.9 84.8 93.2
Completed at Starting Institution 58.5 79.9 75.8 87.6
Completed at Different Institution: Two-Year 2.6 1.6 1.1 0.6
Completed at Different Institution: Four-Year 7.6 6.4 7.9 5.0
Still Enrolled (at Any Institution) 14.7 3.4 6.3 1.7
Not Enrolled (at Any Institution) 16.7 8.7 8.9 5.1
* The federal graduation rate is most comparable to the total completion rate for exclusively full-time students in NSC data.

AMERICAN COUNCIL ON EDUCATION 33
Public two-year AANAPISIsCompletion at Starting Institution: The total completion rate for the 2007 cohort of public two-year AANAPISI students was approximately 21 percent. The rate increased to nearly 43 percent when the cohort was restricted to exclusively full-time students, an increase of nearly 15 percentage points above their federal graduation rate (27.9 percent). Around 33 percent of exclusively full-time students completed their certificate/degree at their starting institution.
Transfer and Completion: Approximately 2 percent of the total cohort transferred and completed their first credential at another two-year institution. Another 3 percent transferred and completed their first certificate/degree at a four-year institution. Only about 1 percent of all students completed a certificate/degree at their starting institution and a subsequent credential at a four-year institution within four years. Around 6 percent of exclusively full-time students completed a credential at both their starting two-year and subsequent four-year institution within four years. In total, approximately 4 percent of all students who started at a public two-year AANAPISI went on to complete a credential at a four-year institution within four years. However, this number increased to nearly 27 percent when the tracking period was extended to eight years (see Appendix B).
Persistence: Around 48 percent of the total cohort and 22.9 percent of the exclusively full-time subcohort were still enrolled pursuing their first credential in the fourth year. Nearly 31 percent of the total cohort had yet to complete a certificate/degree and were no longer enrolled at any institution in the fourth year. This rate increased to around 35 percent among students who had enrolled exclusively full time.
TABLE 12. Four-Year Outcomes (200% Normal Time) at Public Two-Year AANAPISIs: Fall 2007 Cohort
NSC Total Completion Rate: Exclusively Full-Time Students 42.6
Federal Graduation Rate* 27.9
Overall (Cohort Size = 157,294)
Exclusively Full Time (Cohort Size = 25,453)
Total Completion Rate 21.4 42.6
First Completion at Starting Institution 16.2 32.7
First Completion at Different Institution: Two-Year 2.3 2.5
First Completed at Different Institution: Four-Year 3.0 7.4
Subsequent Completion at a Four-Year 1.4 5.9
Still Enrolled (at Any Institution) 47.7 22.9
Not Enrolled (at Any Institution) 30.8 34.5
* The federal graduation rate is most comparable to the total completion rate for exclusively full-time students in NSC data.

34 BE
YO
ND
TH
E N
UM
BE
RS
A Closer Look at AAPI Students and the Role of AANAPISIs in Facilitating Student Success
Dina C. Maramba, Associate Professor of Higher Education, Claremont Graduate University (CA)
Higher education can learn valuable lessons from minority serving institutions (MSIs), especially when we reflect on how to help college students succeed. As many of us in education know, an ongoing chal-lenge for institutions of higher education is creating learning environments that contribute to student achievement. While it is expected that colleges and universities will work to help all of their students succeed, it is equally important that they have a depth of understanding of their student populations in order to provide tailored support for their success.
The Asian American Pacific Islander (AAPI) student population is one that requires considerable attention given its size and complexity. The AAPI population is composed of over 48 ethnicities that are diverse in socioeconomic class, language, religion, educational attainment, and migration his-tory, among other attributes (National Commission 2011). AAPIs are also one of the fastest-growing minority groups in the United States (Pak, Maramba, and Hernandez 2014), with a predicted population increase of 125 percent (to over 40.1 million) by 2060 (Colby and Ortman 2014).
Given these increasing numbers and the complex, heterogeneous composition of the AAPI population, it behooves higher education institutions to have a deeper understanding of AAPI students and their needs. One such opportunity is to consider the role of Asian American and Native American Pacific Islander-Serving Institutions (AANAPISIs) and their contributions to the success of AAPI college students. First, we take a deeper look into the U.S. AAPI student body, to more fully understand who AANAPISIs serve.
A Closer Look at AAPI StudentsAAPI students are often excluded within the larger national discussion on the needs of racial and eth-nic minorities in higher education (Teranishi 2010). Among the many possible reasons for this exclu-sion is a common misperception that AAPIs are high achieving, a belief long known as the “model minority myth” (Suzuki 2002). This misperception has grave consequences for AAPI college students. Student affairs professionals, for instance, may limit outreach efforts and services, such as tutoring or psychological services (Suzuki 2002). We may also see this play out in federal or local grant or scholar-ship programs geared toward racial and ethnic minorities where AAPI students are, for the most part, not considered underrepresented. Therefore, AAPIs are not afforded the opportunity to take advantage of these financial resources that might otherwise help defray the cost of their education (Teranishi, Maramba, and Ta 2013).
Examining disaggregated data reveals why such trends are counterproductive. More specifically, dis-aggregated data provide a contextual backdrop and clearer understanding of the AAPI population. For example, Southeast Asian Americans (SEAAs) have one of the highest poverty rates among commu-nities of color, with a staggering 37.8 percent of Hmong families at or below the national poverty level (Teranishi 2010). SEAAs also have one of the lowest educational attainment rates for those who earned

BE
YO
ND
THE
NU
MB
ER
S
35
a bachelor’s degree or higher. For example, 9.2 percent of Cambodians have earned a bachelor’s degree, compared to the national average of 25.9 percent (Teranishi 2010).
In California, in particular, a high number of AAPIs are Limited English Proficient (LEP), meaning a limited knowledge in reading, speaking, writing, or understanding English (LEP 2016). These are important data points given the role that poverty and English fluency play in educational attainment. Nationally, Native Hawaiian and Pacific Islanders (NHPIs), another subgroup in the AAPI category, experience great educational disparities. This includes a high dropout rate in college; 50 percent of Native Hawaiians, 54 percent of Tongans, and 58 percent of Samoans enter college, but do not earn a degree (National Commission 2011).
Approximately 47 percent of AAPI students attend community colleges (National Commission 2011), which is contrary to a popular belief that the majority attend highly selective institutions (National Commission 2010). Additionally, in California, 65 percent of Cambodian and 61 percent of Filipino students took at least one pre-college level course in basic skills math, reading, and English, compared to 56 percent of California community college students overall. Pre-college coursework is an important measure to pay attention to given that students enrolled in such courses are less likely to obtain an associate degree (Campaign for College Opportunity 2015).
Studies conducted at the University of California, Los Angeles showed that AAPI experiences with campus climate parallel that of their black and Latino/a counterparts. For example, AAPI students were more likely to hear racially charged, negative, and/or stereotypical comments from other students, staff, or faculty compared to white students (National Commission 2016). Such experiences have been shown to negatively influence students’ sense of belonging, a condition critical to student success on any campus (Hurtado and Carter 1997; Strayhorn 2012). Further disaggregated data reveal that both Filipina/o and Southeast Asian students (both nearly 75 percent) reported hearing more negative com-ments from peers compared to their East Asian and South Asian counterparts (National Commission 2016).
The Importance of DataCollecting more precise data for AAPI students requires intentional effort and sustained commitment. Fortunately, we have some models to work from. The National Commission on Asian American and Pacific Islander Research in Education (CARE) and the Center for Minority Serving Institutions at the University of Pennsylvania have made great strides in the push to collect more precise AAPI and AANAPISI data and to critically analyze those data (Conrad and Gasman 2013; Teranishi, Lok, and Nguyen 2013). And in 2013, CARE and the White House Initiative on Asian Americans and Pacific Islanders (WHIAAPI) initiated a data quality campaign called iCount, which urges institutions to collect and report more accurate data about specific AAPI ethnicities on local and national levels (Ter-anishi, Lok, and Nguyen 2013). Better data collection efforts and analysis within AANAPISIs can lead to more effective student services and thus student outcomes. Examination of such positive outcomes shows that work at funded AANAPISIs contributes to student success, namely through academic support, student services, opportunities for leadership and mentorship, and professional development (National Commission 2012).
Examples of AANAPISI SuccessThe official designation of the AANAPISI Title III program was instituted as part of the College Cost Reduction and Access Act of 2007 (National Commission 2010). Although each AANAPISI that

36 BE
YO
ND
TH
E N
UM
BE
RS
receives federal funding utilizes its grant according to its unique institutional context, the common goal is to address the needs of AAPI students, including through curricular, academic, and student support services (National Commission 2011). The gains achieved by institutions reveal positive educational outcomes for AAPI students (e.g., Teranishi, Maramba, and Ta 2012). A leading study by Partnership for Equity in Education through Research (PEER) examined the positive influence of federal funding on three AANAPISI campuses (National Commission 2014), showing that investing in targeted institutional capacity building efforts can lead to better student outcomes.
One such institution, De Anza College (CA), focused on Filipina/o, Southeast Asian, and Pacific Islander students by implementing learning communities with the ultimate goals of assisting students to transition from remedial to college-level courses, and increasing transfer rates to four-year colleges and universities. Students in these learning communities were more likely to transition into and pass college-level English than nonparticipants. They were also more likely to earn an associate degree (National Commission 2014).
Another institution, South Seattle Community College, addressed its concern with low-income AAPI students not persisting after their first year on campus through creating learning communities that involved counselors taking an active role in developing and teaching college success courses that included time management, study skills, tutoring and mentoring. Students in these learning commu-nities successfully transitioned into college-level courses and were more likely to obtain an associate degree or certificate (National Commission 2014).
A final lesson from PEER was that higher education administrators and practitioners at AANAPISIs are wise to work collaboratively within their institutions. PEER showed that administrator, staff, and faculty collaboration within AANAPISIs through supplemental courses, counseling, and mentoring led to more successful student outcomes, including higher rates of persistence and transfer to four-year institutions (National Commission 2014). Collaboration can also be more intentional across the AANAPISI community and may take the form of an AANAPISI support network between funded institutions (Maramba 2014).
Designation and FundingOn a policy level, several areas can be addressed to further support AANAPISIs in their efforts to serve the students they enroll. As suggested by CARE, it is critical that there be a concerted effort to urge AANAPISI designation for eligible institutions, and encourage institutions to apply for funding. As of 2012, there were 153 institutions eligible for AANAPISI designation; however, 78 were designated, and only 21 had been funded due to current budget appropriations for the AANAPISI program not meet-ing the need or demand for funding (National Commission 2013). While it is important that political constituents are aware of institutions that are funded, they should also encourage those that meet AANAPISI eligibility to apply, and those that have yet to apply for funding, to do so (National Commis-sion 2013).
In encouraging institutions to apply for AANAPISI eligibility, it is also important to note that institu-tions that meet more than one MSI designation can only apply for one federal grant program in a given year. For example, AANAPISIs that also meet the eligibility requirements for HSI designation must select which federal grant program they will apply for in any given year. Granting AANAPISIs that meet the eligibility requirements for other MSI designations to apply for both federally funded grants would provide institutions greater resources with which to better serve the needs of their students (National Commission 2013).
BE
YO
ND
THE
NU
MB
ER
S
37
Lastly, it is important for policymakers to provide opportunities for increased AANAPISI funding that will allow for sustainability and scalability and facilitate ways to forge partnerships with foundations that could provide additional funding to encourage effective practices (National Commission 2014). Working toward addressing these issues will lead to positive outcomes at large as it creates more con-ducive and successful learning environments for all students.
REFERENCES
Campaign for College Opportunity. 2015. The State of Higher Education in California: Asian Ameri-cans, Native Hawaiians, Pacific Islander Report. Los Angeles: Campaign for College Opportunity.
Colby, Sandra L., and Jennifer M. Ortman. 2014. Projections of the Size and Composition of the U.S. Pop-ulation: 2014 to 2060. Current Population Reports, P25-1143. Washington, DC: U.S. Census Bureau.
Conrad, Clifton, and Marybeth Gasman. 2015. Educating a Diverse Nation: Lessons from Minority-Serv-ing Institutions. Cambridge, MA: Harvard University.
Hurtado, Sylvia, and Deborah Faye Carter. 1997. “Effects of College Transition and Perceptions of the Campus Racial Climate on Latino College Students’ Sense of Belonging.” Sociology of Education 70 (4): 324–345.
Limited English Proficiency (LEP): A Federal Interagency Website. 2016. Last modified August 18. https://www.lep.gov/faqs/faqs.html#One_LEP_FAQ.
Maramba, Dina C. 2014. “Learning from Each Other: Learning Communities for MSIs.” MSIs Unplugged. The Penn Center for Minority Serving Institutions. https://msisunplugged.com/2014/03/.
National Commission on Asian American and Pacific Islander Research in Education (CARE). 2010. Federal Higher Education Policy Procedures and the Asian American and Pacific Islander Commu-nity. New York: National Commission on Asian American and Pacific Islander Research in Educa-tion (CARE).
National Commission on Asian American and Pacific Islander Research in Education (CARE). 2011. The Relevance of Asian Americans and Pacific Islanders in the College Completion Agenda. New York: National Commission on Asian American and Pacific Islander Research in Education (CARE).
National Commission on Asian American and Pacific Islander Research in Education (CARE). 2012. Asian American and Native American Pacific Islander-Serving Institutions: Areas of Growth, Innovation, and Collaboration. Los Angeles: National Commission on Asian American and Pacific Islander Research in Education (CARE).
National Commission on Asian American and Pacific Islander Research in Education (CARE). 2013. Partnership for Equity in Education Through Research (PEER): Findings from the First Year of Research on AANAPISIs. Los Angeles: National Commission on Asian American and Pacific Islander Research in Education (CARE).
National Commission on Asian American and Pacific Islander Research in Education (CARE). 2016. The Racialized Experiences of Asian American and Pacific Islander Students: An Examination of Campus Racial Climate at the University of California, Los Angeles. Los Angeles: National Com-mission on Asian American and Pacific Islander Research in Education (CARE).
Pak, Yoon K., Dina C. Maramba, and Xavier J. Hernandez, eds. 2014. Asian Americans in Higher Educa-

38 BE
YO
ND
TH
E N
UM
BE
RS
tion: Charting New Realities. ASHE Higher Education Report, Volume 40, Number 1. Hoboken, NJ: John Wiley & Sons.
Strayhorn, Terrell L. 2012. College Students’ Sense of Belonging: A Key to Educational Success. New York: Routledge.
Suzuki, Bob H. 2002. “Revisiting the Model Minority Stereotype: Implications for Student Affairs Prac-tice and Higher Education.” In Working with Asian American College Students, edited by Marylu K. McEwen, Corinne Maekawa Kodama, Alvin N. Alvarez, Sunny Lee, and Christopher T. H. Liang, 21–32. New Directions for Student Services, No. 97. San Francisco: Jossey-Bass.
Teranishi, Robert T. 2010. Asians in the Ivory Tower: Dilemmas of Racial Inequality in American Higher Education. New York: Teachers College Press.
Teranishi, Robert, Libby Lok, and Bach Mai Dolly Nguyen. 2013. iCount: A Data Quality Movement of Asian Americans and Pacific Islanders in Higher Education. Los Angeles: National Commission on Asian American and Pacific Islander Research in Education (CARE).
Teranishi, Robert T., Dina C. Maramba, and Min-Hoa Ta. 2012. “Asian American Native American Pacific Islander Serving-Institutions (AANAPISIs): Mutable Sites of Intervention for STEM Oppor-tunities and Outcomes.” In Fostering Success of Ethnic and Racial Minorities in STEM: The Role of Minority Serving Institutions, edited by Robert T. Palmer, Dina C. Maramba, and Marybeth Gas-man, 168–180. New York: Routledge.
Teranishi, Robert, Margary Martin, Loni Bordoloi Pazich, Cynthia M. Alcantar, and Tu-Lien Kim Nguyen. 2014. Measuring the Impact of MSI-Funded Programs on Student Success: Findings from the Evaluation of Asian American and Native American Pacific Islander-Serving Institutions. Los Angeles: National Commission on Asian American and Pacific Islander Research in Education (CARE).

AMERICAN COUNCIL ON EDUCATION 39
We were unable to analyze enrollment and outcomes data for Tribal Colleges and Universities due to their low participation in the National Student Clearinghouse. Although national data on TCUs is limited, it is none-theless critical to bring these institutions into the discussion given their paramount role in educating Native communities. The lack of data on TCUs raises important questions on a host of issues including the visibility of TCUs and the students they serve, and the appropriateness of enrollment and completion data for measur-ing institutional performance.
TRIBAL COLLEGES AND UNIVERSITIES
Shifting from Data Invisibility Toward Data Usage: Research and Data Collection at Tribal Colleges and Universities
Christine A. Nelson, Laguna Pueblo and Diné, Assistant Professor, University of Denver
Introduction The invisibility of Native American1 perspectives—including those of Native students, researchers, and their communities—continues to plague Native higher education despite numerous calls for action from educational advocates across the country. As part of this report, which analyzes the enrollment patterns and completion rates at minority serving institutions (MSIs) using National Student Clearinghouse (NSC) data, ACE’s researchers confirmed the challenges that other scholars have encountered in trying to be inclusive of Native perspectives: namely, a lack of data on Tribal Colleges and Universities (TCUs) and the students they serve.
Disaggregated numbers for TCU enrollment were unavailable for this report, given the low number of TCUs that participate in the Clearinghouse. According to NSC, 84 percent of Title IV degree-granting institutions participated in the Clearinghouse (Dundar and Shapiro 2016). Whereas, only 50 percent of TCUs (17 of 34) have reported student data to NSC at any one time.2 The missing Native narrative and lack of data availability is not a negative reflection of NSC or TCUs, but rather a challenge and opportunity that new institutions like TCUs face when establishing a foothold in the higher education landscape. Data availability for TCUs would improve
1 Native and Native American are used interchangeably and include both American Indian and Alaska Native people within the United States.
2 Derived from NSC core participant list: http://www.studentclearinghouse.org/colleges/enrollmentverify/ev_participating_schools2.php.
40 BE
YO
ND
TH
E N
UM
BE
RS
the visibility of Native perspectives and drive higher education practice, policy, and research toward improving the system of higher education for Native students and their communities.
A quick, seemingly logical solution to the data conundrum could be to increase the number of TCUs participating in big data collection warehouses like NSC. However, the context of Native higher edu-cation is complex, with external, internal, and historical factors at play. These factors must in fact be examined and addressed before the issue of data invisibility can be resolved, and data availability and utilization can be enacted. This essay explores these factors through a discussion of what invisibility means to Native data, and why data invisibility continues to challenge large-scale projects, by address-ing three intersecting factors: history, purpose, and capacity.
Invisibility in the Native ContextInvisibility, from a Native American perspective, has been largely framed in terms of student experi-ences (Brayboy 2004; Fryberg and Stephens 2010), where Native students are not visually seen such that their stories are either missing or misunderstood within higher education. Brayboy (2004) uses an invisibility framework to describe how students navigate and persist at predominantly white insti-tutions and how invisibility acts as a paradox. In one sense, the lack of visibility marginalizes Native voices and experiences. In another sense, invisibility allows one to maintain cultural integrity while navigating what can often be viewed as hostile spaces within higher education.
The book Beyond the Asterisks confronts the dominant narrative that positions Native students as an “asterisked” group in quantitative student data due to statistical insignificance (Shotton, Lowe, and Waterman 2013). The authors use qualitative methods to demonstrate the multiple perspectives miss-ing from the research literature, while stating that the asterisk needs to be retired and Native student experiences need to be heard on a larger platform. The invisibility framework is applied at an institu-tional level to further the discussion of what factors impact data access and availability at TCUs. This analysis begins by looking at the history and purpose of data to contextualize why the Native perspec-tive has been absent and to begin the discussion of how data can be utilized to promote equity and visibility for TCU institutions and students.
History and Purpose of Data After 500 years of multiple waves of colonization and educational approaches that favored assimilation, dedicated tribal leaders, tribal community members, and educational allies began the tribal college movement in the 1960s and 1970s (Carney 1999). Provoked by the fact that Native students were not persisting and graduating from mainstream institutions, TCU advocates sought to reclaim the higher education space as a tool to build capacity that best served individual tribal nations and their students (McSwain and Cunningham 2006). Today, 35 TCUs enroll nearly 28,000 full- and part-time students annually, and enrollment continues to grow incrementally.1 Between the 2002 and 2012 academic years, overall TCU enrollment increased 9 percent.2
As the TCU student body grows, it is important not to characterize TCUs as only being spaces that pro-vide college access for Native students. Rather, TCUs are in the opportune position to influence Native higher education practice, policy, and research across the United States. TCUs’ ability to self-determine education provides an ideal space to develop educational opportunity for Native communities at large.
1 Derived from IPEDS 12-month unduplicated head count (AY 2013–14) for all students attending TCUs. Does not include Wind River.
2 Derived from the IPEDS 12-month unduplicated headcount (AY 2002–03 and AY 2012–13) for all students attending TCUs. Does not include Comanche Nation, Muscogee Nation, and Wind River.

BE
YO
ND
THE
NU
MB
ER
S
41
The notion of tribal self-determination is intricately tied to federal Indian treaty rights between the United States and tribal nations (Carney 1999). In terms of higher education opportunity at TCUs, tribal self-determination gives tribes the right to direct educational initiatives that serve their needs, which includes institutional data usage. In most mainstream higher education settings, the production of data informs policy formation and allocation of resources. TCUs do not object to the importance of demon-strating accountability and progress, but through tribal self-determination, they are in a position to widen the meaning and purpose of research and data by employing Indigenous paradigms that value cultural integrity (AIHEC 2012).
In some ways, the invisibility of TCU data has now emerged as an opportunity to purposefully engage in data usage that values and centers around cultural integrity. TCUs employing self-determination in the field of Native educational research and data is ideal. Under self-determination, TCUs are in the position to challenge the dominant research and data norms that often frame Native American communities as “less than” and deficient (Lomawaima 2000; Walter and Andersen 2013). The power to structure research protocols has been historically in the hands of non-Native communities and the right for tribes to self- determine education, which includes data capacity building and usage, disrupts this relationship. TCUs and tribal nations can no longer be bystanders in the process of research. As TCUs become agents of change, more resources should be allocated to support this developing sector of Native higher education.
Considerations for Building Data Capacity Addressing the issue of invisibility through data capacity building (e.g., becoming an NSC participat-ing institution) is not a simple solution for TCUs and the higher education industry as a whole. Areas to consider when promoting data capacity building are: 1) the pragmatic use of data for TCUs, includ-ing as a part of national data warehouses; 2) the opportunity to frame TCUs through a lens that values cultural integrity; 3) the resources available to build data capacity at TCUs; and lastly, 4) the bearers of responsibility to improve TCU data visibility.
Data Use and Participation As accountability movements (e.g., empirically demonstrating student outcomes and return on invest-ment) continue to take shape within the higher education sector, TCU leadership are recognizing the need to be better stewards and users of data. This move toward promoting the collection and use of data is two-fold. On one hand, participation in national data warehouses has pragmatic implications to demonstrate TCU impact. And on the other hand, TCUs are in a position where they can (re)define data usage for the betterment of their communities.
Participation in national data warehouses will increase the visibility of TCUs and allow researchers to conduct more high-level analysis of TCU trends. Possibly more important is how data availability allows TCUs to understand and advocate their contributions to the wider higher education field. Today, many TCUs do not readily have access to data, that shows if and where their students transfer after graduation. Ultimately, this invisibility limits TCUs ability to efficiently know (and take credit for) student success.
Furthermore, existing data warehouses offer opportunities for TCUs to better serve their students. Understanding of the college pathways of Native students can be more complete, especially given grow-ing evidence that Native students attend multiple institutions during their college career (Nelson 2015). Additionally, when institutions participate in NSC, student enrollment data is shared with federal stu-dent loan agencies to verify college attendance. While the majority of TCUs do not offer loans, students who attended other institutions may transfer to TCUs with existing loans. Without an automated system that verifies enrollment, obtaining an in-school loan deferment may be complicated for a student.

42 BE
YO
ND
TH
E N
UM
BE
RS
Cultural Integrity of Data As participation in non-tribally controlled systems, like NSC, become more commonplace at institu-tions that serve Native American communities (e.g., TCUs), it is important to remain focused on the cultural integrity component of building data capacity. Currently, existing large data warehouses do not employ measures, frame data collection, and report the types of data that often captures the impacts TCUs are making at the community level (AIHEC 2012). For example, one common activity among TCUs is cultural and language revitalization. TCUs typically extend their efforts beyond offering tribal language or history courses. At various institutions, TCU faculty, staff, and students, along with tribal elders, can be found actively engaging in collection and documentation of oral traditions and cultural practices. These pieces of knowledge are archived and protected for future generations, along with the creation of curriculum and community events to share tribal knowledge with all community members, regardless of age or TCU enrollment status (AIHEC 2012).
Engaging in data capacity building activities that places a focus on cultural integrity thus allows TCUs to highlight the impact these institutions have on tribal communities. It has taken collaborative efforts with tribally informed organizations, like the American Indian Higher Education Consortium (AIHEC) and the American Indian College Fund (the College Fund), to begin reporting data indicators relevant to TCUs and their communities (AICF 2016; AIHEC 2012). Keeping that in mind, it is important to emphasize the local work that is happening through the support of tribally informed agencies. For the past three years, the College Fund, through external grants, participated in the Achieving the Dream’s National Reform Network, a student success initiative to build capacity at the community college level. Two tribal colleges, Diné College (AZ) and Salish Kootenai College (MT), were able to embrace a data-driven institutional culture that blended the pragmatic aspects of data with indicators that valued cul-tural integrity and tribal self-determination (AICF 2016), thus demonstrating that data capacity build-ing that moves toward data usage at TCUs is possible. However, as data usage continues to develop, one must consider the current resources available at TCUs.
Resource Realities and NeedsIt has been well documented that TCUs face fiscal challenges that lead to a shortage of staff and faculty (AIHEC 2012). These institutions frequently require employees to hold multiple administrative roles within the institution, and it is often the case that the employee reporting institutional data has other responsibilities within the college (AIHEC 2012). Additionally, TCUs, unlike any other higher education institution, are required to report institutional data to the Bureau of Indian Affairs (BIA Form 6259); many times, supplemental reporting is also required to the tribal councils who charter the institutions. Adding more responsibilities to a department or person without a commensurate increase in resources raises the question of whether or not participating in larger data warehouses is the best method for TCUs to build capacity. It also begs the question of how smaller and developing TCUs should begin the process of tribally self-determined data usage.
Improving Data UsageAs data invisibility shifts toward data usage, TCUs should not be the sole bearers of engaging in such usage. Furthermore, while organizations like AIHEC and AICF continue to engage with TCUs on a local level, more widespread support is needed. Larger data warehouses need to understand TCU data collection norms and systemically question how their existing practices ignore or impede TCU data usage. Without this process, TCU self-determination, which is linked to federal public law (see P.L. 95-471), is not seen as distinct from the dominant standards of data collection in U.S. higher education.

BE
YO
ND
THE
NU
MB
ER
S
43
Large-scale, national data warehouses should be open to respecting the tribal sovereignty inherently embodied by TCUs and data usage. Failing to critically understand TCU data usage as a complex web of history, purpose, and capacity building, not only negates the benefits of TCUs participating in orga-nizations like NSC, but also places an undue burden on TCUs to alter their values and continues the narrative that TCUs are deficient in their operations.
Next StepsAddressing the issue of invisibility for TCUs at both the national and local level through data capacity building is feasible. The collaborative work between individual TCUs and entities like the AIHEC and AICF offer prime examples of how data usage can remain tribally centered while demonstrating impact, effectiveness, and transparency. These reports can be found online at AICF’s Research Repository3 or AIHEC’s Measures of Success.4 The path toward TCU data capacity building needs to be informed by the intersection of history and purpose (NCAI and MSU 2012). History informs how data typically serves the dominant narrative of higher education; in today’s context, data collection and sharing need to shift to accommodate tribal values that inform TCU operations and sustainability. This multifaceted approach helps both tribal and non-tribal entities view this process as collaborative and TCU-led as they work toward improving TCU visibility and data usage. The transition of power will cause some growing pains of data availability and may temporarily contribute to the invisibility of TCUs, as TCUs should be allowed time to independently process how the data can maintain cultural integrity. Regardless, this invisibility should be framed as an opportunity for TCUs and allies to determine how to fill the data gap.
The opportunity to shape future narratives on Native research is critically important to the future of TCUs and other aspects of Native higher education. Tribal leaders, educators, and allies should remain dedicated to establishing research parameters at TCUs and to self-determining how TCUs should become data users. And while these stakeholders should lead efforts around data visibility, such a task cannot be completed in isolation. Outside researchers can contribute to the TCU narrative by 1) asking how research and data visibility is relevant to individual tribal communities and 2) working collabo-ratively with TCUs and their institutional researchers5 to advance the tribal self-determination of data and its contribution to improving institutional visibility.
REFERENCES
American Indian College Fund (AICF). 2002. Cultivating Success: The Critical Value of American Indian Scholarships and the Positive Impact of Tribal College Capital Construction. Denver: Ameri-can Indian College Fund (AICF).
American Indian College Fund (AICF). 2016. Improving Student Success at Tribal Colleges and Univer-sities. Denver: American Indian College Fund (AICF).
American Indian Higher Education Consortium (AIHEC). 2012. 2009–2010 AIHEC AIMS Fact Book: Tribal Colleges and Universities Report. Alexandria, VA: American Indian Higher Education Con-sortium (AIHEC).
Brayboy, Brian McKinley Jones. 2004. “Hiding in the Ivy: American Indian Students and Visibility in Elite Educational Settings.” Harvard Educational Review 74 (2): 125–152.
3 http://collegefund.org/research-and-programs/research/research-repository4 www.aihec.org/our-stories/measuresSuccess.htm5 Not all TCUs or tribal nations have institutional researchers or institutional review board protocols, but there is a growing
trend for tribal communities to adopt formal requests for research (Hernandez 2004).

44 BE
YO
ND
TH
E N
UM
BE
RS
Carney, Cary Michael. 1999. Native American Higher Education in the United States. Piscataway, NJ: Transaction Publishers.
Dundar, Afet, and Doug Shapiro. 2016. The National Student Clearinghouse as an Integral Part of the National Postsecondary Data Infrastructure. National Student Clearinghouse Research Center. https://nscresearchcenter.org/wp-content/uploads/NSC-as-an-Integral-Part-of-the-National-Post-secondary-Data-Infrastructure.pdf.
Fryberg, Stephanie A., and Nicole M. Stephens. 2010. “When the World is Colorblind, American Indians Are Invisible: A Diversity Science Approach.” Psychological Inquiry 21 (2): 115–119.
Hernandez, Juan A. Avila. 2004. “Blood, Lies, and Indian Rights: TCUs Becoming Gatekeepers for Research.” Tribal College Journal of American Indian Higher Education 16 (2): 10–13.
Lomawaima, K. Tsianina. 2000. “Tribal Sovereigns: Reframing Research in American Indian Education.” Harvard Educational Review 70 (1): 1–21.
McSwain, Courtney, and Alisa Cunningham. 2006. Championing Success: A Report on the Progress of Tribal College and University Alumni. Institute for Higher Education Policy. http://www.ihep.org/sites/default/ les/uploads/docs/pubs/championingsuccess.pdf.
NCAI Policy Research Center and MSU Center for Native Health Partnerships. 2012. ‘Walk Softly and Listen Carefully’: Building Research Relationships with Tribal Communities. Washington, DC and Bozeman, MT: NCAI Policy Research Center and MSU Center for Native Health Partnerships.
Nelson, Christine A. 2015. “American Indian College Students as Native Nation Builders: Tribal Finan-cial Aid as a Lens for Understanding College-Going Paradoxes.” Doctoral dissertation, University of Arizona.
Shotton, Heather S., Shelly C. Lowe, and Stephanie J. Waterman, eds. 2013. Beyond the Asterisk: Under-standing Native Students in Higher Education. Sterling, VA: Stylus.
Walter, Maggie, and Chris Andersen. 2013. Indigenous Statistics: A Quantitative Research Methodol-ogy. Walnut Creek, CA: Left Coast Press, Inc.

AMERICAN COUNCIL ON EDUCATION 45
CONCLUSIONMinority serving institutions play an increasingly important role in American society. While differences in institutional and student characteristics exist across them, MSIs collectively provide access for traditionally underserved students at a time when the nation’s K–12 and higher education student body is becoming more and more diverse. This report offers insight into how MSIs contribute to national goals around college access and completion and provides a more holistic examination of these measures than can be found elsewhere. The analysis presented in these pages utilizes data from the National Student Clearinghouse to examine enroll-ment and degree and credential completion rates of students who began college at various MSI types.
As the data show, students who attend MSIs typically do not fit the profile of students counted in the federal graduation rate. Rather, students at MSIs tend to enroll primarily through mixed enrollment, meaning that they move between attending college both full time and part time, and not solely through one or the other. Using NSC data accounts for students with different enrollment patterns and those who transfer, drop out, or who are still persisting in their degree program, better capturing how students move through to completion. When measured using NSC data, MSIs do in many cases substantially better at completing students than is depicted by the standard federal graduation rate. In all cases, students enrolled exclusively full time—and in many cases, students overall—have much higher completion rates using NSC data.
These differences speak to the ongoing need not only to improve data on student outcomes, but also to inform policymakers and other decision makers about the assumptions made in generating institutional data for accountability purposes. As the essays included in this report show, hard data is just one part of a given institution’s story about how it educates students, and in the case of many MSIs, how they provide academic and nonacademic opportunities for students historically shut out of higher education. Finally, the importance of federal funding for MSIs cannot be understated. As these institutions move into the future and continue to serve low-income communities of color and first-generation college students, they will require investment in their capacity to do so. If we as a nation are to make good on the role of education for upward mobility and workforce preparation, we must also ensure that MSIs are strengthened and enhanced so they can provide access to more and better educational opportunities for the students they enroll.
46 PULLING BACK THE CURTAIN: ENROLLMENT AND OUTCOMES AT MINORITY SERVING INSTITUTIONS
REFERENCESAsian American and Native American Pacific Islander-Serving Institutions. 2016. “About AANAPISIs.” Washing-
ton, DC: Asian American and Native American Pacific Islander-Serving Institutions. http://www.aanapisi.net/about_aanapisis.
American Association of Community Colleges. 2016. Community College Legislative Priorities—January 2016. Washington, DC. http://www.aacc.nche.edu/Advocacy/Documents/AACC_Legislative_Priorities_Jan-2016Final.pdf.
American Indian Higher Education Consortium (AIHEC). 1999. Tribal Colleges: An Introduction. Alexandria, VA: American Indian Higher Education Consortium (AIHEC).
Bill & Melinda Gates Foundation. 2009. Postsecondary Success. Fact Sheet. Seattle, WA: Bill & Melinda Gates Foun-dation.
Carnevale, Anthony P., and Jeff Strohl. 2013. Separate & Unequal: How Higher Education Reinforces the Intergenera-tional Reproduction of White Racial Privilege. Washington, DC: Georgetown University.
Cornell, Stephen, and Joseph P. Kalt. 2010. “American Indian Self-Determination: The Political Economy of a Successful Policy.” Joint Occasional Papers on Native Affairs (JOPNA) Working Paper No. 1. Tucson, AZ: The University of Arizona.
Excelencia in Education. 2016. Hispanic-Serving Institutions (HSIs): 2014–15. Washington, DC: Excelencia in Educa-tion.
Flores, Stella M., and Toby J. Park. 2013. “Race, Ethnicity, and College Success: Examining the Continued Signifi-cance of the Minority-Serving Institution.” Educational Researcher 42 (3): 115–128.
Gasman, Marybeth, Thai-Huy Nguyen, and Clifton F. Conrad. 2015. “Lives Intertwined: A Primer on the History and Emergence of Minority Serving Institutions.” Journal of Diversity in Higher Education 8 (2): 120–138.
Hussar, William J., and Tabitha M. Bailey. 2016. Projections of Education Statistics to 2024. NCES 2016-013. U.S. Department of Education, National Center for Education Statistics. Washington, DC: U.S. Government Printing Office.
Lumina Foundation. 2017. Goal 2025. Accessed January 30, 2017. https://www.luminafoundation.org/goal_2025.
Nellum, Christopher J., and Katherine Valle. 2015. Government Investment in Public Hispanic-Serving Institutions. Washington, DC: American Council on Education.
Nelson, Christine A., and Joanna R. Frye. 2016. Tribal College and University Funding: Tribal Sovereignty at the Intersection of Federal, State, and Local Funding. Washington, DC: American Council on Education.
Shapiro, Doug, Afet Dundar, Mary Ziskin, Xin Yuan, and Autumn Harrell. 2013. Completing College: A National View of Student Attainment Rates - Fall 2007 Cohort. Signature Report No. 6. Herndon, VA: National Student Clearinghouse Research Center.
Strategy Labs. 2017. Strategy Labs: State Policy to Increase Higher Education Attainment. Indianapolis, IN: Lumina Foundation. http://strategylabs.luminafoundation.org.
U.S. Department of Education. 2016. Fiscal Year 2017: Application Package to Request Designation as an Eligi-ble Institution Under Title III and Title V Programs. Washington, DC: U.S. Department of Education. https://opeweb.ed.gov/title3and5/docs/Designation%20of%20Eligibility%20Application%20Booklet.pdf.
U.S. Department of Education. 2017a. “Developing Hispanic-Serving Institutions Program – Title V.” Last modified February 23. https://www2.ed.gov/programs/idueshsi/index.html.
U.S. Department of Education. 2017b. “Title III Part A Programs – Strengthening Institutions.” Last modified March 31. https://www2.ed.gov/programs/iduestitle3a/index.html.
U.S. Department of Education. 2017c. “Title III Part B, Strengthening Historically Black Colleges and Universities Program.” Last modified March 14. https://www2.ed.gov/programs/iduestitle3b/index.html.
The White House. n.d. “Higher Education.” Accessed March 3, 2017. https://obamawhitehouse.archives.gov/issues/education/higher-education.

AMERICAN COUNCIL ON EDUCATION 47
APPENDIX A. Count of MSIs in StudyThe table below depicts the number of MSI-eligible institutions for which the authors requested data from the National Student Clearinghouse (NSC), as well as the actual number of institutions for which NSC was able to provide data, by MSI type.
MSI Type Number Requested for Study Number of MSIs Included in StudyHBCU 98 54
PBI 51 34HSI 332 144
AANAPISI 357 239

48 PULLING BACK THE CURTAIN: ENROLLMENT AND OUTCOMES AT MINORITY SERVING INSTITUTIONS
APPENDIX B. Four-, Six-, and Eight-Year Outcomes at MSIs, by Enrollment Intensity and MSI Type
1. OUTCOMES AT PUBLIC TWO-YEAR MSIs
Four-Year Outcomes (200% Normal Time) at Public Two-Year MSIs: Fall 2007 Cohort OVERALL COHORT
Total Completion
Rate
1st Completion at Starting Institution
1st Completion at Different Institution: Two-Year
1st Completed at Different Institution: Four-Year
Subsequent Completion at a
Four-Year
Still Enrolled (at Any
Institution)
Not Enrolled (at Any
Institution)
HBCU (Cohort Size = 2,610) 19.6 14.6 3.5 1.4 0.4 39.6 40.8
PBI (Cohort Size = 20,986) 22.0 18.7 1.8 1.5 0.7 36.9 41.2
HSI (Cohort Size = 158,007) 21.3 17.5 1.9 1.9 1.3 44.6 34.2
AANAPISI (Cohort Size = 157,294) 21.4 16.2 2.3 3.0 1.4 47.7 30.8
STUDENTS ENROLLED EXCLUSIVELY FULL TIME
Total Completion
Rate
1st Completion at Starting Institution
1st Completion at Different Institution: Two-Year
1st Completed at Different Institution: Four-Year
Subsequent Completion at a
Four-Year
Still Enrolled (at Any
Institution)
Not Enrolled (at Any
Institution)
HBCU (Cohort Size = 546) 32.1 27.1 2.5 2.5 0.7 15.7 52.2
PBI (Cohort Size = 5,372) 37.4 32.8 1.8 2.8 2.1 17.2 45.4
HSI (Cohort Size = 25,157) 40.3 34.2 2.0 4.0 5.2 16.8 42.8
AANAPISI (Cohort Size = 25,453) 42.6 32.7 2.5 7.4 5.9 22.9 34.5
STUDENTS ENROLLED EXCLUSIVELY PART TIME
Total Completion
Rate
1st Completion at Starting Institution
1st Completion at Different Institution: Two-Year
1st Completed at Different Institution: Four-Year
Subsequent Completion at a
Four-Year
Still Enrolled (at Any
Institution)
Not Enrolled (at Any
Institution)
HBCU (Cohort Size = 373) 16.2 11.5 4.4 0.3 0.3 23.3 60.5
PBI (Cohort Size = 2,691) 13.1 12.0 0.8 0.3 0.1 26.7 60.2
HSI (Cohort Size = 19,209) 10.5 9.0 1.2 0.3 0.3 29.4 60.1
AANAPISI (Cohort Size = 16,572) 10.2 8.7 1.3 0.3 0.3 29.5 60.3
STUDENTS ENROLLED THROUGH MIXED ENROLLMENT
Total Completion
Rate
1st Completion at Starting Institution
1st Completion at Different Institution: Two-Year
1st Completed at Different Institution: Four-Year
Subsequent Completion at a
Four-Year
Still Enrolled (at Any
Institution)
Not Enrolled (at Any
Institution)
HBCU (Cohort Size = 1,691) 16.2 11.3 3.6 1.3 0.4 50.9 32.8
PBI (Cohort Size = 12,923) 17.4 14.2 2.0 1.1 0.3 47.2 35.5
HSI (Cohort Size = 113,642) 18.9 15.3 2.0 1.7 0.6 53.2 27.9
AANAPISI (Cohort Size = 115,269) 18.4 13.7 2.4 2.4 0.6 55.8 25.8

AMERICAN COUNCIL ON EDUCATION 49
Six-Year Outcomes (300% Normal Time) at Public Two-Year MSIs: Fall 2007 CohortOVERALL COHORT
Total Completion
Rate
1st Completion at Starting Institution
1st Completion at Different Institution: Two-Year
1st Completed at Different Institution: Four-Year
Subsequent Completion at a
Four-Year
Still Enrolled (at Any
Institution)
Not Enrolled (at Any
Institution)
HBCU (Cohort Size = 2,525) 34.1 18.5 5.8 9.7 1.8 19.1 46.9
PBI (Cohort Size = 20,898) 32.0 22.1 3.2 6.7 3.7 20.3 47.7
HSI (Cohort Size = 157,413) 33.3 21.8 3.3 8.2 5.7 24.2 42.5
AANAPISI (Cohort Size = 157,212) 34.6 20.1 3.7 10.8 6.3 26.3 39.2
STUDENTS ENROLLED EXCLUSIVELY FULL TIME
Total Completion
Rate
1st Completion at Starting Institution
1st Completion at Different Institution: Two-Year
1st Completed at Different Institution: Four-Year
Subsequent Completion at a
Four-Year
Still Enrolled (at Any
Institution)
Not Enrolled (at Any
Institution)
HBCU (Cohort Size = 477) 44.1 35.4 3.1 5.6 2.3 5.7 50.2
PBI (Cohort Size = 4,911) 50.0 38.4 2.6 9.0 9.2 4.6 45.5
HSI (Cohort Size = 23,325) 53.7 40.7 2.8 10.2 18.0 4.1 42.2
AANAPISI (Cohort Size = 23,214) 61.1 39.5 3.3 18.3 20.8 4.3 34.6
STUDENTS ENROLLED EXCLUSIVELY PART TIME
Total Completion
Rate
1st Completion at Starting Institution
1st Completion at Different Institution: Two-Year
1st Completed at Different Institution: Four-Year
Subsequent Completion at a
Four-Year
Still Enrolled (at Any
Institution)
Not Enrolled (at Any
Institution)
HBCU (Cohort Size = 315) 22.7 16.2 5.5 1.0 0.7 7.1 70.2
PBI (Cohort Size = 2,264) 19.1 16.8 1.3 1.0 1.0 12.0 68.9
HSI (Cohort Size = 16,762) 15.8 13.6 1.8 0.5 1.6 13.3 70.9
AANAPISI (Cohort Size = 14,363) 15.1 12.7 1.9 0.5 1.5 13.8 71.2
STUDENTS ENROLLED THROUGH MIXED ENROLLMENT
Total Completion
Rate
1st Completion at Starting Institution
1st Completion at Different Institution: Two-Year
1st Completed at Different Institution: Four-Year
Subsequent Completion at a
Four-Year
Still Enrolled (at Any
Institution)
Not Enrolled (at Any
Institution)
HBCU (Cohort Size = 1,733) 33.4 14.3 6.6 12.5 1.8 24.9 41.7
PBI (Cohort Size = 13,723) 27.7 17.1 3.8 6.8 2.1 27.3 45.0
HSI (Cohort Size = 117,326) 31.7 19.2 3.6 8.9 3.9 29.8 38.6
AANAPISI (Cohort Size = 119,635) 31.8 17.2 4.0 10.6 4.1 32.0 36.2

50 PULLING BACK THE CURTAIN: ENROLLMENT AND OUTCOMES AT MINORITY SERVING INSTITUTIONS
Eight-Year Outcomes (400% Normal Time) at Public Two-Year MSIs: Fall 2007 CohortOVERALL COHORT
Total Completion
Rate
1st Completion at Starting Institution
1st Completion at Different Institution: Two-Year
1st Completed at Different Institution: Four-Year
Subsequent Completion at a
Four-Year
Still Enrolled (at Any
Institution)
Not Enrolled (at Any
Institution)
HBCU (Cohort Size = 2,665) 37.9 18.9 6.9 12.2 3.7 11.2 50.9
PBI (Cohort Size = 21,044) 37.6 23.9 4.2 9.5 6.3 11.8 50.6
HSI (Cohort Size = 158,219) 40.7 24.0 4.3 12.4 10.2 13.9 45.4
AANAPISI (Cohort Size = 157,513) 42.9 22.1 4.9 16.0 10.7 14.7 42.4
STUDENTS ENROLLED EXCLUSIVELY FULL TIME
Total Completion
Rate
1st Completion at Starting Institution
1st Completion at Different Institution: Two-Year
1st Completed at Different Institution: Four-Year
Subsequent Completion at a
Four-Year
Still Enrolled (at Any
Institution)
Not Enrolled (at Any
Institution)
HBCU (Cohort Size = 516) 43.9 33.7 3.0 7.1 5.4 3.0 53.1
PBI (Cohort Size = 4,770) 53.3 40.0 3.0 10.4 12.8 2.3 44.4
HSI (Cohort Size = 22,591) 57.1 42.3 3.2 11.6 24.3 1.8 41.2
AANAPISI (Cohort Size = 22,497) 65.0 40.9 3.6 20.5 27.3 1.8 33.2
STUDENTS ENROLLED EXCLUSIVELY PART TIME
Total Completion
Rate
1st Completion at Starting Institution
1st Completion at Different Institution: Two-Year
1st Completed at Different Institution: Four-Year
Subsequent Completion at a
Four-Year
Still Enrolled (at Any
Institution)
Not Enrolled (at Any
Institution)
HBCU (Cohort Size = 318) 24.1 17.3 5.9 1.0 2.2 4.5 71.4
PBI (Cohort Size = 2,133) 23.0 20.0 1.6 1.4 3.1 6.5 70.5
HSI (Cohort Size = 15,625) 18.6 15.7 2.1 0.7 4.2 7.0 74.5
AANAPISI (Cohort Size = 13,285) 17.7 14.7 2.3 0.7 3.6 7.1 75.2
STUDENTS ENROLLED THROUGH MIXED ENROLLMENT
Total Completion
Rate
1st Completion at Starting Institution
1st Completion at Different Institution: Two-Year
1st Completed at Different Institution: Four-Year
Subsequent Completion at a
Four-Year
Still Enrolled (at Any
Institution)
Not Enrolled (at Any
Institution)
HBCU (Cohort Size = 1,830) 38.6 15.0 8.1 15.6 3.5 14.7 46.7
PBI (Cohort Size = 14,141) 34.5 19.0 5.0 10.5 4.6 15.8 49.7
HSI (Cohort Size = 120,003) 40.5 21.6 4.8 14.1 8.3 17.1 42.4
AANAPISI (Cohort Size = 121,731) 41.6 19.4 5.4 16.8 8.4 17.9 40.5

AMERICAN COUNCIL ON EDUCATION 51
2. OUTCOMES AT PUBLIC FOUR-YEAR MSIs
Four-Year Outcomes (100% Normal Time) at Public Four-Year MSIs: Fall 2007 Cohort OVERALL COHORT
Total Completion
Rate
Completed at Starting Institution
Completed at Different Institution: Two-Year
Completed at Different Institution: Four-Year
Still Enrolled (at Any
Institution)
Not Enrolled (at Any
Institution)
HBCU (Cohort Size = 28,247) 18.3 15.3 1.6 1.4 55.2 26.5
PBI (Cohort Size = 4,480) 14.5 9.8 2.8 2.0 51.6 33.9
HSI (Cohort Size = 73,516) 20.0 15.6 2.4 2.1 60.0 20.1
AANAPISI (Cohort Size = 204,901) 40.2 36.4 1.6 2.2 47.5 12.3
STUDENTS ENROLLED EXCLUSIVELY FULL TIME
Total Completion
Rate
Completed at Starting Institution
Completed at Different Institution: Two-Year
Completed at Different Institution: Four-Year
Still Enrolled (at Any
Institution)
Not Enrolled (at Any
Institution)
HBCU (Cohort Size = 14,880) 26.5 23.8 1.0 1.6 50.7 22.8
PBI (Cohort Size = 1,371) 24.6 18.9 2.5 3.2 40.9 34.5
HSI (Cohort Size = 25,211) 31.8 27.0 1.9 2.9 53.7 14.6
AANAPISI (Cohort Size = 104,600) 54.9 50.7 1.3 2.9 38.2 6.9
STUDENTS ENROLLED EXCLUSIVELY PART TIME
Total Completion
Rate
Completed at Starting Institution
Completed at Different Institution: Two-Year
Completed at Different Institution: Four-Year
Still Enrolled (at Any
Institution)
Not Enrolled (at Any
Institution)
HBCU (Cohort Size = 975) 17.2 14.5 1.5 1.2 17.4 65.5
PBI (Cohort Size = 411) 6.7 3.9 1.5 1.4 21.4 71.9
HSI (Cohort Size = 5,402) 12.6 9.9 1.1 1.6 21.0 66.4
AANAPISI (Cohort Size = 9,891) 14.2 12.6 0.9 0.8 22.4 63.4
STUDENTS ENROLLED THROUGH MIXED ENROLLMENT
Total Completion
Rate
Completed at Starting Institution
Completed at Different Institution: Two-Year
Completed at Different Institution: Four-Year
Still Enrolled (at Any
Institution)
Not Enrolled (at Any
Institution)
HBCU (Cohort Size = 12,391) 8.6 5.1 2.4 1.2 63.5 27.9
PBI (Cohort Size = 2,699) 10.6 6.0 3.1 1.4 61.6 27.9
HSI (Cohort Size = 42,903) 14.0 9.6 2.9 1.6 68.5 17.4
AANAPISI (Cohort Size = 90,410) 26.1 22.3 2.1 1.7 61.0 13.0

52 PULLING BACK THE CURTAIN: ENROLLMENT AND OUTCOMES AT MINORITY SERVING INSTITUTIONS
Six-Year Outcomes (150% Normal Time) at Public Four-Year MSIs: Fall 2007 CohortOVERALL COHORT
Total Completion
Rate
Completed at Starting Institution
Completed at Different Institution: Two-Year
Completed at Different Institution: Four-Year
Still Enrolled (at Any
Institution)
Not Enrolled (at Any
Institution)
HBCU (Cohort Size = 28,206) 43.0 33.6 2.9 6.5 22.1 34.9
PBI (Cohort Size = 4,486) 34.1 18.4 4.6 11.1 26.2 39.8
HSI (Cohort Size = 73,437) 49.5 36.6 4.0 8.8 24.1 26.4
AANAPISI (Cohort Size = 204,940) 68.6 58.5 2.6 7.6 14.7 16.7
STUDENTS ENROLLED EXCLUSIVELY FULL TIME
Total Completion
Rate
Completed at Starting Institution
Completed at Different Institution: Two-Year
Completed at Different Institution: Four-Year
Still Enrolled (at Any
Institution)
Not Enrolled (at Any
Institution)
HBCU (Cohort Size = 12,613) 61.8 54.0 1.7 6.2 8.6 29.6
PBI (Cohort Size = 1,101) 51.5 35.1 3.6 12.8 8.9 39.5
HSI (Cohort Size = 20,310) 74.1 63.8 2.7 7.6 6.9 19.0
AANAPISI (Cohort Size = 92,775) 87.9 79.9 1.6 6.4 3.4 8.7
STUDENTS ENROLLED EXCLUSIVELY PART TIME
Total Completion
Rate
Completed at Starting Institution
Completed at Different Institution: Two-Year
Completed at Different Institution: Four-Year
Still Enrolled (at Any
Institution)
Not Enrolled (at Any
Institution)
HBCU (Cohort Size = 865) 23.5 19.4 1.9 2.2 7.7 68.9
PBI (Cohort Size = 343) 9.5 6.1 1.8 1.6 8.2 82.3
HSI (Cohort Size = 4,620) 17.5 13.6 1.8 2.1 10.2 72.4
AANAPISI (Cohort Size = 9,038) 18.4 15.9 1.2 1.3 11.3 70.4
STUDENTS ENROLLED THROUGH MIXED ENROLLMENT
Total Completion
Rate
Completed at Starting Institution
Completed at Different Institution: Two-Year
Completed at Different Institution: Four-Year
Still Enrolled (at Any
Institution)
Not Enrolled (at Any
Institution)
HBCU (Cohort Size = 14,728) 28.0 17.0 4.1 6.9 34.6 37.4
PBI (Cohort Size = 3,042) 30.5 13.7 5.3 11.5 34.5 35.1
HSI (Cohort Size = 48,507) 42.2 27.5 4.8 10.0 32.6 25.2
AANAPISI (Cohort Size = 103,128) 55.8 43.0 3.6 9.2 25.2 19.1

AMERICAN COUNCIL ON EDUCATION 53
Eight-Year Outcomes (200% Normal Time) at Public Four-Year MSIs: Fall 2007 CohortOVERALL COHORT
Total Completion
Rate
Completed at Starting Institution
Completed at Different Institution: Two-Year
Completed at Different Institution: Four-Year
Still Enrolled (at Any
Institution)
Not Enrolled (at Any
Institution)
HBCU (Cohort Size = 28,261) 50.1 36.9 4.1 9.1 10.9 39.0
PBI (Cohort Size = 4,493) 45.2 22.0 7.3 15.9 13.7 41.1
HSI (Cohort Size = 73,437) 60.2 42.4 5.3 12.5 10.8 29.0
AANAPISI (Cohort Size = 204,899) 75.4 62.1 3.4 9.9 6.4 18.2
STUDENTS ENROLLED EXCLUSIVELY FULL TIME
Total Completion
Rate
Completed at Starting Institution
Completed at Different Institution: Two-Year
Completed at Different Institution: Four-Year
Still Enrolled (at Any
Institution)
Not Enrolled (at Any
Institution)
HBCU (Cohort Size = 11,928) 68.2 58.7 2.1 7.5 2.5 29.3
PBI (Cohort Size = 1,022) 58.7 39.4 4.1 15.1 3.0 38.3
HSI (Cohort Size = 19,616) 80.3 68.7 3.0 8.6 1.6 18.1
AANAPISI (Cohort Size = 91,167) 91.2 82.4 1.7 7.0 0.7 8.2
STUDENTS ENROLLED EXCLUSIVELY PART TIME
Total Completion
Rate
Completed at Starting Institution
Completed at Different Institution: Two-Year
Completed at Different Institution: Four-Year
Still Enrolled (at Any
Institution)
Not Enrolled (at Any
Institution)
HBCU (Cohort Size = 838) 25.5 21.1 2.2 2.2 5.3 69.2
PBI (Cohort Size = 319) 11.7 6.6 3.2 1.9 3.9 84.4
HSI (Cohort Size = 4,411) 19.7 15.1 2.1 2.5 6.7 73.7
AANAPISI (Cohort Size = 8,755) 20.4 17.4 1.4 1.6 6.1 73.5
STUDENTS ENROLLED THROUGH MIXED ENROLLMENT
Total Completion
Rate
Completed at Starting Institution
Completed at Different Institution: Two-Year
Completed at Different Institution: Four-Year
Still Enrolled (at Any
Institution)
Not Enrolled (at Any
Institution)
HBCU (Cohort Size = 15,494) 37.5 20.9 5.9 10.7 17.7 44.8
PBI (Cohort Size = 3,152) 44.3 17.9 8.7 17.6 18.2 37.6
HSI (Cohort Size = 49,410) 55.9 34.4 6.6 14.9 14.8 29.3
AANAPISI (Cohort Size = 104,977) 66.2 48.1 4.9 13.2 11.5 22.3

54 PULLING BACK THE CURTAIN: ENROLLMENT AND OUTCOMES AT MINORITY SERVING INSTITUTIONS
3. OUTCOMES AT PRIVATE FOUR-YEAR MSIs
Four-Year Outcomes (100% Normal Time) at Private Four-Year MSIs: Fall 2007 Cohort OVERALL COHORT
Total Completion
Rate
Completed at Starting Institution
Completed at Different Institution: Two-Year
Completed at Different Institution: Four-Year
Still Enrolled (at Any
Institution)
Not Enrolled (at Any
Institution)
HBCU (Cohort Size = 10,685) 28.9 25.6 1.5 1.8 48.6 22.5
PBI (Cohort Size = 2,658) 27.5 23.4 1.4 2.8 38.0 34.5
HSI (Cohort Size = 8,376) 38.8 33.5 2.2 3.1 41.1 20.1
AANAPISI (Cohort Size = 83,178) 69.1 65.5 0.8 2.9 24.7 6.2
STUDENTS ENROLLED EXCLUSIVELY FULL TIME
Total Completion
Rate
Completed at Starting Institution
Completed at Different Institution: Two-Year
Completed at Different Institution: Four-Year
Still Enrolled (at Any
Institution)
Not Enrolled (at Any
Institution)
HBCU (Cohort Size = 6,919) 39.2 36.0 1.1 2.1 41.5 19.3
PBI (Cohort Size = 1,263) 38.0 32.9 1.3 3.8 32.8 29.2
HSI (Cohort Size = 4,609) 51.5 46.4 1.4 3.7 33.2 15.4
AANAPISI (Cohort Size = 62,094) 78.2 74.8 0.5 2.8 18.1 3.7
STUDENTS ENROLLED EXCLUSIVELY PART TIME
Total Completion
Rate
Completed at Starting Institution
Completed at Different Institution: Two-Year
Completed at Different Institution: Four-Year
Still Enrolled (at Any
Institution)
Not Enrolled (at Any
Institution)
HBCU (Cohort Size = 109) 3.7 3.7 0.0 0.0 14.2 82.1
PBI (Cohort Size = 254) 17.4 15.4 0.8 1.2 18.5 64.1
HSI (Cohort Size = 511) 21.4 19.2 0.8 1.4 17.6 61.0
AANAPISI (Cohort Size =2,598) 40.0 38.7 0.2 1.2 16.0 44.0
STUDENTS ENROLLED THROUGH MIXED ENROLLMENT
Total Completion
Rate
Completed at Starting Institution
Completed at Different Institution: Two-Year
Completed at Different Institution: Four-Year
Still Enrolled (at Any
Institution)
Not Enrolled (at Any
Institution)
HBCU (Cohort Size = 3,657) 10.0 6.5 2.1 1.5 63.1 26.8
PBI (Cohort Size = 1,141) 18.1 14.6 1.5 2.0 48.1 33.8
HSI (Cohort Size = 3,256) 23.6 17.6 3.5 2.5 55.9 20.5
AANAPISI (Cohort Size = 18,487) 42.6 37.8 1.6 3.3 48.1 9.2

AMERICAN COUNCIL ON EDUCATION 55
Six-Year Outcomes (150% Normal Time) at Private Four-Year MSIs: Fall 2007 CohortOVERALL COHORT
Total Completion
Rate
Completed at Starting Institution
Completed at Different Institution: Two-Year
Completed at Different Institution: Four-Year
Still Enrolled (at Any
Institution)
Not Enrolled (at Any
Institution)
HBCU (Cohort Size = 10,648) 49.3 39.7 2.4 7.3 19.7 31.0
PBI (Cohort Size = 2,650) 47.0 35.8 2.5 8.7 14.0 39.1
HSI (Cohort Size = 8,362) 60.5 47.5 3.4 9.6 14.9 24.6
AANAPISI (Cohort Size = 83,178) 84.8 75.8 1.1 7.9 6.3 8.9
STUDENTS ENROLLED EXCLUSIVELY FULL TIME
Total Completion
Rate
Completed at Starting Institution
Completed at Different Institution: Two-Year
Completed at Different Institution: Four-Year
Still Enrolled (at Any
Institution)
Not Enrolled (at Any
Institution)
HBCU (Cohort Size = 5,968) 66.7 57.7 1.5 7.5 8.0 25.3
PBI (Cohort Size = 1,102) 62.7 52.2 1.8 8.7 3.9 33.5
HSI (Cohort Size = 4,107) 77.9 68.0 1.7 8.1 3.9 18.3
AANAPISI (Cohort Size = 59,465) 93.2 87.6 0.6 5.0 1.7 5.1
STUDENTS ENROLLED EXCLUSIVELY PART TIME
Total Completion
Rate
Completed at Starting Institution
Completed at Different Institution: Two-Year
Completed at Different Institution: Four-Year
Still Enrolled (at Any
Institution)
Not Enrolled (at Any
Institution)
HBCU (Cohort Size = 92) 7.6 7.6 0.0 0.0 17.6 74.8
PBI (Cohort Size = 224) 23.7 20.5 1.9 1.4 10.6 65.6
HSI (Cohort Size = 461) 27.7 24.1 0.7 2.9 9.3 63.1
AANAPISI (Cohort Size = 2,482) 47.1 45.0 0.3 1.8 8.1 44.9
STUDENTS ENROLLED THROUGH MIXED ENROLLMENT
Total Completion
Rate
Completed at Starting Institution
Completed at Different Institution: Two-Year
Completed at Different Institution: Four-Year
Still Enrolled (at Any
Institution)
Not Enrolled (at Any
Institution)
HBCU (Cohort Size = 4,588) 27.6 16.8 3.7 7.2 34.9 37.4
PBI (Cohort Size = 1,324) 37.8 24.7 3.2 10.0 22.9 39.2
HSI (Cohort Size = 3,794) 45.7 28.2 5.6 12.0 27.4 26.9
AANAPISI (Cohort Size = 21,231) 65.7 46.4 2.6 16.7 19.0 15.3

56 PULLING BACK THE CURTAIN: ENROLLMENT AND OUTCOMES AT MINORITY SERVING INSTITUTIONS
Eight-Year Outcomes (200% Normal Time) at Private Four-Year MSIs: Fall 2007 CohortOVERALL COHORT
Total Completion
Rate
Completed at Starting Institution
Completed at Different Institution: Two-Year
Completed at Different Institution: Four-Year
Still Enrolled (at Any
Institution)
Not Enrolled (at Any
Institution)
HBCU (Cohort Size = 10,675) 54.9 41.2 3.1 10.5 10.0 35.2
PBI (Cohort Size = 2,659) 51.9 37.2 3.9 10.9 9.6 38.5
HSI (Cohort Size = 8,353) 66.6 49.4 4.3 12.8 7.3 26.2
AANAPISI (Cohort Size = 82,937) 87.9 77.1 1.4 9.4 2.7 9.4
STUDENTS ENROLLED EXCLUSIVELY FULL TIME
Total Completion
Rate
Completed at Starting Institution
Completed at Different Institution: Two-Year
Completed at Different Institution: Four-Year
Still Enrolled (at Any
Institution)
Not Enrolled (at Any
Institution)
HBCU (Cohort Size = 5,714) 71.9 61.0 1.7 9.2 2.6 25.4
PBI (Cohort Size = 1,067) 65.9 54.0 2.5 9.4 2.2 31.9
HSI (Cohort Size = 3,996) 81.5 70.4 2.0 9.1 1.6 17.0
AANAPISI (Cohort Size = 58,885) 94.7 88.7 0.7 5.3 0.5 4.8
STUDENTS ENROLLED EXCLUSIVELY PART TIME
Total Completion
Rate
Completed at Starting Institution
Completed at Different Institution: Two-Year
Completed at Different Institution: Four-Year
Still Enrolled (at Any
Institution)
Not Enrolled (at Any
Institution)
HBCU (Cohort Size = 84) 8.3 8.3 0.0 0.0 2.4 89.3
PBI (Cohort Size = 210) 25.8 22.3 2.0 1.4 7.2 67.1
HSI (Cohort Size = 441) 31.4 26.6 1.2 3.7 3.4 65.1
AANAPISI (Cohort Size = 2,418) 50.1 47.5 0.3 2.2 3.9 46.0
STUDENTS ENROLLED THROUGH MIXED ENROLLMENT
Total Completion
Rate
Completed at Starting Institution
Completed at Different Institution: Two-Year
Completed at Different Institution: Four-Year
Still Enrolled (at Any
Institution)
Not Enrolled (at Any
Institution)
HBCU (Cohort Size = 4,877) 35.6 18.5 4.8 12.3 18.7 45.7
PBI (Cohort Size = 1,381) 45.1 26.4 5.2 13.4 15.7 39.2
HSI (Cohort Size = 3,917) 55.3 30.6 7.0 17.6 13.5 31.2
AANAPISI (Cohort Size = 21,634) 73.4 48.7 3.4 21.3 8.7 17.9

AMERICAN COUNCIL ON EDUCATION 57
APPENDIX C. National Student Clearinghouse Data Glossary of TermsThis report utilizes data from the National Student Clearinghouse (NSC) to examine enrollment and out-comes at MSIs. The data definitions came directly from NSC’s Signature Report No. 6, Completing College: A National View of Student Attainment Rates-Fall 2007 Cohort,1 and are defined as they appear in the report.
Cohort — The study cohort included students who fulfilled all of the following conditions:
1. Enrolled in a Title IV institution in fall 2007 (defined as any term with a start date between August 13 and October 31, 2007, inclusive);
2. Did not have a previous enrollment record, as shown in StudentTracker, between June 1, 2003, and May 31, 2007, unless the previous enrollment record was before the student turned 18 years old (dual enroll-ment);
3. Did not receive any degree or certificate from a postsecondary institution prior to the first day of enroll-ment in fall 2007, according to Clearinghouse data unless the award date was before the student turned 18 years old (dual enrollment);
4. Enrolled at just one institution in fall 2007 (i.e., showed no overlapping multiple enrollments between August 13 and October 31, 2007);
5. Enrolled for at least one term that was longer than 21 days and that started between August 13 and October 31, 2007;
6. Showed no enrollment terms of implausible length (i.e., either longer than 365 days or shorter than one day) throughout the study period;
7. Had at least one legitimate enrollment status throughout the study period; that is, enrolled for at least one term with full-time, part-time (i.e., half-time or less than half-time), or withdrawal status;
8. Showed intent to seek a degree or certificate. That is:
a. For students who started at four-year institutions, enrolled at least one term with an intensity of half-time or higher.
b. For students who started at two-year institutions, either:
i. Enrolled full time for at least one term before August 15, 2008, or
ii. Enrolled at least half time for any two terms before December 31, 2008;
9. Did not show a last enrollment record in any of the following contexts, identified above as having a combination of low coverage and high rates of stop-out:
a. Two-year private for-profit institutions in Nebraska
b. Two-year private for-profit institutions in New York
Exclusively full-time enrollment — “The exclusively full-time enrollment” designation was assigned to stu-dents whose enrollment showed one of three situations: (1) the enrollment record showed exclusively full-time enrollment for all terms; or (2) for terms with concurrent enrollments, the two highest-intensity enrollment records included at least one full-time enrollment; or (3) for terms with concurrent enrollments, the two high-est-intensity enrollment records both reflected half-time enrollment.
1 For the full report, please visit https://nscresearchcenter.org/signaturereport6.

58 PULLING BACK THE CURTAIN: ENROLLMENT AND OUTCOMES AT MINORITY SERVING INSTITUTIONS
Exclusively part-time enrollment — The “part-time enrollment” designation was assigned to students whose enrollment for each term under consideration showed one of the two following situations: (1) the enrollment record showed exclusively half-time or less than half-time enrollment; or (2) for terms with concurrent enroll-ments, the two highest-intensity enrollment records included some combination of half-time and less than half-time enrollments, but no full-time enrollment, and no more than one half-time enrollment.
Mixed enrollment — The category of mixed enrollment was applied to students who showed a combination of full-time and part-time enrollments across the terms under consideration. Finally, students who showed records indicating withdrawal but no full-time or part-time enrollments were randomly assigned to an enroll-ment intensity category.
Overall completion — Receipt of any postsecondary credential by the end of the study period.
1st completion at starting institution — Completions awarded at the institution where a student first enrolled (his or her starting institution).
1st completion at different institution — [Completions] awarded at an institution other than the starting institution. For students who started at a two-year public institution, this report also presents an overview of their completions at a four-year institution, either as a first completion (i.e., those who completed a four-year degree without having first earned a credential at a two-year institution) or as a subsequent degree after a first completion awarded in the two-year sector.
Still enrolled (at any institution) — Persistence (i.e., having enrollment records at any postsecondary institu-tion during the last year of the study period).
Not enrolled (at any institution) — Stop-out without completion (i.e., having no enrollment records at any postsecondary institution during the last year of the study period).


100 Years of Leadership and Advocacy