pulses for soil crop and environmental health - alberta …department/deptdocs.nsf/all... · ·...
TRANSCRIPT

Pulses for Soil, Crop and
Environmental Health
Newton Lupwayi
Agriculture & Agri-Food Canada
Lethbridge, Alberta, Canada

Harvested Area (hectares x1000) in Canada
2Year
1990 1995 2000 2005 2010 2015
Ha
rve
ste
d a
rea
(H
ecta
res x
10
00
)
0
500
1000
1500
2000Field pea
Chickpea
Lentil Dry bean
Faba bean

Total Production (metric tonnes x1000) in Canada
3Year
1990 1995 2000 2005 2010 2015
Pro
duction (
Metr
ic t
onne
s x
1000
)
0
1000
2000
3000
4000Field pea
Chickpea
Lentil Dry bean
Faba bean

4

Soil, Plant and Environmental Health Benefits
• N benefits
• Non-N benefits
5

1. N Benefits

N Benefits
• Biological nitrogen fixation
7

Nitrogen Fixed by Pulses in 2015
Pulse Harvested area
(ha)
Nitrogen fixed
(kg N/ha)a
Total N fixed
(x1000 kg N)
Field pea 1469800 83 121993
Lentil 1588700 72 114386
Dry bean 104400 34 3550
Chickpea 46500 33 1535
Faba bean 31200 187 5834
Total 247298
8aWalley et al. (2007) Agron. J.

$$ Saved by Utilizing Fixed N in 2015
• Amount of N fixed by pulses: 250,000,000 kg (250 million kg)
• Cost of urea (March, 2015): $650/1000 kg urea
• = $0.65/kg urea
• Cost of N = $0.65/0.46 kg N (urea has 46% N)
• =$1.41/kg N
• Value of N fixed by pulses: $353 million
• $353 million saved by producers who grew pulses in 2015.
9

N Benefits
• Biological nitrogen fixation
• N cycling: benefit to subsequent crops
10

N Benefits to Succeeding Crops?
• Most of the 250 million kg of fixed N – exported off the
farm with the legume grain.
11

Grain N vs. Residue N at Harvest: Field Pea
124
65
kg/ha
Grain N
Residue N
12Lupwayi and Soon (2015) Soil Sci. Soc. Am. J.

Grain N vs Residue N
• These estimates:-
– Do not include root N contributions
– Quantify N released only to the first crop grown after a pulse
crop
13

Grain N vs Residue N
• These estimates:-
– Do not include root N
14

Aboveground vs Belowground Pea N (g/pot)
Recovered by Wheat
0
0.5
1
1.5
2
2.5
3
3.5
4
4.5
Aboveground N
Belowground N
15Arcand et al. (2014) Biol. Fertil. Soils
> 2x (from roots and rhizodeposits)

Grain N vs Residue N
• These estimates:-
– Do not include root N
– Quantify N released only to the first crop grown after a
pulse crop
16

17
Above-Ground Residue N (kg N/ha)
0
20
40
60
80
100
120
140
160
Green Pea Forage Pea Faba bean Faba GM Vetch GM
Green pea – least residue N
ab
a
c
ab
b
Lupwayi and Soon (2015) Soil Sci. Soc. Am. J.

N Released (% of Initial) in 3 Consecutive Crops
18
87 83
6351 51
78
15
21 23
3 4
912 12
0
20
40
60
80
100
120
Vetch GM Faba GM Faba bean Forage pea Green pea
Unreleased
105-156 wk
53-104 wk
0-52 wk
-GM residues released >80% of their N in the first 52 wks.
-Faba bean residues released >60%.
-Pea residues released ~50. Lupwayi and Soon (2015) Soil Sci. Soc. Am. J.

N Released (kg N/ha) in 3 Consecutive Crops
19
112
8195
67
32
9
9
24
26
16
7
7
16
15
12
0
20
40
60
80
100
120
140
160
180
Vetch GM Faba GM Faba bean Forage pea Green pea
Unreleased
105-208 wk
53-104 wk
0-52 wk
Residues of grain legumes, especially forage pea and faba bean,
released more N during the 2nd and 3rd years than GM residues.
128/129
97/99
135/153
108/129
60/65

N Benefits to Succeeding Crops
• So substantial amounts of the N in aboveground and
belowground crop residues can be released to
subsequent crops (not just the first crop) in rotation – N
cycling.
20

N Benefits
• Biological nitrogen fixation
• N cycling: benefit to subsequent crops
• Greenhouse gas emissions
21

Greenhouse Gases: CO2
• Increased microbial activity during residue decomposition increases CO2 emissions.
• But the non-renewable energy used in the manufacture, transportation, and application of N fertilizer used in cereals results in much more CO2 emissions than use of legume N.

Greenhouse Gases: N2O
• Mineralization of legume N results in N2O emissions.
• But N fertilizer – greater N2O emissions than biologically fixed N.

Greenhouse Gas Emissions Life Cycle (100 Yr)
Assessment, Saskatchewan (kg CO2 eq. )
0
200
400
600
800
1000
1200
1400
Canola-Wht-Wht-Wht
Canola-Wht-Lentil-Wht
Canola-Wht-Pea-Wht
24
-22% -25%
MacWilliam et al. (2014) Agric. Syst.

N Benefits
• Biological nitrogen fixation
• N cycling: benefit to subsequent crops
• Greenhouse gas emissions
• Aboveground and belowground biodiversity
25

Aboveground and Belowground Biodiversity
• Pulses enable spatial and temporal diversification of
agro-ecosystems.
• The aboveground diversity:-
– supports beneficial insects like pollinator bees
– increases belowground diversity (soil organisms):-
• Biological soil health
26

a
b
cc c
dd
Soil Microbial Biomass - Crop Residue Effects
0
100
200
300
400
500
600
Control Fert. Wheat Barley Canola Peas Clover
Mic
rob
ial-
C (
mg
/kg
so
il)
Treatment
Lupwayi et al. (2004) Can. J. Soil Sci.

Soil Microbial Diversity - Crop Residue Effects
0
0.5
1
1.5
2
2.5
3
3.5
4
4.5
Control Fert. Wheat Barley Canola Peas Clover
Sh
an
no
n's
div
ers
ity i
nd
ex
(H
')
Treatment
dcd
bc cdbc ab
a
Lupwayi et al. (2004) Can. J. Soil Sci.

Aboveground and Belowground Biodiversity
• Crop rotation meta-analysis: 15.1% greater microbial
richness and 3.4% greater Shannon index of diversity.
• “By increasing the quantity, quality and chemical
diversity of residues, high-diversity rotations can sustain
soil biological communities, with positive effects on soil
OM and fertility” – Biological soil health.• Nitrogen fixation
• Nutrient cycling
• Biological disease/pest control
• Degradation of agro-chemicals
• Etc.
• All have economic and environmental benefits. 29
Venter et al. (2016) Pedobiol.
Tiemann et al. (2015) Ecol. Letters

Summary of N Benefits
• Legumes usually grown without N fertilizer.
• N benefit to non-legume crops grown in rotation with
pulse crops – less N fertilizer applied.
• Agronomic/Economic benefits:-
– Healthy (well-nourished) soils/crops
– Less $$ spent on N inputs
• Environmental benefits:
– Less N fertilizer pollutes surface and ground waters
– Less greenhouse gas emissions

Non-N Benefits

Non-N Benefits
• Residual soil water
32

Residual Soil Water (mm/100 cm, 2006 - Rainfed)
0
20
40
60
80
100
120
140
160
180
Early flowering late flowering Late pod Maturity
Chickpea
Field pea
Lentil
Canola
Wheat
33Gan et al. (2009) Agric. Water Manage.

Residual Soil Water
• Pulse crops leave more unused water in the soil profile
than oilseed crops or wheat.
• Pulse crops extract water mostly in top 60 cm soil.
– Pulse crops – shallower rooting depth – than wheat or
canola.
34
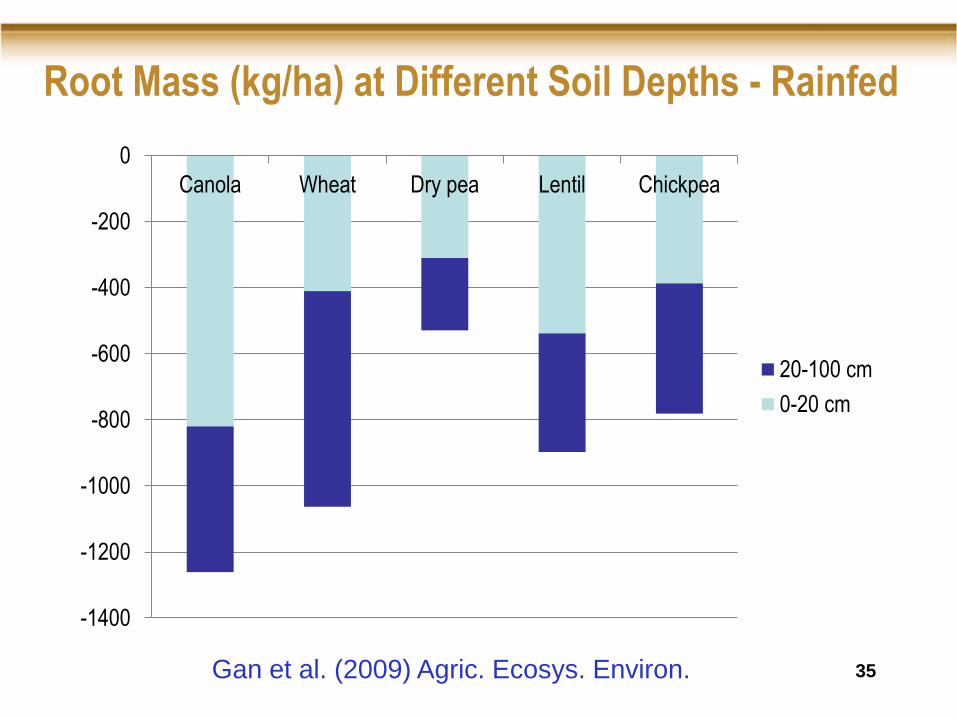
Root Mass (kg/ha) at Different Soil Depths - Rainfed
-1400
-1200
-1000
-800
-600
-400
-200
0
Canola Wheat Dry pea Lentil Chickpea
20-100 cm
0-20 cm
35Gan et al. (2009) Agric. Ecosys. Environ.

Non-N Benefits
• Residual soil water
• Biological disease and pest control
36

Disease and Pest Control• In rotations, legumes break cereal disease/pest cycles,
especially for some soil-borne root diseases.
• Sporulation of wheat common root rot pathogen Bipolaris sorokiana (telemorph: Cochliobolus sativus on crop crowns:-
– Cereals > Pulses = Oilseeds (# of conidia/g crown tissue)
• Wheat common root rot incidence (0-4 scale) :
– Pea-Wheat rotation: 0.99
– Wheat-Wheat rotation: 3.19.
Duczek et al. (1996) Can. J. Plant Sci.
Stevenson & van Kessel (1996) Soil Sci. Soc. Am. J.

Total Weeds (plants/sq. m) in Year 2 Wheat
0
0.5
1
1.5
2
2.5
3
3.5
4
4.5
5
Wheat Barley Oats Canola Lupin Field pea
Weeds
38Malik et al. (2015) Crop Pasture Sci.

Barley Grass (plants/sq. m) in Year 3 Wheat
0
0.2
0.4
0.6
0.8
1
1.2
Wheat-Wht Barley-Wht Oats-Wht Canola-Wht Lupin-Wht Pea-Wht
Barley grass
39Malik et al. (2015) Crop Pasture Sci.

Brome Grass (plants/sq. m) in Year 3 Wheat
0
0.1
0.2
0.3
0.4
0.5
0.6
Wheat-Wht Barley-Wht Oats-Wht Canola-Wht Lupin-Wht Pea-Wht
Brom grass
40Malik et al. (2015) Crop Pasture Sci.

Benefits of Biological Pest Control
• Agronomic/Economic:-
– Healthy soils/crops – less disease/pests
– Less $$ spent on purchase and use of pesticides
• European survey: 20-25% reduction in agro-chemical costs, and savings of
up to €31 per hectare (von Richthofen et al. (2006).
• Environmental:-
– Less pesticides polluting crops, land and water
– Less greenhouse gases produced in the manufacture,
transportation and use of pesticides
41

Non-N Benefits
• Residual soil water
• Biological disease and pest control
• P nutrition
• Soil structure (tilth)
42

Summary: Soil, Crop and Environmental Health
• Relative to nonlegume crops, pulses produce healthy
soils that produce healthy crops (nutrition and crop
protection) in an environmentally healthy manner.
• Human and livestock health? Whole new topics.
43

Acknowledgements